Embed Size (px)
Citation preview

IFS Working Paper W16/18
Emla FitzsimonsBansi Malde Marcos Vera-Hernández
Spillovers of community-based health interventions on consumption smoothing
Spillovers of Community-Based HealthInterventions on Consumption Smoothing
Emla Fitzsimons, Bansi Malde and Marcos Vera-Hernández∗
October 10, 2016
Abstract
Community-based interventions, particularly group-based ones, are considered to
be a cost-effective way of delivering interventions in low-income settings. However,
design features of these programs could also influence dimensions of household and
community behaviour beyond those targeted by the intervention. This paper stud-
ies spillover effects of a participatory community health intervention in rural Malawi,
implemented through a cluster randomised control trial, on an outcome not directly
targeted by the intervention: household consumption smoothing after crop losses. We
find that while crop losses reduce consumption growth in the absence of the interven-
tion, households in treated areas are able to compensate for this loss and perfectly
insure their consumption. Asset decumulation also falls in treated areas. We pro-
vide suggestive evidence that these effects are driven by increased social interactions,
which could have alleviated contracting frictions; and rule out that they are driven by
improved health or reductions in the incidence of crop losses.
Keywords: participatory community interventions, spillovers, consumption smoothing,Sub-Saharan Africa
JEL Classification: E21, G22, O12, O13∗Affiliations: Fitzsimons - UCL Institute of Education and IFS ([email protected]); Malde (corre-
sponding author) - University of Kent and IFS (E-mail: [email protected]; Postal Address: Schoolof Economics, Keynes College, University of Kent, Canterbury, Kent CT2 7NP, United Kingdom.); VeraHernández - UCL and IFS ([email protected]). This research was funded by the ESRC/Hewlett JointScheme under grant RES-183-25-0008, and the Bureau of International Labor Affairs at the Department ofLabor. We are grateful to Orazio Attanasio, Pierre Dubois, Erica Field, Dilip Mookherjee, Mushfiq Mobarak,Rohini Pande, and other conference and seminar participants at The US Department of Labor, EDePo@IFS,The 2012 Royal Economic Society Conference (Cambridge) for useful discussions and suggestions. Wethank the Mai Mwana team, especially Tambozi Phiri, Andrew Mganga, Nicholas Mbwana, ChristopherKamphinga, Sonia Lewycka, and Mikey Rosato for their advice and assistance in collecting the data. Ju-lia Behrman, Senthuran Bhuvanendra, Lena Lepuschuetz and Carys Roberts provided excellent researchassistance. All errors are the responsibility of the authors.
1
1 Introduction
Community-based interventions, particularly group-based interventions, have becomevery wide-spread in developing countries (Mansuri and Rao [2004]). They are consid-ered to be an effective, and relatively less costly way of delivering interventions, trigger-ing and sustaining behaviour change, as well as shifting social norms in low-income set-tings. Goverments and NGOs often use group-based interventions to provide financialservices (e.g. microfinance groups, savings groups, etc); promote collective action (e.g.Community-Led Total Sanitation; participatory women’s groups); deliver early child-hood parenting interventions; deliver aid and infrastructure in post-conflict as well asnon-conflict settings among others.
Design features of these community-based interventions could influence dimensions ofhousehold or community behaviour beyond those directly targeted. For example, manyinterventions incorporate regular group meetings, which could encourage informationsharing, thereby alleviating contracting frictions. It is important to account for suchspillover effects when assessing the welfare impacts of interventions. However, empiri-cally disentangling these is challenging since interventions might also provide resourceswhich may also influence outcomes affected by the contracting frictions.
In this paper, we study the spillover effects of a participatory community based healthintervention in rural Malawi on household consumption smoothing of idiosyncratic croplosses. The chief goal of the intervention was to improve maternal and child health. Con-sumption smoothing was not regarded as an issue of even mild importance by the im-plementation agency; and no direct efforts or resources were provided to influence this.Instead, the mere design of the program could have influenced consumption smoothingoutcomes. Focusing on an outcome not directly targeted by the intervention allows us toshed light on this type of spillover effect. Our contributions are two-fold: First, we studywhether participatory group-based community health interventions affect consumptionsmoothing. Second, drawing on the theoretical literature on informal risk sharing, weconsider ways in which the intervention may have altered consumption smoothing pat-terns, paying special attention to features of its design.
Though households frequently experience shocks in the context we study, formal creditand insurance markets are severely lacking. Instead, informal tools such as transfers andinformal loans between relatives, friends and neighbours, as well as assets such as live-stock are the key tools used to deal with the consequences of risk. The intervention en-couraged women to form groups which met on a fortnightly or monthly basis to engagein a participatory action cycle to improve reproductive and child health. The group meet-
2
ings did not follow a top-bottom approach. A trained facilitator organised the discus-sion, but it was up to the villagers to come up with ideas, and take decisions. Initialmeetings were discussion-based, while later meetings planned and implemented (alongwith the wider community) strategies identified by the groups to improve maternal andchild health (such as for instance, lobbying a range of donors to provide bycicle ambu-lances to get to the health care facilities). By facilitating the formation of groups that metregularly, and that aimed to involve a broad swathe of the community, the interventioncould have increased social interactions and alleviated contracting frictions thereby al-tering consumption smoothing. It provided no monetary resources whatsoever, and assuch, is extremely cost effective, and thus increasingly used in developing countries toimprove infant mortality and female reproductive health (see Prost et al. [2013] for a sys-tematic review). If beneficial effects on outcomes even beyond those targeted directly bythe program are achieved, the case for such already successful programs is strengthenedeven further.
The analysis begins by considering how consumption smoothing – measured as the re-sponse of changes in log household (non-durable) consumption to idiosyncratic crop lossevents, net of village level aggregate shocks – varies in villages receiving the interventionrelative to villages not receiving it. To identify causal impacts, we exploit the random al-location of the intervention to groups of villages (or clusters). Household crop losses arean important source of risk in these communities: around 28% of households in our sam-ple experience a crop loss over a 2-year period. Our results indicate that the interventionyields improvements in consumption smoothing: while experiencing a crop loss leads toa reduction in household consumption growth by around 9% for households in controlareas, those in intervention areas are able to compensate for this loss, and subsequentlyperfectly insure their consumption.
With very limited formal markets, self-insurance through accumulation and decumula-tion of assets such as livestock; and informal risk sharing through informal loans, giftsand transfers from friends, family and neighbours form the key ways through whichhouseholds smooth consumption in Mchinji, rural Malawi. Examining data on savingsand livestock holdings, we find that following a crop loss, households in interventionareas are less likely to draw down their savings, and to hold more large animals thanhouseholds in control areas. Thus, households in intervention areas do not draw downas many assets to cope with crop losses, which also supports long run poverty alleviationefforts. We hypothesize instead that the improvements in consumption smoothing needto come from better informal risk sharing.
The next step of the analysis examines how the intervention might have improved infor-
3

mal risk sharing arrangements. These are likely to be constrained by contracting frictionssuch as information asymmetries (e.g. Ligon, 1998; Kinnan, 2014) and imperfect enforce-ment (Kocherlakota, 1996; Ligon et al., 2003; Ali and Miller, 2013). Through forminggroups that met regularly, the intervention could have increased social interactions in theintervention areas. These could, in turn, improve information sharing, thereby alleviatingthe contracting barriers that come with information asymmetries; as well as provide moreopportunities to punish renegers of informal arrangements and reduce limited commit-ment problems. Indeed, we document an increase in the probability that households chatwith their friends and family on a one-to-one basis outside the intervention group, pro-viding suggestive evidence that the intervention increased social interactions also outsideof the groups. This is in line with Feigenberg et al. [2013], who find that increasing thefrequency of meetings among microfinance clients increases risk sharing amongst them-selves. Our study, however, considers consumption smoothing and risk sharing outcomesfor households across the village regardless of their decision to participate in the groups.
Several aspects of the intervention likely contributed to the large observed impacts: first,the intervention had already been running for three years at the time we started data col-lection. Second, the group meetings did not follow a top-bottom approach but - on thecontrary - a participatory one in which the role of the facilitator was to simply encour-age discussion within a 4-cycle structure which also involved non-group villagers. Thisparticipatory approach is more likely to have resulted in increased communication (andultimately information sharing) among group members. Moreover, the third and fourthparts of the participatory cycle – where groups implemented chosen strategies – also pro-vided opportunities to participants to learn about the traits (e.g. trustworthiness, ability,etc) of their fellow group members.
Crucially, we rule out other channels through which the intervention might have con-tributed to risk sharing other than increasing social interaction. This is helped by thenarrowly defined remit of the intervention: improving reproductive health. We find thatthe intervention did not lead to improvements in general health, nor reduce the severityof crop losses.
Our findings are important for the design of development programs. In particular, theyspeak to the debate on whether interventions should be delivered to beneficiaries on aone-to-one basis or within a group. One-to-one delivery of interventions such as healtheducation allow for the provision of tailored services, and hence may be more effective(though costly); while group-based interventions might be less costly but may entail adilution in services. Our findings provide one additional benefit of group-based inter-ventions – improved consumption smoothing as a result of increased social interactions
4

– which not only influences household welfare, but may also affect households’ ability toadhere to the services provided by the intervention.
Our paper contributes to a number of strands of the literature. First, it adds to a bodyof work investigating the impacts and workings of community-driven (CDD) interven-tions, which have become an immensely popular way of delivering development aid(Mansuri and Rao, 2004). Such interventions aim to improve coordination between com-munity members, as well as broaden participation in interventions by under-representedgroups within a community. Existing studies, though, find mixed evidence on their ef-ficacy. Fearon et al. [2009] find that a community driven reconstruction intervention inpost-conflict Liberia improved social cohesion and co-operation; while Casey et al. [2012]document short-run improvements in local public goods in post-conflict Sierra Leone,but no long run changes on involvement of marginalised groups, collective action or de-cision making. Humphreys et al. [2015] also fail to find effects of a CDD program in theDemocratic Republic of Congo on social outcomes. Labonne and Chase [2011] find thata CDD program in the Philippines has mixed impacts on social capital: the interventionincreased participation in village assemblies and generalised trust, but lowered collectiveaction and group membership. Banerjee et al. [2010] find no impacts of a program en-couraging participation of parents on village education committees in rural India. How-ever, an extensive literature in public health documents positive effects of participatorywomen’s groups on health (see Prost et al., 2013 for a review); as well as community-ledtotal sanitation on increasing uptake of sanitation (e.g. Pickering et al., 2016; Cameronet al., 2015). Our paper contributes to this literature by providing evidence of impactson an as yet unconsidered outcome - consumption smoothing - in a poor, but not post-conflict setting.
Second, it also contributes to the literature on the strength of social ties and risk sharingor closely related outcomes. Guiso et al. [2004] show that individuals living in regionswith higher social capital also engage in more complex financial transactions, Angelucciet al. [2015] show that individuals connected to a family network in the village attainbetter consumption smoothing. Fafchamps and Ferrara [2012] provide evidence support-ing the hypothesis that self-help groups in urban Kenya play a mutual assistance role.Chandrasekhar et al. [2015] find, within lab-in-the-field experimental games, that sociallyconnected ties are able to overcome enforcement constraints and cooperate in the absenceof outside enforcement; while Breza and Chandrasekhar [2015] document that inform-ing socially close, and more central villagers about an individual’s savings increases theamount saved.
Finally, it contributes to a body of work on the impacts of groups on economic behaviour.
5
The microfinance literature has contributed to either justify theoretically or establish em-pirically a correlation between group formation and positive loan outcomes. Closest toour paper is the contribution by Feigenberg et al. [2013] who also randomly increase indi-viduals’ social interactions (in their case microfinance clients) by experimentally varyingthe frequency of microfinance meetings. Our paper complements theirs by looking atdifferent outcomes (consumption smoothing rather than default probability), in a differ-ent setting (rural rather than urban), and studying a different type of group meeting -open community-wide meetings rather than microfinance group meetings. In anotherrelated study in post-conflict Uganda, Blattman et al. [2016] document that cash grantsand training provided to women encouraged to form groups engaged more in informalfinance as well as labour sharing, and enjoyed higher earnings, but did not increase theirconsumption in response.
The rest of the paper is organised as follows. Section 2 provides background on the con-text, and introduces the intervention and the experimental design. We outline our em-pirical strategy in section 3. Section 4 describes the data, including our measures of croplosses; Section 5 displays the main results, investigates the underlying mechanisms andrules out some alternative explanations. Section 6 concludes.
2 Background and Intervention
2.1 Context
Our study takes place in Mchinji, a rural district in the central part of Malawi. Socio-economic conditions in Mchinji are similar to or worse than the average for Malawi (inparentheses in what follows), with literacy rates of just over 60% (64%), poor qualityflooring materials used by 85% (78%) of households, piped water access for 10% (20%)of households, and electricity access for just 2% (7%) of households. Subsistence agricul-ture is the most important economic activity in Mchinji, and provides the main incomesource for a large majority of households. Key crops include maize, tobacco and groundnuts. Agricultural production is mainly rain-fed, and the use of modern inputs and im-plements such as fertilizer is very rare; thereby leaving household incomes vulnerable tofluctuations from unpredictable weather as well as pests and crop diseases.
Access to formal financial and insurance products is limited: the 2008 Finscope MalawiSurvey documented that only 3% of Malawians held an insurance product, and fewerthan 20% had a formal bank account. Social connections such as family, friends and
6
other community members are very important in helping households cope with risk.For example, Trinitapoli et al. [2014] document that older siblings play a role in protect-ing educational investments of younger siblings, while Munthali [2002] and Peters et al.[2008] document that extended family members foster and care for children orphaned byHIV/AIDS.
A number of contracting frictions have been documented to be present in the context ofrural Malawi: Gine et al. [2012] document that difficulties in verifying an individual’sidentity introduce frictions in credit markets. Jack [2013] shows that private informationhampers effective targeting of subsidies for an environmental program; while Guiterasand Jack [2014] document the implications of asymmetric information on labour marketsin rural Malawi. These not only hamper the availability of formal credit and insurancemarkets, but may also influence the terms of informal arrangements, and may preventthem from providing full insurance.
2.2 Intervention
We consider a participatory women’s group intervention aimed at improving reproduc-tive health, set up in 2005 by the MaiMwana (“Mother and Child”) Project. The interven-tion was implemented as a cluster randomised control trial in order to assess its effective-ness in improving maternal and neonatal health outcomes.
It aimed to impart information and mobilise the local community (village) through aparticipatory action cycle to act on issues relating to pregnancy, childbirth and new-born health, with the overarching goal of improving maternal and child health outcomes[Lewycka et al., 2010, Lewycka, 2011]. Trained local women (facilitators), covering a pop-ulation of around 3,000 individuals each, visited study villages and encouraged womento form groups. Each was charged with forming and guiding between 6 and 12 groups.1
Groups were guided through a four-stage community mobilization action cycle of fort-nightly (in principle; every 4-6 weeks in practice) meetings under the guidance of thefacilitator, where in the first stage (comprising 8 meetings) they identified and prioritisedproblems relating to pregnancy, childbirth and newborn health.2 In the second stage (4
1The facilitators, who were aged 20-49 years, literate and mothers, received intial training over 11 days,followed by refresher training every 4 months. They were paid a salary, and provided with a bicycle, T-shirt, umbrella and field bag. They were also given a manual to implement the participatory action cycle, aswell as picture cards to help guide discussions. They also received support and feedback from a supervisor.
2Rosato et al. [2006] summarize the problems identified by the groups in this setting relating to maternalhealth (anaemia, obstructed labour, malaria, retained placenta, and haemorrhaging, amongst others), whileRosato et al. [2009] summarise those relating to neonatal and infant health (diarrhoea, pre-term births,tetanus, asphyxia, infection and malaria).
7

meetings), the groups shared the results of their discussions with the wider communityand devised strategies to overcome identified problems. To take an example, the prob-lem identified might be a lack of transport to health centers in cases of emergency andthe strategy to help overcome this was to lobby various donors to provide bicycle am-bulances.3 In the third stage (4 meetings), the groups involved the wider community inimplementing the strategies, before evaluating their activities and making future plans inthe final stage (4 meetings).
The primary targets of this intervention were women aged 15-49, and particularly preg-nant women. However, older women who had completed their fertility were also en-couraged to attend so as to share their experiences, and were considered to be very in-fluential in shaping reproductive health outcomes within the community. From the thirdpart of the cycle, where groups began implementing the strategies devised, men joinedthe groups and attended meetings. Around 31% of women aged 15-49 in our data re-port having attended at least one women’s group meeting. Conditional on attending atleast one meeting, women report having attended on average 12 women’s group meet-ings over a 4-year period, indicating active engagement in the intervention among thisgroup. Moreover, the groups were successful in reaching less affluent women and house-holds: attendees were poorer than non-attendees (as indicated by an asset index and thequality of housing materials) older on average, and were less likely to have completedprimary schooling. Attendees were also more likely to have been married at least once;while those from households with more than one adult woman were less likely to attend.
Potential Intervention Impacts on Consumption Smoothing The intervention couldhave influenced informal risk sharing arrangements in a number of ways, thereby af-fecting overall consumption smoothing. First, it provided women with a forum withinwhich to interact with other women regularly, which could alleviate various contractingfrictions. For example, the regular interaction might facilitate sharing of information onnot just health, but also on other topics and local issues, reducing asymmetries in infor-mation about shocks experienced (or not) by other community members. The meetingsalso provide a forum for women to learn more about each other (e.g. about each other’s‘types’) thereby reducing adverse selection problems, and may also reduce the costs ofmonitoring effort, thereby reducing moral hazard frictions. Finally, interactions withinthe groups might also ease enforcement of risk sharing arrangements with other group
3Common strategies implemented by groups included vegetable garden cultivation, health educationsessions, insecticide treated net distribution, health programme radio listening clubs and cleaning the sur-roundings around one’s house.
8
members, reducing another barrier to efficient risk sharing (e.g. Feigenberg et al. [2013]).In reducing contracting frictions, the intervention might have allowed women (and theirhouseholds) to either form new social connections that could support informal risk shar-ing; and/or strengthen existing arrangements to allow for more risk sharing.4
Second, the intervention could also have reduced households’ exposure to health shocks,thereby improving their capacity to cope with crop loss shocks. We consider, and rule outthis mechanism in Section 5.4.1.
2.3 Experimental Design
The evaluation is based on a cluster randomized controlled trial designed as follows (seeLewycka et al. [2010], Lewycka [2011]). Mchinji District was divided into 48 clusters bycombining enumeration areas of the 1998 Malawi Population and Housing Census in asystematic way so that each cluster contained approximately 8,000 individuals.5 Withineach cluster, the 3,000 individuals (equating to 14 villages on average) living closest to thegeographical centre of the cluster were chosen to be included in the study.6 This leavesa buffer area between adjacent clusters created purposefully to limit contamination. 12clusters were randomly selected to receive the intervention. A further 12 serve as con-trols.7
The intervention began in 2005, and was still in place when the data used in this studywere collected (2008-09, and 2009-10).8
4However, the increased interactions with group members could crowd out other or weaken relation-ships with connections who were not group members, potentially crowding out existing risk sharing; andmaking the effects on overall consumption smoothing ambiguous.
5The District Administrative Centre was excluded because it is relatively more urbanized and hence lesscomparable to the rest of the District.
6The geographic centre was chosen to be the most central village in the cluster as shown on a carto-graphic map from the National Statistical Office, Malawi, and whose existence was corroborated with theDistrict Commissioner’s records. See Lewycka [2011], pp. 122 for more details.
7A further 12 were assigned an Infant Feeding intervention, and the final 12 were assigned both the In-fant Feeding Intervention and the Women’s Group one. We do not exploit these here; see instead Lewyckaet al. [2013] and Fitzsimons et al. [2016]. MaiMwana Project also improved health facilities across the Dis-trict, which benefitted both intervention and control clusters equally.
8Though groups began in 2005/06, the meetings cycle was not completed within 2 years as a result ofdelays arising primarily from groups trying to involve men in their activities (at the start of the secondstage of the cycle). Most groups were in either the third or fourth stage of the cycle at the time of the firstfollow-up survey. Many groups were in the fourth stage at the time of the second follow-up survey.
9
3 Empirical Model
To identify whether the intervention improves consumption smoothing, we exploit itscluster randomised allocation and assess how household consumption smoothing varieswith whether or not the household lived in a cluster that received the intervention. Ourempirical specification is derived from a standard model of inter-temporal consumptionsmoothing in which households have a utility function of the constant relative risk aver-sion (CRRA) form (as is conventional - see for instance Cochrane, 1991, and Townsend,1994), and face idiosyncratic and aggregate risk. The specification is as follows:
∆log(chvt) = α∆crophvt + γ∆crophvt ∗ Dv + ∆Xhvt + µvt + ∆εhvt (1)
where ∆log(chvt) is the consumption growth rate for household h living in village v,between periods t − 1 and t, ∆crophvt refers to changes between periods t − 1 and t inhousehold-level crop loss indicators (incidence and severity, separately), Dv is an indica-tor variable that equals 1 if, in 2004 (before the start of the intervention), household h livedin a cluster that was subsequently randomly selected to receive the women’s group inter-vention, Xhvt is a vector of household level time-varying characteristics such as householdsize and demographics, and µvt is a set of village-specific time dummies which will ab-sorb village-specific aggregate shocks.9
Under perfect consumption smoothing (or full insurance), the household consumptiongrowth rate should move one-to-one with the aggregate consumption growth rate (Cochrane,1991, Townsend, 1994), and be uncorrelated with household-level crop losses.10 In ourcase, we take the village to be the unit within which risk sharing takes place, and so ag-gregate consumption is captured by the village-time dummies. We consider village-levelrisk sharing since the participatory groups were generally formed within a village, andso any impacts on consumption smoothing, including on social interactions would beconcentrated within the village. Doing so also allows us to capture the net effects of thegroups on village-level consumption smoothing.11
9In our application, because we have only two time periods, the term µvt is essentially a village fixed-effect.
10Shocks could also affect long term outcomes, such as education and health outcomes, see for instanceMaccini and Yang [2009]. More generally, note that poor households who are close to subsistence couldbe smoothing consumption at the expense of investments, which would affect their long-term wellbeing(Chetty and Looney, 2006).
11It is possible that households that are part of a group may reduce risk sharing with those outside thegroup leading to some households being left worse off by the intervention. Unfortunately, we are unable tostudy such heterogeneity in effects since we do not have any exogenous variation in within-village groupparticipation decisions.
10

If households are able to perfectly smooth consumption through existing mechanisms,and particularly in the absence of the participatory intervention, then we would expectthe coefficient α to equal zero. If, however, households are unable to smooth consump-tion following a crop loss, α would be negative. γ identifies the additional consumptionsmoothing available to households in intervention areas experiencing a crop loss as a re-sult of the intervention. The sum of the coefficients α + γ reveals whether households inintervention areas are perfectly able to smooth their consumption following an idiosyn-cratic crop loss. Our test for whether the intervention improves risk sharing thereforeentails testing whether γ is positive and statistically significant from 0.
In terms of the dependent variable, we use two measures of household consumption:non-durable household consumption and food consumption. This choice is motivated bythe fact that different types of consumption might be more or less sensitive to the effectsof shocks, and also might be differentially sensitive to measurement error. Moreover, foodconsumption accounts for a large share of households’ budgets in this context.
Regarding crop losses, we exploit both their incidence – whether or not a household ex-perienced a crop loss, and severity - the estimated loss in income associated with the croploss, normalised by predicted pre-intervention household consumption.12,13 The normal-isation adjusts for the fact that more wealthy households might experience larger croplosses since they have more land. Our empirical strategy relies on crop losses represent-ing idiosyncratic (household-level) rather than aggregate (village-level) adverse events.We provide evidence on this, along with more details on the measurement and specifica-tion of the crop loss variables in Section 4.
Important consideration needs to be given to inference. The cluster-correlated Huber-White estimator for clustered standard errors have been shown to provide standard errorestimates which are too small (and thereby over-reject hypothesis tests of significance)when the number of clusters is less than 30 (Donald and Lang, 2007, Wooldridge, 2004,Bertrand et al., 2004, Cameron et al., 2008). This is important here since the number ofclusters is 24. To ensure correct inference, we implement a wild cluster bootstrap-t proce-dure recommended by Cameron et al. [2008] to compute the correct p-values for hypothe-sis tests of significance. Their Monte Carlo simulations suggest that this method performsrelatively well with as few as 5 clusters.14 In all estimation tables, we report the clustered
12This variable is predicted from a linear regression of household consumption on pre-intervention edu-cation of the survey respondent. We also experimented with including other baseline assets in the specifi-cation. The qualitative results reported in this paper do not change with the alternative specification.
13Our use of ∆crophvt follows Gertler and Gruber [2002]. Note also that changes in crop loss intensityclosely relates to changes in income used by among others, Townsend [1994].
14Monte Carlo simulations reported in Fitzsimons et al. [2016] also indicate that the wild bootstrap
11
standard error, clustered standard error p-value along with the wild cluster bootstrappedp-value.
4 Data
4.1 Sample Description and Balance
The analysis in the paper is based on two years of survey data collected in 2008-09 and2009-10, respectively 3.5 and 4.5 years after the intervention started in May 2005, com-bined with a more limited set of variables collected in a pre-intervention baseline censusof all women of childbearing age by Mai Mwana in 2004 (Mai Mwana census hereon). Alarge majority of the groups were still in operation at the time of our follow-up surveys(Rosato et al., 2012), partly due to late completion of the participatory action meeting cy-cle (the median group completed the action cycle in October 2008), as well as continuationof meetings beyond the initial participatory action cycle.
This census contains basic socio-economic and demographic characteristics, displayedin Table 1, for households in our analysis sample. Households contain an average of6 members. Housing conditions are poor, as demonstrated by the roofing and flooringmaterials. Less than 7% of households have access to piped water and less than 1% haveaccess to electricity. Among assets, most households own a paraffin lamp, 64% own aradio, and 52% own a bicycle. Ownership of other assets such as cars, motorbikes andoxcarts is rare. Almost all households are involved in agriculture.
The sample for the follow-up surveys was drawn from the census: we selected a ran-dom sample of 104 women per cluster to survey. The left panel of Table 2 compares themeans of available pre-intervention characteristics between the intervention and the con-trol clusters for the sample drawn, and confirms that the randomization worked well.In the 2008-09 (“first follow-up”, hereon) survey, we were able to interview around twothirds of the sample drawn of women of child bearing age (aged 17-43 at the time of sur-vey) and their households. In addition to the time-lapse between the baseline and the firstfollow-up, two additional factors contributed to the attrition. First, collecting longitudinaldata in Mchinji is prticularly challenging since respondents are known to report ‘ghost’– or fictitious – household members in an effort to increase future official aid/transfers
method performs well in this setting.
12

Table 1: Baseline Descriptive Statistics
Variable Mean Std. Dev.
Main flooring material: dirt, sand or dung 0.916 0.278Main roofing material: natural 0.858 0.349Agricultural Household (yes=1) 0.995 0.069Traditional pit toilet (yes = 1) 0.783 0.413Piped water (yes=1) 0.063 0.242# of hh members 5.781 2.376# of sleeping rooms 2.157 1.083Household has electricity (yes=1) 0.002 0.049Household has radio (yes=1) 0.647 0.478Household has bicycle (yes=1) 0.528 0.499Household has motorcycle (yes=1) 0.007 0.085Household has car (yes=1) 0.004 0.063Household has paraffin lamp (yes=1) 0.952 0.214Household has oxcart (yes=1) 0.055 0.229N 1249Notes to Table: Sample contains women whose households were interviewed in our follow-up surveys,
and whose households were resident in the same village for both follow-up surveys.
(that may increase with household size). Hence, it is possible that some women listedin the baseline census did not actually exist, and hence could not be found by the fieldteam in 2008. Second, an unexpected sharp drop in the British Pound against the MalawiKwacha in 2008 resulted in fewer resources to track women who had moved.
Reassuringly, this attrition rate is very similar across intervention and control clusters, at67% and 63% respectively. The balance on a range of observed baseline characteristicsis mostly maintained, as shown in the middle panel of Table 2, with small statisticallysignificant differences appearing only on 1 variable indicating that attrition was not sig-nificantly different between intervention and control zones. The 2009-10 (“second follow-up”) survey followed those women (and their households) who had been successfullyinterviewed in the first survey. 91% of these were reached: 92% and 90% in interventionand control areas respectively.
As is common practice in the consumption smoothing literature, we restrict the sampleto households that were resident in the same village over both survey rounds. This isin order to control accurately for aggregate (village-level) adverse events through theterm µvt in (1). This results in a smaller analysis sample: 1636 vs. 1249. The balance forthis sample, again based on observed baseline characteristics displayed in the last threecolumns of Table 2, is maintained for all variables.
13
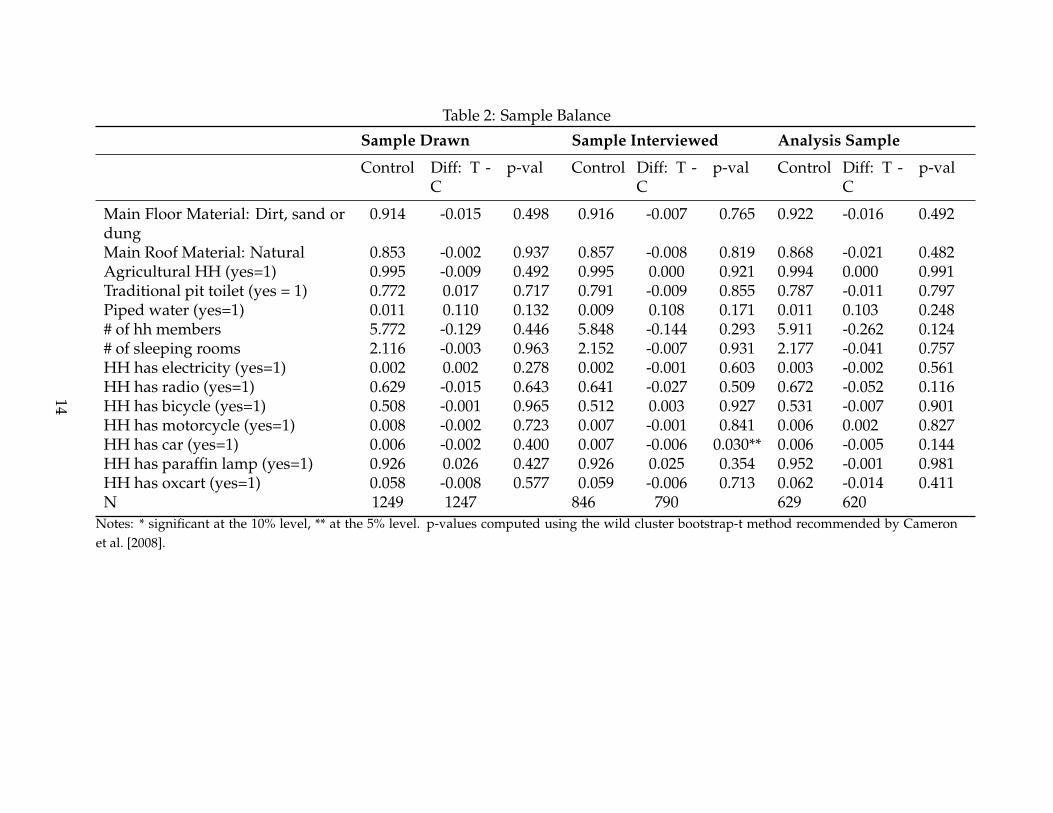
Table 2: Sample Balance
Sample Drawn Sample Interviewed Analysis Sample
Control Diff: T -C
p-val Control Diff: T -C
p-val Control Diff: T -C
p-val
Main Floor Material: Dirt, sand ordung
0.914 -0.015 0.498 0.916 -0.007 0.765 0.922 -0.016 0.492
Main Roof Material: Natural 0.853 -0.002 0.937 0.857 -0.008 0.819 0.868 -0.021 0.482Agricultural HH (yes=1) 0.995 -0.009 0.492 0.995 0.000 0.921 0.994 0.000 0.991Traditional pit toilet (yes = 1) 0.772 0.017 0.717 0.791 -0.009 0.855 0.787 -0.011 0.797Piped water (yes=1) 0.011 0.110 0.132 0.009 0.108 0.171 0.011 0.103 0.248# of hh members 5.772 -0.129 0.446 5.848 -0.144 0.293 5.911 -0.262 0.124# of sleeping rooms 2.116 -0.003 0.963 2.152 -0.007 0.931 2.177 -0.041 0.757HH has electricity (yes=1) 0.002 0.002 0.278 0.002 -0.001 0.603 0.003 -0.002 0.561HH has radio (yes=1) 0.629 -0.015 0.643 0.641 -0.027 0.509 0.672 -0.052 0.116HH has bicycle (yes=1) 0.508 -0.001 0.965 0.512 0.003 0.927 0.531 -0.007 0.901HH has motorcycle (yes=1) 0.008 -0.002 0.723 0.007 -0.001 0.841 0.006 0.002 0.827HH has car (yes=1) 0.006 -0.002 0.400 0.007 -0.006 0.030** 0.006 -0.005 0.144HH has paraffin lamp (yes=1) 0.926 0.026 0.427 0.926 0.025 0.354 0.952 -0.001 0.981HH has oxcart (yes=1) 0.058 -0.008 0.577 0.059 -0.006 0.713 0.062 -0.014 0.411N 1249 1247 846 790 629 620
Notes: * significant at the 10% level, ** at the 5% level. p-values computed using the wild cluster bootstrap-t method recommended by Cameronet al. [2008].
14
4.2 Survey Data
The follow-up surveys contain detailed socio-economic information such as non-durableconsumption, education, labour supply, and self-reported health and anthropometricmeasurements for young children, as well as information on adverse events experiencedby the household and social interactions as measured by the extent of one-to-one chatstaking place.
The extensive consumption module in the survey required respondents to report, at thehousehold level, the quantity consumed and purchased, and the amount spent on thepurchase of 25 different food items in the week prior to the interview. It also elicitedexpenditures on other important household items including clothing, health, education,and housing improvements, among others. The latter items were collected for recall pe-riods of 1 month (for items such as fuel, utilities and transport), and 12 months or sincethe last survey (9-11 months) (for items such as house improvements, clothing, health,and education expenditures). In the 2009-10 survey, information was also collected onconversion units, allowing us to convert non-standard units of measurements (such asa cup of beans) to standard units (such as kilograms and grams). Total household foodconsumption is computed by summing expenditures on food and imputed values of non-purchased food.15 The average monthly food consumption for households in our sampleis about 9874 MK (~US$70) , while average total monthly non-durable consumption is11,808MK (~US$84).
4.3 Measuring Adverse Events
Crop losses, described here, are a particularly important adverse event in our setting,where practically all households are involved in agriculture. These could arise for a num-ber of reasons including poor weather conditions (which could be idiosyncratic within avillage as documented by among others Udry, 1995), localised crop diseases, pests, fires,and so on. Information on crop losses was collected from two questions: first from a
15To value food that was not purchased, we first use the conversion units collected in 2009-10 to convertfoods measured in non-standard units into standard units. We then use median unit-values (computed bydividing expenditure on a certain good by the quantity purchased, and taking the median at the zone anddistrict levels) to value this non-purchased consumption. An alternative method is to use market prices,which were also collected from local markets and trading centres most regularly visited by sampled house-holds. This is not our preferred method, since most households rarely purchase the foods they commonlyconsume from the markets, and we may over-value their consumption this way. Reassuringly though, valu-ing consumption by either method yields the same food consumption share of total non-durable consump-tion of 0.86. Total non-durable consumption is computed by converting all consumption and expenditurevalues into monthly terms and summing them up.
15
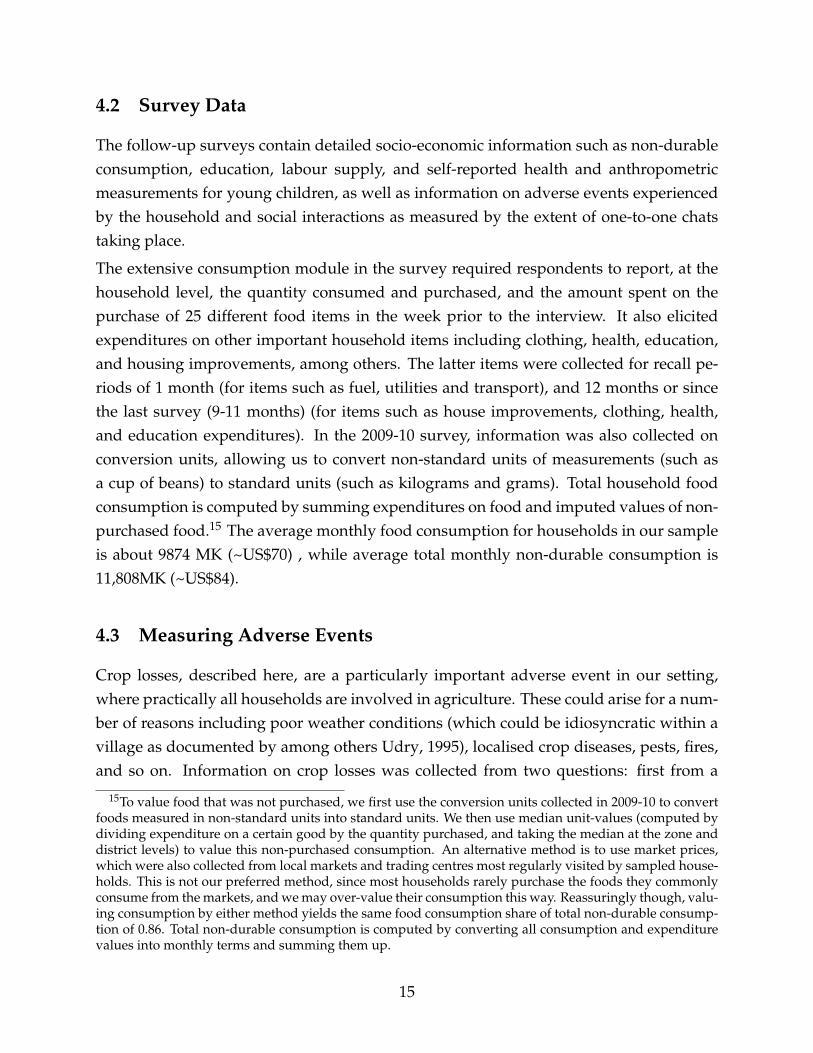
Table 3: Incidence and Severity of Crop Loss EventsVariable N Mean Std. Dev.Pooling Both WavesCrop loss in past 12 months (or since last survey); yes=1 2498 0.284 0.451Intensity of crop loss (as share of predicted consumption) 2473 0.288 0.848
Wave 1Crop loss in past 12 months (yes=1) 1249 0.353 0.478Intensity of crop loss (as share of predicted consumption) 1237 0.401 1.067
Wave 2Crop loss since last survey (yes=1) 1249 0.215 0.411Intensity of crop loss (as share of predicted consumption) 1236 0.175 0.524
Notes to Table: This table pools households in both control and treated clusters, who were living in the samevillage during both follow-up surveys. Predicted consumption is calculated from a regression of monthlyhousehold non-durable consumption over baseline (2004) education of the main respondent.
question asking households were asked whether they had experienced a crop loss in theyear (9-11 months) prior to the first (second) follow-up survey.16 If yes, households wereasked to report the size (severity) of the crop loss, in terms of the estimated income lossassociated with it. Table 3 displays the prevalence and severity of crop losses in our sam-ple, with the latter variable normalised by predicted pre-intervention consumption. Theuppermost panel shows the incidence and size (as a proportion of predicted consump-tion) of crop loss events when data from both rounds are pooled, while the lower twopanels show these for each round of data collection.
On average across both rounds, 28% of households experienced a crop loss. The size ofthe average loss was around 29% of predicted monthly pre-intervention consumption.Among households that experienced a crop loss, the average size of the loss is about 93%of predicted monthly pre-intervention consumption. Finally, disaggregating by roundhighlights differences in the incidence of crop loss events and the size of the crop lossbetween rounds, with a substantially higher incidence and severity of crop loss in thefirst wave compared to the second. This is most likely the case for two reasons. First, theincidence of crop losses in the second wave relates to a shorter period (9 to 11 monthsas opposed to 12 months). Second, data collection in the second (first) wave took placeduring (after) the main growing season, and so not all crop losses would have been re-
16In the second follow-up survey households were asked about crop losses since the first follow-up sur-vey, between 9 and 11 months for most households.
16

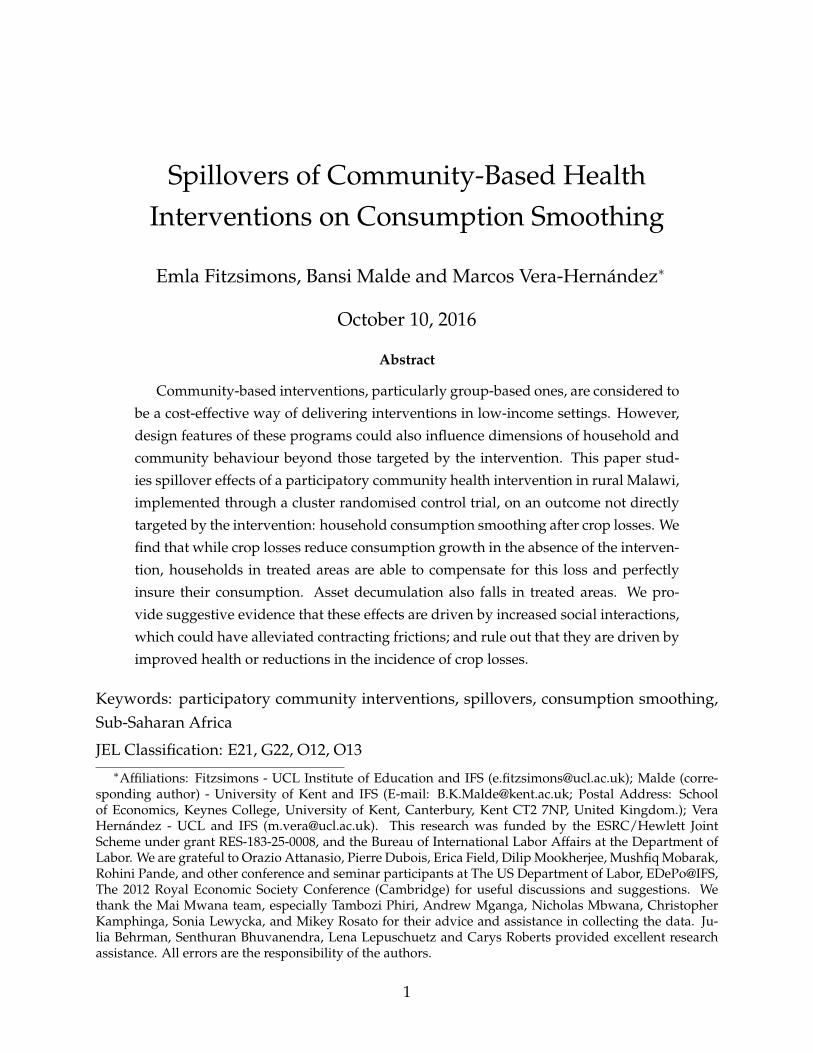
Figure 1: Village level proportion of crop losses among all sampled householdsFigure 1
02
46
Den
sity
0 .2 .4 .6 .8 1Proportion of households with crop shock in village
Wave1
02
46
8D
ensi
ty
0 .2 .4 .6 .8 1Proportion of households with crop shock in village
Wave2
alised by the time of the second wave interview. Note that we control for the differinghousehold-level recall periods in the empirical work.
Our empirical strategy relies on the fact that crop losses represent idiosyncratic (household-level) and not aggregate (village-level) adverse events. Crop losses could affect all house-holds in a village if they are caused by common weather shocks or natural disasters af-fecting the whole village. To assess the idiosyncratic variation in crop losses, Figure 1plots a histogram of the village level proportion of households experiencing a crop lossin our sample.
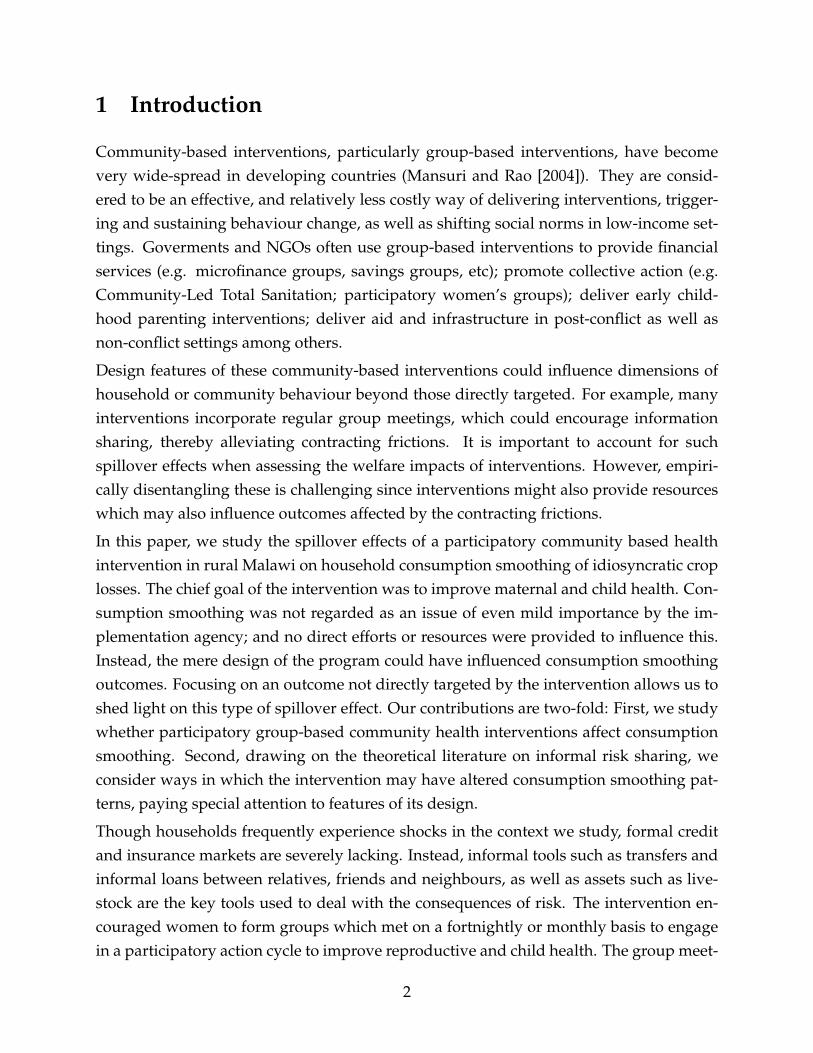
The left (right) panel of the figure shows the density of the village level proportion ofcrop losses in the first (second) wave. Both show substantial variation within the villagein the incidence of crop losses, though there are some villages where no household experi-enced a crop loss and others where all households experienced a crop loss. Reassuringly,this variation does not simply reflect variation in the distribution of occupations acrossvillages, as can be seen in Figure 2, which plots the same distribution as Figure 1 but is re-stricted to households where the head or spouse report agriculture as their main incomegenerating activity.
17
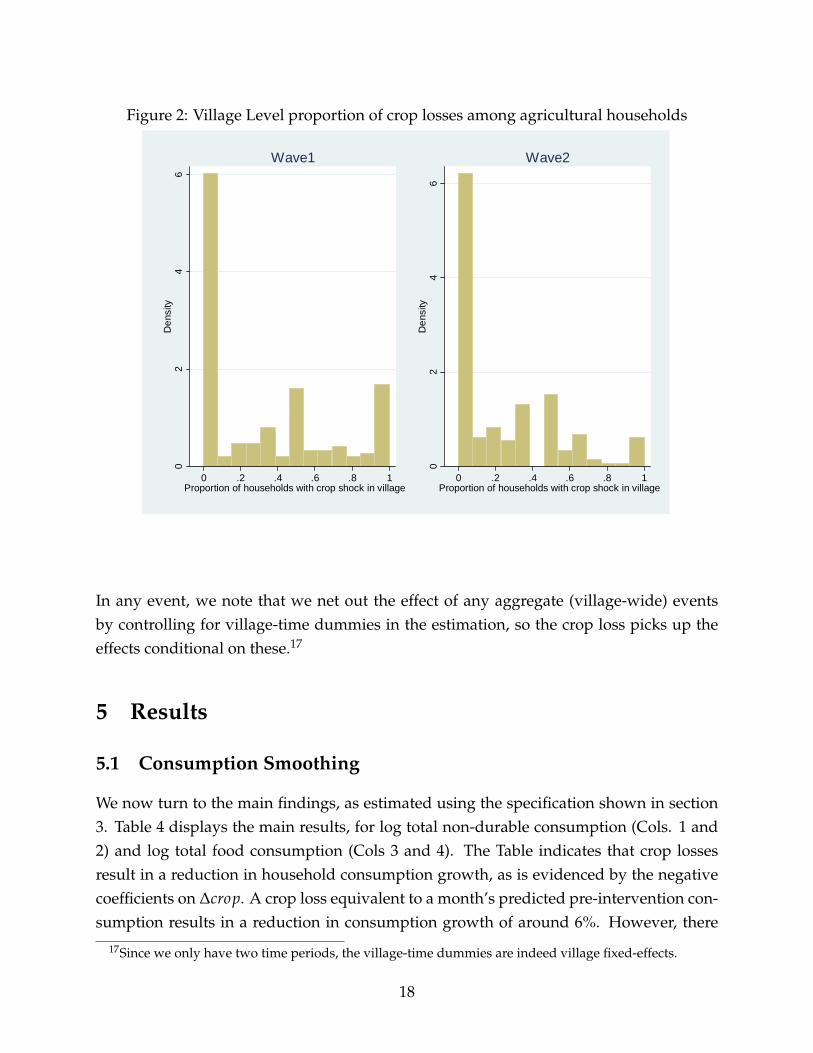
Figure 2: Village Level proportion of crop losses among agricultural householdsFigure 2
02
46
Den
sity
0 .2 .4 .6 .8 1Proportion of households with crop shock in village
Wave1
02
46
Den
sity
0 .2 .4 .6 .8 1Proportion of households with crop shock in village
Wave2
In any event, we note that we net out the effect of any aggregate (village-wide) eventsby controlling for village-time dummies in the estimation, so the crop loss picks up theeffects conditional on these.17
5 Results
5.1 Consumption Smoothing
We now turn to the main findings, as estimated using the specification shown in section3. Table 4 displays the main results, for log total non-durable consumption (Cols. 1 and2) and log total food consumption (Cols 3 and 4). The Table indicates that crop lossesresult in a reduction in household consumption growth, as is evidenced by the negativecoefficients on ∆crop. A crop loss equivalent to a month’s predicted pre-intervention con-sumption results in a reduction in consumption growth of around 6%. However, there
17Since we only have two time periods, the village-time dummies are indeed village fixed-effects.
18
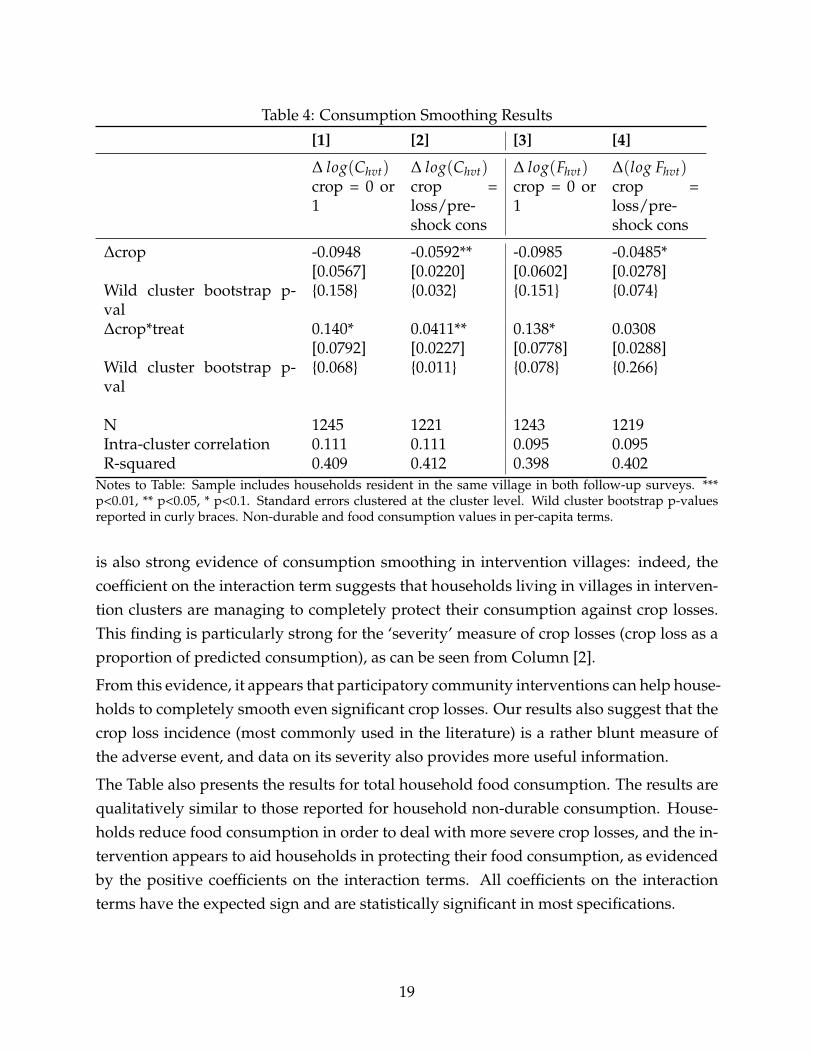
Table 4: Consumption Smoothing Results
[1] [2] [3] [4]
∆ log(Chvt) ∆ log(Chvt) ∆ log(Fhvt) ∆(log Fhvt)crop = 0 or1
crop =loss/pre-shock cons
crop = 0 or1
crop =loss/pre-shock cons
∆crop -0.0948 -0.0592** -0.0985 -0.0485*[0.0567] [0.0220] [0.0602] [0.0278]
Wild cluster bootstrap p-val
{0.158} {0.032} {0.151} {0.074}
∆crop*treat 0.140* 0.0411** 0.138* 0.0308[0.0792] [0.0227] [0.0778] [0.0288]
Wild cluster bootstrap p-val
{0.068} {0.011} {0.078} {0.266}
N 1245 1221 1243 1219Intra-cluster correlation 0.111 0.111 0.095 0.095R-squared 0.409 0.412 0.398 0.402
Notes to Table: Sample includes households resident in the same village in both follow-up surveys. ***p<0.01, ** p<0.05, * p<0.1. Standard errors clustered at the cluster level. Wild cluster bootstrap p-valuesreported in curly braces. Non-durable and food consumption values in per-capita terms.
is also strong evidence of consumption smoothing in intervention villages: indeed, thecoefficient on the interaction term suggests that households living in villages in interven-tion clusters are managing to completely protect their consumption against crop losses.This finding is particularly strong for the ‘severity’ measure of crop losses (crop loss as aproportion of predicted consumption), as can be seen from Column [2].
From this evidence, it appears that participatory community interventions can help house-holds to completely smooth even significant crop losses. Our results also suggest that thecrop loss incidence (most commonly used in the literature) is a rather blunt measure ofthe adverse event, and data on its severity also provides more useful information.
The Table also presents the results for total household food consumption. The results arequalitatively similar to those reported for household non-durable consumption. House-holds reduce food consumption in order to deal with more severe crop losses, and the in-tervention appears to aid households in protecting their food consumption, as evidencedby the positive coefficients on the interaction terms. All coefficients on the interactionterms have the expected sign and are statistically significant in most specifications.
19
5.2 Savings and Assets
Having considered how the intervention influences consumption smoothing in the eventof a crop loss, we next study effects on cash savings and assets, specifically livestock.In addition to informal risk sharing with other households through transfers, gifts andloans, another way through which households could cope with crop losses may be bydrawing down savings and assets (Paxson, 1992; Rosenzweig and Wolpin, 1993). This isa margin with important consequences for long run household well-being, since produc-tion and consumption decisions for farm households in developing countries are knownto be interlinked. Households might use productive assets such as livestock to smooththeir consumption, impacting future income generation and longer-run poverty status(Banerjee and Newman, 1993; Aghion and Bolton, 1997).
To see how household savings and asset holdings following a crop loss vary by treatmentstatus, we estimate Equation 1 using as the dependent variable changes in cash savings,changes in the number of small animals (e.g. poultry and rabbits), and changes in thenumber of large animals (e.g. cows and sheeps) rather than changes in log consump-tion. Table 5 displays the results. Though the estimates are noisy, the Table indicates thathouseholds in control areas hold fewer savings and livestock following a crop loss, indi-cating that they partly self-insure these shocks. This pattern is reversed in treated clusters:households experiencing a crop loss hold one more large animal than those in control ar-eas, suggesting that these households no longer rely on livestock sales to smooth theirconsumption.
Thus, the intervention not only improves consumption smoothing, but also reduces assetdecumulation following crop losses. This has important implications for future house-hold well-being since higher savings has been shown to be linked with higher agriculturalinput use as well as higher agricultural yields in this context (Gine et al., 2012).
5.3 Possible Mechanisms
The findings thus far indicate that not only did consumption smoothing improve in inter-vention areas, but also that households in intervention areas are less likely to draw downassets, particularly large animals, to smooth their consumption compared to householdsin control clusters. Thus, improvements in consumption smoothing are likely to be drivenby improvements in informal risk sharing. In particular, we hypothesize that the groups
20
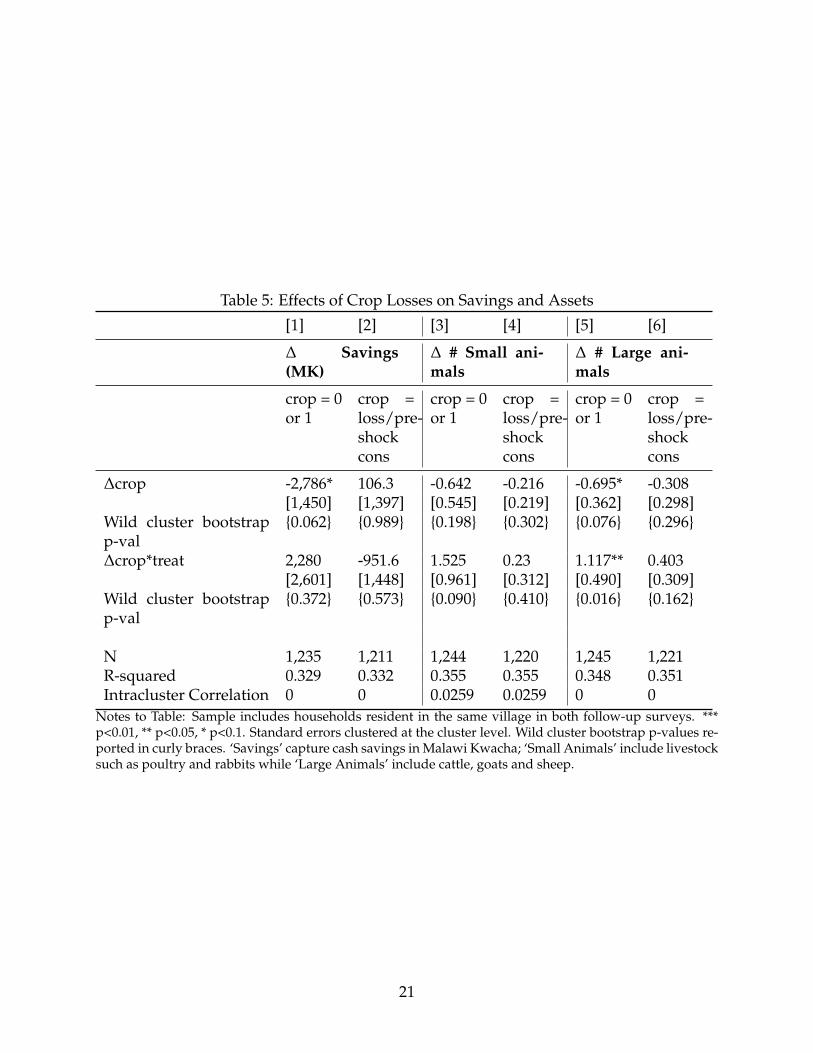
Table 5: Effects of Crop Losses on Savings and Assets
[1] [2] [3] [4] [5] [6]
∆ Savings(MK)
∆ # Small ani-mals
∆ # Large ani-mals
crop = 0or 1
crop =loss/pre-shockcons
crop = 0or 1
crop =loss/pre-shockcons
crop = 0or 1
crop =loss/pre-shockcons
∆crop -2,786* 106.3 -0.642 -0.216 -0.695* -0.308[1,450] [1,397] [0.545] [0.219] [0.362] [0.298]
Wild cluster bootstrapp-val
{0.062} {0.989} {0.198} {0.302} {0.076} {0.296}
∆crop*treat 2,280 -951.6 1.525 0.23 1.117** 0.403[2,601] [1,448] [0.961] [0.312] [0.490] [0.309]
Wild cluster bootstrapp-val
{0.372} {0.573} {0.090} {0.410} {0.016} {0.162}
N 1,235 1,211 1,244 1,220 1,245 1,221R-squared 0.329 0.332 0.355 0.355 0.348 0.351Intracluster Correlation 0 0 0.0259 0.0259 0 0
Notes to Table: Sample includes households resident in the same village in both follow-up surveys. ***p<0.01, ** p<0.05, * p<0.1. Standard errors clustered at the cluster level. Wild cluster bootstrap p-values re-ported in curly braces. ‘Savings’ capture cash savings in Malawi Kwacha; ‘Small Animals’ include livestocksuch as poultry and rabbits while ‘Large Animals’ include cattle, goats and sheep.
21
increased social interactions within communities, which in turn could have reduced con-tracting frictions including information asymmetries and imperfect enforcement.
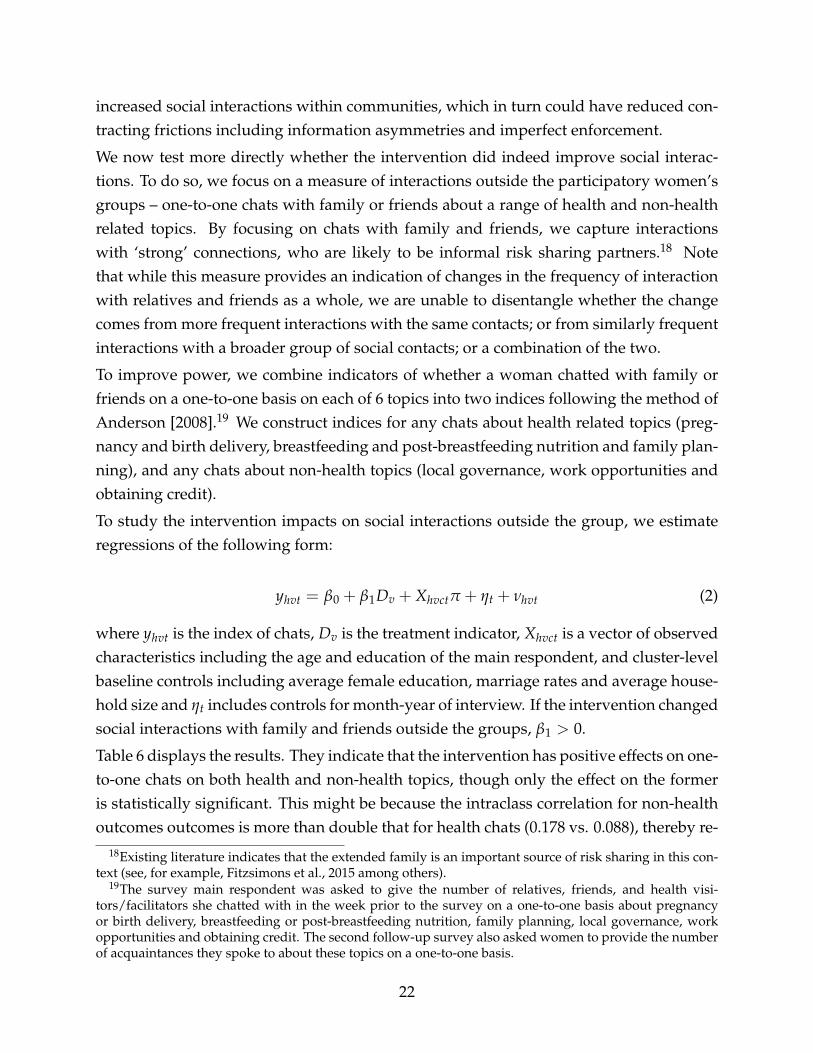
We now test more directly whether the intervention did indeed improve social interac-tions. To do so, we focus on a measure of interactions outside the participatory women’sgroups – one-to-one chats with family or friends about a range of health and non-healthrelated topics. By focusing on chats with family and friends, we capture interactionswith ‘strong’ connections, who are likely to be informal risk sharing partners.18 Notethat while this measure provides an indication of changes in the frequency of interactionwith relatives and friends as a whole, we are unable to disentangle whether the changecomes from more frequent interactions with the same contacts; or from similarly frequentinteractions with a broader group of social contacts; or a combination of the two.
To improve power, we combine indicators of whether a woman chatted with family orfriends on a one-to-one basis on each of 6 topics into two indices following the method ofAnderson [2008].19 We construct indices for any chats about health related topics (preg-nancy and birth delivery, breastfeeding and post-breastfeeding nutrition and family plan-ning), and any chats about non-health topics (local governance, work opportunities andobtaining credit).
To study the intervention impacts on social interactions outside the group, we estimateregressions of the following form:
yhvt = β0 + β1Dv + Xhvctπ + ηt + νhvt (2)
where yhvt is the index of chats, Dv is the treatment indicator, Xhvct is a vector of observedcharacteristics including the age and education of the main respondent, and cluster-levelbaseline controls including average female education, marriage rates and average house-hold size and ηt includes controls for month-year of interview. If the intervention changedsocial interactions with family and friends outside the groups, β1 > 0.
Table 6 displays the results. They indicate that the intervention has positive effects on one-to-one chats on both health and non-health topics, though only the effect on the formeris statistically significant. This might be because the intraclass correlation for non-healthoutcomes outcomes is more than double that for health chats (0.178 vs. 0.088), thereby re-
18Existing literature indicates that the extended family is an important source of risk sharing in this con-text (see, for example, Fitzsimons et al., 2015 among others).
19The survey main respondent was asked to give the number of relatives, friends, and health visi-tors/facilitators she chatted with in the week prior to the survey on a one-to-one basis about pregnancyor birth delivery, breastfeeding or post-breastfeeding nutrition, family planning, local governance, workopportunities and obtaining credit. The second follow-up survey also asked women to provide the numberof acquaintances they spoke to about these topics on a one-to-one basis.
22
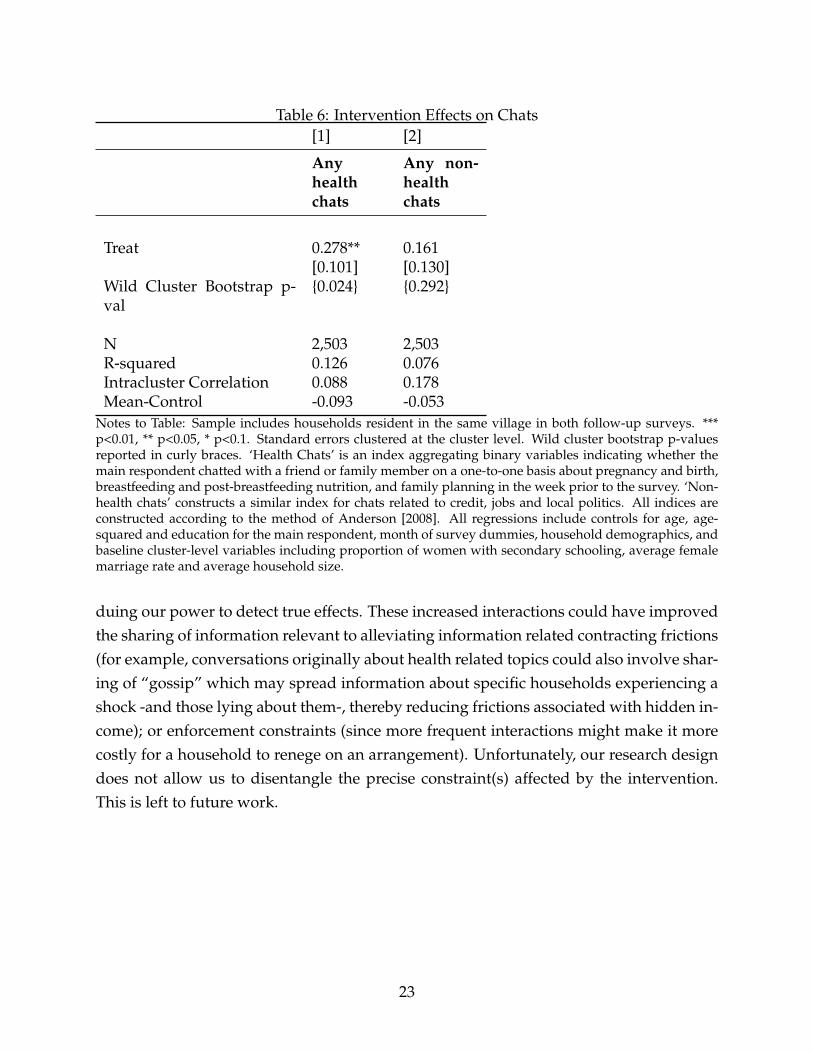
Table 6: Intervention Effects on Chats[1] [2]
Anyhealthchats
Any non-healthchats
Treat 0.278** 0.161[0.101] [0.130]
Wild Cluster Bootstrap p-val
{0.024} {0.292}
N 2,503 2,503R-squared 0.126 0.076Intracluster Correlation 0.088 0.178Mean-Control -0.093 -0.053
Notes to Table: Sample includes households resident in the same village in both follow-up surveys. ***p<0.01, ** p<0.05, * p<0.1. Standard errors clustered at the cluster level. Wild cluster bootstrap p-valuesreported in curly braces. ‘Health Chats’ is an index aggregating binary variables indicating whether themain respondent chatted with a friend or family member on a one-to-one basis about pregnancy and birth,breastfeeding and post-breastfeeding nutrition, and family planning in the week prior to the survey. ‘Non-health chats’ constructs a similar index for chats related to credit, jobs and local politics. All indices areconstructed according to the method of Anderson [2008]. All regressions include controls for age, age-squared and education for the main respondent, month of survey dummies, household demographics, andbaseline cluster-level variables including proportion of women with secondary schooling, average femalemarriage rate and average household size.
duing our power to detect true effects. These increased interactions could have improvedthe sharing of information relevant to alleviating information related contracting frictions(for example, conversations originally about health related topics could also involve shar-ing of “gossip” which may spread information about specific households experiencing ashock -and those lying about them-, thereby reducing frictions associated with hidden in-come); or enforcement constraints (since more frequent interactions might make it morecostly for a household to renege on an arrangement). Unfortunately, our research designdoes not allow us to disentangle the precise constraint(s) affected by the intervention.This is left to future work.
23

5.4 Ruling out alternative mechanisms
5.4.1 Improved Health
Though we consider intervention impacts on consumption smoothing in response to ashock not targeted by the intervention, it is possible that this response could also be in-fluenced by health improvements due to the intervention. In particular, the interventioncould have improved both reproductive health outcomes, as well as health more gener-ally within the household, for instance by increasing awareness of health issues, or mak-ing these more salient. This may put households in a better position to cope with anyadverse events that occur – being in better health may mean that individuals can workharder, for instance.
Lewycka et al. [2013] document a reduction in maternal mortality of 74% due to the in-tervention. This would have resulted in approximately 3 less maternal deaths amongtreated households in our sample, which is too small to explain the entire consumptionsmoothing effect we uncover. This makes it unlikely to be the mechanism through whichthe intervention improves consumption smoothing of crop losses.
Nonetheless, the intervention could also have improved adult health more generally,thereby leading to fewer health shocks. To investigate this possibility, Tables 7 and 8report the effect of the intervention on several self-reported indicators of adult health, formales and females respectively. According to the results, there is no evidence that theintervention improved adult health, for both symptoms experienced in a short intervalprior to the survey, as well as in indicators relating to activities of daily living, which arebetter at capturing longer-term health issues.20 This provides further evidence indicatingthat the key findings are not driven by health improvements due to the intervention.
20Though not reported here, we also examine and rule out that the intervention affected children’s health.These results are available on request.
24

Table 7: Effect of Intervention on Male Adult Health[1] [2] [3] [4] [5] [6] [7] [8] [9]
HealthIndex
No di-arrhoeain last30 days
Nofever inlast 30days
Nocoughin last30 days
Nochills inlast 30days
Novomitin last30 days
Able tocarryoutdailyactivi-ties
Caneasilycarry10kgload for20m
Caneasilywalk5km
Treat 0.022 -0.004 -0.069 0.016 0.001 0.015 -0.043 0.022 0.041[0.063] [0.013] [0.043] [0.050] [0.031] [0.018] [0.039] [0.033] [0.029]
Wild Cluster bootstrap p-val
{0.673} {0.781} {0.138} {0.637} {0.975} {0.390} {0.340} {0.519} {0.190}
Observations 3124 3,124 3,124 3,124 3,124 3,124 3,124 3,124 3,124R-squared 0.051 0.003 0.014 0.002 0.005 0.004 0.009 0.091 0.119IntraCluster Correlation 0.0868 0.0114 0.0557 0.0648 0.0604 0.0173 0.0358 0.0719 0.0629Average in Control -0.0107 0.947 0.77 0.724 0.912 0.901 0.719 0.911 0.89
Notes to Table: Sample includes male individuals aged 15-64 living in households that were resident in the same village in both follow-up surveys.*** p<0.01, ** p<0.05, * p<0.1. Standard errors clustered at the cluster level. Wild cluster bootstrap p-values reported in curly braces. The HealthIndex aggregates the responses to questions in Columns 2 - 9 using the method of Anderson [2008].
25
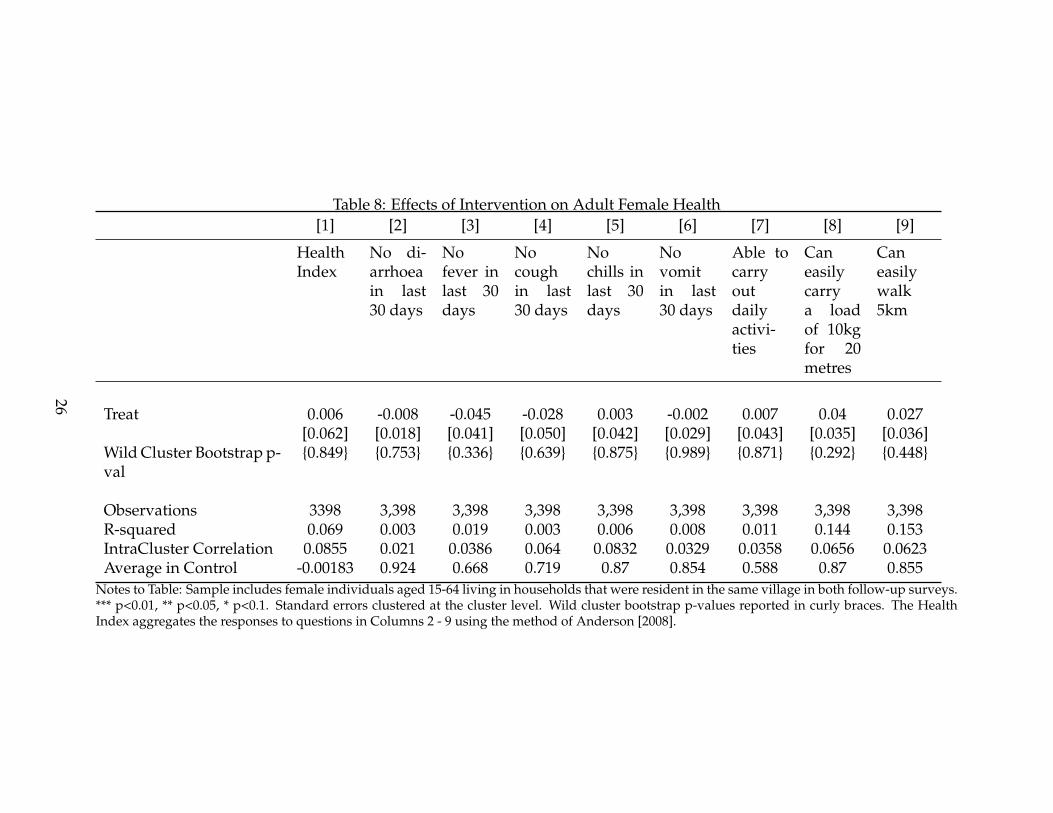
Table 8: Effects of Intervention on Adult Female Health[1] [2] [3] [4] [5] [6] [7] [8] [9]
HealthIndex
No di-arrhoeain last30 days
Nofever inlast 30days
Nocoughin last30 days
Nochills inlast 30days
Novomitin last30 days
Able tocarryoutdailyactivi-ties
Caneasilycarrya loadof 10kgfor 20metres
Caneasilywalk5km
Treat 0.006 -0.008 -0.045 -0.028 0.003 -0.002 0.007 0.04 0.027[0.062] [0.018] [0.041] [0.050] [0.042] [0.029] [0.043] [0.035] [0.036]
Wild Cluster Bootstrap p-val
{0.849} {0.753} {0.336} {0.639} {0.875} {0.989} {0.871} {0.292} {0.448}
Observations 3398 3,398 3,398 3,398 3,398 3,398 3,398 3,398 3,398R-squared 0.069 0.003 0.019 0.003 0.006 0.008 0.011 0.144 0.153IntraCluster Correlation 0.0855 0.021 0.0386 0.064 0.0832 0.0329 0.0358 0.0656 0.0623Average in Control -0.00183 0.924 0.668 0.719 0.87 0.854 0.588 0.87 0.855
Notes to Table: Sample includes female individuals aged 15-64 living in households that were resident in the same village in both follow-up surveys.*** p<0.01, ** p<0.05, * p<0.1. Standard errors clustered at the cluster level. Wild cluster bootstrap p-values reported in curly braces. The HealthIndex aggregates the responses to questions in Columns 2 - 9 using the method of Anderson [2008].
26
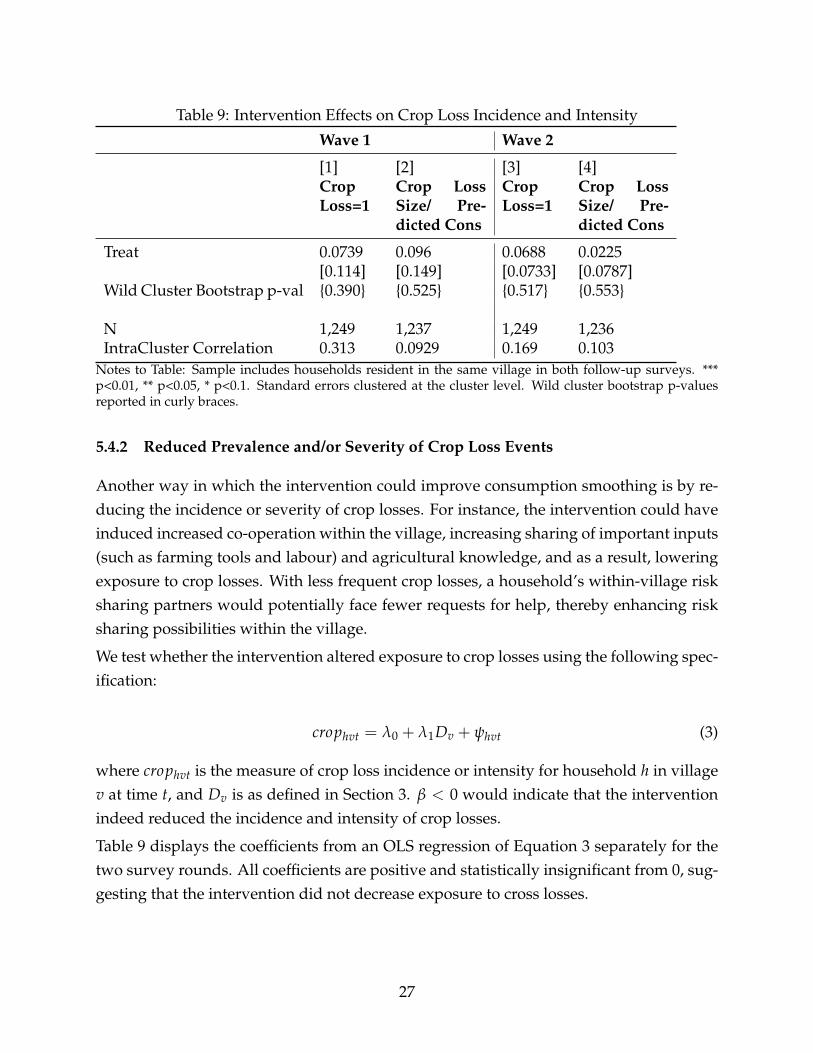
Table 9: Intervention Effects on Crop Loss Incidence and Intensity
Wave 1 Wave 2
[1] [2] [3] [4]CropLoss=1
Crop LossSize/ Pre-dicted Cons
CropLoss=1
Crop LossSize/ Pre-dicted Cons
Treat 0.0739 0.096 0.0688 0.0225[0.114] [0.149] [0.0733] [0.0787]
Wild Cluster Bootstrap p-val {0.390} {0.525} {0.517} {0.553}
N 1,249 1,237 1,249 1,236IntraCluster Correlation 0.313 0.0929 0.169 0.103
Notes to Table: Sample includes households resident in the same village in both follow-up surveys. ***p<0.01, ** p<0.05, * p<0.1. Standard errors clustered at the cluster level. Wild cluster bootstrap p-valuesreported in curly braces.
5.4.2 Reduced Prevalence and/or Severity of Crop Loss Events
Another way in which the intervention could improve consumption smoothing is by re-ducing the incidence or severity of crop losses. For instance, the intervention could haveinduced increased co-operation within the village, increasing sharing of important inputs(such as farming tools and labour) and agricultural knowledge, and as a result, loweringexposure to crop losses. With less frequent crop losses, a household’s within-village risksharing partners would potentially face fewer requests for help, thereby enhancing risksharing possibilities within the village.
We test whether the intervention altered exposure to crop losses using the following spec-ification:
crophvt = λ0 + λ1Dv + ψhvt (3)
where crophvt is the measure of crop loss incidence or intensity for household h in villagev at time t, and Dv is as defined in Section 3. β < 0 would indicate that the interventionindeed reduced the incidence and intensity of crop losses.
Table 9 displays the coefficients from an OLS regression of Equation 3 separately for thetwo survey rounds. All coefficients are positive and statistically insignificant from 0, sug-gesting that the intervention did not decrease exposure to cross losses.
27
6 Conclusion
This paper studies the spillover effects of a participatory community based health inter-vention in rural Malawi on an outcome not directly targeted by the intervention: house-hold consumption smoothing following idiosyncratic crop losses. Group-based commu-nity ones are considered to be a cost-effective way of delivering interventions in low-income settings. However, design features of these programs could also influence dimen-sions of household and community-behaviour beyond those targeted by the intervention,generating important spillovers.
To provide causal estimates, we exploit a cluster randomised trial in which a participatorywomen’s group intervention targeting maternal and child health was randomly allocatedto some groups of villages (clusters), while a similar number of clusters received no in-tervention. The intervention encouraged community members, particularly women, tomeet on a regular basis to discuss maternal and child health related issues, before mo-bilising the community to combat the identified issues. By facilitating the formation ofgroups that met regularly, and that aimed to involve a broad swathe of the community,the intervention could have increased social interactions and alleviated contracting fric-tions thereby improving consumption smoothing.
We find that consumption smoothing – measured as the response of changes in log house-hold (non-durable) consumption to idiosyncratic crop loss events, net of village level ag-gregate shocks – worsens following a crop loss for households in control clusters. Thosein intervention clusters, however, are able to compensate for this loss and almost per-fectly insure their consumption. We also find that households in intervention areas areless likely to draw down their savings, and hold more large animals following a crop lossthan households in control areas. This has important implications for households’ effortsto escape poverty in the long-run.
Examining mechanisms underlying this effect on consumption smoothing, we find sug-gestive evidence that the intervention increased social interactions. This, in turn, couldhave alleviated a number of contracting frictions impeding informal risk sharing in thiscontext, thereby increasing overall risk sharing and consumption smoothing. Crucially,we also rule out that these effects were driven by improvements in general health, or areduction in the incidence of crop losses.
Though we find suggestive evidence indicating that social interactions increased, andcontracting frictions may have been alleviated, our research design doesn’t allow us topin down more clearly the exact frictions alleviated in this context. Testing this is left tofuture work.
28
References
Philippe Aghion and Patrick Bolton. A theory of trickle-down growth and development.Review of Economic Studies, 64(2):151–172, 1997.
N. Ali and D. Miller. “Enforcing Cooperation in Networked Societies”. mimeo, Universityof Michigan, 2013.
M. Anderson. "Multiple Inference and Gender Differences in the Effects of Early Interven-tion: A Reevaluation of the Abecedarian, Perry Preschool, and Early Training Projects".Journal of the American Statistical Association, 103(484):1484–1495, 2008.
M. Angelucci, G. De Giorgi, and I. Rasul. “Resource Pooling Within Family Networks:Insurance and Investment”. mimeo, University College London, 2015.
Abhijit V Banerjee and Andrew Newman. Occupational choice and the process of devel-opment. Journal of Political Economy, 101(2):274–98, 1993.
Abhijit V. Banerjee, Rukmini Banerji, Esther Duflo, Rachel Glennerster, and Stuti Khe-mani. Pitfalls of Participatory Programs: Evidence from a Randomized Evaluation inEducation in India. American Economic Journal: Economic Policy, 2(1):1–30, February 2010.
M. Bertrand, E. Duflo, and S. Mullainathan. “How Much Should We Trust Differences-in-Differences Estimates?". Quarterly Journal of Economics, 119(1):249–275, 2004.
Christopher Blattman, Eric P. Green, Julian Jamison, M. Christian Lehmann, and JeannieAnnan. The returns to microenterprise support among the ultrapoor: A field exper-iment in postwar uganda. American Economic Journal: Applied Economics, 8(2):35–64,April 2016.
E. Breza and A. Chandrasekhar. “Social Networks, Reputation and Commitment: Evi-dence from a Savings Monitors Field Experiment”. mimeo, Columbia University, 2015.
C. Cameron, J. Gelbach, and D. Miller. “Bootstrap-Based Improvements for Inferencewith Clustered Errors". Review of Economics and Statistics, 90:414–427, 2008.
L. Cameron, S. Oliva, and M. Shah. "Initial Conditions Matter: Social Capital and Partici-patory Development". IZA Working Paper, 9563, 2015.
Katherine Casey, Rachel Glennerster, and Edward Miguel. Reshaping institutions: Evi-dence on aid impacts using a preanalysis plan*. The Quarterly Journal of Economics, 127(4):1755–1812, 2012.
29
A. Chandrasekhar, H. Larreguy, and C. Kinnan. "Social Networks as Contract Enforce-ment: Evidence from a lab experiment in the field". mimeo, Stanford University, 2015.
Raj Chetty and Adam Looney. Consumption smoothing and the welfare consequences ofsocial insurance in developing economies. Journal of Public Economics, 90(12):2351–2356,December 2006.
John H Cochrane. A Simple Test of Consumption Insurance. Journal of Political Economy,99(5):957–76, October 1991.
S. Donald and K. Lang. “Inference with Differences-in-Differences and Other Panel Data".Review of Economics and Statistics, 89:221–233, 2007.
Marcel Fafchamps and Eliana La Ferrara. Self-Help Groups and Mutual Assistance: Ev-idence from Urban Kenya. Economic Development and Cultural Change, 60(4):707 – 733,2012.
James D. Fearon, Macartan Humphreys, and Jeremy M. Weinstein. Can developmentaid contribute to social cohesion after civil war? evidence from a field experiment inpost-conflict liberia. American Economic Review, 99(2):287–91, May 2009.
B. Feigenberg, E. Field, and R. Pande. “The Economic Returns to Social Interaction: Ex-perimental Evidence from Microfinance”. 80(4):1459–1483, 2013.
E. Fitzsimons, B. Malde, and M. Vera-Hernandez. “Group Size and the Efficiency of In-formal Risk Sharing”. IFS Working Paper, 2015.
E. Fitzsimons, B. Malde, A. Mesnard, and M. Vera-Hernandez. "Nutrition, informationand household behaviour: experimental evidence from Malawi". Journal of DevelopmentEconomics, Forthcoming, 2016.
Paul Gertler and Jonathan Gruber. Insuring consumption against illness. American Eco-nomic Review, 92(1):51–70, March 2002.
X. Gine, J. Goldberg, and D. Yang. “Credit Market Consequences of Improved PersonalIdentification: Field Experimental Evidence from Malawi". The American Economic Re-view, 102(6):2923–54, 2012.
Luigi Guiso, Paola Sapienza, and Luigi Zingales. The Role of Social Capital in FinancialDevelopment. American Economic Review, 94(3):526–556, June 2004.
30
R. Guiteras and B. K. Jack. "Incentive, Selection and Productivity in Labor Markets: Evi-dence from Rural Malawi". NBER Working Paper, 19825, 2014.
M. Humphreys, R. de la Sierra, and P. Van der Windt. "Social Engineering in the Tropics:A Grassroots Democratisation Experiment in the Congo". mimeo, Columbia University,2015.
B. Kelsey Jack. Private information and the allocation of land use subsidies in malawi.American Economic Journal: Applied Economics, 5(3):113–35, July 2013.
C. Kinnan. “Distinguishing Barriers to Insurance in Thai Villages”. mimeo, NorthwesternUniversity, 2014.
N. Kocherlakota. "Implications of Efficient Risk Sharing without Commitment". Reviewof Economic Studies, 63(4):595–609, 1996.
Julien Labonne and Robert S. Chase. Do community-driven development projects en-hance social capital? evidence from the philippines. Journal of Development Economics,96(2):348 – 358, 2011. ISSN 0304-3878.
S. Lewycka. “Reducing Maternal and Neonatal Deaths in Rural Malawi: Evaluating the Im-pact of a Community-based Women’s Group Intervention". PhD thesis, University CollegeLondon, 2011.
S. Lewycka, C. Mwansambo, P. Kazembe, T. Phiri, A. Mganga, M. Rosato, H. Chapota,F. Malamba, S. Vergnano, M-L. Newell, D. Osrin, and A. Costello. “A cluster ran-domised controlled trial of the community effectiveness of two interventions in ruralMalawi to improve health care and to reduce maternal, newborn and infant mortality".Trials, 11:88, 2010.
S. Lewycka, C. Mwansambo, M. Rosato, P. Kazembe, T. Phiri, A. Mganga, H. Chapota,F. Malamba, E. Kainja, M. Newell, G. Greco, A. Brannstrom, J. Skordis-Worrall,S. Vergnano, D. Osrin, and A. Costello. "Effect of women’s groups and volunteer peercounselling on rates of mortality, morbidity and health behaviours in mothers and chil-dren in rural Malawi (MaiMwana): a factorial, cluster-randomised controlled trial". TheLancet, 381:1721–35, 2013.
E. Ligon. “Risk Sharing and Information in Village Economies”. Review of Economic Stud-ies, 65(4):847–864, 1998.
31
E. Ligon, J. Thomas, and T. Worrall. “Informal Insurance Arrangements with LimitedCommitment: Theory and Evidence from Village Economies”. The Review of EconomicStudies, 69(1):209–244, 2003.
Sharon Maccini and Dean Yang. Under the weather: Health, schooling, and economicconsequences of early-life rainfall. American Economic Review, 99(3):1006–26, June 2009.
Ghazala Mansuri and Vijayendra Rao. Community-based and -driven development: Acritical review. The World Bank Research Observer, 19(1):1–39, 2004.
A. Munthali. "Adaptive Strategies and Coping Mechanisms of Families and Commu-nities Affected by HIV/AIDS in Malawi". Draft paper prepared for the UNRISD projectHIV/AIDS and Development, 2002.
Christina H Paxson. Using Weather Variability to Estimate the Response of Savings toTransitory Income in Thailand. American Economic Review, 82(1):15–33, March 1992.
P. Peters, P. Walker, and D. Kambewa. "Striving for Normality in a Time of AIDS inMalawi". The Journal of Modern African Studies, 46(4):659–687, 2008.
Amy J. Pickering, Habiba Djebbari, Carolina Lopez, Massa Coulibaly, and Maria LauraAlzua. Effect of a community-led sanitation intervention on child diarrhoea and childgrowth in rural mali: a cluster-randomised controlled trial. The Lancet Global Health, 3(11):e701–e711, 2016. ISSN 2214-109X.
Audrey Prost, Tim Colbourn, Nadine Seward, Kishwar Azad, Arri Coomarasamy, An-drew Copas, Tanja A. J. Houweling, Edward Fottrell, Abdul Kuddus, Sonia Lewycka,Christine MacArthur, Dharma Manandhar, Joanna Morrison, Charles Mwansambo,Nirmala Nair, Bejoy Nambiar, David Osrin, Christina Pagel, Tambosi Phiri, Anni-MariaPulkki-Brännström, Mikey Rosato, Jolene Skordis-Worrall, Naomi Saville, Neena ShahMore, Bhim Shrestha, Prasanta Tripathy, Amie Wilson, and Anthony Costello. Women’sgroups practising participatory learning and action to improve maternal and newbornhealth in low-resource settings: a systematic review and meta-analysis. The Lancet, 381(9879):1736–1746, 2013. ISSN 0140-6736.
M. Rosato, S. Lewycka, C. Mwansambo, P. Kazembe, and A. Costello. “Women’s Groups’Perceptions of Neonatal and Infant Health Problems in Rural Malawi". Malawi MedicalJournal, 21(4):168–173, 2009.
M. Rosato, F. Malamba, B. Kunyenge, T. Phiri, C. Mwansambo, P. Kazembe, A. Costello,and S. Lewycka. Strategies developed and implemented by women’s groups to improve
32
mother and infant health and reduce mortality in rural malawi. International Health, 4(3):176–184, 2012.
Mikey Rosato, Charles W Mwansambo, Peter N Kazembe, Tambosi Phiri, Queen S Soko,Sonia Lewycka, Beata E Kunyenge, Stefania Vergnano, David Osrin, Marie-LouiseNewell, and Anthony M de L Costello. “Women’s groups’ perceptions of maternalhealth issues in rural Malawi". The Lancet, 368(9542):1180–1188, 2006. ISSN 0140-6736.
Mark R Rosenzweig and Kenneth I Wolpin. Credit Market Constraints, ConsumptionSmoothing, and the Accumulation of Durable Production Assets in Low-Income Coun-tries: Investment in Bullocks in India. Journal of Political Economy, 101(2):223–44, April1993.
R. Townsend. "Risk and Insurance in Village India". Econometrica, 62(3):539–591, 1994.
J. Trinitapoli, S. Yeatman, and J. Fledderjohann. "Sibling Support and the EducationalProspects of Young Adults in Malawi". Demographic Research, 30:547–578, 2014.
Christopher Udry. Risk and Saving in Northern Nigeria. American Economic Review, 85(5):1287–1300, December 1995.
J. Wooldridge. “Cluster-Sample Methods in Applied Econometrics". The American Eco-nomic Review, 93(2):133–138, 2004.
33


![Community-based population-level interventions for ...dro.deakin.edu.au/eserv/DU:30090799/hegde... · [Intervention Review] Community-based population-level interventions for promoting](https://img.dokumen.tips/doc/110x75/5fae2c13a53188374773fcce/community-based-population-level-interventions-for-dro-30090799hegde-intervention.jpg)