Embed Size (px)
Citation preview

NASA/TMm2000-209891, Vol. 92
Technical Report Series on theBoreal Ecosystem-Atmosphere Study (BOREAS)
Forrest G. Hall and Jaime Nickeson, Editors
Volume 92
BOREAS Level-lB TIMS Imagery:
At-sensor Radiance in BSQ Format
Richard Strub and Jeffrey A. Newcomer, Raytheon ITSS
Sonia Chernobiefj-; User Tech. Associates, Inc.
National Aeronautics and
Space Administration
Goddard Space Flight Center
Greenbelt, Maryland 20771
September 2000
https://ntrs.nasa.gov/search.jsp?R=20010022244 2018-10-02T04:48:58+00:00Z

The NASA STI Program Office ... in Profile
Since its founding, NASA has been dedicated to
the advancement of aeronautics and spacescience. The NASA Scientific and Technical
Information (STI) Program Office plays a key
part in helping NASA maintain this importantrole.
The NASA STI Program Office is operated by
Langley Research Center, the lead center forNASA's scientific and technical information. The
NASA STI Program Office provides access to
the NASA STI Database, the largest collection of
aeronautical and space science STI in the world.
The Program Office is also NASA's institutional
mechanism for disseminating the results of its
research and development activities. These
results are published by NASA in the NASA STI
Report Series, which includes the following
report types:
• TECHNICAL PUBLICATION. Reports of
completed research or a major significant
phase of research that present the results of
NASA programs and include extensive data or
theoretical analysis. Includes compilations of
significant scientific and technical data and
information deemed to be of continuing
reference value. NASA's counterpart of
peer-reviewed formal professional papers but
has less stringent limitations on manuscript
length and extent of graphic presentations.
• TECHNICAL MEMORANDUM. Scientific
and technical findings that are preliminary or
of specialized interest, e.g., quick release
reports, working papers, and bibliographiesthat contain minimal annotation. Does not
contain extensive analysis.
• CONTRACTOR REPORT. Scientific and
technical findings by NASA-sponsored
contractors and grantees.
CONFERENCE PUBLICATION. Collected
papers from scientific and technical
conferences, symposia, seminars, or other
meetings sponsored or cosponsored by NASA.
SPECIAL PUBLICATION. Scientific, techni-cal, or historical information from NASA
programs, projects, and mission, often con-
cerned with subjects having substantial publicinterest.
TECHNICAL TRANSLATION.
English-language translations of foreign scien-
tific and technical material pertinent to NASA'smission.
Specialized services that complement the STI
Program Office's diverse offerings include creat-
ing custom thesauri, building customized data-
bases, organizing and publishing research results...
even providing videos.
For more information about the NASA STI Pro-
grain Office, see the following:
Access the NASA STI Program Home Page at
http://www, sti.nasa.gov/STI-homepage.html
E-mail your question via the Internet to
help@ sti.nasa.gov
Fax your question to the NASA Access Help
Desk at (301) 621-0134
• Telephone the NASA Access Help Desk at
(301) 621-0390
Write to:
NASA Access Help Desk
NASA Center for AeroSpace Information7121 Standard Drive
Hanover, MD 21076-1320

NASA/TMm2000-209891, Vol. 92
Technical Report Series on theBoreal Ecosystem-Atmosphere Study (BOREAS)
Forrest G. Hall and Jaime Nickeson, Editors
Volume 92
BOREAS Level-lB TIMS Imagery:
At-sensor Radiance in BSQ Format
Richard Strub and Jeffrey A. Newcomer, Raytheon ITSS
Sonia Chernobiefj-; User Tech. Associates, Inc.
National Aeronautics and
Space Administration
Goddard Space Flight Center
Greenbelt, Maryland 20771
September 2000

NASA Center for AeroSpace Information7121 Standard Drive
Hanover, MD 21076-1320Price Code: A17
Available from:
National Technical Information Service
5285 Port Royal RoadSpringfield, VA 22161
Price Code: A10

BOREAS Level-lb TIMS Imagery: At-sensor Radiance in BSQ Format
Richard Strub, Jeffrey A. Newcomer, Sonia Chernobieff
Summary
The BOREAS Staff Science Aircraft Data Acquisition Program focused on providing the researchteams with the remotely sensed satellite data products they needed to compare and spatially extendpoint results. For BOREAS, the TIMS imagery, along with other aircraft images, was collected toprovide spatially extensive information over the primary study areas. The Level-lb TIMS images coverthe time periods of 16-Apr- 1994 to 20-Apr- 1994 and 06-Sep- 1994 to 17-Sep- 1994. The systemcalibrated images are stored in binary image format files.
Note that the Level-lb TIMS data are not contained on the BOREAS CD-ROM set. An inventorylisting file is supplied on the CD-ROM to inform users of the data that were collected. See Section 15for information about how to acquire actual Level-lb TIMS images.
Table of Contents
1) Data Set Overview2) Investigator(s)3) Theory of Measurements4) Equipment5) Data Acquisition Methods6) Observations7) Data Description8) Data Organization9) Data Manipulations10) Errors11) Notes12) Application of the Data Set13) Future Modifications and Plans14) Software15) Data Access16) Output Products and Availability17) References18) Glossary of Terms19) List of Acronyms20) Document Information
1. Data Set Overview
1.1 Data Set Identification
BOREAS Level-lb TIMS Imagery: At-sensor Radiance in BSQ Format
1.2 Data Set Introduction
The BOReal Ecosystem-Atmosphere Study (BOREAS) Staff Science effort covered those activitiesthat were BOREAS community-level activities or required uniform data collection procedures acrosssites and time. These activities included the acquisition, processing, and archiving of 6-band ThermalInfrared Multispectral Scanner (TIMS) image data collected on the National Aeronautics and SpaceAdministrator's (NASA's) C-130 aircraft.
Page 1

1.3 Objective/PurposeForBOREAS,theTIMS imagery,alongwith theotherremotelysensedimages,wascollectedto
providespatiallyextensiveinformationovertheprimarystudyareas.This informationincludesdetailedlandcover,biophysicalparametermapssuchasfractionof PhotosyntheticallyActiveRadiation(fPAR),LeafAreaIndex(LAI), andsurfacethermalproperties.
1.4 Summary of Parameters
The level- lb TIMS images contain JPL supplied header information and at sensor radiance values
in units of milliwatts/(m2 sr pro) for bands 1 to 6 in a band sequential (BSQ) format.
1.5 Discussion
The Jet Propulsion Laboratory (JPL) personnel obtained the original data from NASA AmesResearch Center (ARC) and processed them to the at-sensor radiance product described here. The dataare not corrected for look angle or atmospheric effects.
1.6 Related Data Sets
BOREAS Level-0 TIMS Imagery: Digital Counts in BIL FormatBOREAS Level-2 NS001 TMS Images: Reflectance and Temperatures in BSQ FormatBOREAS Level-lb ASAS Imagery: At-sensor Radiance in BSQ Format
2. Investigator(s)
2.1 Investigator(s) Name and TitleBOREAS Staff" Science
2.2 Title of InvestigationBOREAS Staff Science Aircraft Data Acquisition Program
2.3 Contact Information
Contact 1:Sonia ChernobieffNASA JPL4800 Oak Grove Dr.MS 183-501
Building: 183, Room: 519Pasadena, CA 91101(818) [email protected]
Contact 2:
Jeffrey A. NewcomerRaytheon ITSSNASA GSFCCode 923
Greenbelt, MD 20771(301) 286-7858(301) 286-0239 (fax)Jeffrey.Newcomer@ gsfc.nasa.gov
Page 2
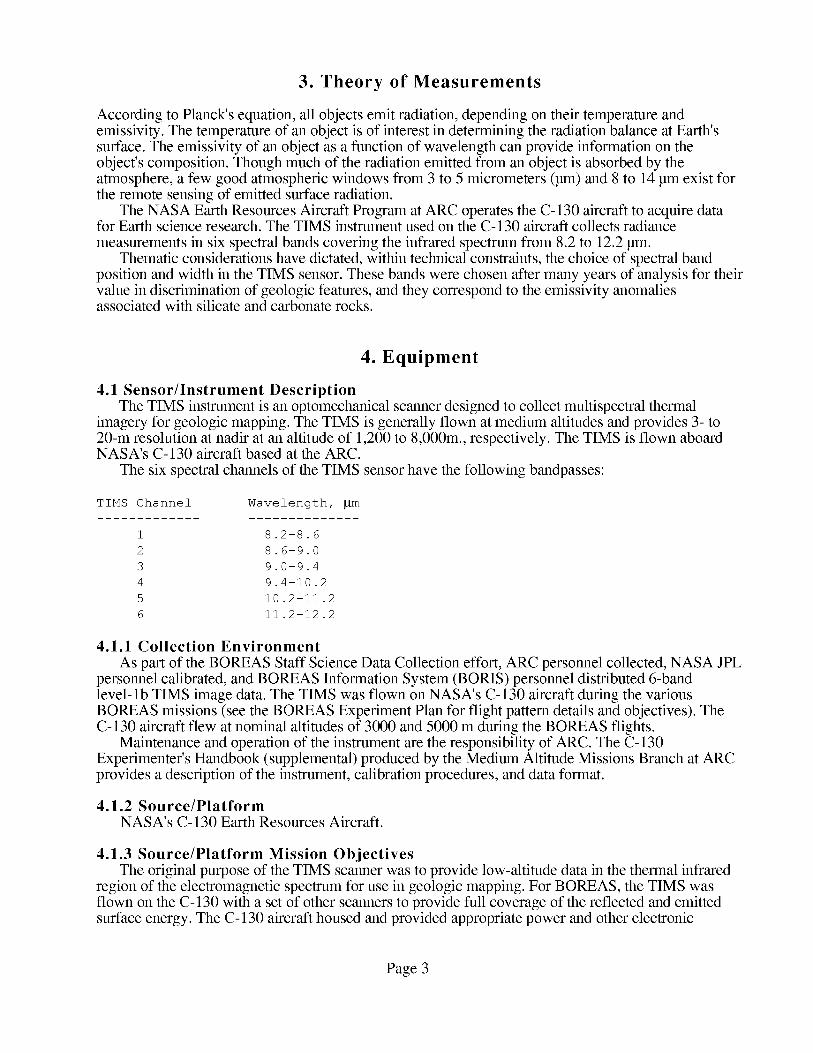
3. Theory of Measurements
According to Planck's equation, all objects emit radiation, depending on their temperature andemissivity. The temperature of an object is of interest in determining the radiation balance at Earth'ssurface. The emissivity of an object as a function of wavelength can provide information on theobject's composition. Though much of the radiation emitted from an object is absorbed by theatmosphere, a few good atmospheric windows from 3 to 5 micrometers 0am) and 8 to 14 _am exist forthe remote sensing of emitted surface radiation.
The NASA Earth Resources Aircraft Program at ARC operates the C-130 aircraft to acquire datafor Earth science research. The TIMS instrument used on the C-130 aircraft collects radiance
measurements in six spectral bands covering the infrared spectrum from 8.2 to 12.2 _am.Thematic considerations have dictated, within technical constraints, the choice of spectral band
position and width in the TIMS sensor. These bands were chosen after many years of analysis for theirvalue in discrimination of geologic features, and they correspond to the emissivity anomaliesassociated with silicate and carbonate rocks.
4. Equipment
4.1 Sensor/Instrument Description
The TIMS instrument is an optomechanical scanner designed to collect multispectral thermalimagery for geologic mapping. The TIMS is generally flown at medium altitudes and provides 3- to20-m resolution at nadir at an altitude of 1,200 to 8,000m., respectively. The TIMS is flown aboardNASA's C-130 aircraft based at the ARC.
The six spectral channels of the TIMS sensor have the following bandpasses:
TIMS Channel Wavelength, _m
i 8.2-8.6
2 8.6-9.0
3 9.0-9.4
4 9.4-10 .2
5 i0 .2-11 .2
6 ii .2-12 .2
4.1.1 Collection Environment
As part of the BOREAS Staff Science Data Collection effort, ARC personnel collected, NASA JPLpersonnel calibrated, and BOREAS Information System (BORIS) personnel distributed 6-bandlevel-lb TIMS image data. The TIMS was flown on NASA's C-130 aircraft during the variousBOREAS missions (see the BOREAS Experiment Plan for flight pattern details and objectives). TheC-130 aircraft flew at nominal altitudes of 3000 and 5000 m during the BOREAS flights.
Maintenance and operation of the instrument are the responsibility of ARC. The C-130Experimenter's Handbook (supplemental) produced by the Medium Altitude Missions Branch at ARCprovides a description of the instrument, calibration procedures, and data format.
4.1.2 Source/PlatformNASA's C-130 Earth Resources Aircraft.
4.1.3 Source/Platform Mission Objectives
The original purpose of the TIMS scanner was to provide low-altitude data in the thermal infraredregion of the electromagnetic spectrum for use in geologic mapping. For BOREAS, the TIMS wasflown on the C-130 with a set of other scalmers to provide full coverage of the reflected and emittedsurface energy. The C-130 aircraft housed and provided appropriate power and other electronic
Page 3

connectionsfor operationof theTIMS instrument.
4.1.4 Key VariablesEmitted and reflected radiation.
4.1.5 Principles of Operation
Design parameters of the TIMS are based on the specifications of Dr. Anne B. Kahle of the NASAJPL. A rotating scan mirror scans the instrument's Instantaneous Field of View (IFOV) across track asthe motion of the aircraft moves the sensor along the data collection path.
4.1.6 Sensor/Instrument Measurement GeometryIFOV 2.5 mrad
Total Scan Angle 76.56 °
Pixels/Scan Line 638
Sensor footprint is l0 x l0 m at nadir at 4,000-m altitude.
4.1.7 Manufacturer of Sensor/Instrument
The TIMS instrument was built by Daedalus Enterprises, of Ann Arbor, MI. It was furthermodified by the NASA Stennis Space Flight Center.
4.2 Calibration
As with the First International Satellite Land Surface Climatology Project (ISLSCP) FieldExperiment (FIFE), BOREAS staff attempted to further relate remotely sensed radiances to landsurface radiometers. The TIMS instrument carries two onboard blackbody sources, which fill the fullaperture of the system with energy of a preset, known temperature. The two blackbody sources areviewed by the TIMS once every scan line.
The spectral bandpass of each channel was determined by the calibration laboratory at Stennis onan annual basis.
TIMS data may be intentionally overscanned, e.g., operated at some integral multiple of the desiredscan rate and then subsampled in preprocessing. The subsampling factor is reported as a"demagnification factor."
4.2.1 Specifications
The wavelength ranges (in micrometers) of the bands for the TIMS are:
Noise Equivalent Change
Band Detector Wavelength in Temperature (NEdT)
1 HgCdTe 8
2 " 8
3 " 9
4 " 9
5 " i0
6 " ii
2 - 8.6
6 - 9.0
0 - 9.4
4 - 10.2
2 - 11.2
2 - 12.2
0 2°C
0 2°C
0 2°C
0 2°C
0 2°C
0 2°C
DESIGN DATA:
IFOV
Across-track Field-Of-View
Nominal aperture diameter
Effective aperture area
f/number
Primary focal length
2.5 mrads
76.56 °
7.5 inches
59.8 cm 2
Not available
Not available
Page 4

Inflight calibration
V/H range
Scan rate
Scan speed ability
Data quantization
Number of video samples/scan
Roll compensation
Scan mirror
NEdt
line
Two controllable blackbodies
Variable, 0.025 to 0.25
Variable, 7.3 to 25 scans/sec.
One-third of the IFOV, scan
line to scan line
8 bits (256 discrete levels)
638
+/-15 °
45 ° rotating mirror
0.25 K
4.2.1.1 Tolerance
The TIMS channels were designed for noise-equivalent temperature differences for the channels,represented by the radiometric sensitivity (NEdT) of 0.25 K.
4.2.2 Frequency of Calibration
The TIMS was spectrally calibrated prior to each flight season at Stennis to determine the spectralresponse function of each channel.
4.2.3 Other Calibration Information
The TIMS instrument periodically viewed an extended-area precision blackbody source at ARC toverify linearity of response over the range of 0-50 °C.
5. Data Acquisition Methods
As part of the BOREAS Staff Science data collection effort, BORIS distributed 6-band level-lb TIMSimage data. The TIMS was flown on NASA's C-130 aircraft during the BOREAS mission (see theBOREAS Experiment Plan for flight pattern details and objectives).
Personnel at NASA ARC processed the raw data to level-0 products, which were supplied toBORIS and JPL personnel. JPL personnel in turn processed selected level-0 images to the level-lbBat-sensor radiance products described here.
6. Observations
6.1 Data Notes
The data obtained from NASA ARC processed easily into the level-lb products.
6.2 Field Notes
Flight summary reports and verbal records on videotapes are available for the BOREAS TIMSdata.
7. Data Description
7.1 Spatial CharacteristicsThe BOREAS Level-lb TIMS images primarily cover the Southern Study Area (SSA) and the
Northern Study Area (NSA). A few images were acquired for the transect area between the SSA andthe NSA. The SSA and the NSA are located in the southwest and northeast portions of the overallregion.
Page 5

7.1.1 Spatial CoverageThe North American Datum of 1983 (NAD83) corner coordinates of the SSA are:
Latitude Longitude
Northwest 54.321 N 106.228 W
Northeast 54.225 N 104.237 W
Southwest 53.515 N 106.321 W
Southeast 53.420 N 104.368 W
The NAD83 corner coordinates of the NSA are:
Latitude Longitude
Northwest 56.249 N 98.825 W
Northeast 56.083 N 97.234 W
Southwest 55.542 N 99.045 W
Southeast 55.379 N 97.489 W
7.1.2 Spatial Coverage MapNot available.
7.1.3 Spatial Resolution
Typical altitudes for BOREAS flights were 5,000 and 3,000 m above ground level (surfaceelevation of 400 m), which normally required 25 scan lines per second. These altitudes produced 12.5m and 7.5 m pixels at nadir given the TIMS's 2.5 mrad IFOV.
7.1.4 Projection
Not applicable.
7.1.5 Grid Description
The BOREAS level-lb TIMS images are stored in their original data collection frame withincreasing pixel sizes from nadir to the scanning extremes based on the scan angle.
7.2 Temporal Characteristics
7.2.1 Temporal Coverage
The data were collected during the BOREAS Focused Field Campaign-Thaw (FFC-T) andIntensive Field Campaign (IFC)-3, covering the periods of 16- to 20-Apr-1994 and 06- to16-Sep- 1994.
7.2.2 Temporal Coverage Map
IFC# Dates
FFC-T 16-Apr-1994 -- 20-Apr-1994
IFC-3 06-Sep-1994 -- 17-Sep-1994
7.2.3 Temporal Resolution
Images were acquired on at least one day during the field campaigns.
Page 6

7.3 Data Characteristics
7.3.1 Parameter/Variable
The main parameter contained in the image data files is:At Sensor Radiance in milliwatts/ (m 2 sr _m) .
The descriptions of the parameters contained in the inventory listing file on the CD-ROM are:
Column Name
SPATIAL COVERAGE
DATE OBS
START TIME
END TIME
PLATFORM
INSTRUMENT
NUM BANDS
PLATFORM ALTITUDE
MIN SOLAR ZEN ANG
MAX SOLAR ZEN ANG
MIN SOLAR AZ ANG
MAX SOLAR AZ ANG
C130 MISSION ID
C130 LINE NUM
C130 RUN NUM
C130 SITE
BAND QUALITY
CLOUD COVER
TIMS MEAN FRAME STATUS
NW LATITUDE
NW LONGITUDE
NE LATITUDE
NE LONGITUDE
SW LATITUDE
SW LONGITUDE
SE LATITUDE
SE LONGITUDE
CRTFCN CODE
7.3.2 Variable Description/Definition
For the image data files:At-sensor radiance - The value representing the quantized DN derived by
the TM scanning system radiant energy incident on the
sensor aperture at the time of data collection in the
specific TIMS wavelength regions.
The descriptions of the parameters contained in the inventory listing file on the CD-ROM are:
Column Name Description
SPATIAL COVERAGE
DATE OBS
START TIME
The general term used to denote the spatial area
over which the data were collected.
The date on which the data were collected.
The starting Greenwich Mean Time (GMT) for the
Page 7

END TIME
PLATFORM
INSTRUMENT
NUM BANDS
PLATFORM ALTITUDE
MIN SOLAR ZEN ANG
MAX SOLAR ZEN ANG
MIN SOLAR AZ ANG
MAX SOLAR AZ ANG
C130 MISSION ID
C130 LINE NUM
C130 RUN NUM
C130 SITE
BAND QUALITY
CLOUD COVER
TIMS MEAN FRAME STATUS
data collected.
The ending Greenwich Mean Time (GMT) for the
data collected.
The object (e.g., satellite, aircraft, tower,
person) that supported the instrument.
The name of the device used to make the
measurements.
The number of spectral bands in the data.
The nominal altitude of the data collection
platform above the target.
The minimum angle from the surface normal
(straight up) to the sun during the data
collection.
The maximum angle from the surface normal
(straight up) to the sun during the data
collection.
The minimum azimuthal direction of the sun
during data collection expressed in clockwise
increments from North.
The maximum azimuthal direction of the sun
during data collection expressed in clockwise
increments from North.
The mission identifier assigned to the C130
mission in the form of YY-DDD-FF where YY is the
last two digits of the fiscal year, DDD is the
deployment number for "official" C130 missions and
is day of year for non-"official" C130 missions
(i.e., no site coverage), and FF is the flight
number within the given deployment (00 is given
for non-"official" C130 missions) . An example
would be 94-006-04.
The number of the C130 line in its flights over
the BOREAS area as given in the flight logs.
Zero values are given for non-"official" C130
missions and for data between C130 sites or lines.
The number of the C130 run in its flights over
the BOREAS area as given in the flight logs.
Zero value is given for non-"official" C130
missions and data between C130 sites, lines or
runs.
The C130 site designator as given in the flight
logs. PRE is used for data taken from the
airport to the first "official" C130 site, BTW is
used for data taken between two "official" C130
sites, DSC is used for data taken after the last
"official" C130 site, TRN is used for transect
data, and YTH and YPA are used for data taken at
the YTH and YPA airports (aircraft never
left the ground).
The data analyst's assessment of the quality of
the spectral bands in the data.
The data analyst's assessment of the cloud cover
that exists in the data.
The mean frame status calculated from the values
Page 8

NW LATITUDE
NW LONGITUDE
NE LATITUDE
NE LONGITUDE
SW LATITUDE
SW LONGITUDE
SE LATITUDE
SE LONGITUDE
CRTFCN CODE
on the digital tape of TIMS data collected during
the flight.
The NAD83 based latitude coordinate of the north-
west corner of the minimum bounding rectangle
for the data.
The NAD83 based longitude coordinate of the
northwest corner of the minimum bounding
rectangle for the data.
The NAD83 based latitude coordinate of the north
east corner of the minimum bounding rectangle for
the data.
The NAD83 based longitude coordinate of the
north east corner of the minimum bounding
rectangle for the data.
The NAD83 based latitude coordinate of the south
west corner of the minimum bounding rectangle for
the data.
The NAD83 based longitude coordinate of the
southwest corner of the minimum bounding
rectangle for the data.
The NAD83 based latitude coordinate of the south
east corner of the minimum bounding rectangle for
the data.
The NAD83 based longitude coordinate of the
southeast corner of the minimum bounding
rectangle for the data.
The BOREAS certification level of the data.
Examples are CPI (Checked by PI), CGR (Certified
by Group), PRE (Preliminary), and CPI-??? (CPI
but questionable).
7.3.3 Unit of Measurement
For theimage datafiles:At-sensor radiance - milliwatts/ (m 2 sr _m)
The measurement units for the parameters contained in the inventory listing file on the CD-ROM are:
Column Name Units
SPATIAL COVERAGE [none]
DATE OBS [DD-MON-YY]
START TIME [HHMM GMT]
END TIME [HHMM GMT]
PLATFORM [none]
INSTRUMENT [none]
NUM BANDS [counts]
PLATFORM ALTITUDE [meters]
MIN SOLAR ZEN ANG [degrees]
MAX SOLAR ZEN ANG [degrees]
MIN SOLAR AZ ANG [degrees]
MAX SOLAR AZ ANG [degrees]
C130 MISSION ID [none]
C130 LINE NUM [none]
C130 RUN NUM [none]
C130 SITE [none]
Page 9

BAND QUALITY [none]
CLOUD COVER [none]
TIMS MEAN FRAME STATUS [none]
NW LATITUDE [degrees]
NW LONGITUDE [degrees]
NE LATITUDE [degrees]
NE LONGITUDE [degrees]
SW LATITUDE [degrees]
SW LONGITUDE [degrees]
SE LATITUDE [degrees]
SE LONGITUDE [degrees]
CRTFCN CODE [none]
7.3.4 Data Source
The level-lb TIMS data were derived by JPL personnel from the original level-0 data. The sourcesof the parameter values contained in the inventory listing file on the CD-ROM are:
Column Name Data Source
SPATIAL COVERAGE
DATE OBS
START TIME
END TIME
PLATFORM
INSTRUMENT
NUM BANDS
PLATFORM ALTITUDE
MIN SOLAR ZEN ANG
MAX SOLAR ZEN ANG
MIN SOLAR AZ ANG
MAX SOLAR AZ ANG
C130 MISSION ID
C130 LINE NUM
C130 RUN NUM
C130 SITE
BAND QUALITY
CLOUD COVER
NS001 MEAN FRAME STATUS
NW LATITUDE
[Determined from latitude and longitude
information provided in the NASA ARC flight
summary reports]
[Software derived from TIMS housekeeping data]
[Software derived from TIMS housekeeping data]
[Software derived from TIMS housekeeping data]
[Data base constant]
[Data base constant]
[Data base constant]
[Determined from latitude and longitude
information provided in the NASA ARC flight
summary reports]
[Calculated with software from latitude and
longitude and time information]
[Calculated with software from latitude and
longitude and time information]
[Calculated with software from latitude and
longitude and time information]
[Calculated with software from latitude and
longitude and time information]
[Taken from the delivered tape label and the NASA
ARC Flight Summary Reports]
[Taken from the delivered tape label and the NASA
ARC Flight Summary Reports]
[Taken from the delivered tape label and the NASA
ARC Flight Summary Reports]
[Taken from the delivered tape label and the NASA
ARC Flight Summary Reports]
[Constant software parameter value]
[Constant software parameter value]
[Software derived from TIMS housekeeping data]
[Calculated with software from the C130 altitude
and heading, starting and ending flight line
latitude and longitude, and the static NS001 scan
Page 10

NW LONGITUDE
NE LATITUDE
NE LONGITUDE
SW LATITUDE
SW LONGITUDE
SE LATITUDE
SE LONGITUDE
CRTFCN CODE
angle information]
[Calculated with software from the C130 altitude
and heading, starting and ending flight line
latitude and longitude and the static TIMS scan
angle information]
[Calculated with software from the C130 altitude
and heading, starting and ending flight line
latitude and longitude and the static TIMS scan
angle information]
[Calculated with software from the C130 altitude
and heading, starting and ending flight line
latitude and longitude and the static TIMS scan
angle information]
[Calculated with software from the C130 altitude
and heading, starting and ending flight line
latitude and longitude and the static TIMS scan
angle information]
[Calculated with software from the C130 altitude
and heading, starting and ending flight line
latitude and longitude and the static TIMS scan
angle information]
[Calculated with software from the C130 altitude
and heading, starting and ending flight line
latitude and longitude and the static TIMS scan
angle information]
[Calculated with software from the C130 altitude
and heading, starting and ending flight line
latitude and longitude and the static TIMS scan
angle information]
[Constant data base value]
7.3.5 Data Range
The maximum range of DNs in each level-lb TIMS image band is limited from -16,384 to 16,383so that the values can be stored in a two-byte field. The following table gives information about theparameter values found in the inventory table on the CD-ROM.
Column Name
Minimum Maximum Missng Unrel Below Data
Data Data Data Data Detect Not
Value Value Value Value Limit Cllctd
SPATIAL COVERAGE N/A N/A None None None None
DATE OBS 16-APR-94 17-SEP-94 None None None None
START TIME 2 959 None None None None
END TIME 5 959 None None None None
PLATFORM C130 C130 None None None None
INSTRUMENT N/A N/A None None None None
NUM BANDS 6 6 None None None None
PLATFORM ALTITUDE 4640 7265.5 None None None None
MIN SOLAR ZEN ANG 73.8 121.4 None None None None
MAX SOLAR ZEN ANG 74 121.7 None None None None
MIN SOLAR AZ ANG .3 358.3 None None None None
MAX SOLAR AZ ANG .7 358.8 None None None None
C130 MISSION ID 94-004-09 94-009-09 None None None None
C130 LINE NUM 1 703 None None None None
Page 11

C130 RUN NUM i 2 None None None None
C130 SITE 429 433 None None None None
BAND QUALITY N/A N/A None None None None
CLOUD COVER N/A N/A None None None None
TIMS MEAN FRAME None None None Blank
STATUS
NW LATITUDE 53.65307 56.17763 None None None None
NW LONGITUDE -106.54837 -97.96291 None None None None
NE LATITUDE 53.6305 56.12803 None None None None
NE LONGITUDE -106.09913 -97.77578 None None None None
SW LATITUDE 53.45336 55.89295 None None None None
SW LONGITUDE -106.63445 -98.02344 None None None None
SE LATITUDE 53.37184 55.84932 None None None None
SE LONGITUDE -106.13012 -97.83714 None None None None
CRTFCN CODE PRE PRE None None None None
Minimum Data Value -- The minimum value found in the column.
Maximum Data Value -- The maximum value found in the column.
Missng Data Value -- The value that indicates missing data. This is used to
indicate that an attempt was made to determine the
parameter value, but the attempt was unsuccessful.
Unrel Data Value -- The value that indicates unreliable data. This is used
to indicate an attempt was made to determine the
parameter value, but the value was deemed to be
unreliable by the analysis personnel.
Below Detect Limit -- The value that indicates parameter values below the
instruments detection limits. This is used to
indicate that an attempt was made to determine the
parameter value, but the analysis personnel determined
that the parameter value was below the detection
limit of the instrumentation.
Data Not Cllctd -- This value indicates that no attempt was made to
determine the parameter value. This usually
indicates that BORIS combined several similar but
not identical data sets into the same data base table
but this particular science team did not
measure that parameter.
Blank -- Indicates that blank spaces are used to denote that type of value.
N/A -- Indicates that the value is not applicable to the respective column.
None -- Indicates that no values of that sort were found in the column.
7.4 Sample Data Record
A sample data record for the level-lb TIMS images is not available here. The following are wrappedversions of the first few records from the level- lb TIMS inventory table on the CD-ROM.
SPATIAL COVERAGE,DATE OBS,START TIME,END TIME,PLATFORM, INSTRUMENT,NUM BANDS,
PLATFORM ALTITUDE,MIN SOLAR ZEN ANG,MAX SOLAR ZEN ANG,MIN SOLAR AZ ANG,
MAX SOLAR AZ ANG,CI30 MISSION ID,CI30 LINE NUM, CI30 RUN NUM, CI30 SITE,
BAND QUALITY,CLOUD COVER, TIMS MEAN FRAME STATUS,NW LATITUDE,NW LONGITUDE,
NE LATITUDE,NE LONGITUDE,SW LATITUDE,SW LONGITUDE,SE LATITUDE,SE LONGITUDE,
CRTFCN CODE
Page 12

'SSA',I6-APR-94,606,610, 'C130', 'TIMS',6,4753.1,115.2,115.4,343.9,344.4,
'94-004-09',301,i, '429', 'NOT ASSESSED', 'NOT ASSESSED',,53.71754,-106.37024,
53.6996,-i05.93603,53.52663,-i06.39161,53.50878,-i05.95939, 'PRE'
'SSA',I6-APR-94,615,618, 'C130', 'TIMS',6,4771.0,115.5,115.7,346.2,346.8,
'94-004-09',303,1, '429', 'NOT ASSESSED', 'NOT ASSESSED',,53.65307,-106.48068,
53.6305,-i05.92932,53.62535,-i06.48372,53.60279,-i05.93272, 'PRE'
8. Data Organization
8.1 Data GranularityThe smallest unit of data for level-lb TIMS images is a single image.
8.2 Data Format(s)The CD-ROM inventory listing file consists of numerical and character fields of varying length
separated by commas. The character fields are enclosed with single apostrophe marks. There are nospaces between the fields.
Each level- lb TIMS scene is stored in 6 files, one per spectral band. Each band in a scene iscontained in a file of 1276 byte records, the first two of which are ASCII header information. Thefollowing records each contain one image line of 698 2-byte pixels. These 16-bit data are high-orderbyte first. For computer systems using low-order byte first ordering, the bytes in these fields need tobe swapped before they can be interpreted properly.
9. Data Manipulations
9.1 Formulae
9.1.1 Derivation Techniques and AlgorithmsFirst, a header label is created for the file that includes the number of scan lines, number of
samples, number of bands (default: six), and file organization (default: BSQ). The TIMSCAL programis used next to convert the raw data to instrument perceived radiance data. This file is then separatedinto six files constituting the six TIMS bands for further manipulation.
Additional calibration programs used by the JPL science team are FIT, XFORM, and C130RECT(see Section 9.2.1 for detailed description of these programs).
9.2 Data Processing Sequence
9.2.1 Processing Steps
TIMSCAL produces an output of instrument perceived radiance data. The output is a data set of all
six bands stored in 2-byte integers. The units output for radiance images are: milliwatts/(m2 sr pro).The units output for temperature images are in hundredths of degrees Centigrade. Output is in 2-bytesigned integer format. Next, the data are separated into the six TIMS bands for processing by theinvestigator, or further processing of the data to output a hardcopy quality image.
FIT is a VICAR applications program that performs automatic linear stretches on 2-byte imagesanywhere in the 2-byte range (-32768 to +32767). FIT computes a grey-level frequency table(histogram) of the input image. The histogram has 65536 bins, hence spans the entire halfword rangefrom -32768 to +32767. The program determines linear stretch constants IMIN and IMAX such that:
• IMIN is the largest I that satisfies the equation: A(-32768,I) <= PL * A(-32768,32767)
• IMAX is the smallest I that satisfies the equation: A(I,32767) <= PH * A(-32768,32767)
Page 13

Thelinearstretchthatis appliedtotheimageisdefinedas:
HV- LV
Y = (X - IMIN) + LV
IHAX - IHIN
where X and Y are the input and output DN values respectively for each pixel.XFORM will perform a linear transformation on the input data. The transformation is specified by
a matrix input as a parameter.Each corresponding pixel from the input data sets is represented by a vector x[T] =
(xl,x2 .... xm)[T], where [T] denotes Transpose.A gain and offset are then applied to each component before it is written to the output data set.Auto-scale mode is the default condition and was used in the processing of this data. In auto-scale
mode, the gains and offsets for each band are calculated by fitting the output histogram touser-specified parameters.
C130RECT removes scan-angle distortion in images acquired by scanners that sample at equalangular increments. Tilt can be corrected and the aspect ratio of the image can be adjusted. C130RECTis essentially divided into three parts. The first of these handles simple initialization and computes(using basic trigonometry) values for the variables which are dependent on the image tilt and scanwidth. The second part of the program fills a resampling address array which, for each input pixelposition, gives a real-valued index into the input buffer from which values may be interpolated; thisarray mapping may be dumped to the screen by specifying the DEBUG option. The third part of theprogram reads in each line of the image, and using the resampling address array and C routine resamp,corrects each line for distortion according to the tilt and scan width specified, finally outputting eachline to the output image.
BORIS staff processed the level- lb TIMS images by:• Extracting the American Standard Code for Information Interchange (ASCII) header record
from the level- lb image product and placing it on disk.• Reading the information in the disk file and loading the online data base with needed
information.
9.2.2 Processing ChangesNone.
9.3 Calculations
9.3.1 Special Corrections/Adjustments
The TIMS data are not geometrically corrected. The data contain both panoramic distortion, as afunction of the 76.56-degree total FOV, and other spatial perturbations induced by a moving aircraft.
9.3.2 Calculated Variables
None given.
9.4 Graphs and Plots
None given.
10. Errors
10.1 Sources of Error
See Section 9.3.1. Other sources of error include possible nonunity emissivity of the onboardblackbodies and inexact knowledge of the exact blackbody temperatures in flight conditions. In 1989,a honeycomb scheme container was used for the blackbodies, which made the above errors muchsmaller.
Page 14

10.2 Quality Assessment
10.2.1 Data Validation by Source
Spectral errors could arise because of image-wide signal-to-noise ratio, saturation, cross-talk,spikes, response normalization caused by a change in gain. JPL personnel did not perform any errorvalidation.
10.2.2 Confidence Level/Accuracy Judgment
The system's optical focus is continually monitored by close observation of the apparent sharpnessand resolution of objects appearing in scenes after data processing. Although this approach issomewhat subjective, it has proven to be a viable alternative compared to the classical resolutionmeasurement method, which requires removing the scanner system from the C-130 airplane withsubsequent setup. This is not a practical option during the flying/deployment portion of the year.However, any observed focus degradation would be corrected by focus adjustment.
There was no reason to believe that the data were faulty; therefore, the confidence level was highfor these data.
10.2.3 Measurement Error for Parameters
The NEdT for the channels is typically 0.2 °C or less, depending on aircraft flight regime, withvariations caused by vibration.
10.2.4 Additional Quality Assessments
The TIMS has periodically viewed a precision extended-area blackbody calibration source to verifylinearity over the 0-50 °C range.
The hardcopy images are visually reviewed for any obvious distortions that may be eliminated bythe JPL programs. None were noticed and the data were not manipulated further.
10.2.5 Data Verification by Data Center
BORIS personnel reviewed the values extracted from the tape files and loaded into the data baseand visually reviewed a random set of the images on a display screen. No anomalous items werediscovered in the review.
11. Notes
11.1 Limitations of the Data
None given.
11.2 Known Problems with the Data
None given.
11.3 Usage GuidanceBecause of variable conditions found in different flight regimes on the C-130 aircraft, the onboard
blackbody temperatures reported in the housekeeping data may be artificially high, which will result inapparently elevated ground temperatures. This is caused by cold air blasting on the front surface ofthese reference sources. An airdam (air fence) was installed to shelter the sensor from the wind,thereby minimize the effects of the wind blast.
The TIMS data are not geometrically corrected. The data contain both panoramic distortions, as afunction of the 76-degree total FOV, as well as other spatial perturbations induced by a movingaircraft.
11.4 Other Relevant Information
None given.
Page 15

12. Application of the Data Set
The TIMS data can be used to analyze the thermal properties of various surface targets. The dataprovide a six-channel spectral emissivity curve, which is used as a diagnostic tool to identify variousminerals and man-made surfaces.
None.
13. Future Modifications and Plans
14. Software
14.1 Software DescriptionBORIS staff developed software and command procedures for:• Extracting header and calibration information from level-lb TIMS images on tape and writing
it to ASCII files on disk.
• Reading the ASCII disk file and logging the level-lb TIMS image products into the Oracledata base tables.
14.2 Software Access
The software is written in C and is operational on VAX 6410 and MicroVAX 3100 systems atGoddard Space Flight Center (GSFC). The primary dependencies in the software are the Oracle database utility routines.
15. Data Access
The TIMS images are available from the Earth Observing System Data and Information System(EOSDIS) Oak Ridge National Laboratory (ORNL) Distributed Active Archive Center (DAAC).
15.1 Contact Information
For BOREAS data and documentation please contact:
ORNL DAAC User Services
Oak Ridge National LaboratoryP.O. Box 2008 MS-6407
Oak Ridge, TN 37831-6407Phone: (423) 241-3952Fax: (423) 574-4665
E-mail: [email protected] or [email protected]
15.2 Data Center Identification
Earth Observing System Data and Information System (EOSDIS) Oak Ridge National Laboratory(ORNL) Distributed Active Archive Center (DAAC) for Biogeochemical Dynamicshttp://www-eosdis.ornl.gov/.
15.3 Procedures for Obtaining Data
Users may obtain data directly through the ORNL DAAC online search and order system[http://www-eosdis.ornl.gov/] and the anonymous FTP site [ftp://www-eosdis.ornl.gov/data/] or bycontacting User Services by electronic mail, telephone, fax, letter, or personal visit using the contactinformation in Section 15.1.
Page 16

15.4 Data Center Status/Plans
The ORNL DAAC is the primary source for BOREAS field measurement, image, GIS, andhardcopy data products. The BOREAS CD-ROM and data referenced or listed in inventories on theCD-ROM are available from the ORNL DAAC.
16. Output Products and Availability
16.1 Tape ProductsThe BOREAS level-lb TIMS data can be made available on 1600- or 6250-Bytes Per Inch (BPI)
9-track, 8-ram, or Digital Archive Tape (DAT) media.
16.2 Film Products
Color aerial photographs and video records were made during data collection. The video recordincludes aircraft crew cabin intercom conversations and an audible tone that was initiated each time the
sensor was triggered. The BOREAS data base contains an inventory of available BOREAS aircraftflight documentation, such as flight logs, videotapes, and photographs.
16.3 Other Products
Although the image inventory is contained on the BOREAS CD-ROM set, the actual level-lb TIMSimages are not. See Section 15 for information about how to obtain the data.
17. References
17.1 Platform/Sensor/Instrument/Data Processing Documentation
There is a Daedalus Operator's Manual for TIMS, but it is proprietary and may not be reproducedwithout their permission. Contact Daedalus Enterprises, Ann Arbor, MI, for details.
NASA. 1990. C-130 Earth Resources Aircraft Experimenter's Handbook. National Aeronautics andSpace Administration, Ames Research Center. Moffett Field, CA.
Airborne Instrumentation Research Project. 1994. Flight Summary Reports for Flight No. 94-004-09to 94-009-09 or April 16, 1994 to September 19, 1994. NASA Ames Research Center, AirborneMissions and Applications Division, Moffett Field, CA 94035.
17.2 Journal Articles and Study Reports
Newcomer, J., D. Landis, S. Conrad, S. Curd, K. Huemmrich, D. Knapp, A. Morrell, J. Nickeson,A. Papagno, D. Rinker, R. Strub, T. Twine, F. Hall, and P. Sellers, eds. 2000. Collected Data of TheBoreal Ecosystem-Atmosphere Study. NASA. CD-ROM.
Sellers, P. and F. Hall. 1994. Boreal Ecosystem-Atmosphere Study: Experiment Plan. Version1994-3.0, NASA BOREAS Report (EXPLAN 94).
Sellers, P. and F. Hall. 1996. Boreal Ecosystem-Atmosphere Study: Experiment Plan. Version1996-2.0, NASA BOREAS Report (EXPLAN 96).
Sellers, P., F. Hall, and K.F. Huemmrich. 1996. Boreal Ecosystem-Atmosphere Study: 1994Operations. NASA BOREAS Report (OPS DOC 94).
Sellers, P., F. Hall, and K.F. Huemmrich. 1997. Boreal Ecosystem-Atmosphere Study: 1996Operations. NASA BOREAS Report (OPS DOC 96).
Page 17

Sellers,P.,F. Hall, H. Margolis,B. Kelly, D. Baldocchi,G. denHartog,J.Cihlar, M.G. Ryan,B.Goodison,P.Crill, K.J.RansomD. Lettenmaier,andD.E. Wickland. 1995.Theborealecosystem-atmospherestudy(BOREAS):anoverviewandearlyresultsfrom the1994field year.Bulletinof theAmericanMeteorologicalSociety.76(9):1549-1577.
Sellers,P.J.,F.G.Hall, R.D. Kelly, A. Black, D. Baldocchi,J. Berry, M. Ryan,K.J. Ranson,P.M.Crill, D.P.Lettenmaier,H. Margolis,J.Cihlar, J.Newcomer,D. Fitzjarrald,P.G.Jarvis,S.T.Gower,D. Halliwell, D. Williams, B. Goodison,D.E.Wickland, andF.E.Guertin.1997.BOREASin 1997:ExperimentOverview,ScientificResultsandFutureDirections.Journalof GeophysicalResearch102(D24):28,731-28,770.
17.3 Archive/DBMS Usage DocumentationNone.
None.
18. Glossary of Terms
ARC
ASAS
ASCII
BIL
BOREAS
BORIS
BPI
BSQ
CCRS
CCT
CD-ROM
DAAC
DAT
DN
EOS
EOSDIS
FFC-T
FIFE
FOV
fPAR
GIS
GMT
GSFC
HgCdTe
HTML
I/O
IFC
IFOV
ISLSCP
JPL
LAI
NAD83
19. List of Acronyms
- Ames Research Center
- Advanced Solid-state Array Spectroradiometer
- American Standard Code for Information Interchange
- Band Interleaved by Line
- BOReal Ecosystem-Atmosphere Study
- BOREAS Information System
- Bytes Per Inch
- Band Sequential
- Canada for Remote Sensing
- Computer Compatible Tape
- Compact Disk-Read-Only Memory
- Distributed Active Archive Center
- Digital Archive Tape
- Digital Number
- Earth Observing System
- EOS Data and Information System
- Focused Field Campaign - Thaw
- First ISLSCP Field Experiment
- Field-Of-View
- fraction of Photosynthetically Active Radiation
- Geographic Information System
- Greenwich Mean Time
- Goddard Space Flight Center
- mercury-cadmium-tellurium
- HyperText Markup Language
- Input/Output
- Intensive Field Campaign
- Instantaneous Field-of-View
- International Satellite Land Surface Climatology Project
- Jet Propulsion Laboratory
- Leaf Area Index
- North American Datum 1983
Page 18

NASA
NEdt
NSA
ORNL
PANP
SSA
TIMS
TM
TMS
URL
- National Aeronautics and Space Administration
- Noise-Equivalent Change in Temperature
- Northern Study Area
- Oak Ridge National Laboratory
- Prince Albert National Park
- Southern Study Area
- Thermal Infrared Multispectral Scanner
- Thematic Mapper
- Thematic Mapper Simulator
- Uniform Resource Locator
20. Document Information
20.1 Document Revision Date(s)Written: 21-Mar- 1995
Last Updated: 13-Aug- 1999
20.2 Document Review Date(s)BORIS Review: 06-Jan- 1997Science Review:
20.3 Document ID
20.4 Citation
When using these data, please include the following acknowledgment as well as citations ofrelevant papers in Section 17.2:
The BOREAS level-lb TIMS data were collected and processed from the original aircraft tapes bypersonnel of the Medium Altitude Aircraft Branch at NASA ARC. Their contributions to providing thisdata set are greatly appreciated.
If using data from the BOREAS CD-ROM series, also reference the data as:BOREAS Staff Science, "BOREAS Staff Science Aircraft Data Acquisition Program." In Collected
Data of The Boreal Ecosystem-Atmosphere Study. Eds. J. Newcomer, D. Landis, S. Conrad, S.Curd, K. Huemmrich, D. Knapp, A. Morrell, J. Nickeson, A. Papagno, D. Rinker, R. Strub, T.Twine, F. Hall, and P. Sellers. CD-ROM. NASA, 2000.
Also, cite the BOREAS CD-ROM set as:Newcomer, J., D. Landis, S. Conrad, S. Curd, K. Huemmrich, D. Knapp, A. Morrell, J.
Nickeson, A. Papagno, D. Rinker, R. Strub, T. Twine, F. Hall, and P. Sellers, eds. Collected Data ofThe Boreal Ecosystem-Atmosphere Study. NASA. CD-ROM. NASA, 2000.
20.5 Document Curator
20.6 Document URL
Page 19

REPORT DOCUMENTATION PAGE FormApprovedOMB No. 0704-0188
Public reporting burden for this collection of informationis estimated to average 1 hour per response, including the time for reviewing instructions, searching existing data sources,gathering and maintaining the data needed, and completing and reviewing the collection of information. Send comments regarding this burden estimate or any other aspect of thiscollection of information, including suggestions for reducing this burden, to Washington Headquarters Services, Directorate for Information Operations and Reports, 1215 JeffersonDavis Highway, Suite 1204, Arlington, VA 22202-4302, and to the Office of Management and Budget, Paperwork Reduction Project (0704-0188), Washington, DC 20503.
1. AGENCY USE ONLY (Leave blank) 2. REPORT DATE 3. REPORT TYPE AND DATES COVERED
September 2000 Technical Memorandum4. TITLE AND SUBTITLE
Technical Report Series on the Boreal Ecosystem-Atmosphere Study (BOREAS)
BOREAS Level-1B TIMS Imagery: At-sensor Radiance in BSQ Format
6. AUTHOR(S)
Richard Strub, Jeffrey A. Newcomer, and Sonia Chernobieff
Forrest G. Hall and Jaime Nickeson, Editors
7. PERFORMING ORGANIZATION NAME(S) AND ADDRESS (ES)
Goddard Space Flight Center
Greenbelt, Maryland 20771
9. SPONSORING / MONITORING AGENCY NAME(S) AND ADDRESS (ES)
National Aeronautics and Space Administration
Washington, DC 20546-0001
5. FUNDING NUMBERS
923
RTOP: 923-462-33-01
8. PEFORMING ORGANIZATIONREPORT NUMBER
2000-03136-0
10. SPONSORING / MONITORING
AGENCY REPORT NUMBER
TM--2000-209891
Vol. 92
11. SUPPLEMENTARY NOTES
R. Strub, J.A. Newcomer, and J. Nickeson: Raytheon ITSS;
S. Chernobieff: User Tech. Associates, Inc.
12a. DISTRIBUTION / AVAILABILITY STATEMENT
Unclassifie_Unlimited
Subject Category: 43
Report available from the NASA Center for AeroSpace Information,
7121 Standard Drive, Hanover, MD 21076-1320. (301) 621-0390.
12b. DISTRIBUTION CODE
13. ABSTRACT (Maximum 200 words)
The BOREAS Staff Science Aircraft Data Acquisition Program focused on providing the research
teams with the remotely sensed satellite data products they needed to compare and spatially extend
point results. For BOREAS, the TIMS imagery, along with other aircraft images, was collected to
provide spatially extensive information over the primary study areas. The Level-lb TIMS images
cover the time periods of 16-Apr-1994 to 20-Apr-1994 and 06-Sep-1994 to 17-Sep-1994. The system
calibrated images are stored in binary image format files.
14. SUBJECT TERMS
BOREAS, remote sensing science, TIMS imagery.
17. SECURITY CLASSIFICATIONOF REPORT
Unclassified
NSN 7540-01-280-5500
18. SECURITY CLASSIFICATIONOF THIS PAGE
Unclassified
19. SECURITY CLASSIFICATIONOF ABSTRACT
Unclassified
15. NUMBER OF PAGES
1916. PRICE CODE
20. LIMITATION OF ABSTRACT
UL
Standard Form 298 (Rev. 2-89)Prescribed by ANSI Std. Z39.18298-102


![Boreas AHU [EN]](https://img.dokumen.tips/doc/110x75/58869e461a28ab0c1d8b561b/boreas-ahu-en.jpg)


![Boreas AHU [TR]](https://img.dokumen.tips/doc/110x75/589d79831a28ab69538b5849/boreas-ahu-tr.jpg)