Embed Size (px)
DESCRIPTION
Taxes, Teacher Wages & School District Resource Allocation in New Jersey. Bruce D. Baker. Recurring Media Claims. New Jersey is the most taxed state in the nation, Our taxes are driving our economy into the ground and we’re falling way behind all other states, - PowerPoint PPT Presentation
Citation preview
Bru
ce D
. Ba
ker, 2
01
0
Taxes, Teacher Wages & School District Resource Allocation in
New Jersey
Bruce D. Baker

Bru
ce D
. Ba
ker, 2
01
0
Recurring Media Claims
• New Jersey is the most taxed state in the nation, • Our taxes are driving our economy into the ground and
we’re falling way behind all other states, • Our teacher salaries which are completely out of
control are the reason why our taxes are out of control, • School districts don’t have to cut teachers to get their
budgets in line because school districts waste most of their money on administration anyway.
– Of course, these last two claims are entirely inconsistent, but often spouted by the same pundits (primarily talk radio). If escalating teacher salaries were the cause of escalating costs, then teacher salaries – or teachers themselves – would need to be cut.

Bru
ce D
. Ba
ker, 2
01
0
Part I
New Jersey’s Tax Burden

Bru
ce D
. Ba
ker, 2
01
0
Take Home Point
• New Jersey is not, in fact, the highest taxed state in the nation. – Our property taxes are high, but our income
and sales taxes are modest by comparison.– We’re also not number one in property taxes
when all states are considered and when property taxes are measured as a percent of income.

Bru
ce D
. Ba
ker, 2
01
0
Total Taxes as Share of Personal Income
New Jersey
New Jersey New JerseyNew Jersey
8%
9%
10%
11%
12%
13%
14%
15%
16%
17%
18%
2004 2005 2006 2007
Year
% o
f P
erso
nal
In
com
e, N
om
inal
State & Local Government Finance Data Query System. http://www.taxpolicycenter.org/slf-dqs/pages.cfm. The Urban Institute-Brookings Institution Tax Policy Center. Data from U.S. Census Bureau, Annual Survey of State and Local Government Finances, Government Finances, Volume 4, and Census of Governments (Years). Date of Access: (12-Feb-10 09:55 PM)

Bru
ce D
. Ba
ker, 2
01
0
Property Taxes as Share of Personal Income
2%
3%
3%
4%
4%
5%
5%
6%
6%
1980
1982
1984
1986
1988
1990
1992
1994
1996
1998
2000
2002
2004
2006
Year
% o
f P
erso
nal
In
com
e, N
om
inal
Connecticut
Massachusetts
New Jersey
New York
United States
State & Local Government Finance Data Query System. http://www.taxpolicycenter.org/slf-dqs/pages.cfm. The Urban Institute-Brookings Institution Tax Policy Center. Data from U.S. Census Bureau, Annual Survey of State and Local Government Finances, Government Finances, Volume 4, and Census of Governments (Years). Date of Access: (12-Feb-10 09:55 PM)

Bru
ce D
. Ba
ker, 2
01
0
Income Taxes as Share of Personal Income
0%
1%
2%
3%
4%
5%
6%
7%
8%
1980
1982
1984
1986
1988
1990
1992
1994
1996
1998
2000
2002
2004
2006
Year
% o
f P
erso
nal
In
com
e, N
om
inal
Connecticut
Massachusetts
New Jersey
New York
United States
State & Local Government Finance Data Query System. http://www.taxpolicycenter.org/slf-dqs/pages.cfm. The Urban Institute-Brookings Institution Tax Policy Center. Data from U.S. Census Bureau, Annual Survey of State and Local Government Finances, Government Finances, Volume 4, and Census of Governments (Years). Date of Access: (12-Feb-10 09:55 PM)

Bru
ce D
. Ba
ker, 2
01
0
Sales Taxes as Share of Personal Income
1.0%
1.5%
2.0%
2.5%
3.0%
3.5%
4.0%
4.5%
5.0%
1980
1982
1984
1986
1988
1990
1992
1994
1996
1998
2000
2002
2004
2006
Year
% o
f P
erso
nal
In
com
e, N
om
inal
Connecticut
Massachusetts
New Jersey
New York
United States
State & Local Government Finance Data Query System. http://www.taxpolicycenter.org/slf-dqs/pages.cfm. The Urban Institute-Brookings Institution Tax Policy Center. Data from U.S. Census Bureau, Annual Survey of State and Local Government Finances, Government Finances, Volume 4, and Census of Governments (Years). Date of Access: (12-Feb-10 09:55 PM)

Bru
ce D
. Ba
ker, 2
01
0
Part II
Economic Productivity in New Jersey over the Long Run

Bru
ce D
. Ba
ker, 2
01
0
Take Home Points
• New Jersey remains high in gross state product (gross domestic product – state) per capita. – Our growth has been only modest, but some of those
states in our region that have outpaced us in recent years are actually states with higher tax burdens (NY). This is obviously not causal – ONE WAY OR THE OTHER!
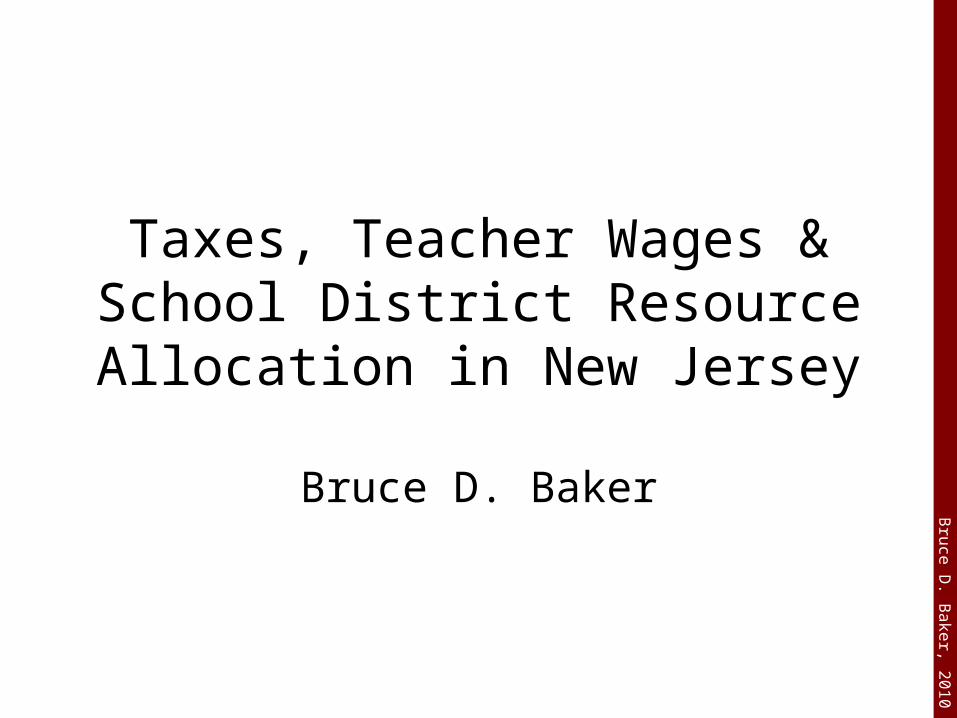
• New Jersey also remains high in per capita income and has held pace over time despite apocalyptic claims that all of the state’s high income residents are exiting the state in droves.

Bru
ce D
. Ba
ker, 2
01
0
Gross Domestic Product (state) per Capita
$20,000
$25,000
$30,000
$35,000
$40,000
$45,000
$50,000
$55,000
$60,000
1997
1998
1999
2000
2001
2002
2003
2004
2005
2006
2007
2008
Year
GD
P pe
r Cap
ita (S
tate
)
Data Source: Bureau of Economic Analysis, Regional Economic Accounts, http://www.bea.gov/regional/
New Jersey

Bru
ce D
. Ba
ker, 2
01
0
Gross Domestic Product (state) per Capita(Northeast)
$20,000
$25,000
$30,000
$35,000
$40,000
$45,000
$50,000
$55,000
$60,000
Year
GD
P pe
r Cap
ita (S
tate
)
United States
Connecticut
Delaware
Maryland
Massachusetts
New Jersey
New York
Pennsylvania
Rhode Island
Data Source: Bureau of Economic Analysis, Regional Economic Accounts, http://www.bea.gov/regional/
Bru
ce D
. Ba
ker, 2
01
0
Personal Income per Capita
$0
$10,000
$20,000
$30,000
$40,000
$50,000
$60,000
1969
1971
1973
1975
1977
1979
1981
1983
1985
1987
1989
1991
1993
1995
1997
1999
2001
2003
2005
2007
Year
Inco
me
per C
apita
Data Source: Bureau of Economic Analysis, Regional Economic Accounts, http://www.bea.gov/regional/
New Jersey

Bru
ce D
. Ba
ker, 2
01
0
Personal Income per Capita(Northeast)
$20,000
$25,000
$30,000
$35,000
$40,000
$45,000
$50,000
$55,000
$60,000
Year
Inco
me
per C
apita
United States 3/
Connecticut
Delaware
Maryland
Massachusetts
New Jersey
New York
Pennsylvania
Rhode Island
Data Source: Bureau of Economic Analysis, Regional Economic Accounts, http://www.bea.gov/regional/

Bru
ce D
. Ba
ker, 2
01
0
Part III
Teacher Wages – Out of control?

Bru
ce D
. Ba
ker, 2
01
0
Take Home Points• Teacher salaries have actually declined with respect to non-teacher
wages over time in NJ, even when comparing wages for the same number of hours and weeks worked, and at same degree level and age.
• Despite a mythology that all non-teachers work every day of every week of the year and that teachers work about half the year, non-teachers actually report working about 48 weeks per year compared to teachers 42 weeks. Teachers worked about 87% of the weeks worked by other non-teacher workers in NJ.
• Comparing different data sources (something I prefer not to do), teachers at specific experience and degree levels appear to earn an annual wage about 67% of that of their non-teaching peers – annually. Okay, but they don’t work as many weeks. So, they earned 67% of the wage for working 87% of the time. Still a significant disparity.
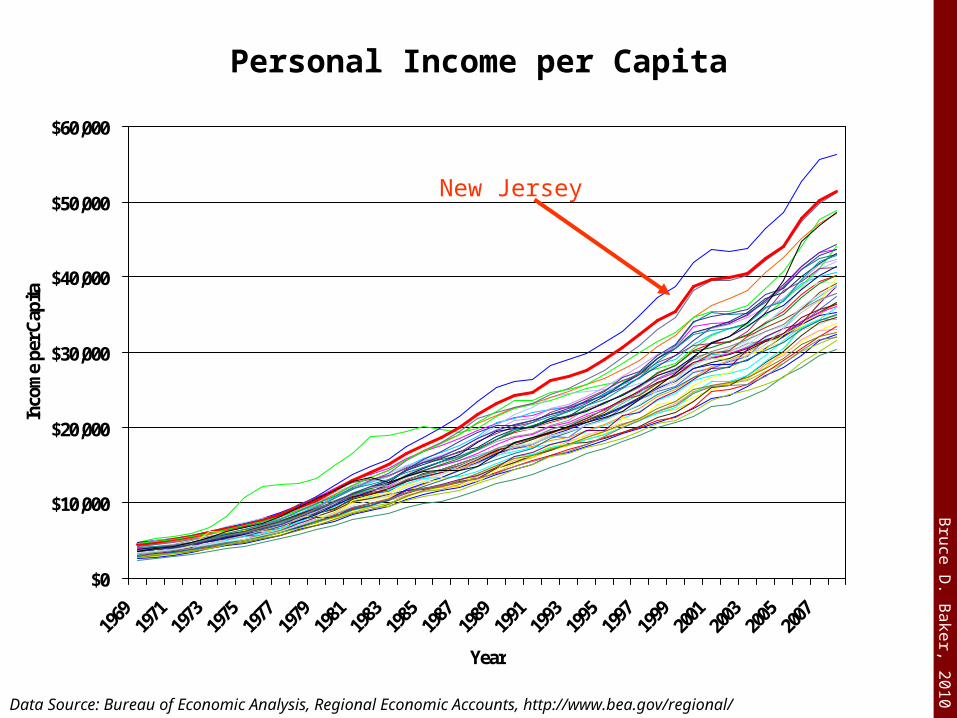
• Teachers’ annual income return to experience (or age) is well less than that of non-teachers over much of their careers. Assuming teachers and non-teachers start at a similar wage at age 23 with a masters degree (around $50k), by age 40, the average non-teacher will be earning over $100k, while the average teacher will be approaching $80k .

Bru
ce D
. Ba
ker, 2
01
0
Teacher Hourly Wage as % of Non-Teacher HourlyStatewide
0%
20%
40%
60%
80%
100%
120%
1990 2000 2005 2006 2007
Year
Rel
ativ
e H
ou
rly
Wag
e
Bachelors Degree
Masters Degree
Professional Degree
Doctoral Degree
All Degree Levels
Data Source: US Census 1990 & 2000, American Community Survey 2005 - 2007

Bru
ce D
. Ba
ker, 2
01
0
$20,000
$30,000
$40,000
$50,000
$60,000
$70,000
$80,000
1990 1992 1994 1996 1998 2000 2002 2004 2006
Year
Pre
dic
ted
Wag
e
Teacher with BANon-Teacher with BATeacher with MANon-Teacher with MA
Data Source: US Census 1990 & 2000, American Community Survey 2005 - 2007 Based on Statewide Model for worker 40yrs old, 40hrs for 40 wks
Regression Model Estimates of Teacher & Non-teacher Wages

Bru
ce D
. Ba
ker, 2
01
0
Hours Worked Last Year
Year Non-Teachers Teachers Share
1990 47.82 41.74 87%
2000 48.33 42.21 87%
2005 48.50 42.92 88%
2006 48.84 42.87 88%
2007 48.78 42.60 87%
Data Source: US Census 1990 & 2000, American Community Survey 2005 - 2007

Bru
ce D
. Ba
ker, 2
01
0
Annual Teacher Wages and Non-Teacher Wages at Fixed Age/ Experience, Location and Degree Level
TEACHERS (NJDOE Data) Non-Teachers (Census Data)
Masters Degree with 10 yrs.
(Nwk CBSA)
Masters Degree with 10 yrs.
(Nwk CBSA)
Masters Degree, 35 yr. Old, (Nwk
Metro)
Masters Degree, 35 yr.
Old, (Nwk Metro)
Teacher % of Non-Teacher
Year Exper. Const. Exper Growth Exper. Const. Exper Growth
2000 $ 70,732 $ 70,732
2001
2002 $ 50,542 $ 50,542
2003 $ 52,057 $ 53,852
2004 $ 53,865 $ 58,014
2005 $ 55,682 $ 62,489 $ 85,404 $ 92,744 65%
2006 $ 57,563 $ 66,590 $ 85,279 $ 93,258 67%
2007 $ 59,373 $ 70,437 $ 89,064 $ 95,595 67%
2008 $ 61,189 $ 74,139 $ 90,708 $ 98,654 67%
Data Sources: Non-Teacher Wages from US Census 2000, American Community Survey 2005 - 2008 based on regression model of wages controlling for age, location, degree level and year. Teacher wages based on NJDOE Personnel Files also using regression model controlling for experience, degree level, location, position type and year.

Bru
ce D
. Ba
ker, 2
01
0
Returns to Experience/Age for Teachers and Non-Teachers (at fixed degree level, location)
$40,000
$50,000
$60,000
$70,000
$80,000
$90,000
$100,000
$110,000
$120,000
23 28 33 38 43 48 53 58
Age/Experience (23 = Year 1)
Inco
me
from
Wag
e (S
alar
y)
Public School Increase
Non-teacher Increase
Data Sources: Non-Teacher Wages from US Census 2000, American Community Survey 2005 - 2008 based on regression model of wages controlling for age, location, degree level and year. Teacher wages based on NJDOE Personnel Files also using regression model controlling for experience, degree level, location, position type and year.

Bru
ce D
. Ba
ker, 2
01
0
Part IV
District Resources and the Growing “Administrative Blob”

Bru
ce D
. Ba
ker, 2
01
0
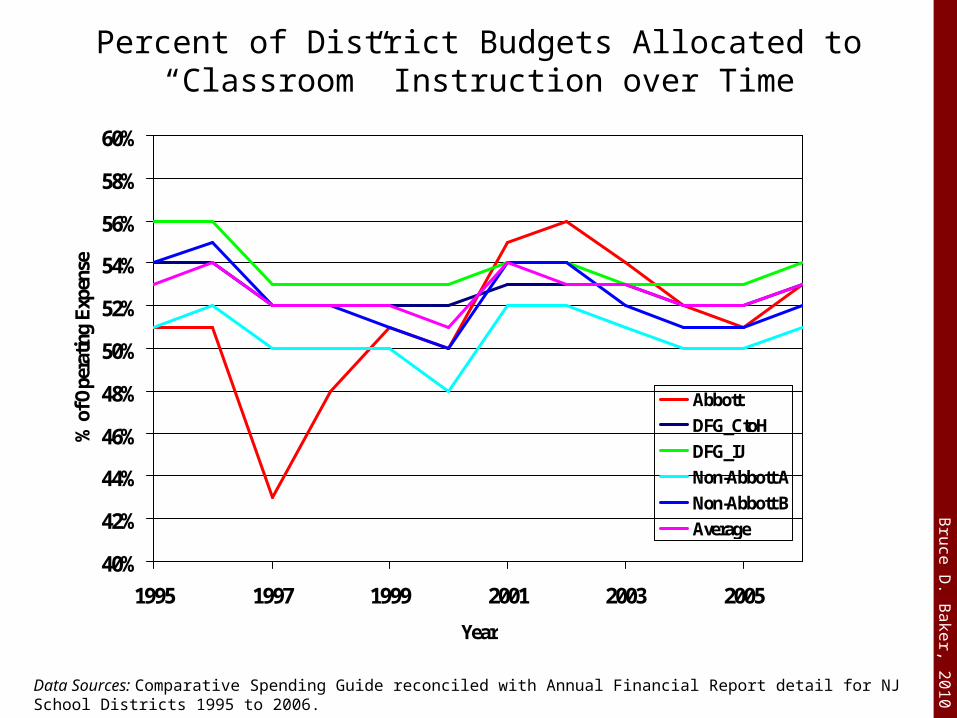
Take Home Points• Classroom instructional spending as a share of budgets
has remained relatively constant over time, and poor urban districts are in line with other NJ districts in this regard.
• Total administrative expenses as a share of school district budgets have remained relatively constant for nearly 15 years and large poor urban and Abbott district administrative expenses are in line with (and lower than) other districts.
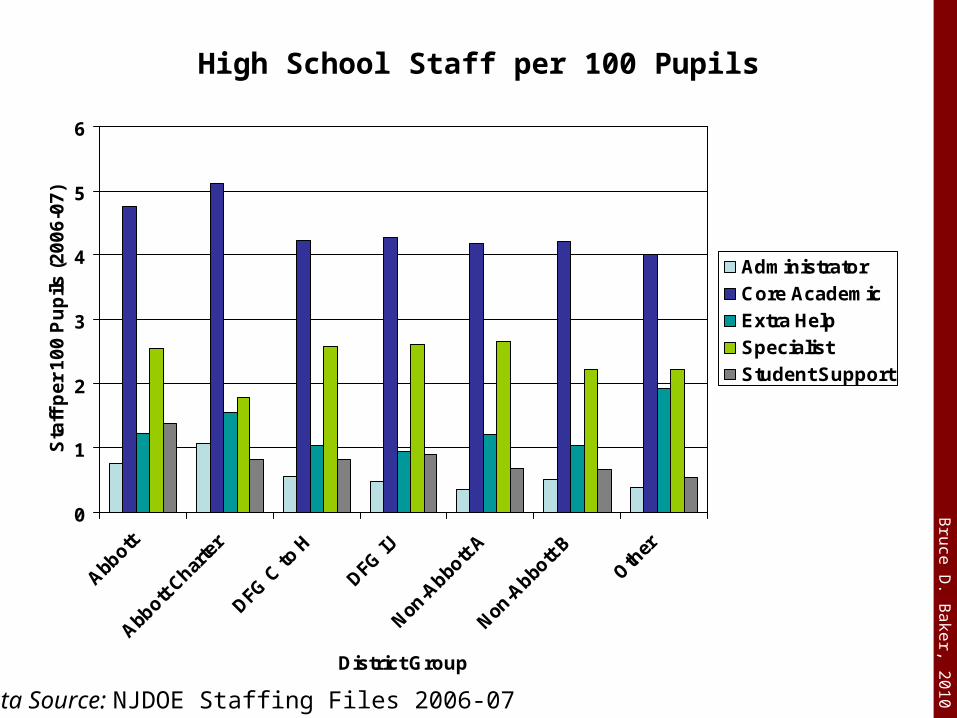
• School level administrators are a relatively small share of school personnel. Not shown here, but also relevant is the fact that school level administrative salaries are only marginally higher than senior teacher salaries. As such, it is highly unlikely that one can cut substantially close budget gaps by cutting “administrative fat” alone.
Bru
ce D
. Ba
ker, 2
01
0
Percent of District Budgets Allocated to “Classroom” Instruction over Time
40%
42%
44%
46%
48%
50%
52%
54%
56%
58%
60%
1995 1997 1999 2001 2003 2005
Year
% o
f Ope
ratin
g Ex
pens
e
Abbott
DFG_CtoH
DFG_IJ
Non-Abbott A
Non-Abbott B
Average
Data Sources: Comparative Spending Guide reconciled with Annual Financial Report detail for NJ School Districts 1995 to 2006.

Bru
ce D
. Ba
ker, 2
01
0
Percent of District Budgets Allocated to “Classroom” Salaries for Instruction over Time
40%
42%
44%
46%
48%
50%
52%
54%
56%
58%
60%
1995 1997 1999 2001 2003 2005
Year
% o
f Ope
ratin
g Ex
pens
e
Abbott
DFG_CtoH
DFG_IJ
Non-Abbot A
Non-Abbot B
Average
Data Sources: Comparative Spending Guide reconciled with Annual Financial Report detail for NJ School Districts 1995 to 2006.

Bru
ce D
. Ba
ker, 2
01
0
Percent of District Budgets Allocated to Total Administrative (District and School Level) Expense
9%
10%
11%
12%
13%
14%
15%
1998 1999 2000 2001 2002 2003 2004 2005 2006
Year
% o
f Ope
ratin
g Ex
pens
e
A
B
CD
DE
FG
GH
I
J
Data Sources: Comparative Spending Guide reconciled with Annual Financial Report detail for NJ School Districts 1998 to 2006.

Bru
ce D
. Ba
ker, 2
01
0
Percent of District Budgets Allocated to Total Administrative (District and School Level) Expense
9%
10%
11%
12%
13%
14%
15%
1998 1999 2000 2001 2002 2003 2004 2005
Year
% o
f Ope
ratin
g Ex
pens
e
Abbott
DFG_CtoHDFG_IJ
Non-Abbot
Non-AbbotTotal
Data Sources: Comparative Spending Guide reconciled with Annual Financial Report detail for NJ School Districts 1995 to 2005. (not weighted for district enrollment)

Bru
ce D
. Ba
ker, 2
01
0
Elementary School Staff per 100 Pupils
0
1
2
3
4
5
6
7
8
Abbott
Abbott
Charte
r
DFG C
to H
DFG IJ
Non-A
bbott
A
Non-A
bbott
B
Oth
er
Oth
er C
harte
r
District Group
Sta
ff p
er
10
0 P
up
ils (
20
06
-07
)
Administrator
Core Academic
Extra Help
Specialist
Student Support
Data Source: NJDOE Staffing Files 2006-07

Bru
ce D
. Ba
ker, 2
01
0
Middle School Staff per 100 Pupils
0
1
2
3
4
5
6
7
Abbott DFG C toH
DFG IJ Non-Abbott A
Non-Abbott B
Other
District Group
Sta
ff p
er
10
0 P
up
ils (
20
06
-07
)
Administrator
Core Academic
Extra Help
Specialist
Student Support
Data Source: NJDOE Staffing Files 2006-07
Bru
ce D
. Ba
ker, 2
01
0
High School Staff per 100 Pupils
0
1
2
3
4
5
6
Abbott
Abbott
Charte
r
DFG C
to H
DFG IJ
Non-A
bbott
A
Non-A
bbott
B
Oth
er
District Group
Sta
ff p
er
10
0 P
up
ils (
20
06
-07
)
Administrator
Core Academic
Extra Help
Specialist
Student Support
Data Source: NJDOE Staffing Files 2006-07