Embed Size (px)
Citation preview

1
Bru
ce D
. Ba
ker, 2
01
0
Taxes, Teacher Wages & School District Resource Allocation in
New Jersey
Bruce D. Baker

2
Bru
ce D
. Ba
ker, 2
01
0
Recurring Media Claims
• New Jersey is the most taxed state in the nation, • Our taxes are driving our economy into the ground and
we’re falling way behind all other states, • Our teacher salaries which are completely out of
control are the reason why our taxes are out of control, • School districts don’t have to cut teachers to get their
budgets in line because school districts waste most of their money on administration anyway.
– Of course, these last two claims are entirely inconsistent, but often spouted by the same pundits (primarily talk radio). If escalating teacher salaries were the cause of escalating costs, then teacher salaries – or teachers themselves – would need to be cut.

3
Bru
ce D
. Ba
ker, 2
01
0
Part I
New Jersey’s Tax Burden

4
Bru
ce D
. Ba
ker, 2
01
0
Take Home Point
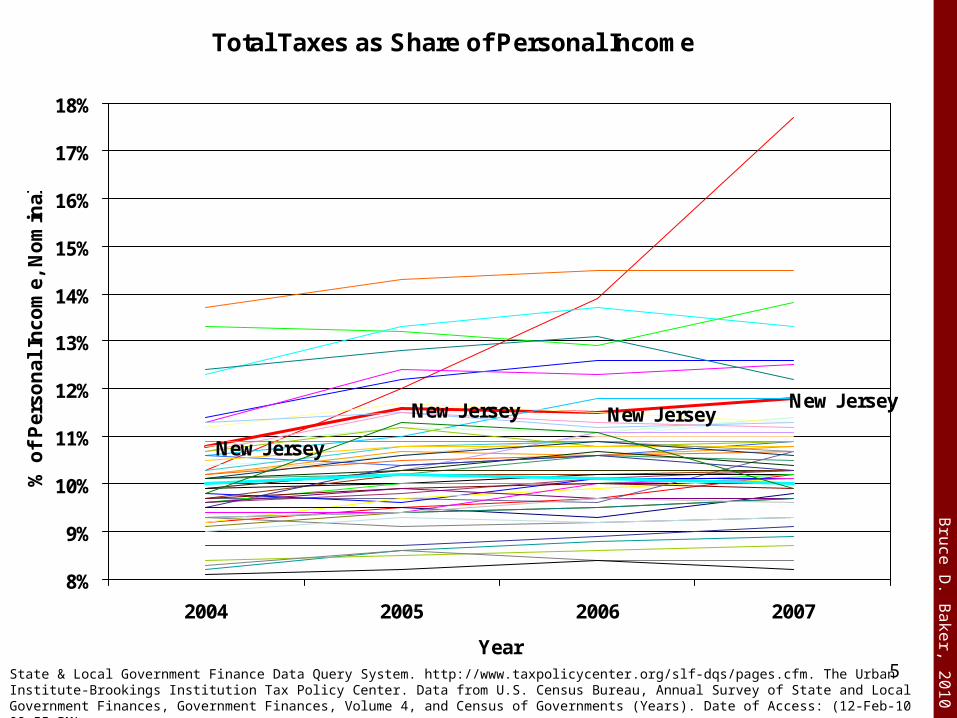
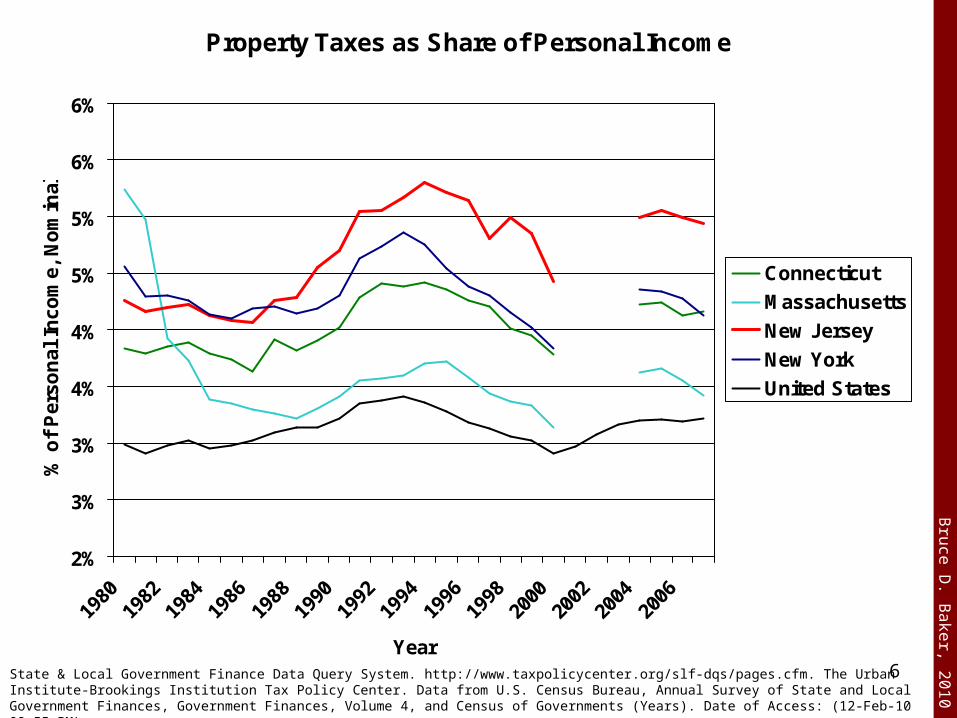
• New Jersey is not, in fact, the highest taxed state in the nation. – Our property taxes are high, but our income
and sales taxes are modest by comparison.– We’re also not number one in property taxes
when all states are considered and when property taxes are measured as a percent of income.
5
Bru
ce D
. Ba
ker, 2
01
0
Total Taxes as Share of Personal Income
New Jersey
New Jersey New JerseyNew Jersey
8%
9%
10%
11%
12%
13%
14%
15%
16%
17%
18%
2004 2005 2006 2007
Year
% o
f P
erso
nal
In
com
e, N
om
inal
State & Local Government Finance Data Query System. http://www.taxpolicycenter.org/slf-dqs/pages.cfm. The Urban Institute-Brookings Institution Tax Policy Center. Data from U.S. Census Bureau, Annual Survey of State and Local Government Finances, Government Finances, Volume 4, and Census of Governments (Years). Date of Access: (12-Feb-10 09:55 PM)
6
Bru
ce D
. Ba
ker, 2
01
0
Property Taxes as Share of Personal Income
2%
3%
3%
4%
4%
5%
5%
6%
6%
1980
1982
1984
1986
1988
1990
1992
1994
1996
1998
2000
2002
2004
2006
Year
% o
f P
erso
nal
In
com
e, N
om
inal
Connecticut
Massachusetts
New Jersey
New York
United States
State & Local Government Finance Data Query System. http://www.taxpolicycenter.org/slf-dqs/pages.cfm. The Urban Institute-Brookings Institution Tax Policy Center. Data from U.S. Census Bureau, Annual Survey of State and Local Government Finances, Government Finances, Volume 4, and Census of Governments (Years). Date of Access: (12-Feb-10 09:55 PM)

7
Bru
ce D
. Ba
ker, 2
01
0
Income Taxes as Share of Personal Income
0%
1%
2%
3%
4%
5%
6%
7%
8%
1980
1982
1984
1986
1988
1990
1992
1994
1996
1998
2000
2002
2004
2006
Year
% o
f P
erso
nal
In
com
e, N
om
inal
Connecticut
Massachusetts
New Jersey
New York
United States
State & Local Government Finance Data Query System. http://www.taxpolicycenter.org/slf-dqs/pages.cfm. The Urban Institute-Brookings Institution Tax Policy Center. Data from U.S. Census Bureau, Annual Survey of State and Local Government Finances, Government Finances, Volume 4, and Census of Governments (Years). Date of Access: (12-Feb-10 09:55 PM)

8
Bru
ce D
. Ba
ker, 2
01
0
Sales Taxes as Share of Personal Income
1.0%
1.5%
2.0%
2.5%
3.0%
3.5%
4.0%
4.5%
5.0%
1980
1982
1984
1986
1988
1990
1992
1994
1996
1998
2000
2002
2004
2006
Year
% o
f P
erso
nal
In
com
e, N
om
inal
Connecticut
Massachusetts
New Jersey
New York
United States
State & Local Government Finance Data Query System. http://www.taxpolicycenter.org/slf-dqs/pages.cfm. The Urban Institute-Brookings Institution Tax Policy Center. Data from U.S. Census Bureau, Annual Survey of State and Local Government Finances, Government Finances, Volume 4, and Census of Governments (Years). Date of Access: (12-Feb-10 09:55 PM)

9
Bru
ce D
. Ba
ker, 2
01
0
Part II
Economic Productivity in New Jersey over the Long Run

10
Bru
ce D
. Ba
ker, 2
01
0
Take Home Points
• New Jersey remains high in gross state product (gross domestic product – state) per capita. – Our growth has been only modest, but some of those
states in our region that have outpaced us in recent years are actually states with higher tax burdens (NY). This is obviously not causal – ONE WAY OR THE OTHER!
• New Jersey also remains high in per capita income and has held pace over time despite apocalyptic claims that all of the state’s high income residents are exiting the state in droves.

11
Bru
ce D
. Ba
ker, 2
01
0
Gross Domestic Product (state) per Capita
$20,000
$25,000
$30,000
$35,000
$40,000
$45,000
$50,000
$55,000
$60,000
1997
1998
1999
2000
2001
2002
2003
2004
2005
2006
2007
2008
Year
GD
P pe
r Cap
ita (S
tate
)
Data Source: Bureau of Economic Analysis, Regional Economic Accounts, http://www.bea.gov/regional/
New Jersey

12
Bru
ce D
. Ba
ker, 2
01
0
Gross Domestic Product (state) per Capita(Northeast)
$20,000
$25,000
$30,000
$35,000
$40,000
$45,000
$50,000
$55,000
$60,000
Year
GD
P pe
r Cap
ita (S
tate
)
United States
Connecticut
Delaware
Maryland
Massachusetts
New Jersey
New York
Pennsylvania
Rhode Island
Data Source: Bureau of Economic Analysis, Regional Economic Accounts, http://www.bea.gov/regional/

13
Bru
ce D
. Ba
ker, 2
01
0
Personal Income per Capita
$0
$10,000
$20,000
$30,000
$40,000
$50,000
$60,000
1969
1971
1973
1975
1977
1979
1981
1983
1985
1987
1989
1991
1993
1995
1997
1999
2001
2003
2005
2007
Year
Inco
me
per C
apita
Data Source: Bureau of Economic Analysis, Regional Economic Accounts, http://www.bea.gov/regional/
New Jersey

14
Bru
ce D
. Ba
ker, 2
01
0
Personal Income per Capita(Northeast)
$20,000
$25,000
$30,000
$35,000
$40,000
$45,000
$50,000
$55,000
$60,000
Year
Inco
me
per C
apita
United States 3/
Connecticut
Delaware
Maryland
Massachusetts
New Jersey
New York
Pennsylvania
Rhode Island
Data Source: Bureau of Economic Analysis, Regional Economic Accounts, http://www.bea.gov/regional/

15
Bru
ce D
. Ba
ker, 2
01
0
Total State and Local Education Expenditures as a Share of Gross Domestic Product (State) in NJ
3.0%
3.5%
4.0%
4.5%
5.0%
5.5%
6.0%
1997
1998
1999
2000
2001
2002
2003
2004
2005
2006
2007
Year
Educ
atio
nal E
ffort
(Ed.
Exp
ense
as
Shar
e of
GSP
)
Data Source: Bureau of Economic Analysis, Regional Economic Accounts, http://www.bea.gov/regional/
This graph presents what is perhaps the strongest evidence of an increased burden associated with public education spending in NJ, but represents a period over which funding was scaled up, then leveled off (including facilities funding). New Jersey ranks 2nd in educational effort. But, this upswing is not driven primarily by increased costs associated with certified staff salaries.

16
Bru
ce D
. Ba
ker, 2
01
0
Part III
Teacher Wages – Out of control?

17
Bru
ce D
. Ba
ker, 2
01
0
Take Home Points• Teacher salaries have actually declined with respect to non-teacher wages over
time in NJ, even when comparing wages for the same number of hours and weeks worked, and at same degree level and age.
• Despite a mythology that all non-teachers work every day of every week of the year and that teachers work about half the year, non-teachers actually report working about 48 weeks per year compared to teachers 42 weeks. Teachers worked about 87% of the weeks worked by other non-teacher workers in NJ.
• Comparing different data sources (something I prefer not to do), teachers at specific experience and degree levels appear to earn an annual wage about 67% of that of their non-teaching peers – annually. Okay, but they don’t work as many weeks. So, they earned 67% of the wage for working 87% of the time. Still a significant disparity.
• Teachers’ annual income return to experience (or age) is well less than that of non-teachers over much of their careers. Assuming teachers and non-teachers start at a similar wage at age 23 with a masters degree (around $50k), by age 40, the average non-teacher will be earning over $100k, while the average teacher will be approaching $80k .
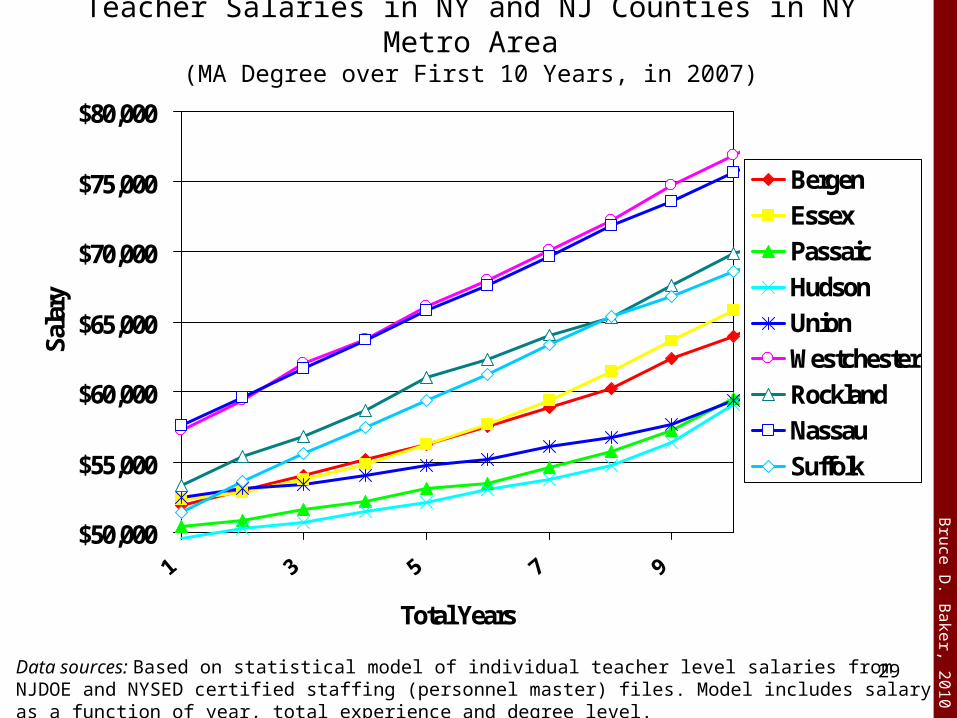
• New Jersey teacher wages for teachers in the New York metro area lag well behind New York teacher wages in Westchester, Rockland, Nassau and Suffolk counties and have grown more slowly over time.
• Certified staffing salaries for public schools, as a percent of total state and local expense, have declined over time!

18
Bru
ce D
. Ba
ker, 2
01
0
Wages of Selected Occupations (National)Integrated Public Use Microdata System (IPUMS) Census 5% Samples 1980, 1990 & 2000 and
American Community Survey of 2005
$5
$10
$15
$20
$25
$30
$35
1980 1985 1990 1995 2000 2005
Year
Hou
rly
Wag
e
k12 TeachersPostsecondaryMath/ComputerArchitects/EngineersLife ScienceSocial Science (incl. Econ.)Healthcare (non-Physicians)All with BA or MA
Notes: Individuals age 25 to 40. Excludes managerial positions. Hourly wages computed from “income from wages” divided by estimated annual hours worked (usual hours per week times weeks worked last year).

19
Bru
ce D
. Ba
ker, 2
01
0
Wages of Selected Occupations in New JerseyIntegrated Public Use Microdata System (IPUMS)
Census 5% Samples 1980, 1990 & 2000 and American Community Survey of 2005
$5
$10
$15
$20
$25
$30
$35
$40
$45
$50
1980 1985 1990 1995 2000 2005
Year
Hou
rly
Wag
e
k12 TeachersPostsecondaryMath/ComputerArchitects/EngineersLife ScienceSocial Science (incl. Econ.)Healthcare (non-Physicians)All with BA or MA
Notes: Individuals age 25 to 40. Excludes managerial positions. Hourly wages computed from “income from wages” divided by estimated annual hours worked (usual hours per week times weeks worked last year).

20
Bru
ce D
. Ba
ker, 2
01
0
Teacher Hourly Wage as % of Non-Teacher HourlyStatewide
70%
75%
80%
85%
90%
95%
100%
1990 2000 2005 2006 2007
Year
Rel
ativ
e H
ou
rly
Wag
e
Bachelors Degree
Masters Degree
All Degree Levels
Data Source: US Census 1990 & 2000, American Community Survey 2005 - 2007

21
Bru
ce D
. Ba
ker, 2
01
0
$20,000
$30,000
$40,000
$50,000
$60,000
$70,000
$80,000
1990 1992 1994 1996 1998 2000 2002 2004 2006
Year
Pre
dic
ted
Wag
e
Teacher with BANon-Teacher with BATeacher with MANon-Teacher with MA
Data Source: US Census 1990 & 2000, American Community Survey 2005 - 2007 Based on Statewide Model for worker 40yrs old, 40hrs for 40 wks
Regression Model Estimates of Teacher & Non-teacher Wages

22
Bru
ce D
. Ba
ker, 2
01
0
Hours Worked Last Year
Year Non-Teachers Teachers Share
1990 47.82 41.74 87%
2000 48.33 42.21 87%
2005 48.50 42.92 88%
2006 48.84 42.87 88%
2007 48.78 42.60 87%
Data Source: US Census 1990 & 2000, American Community Survey 2005 - 2007

23
Bru
ce D
. Ba
ker, 2
01
0
Annual Teacher Wages and Non-Teacher Wages at Fixed Age/ Experience, Location and Degree Level
TEACHERS (NJDOE Data) Non-Teachers (Census Data)
Masters Degree with 10 yrs.
(Nwk CBSA)
Masters Degree with 10 yrs.
(Nwk CBSA)
Masters Degree, 35 yr. Old, (Nwk
Metro)
Masters Degree, 35 yr.
Old, (Nwk Metro)
Teacher % of Non-Teacher
Year Exper. Const. Exper Growth Exper. Const. Exper Growth
2000 $ 70,732 $ 70,732
2001
2002 $ 50,542 $ 50,542
2003 $ 52,057 $ 53,852
2004 $ 53,865 $ 58,014
2005 $ 55,682 $ 62,489 $ 85,404 $ 92,744 65%
2006 $ 57,563 $ 66,590 $ 85,279 $ 93,258 67%
2007 $ 59,373 $ 70,437 $ 89,064 $ 95,595 67%
2008 $ 61,189 $ 74,139 $ 90,708 $ 98,654 67%
Data Sources: Non-Teacher Wages from US Census 2000, American Community Survey 2005 - 2008 based on regression model of wages controlling for age, location, degree level and year. Teacher wages based on NJDOE Personnel Files also using regression model controlling for experience, degree level, location, position type and year.

24
Bru
ce D
. Ba
ker, 2
01
0
YearMean Wage
Wage Earners
Total Wages ('000s)
(E001) Total Expenditure
('000s)
(E004) Total Current Expend ('000s)
Cert Staff Wages as % of Total State
& Local Expend
Cert Staff Wages as %
of Current State & Local
Expend
1997 $51,217 110,958 $5,682,939 $47,897,521 $43,359,183 12% 13%1998 $52,022 113,210 $5,889,465 $50,915,658 $45,714,119 12% 13%1999 $52,878 116,535 $6,162,190 $51,264,737 $46,447,220 12% 13%2000 $53,533 120,724 $6,462,689 $54,590,246 $49,638,211 12% 13%2001 $54,142 125,152 $6,776,0352002 $55,422 130,572 $7,236,526 $64,289,465 $57,609,960 11% 13%2003 $56,541 133,765 $7,563,2232004 $58,132 136,279 $7,922,223 $74,335,925 $66,861,901 11% 12%2005 $59,698 138,986 $8,297,204 $79,845,099 $71,944,445 10% 12%2006 $61,443 140,651 $8,642,062 $82,928,181 $74,854,461 10% 12%2007 $63,072 141,337 $8,914,472 $87,091,981 $78,594,281 10% 11%
State Department of Education Certified Staffing Files
Census & Tax Policy Center State & Local Rev/Expend
Data Sources: A) NJDOE Certified Staffing filesB) State & Local Government Finance Data Query System. http://www.taxpolicycenter.org/slf-dqs/pages.cfm. The Urban Institute-Brookings Institution Tax Policy Center. Data from U.S. Census Bureau, Annual Survey of State and Local Government Finances, Government Finances, Volume 4, and Census of Governments (Years). Date of Access: (22-Mar-10 09:55 AM)
New Jersey Elementary and Secondary Certified Staffing Wages as a Percent of State and Local Expenditures

25
Bru
ce D
. Ba
ker, 2
01
0
Returns to Experience/Age for Teachers and Non-Teachers (at fixed degree level, location)
$40,000
$50,000
$60,000
$70,000
$80,000
$90,000
$100,000
$110,000
$120,000
23 28 33 38 43 48 53 58
Age/Experience (23 = Year 1)
Inco
me
from
Wag
e (S
alar
y)
Public School Increase
Non-teacher Increase
Data Sources: Non-Teacher Wages from US Census 2000, American Community Survey 2005 - 2008 based on regression model of wages controlling for age, location, degree level and year. Teacher wages based on NJDOE Personnel Files also using regression model controlling for experience, degree level, location, position type and year.

26
Bru
ce D
. Ba
ker, 2
01
0
Teacher Salaries in NY and NJ Counties in NY Metro Area(BA Degree with 10 Years)
BergenBergen
BergenEssex
EssexEssex
Passaic
PassaicPassaic
Hudson
Hudson
Hudson
UnionUnion
Union
Westchester
Westchester
Westchester
Rockland
RocklandNassau
Nassau
Nassau
Suffolk
Suffolk
Suffolk
Rockland
$45,000
$50,000
$55,000
$60,000
$65,000
$70,000
2005 2006 2007
Year
Sala
ry
Data sources: Based on statistical model of individual teacher level salaries from NJDOE and NYSED certified staffing (personnel master) files. Model includes salary as a function of year, total experience and degree level.

27
Bru
ce D
. Ba
ker, 2
01
0Teacher Salaries in NY and NJ Counties in NY Metro Area
(MA Degree with 10 Years)
NJ-Bergen
NJ-Bergen
NJ-Bergen
NJ-Essex
NJ-EssexNJ-Essex
NJ-Passaic
NJ-Passaic
NJ-Passaic
NJ-Hudson
NJ-Hudson
NJ-Hudson
NJ-UnionNJ-Union
NJ-Union
NY-Westchester
NY-Westchester
NY-Westchester
NY-Rockland
NY-Rockland
NY-RocklandNY-Nassau
NY-Nassau
NY-Nassau
NY-Suffolk
NY-Suffolk
NY-Suffolk
$55,000
$57,000
$59,000
$61,000
$63,000
$65,000
$67,000
$69,000
$71,000
$73,000
$75,000
2005 2006 2007
Year
Sala
ry
Data sources: Based on statistical model of individual teacher level salaries from NJDOE and NYSED certified staffing (personnel master) files. Model includes salary as a function of year, total experience and degree level.

28
Bru
ce D
. Ba
ker, 2
01
0Teacher Salaries in NY and NJ Counties in NY Metro Area
(MA Degree over First 30 Years, in 2007)
$50,000
$60,000
$70,000
$80,000
$90,000
$100,000
1 3 5 7 9 11 13 15 17 19 21 23 25 27 29
Total Years
Sala
ry
BergenEssexPassaicHudsonUnionWestchesterRocklandNassauSuffolk
Data sources: Based on statistical model of individual teacher level salaries from NJDOE and NYSED certified staffing (personnel master) files. Model includes salary as a function of year, total experience and degree level.
29
Bru
ce D
. Ba
ker, 2
01
0Teacher Salaries in NY and NJ Counties in NY Metro Area
(MA Degree over First 10 Years, in 2007)
$50,000
$55,000
$60,000
$65,000
$70,000
$75,000
$80,000
1 3 5 7 9
Total Years
Sala
ry
BergenEssexPassaicHudsonUnionWestchesterRocklandNassauSuffolk
Data sources: Based on statistical model of individual teacher level salaries from NJDOE and NYSED certified staffing (personnel master) files. Model includes salary as a function of year, total experience and degree level.

30
Bru
ce D
. Ba
ker, 2
01
0
Note regarding benefits & bias
• Corcoran and Mishel point out here: http://epi.3cdn.net/05447667bb274f359e_zam6br3st.pdf that– “…overall K-12 teacher compensation was 27.5% greater than
teacher wages alone, while overall professional compensation was 23.5% greater than professional wages. These differences in benefit shares translate into a benefits “bias”of 2.8 percentage points in 2006.”
• That is, benefits would close little of the overall gap in wages, even if the bias is somewhat larger in NJ.
• Costrell and Podgursky show about a 5% (slightly less) differential (10% non-teachers, 15% teachers) in the value of pensions, a portion of benefits. This too would close only part of the teacher to non-teacher wage gap in New Jersey, even if we assume New Jersey benefits for teachers to be much greater than other employee benefits.

31
Bru
ce D
. Ba
ker, 2
01
0
Part IV
District Resources and the Growing “Administrative Blob”

32
Bru
ce D
. Ba
ker, 2
01
0
Take Home Points• Classroom instructional spending as a share of budgets has
remained relatively constant over time, and poor urban districts are in line with other NJ districts in this regard.
• Total administrative expenses as a share of school district budgets have remained relatively constant for nearly 15 years and large poor urban and Abbott district administrative expenses are in line with (and lower than) other districts.
• School level administrators are a relatively small share of school personnel. Not shown here, but also relevant is the fact that school level administrative salaries are only marginally higher than senior teacher salaries. As such, it is highly unlikely that one can cut substantially close budget gaps by cutting “administrative fat” alone.
• District and school level administrative salaries in New Jersey have been flat for a decade. They are not increasing dramatically.
• Private independent school headmaster compensation tends to be much higher than a) superintendent salaries of the district where the private school is located and b) large city superintendent salaries.

33
Bru
ce D
. Ba
ker, 2
01
0
Percent of District Budgets Allocated to “Classroom” Instruction over Time
40%
42%
44%
46%
48%
50%
52%
54%
56%
58%
60%
1995 1997 1999 2001 2003 2005
Year
% o
f Ope
ratin
g Ex
pens
e
Abbott
DFG_CtoH
DFG_IJ
Non-Abbott A
Non-Abbott B
Average
Data Sources: Comparative Spending Guide reconciled with Annual Financial Report detail for NJ School Districts 1995 to 2006.

34
Bru
ce D
. Ba
ker, 2
01
0
Percent of District Budgets Allocated to “Classroom” Salaries for Instruction over Time
40%
42%
44%
46%
48%
50%
52%
54%
56%
58%
60%
1995 1997 1999 2001 2003 2005
Year
% o
f Ope
ratin
g Ex
pens
e
Abbott
DFG_CtoH
DFG_IJ
Non-Abbot A
Non-Abbot B
Average
Data Sources: Comparative Spending Guide reconciled with Annual Financial Report detail for NJ School Districts 1995 to 2006.

35
Bru
ce D
. Ba
ker, 2
01
0
Percent of District Budgets Allocated to Total Administrative (District and School Level) Expense
9%
10%
11%
12%
13%
14%
15%
1998 1999 2000 2001 2002 2003 2004 2005 2006
Year
% o
f Ope
ratin
g Ex
pens
e
A
B
CD
DE
FG
GH
I
J
Data Sources: Comparative Spending Guide reconciled with Annual Financial Report detail for NJ School Districts 1998 to 2006.

36
Bru
ce D
. Ba
ker, 2
01
0
Percent of District Budgets Allocated to Total Administrative (District and School Level) Expense
9%
10%
11%
12%
13%
14%
15%
1998 1999 2000 2001 2002 2003 2004 2005
Year
% o
f Ope
ratin
g Ex
pens
e
Abbott
DFG_CtoHDFG_IJ
Non-Abbot
Non-AbbotTotal
Data Sources: Comparative Spending Guide reconciled with Annual Financial Report detail for NJ School Districts 1995 to 2005. (not weighted for district enrollment)

37
Bru
ce D
. Ba
ker, 2
01
0
Elementary School Staff per 100 Pupils
0
1
2
3
4
5
6
7
8
Abbott
Abbott
Charte
r
DFG C
to H
DFG IJ
Non-A
bbott
A
Non-A
bbott
B
Oth
er
Oth
er C
harte
r
District Group
Sta
ff p
er
10
0 P
up
ils (
20
06
-07
)
Administrator
Core Academic
Extra Help
Specialist
Student Support
Data Source: NJDOE Staffing Files 2006-07

38
Bru
ce D
. Ba
ker, 2
01
0
Middle School Staff per 100 Pupils
0
1
2
3
4
5
6
7
Abbott DFG C toH
DFG IJ Non-Abbott A
Non-Abbott B
Other
District Group
Sta
ff p
er
10
0 P
up
ils (
20
06
-07
)
Administrator
Core Academic
Extra Help
Specialist
Student Support
Data Source: NJDOE Staffing Files 2006-07

39
Bru
ce D
. Ba
ker, 2
01
0
High School Staff per 100 Pupils
0
1
2
3
4
5
6
Abbott
Abbott
Charte
r
DFG C
to H
DFG IJ
Non-A
bbott
A
Non-A
bbott
B
Oth
er
District Group
Sta
ff p
er
10
0 P
up
ils (
20
06
-07
)
Administrator
Core Academic
Extra Help
Specialist
Student Support
Data Source: NJDOE Staffing Files 2006-07

40
Bru
ce D
. Ba
ker, 2
01
0
District Level Administrative Salaries in New Jersey
$60,000
$70,000
$80,000
$90,000
$100,000
$110,000
$120,000
$130,000
$140,000
$150,000
$160,000
1997
1998
1999
2000
2001
2002
2003
2004
2005
2006
2007
2008
Year
Sala
ry
SuperintendentAdmin. AssistantBusiness AdministratorAsst. Sup. Non-BusinessAsst. Sup. Business
Data source: NJDOE Staffing Files. Includes cumulative salaries of individuals by job code because some district level administrators hold positions across multiple districts, collecting more than one salary.

41
Bru
ce D
. Ba
ker, 2
01
0
District Level Administrative Salaries in New JerseyECWI Adjusted ($1997 constant)
$50,000
$60,000
$70,000
$80,000
$90,000
$100,000
$110,000
1997
1998
1999
2000
2001
2002
2003
2004
2005
2006
2007
2008
Year
Sala
ry
Superintendent
Admin. Assistant
Business Administrator
Asst. Sup. Non-Business
Asst. Sup. Business
Data source: NJDOE Staffing Files & NCES State ECWI (http://nces.ed.gov/edfin/adjustments.asp) 2006 to 2008 ECWI not available. Assumed at average rate of change from 1997 to 2005. Includes cumulative salaries of individuals by job code because some district level administrators hold positions across multiple districts, collecting more than one salary.

42
Bru
ce D
. Ba
ker, 2
01
0
Top 100 Superintendent Salaries in New Jersey & ECWI Adjusted Salaries ($1997 constant)
$50,000
$70,000
$90,000
$110,000
$130,000
$150,000
$170,000
$190,000
$210,000
1997
1998
1999
2000
2001
2002
2003
2004
2005
2006
2007
2008
Year
Sala
ry
Top 100 Superintendents
Adjusted
Data source: NJDOE Staffing Files & NCES State ECWI (http://nces.ed.gov/edfin/adjustments.asp) 2006 to 2008 ECWI not available. Assumed at average rate of change from 1997 to 2005. Includes cumulative salaries of individuals by job code because some district level administrators hold positions across multiple districts, collecting more than one salary.

43
Bru
ce D
. Ba
ker, 2
01
0
School Level Administrative Salaries in New Jersey
$60,000
$70,000
$80,000
$90,000
$100,000
$110,000
$120,000
$130,000
$140,000
1997
1998
1999
2000
2001
2002
2003
2004
2005
2006
2007
2008
Year
Sala
ry
HS Principal
Assist Principal HS
Jr HS Principal
Assist Principal Jr HS
Middle Sch PrincipalAssist Prin Middle Sch
Elemementary Sch Principal
Assist Principal Elem Sch
Data source: NJDOE Staffing Files

44
Bru
ce D
. Ba
ker, 2
01
0
School Level Administrative Salaries in New JerseyECWI Adjusted ($1997 constant)
$50,000
$55,000
$60,000
$65,000
$70,000
$75,000
$80,000
$85,000
$90,000
$95,000
1997
1998
1999
2000
2001
2002
2003
2004
2005
2006
2007
2008
Year
Sala
ry
HS PrincipalAssist Principal HSJr HS PrincipalAssist Principal Jr HSMiddle Sch PrincipalAssist Prin Middle SchElemementary Sch PrincipalAssist Principal Elem Sch
Data source: NJDOE Staffing Files & NCES State ECWI (http://nces.ed.gov/edfin/adjustments.asp) 2006 to 2008 ECWI not available. Assumed at average rate of change from 1997 to 2005.

45
Bru
ce D
. Ba
ker, 2
01
0
Executive Compensation in Private and Public Schoolsin New Jersey (2006-07)
$0
$50,000
$100,000
$150,000
$200,000
$250,000
$300,000
Dwig
ht/Englew
ood
FHCDS/Som
erse
t Hill
s
PDS/Prin
ceto
n Twp.
Frisch
/Para
mus
MBS/M
orris
SRDS/Upper
Sad
dle R
iver
Morro
w
Pingry
/Ber
nards
Twp
MKA/M
ontcla
ir
Ranney/T
into
n Fal
ls
RPS/Fra
nklin T
wp.
Oak H
ill/M
iddl
etown
RCDS/Rum
son-FH
Peck/
Morri
s
GSB/Som
erset
Hill
s
Newark
Acad/L
ivin
gston
Chapin/P
rince
ton T
wp.
MFS/M
oorest
own
Ward
law/E
dison
Far B
rook/
Milb
urn
Big C
ity S
upts.
Headm
aster
Mea
n
Host Supt.
Mean
Headmaster Comp.
Local Supt. Comp.
Note: Private school headmaster compensation from Guidestar.org, IRS 990 for 2006. Local Superintendent compensation for district that is geographic home to private school. Supt. Comp based on 2006-07 (1 yr later than Headmaster Comp.). Headmaster and Supt. Comp. include salary and cash-basis benefits (not health-care, retirement contributions, etc.). Big City Supts. Includes Newark, Camden, Jersey City, Paterson and Trenton.

46
Bru
ce D
. Ba
ker, 2
01
0
Part V
State Revenues, Expenditures and Debt over Time

47
Bru
ce D
. Ba
ker, 2
01
0
Per Capita Revenue, Expenditure & Debt
$0
$1,000
$2,000
$3,000
$4,000
$5,000
$6,000
$7,000
$8,000
$9,000
1985 1990 1995 2000 2005
Year
Per C
apita
Rea
l 200
7$
(R01) Total Revenue
(E001) Total Expenditure
(D01) Total DebtOutstanding
Data Source: State & Local Government Finance Data Query System. http://www.taxpolicycenter.org/slf-dqs/pages.cfm. The Urban Institute-Brookings Institution Tax Policy Center. Data from U.S. Census Bureau, Annual Survey of State and Local Government Finances, Government Finances, Volume 4, and Census of Governments (Years). Date of Access: (22-Mar-10 09:55 AM)
2001-2002 revenue shock

48
Bru
ce D
. Ba
ker, 2
01
0
State General Revenues and Expenditures
$0
$10,000,000
$20,000,000
$30,000,000
$40,000,000
$50,000,000
$60,000,000
1985 1990 1995 2000 2005
Year
Rea
l 200
7$
(R03) General Revenue(R04) Gen Rev-Own Sources(E013) General Expenditure
Data Source: State & Local Government Finance Data Query System. http://www.taxpolicycenter.org/slf-dqs/pages.cfm. The Urban Institute-Brookings Institution Tax Policy Center. Data from U.S. Census Bureau, Annual Survey of State and Local Government Finances, Government Finances, Volume 4, and Census of Governments (Years). Date of Access: (22-Mar-10 09:55 AM)

49
Bru
ce D
. Ba
ker, 2
01
0
Per Capita Debt Across States
$0
$2,000
$4,000
$6,000
$8,000
$10,000
$12,000
1985 1990 1995 2000 2005
Year
Per C
apita
Deb
t Rea
l 200
7$
ConnecticutMassachusettsNew Jersey New York
Data Source: State & Local Government Finance Data Query System. http://www.taxpolicycenter.org/slf-dqs/pages.cfm. The Urban Institute-Brookings Institution Tax Policy Center. Data from U.S. Census Bureau, Annual Survey of State and Local Government Finances, Government Finances, Volume 4, and Census of Governments (Years). Date of Access: (22-Mar-10 09:55 AM)

50
Bru
ce D
. Ba
ker, 2
01
0
New Jersey Education Spending & New Jersey
Education Outcomes

51
Bru
ce D
. Ba
ker, 2
01
0
Alabama
Alaska
Arizona
Arkansas
California
Colorado
ConnecticutDelawareFlorida
Georgia
Idaho
Illinois
Indiana
Iowa
Kansas
Kentucky
Louisiana
Maine
Maryland
Massachusetts
Michigan
Minnesota
Mississippi
Missouri
Montana
Nebraska
Nevada
New HampshireNew Jersey
New Mexico
New YorkNorth Carolina
North DakotaOhio
OklahomaOregon
Pennsylvania
Rhode IslandSouth Carolina
South Dakota
Tennessee
Texas
Utah
Vermont
VirginiaWashington
West Virginia
Wisconsin Wyoming
230
240
250
NA
EP
Mat
h G
r 4
2007
6000 8000 10000 12000 14000 16000Pred. Basic State & Local Rev. PP
naep_m4_07_all Fitted values

52
Bru
ce D
. Ba
ker, 2
01
0
Alabama
Alaska
ArizonaArkansas
California
Colorado
ConnecticutDelaware
Florida
Georgia
Idaho
Illinois
IndianaIowa
Kansas
Kentucky
Louisiana
MaineMaryland
Massachusetts
Michigan
Minnesota
Mississippi
Missouri
Montana
Nebraska
Nevada
New HampshireNew Jersey
New Mexico
New York
North Carolina
North Dakota
Ohio
Oklahoma
Oregon
Pennsylvania
Rhode Island
South Carolina
South Dakota
Tennessee
Texas
Utah
Vermont
Virginia
Washington
West Virginia
WisconsinWyoming
260
270
280
290
300
NA
EP
Mat
h G
r 8
2007
6000 8000 10000 12000 14000 16000Pred. Basic State & Local Rev. PP
naep_m8_07_all Fitted values

53
Bru
ce D
. Ba
ker, 2
01
0
Alabama
Alaska
Arizona
Arkansas
California
Colorado
Connecticut
DelawareFlorida
Georgia
Idaho
Illinois
Indiana
IowaKansas
Kentucky
Louisiana
MaineMaryland
Massachusetts
Michigan
Minnesota
Mississippi
Missouri
Montana
Nebraska
Nevada
New HampshireNew Jersey
New Mexico
New York
North Carolina
North DakotaOhio
Oklahoma
Oregon
Pennsylvania
Rhode Island
South Carolina
South Dakota
Tennessee
TexasUtah
VermontVirginia
Washington
West Virginia
Wisconsin
Wyoming
210
220
230
240
NA
EP
Rea
d G
r 4
2007
6000 8000 10000 12000 14000 16000Pred. Basic State & Local Rev. PP
naep_r4_07_all Fitted values

54
Bru
ce D
. Ba
ker, 2
01
0
Alabama
Alaska
Arizona
Arkansas
California
ColoradoConnecticut
Delaware
FloridaGeorgia
Idaho
IllinoisIndiana
IowaKansas
Kentucky
Louisiana
Maine
Maryland
Massachusetts
Michigan
Minnesota
Mississippi
Missouri
Montana
Nebraska
Nevada
New HampshireNew Jersey
New Mexico
New York
North Carolina
North DakotaOhio
Oklahoma
Oregon
Pennsylvania
Rhode IslandSouth Carolina
South Dakota
Tennessee
Texas
Utah
Vermont
Virginia
Washington
West Virginia
Wisconsin
Wyoming
250
255
260
265
270
275
NA
EP
Rea
d G
r 8
2007
6000 8000 10000 12000 14000 16000Pred. Basic State & Local Rev. PP
naep_r8_07_all Fitted values

55
Bru
ce D
. Ba
ker, 2
01
0
Part VI
Notes on Tax and Expenditures Limits

56
Bru
ce D
. Ba
ker, 2
01
0
TELs & Student Teacher Ratios
• David N. Figlio– SHORT-TERM EFFECTS OF A 1990S-ERA PROPERTY
TAX LIMIT: PANEL EVIDENCE ON OREGON’S MEASURE 5
– National Tax Journal Vol 51 no. 1 (March 1998) pp. 55-70• I use a comprehensive panel of school districts
from Oregon and Washington, with annual data from before and after Oregon imposed its limitation in 1990. Controlling for unobserved heterogeneity, I find that Oregon student-teacher ratios have increased significantly as a result of the state’s tax limitation.

57
Bru
ce D
. Ba
ker, 2
01
0
TELs & Teacher Quality
• David N. Figlio and Kim S. Rueben– Tax limits and the qualifications of new teachers – Journal of Public Economics Volume 80, Issue 1, April 2001,
Pages 49-71• This paper examines the impact of local tax limits on new
teacher quality. Using data from the National Center for Education Statistics we find that tax limits systematically reduce the average quality of education majors, as well as new public school teachers in states that have passed these limits. The average relative test scores of education majors in tax limit states declined by ten percent as compared to the relative test scores of education majors in states that did not pass limits. This relationship is strengthened if we control for school finance equalization reforms or examine tax limits passed in two different periods.

58
Bru
ce D
. Ba
ker, 2
01
0
TELs & Student Outcomes
• Downes and Figlio working paper:
– http://ase.tufts.edu/econ/papers/9805.pdf
• In this paper, we find compelling evidence that the imposition of tax or expenditure limits on local governments in a state results in a significant reduction in mean student performance on standardized tests of mathematics skills.

59
Bru
ce D
. Ba
ker, 2
01
0
Massachusetts Prop 2 ½
• David M. Cutlera ,*, Douglas W. Elmendorfb, Richard Zeckhauserc– Restraining the Leviathan: property tax limitation in Massachusetts
– Journal of Public Economics 71 (1999) 313–334
• Proposition 2 ½, a ballot initiative passed in Massachusetts in 1980, sharply reduced local property taxes. We examine why voters supported Proposition 2 ½, using data on votes for the Proposition and for overrides of it a decade later. We find two reasons for the Proposition’s support: people perceived agency losses from the difficulty of monitoring government, and people judged government to be inefficient because their tax burden was high. By the 1990s, people either regretted the severity of the Proposition’s constraints or felt that its mission was accomplished.

60
Bru
ce D
. Ba
ker, 2
01
0
Massachusetts Prop 2 ½• Phil Oliff and Iris J. Lav • HIDDEN CONSEQUENCES: LESSONS FROM MASSACHUSETTS FOR STATES
CONSIDERING A PROPERTY TAX CAP– http://www.cbpp.org/archiveSite/5-21-08sfp.pdf
• A tax cap won’t make government services cost less. A cap does not prevent employee health insurance costs, special education costs, or other costs beyond localities’ control from rising much faster than the cap allows. Nor does it hold down the cost of heating buildings, buying gas for police and fire vehicles, and operating schools buses when the world price of oil is skyrocketing. When these things occur, as they have in Massachusetts, other services have to be cut to fit total expenditures under the cap.
• Claims that caps will produce large savings through “efficiencies” are overblown. There are fewer efficiencies to realize from squeezing down revenues than cap proponents generally suggest. One person’s “efficiency savings,” such as the elimination of a police or fire station, may represent the loss of a critical service for another person. Ultimately, a property tax cap is highly likely to lead to reductions in basic community services and a deterioration in the quality of life in many communities — particularly in communities that cannot routinely override it.

61
Bru
ce D
. Ba
ker, 2
01
0
Massachusetts Prop 2 ½• Phil Oliff and Iris J. Lav • HIDDEN CONSEQUENCES: LESSONS FROM MASSACHUSETTS FOR STATES
CONSIDERING A PROPERTY TAX CAP– http://www.cbpp.org/archiveSite/5-21-08sfp.pdf
• Tax caps can be particularly harmful if adopted during a weak economy. Proposition 2½ took effect during a period of extraordinary economic growth — the “Massachusetts Miracle.” State revenues were rising, which allowed the state to boost aid to compensate for constrained property taxes, and construction was expanding, which allowed communities to raise their property tax revenue by more than 2.5 percent per year. If a state were to adopt a property tax cap during an economic slowdown or a period of weak state revenue growth, a major sustained infusion of state aid would not be possible and property tax revenue growth would be more constrained. As a result, schools and other services dependent on the property tax would have to be cut much more severely than in Massachusetts.
• State aid can’t be relied upon to fill the gap. Even when state policymakers fully intend to expand state aid to fill local funding gaps created by a cap, a recession or fiscal crisis will usually derail this plan. State aid to localities in Massachusetts has fluctuated greatly with the business cycle and with state policy decisions. In any other state that might implement a cap, local government and school budgets are likely to become more volatile.

62
Bru
ce D
. Ba
ker, 2
01
0
Massachusetts Prop 2 ½• Phil Oliff and Iris J. Lav • HIDDEN CONSEQUENCES: LESSONS FROM MASSACHUSETTS FOR STATES CONSIDERING A
PROPERTY TAX CAP– http://www.cbpp.org/archiveSite/5-21-08sfp.pdf
• Changes in school enrollment can have a big impact. The adoption of Proposition 2 ½ coincided with a decline in Massachusetts’ K-12 enrollment, allowing schools to operate with less revenue. If another state adopted a property tax cap during a period of steady or rising enrollment, it would be forced to impose much more extensive cutbacks in teachers, classes, and programs than those seen in Massachusetts.
• Without effectively targeted state aid, low-income communities will fall even further behind. Massachusetts has a highly targeted system of aiding local governments. The influx of state aid seems to have shielded low-income communities somewhat from Proposition 2 ½’s tendency to exacerbate differences in services between high- and low-income communities. But when state aid has receded as a result of economic downturns or state policy decisions, the poorest communities have had to make the largest budget cuts. In states that do not have a system of school aid that is targeted as effectively as Massachusetts’, students in low-income communities are likely to fall increasingly behind students in schools that have greater resources.
• Wealthier communities will override a tax cap more frequently than poorer ones. This has contributed to a growing spending gap between local governments in high-income communities and all other communities, despite Massachusetts’ progressive system of state aid. This is likely to occur in other states that implement a cap.
![Bruce Baker Et Al. [Elc] 2012_is School Funding Fair, A National Report Card [Second Edition]](https://img.dokumen.tips/doc/110x75/577d1cff1a28ab4e1e8b63c7/bruce-baker-et-al-elc-2012is-school-funding-fair-a-national-report-card.jpg)