Embed Size (px)
Citation preview
Taxation of Housing in Belgium Facts and reforms
Christian VALENDUCGeert VAN REYBROUCKFederal Ministry of Finance, Studies department
Taxation of housing in BelgiumFacts: how do we tax property in Belgium ?
The marketThe basics of housing taxationMain trends and components of the ETR
ReformsRegional reforms in registration dutiesProperty tax and valuationThe 2005 reform of PIT Tax incentives
Facts The market
rather static, low turnoverwidespread commutingprice increases since 2004 but no boom/bust
high share of owner occupied housingrisk avoiding, low Loan to Value ratio, few 2nd mortgagesrather renovating than moving
dual rental sector: social & privatesocial sector: income related rentals, demand > offerrather strict private rent regulation (main residence)
mandatory energy certificatetransparent rental pricesmandatory registration of rental agreementstrict indexation proceduresbut few rental subsidies
Facts: how do we tax property? Owner occupied housing
Bold : FederalTransaction taxes (Registration duties or VAT)Property taxes (Region+Provinces+municipalities)No taxation of the imputed income
Up to 2005, property tax credit on PIT, up to 12,5% of the indexed imputed income
Tax incentives, up to 2005No effective mortgage interest deduction, except for new and owner occupied residential property Tax credit for mortgage repayments, up to a ceiling
Tax incentives, from to 2005Allowances for mortgage interest and repayments, up to (per spouse) 2120 € + 710 € for the 10 first yearsNo distinction existing – new residential property« Old rules » remains for ongoing contracts, but refinancing mortgages qualified for the new rules
Facts An ETR for owner occupied housing
ETR = (Rg-Rn)/(Rg-π)Rg = gross nominal return (8% of the value of the property)Rn = net nominal returnΠ = inflation rate
(Rg-Rn) Includes(a) Taxation of the acquisition(b) Net Property tax(c) NPV of tax credits and allowancesInfinite horizon: (a) and (c) are transformed into a yearly tax or subsidy (lower bound, due to the infinite horizon)
How do we tax property? An ETR for owner occupied housing
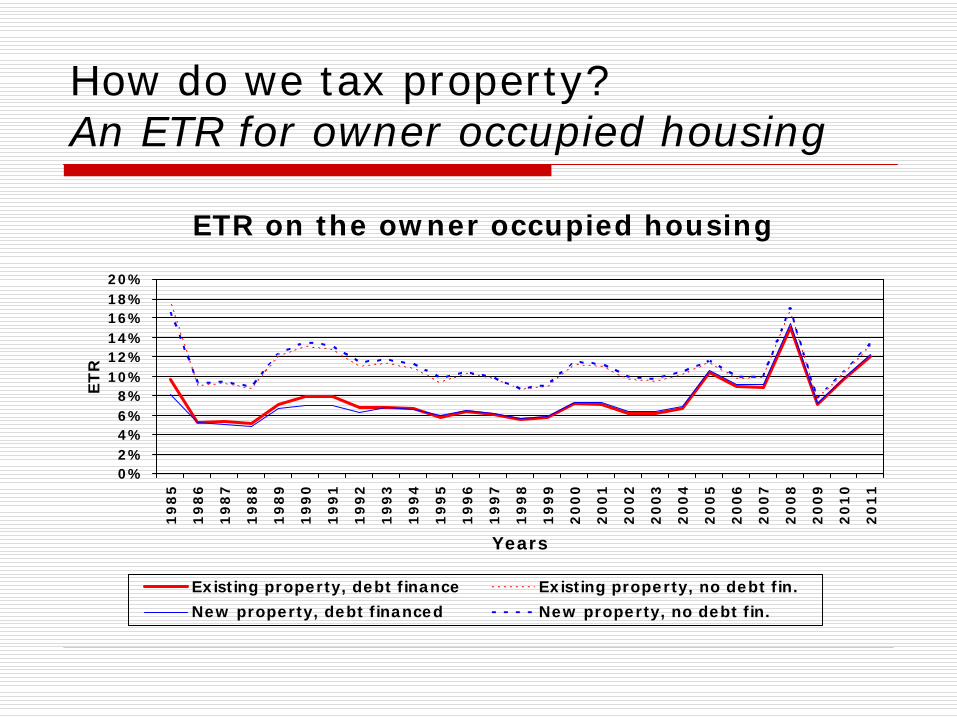
ETR on the owner occupied housing
0%2%4%6%8%
10%12%14%16%18%20%
19
85
19
86
19
87
19
88
19
89
19
90
19
91
19
92
19
93
19
94
19
95
19
96
19
97
19
98
19
99
20
00
20
01
20
02
20
03
20
04
20
05
20
06
20
07
20
08
20
09
20
10
20
11
Years
ET
R
Existing property, debt finance Existing property, no debt fin.New property, debt financed New property, no debt fin.
How do we tax property? An ETR for owner occupied housing
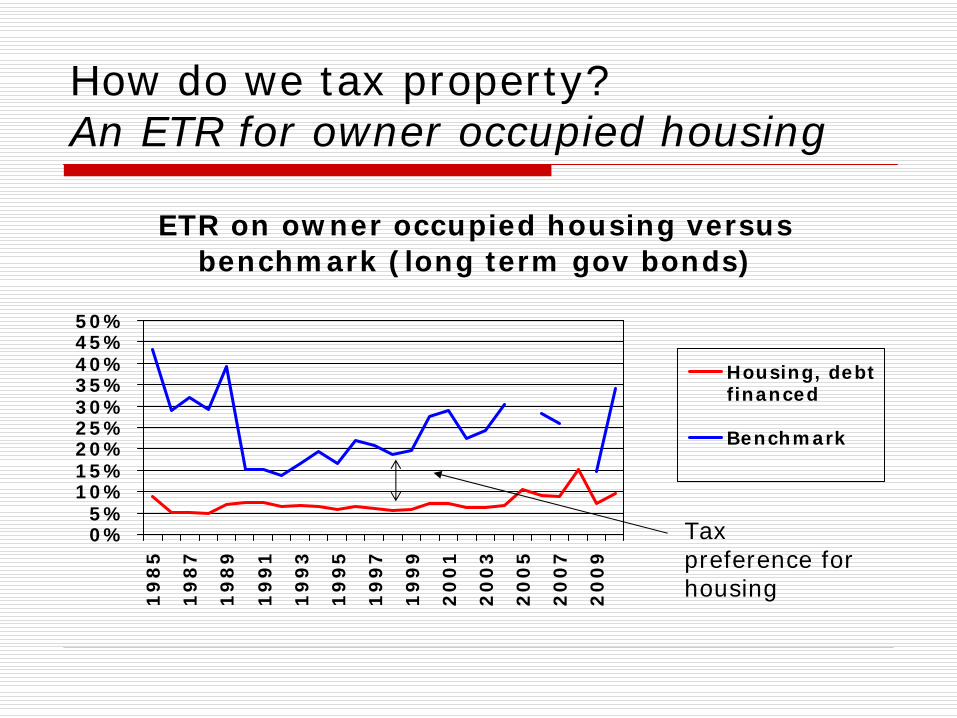
ETR on owner occupied housing versus benchmark (long term gov bonds)
0%5%
10%15%20%25%30%35%40%45%50%
19
85
19
87
19
89
19
91
19
93
19
95
19
97
19
99
20
01
20
03
20
05
20
07
20
09
Housing, debtfinanced
Benchmark
Tax preference for housing
How do we tax property? An ETR for owner occupied housing
Main lessonsFrom the methodology: ETR highly sensitive to inflation and interest ratesIn any case, a clear tax privilege compared to the benchmarkAdditional tax support in the case of mortgageThe specific tax privilege for construction has disappeared over time
Reforms Registration duties (Flanders)
Rate cutup to 2002: 12.5% and 6%since 2002: 10% and 5%
Reduced ratedepends mainly on cadastral revenue (CI)rationale: equity
enhancing accessibility of home ownershipCI is a poor benchmark - how to turn into “house reduction”?
depending upon revenue buyerdepending upon surface area house + garden
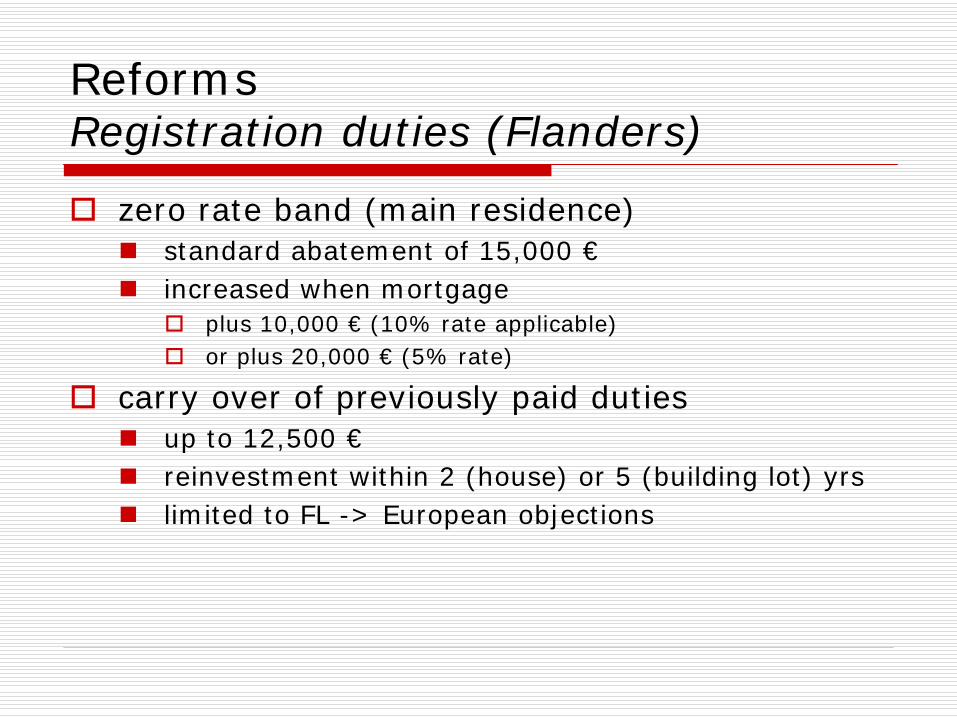
Reforms Registration duties (Flanders)
zero rate band (main residence)standard abatement of 15,000 €increased when mortgage
plus 10,000 € (10% rate applicable)or plus 20,000 € (5% rate)
carry over of previously paid duties up to 12,500 €reinvestment within 2 (house) or 5 (building lot) yrs limited to FL -> European objections
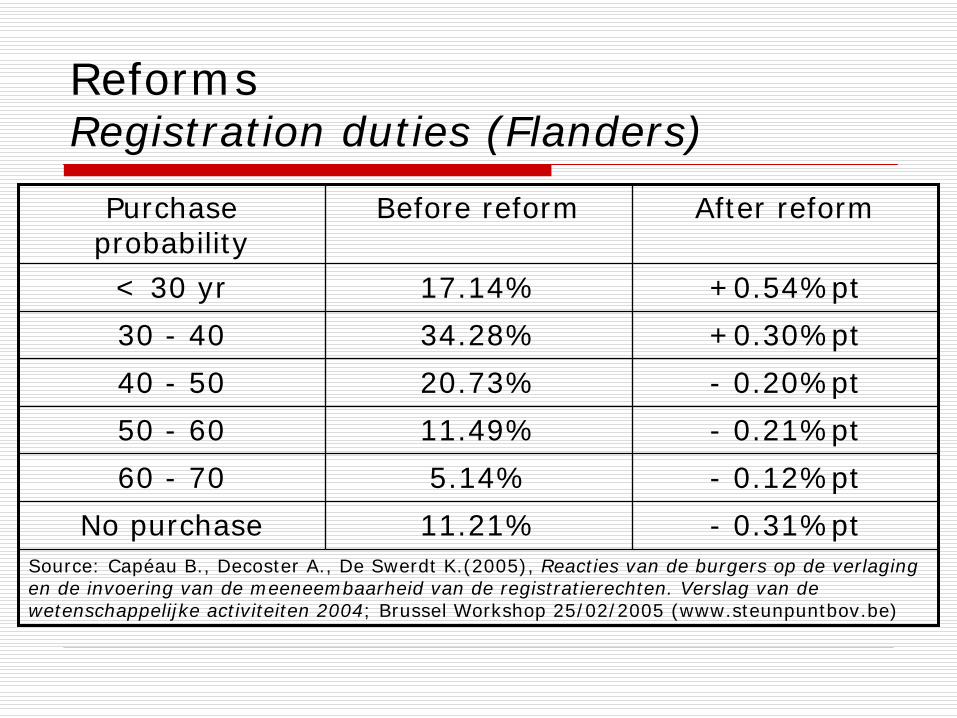
Reforms Registration duties (Flanders)
Purchase probability
Before reform After reform
< 30 yr 17.14% +0.54%pt30 - 40 34.28% +0.30%pt40 - 50 20.73% - 0.20%pt50 - 60 11.49% - 0.21%pt60 - 70 5.14% - 0.12%pt
No purchase 11.21% - 0.31%ptSource: Capéau B., Decoster A., De Swerdt K.(2005), Reacties van de burgers op de verlaging en de invoering van de meeneembaarheid van de registratierechten. Verslag van de wetenschappelijke activiteiten 2004; Brussel Workshop 25/02/2005 (www.steunpuntbov.be)
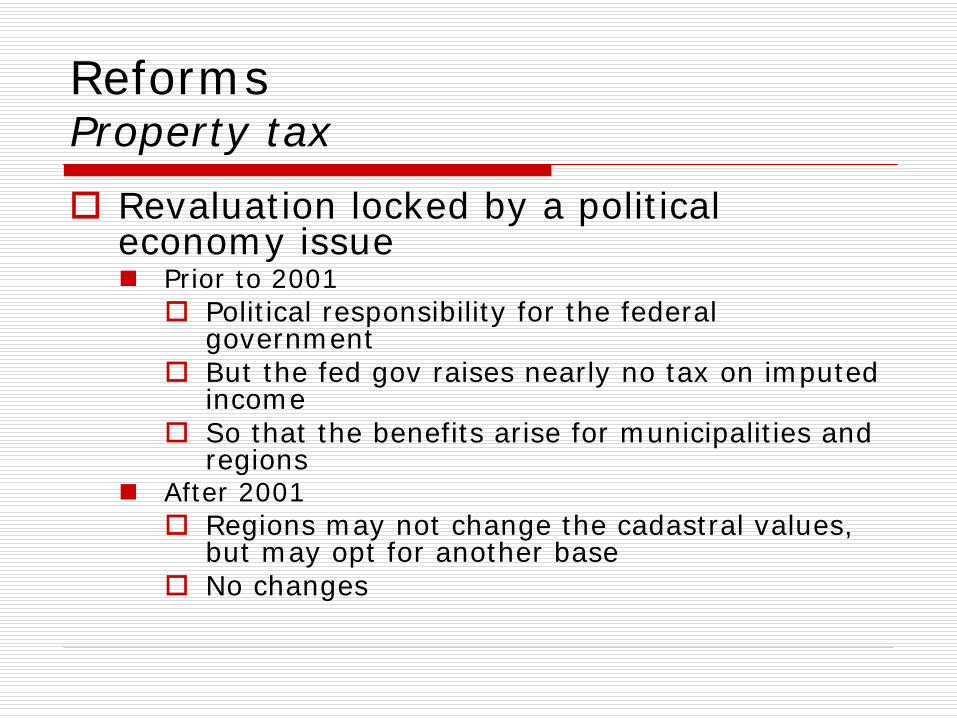
Reforms Property tax
Revaluation locked by a political economy issue
Prior to 2001Political responsibility for the federal governmentBut the fed gov raises nearly no tax on imputed incomeSo that the benefits arise for municipalities and regions
After 2001Regions may not change the cadastral values, but may opt for another baseNo changes
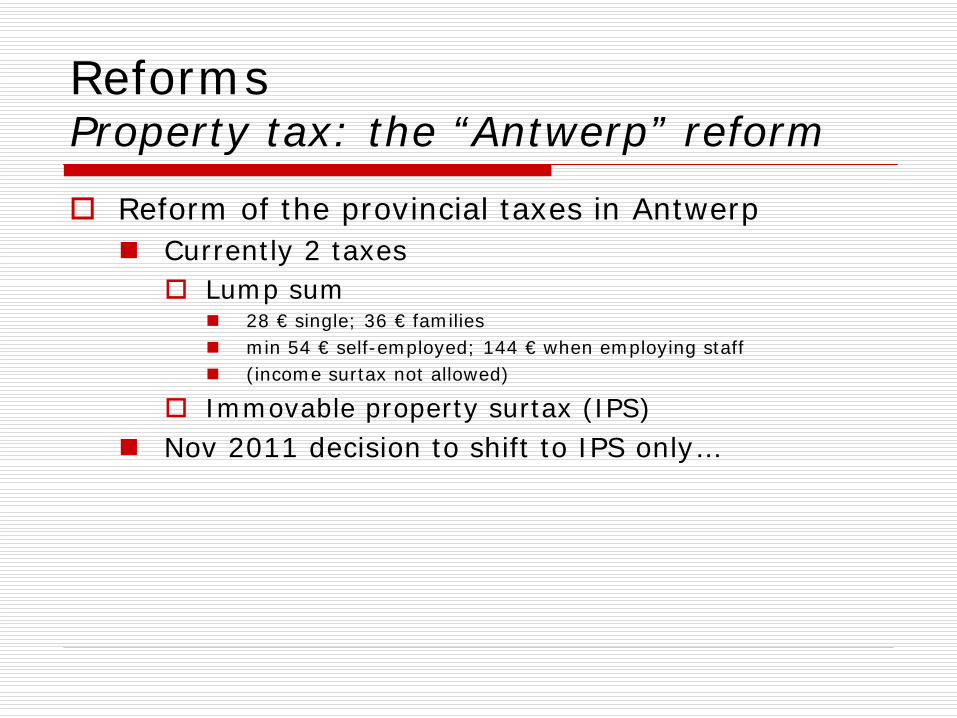
Reforms Property tax: the “Antwerp” reform
Reform of the provincial taxes in AntwerpCurrently 2 taxes
Lump sum 28 € single; 36 € familiesmin 54 € self-employed; 144 € when employing staff(income surtax not allowed)
Immovable property surtax (IPS)Nov 2011 decision to shift to IPS only…
Reforms Property tax: the “Antwerp” reform
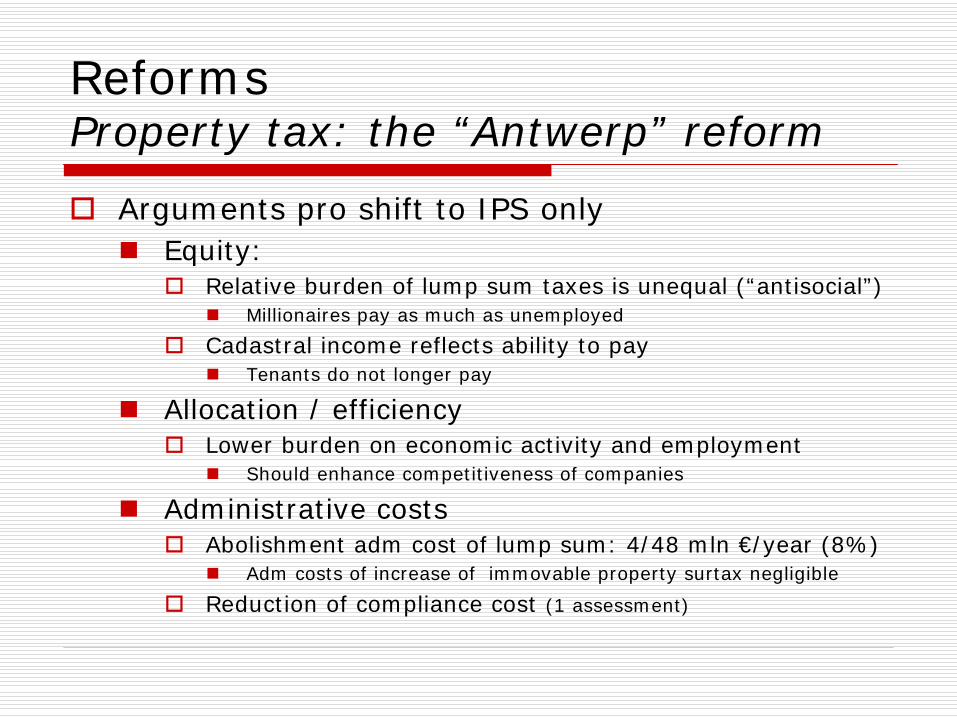
Arguments pro shift to IPS onlyEquity:
Relative burden of lump sum taxes is unequal (“antisocial”)Millionaires pay as much as unemployed
Cadastral income reflects ability to payTenants do not longer pay
Allocation / efficiency Lower burden on economic activity and employment
Should enhance competitiveness of companies
Administrative costs Abolishment adm cost of lump sum: 4/48 mln €/year (8%)
Adm costs of increase of immovable property surtax negligible
Reduction of compliance cost (1 assessment)
Reforms Property tax: the “Antwerp” reform
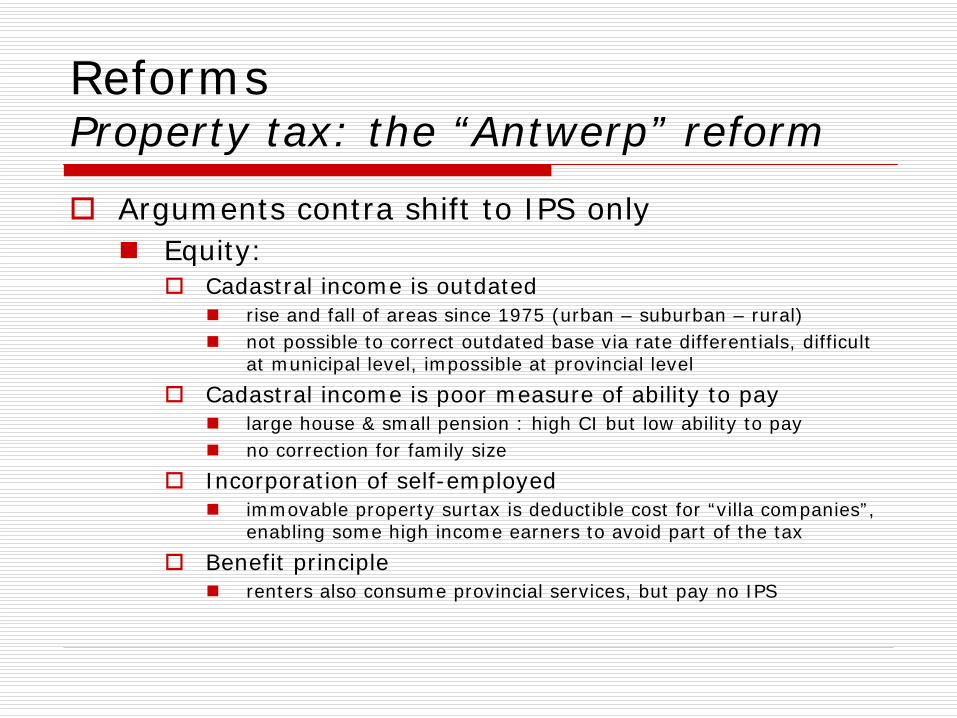
Arguments contra shift to IPS onlyEquity:
Cadastral income is outdatedrise and fall of areas since 1975 (urban – suburban – rural)not possible to correct outdated base via rate differentials, difficult at municipal level, impossible at provincial level
Cadastral income is poor measure of ability to paylarge house & small pension : high CI but low ability to payno correction for family size
Incorporation of self-employedimmovable property surtax is deductible cost for “villa companies”, enabling some high income earners to avoid part of the tax
Benefit principlerenters also consume provincial services, but pay no IPS
Reforms The 2005 Federal reform
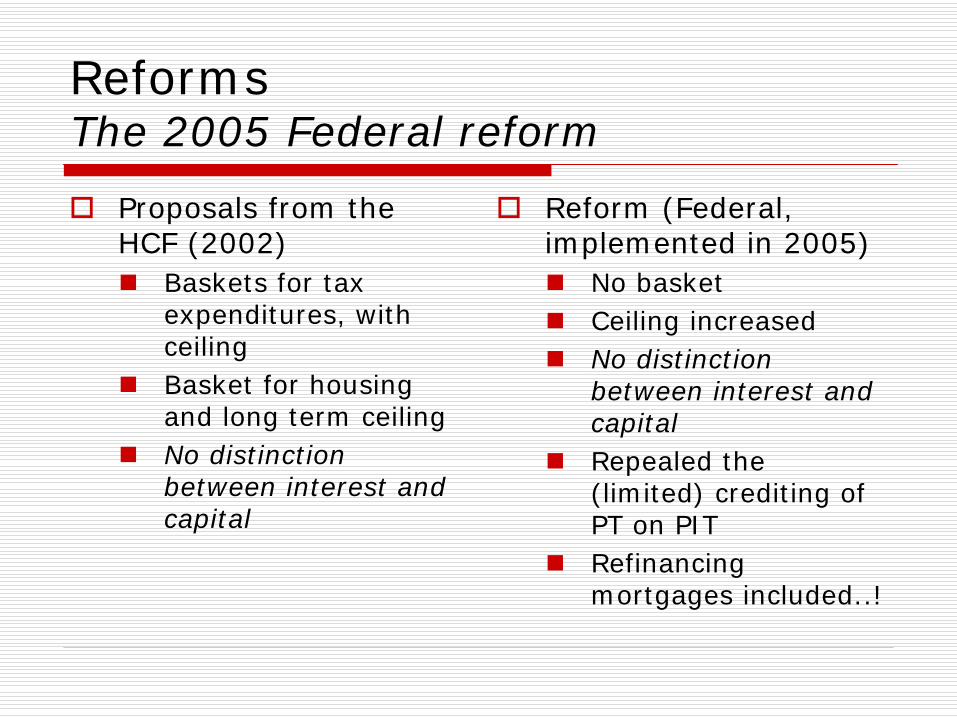
Proposals from the HCF (2002)
Baskets for tax expenditures, with ceilingBasket for housing and long term ceilingNo distinction between interest and capital
Reform (Federal, implemented in 2005)
No basketCeiling increasedNo distinction between interest and capitalRepealed the (limited) crediting of PT on PITRefinancing mortgages included..!
Reforms The 2005 Federal reform
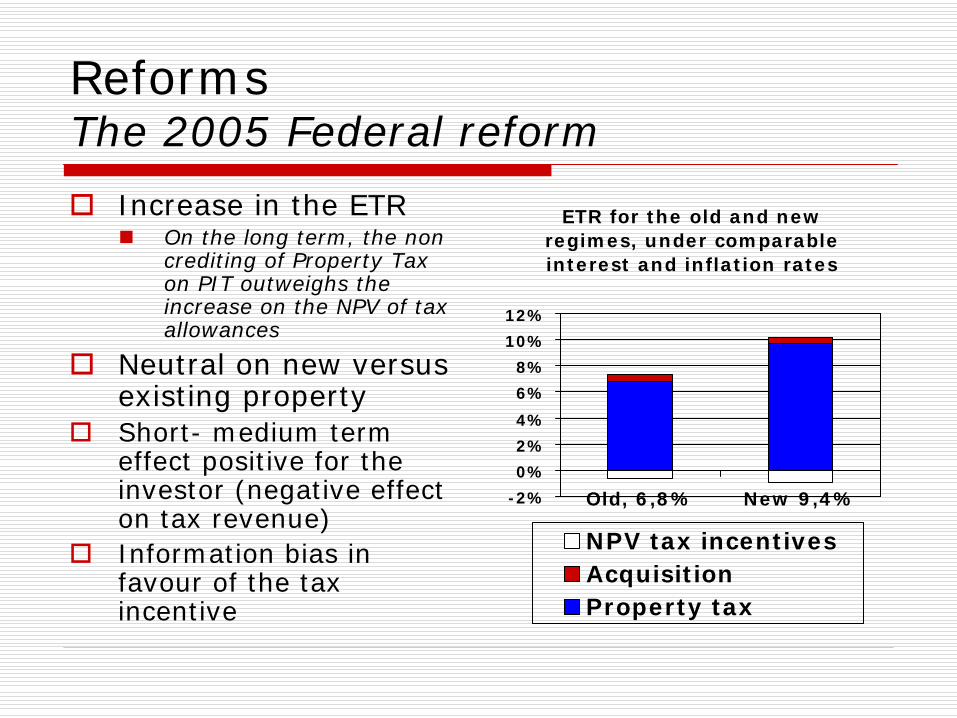
Increase in the ETROn the long term, the non crediting of Property Tax on PIT outweighs the increase on the NPV of tax allowances
Neutral on new versus existing propertyShort- medium term effect positive for the investor (negative effect on tax revenue)Information bias in favour of the tax incentive
ETR for the old and new regimes, under comparable interest and inflation rates
-2%0%2%4%
6%8%
10%12%
Old, 6,8% New 9,4%
NPV tax incentivesAcquisitionProperty tax
Reforms The 2005 Federal reform
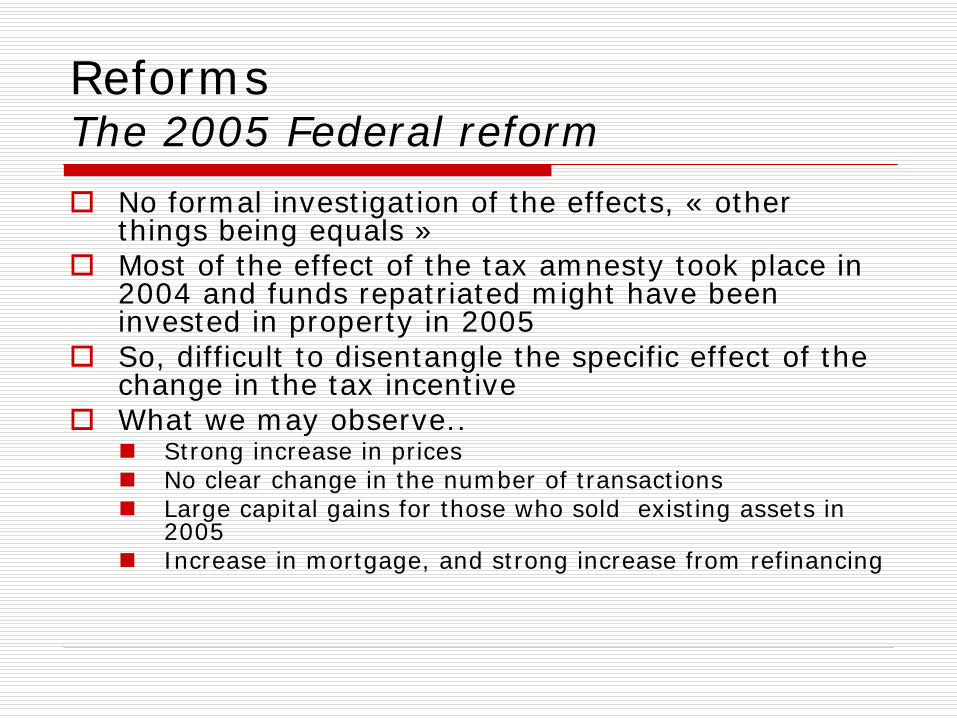
No formal investigation of the effects, « other things being equals »Most of the effect of the tax amnesty took place in 2004 and funds repatriated might have been invested in property in 2005So, difficult to disentangle the specific effect of the change in the tax incentiveWhat we may observe..
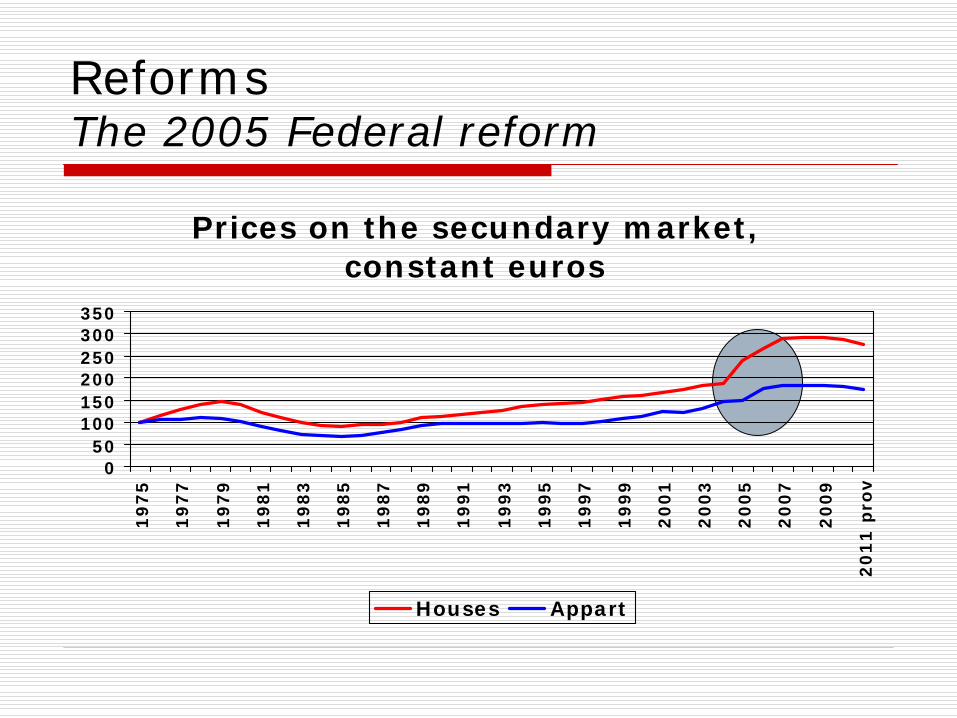
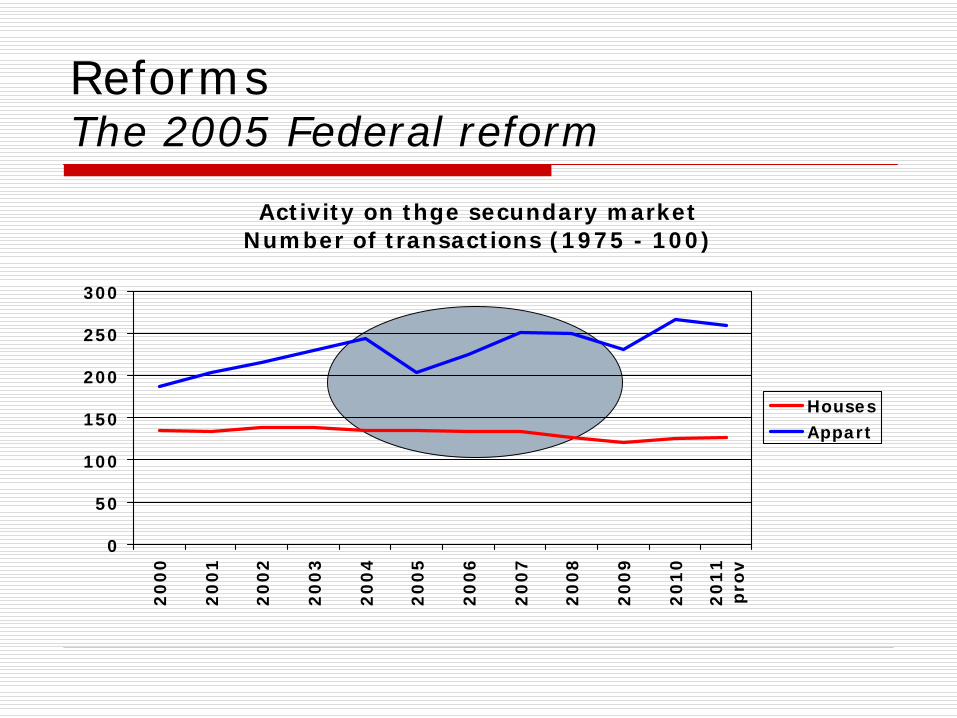
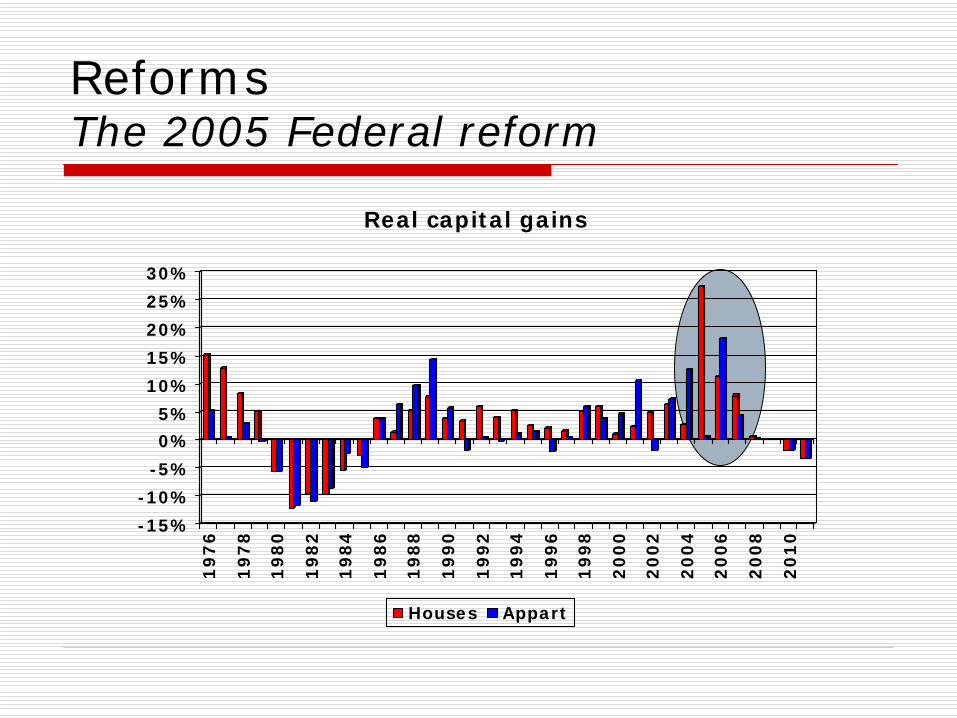
Strong increase in pricesNo clear change in the number of transactionsLarge capital gains for those who sold existing assets in 2005Increase in mortgage, and strong increase from refinancing
Reforms The 2005 Federal reform
Prices on the secundary market, constant euros
050
100150200250300350
19
75
19
77
19
79
19
81
19
83
19
85
19
87
19
89
19
91
19
93
19
95
19
97
19
99
20
01
20
03
20
05
20
07
20
09
20
11
pro
v
Houses Appart
Reforms The 2005 Federal reform
Activity on thge secundary marketNumber of transactions (1975 - 100)
0
50
100
150
200
250
300
20
00
20
01
20
02
20
03
20
04
20
05
20
06
20
07
20
08
20
09
20
10
20
11
pro
v
HousesAppart
Reforms The 2005 Federal reform
-15%-10%
-5%0%5%
10%15%20%25%30%
19
76
19
78
19
80
19
82
19
84
19
86
19
88
19
90
19
92
19
94
19
96
19
98
20
00
20
02
20
04
20
06
20
08
20
10
Real capital gains
Houses Appart

Reforms The 2005 Federal reform
-80%-60%-40%-20%
0%20%40%60%80%
19
96
19
97
19
98
19
99
20
00
20
01
20
02
20
03
20
04
20
05
20
06
20
07
20
08
20
09
20
10
Number of new mortgages Annual growth rate
New inv. refinancing
Reforms The 2005 Federal reform
More broadly, on tax incentives They should to improve access to “a decent house”But the way they work does not fit with the policy rationale
Owner-occupied housing versus tenantsBenefits unevenly distributedDo not increase supply for low income earners, what they should do from the theoretical perspectiveThey seems to be capitalised into prices (do not benefit entrants)