Embed Size (px)
Citation preview
Tax Policy Choices and New York City’s Competitive PositionDonald Boyd - [email protected]
1
The Most Important Economic and Fiscal Decisions Facing the Next MayorA Citizens Budget Commission ConferenceDecember 6, 2013

Outline
• NYC taxes: high, rising• How easy is it to leave NYC taxes behind?• Impact of PIT options• Disparities between NYC commercial property
tax rates and competitive locations• Conclusions
2
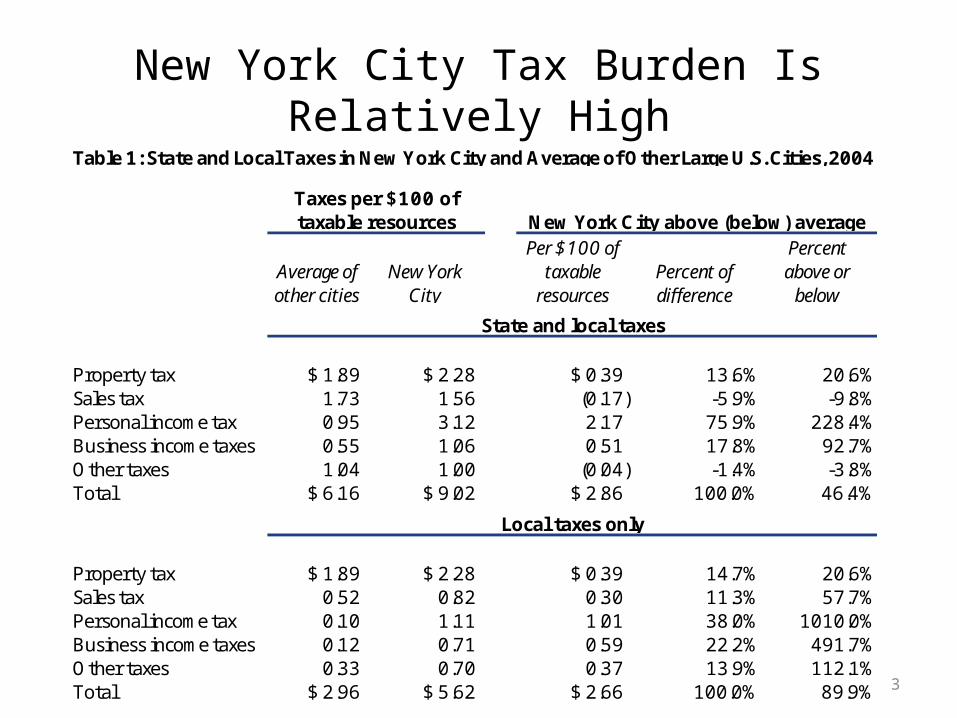
New York City Tax Burden Is Relatively High
3
Average of other cities
New York City
Per $100 of taxable
resourcesPercent of difference
Percent above or below
Property tax $ 1.89 $ 2.28 $ 0.39 13.6% 20.6%Sales tax 1.73 1.56 (0.17) -5.9% -9.8%Personal income tax 0.95 3.12 2.17 75.9% 228.4%Business income taxes 0.55 1.06 0.51 17.8% 92.7%Other taxes 1.04 1.00 (0.04) -1.4% -3.8%Total $ 6.16 $ 9.02 $ 2.86 100.0% 46.4%
Property tax $ 1.89 $ 2.28 $ 0.39 14.7% 20.6%Sales tax 0.52 0.82 0.30 11.3% 57.7%Personal income tax 0.10 1.11 1.01 38.0% 1010.0%Business income taxes 0.12 0.71 0.59 22.2% 491.7%Other taxes 0.33 0.70 0.37 13.9% 112.1%Total $ 2.96 $ 5.62 $ 2.66 100.0% 89.9%
Table 1: State and Local Taxes in New York City and Average of Other Large U.S. Cities, 2004
Taxes per $100 of taxable resources New York City above (below) average
State and local taxes
Local taxes only

Taxes on Upper Income Households Long Among Highest in Nation
4
$25,000 $150,000 $25,000 $150,000 $25,000 $150,000
1997 20 1 NA NA 19 3
1999 23 1 NA NA 21 4
2001 15 1 28 28 25 5
2003 42 1 18 18 23 2
2005 35 1 13 16 22 2
2007 41 1 18 16 NA NA
2009 40 1 15 13 16 2
2011 40 1 16 18 16 3
Total taxesSales taxPersonal income tax
Table 5: Ranking of New York City State and Local Taxes Among 51 Cities, by Income Levels, Selected Years
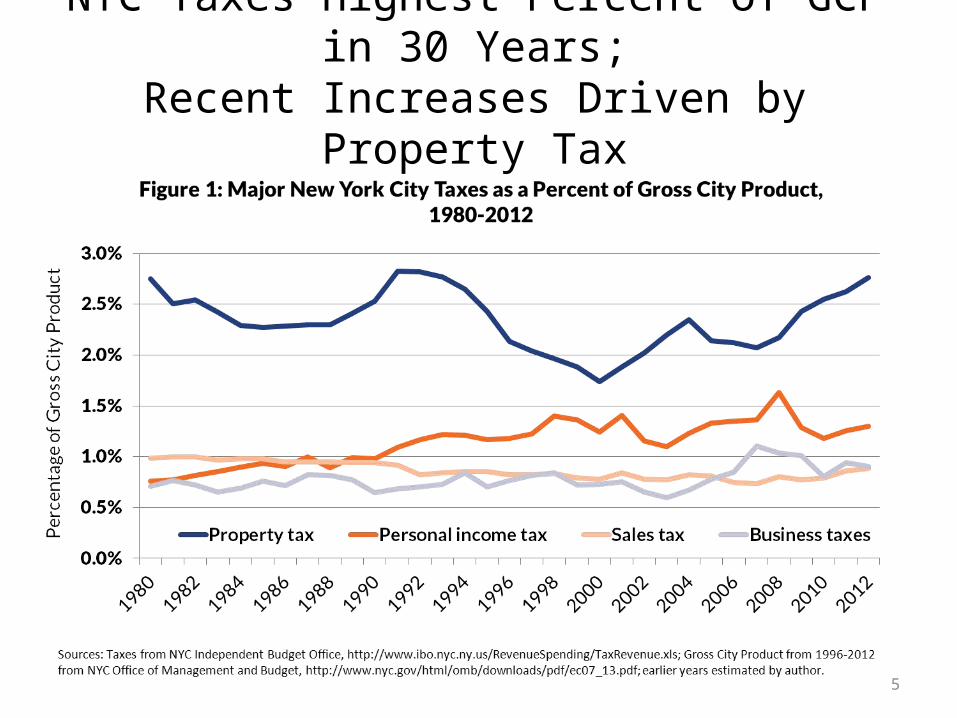
NYC Taxes Highest Percent of GCP in 30 Years;Recent Increases Driven by Property Tax
5

How Easy is it to Leave NYC Taxes Behind?
• Outmigration• Commuting• Research on– Intraregional responses to taxes– Millionaire taxes
6

Outmigration of High-Income NYC Individuals More Common than in Neighboring Areas
7
NewYork City
New York City suburbs
Connecticut(Fairfield County)
New Jersey commuting counties
Income ($000)
Up to $100 3.6% 3.8% 5.8% 4.7%
$100-400 4.0% 1.6% 3.1% 3.0%
$400+ 3.5% 1.1% 2.4% 3.1%Total 3.6% 3.5% 5.3% 4.5%
Table 7: Regional Outmigration as a Percent of Residents by County of Origin, 2007-2011
Note: New York City suburbs are Nassau, Suffolk, Westchester and Rockland counties. New Jersey commuting counties are Bergen, Essex, Hudson, Middlesex and Monmouth counties.
Source: Author's analysis of U.S. Census Bureau, American Community Survey, 2007-2011 Five-Year Public Use Microdata.

Commuting More Common among Higher-Wage NYC Earners than Lower-Wage Earners
8
Wages ($000) Commuters Residents Total
Commuters as a percent of total
Up to $50 305.3 2,194.8 2,500.1 12.2%
$50-75 183.3 547.3 730.6 25.1%
$75-100 145.3 260.0 405.3 35.8%
$100-250 224.9 282.4 507.3 44.3%
$250-400 24.3 23.8 48.0 50.6%
Above $400 38.6 41.9 80.5 48.0%
Total 921.7 3,350.1 4,271.8 21.6%
Table 8: New York City Workers by Commuter Status and Wage Level, 2007-2011
Number of Workers (in thousands)
Source: Author's analysis of U.S. Census Bureau, American Community Survey, 2007-2011 Five-Year Public Use Microdata.

Impact of PIT Increases
• Examined two options:– 10% surcharge– 0.75% increase in top rate on income above
$500k (from 3.876% to 4.626%)
• Within the bounds of past changes; similar in magnitude (surcharge somewhat greater)
9
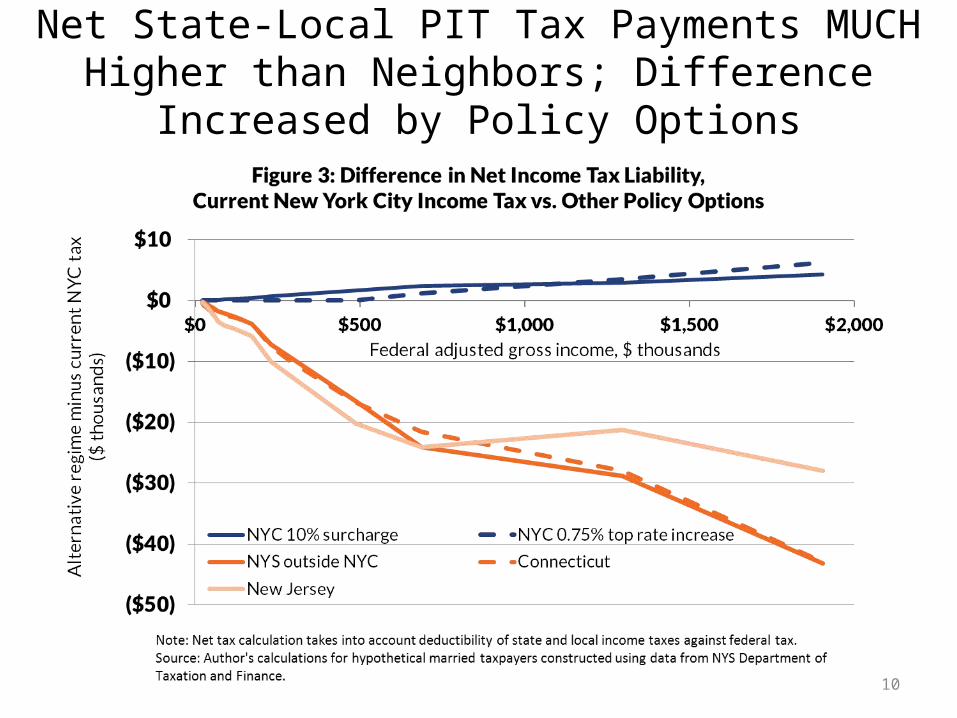
Net State-Local PIT Tax Payments MUCH Higher than Neighbors; Difference Increased by Policy Options
10

NYC Property Tax Much Higher than Nearby Jurisdictions
11
Jurisdiction TaxTax Rate
New York City % above (below)
Nearby jurisdictions:Mineola $ 1,450 4.83% (33.5%)New York City 964 3.21 White Plains 813 2.71 18.6%J ersey City 563 1.88 71.2%Stamford 505 1.68 90.9%Hoboken 368 1.23 161.8%Average of nearby jurisdictions, excluding NYC $ 740 2.47% 30.3%
Average of largest 15 cities, excluding NYC
$ 646 2.12% 51.3%
Table 10: Property Tax on $25 Million Commercial Property, Selected Locations, 2012 (dollars in thousands)
Source: Minnesota Center for Fiscal Excellence and Lincoln Institute for Land Policy, 50-State Property Tax Comparison Study , 2012, and author's analysis.
Notes: Estimates for Mineola, White Plains, Jersey City, Stamford, and Hoboken developed by the author using methodology of the Minnesota/Lincoln Institute study.
Conclusions• NYC tax levels extremely high relative to neighbors,
particularly for PIT and commercial property tax
• Intraregional competition carries greater risks of economic impacts than longer-distance competition– Millionaire migration studies show relatively small impacts, but NYC
differentials much greater than in those studies– Higher income individuals in NYC relatively more likely to migrate than
in neighboring areas. Higher wage workers more likely to commute to NYC than lower wage workers
• PIT increases examined would exacerbate existing differentials• Differential between NYC property tax and some competitors
is large• Caution advisable when considering increased taxes in areas
where NYC is already an outlier12


![DAFTAR ACUAN - OPAClib.ui.ac.id/file?file=digital/125019-R210822-Simulasi kelayakan-Bibliografi.pdf[12] Donald S. Barrie, Boyd C. Paulson JR Terj Sudinarto, Manajemen Konstruksi Profesional](https://img.dokumen.tips/doc/110x75/6124757814d095070564555e/daftar-acuan-kelayakan-bibliografipdf-12-donald-s-barrie-boyd-c-paulson.jpg)