Embed Size (px)
Citation preview

MITSUBISHI ELECTRIC RESEARCH LABORATORIEShttp://www.merl.com
Tangible Interaction + Graphical Interpretation: A NewApproach to 3D Modeling
David Anderson, James L. Frankel, Joe Marks, Aseem Agarwala, Paul Beardsley, Jessica Hodgins,Darren Leigh, Kathy Ryall, Eddie Sullivan, Jonathan S. Yedidia
TR2000-13 April 2000
AbstractConstruction toys are a superb medium for creating geometric models. We argue thatsuch toys, suitably instrumented or sensed, could be the inspiration for a new generationof easy-to-use, tangible modeling systems—especially if the tangible modeling is combinedwith graphical-interpretation techniques for enhancing nascent models automatically. Thethree key technologies needed to realize this idea are embedded computation, vision-basedacquisition, and graphical interpretation. We sample these technologies in the context of twonovel modeling systems: physical building blocks that self-describe, interpret, and decoratethe structures into which they are assembled; and a system for scanning, interpreting, andanimating clay figures.
Proceedings of SIGGRAPH 2000
This work may not be copied or reproduced in whole or in part for any commercial purpose. Permission to copy inwhole or in part without payment of fee is granted for nonprofit educational and research purposes provided that allsuch whole or partial copies include the following: a notice that such copying is by permission of Mitsubishi ElectricResearch Laboratories, Inc.; an acknowledgment of the authors and individual contributions to the work; and allapplicable portions of the copyright notice. Copying, reproduction, or republishing for any other purpose shall requirea license with payment of fee to Mitsubishi Electric Research Laboratories, Inc. All rights reserved.
Copyright c© Mitsubishi Electric Research Laboratories, Inc., 2000201 Broadway, Cambridge, Massachusetts 02139

MERL – A MITSUBISHI ELECTRIC RESEARCH LABORATORY
http://www.merl.com
Tangible Interaction + Graphical Interpretation:
A New Approach to 3D Modeling
David Anderson, James L. Frankel, Joe Marks,
Aseem Agarwala, Paul Beardsley, Jessica Hodgins, Darren Leigh,
Kathy Ryall, Eddie Sullivan, Jonathan S. Yedidia
TR-2000-13 April 2000
Abstract
Construction toys are a superb medium for creating geometric models. We argue that
such toys, suitably instrumented or sensed, could be the inspiration for a new gen-
eration of easy-to-use, tangible modeling systems—especially if the tangible model-
ing is combined with graphical-interpretation techniques for enhancing nascent models
automatically. The three key technologies needed to realize this idea are embedded
computation, vision-based acquisition, and graphical interpretation. We sample these
technologies in the context of two novel modeling systems: physical building blocks
that self-describe, interpret, and decorate the structures into which they are assembled;
and a system for scanning, interpreting, and animating clay figures.
In Proceedings of SIGGRAPH 2000, July 23-28, 2000. New Orleans, Louisiana, USA.
This work may not be copied or reproduced in whole or in part for any commercial purpose. Permission to copy in
whole or in part without payment of fee is granted for nonprofit educational and research purposes provided that all
such whole or partial copies include the following: a notice that such copying is by permission of Mitsubishi Electric
Information Technology Center America; an acknowledgment of the authors and individual contributions to the work;
and all applicable portions of the copyright notice. Copying, reproduction, or republishing for any other purpose shall
require a license with payment of fee to Mitsubishi Electric Information Technology Center America. All rights reserved.
Copyright c Mitsubishi Electric Information Technology Center America, 2000
201 Broadway, Cambridge, Massachusetts 02139

Submitted January 2000, revised and released April 2000.

Tangible Interaction + Graphical Interpretation:
A New Approach to 3D Modeling
David Anderson , James L. Frankel !, Joe Marks ,
Aseem Agarwala , Paul Beardsley , Jessica Hodgins", Darren Leigh ,
Kathy Ryall#, Eddie Sullivan , Jonathan S. Yedidia
—————————— MERL—Mitsubishi Electric Research Laboratory "Georgia Institute of Technology
#University of Virginia !Frankel and Associates, Inc.
Contact: [email protected]
Abstract
Construction toys are a superb medium for creating geometric mod-els. We argue that such toys, suitably instrumented or sensed,could be the inspiration for a new generation of easy-to-use, tan-gible modeling systems—especially if the tangible modeling iscombined with graphical-interpretation techniques for enhancingnascent models automatically. The three key technologies neededto realize this idea are embedded computation, vision-based acqui-sition, and graphical interpretation. We sample these technologiesin the context of two novel modeling systems: physical buildingblocks that self-describe, interpret, and decorate the structures intowhich they are assembled; and a system for scanning, interpreting,and animating clay figures.
CR Categories: I.3.6 [Computer Graphics]: Methodology andTechniques—interaction techniques.
Keywords: Applications, Geometric Modeling, Graphics Sys-tems, HCI (Human-Computer Interface), Shape Recognition, UserInterface Hardware.
Additional Keywords: Embedded Computation, Tangible User In-terfaces, Perceptual User Interfaces, Transmedia.
1 Introduction
Artists using standard 3D modeling packages must specify pre-cisely the geometric and material properties of the models theycreate, and therein lies much of the complexity and tedium of us-ing those tools. By contrast, children playing with constructiontoys like LegoTM and K’nexTM make simple models easily, and usetheir imaginations to fill in the details. We would like to transformcomputer-based geometric modeling into that same kind of play-ful, tactile experience but without sacrificing the ability to createthe interesting geometric detail and movement that make 3D graph-ics and animation compelling. To retain the tactile experience ofmodel manipulation, we look to tangible-interface technology; andto create detailed, fully realized models, we use new methods forgraphically interpreting a nascent model by recognizing and aug-menting its salient features.
This combination of tangible interaction and graphical interpre-tation is investigated in a pair of case studies. Tangible modelingcan be approached in two ways: either by directly instrumentingthe modeling medium with embedded computation or by using ex-ternal sensors to capture the geometry. Our first system consists ofcomputational building blocks assembled into physical structuresthat in their aggregate determine and communicate their own geo-metric arrangement. A rule-based system interprets these structuresas buildings, parses their architectural features, then adds geometricdetail and decorative enhancements (Figures 1 and 4). Our secondsystem uses simple and robust computer vision to capture volumet-ric scans of clay models of such common toy-like objects as peo-ple, animals, trees, houses, cars, and boats. A volumetric matchingalgorithm allows us to recognize, interpret, and animate the claymodels (Figure 2).
2 Computational Building Blocks
The vision of a tangible 3D geometric modeling system that usesbuilding blocks with embedded computation has been pursued byseveral groups over the past 20 years. Research on this topic beganwith the pioneering projects of Aish [1, 2] and of Frazer [15, 16, 12,14, 13], and was renewed more recently by Dewey and Patera [7,3].1
All of these systems take advantage of the idea that completelyand robustly determining the geometry of a tangible model fol-lows naturally if the model is built from rigidly connected buildingblocks of known size and shape. Recovering 3D geometry is thenreduced to the problem of determining the identity and connectivityof the blocks and communicating that information to a host com-puter. However, these systems differ significantly in the details oftheir design and implementation. A broad range of solutions havebeen tried for these fundamental engineering problems:
How do blocks connect? Blocks that can stack only verti-cally have a low “constructive versatility” relative to, say,LegoTM blocks (a pair of standard ! ! LegoTM blocks canconnect in 184 different configurations). Simple, symmetricalconnectors are the key to achieving high constructive versatil-ity.
How are blocks powered? Self-powered blocks allow useof simpler connectors but increase the cost, maintenance,
1The AlgoBlock [31] and Triangles [18, 19] systems are similar in ar-
chitecture to the tangible modelers cited above. However, their target ap-
plication is visual/tangible programming, not geometric modeling; and both
systems enable the general description of 2D structure only, not 3D.
Two other tangible modeling systems deserve mention. The “Active
LegoTM Baseplate Project” at MIT [23] addressed the issue of 3D geometric
modeling, but it was only a paper design and was never implemented. The
MonkeyTM is a posable articulated linkage that is used for keyframing and
performance capture [10]; it is a successful product.

(a) (b) (c)
(d) (e)
Figure 1: (a) a physical block structure comprising 98 blocks; (b) a close-up of the blocks; (c) a bottom view of the circuit board inside eachblock; and renderings of the virtual model recovered from the structure, one literal (d) and one interpreted (e). The literal rendering usesassociated shapes and colors to render the blocks. The virtual model is augmented automatically for the interpreted rendering.
(a) (b) (c) (d) (e)
Figure 2: (a) a clay model; (b) its volumetric scan, computed from silhouette information; (c) the best match for it from a small library ofobject templates; (d) the constituent parts of the interpreted virtual model; and (e) a frame from an automatically generated animation of thevirtual model running.
and complexity of the individual blocks. Externally pow-ered blocks require connectors that handle the distribution ofpower.
How do blocks communicate? The earliest systems used sim-ple electronics to create a circuit-switched network in a blockstructure. Recent systems have used a microcontroller in eachblock, and a variety of message-passing architectures for com-munication.
How is geometry computed? There are two general strate-gies for computing connectivity, and thereby geometry. Atone extreme the connectivity computation can be controlledcentrally by the host computer; at the other extreme, it can beorganized as a distributed computation among the computingelements in the blocks.
The system we have developed is just one point in a large spacespanned by the dimensions of connection, communication, andcomputation, but it illustrates well the various design and engi-neering issues involved. Its distinctive characteristics include thefollowing:
Very simple physical/electrical connection: We havebased the physical design of our blocks on the popular
LegoTM block. Although this choice achieves much greaterconstructive versatility than any previous system, it comes atthe price of extremely simple connectors. Our standard blockhas eight plugs on the top, and eight jacks on the bottom. Theplugs and jacks have only two conductors each, one for powerdistribution and one for bidirectional signals.
Asynchronous, distributed communication: These simpleconnectors make it impossible to have a common bus link-ing all our blocks (in addition to point-to-point connections).The software of many previous systems was simplified by us-ing such a bus for global synchronization and communica-tion. All communication in our block structures is based onasynchronous message passing between physically connectedblocks.
Parallel, distributed computation of structure: Our designgoal was to build self-describing structures of up to 500blocks. To complete the distributed computation of structurefor a 500-block model in a reasonable time we had to ex-ploit parallelism, which further complicated an already com-plicated distributed computation.
Automatic detailing: A modeling system that makes it easy to
create coarse models will be of limited use if the refinementof the models requires learning a complex user interface suchas that found in today’s animation and CAD systems. Au-tomatic detailing based on graphical interpretation can makeblock structures look less blocky and more interesting. As anillustration of what is possible, our system interprets a blockstructure as a building; it identifies walls, roofs, windows,doors, and other features, and augments them with additionalgeometric and surface detail in various styles to produce moreinteresting models.
2.1 System description
For economy and ease of development, we used mostly off-the-shelf components in the construction of our building-blockprototypes (Figure 1(b)). A block consists of a !!mm (L) "!mm (W) #"mm (H) plastic box that is drilled to accommodateslightly modified DC power connectors. Eight plugs are on top ofthe block, and eight jacks are on the bottom. The dimensions ofthe box and the locations of the plugs and jacks are such that ourbuilding blocks fit together like LegoTM blocks.
Each connector has just two conductors. However, instead ofusing one for power and one for ground, we use the inner pin as asignal line for bidirectional communication, and the outer sleeve forpower distribution. Each block is wired internally so that connec-tors with power and ground on their outer sleeves, respectively, arearranged in an alternating pattern, as shown in Figure 1(c). The po-larity of the connector sleeves marked ‘X’ is different from that ofthe sleeves marked ‘O.’ Thus each block has at least one connectionto power and one to ground in any typical LegoTM-block structure,i.e., one in which no block is connected at only one corner or atonly diagonally opposite corners. There is no way to tell a prioriwhich connector sleeves have power or ground, but this problem issolved by the use of a full-wave bridge rectifier.
We chose the PIC16F877 microcontroller as the best single-chipsolution to the various design problems posed by our application.Its features include: a relatively large number of I/O pins (16 arerequired for communication, and it has 33); compact size; low-power, high-speed (20 Mhz) CMOS technology; an 8-bit RISCCPU; $K %-bit words of FLASH program memory; &'$ $-bit bytes of data memory (RAM); #"' $-bit bytes of EEPROMdata memory; a hardware Universal Synchronous AsynchronousReceiver Transmitter (USART) that we use for debugging; and in-terrupt handling. The program and data in each block’s microcon-troller are identical except for a unique ID number.
We left several pads in the periphery of our custom circuit boardto accommodate such additional transducers and sensors inside ablock as speakers, and proximity and touch detectors. Alternatively,the board can be trimmed to fit inside a # # building block withoutaffecting its basic functionality.
2.2 Geometry determination
A fully assembled block structure computes its own geometry inthree phases. When a block is powered on, it immediately en-ters Phase 1 of the geometry-determination algorithm. Lacking aglobal communication bus, the switching on of electrical power isthe only source of synchronization, which is necessarily approxi-mate because of small delays in power propagation throughout ablock structure.
All 16 signal lines in a block are normally held high by pull-upresistors. Phase 1 begins with each block pulling its top signal lines(those in the plugs) low. Each block then tests its bottom signallines (those in the jacks) to determine and record which of themhave been pulled low by some other block. After a short delayto ensure that the approximately synchronized blocks do not try
to drive shared signal lines simultaneously in both directions, thistest is then repeated with the roles of top and bottom lines reversed.Thus when Phase 1 is complete, each block has identified in parallelwhich of its lines are connected, i.e., are attached to other blocks,but it does not know the identity of these neighboring blocks.
After another short delay, each block enters Phase 2 of the algo-rithm during which blocks communicate with their neighbors overthe connected lines found in Phase 1. At the start of Phase 2, eachblock listens on its connected bottom lines for transmitted pack-ets that contain the ID of the transmitting block and the number ofthe connector over which it is transmitting.2 The receiving blockrecords this information with its own ID number and the numberof the connector over which it received the transmission. The com-bined data form a complete record of a single connection betweentwo blocks. When a block has successfully received a transmissionon all of its connected bottom lines, it begins transmitting on itsconnected top lines, iterating through them in order. Connectivityinformation, therefore, flows initially through the block structurefrom bottom to top, with the potential for significant parallel com-munication.
After a block has completed the first half of Phase 2, it knowsto which connector of which block each of its own bottom connec-tors is attached. During the second half of Phase 2, the procedureis repeated with blocks listening on their top connected lines andtransmitting on their bottom connected lines. Thus, at the end ofPhase 2, each block has acquired and recorded in its database com-plete knowledge about all of its connected lines: the IDs of theconnected pair of blocks and the connector numbers by which theyare attached. Each connected line that is processed successfully inPhase 2 is termed valid.
In Phase 3, the connectivity information determined in Phase 2is communicated to the host computer through the drain, a specialblock that runs slightly different software and has a serial connec-tion to the host computer. In addition to mediating communica-tion between a block structure and the host, the drain also suppliespower to the blocks and may be attached to any part of the struc-ture. During Phase 3 all blocks listen for messages on all of theirvalid lines. When a request-to-drain message is received, a blocktransmits packets containing all of its connectivity information onits drain connector, the one from which it received the request-to-drain message. When the block has successfully completed thesetransmissions, it forwards the request-to-drain message on the firstof its valid lines, and enters a message-forwarding mode. If it re-ceives a packet containing connectivity information, it stores andforwards it on its drain connector; if it receives subsequent request-to-drain messages, it responds with an already-drained message;when it receives an already-drained or done message, it forwardsthe request-to-drain message on its next valid line or sends a donemessage on its drain connector when all its valid lines have beenprocessed.
The first request-to-drain message is injected into the structureby the drain, and permission to drain then percolates through theblock structure in a preorder traversal of the blocks. Although thistraversal is performed sequentially—only one block has permissionto drain at any point in time—the forwarding of messages towardsthe drain is pipelined, thereby achieving some parallelism in thisphase as well.
At the end of Phase 3 the host computer should have completeconnectivity information for the block structure. (In fact, it shouldhave redundant information because each connectivity datum is re-ported twice, once by each of the two blocks involved. This re-
2Transmitted packets may be missed if the receiving microcontroller is
busy when transmission commences. Noise may also corrupt a message.
Therefore all packets transmitted in Phases 2 and 3 have checksums and
are acknowledged, and faulty transmissions are retried after an appropriate
timeout.
dundancy contributes to the robustness of the system, but it can beeliminated for greater efficiency.) The host also has shape data foreach block, indexed by ID. These data are recorded when a block isprogrammed. A straightforward recursive procedure ought now togive the 3D structure of the block structure, which can then be usedto produce a geometric scene description suitable as input to a va-riety of common 3D graphics applications. However, occasionallythe host does not obtain complete information: due to mechanicalstresses in the structure, some connections fail (about 0.5% of themon average) such that their connectivity data are not acquired. Ourgeometry-recovery procedure therefore determines the most likelyblock structure given potentially incomplete connectivity data.
The block structure in Figure 1(a) contains 98 blocks. The timerequired for this structure to compute its own geometry is 35 sec-onds. The structure in Figure 4(c) contains 560 blocks and requires53 minutes for geometry determination. Almost all of the time isspent in Phase 3 of the algorithm.
2.3 Graphical interpretation
For a literal rendering of the block structure, the host uses associ-ated values for the rendering attributes of each block, such as shape,color, and texture. Figure 1(d) shows a literal rendering of the blockstructure in Figure 1(a); color and shape values have been chosento mimic the physical blocks.
Examples of graphical interpretations are shown in Figures 1(e)and 4(b) and (d). To produce these enhanced renderings, our systemgenerates a description of a block structure as a set of logical ax-ioms, one to assert the existence and location of each block. Theseaxioms serve as input to a logic program written in Prolog that canidentify architectural features of a block structure. For example, therules in Figure 3 compute which blocks constitute the walls and roofof a structure, interpreted as a building.3 Recognized structural ele-ments can be decorated with additional geometry and surface detailto enhance the visual appearance of the rendered model.
To validate the ability of the computer to generate interpretedrenderings, we handcrafted a few distinct styles that can be appliedto block structures automatically. For a fully realized application,we would develop more interactive user interfaces for customizingand applying these interpretive styles. We return to this point in theconcluding section of the paper.
3 Clay
Using external sensors to capture geometry is the alternative tech-nology for supporting tangible modeling. For our second casestudy, we were inspired by the ancient myth of Pygmalion, whosesculpture of a woman was brought to life by Venus [24]. We setourselves the goal of bringing clay models to life automatically. Al-though any practical application would divide this task more evenlybetween user and computer, we tried to fully automate the systemin order to explore the limits of the technology, just as we did inour previous case study. In the following subsections we presentthe details of the hardware and software used to scan, recognize,interpret, and animate 3D clay models.
3In the early 70’s Winston developed a landmark program that could
learn about simple architectural structures from positive and negative ex-
amples of those structures [33]. However, the robust recognition of the im-
portant structural elements in our block models requires hand-crafted rules
of much greater complexity than those that could be learned by Winston’s
approach.
% wall/1 finds sets of blocks that form walls. A wall is defined to be
% a contiguous set of blocks that lie flush against some vertical plane,
% and that constitute a given fraction of the structure.
wall(WALL BLOCKS) :-
structure bbox(X MIN, X MAX, , , Z MIN, Z MAX),
candidate planes(X MIN, X MAX, Z MIN, Z MAX, U, V, W, R),
lies flush against(U, V, W, R, PLANE BLOCKS),
contiguous subsets(PLANE BLOCKS, PLANE BLOCKS SUBSETS),
member(WALL BLOCKS, PLANE BLOCKS SUBSETS),
big enough(WALL BLOCKS).
% wall tops/1 finds the blocks that are the tops of walls.
wall tops(WALL TOPS) :-
setof(BLOCK,
WALL BLOCKS ˆ
(wall(WALL BLOCKS),
member(BLOCK, WALL BLOCKS),
not overhung(BLOCK, WALL BLOCKS)),
WALL TOPS).
% roof blocks/1 computes the set of blocks make up the roof, which is
% defined to be those blocks that rest directly or indirectly on the tops of
% walls. The indirectly resting blocks are computed by grow roof/2.
roof blocks(ROOF BLOCKS) :-
findall(BLOCK1,
(wall tops(WT BLOCKS),
member(WT BLOCK, WT BLOCKS),
on top of(BLOCK1, WT BLOCK)),
BASE BLOCKS BAG),
setof(BLOCK2,
member(BLOCK2, BASE BLOCKS BAG),
BASE BLOCKS),
grow roof(BASE BLOCKS, ROOF BLOCKS).
grow roof(NASCENT ROOF BLOCKS, FINAL ROOF BLOCKS) :-
member(BLOCK1, NASCENT ROOF BLOCKS),
on top of(BLOCK2, BLOCK1),
not member(BLOCK2, NASCENT ROOF BLOCKS),
grow roof([BLOCK2 NASCENT ROOF BLOCKS], FINAL ROOF BLOCKS),
!.
grow roof(ROOF BLOCKS, ROOF BLOCKS).
Figure 3: Recognizing the structural elements of a block structureby logic programming.
3.1 System description and
geometry determination
Our scanning system consists of a motorized rotary table, aconsumer-quality digital camera, a laser striper (optional), and ahost computer (Figure 5). The camera is calibrated from an imageof an object of known dimensions. The clay model to be scannedis placed upright and face forward on the rotary table. (It is con-venient for the matching process to have models placed in a knownorientation. Inferring orientation automatically is certainly feasiblebut seems unnecessary for modeling applications that involve co-operative users.) The camera captures an image sequence of themodel as it rotates, and a volumetric scan is generated from silhou-ettes [4]. This approach worked well on the majority of modelswe scanned, but when significant concavities were present (e.g.,the door and windows of the house in Figure 8), the laser stripercould be used to refine the shape of the model.4 The use of silhou-ettes and laser striping is well suited to our smooth-surfaced, single-color clay models; however, systems that rely on surface-color vari-ation [29] or uncalibrated systems that require a significant number
4Affordable 3D scanning systems that operate on the same principles
as our laboratory system are now available commercially from Geometrix,
Sanyo, and others.
(a) (b)
(c) (d)
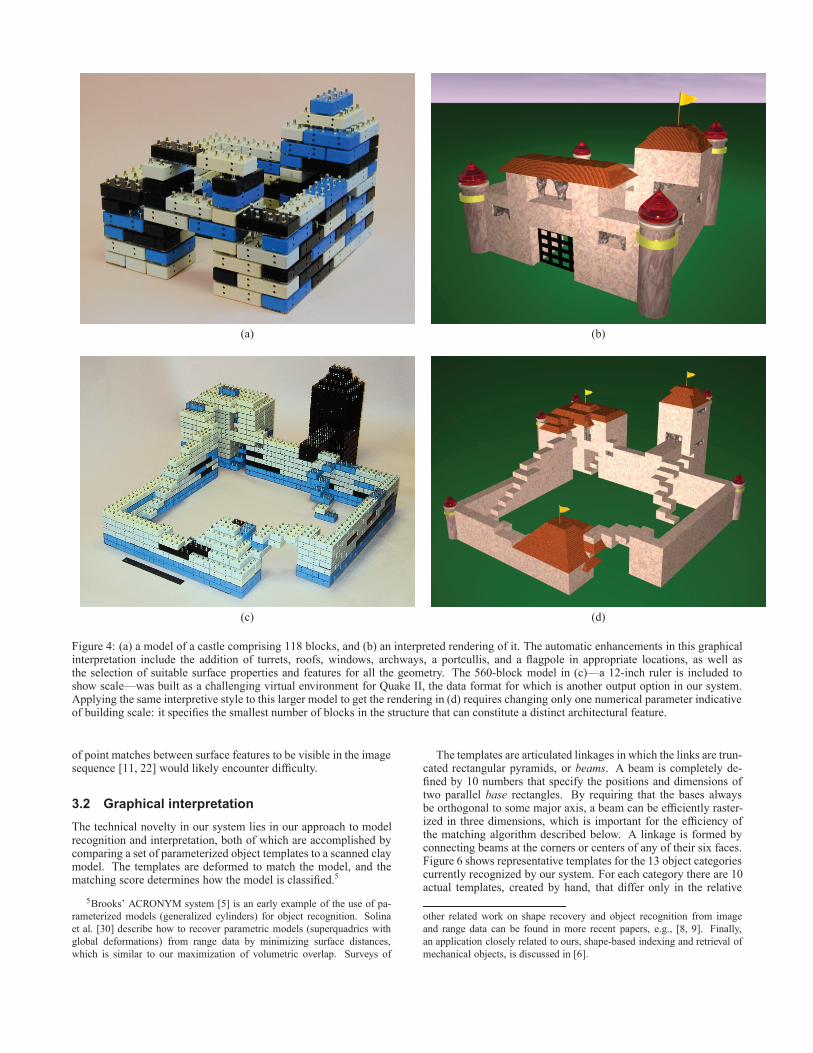
Figure 4: (a) a model of a castle comprising 118 blocks, and (b) an interpreted rendering of it. The automatic enhancements in this graphicalinterpretation include the addition of turrets, roofs, windows, archways, a portcullis, and a flagpole in appropriate locations, as well asthe selection of suitable surface properties and features for all the geometry. The 560-block model in (c)—a 12-inch ruler is included toshow scale—was built as a challenging virtual environment for Quake II, the data format for which is another output option in our system.Applying the same interpretive style to this larger model to get the rendering in (d) requires changing only one numerical parameter indicativeof building scale: it specifies the smallest number of blocks in the structure that can constitute a distinct architectural feature.
of point matches between surface features to be visible in the imagesequence [11, 22] would likely encounter difficulty.
3.2 Graphical interpretation
The technical novelty in our system lies in our approach to modelrecognition and interpretation, both of which are accomplished bycomparing a set of parameterized object templates to a scanned claymodel. The templates are deformed to match the model, and thematching score determines how the model is classified.5
5Brooks’ ACRONYM system [5] is an early example of the use of pa-
rameterized models (generalized cylinders) for object recognition. Solina
et al. [30] describe how to recover parametric models (superquadrics with
global deformations) from range data by minimizing surface distances,
which is similar to our maximization of volumetric overlap. Surveys of
The templates are articulated linkages in which the links are trun-cated rectangular pyramids, or beams. A beam is completely de-fined by 10 numbers that specify the positions and dimensions oftwo parallel base rectangles. By requiring that the bases alwaysbe orthogonal to some major axis, a beam can be efficiently raster-ized in three dimensions, which is important for the efficiency ofthe matching algorithm described below. A linkage is formed byconnecting beams at the corners or centers of any of their six faces.Figure 6 shows representative templates for the 13 object categoriescurrently recognized by our system. For each category there are 10actual templates, created by hand, that differ only in the relative
other related work on shape recovery and object recognition from image
and range data can be found in more recent papers, e.g., [8, 9]. Finally,
an application closely related to ours, shape-based indexing and retrieval of
mechanical objects, is discussed in [6].
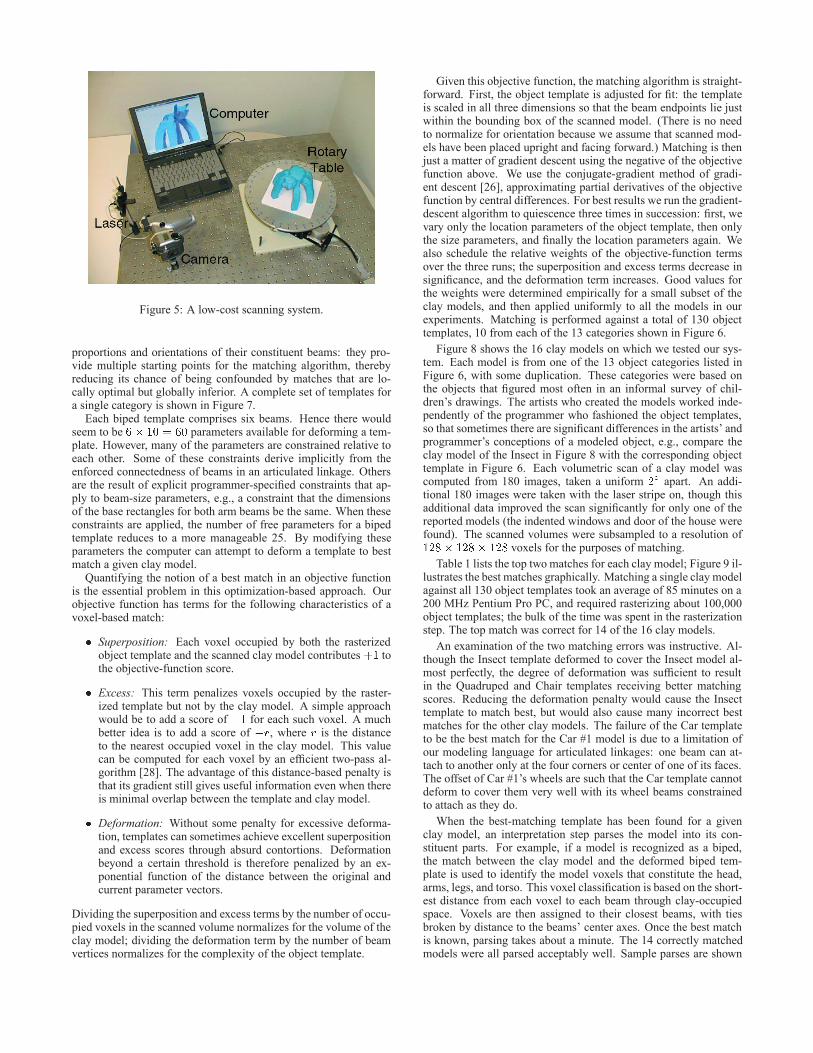
Figure 5: A low-cost scanning system.
proportions and orientations of their constituent beams: they pro-vide multiple starting points for the matching algorithm, therebyreducing its chance of being confounded by matches that are lo-cally optimal but globally inferior. A complete set of templates fora single category is shown in Figure 7.Each biped template comprises six beams. Hence there would
seem to be !" # " parameters available for deforming a tem-plate. However, many of the parameters are constrained relative toeach other. Some of these constraints derive implicitly from theenforced connectedness of beams in an articulated linkage. Othersare the result of explicit programmer-specified constraints that ap-ply to beam-size parameters, e.g., a constraint that the dimensionsof the base rectangles for both arm beams be the same. When theseconstraints are applied, the number of free parameters for a bipedtemplate reduces to a more manageable 25. By modifying theseparameters the computer can attempt to deform a template to bestmatch a given clay model.Quantifying the notion of a best match in an objective function
is the essential problem in this optimization-based approach. Ourobjective function has terms for the following characteristics of avoxel-based match:
! Superposition: Each voxel occupied by both the rasterizedobject template and the scanned clay model contributes $! tothe objective-function score.
! Excess: This term penalizes voxels occupied by the raster-ized template but not by the clay model. A simple approachwould be to add a score of "! for each such voxel. A muchbetter idea is to add a score of " , where is the distanceto the nearest occupied voxel in the clay model. This valuecan be computed for each voxel by an efficient two-pass al-gorithm [28]. The advantage of this distance-based penalty isthat its gradient still gives useful information even when thereis minimal overlap between the template and clay model.
! Deformation: Without some penalty for excessive deforma-tion, templates can sometimes achieve excellent superpositionand excess scores through absurd contortions. Deformationbeyond a certain threshold is therefore penalized by an ex-ponential function of the distance between the original andcurrent parameter vectors.
Dividing the superposition and excess terms by the number of occu-pied voxels in the scanned volume normalizes for the volume of theclay model; dividing the deformation term by the number of beamvertices normalizes for the complexity of the object template.
Given this objective function, the matching algorithm is straight-forward. First, the object template is adjusted for fit: the templateis scaled in all three dimensions so that the beam endpoints lie justwithin the bounding box of the scanned model. (There is no needto normalize for orientation because we assume that scanned mod-els have been placed upright and facing forward.) Matching is thenjust a matter of gradient descent using the negative of the objectivefunction above. We use the conjugate-gradient method of gradi-ent descent [26], approximating partial derivatives of the objectivefunction by central differences. For best results we run the gradient-descent algorithm to quiescence three times in succession: first, wevary only the location parameters of the object template, then onlythe size parameters, and finally the location parameters again. Wealso schedule the relative weights of the objective-function termsover the three runs; the superposition and excess terms decrease insignificance, and the deformation term increases. Good values forthe weights were determined empirically for a small subset of theclay models, and then applied uniformly to all the models in ourexperiments. Matching is performed against a total of 130 objecttemplates, 10 from each of the 13 categories shown in Figure 6.
Figure 8 shows the 16 clay models on which we tested our sys-tem. Each model is from one of the 13 object categories listed inFigure 6, with some duplication. These categories were based onthe objects that figured most often in an informal survey of chil-dren’s drawings. The artists who created the models worked inde-pendently of the programmer who fashioned the object templates,so that sometimes there are significant differences in the artists’ andprogrammer’s conceptions of a modeled object, e.g., compare theclay model of the Insect in Figure 8 with the corresponding objecttemplate in Figure 6. Each volumetric scan of a clay model wascomputed from 180 images, taken a uniform %
Æ apart. An addi-tional 180 images were taken with the laser stripe on, though thisadditional data improved the scan significantly for only one of thereported models (the indented windows and door of the house werefound). The scanned volumes were subsampled to a resolution of!%& !%& !%& voxels for the purposes of matching.
Table 1 lists the top two matches for each clay model; Figure 9 il-lustrates the best matches graphically. Matching a single clay modelagainst all 130 object templates took an average of 85 minutes on a200 MHz Pentium Pro PC, and required rasterizing about 100,000object templates; the bulk of the time was spent in the rasterizationstep. The top match was correct for 14 of the 16 clay models.
An examination of the two matching errors was instructive. Al-though the Insect template deformed to cover the Insect model al-most perfectly, the degree of deformation was sufficient to resultin the Quadruped and Chair templates receiving better matchingscores. Reducing the deformation penalty would cause the Insecttemplate to match best, but would also cause many incorrect bestmatches for the other clay models. The failure of the Car templateto be the best match for the Car #1 model is due to a limitation ofour modeling language for articulated linkages: one beam can at-tach to another only at the four corners or center of one of its faces.The offset of Car #1’s wheels are such that the Car template cannotdeform to cover them very well with its wheel beams constrainedto attach as they do.
When the best-matching template has been found for a givenclay model, an interpretation step parses the model into its con-stituent parts. For example, if a model is recognized as a biped,the match between the clay model and the deformed biped tem-plate is used to identify the model voxels that constitute the head,arms, legs, and torso. This voxel classification is based on the short-est distance from each voxel to each beam through clay-occupiedspace. Voxels are then assigned to their closest beams, with tiesbroken by distance to the beams’ center axes. Once the best matchis known, parsing takes about a minute. The 14 correctly matchedmodels were all parsed acceptably well. Sample parses are shown

House Bicycle Bird Bridge Insect
Chair Tree Rocket Table Boat
Biped Car Quadruped
Figure 6: Representative templates from 13 categories of toy-like objects.
Figure 7: The 10 templates for the Biped category.
in Figure 2(d) and Figure 10.
With this information we can bring a clay model to (virtual) life.We did this automatically for the quadruped shown in Figure 2. Thebody measurements, masses, and moments of inertia were com-puted from the parse of the clay model. These values were passedas input to a control and simulation system for a four-legged robot,which adapted an existing control system to the dynamics of thisparticular clay model [20, 27]. The motion data computed by thesimulation were then used to animate the object template, which inturn was used to animate the scanned volume by moving its vox-els in rough concert with the beams of the template to which theywere assigned in the parsing phase. However, care must be takento avoid the introduction of tears and cracks in the model as it de-forms. Such unwanted artifacts will appear if each voxel maintainsposition relative to just its associated beam. It is better to have allbeams influence the movement of a voxel in inverse proportion tothe square of their distance from the voxel; this reduces tears at thejunctions of different model regions. (See Figure 2 and the com-panion videotape.) Related work on animating volumetric objects
is described in [17].
An alternative and more general way to bring these models tolife is with keyframes specified by the user. Commercial animationpackages are notoriously complex because of the large number offeatures that must be provided. However, these clay models havebeen parsed by the computer and, therefore, the internal skeletalstructure and kinematics are already known. The skeleton shouldallow the construction of an intuitive animation interface for thisspecific character. The user need only specify the motion of theskeleton because the internal details of the motion of the clay can becomputed automatically using heuristic algorithms as was done forthe quadruped or a more general physical simulation of clay [32].Examples of this approach are shown on the companion video.
4 Conclusions and future work
In our case studies we have investigated the combination of tan-gible modeling and graphical interpretation. Tangible modeling

House Bicycle Bird Bridge Insect
Chair Tree Rocket Table Boat
Biped #1 Biped #2 Car #1 Car #2 Quadruped #1 Quadruped #2
Figure 8: Examples from the image sequences for the 16 clay models captured by the camera illustrated in Figure 5.
House Bicycle Bird Bridge
Chair Tree Rocket Table Boat
Biped #1 Biped #2 Car #2 Quadruped #1 Quadruped #2
Figure 9: Best matches illustrated: deformed object templates superimposed on the scanned volumetric models.
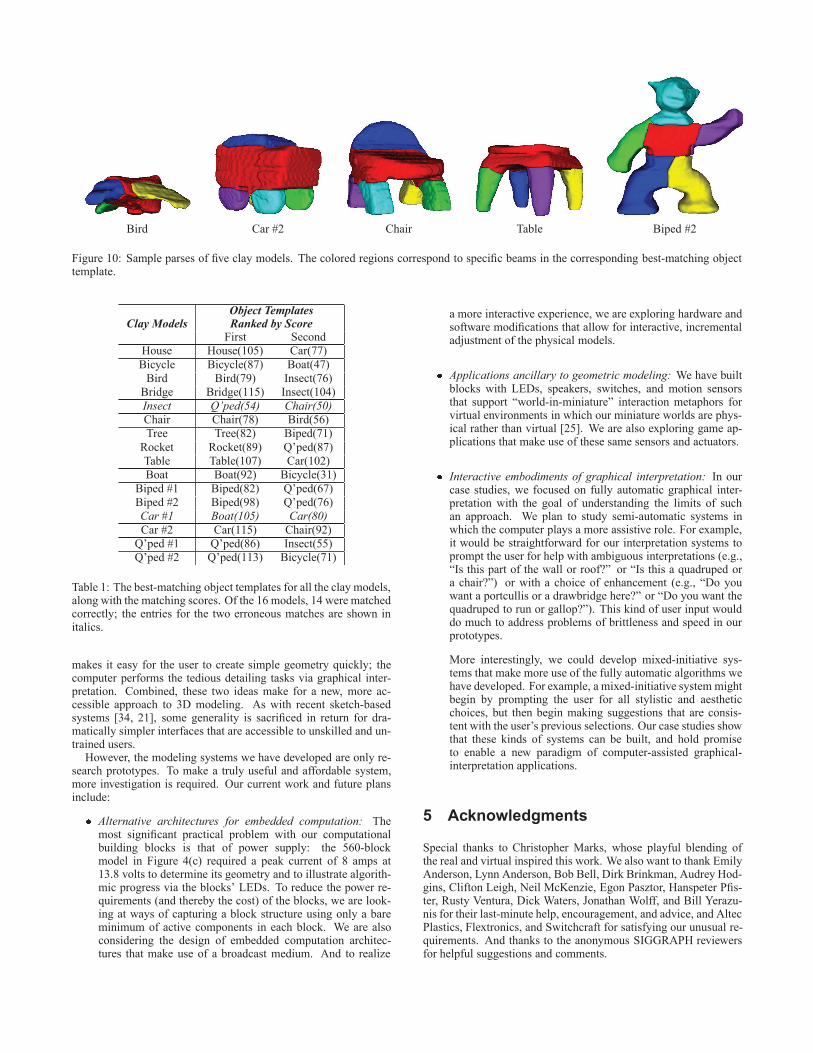
Bird Car #2 Chair Table Biped #2
Figure 10: Sample parses of five clay models. The colored regions correspond to specific beams in the corresponding best-matching objecttemplate.
Object TemplatesClay Models Ranked by Score
First Second
House House(105) Car(77)
Bicycle Bicycle(87) Boat(47)
Bird Bird(79) Insect(76)
Bridge Bridge(115) Insect(104)
Insect Q’ped(54) Chair(50)
Chair Chair(78) Bird(56)
Tree Tree(82) Biped(71)
Rocket Rocket(89) Q’ped(87)
Table Table(107) Car(102)
Boat Boat(92) Bicycle(31)
Biped #1 Biped(82) Q’ped(67)
Biped #2 Biped(98) Q’ped(76)
Car #1 Boat(105) Car(80)
Car #2 Car(115) Chair(92)
Q’ped #1 Q’ped(86) Insect(55)
Q’ped #2 Q’ped(113) Bicycle(71)
Table 1: The best-matching object templates for all the clay models,along with the matching scores. Of the 16 models, 14 were matchedcorrectly; the entries for the two erroneous matches are shown initalics.
makes it easy for the user to create simple geometry quickly; thecomputer performs the tedious detailing tasks via graphical inter-pretation. Combined, these two ideas make for a new, more ac-cessible approach to 3D modeling. As with recent sketch-basedsystems [34, 21], some generality is sacrificed in return for dra-matically simpler interfaces that are accessible to unskilled and un-trained users.However, the modeling systems we have developed are only re-
search prototypes. To make a truly useful and affordable system,more investigation is required. Our current work and future plansinclude:
Alternative architectures for embedded computation: Themost significant practical problem with our computationalbuilding blocks is that of power supply: the 560-blockmodel in Figure 4(c) required a peak current of 8 amps at13.8 volts to determine its geometry and to illustrate algorith-mic progress via the blocks’ LEDs. To reduce the power re-quirements (and thereby the cost) of the blocks, we are look-ing at ways of capturing a block structure using only a bareminimum of active components in each block. We are alsoconsidering the design of embedded computation architec-tures that make use of a broadcast medium. And to realize
a more interactive experience, we are exploring hardware andsoftware modifications that allow for interactive, incrementaladjustment of the physical models.
Applications ancillary to geometric modeling: We have builtblocks with LEDs, speakers, switches, and motion sensorsthat support “world-in-miniature” interaction metaphors forvirtual environments in which our miniature worlds are phys-ical rather than virtual [25]. We are also exploring game ap-plications that make use of these same sensors and actuators.
Interactive embodiments of graphical interpretation: In ourcase studies, we focused on fully automatic graphical inter-pretation with the goal of understanding the limits of suchan approach. We plan to study semi-automatic systems inwhich the computer plays a more assistive role. For example,it would be straightforward for our interpretation systems toprompt the user for help with ambiguous interpretations (e.g.,“Is this part of the wall or roof?” or “Is this a quadruped ora chair?”) or with a choice of enhancement (e.g., “Do youwant a portcullis or a drawbridge here?” or “Do you want thequadruped to run or gallop?”). This kind of user input woulddo much to address problems of brittleness and speed in ourprototypes.
More interestingly, we could develop mixed-initiative sys-tems that make more use of the fully automatic algorithms wehave developed. For example, a mixed-initiative system mightbegin by prompting the user for all stylistic and aestheticchoices, but then begin making suggestions that are consis-tent with the user’s previous selections. Our case studies showthat these kinds of systems can be built, and hold promiseto enable a new paradigm of computer-assisted graphical-interpretation applications.
5 Acknowledgments
Special thanks to Christopher Marks, whose playful blending ofthe real and virtual inspired this work. We also want to thank EmilyAnderson, Lynn Anderson, Bob Bell, Dirk Brinkman, Audrey Hod-gins, Clifton Leigh, Neil McKenzie, Egon Pasztor, Hanspeter Pfis-ter, Rusty Ventura, Dick Waters, Jonathan Wolff, and Bill Yerazu-nis for their last-minute help, encouragement, and advice, and AltecPlastics, Flextronics, and Switchcraft for satisfying our unusual re-quirements. And thanks to the anonymous SIGGRAPH reviewersfor helpful suggestions and comments.
References
[1] R. Aish. 3D input for CAAD systems. Computer-Aided De-sign, 11(2):66–70, Mar. 1979.
[2] R. Aish and P. Noakes. Architecture without numbers –CAAD based on a 3D modelling system. Computer-AidedDesign, 16(6):321–328, Nov. 1984.
[3] G. Anagnostou, D. Dewey, and A. Patera. Geometry-definingprocessors for engineering design and analysis. The VisualComputer, 5:304–315, 1989.
[4] B. G. Baumgart. Geometric modeling for computer vision.Technical Report AIM-249, AI Laboratory, Stanford Univ.,Oct. 1974.
[5] R. Brooks. Model-based 3D interpretations of 2D images.IEEE Trans. on Pattern Analysis and Machine Intelligence,5(2):140–150, 1983.
[6] G. Cybenko, A. Bhasin, and K. D. Cohen. Pattern recognitionof 3D CAD objects: Towards an electronic Yellow Pages ofmechanical parts. Smart Engineering Systems Design, 1:1–13, 1997.
[7] D. Dewey and A. Patera. Geometry-defining processors forpartial differential equations. In B. Alder, editor, Special Pur-pose Computers, pages 67–96. Academic Press, 1988.
[8] S. Dickinson, A. Pentland, and A. Rosenfeld. From volumesto views: An approach to 3D object recognition. ComputerVision, Graphics, and Image Processing: Image Understand-ing, 55(2):130–154, 1992.
[9] S. J. Dickinson and D. Metaxas. Integrating qualitative andquantitative shape recovery. Intl. Journal of Computer Vision,13(3):311–330, 1994.
[10] C. Esposito, W. B. Paley, and J. Ong. Of mice and monkeys: Aspecialized input device for virtual body animation. In Proc.of Symposium on Interactive 3D Graphics, pages 109–114,213, Monterey, California, Apr. 1995.
[11] A. W. Fitzgibbon, G. Cross, and A. Zisserman. Automatic3D model construction for turn-table sequences. In Proc. ofSMILE Workshop, Freiburg, Germany, June 1998.
[12] J. Frazer. Use of simplified three-dimensional computer inputdevices to encourage public participation in design. In Proc.of Computer Aided Design 82, pages 143–151. ButterworthScientific, 1982.
[13] J. Frazer. An Evolutionary Architecture. Architectural Asso-ciation, London, 1994. Describes several tangible modelersdeveloped by Frazer’s group from 1979 onwards.
[14] J. Frazer, P. Coates, and J. Frazer. Software and hardware ap-proaches to improving the man-machine interface. In Proc. ofthe First International IFIP Conf. on Computer Applicationsin Production and Engineering, pages 1083–94, Amsterdam,Holland, 1983. North Holland.
[15] J. Frazer, J. Frazer, and P. Frazer. Intelligent physical three-dimensional modelling system. In Proc. of Computer Graph-ics 80, pages 359–370. Online Publications, 1980.
[16] J. Frazer, J. Frazer, and P. Frazer. New developments in in-telligent modelling. In Proc. of Computer Graphics 81, pages139–154. Online Publications, 1981.
[17] N. Gagvani, D. Kenchammana-HoseKote, and D. Silver. Vol-ume animation using the skeleton tree. In Proc. of the IEEESymposium on Volume Visualization, pages 47–53, ResearchTriangle Park, NC, Oct. 1998.
[18] M. G. Gorbet and M. Orth. Triangles: Design of a physi-cal/digital construction kit. In Proc. of DIS 97, pages 125–128, Amsterdam, Holland, Mar. 1997. ACM.
[19] M. G. Gorbet, M. Orth, and H. Ishii. Triangles: Tangible inter-face for manipulation and exploration of digital informationtopography. In Proc. of CHI 98, pages 49–56, Los Angeles,California, Apr. 1998. ACM.
[20] J. K. Hodgins and N. S. Pollard. Adapting simulated behav-iors for new characters. In Proc. of SIGGRAPH 97, pages153–162, Los Angeles, California, Aug. 1997.
[21] T. Igarashi, S. Matsuoka, and H. Tanaka. Teddy: A sketchinginterface for 3D freeform design. In Proc. of SIGGRAPH 99,pages 409–416, Los Angeles, California, Aug. 1999.
[22] S. B. Kang. Quasi-euclidean recovery from unknown butcomplete orbital motion. Technical Report TR 97-10, Com-paq CRL, 1997.
[23] F. Martin and R. Borovoy. The active LEGO base-plate project. http://fredm.www.media.mit.-edu/people/fredm/projects/ab/, 1994.
[24] Ovid. Metamorphoses:X. Rome, 1 AD.
[25] R. Pausch, T. Burnette, D. Brockway, and M. E. Weiblen.Navigation and locomotion in virtual worlds via flight intohand-held miniatures. In Proc. of SIGGRAPH 95, pages 399–400, Los Angeles, California, Aug. 1995.
[26] W. H. Press, B. P. Flannery, S. A. Teukolsky, and W. T. Vet-terling. Numerical Recipes in C. Cambridge University Press,1988.
[27] M. H. Raibert. Legged Robots That Balance. MIT Press,Cambridge, 1986.
[28] J. C. Russ. The Image Processing Handbook. CRC Press,1998.
[29] S. M. Seitz and C. R. Dyer. Photorealistic scene reconstruc-tion by voxel coloring. International Journal of ComputerVision, 35(2):151–173, 1999.
[30] F. Solina and R. Bajcsy. Recovery of parametric models fromrange images: The case for superquadrics with global defor-mations. IEEE Trans. on Pattern Analysis and Machine Intel-ligence, 12(2):131–146, 1990.
[31] H. Suzuki and H. Kato. AlgoBlock: A tangible programminglanguage — a tool for collaborative learning. In Proc. of the4th European Logo Conference, pages 297–303, 1993.
[32] D. Terzopoulos and K. Fleischer. Deformable models. TheVisual Computer, 4(6):306–331, December 1988.
[33] P. H. Winston. Learning structural descriptions from exam-ples. In P. H. Winston, editor, The Psychology of ComputerVision. McGraw-Hill, New York, 1975.
[34] R. C. Zeleznik, K. Herndon, and J. F. Hughes. SKETCH: Aninterface for sketching 3D scenes. In Proc. of SIGGRAPH 96,pages 163–170, New Orleans, Louisiana, Aug. 1996.