Embed Size (px)
Citation preview
http://crossmark.crossref.org/dialog/?doi=10.1016/j.ajsl.2014.04.002&domain=pdfhttp://crossmark.crossref.org/dialog/?doi=10.1016/j.ajsl.2014.04.002&domain=pdf
System Dynamics Modeling for Determining Optimal Ship Sizes and Types in Coastal Liner Services
31
System Dynamics Modeling for Determining Optimal Ship Sizes and Types in Coastal Liner
Services*
Sung-il PARK**·Ying WANG***· Gi-tae YEO****·Adolf K.Y. NG*****
I. Introduction
II. Study Region
III. Ship Investment System Dynamics Modeling
IV. Model Simulations of Different Scenarios
V. Conclusion
Abstract The problem of determining the required ship investment for deployment is
an ongoing problem faced by governments and ship operators. The nature of ship investment is capital-intensive and the return on investment is often take long time. This paper attempts to establish system dynamics modeling (SDM) to simulate and solve this problem in order to help ship operators make effective strategic decisions. A case study of coastal liner services between Incheon and Baengnyeong Island in South Korea was performed. Using scenario analysis, the possible ship sizes (small: 350 tons; large: 2,500 tons) and types (new or used) were considered by comparing potential revenue with costs. The results indicated that putting a used large-sized ship into operation would accommodate the increasing passenger and cargo volumes, and improve customer services.
Key Words : Coastal Liner Services, Ship Investment, System Dynamics
Modeling (SDM), Baengnyeong Island.
Copyright 2014, The Korean Association of Shipping and Logistics, Inc. Production and hosting by Elsevier B.V. Peer review under responsibility of the Korean Association of Shipping and Logistics, Inc.
*This paper is a revised version of an earlier paper presented at the International Conference of the Asian Journal of Shipping and Logistics (ICALS 2013) organized by the Korean Association of Shipping and Logistics and held at Kobe University in Japan, 30–31 August 2013 ** Masters Student, Graduate School of Logistics, Incheon National University, Korea, Email : [email protected] ***Doctoral Student, Graduate School of Logistics, Incheon National University, Korea, Email : [email protected] **** Professor, Graduate School of Logistics, Incheon National University, Korea, Email : [email protected], Corresponding author ***** Professor, Department of Supply Chain Management, University of Manitoba, Canada, Email : [email protected]
Contents
Volume 30 Number 1 April 2014 pp. 031-050
Open access under CC BY-NC-ND license.

System Dynamics Modeling for Determining Optimal Ship Sizes and Types in Coastal Liner Services
32
I. Introduction
A ship investment system is a comprehensive setup comprising many interacting stakeholders, including passengers, ship owners, carriers, shippers and local government, often with different and competing interests. However, the complex nature of ship investment systems has made it difficult to develop, evaluate, and make decisions within a comprehensive, generic ship investment system model. The combination of increased passenger volumes and limited ship capacity poses a significant challenge for ship company managers. Such challenges are confounded by significant demands for reduction in expenses, and the more effective and efficient utilization of existing resources, while at the same time providing high-quality services. In this paper, the objective is to explore the possibility of using system dynamics modeling (SDM) in decision-making processes related to ship investment: to determine the optimal size and type of ferry ships required to both satisfy increasing volumes and provide better customer service. To illustrate the usefulness of the proposed SDM, a system dynamics simulation approach was used to develop a mathematical model that analyzes typical decision-making scenarios1).
The paper is organized as follows: In Section II, the study region, including the geography of Baengnyeong Island, the current ships in operation, and the passenger and cargo volumes, is reviewed. Section III presents the methodology of SDM and the proposed ship investment SDM. A detailed case study of the ship investment problem in Baengnyeong Island is also presented. Finally, the conclusion can be found in Section V.
II. Study Region
In this research, it is focus on a ship investment decision making problem in coastal liner services. Korea is a peninsula country, for residents in the island, the unique transportation mode to connect the island and mainland is coastal transport, therefore it’s important and necessary to improve the coastal liner services constantly. Recently,
1) Rajasekaram et al.(2010)

System Dynamics Modeling for Determining Optimal Ship Sizes and Types in Coastal Liner Services
33
benefit from the promotion project of tourism in Baengnyeong Island, the tourist passenger volume is increasing; almost half of the tourists are the Incheon passengers, due to geographicaladvantage and 50% ticket discount. The increasing volumes begin to affect the regular travel of residents in Baengnyeong Island little by little, especially in the peak tourist season. The limited capacity of ships leads to inconvenience to both Baengnyeong Island residents (have to ticket to go home or go to mainland) and tourists (overcrowding of the ship). Therefore, to solve this problem, the ship investment decision should be made in this coastal liner service. The ship capacity lack problem liking Baengnyeong Island is appearing more and more due to now the coastal liner service is not only to satisfy the island residents’ regular travel but for commercialpurpose. As a representative case, this research chooses the coastal liner service between Baengnyeong Island and Incheon as a target to find the solution.
<Figure 1> Baengnyeong Island
As the northernmost island in the West Sea, Baengnyeong Island,
shown in Fig. 1, is the eighth largest island in South Korea with about 10,000 inhabitants. A number of soldiers live on the island because its proximity to North Korea makes it an important military region. Baengnyeong Island is 280 kilometers away from the mainland city, Incheon, and a fast-sailing ship requires five hours to travel from Incheon toBaengnyeong Island. The existing coastal liner services are not only a means of transportation for the residents of the island, but also facility for the island residents’ daily cargo transfers.
System Dynamics Modeling for Determining Optimal Ship Sizes and Types in Coastal Liner Services
34
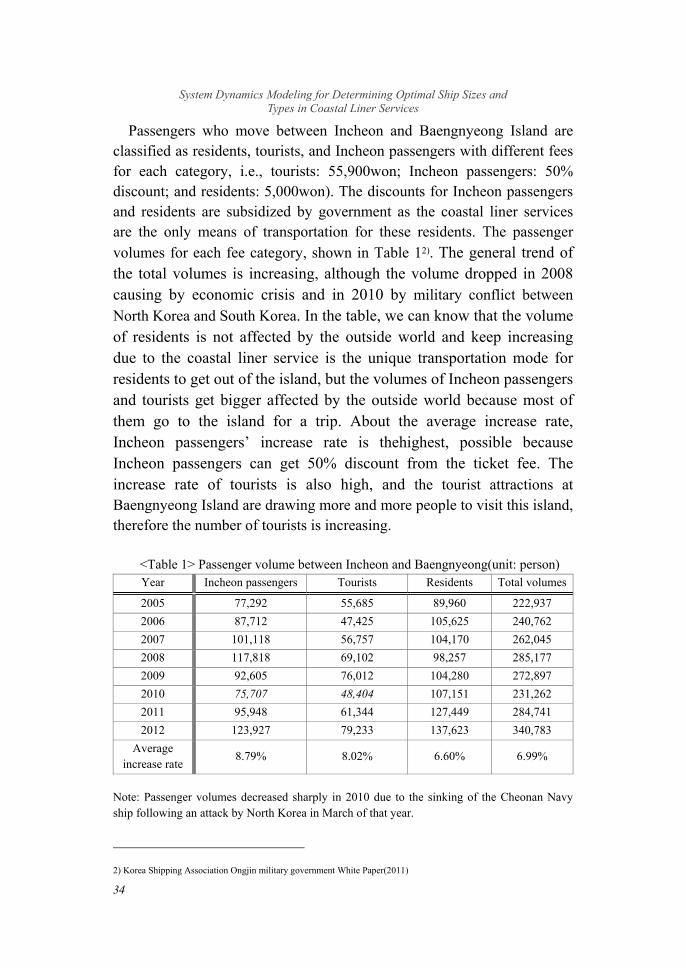
Passengers who move between Incheon and Baengnyeong Island are classified as residents, tourists, and Incheon passengers with different fees for each category, i.e., tourists: 55,900won; Incheon passengers: 50% discount; and residents: 5,000won). The discounts for Incheon passengers and residents are subsidized by government as the coastal liner services are the only means of transportation for these residents. The passenger volumes for each fee category, shown in Table 12). The general trend of the total volumes is increasing, although the volume dropped in 2008 causing by economic crisis and in 2010 by military conflict between North Korea and South Korea. In the table, we can know that the volume of residents is not affected by the outside world and keep increasing due to the coastal liner service is the unique transportation mode for residents to get out of the island, but the volumes of Incheon passengers and tourists get bigger affected by the outside world because most of them go to the island for a trip. About the average increase rate, Incheon passengers’ increase rate is thehighest, possible because Incheon passengers can get 50% discount from the ticket fee. The increase rate of tourists is also high, and the tourist attractions at Baengnyeong Island are drawing more and more people to visit this island, therefore the number of tourists is increasing.
<Table 1> Passenger volume between Incheon and Baengnyeong(unit: person) Year Incheon passengers Tourists Residents Total volumes
2005 77,292 55,685 89,960 222,937 2006 87,712 47,425 105,625 240,762 2007 101,118 56,757 104,170 262,045 2008 117,818 69,102 98,257 285,177 2009 92,605 76,012 104,280 272,897 2010 75,707 48,404 107,151 231,262 2011 95,948 61,344 127,449 284,741 2012 123,927 79,233 137,623 340,783
Average increase rate
8.79% 8.02% 6.60% 6.99%
Note: Passenger volumes decreased sharply in 2010 due to the sinking of the Cheonan Navy ship following an attack by North Korea in March of that year.
2) Korea Shipping Association Ongjin military government White Paper(2011)
System Dynamics Modeling for Determining Optimal Ship Sizes and Types in Coastal Liner Services
35
The majority of cargo volumes between Incheon and Baengnyeong Island are a daily necessity for the residents of Baengnyeong Island, and the number of cargo volumes has increased steadily with an annual average 3.89%rise per year.
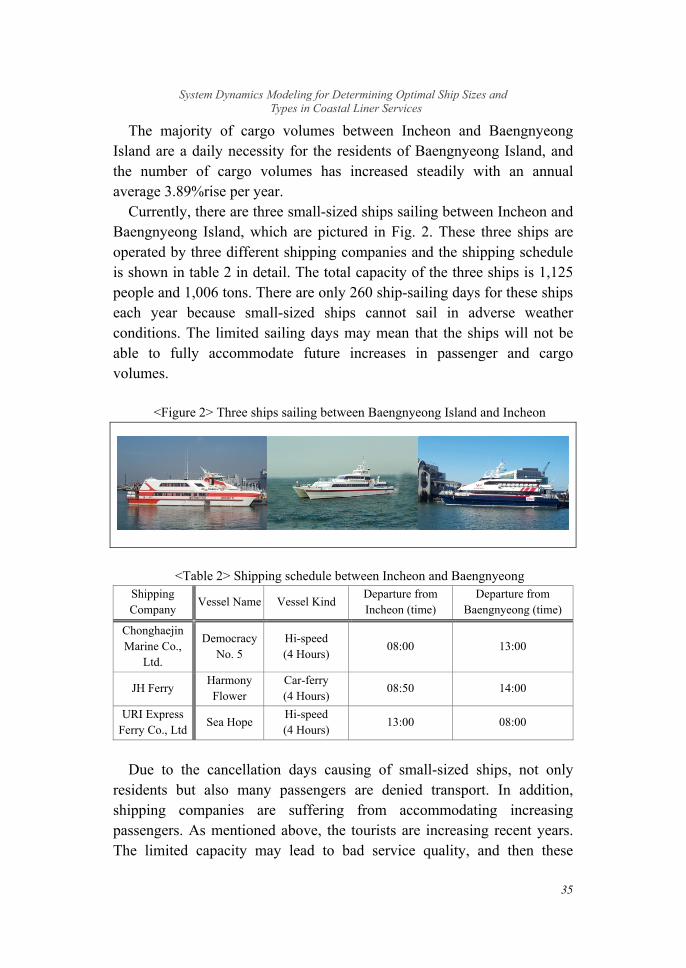
Currently, there are three small-sized ships sailing between Incheon and Baengnyeong Island, which are pictured in Fig. 2. These three ships are operated by three different shipping companies and the shipping schedule is shown in table 2 in detail. The total capacity of the three ships is 1,125 people and 1,006 tons. There are only 260 ship-sailing days for these ships each year because small-sized ships cannot sail in adverse weather conditions. The limited sailing days may mean that the ships will not be able to fully accommodate future increases in passenger and cargo volumes.
<Figure 2> Three ships sailing between Baengnyeong Island and Incheon
<Table 2> Shipping schedule between Incheon and Baengnyeong
Shipping Company
Vessel Name Vessel Kind Departure from Incheon (time)
Departure from Baengnyeong (time)
Chonghaejin Marine Co.,
Ltd.
Democracy No. 5
Hi-speed (4 Hours)
08:00 13:00
JH Ferry Harmony Flower
Car-ferry (4 Hours)
08:50 14:00
URI Express Ferry Co., Ltd
Sea HopeHi-speed (4 Hours)
13:00 08:00
Due to the cancellation days causing of small-sized ships, not only
residents but also many passengers are denied transport. In addition, shipping companies are suffering from accommodating increasing passengers. As mentioned above, the tourists are increasing recent years. The limited capacity may lead to bad service quality, and then these

System Dynamics Modeling for Determining Optimal Ship Sizes and Types in Coastal Liner Services
36
additional passengers run away, finally shipping companies may lose their business expansion opportunities. Yong-Gi Port was constructed in 2011 to absorb additional demand and alleviate the existing port stress. This could allow large ships (up to 3,000 ton) to sail between Incheon and Baengnyeong Island through Yong-Gi Port, and the number of days of cancellation could be reduced by as much as 50%. In order to improve passenger services and accommodate the increasing passenger volumes, the coastal linter service should therefore consider investing in larger ships.
To determine the appropriate ship investment for Yong-Gi Port, we developed a system dynamics model to forecast the passenger/cargo volumes. Using simulation to evaluate different ship sizes and types, an optimal ship investment solution was reached by comparing the profits obtained. The possible ship sizes included a large ship with a capacity of 900 people and 2,500 tons, and a small ship for 375 people and 350 tons. In addition, the respective sailing days employed were 310 and 260 days per year. The possible types of ships included new and used models.
III. Ship Investment System Dynamics Modeling
1. Studies of Ship Investment
Many researchers have carried out studies to determine optimal ship sizes and types in order to arrive at beneficial ship investment decisions and reduce shipping costs. Garrod and Miklius (1985) argued that the optimal size of a ship is determined by minimizing the costs per ton in the port while Hsu and Hsieh (2007) suggested that optimal decision-making with respect to ship size tends to transfer the burden of operation from carriers to shippers without allowing for inventory costs. Bendall and Stent (2005) valued the flexibility available to management decision making of ship investment in introducing an express liner service using a multinomial tree under uncertainty environment. Zhong (2000) applied AHP method on the weight of entropy to a ship investment decision making problem. Miyashita (1982) introduced a quarterly econometric method in bulk carrier industry to analysis the planning behavior in ship investment. Fan and Luo (2013) used binary choice and nested log it models to analyze
System Dynamics Modeling for Determining Optimal Ship Sizes and Types in Coastal Liner Services
37
ship investment and ship choice behavior. Jin (2008) simulated the patterns of the investment in container ship using the system dynamics model for a long time. Ng and Kee (2008) indicated that shipping operators are often confronted with the challenge of deploying the right-sized ship when they attempt to replace their existing small-sized ships with new, bigger ones so as to accommodate their expansion plans. According to Diez and Peri (2010), the potential pay-offs and benefits of such optimization are crucial in the ship design process.
Previous studies solved the ship investment problem by various methods and the target including bulk, container ships, ocean liner and tramp service. However, most of them are focus on cargo ships, and the cost of ship operations without considering increasing passenger and cargo volumes and the provision of better customer service. To fill this gap, this paper attempts to focus on passenger-oriented ships in coastal service, and determine the optimal size and type of ferry ships required to both satisfy increasing volumes of passengers and provide better customer service while simultaneously taking into account the potential costs and profits of the ship investments.
2. System Dynamics Modeling
SDM is a methodology used to develop models that are based on both historical data and dynamic relationships between important variables for the purpose of describing and modeling the behavior of complex systems over time. It is typically used when formal analytical models do not exist but simulations can be developed by linking a number of processes, i.e., developing a system structure.
The application of system dynamics for water management systems3), manufacturing supply chain systems4), weather forecasting systems5), business modeling6), vehicle fuel modeling7), energy systems8), policy decision making9), and public service system10)has been documented by
3) Chung et al.(2008); Sušnik et al.(2012);Zarghami and Akbariye (2012) 4) Bala and Satter(1991); Baines and Harrison(1999); Ozbayraket al.(2007); Trappey et al.(2012); Poles(2013) 5) Li and Simonovic(2002); Simonovic and Li(2003); Rajasekaram et al.(2010) 6) MacDonald et al.(2003);Nielsen and Nielsen(2008); Flynn et al.(2010); Prasad and Mall(2012) 7) Rodrigues et al.(2012); Shafiei et al.(2013) 8) Miller et al.(2012); Reddi et al.(2013) 9) Dangerfield(1992); Park et al.(2009); Inghels and Dullaert(2010); Ojoawo et al.(2012) 10) Homer and Hirsch(2006); Wang(2011); Duryan et al.(2012)
System Dynamics Modeling for Determining Optimal Ship Sizes and Types in Coastal Liner Services
38
various researchers. These studies illustrate the diversity of problems to which SDM can be applied and further show that not only can it be used for natural and anthropogenic systems of various scales, but it can also be utilized effectively to further local stakeholder engagement and knowledge.
Indeed, ship investment systems are complex and comprehensive and cannot be modeled easily. The reason the SDM is advocated in this paper is that modern system dynamics packages use a simple graphic interface, making the modeling of complex systems much easier than before, with delays and feedback effects. By using diagrammatical representation along with underlying equations, building a detailed model of a complex system with delays and balancing and reinforcing loops is relatively uncomplicated. SDM has the ability to simulate complex, non-linear feedback-driven systems, thus justifying its use.
3. Ship Investment SDM
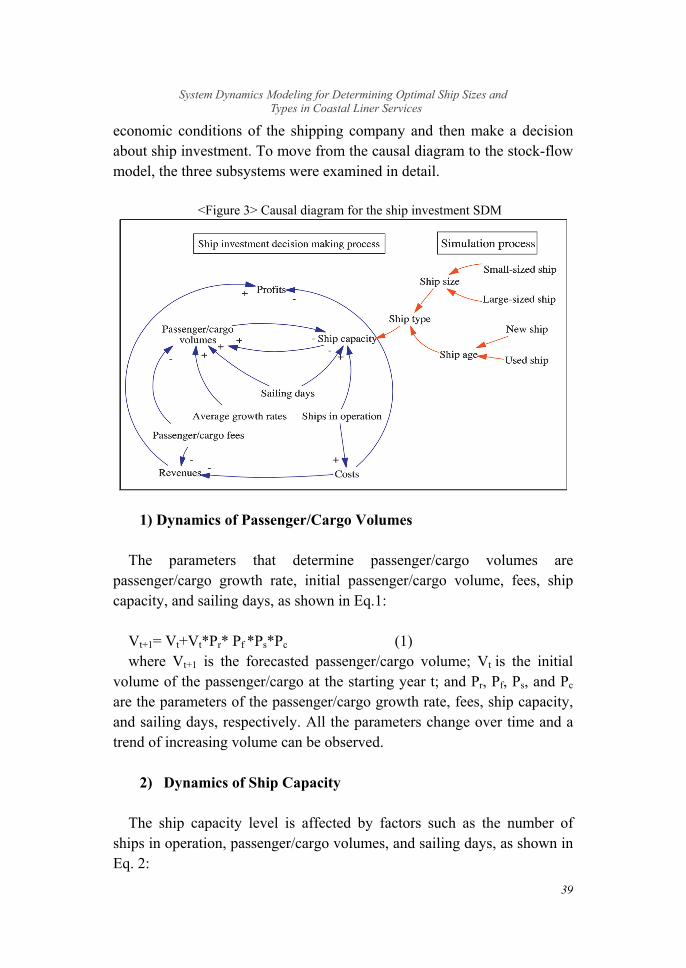
In this paper, a system dynamic model was developed to simulate and facilitate ship investment decisions at Yong-Gi Port. The conceptual and causal diagram for the ship investment SDM is shown in Fig. 3. The model variables are passenger/cargo volumes, fees, average growth rates, ship capacity, sailing days, the number of ships in operation, revenues, and the costs and profits of the shipping company. It consists of three major subsystems: (1) the passenger/cargo volumes, (2) the capacity of the ships, and (3) a simulation process for determining the required ship investment of the shipping company. The model was designed based on the passenger and cargo volumes data from 2005 to 2012, and under the model establish process, the Delphi method has been fulfilled with shipping company that operating the coastal line service between Incheon and Baengnyeong Island. Especially when decide some value of variables (e.g. the value of passenger rates of three groups- Incheon passenger, tourists and residents, impact index from external factors that may dampen the growth of the volumes from Incheon passenger and tourists), the discussions and interviews have been done for gathering ideas and suggestions from these experts, therefore make the model more realistic. Passenger/cargo volumes supply (ship capacity) and demand (volume forecasting) management strategies were applied in the model in order to obtain the current
System Dynamics Modeling for Determining Optimal Ship Sizes and Types in Coastal Liner Services
39
economic conditions of the shipping company and then make a decision about ship investment. To move from the causal diagram to the stock-flow model, the three subsystems were examined in detail.
<Figure 3> Causal diagram for the ship investment SDM
1) Dynamics of Passenger/Cargo Volumes
The parameters that determine passenger/cargo volumes are passenger/cargo growth rate, initial passenger/cargo volume, fees, ship capacity, and sailing days, as shown in Eq.1:
Vt+1= Vt+Vt*Pr* Pf *Ps*Pc (1) where Vt+1 is the forecasted passenger/cargo volume; Vt is the initial
volume of the passenger/cargo at the starting year t; and Pr, Pf, Ps, and Pc
are the parameters of the passenger/cargo growth rate, fees, ship capacity, and sailing days, respectively. All the parameters change over time and a trend of increasing volume can be observed.
2) Dynamics of Ship Capacity
The ship capacity level is affected by factors such as the number of ships in operation, passenger/cargo volumes, and sailing days, as shown in Eq. 2:

System Dynamics Modeling for Determining Optimal Ship Sizes and Types in Coastal Liner Services
40
St+1 = St+St *Pn*Pv*Ps (2) where St+1 is the forecasting ship capacity level; St is the initial ship
capacity level at the starting year t; and Pn, Pv, and Ps are the parameters of the number of ships in operation, the passenger/cargo volume, and the sailing days, respectively.
3) The Dynamics of Ship Investment Decision Making
The ship investment decision can be made by simulation via the SDM. The economic analysis of the shipping company depends on the revenues, costs, and profits associated with the new ship capacity investment, and can be calculated as follows:
Rt= Ft- Ct (3) Ct= Fo (4) Pt= Rt- Ct=Ft- Ct-Fo (5) Where Rt is the total revenue of the shipping company calculated by
subtracting the total costs from the fees obtained from the passengers and cargo; Ct is the total cost at the starting year t;Pt is the total profit calculated by subtracting the total costs from the total revenue.
The result of the analysis can provide an overview of the shipping company with respect to the current ship investment situation, and it can reveal the changes in profit after the new ship capacity investment. This information can aid decision-makers in deciding what type and size of ship to invest in in order to maximize benefits as part of their future strategies.
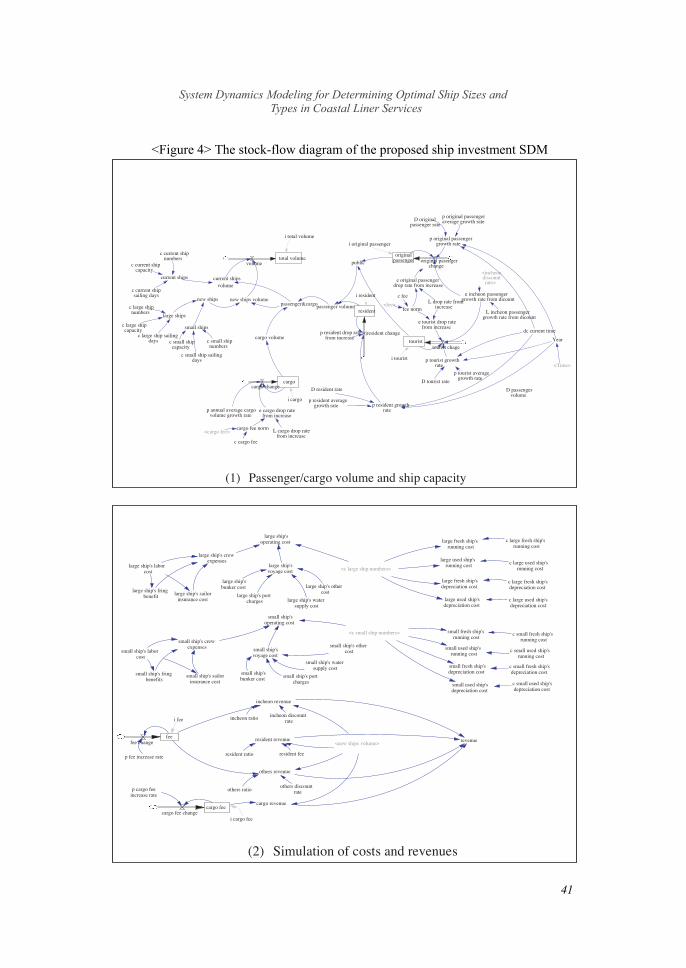
Based on these sub-models, the general stock-flow structure was developed and is shown in Fig 4. The stock and flow model was developed using VENSIM PLE® software.
System Dynamics Modeling for Determining Optimal Ship Sizes and Types in Coastal Liner Services
41
<Figure 4> The stock-flow diagram of the proposed ship investment SDM
(1) Passenger/cargo volume and ship capacity
(2) Simulation of costs and revenues
(1) Passenger/cargo volume and ship capacity
total volumevolume
current ships
c current shipcapacity
c current shipsailing days
new ships
large ships
small shipsc large shipcapacity
c large ship sailingdays c small ship
capacity
c small ship sailingdays
c current shipnumbers
c large shipnumbers
c small shipnumbers
i total volume
cargocargo change
i cargo
p annual average cargovolume growth rate
residentpassenger volume
resident change
public
i resident
p resident growthrate
originalpassenger
tourist
i original passenger
original pasengerchange
tourist chage
i tourist
p original passengeraverage growth rate
p tourist growthrate
e incheon passengergrowth rate from dicount
passenger&cargo
current shipsvolume
new ships volume
Year
dc current time
D originalpassenger rate
p original passengergrowth rate
p tourist averagegrowth rate
D tourist rate
p resident averagegrowth rate
D resident rate
<Time>
cargo volume
e original passengerdrop rate from increase
e tourist drop ratefrom increase
p resident drop ratefrom increase
e cargo drop ratefrom increase
<fee>
<cargo fee> L cargo drop ratefrom increase
cargo fee norm
c cargo fee
D passengervolume
<incheondiscountrate>
L incheon passengergrowth rate from dicount
L drop rate fromincrease
c fee
fee norm
(2) Simulation of costs and revenues
large ship'soperating cost
large ship's crewexpenses
large ship's laborcost
large ship's fringbenefit large ship's sailor
insurance cost
large ship'svoyage cost
large ship'sbunker cost
large ship's portcharges large ship's water
supply cost
large ship's othercost
<c large ship numbers>
small ship'soperating cost
small ship's crewexpenses
small ship's laborcost
small ship's fringbenefits
small ship's sailorinsurance cost
small ship'svoyage cost
small ship'sbunker cost small ship's port
charges
small ship's watersupply cost
small ship's othercost
<c small ship numbers>
large fresh ship'srunning cost
c large fresh ship'srunning cost
large used ship'srunning cost c large used ship's
running cost
small fresh ship'srunning cost
c small fresh ship'srunning cost
small used ship'srunning cost
c small used ship'srunning cost
incheon revenue
incheon ratio incheon discountrate
resident revenue
resident ratio resident fee
others revenue
others ratio
fee<new ships volume>
revenue
cargo revenuecargo fee
fee change
cargo fee change
p fee increase rate
p cargo feeincrease rate
i fee
i cargo fee
others discountrate
large fresh ship'sdepreciation cost
c large fresh ship'sdepreciation cost
large used ship'sdepreciation cost
c large used ship'sdepreciation cost
small fresh ship'sdepreciation cost
c small fresh ship'sdepreciation cost
small used ship'sdepreciation cost
c small used ship'sdepreciation cost

System Dynamics Modeling for Determining Optimal Ship Sizes and Types in Coastal Liner Services
A. Validation of the Model
The ship investment SDM was validated and revised with structural tests, structure-oriented behavior tests, and behavior pattern tests11).
B. Calibration of the Model
The model was calibrated after validation using historical data from 2005 to 2012. Some parameters, such as the Incheon passenger growth rate, tourist growth rate, resident growth rate, cargo growth rate, fee increase rate, and sailing control costs, were revised. The calibration process for the passenger/cargo volumes is shown in Fig 5. The estimated passenger and cargo volumes in recent years have correlation coefficients of 0.89 and 0.95, respectively, which is acceptable.
<Figure 5> Ship investment SDM estimation for the passenger/cargo.
Passenger800,000
600,000
400,000
200,000
0
22
2
22
22
22
2
2
1 1 11
1 11
1
11 1 1
2005 2008 2011 2014 2017 2020 2023Time (Year)
volu
me/
Yea
r
current ships volume[ePassenger] : Normal 1 1 1 1 1 1 1new ships volume[ePassenger] : Normal 2 2 2 2 2 2 2
Cargo400,000
300,000
200,000
100,000
0
22
2
22
22
2 22
2
1 11
11 1
11
1 11
1
2005 2008 2011 2014 2017 2020 2023Time (Year)
volu
me/
Yea
r
current ships volume[eCargo] : Normal 1 1 1 1 1 1
new ships volume[eCargo] : Normal 2 2 2 2 2 2
42
C. Model Testing
There are various types of model tests; the most common ones compare the forecasting error with other methods or use descriptive statistics to assess the point-by-point fit, then calculate the error between a data series and the model output. To test the model, forecasting error between the real data of passenger volumes and the forecasted data was calculated in Table
11) Barlas(1996)

System Dynamics Modeling for Determining Optimal Ship Sizes and Types in Coastal Liner Services
43
3 shown below. The average forecasting error from 2005 to 2012 of passenger is 2.25%, it means using this SDM, the accuracy can reach to 97.75% and also can prove that the proposed method is suitable for forecasting.
<Table 3> Forecasting error of passenger volumes
Passengers (people) Year Real volumes Forecasted volumes Error (%) Average error (%)
2005 222,937 222,937 0.00%
2.25%
2006 240,762 240,783 0.01% 2007 262,045 262,073 0.01% 2008 285,177 285,207 0.01% 2009 272,897 272,897 0.00% 2010 231,262 244,818 5.86% 2011 284,741 307,708 8.07% 2012 340,783 326,928 4.07%
IV. Model Simulations of Different Scenarios
1. The Influence of Ship Size
Due to the ever-increasing passenger and cargo volumes, new ship capacity is an inevitable requirement for the coastal liner services between Incheon and Baengnyeong Island. In this section, the passenger and cargo volumes will be forecasted for the period 2013–2025 based on the current increase rates, as well as scenarios that include a new ship capacity with better service and higher passenger satisfaction. The forecasted results are shown in Table 4.
<Table 4> Forecasted passenger and cargo volumes Passengers (people) Cargo (tons)
Year Current ships New ships Year Current ships New ships 2013 347,467 347,467 2013 240,155 240,155 2014 369,382 369,382 2014 249,497 249,497 2015 392,770 392,770 2015 259,198 259,198 2016 417,733 417,733 2016 269,224 269,224 2017 444,379 444,379 2017 279,583 279,583 2018 472,824 472,824 2018 290,283 290,283 2019 503,195 503,195 2019 301,330 301,330

System Dynamics Modeling for Determining Optimal Ship Sizes and Types in Coastal Liner Services
44
2020 535,622 535,622 2020 312,732 312,732 2021 570,249 570,249 2021 324,494 324,494 2022 585,000 607,228 2022 336,625 336,625 2023 585,000 646,719 2023 349,129 349,129 2024 585,000 688,895 2024 362,014 362,014 2025 585,000 714,000 2025 375,283 375,283
The aim of Table 3 is to show the forecast volume of the passenger
and cargo volume when using the current ships and new ships, thus find whether the capacity of the current ships can accommodate the increasing passenger and cargo volumes. As illustrated by Table 3, the passenger volumes will increase steadily according to the average rate of increase. The passenger volumes of the current ships will increase until 2022, but the capacity of the current ships will not be able to satisfy the increasing numbers of passengers (capacity of the current ships: 585,000 people, forecasted increased number of passengers: 607,228 people). Therefore, given the capacity of the current ships the number of passengers will be constant from 2022 to 2025. However, the number of passengers accommodated by the new ships will increase steadily until 2025 because the new capacity will provide ample space, which will satisfy the increasing number of passengers.
The results show that the new ship capacity should be added before 2021. However, the problem is what type of ship size should be invested to both accommodate the increasing passenger volumes and maximize the benefits for the shipping company. This decision can be made via SDM. When deploying a small-sized ship, the additional ship capacity can accommodate 156,000 people. With the addition of the current ships, the total ship capacity will be 741,000. In 2025, the passenger demand is expected to be 642,718, and this will increase steadily in the future. It is clear that a small-sized ship will not be able to meet the demands of the future passenger volumes. A large-sized ship has a ship capacity of 558,000 people, bringing the total ship capacity to 1,143,000 people. A large-sized ship is a much more suitable investment than a small-sized ship from the viewpoint of passenger volumes.
The cargo shipments between Incheon and Baengnyeong Island are a daily necessity for the residents of Baengnyeong Island. However, the cargo capacity for the current and new ship forecasts have the same result because the cargo needs are much lower than the ships’ capacity (2025

System Dynamics Modeling for Determining Optimal Ship Sizes and Types in Coastal Liner Services
45
cargo: 375,283 tons, capacity of the current ships:523,120 tons). As a result, in order to meet the increasing passenger and cargo volumes,
the coastal liner services between Incheon and Baengnyeong Island should invest in a large-sized ship.
2. The Influence of Ship Type
The issue of determining what type of ship, i.e., new or used, to invest in is an ongoing problem faced by local government and the ship operators in this case study given that the nature of the investment is capital-intensive and there is often a slow return on investment . To this end, a financial analysis was conducted for the period 2013 to 2022 to enable a decision to be made about this problem. The forecasted profits are presented in Table 5.
<Table 5> Forecasted profitsYear New ship Used ship 2013 ( 4,291,720,192) ( 1,905,720,320) 2014 ( 7,937,613,824) ( 3,220,656,128) 2015 ( 10,390,298,624) ( 3,395,854,336) 2016 ( 11,590,746,112) ( 2,370,764,800) 2017 ( 11,479,916,544) ( 84,893,696) 2018 ( 9,996,976,128) 3,524,018,176 2019 ( 7,077,486,592) 8,521,777,152 2020 ( 2,653,421,568) 14,977,744,896 2021 3,346,874,368 22,964,854,784 2022 10,998,628,352 32,559,579,136
Notes: ( ) means deficit, means profit.
According to our analysis, an investment in a new ship would result in the shipping company making a loss for eight years until 2020 because the sailing revenue would be smaller than the sailing costs. Similarly, the purchase of a used ship would make a loss until 2017 after which the company would see profits. Sailing between Incheon and Baengnyeong Island will not produce generous profits for the ship operators due to the passenger fee discounts for residents and Incheon citizens. In addition, Baengnyeong Island holds a military position between North Korea and South Korea, so the government pays more attention to the stability of this
12) Ng and Kee(2008)
System Dynamics Modeling for Determining Optimal Ship Sizes and Types in Coastal Liner Services
46
island. Therefore, the local government should provide some financial assistance to the ship operators so that the coastal liner services can supply more convenient transport services to the island s residents and tourists. The huge capital investment required for a new ship cannot be absorbed by local government and the ship operators, particularly considering the time wasted between ordering a ship and the new ship becoming operational. A new ship investment is therefore not an optimal choice. Hence, our results suggest that the purchase of a used ship would be preferable so as to accommodate the increasing passenger and cargo volumes and provide better customer service while still generating profits, albeit over the long term.
In this section, different scenarios were simulated in the proposed ship investment SDM. The results show that the addition of a used large-sized ship will accommodate the increasing passenger volumes and improve customer service due to the increased number of sailing days.
V. Conclusion
In order to implement investment plans with respect to ship and port construction, accurate forecasts are required because these investments are mostly taken over the long term. This study forecasted passenger and cargo volumes between Incheon and Baengnyeong Island from 2013 to 2025 by using an SDM to solve the social problems emanating from causal relationships in order to accommodate the increasing passenger and cargo volumes and improve customer service. Using the SDM, we employed the existing passenger fee structure to divide the passengers into three groups, i.e., Incheon passengers, tourists, and residents, and proceeded to provide forecasts while taking into consideration the individual growth rates and variables associated with demand. We then investigated whether profits would emerge following investment in a new ship by comparing the revenue created through the forecasted volumes with the costs of the ship operations. It was concluded that deploying a used large-sized ship would accommodate the increasing passenger and cargo volumes, and improve customer service due to the increased number of sailing days.
The results of this study can support decision-makers in both private shipping businesses and in public agencies overseeing the development of
System Dynamics Modeling for Determining Optimal Ship Sizes and Types in Coastal Liner Services
47
the shipping industry. It can help shipping companies to determine the best ship investment strategies that will help them maintain their optimum performance, avoid overcapacity and be successful to service passengers. For the public agencies, they are responsible for development of the shipping industry, using the results they can stipulate economic and financial policies and to promote the development of a specific industry to meet the public needs.
As this study only focused on the increasing volumes and the capacity of the ships, it did not address other factors such as financing factors, economic environment and so on. In order to perform more accurate forecasts, future research should consider supply and demand more closely from both practical and managerial perspectives. Also, to confirm the accuracy of the passenger and cargo forecasts, analyses performed by alternative methodologies, such as ARIMA, are encouraged. Finally, future studies would benefit from not only considering the ability to accommodate demand but also other causal relationships with respect to passengers and ships.
References
BAINES, T.S. and HARRISON, D.K. (1999), “An opportunity for system dynamics in manufacturing system modelling,” Production Planning & Control: The Management of Operations, Vol.10, No. 6, pp.542-552.
BALA, B.K. and SATTER, M.A. (1991), “System dynamics modelling and simulation of biogas production systems,” Renewable Energy, Vol.1, No.5/6, pp.723-728.
BARLAS, Y. (1996), “Formal aspects of model validity and validation in system dynamics,” SystDyn Review, Vol.12, No.3, pp.83-210.
BENDALL, H.B. and STENT A.F. (2005), “Ship investment under uncertainty: Valuing a real option on the maximum of several strategies,” Maritime Economics & Logistics, No. 7, pp. 19–35.
CHUNG,G., KIM, J.H. and KIM, T.W. (2008), “System dynamics modeling approach to water supply system,” Korean Society of Civil Engineers, Vol.12, No.4,
Date of Contribution ; January 30, 2014 Date of Acceptance ; April 1, 2014
System Dynamics Modeling for Determining Optimal Ship Sizes and Types in Coastal Liner Services
48
pp. 275-280.
DANGERFIELD, B. (1992), “The system dynamics modelling process and dysmap2,” European Journal of Operational Research, Vol.59, pp.203-209.
DIEZ, M. and PERI, D. (2010), “Robust optimization for ship conceptual design,” Ocean Engineering, Vol.37, No.11, pp.966-977.
DURYAN,M., NIKOLIK,D., MERODE, G.V. and CURFS, L. (2012), “System dynamics modeling for intellectual disability services: A case study,” Journal of Policy and Practice in Intellectual Disabilities, Vol.9, No.2, pp.112-119.
FAN, L.X. and LUO, M.F. (2013), “Analyzing ship investment behaviour in liner shipping,” Maritime Policy & Management, Vol.40, No.6, pp.511-533.
FLYNN, H., BREGER, D., BELDEN, A., BIER, A., LAURENT, C., ANDREWS, N. and RICKERSON, W. (2010), “System dynamics modeling of the Massachusetts SREC market,” Sustainability, Vol.2, pp.2746-2761.
GARROD, P. and MIKLIUS, W. (1985), “The optimal ship size,” Journal of Transport Economics and Policy, pp.83-90.
HOMER, J.B. and HIRSCH, G.B. (2006), “System dynamics modeling for public health: Background and opportunities,” American Journal of Public Health, Vol.96, No.3. pp.452-458.
HSU, C.I. and HSIEH, Y.P. (2007), “Routing, ship size, and sailing frequency decision-making for a maritime hub-and-spoke container network,” Mathematical and Computer Modelling, Vol.45, No.78, pp.899-916.
INGHELS, D. and DULLAERT, W. (2010),“An analysis of household waste management policy using system dynamics modeling,” Waste Management & Research, Vol.29, No.4, pp.351-370.
JIN, Y. (2008), “Investment in container ships for the Yangtze River: A system dynamics model,” OCEANS 2008, pp.1-7.
Korea Shipping Association Ongjin military government white paper, 2011
LI, L. and SIMONOVIC, S.P. (2002), “System dynamics model for predicting floods from snowmelt in North American prairie watersheds,” Hydrological Processes Journal, Vol.16, pp.2645-2666.
MACDONALD, B., POTTER, J.M.M. and JENSEN, K.O. (2003), “Long-term business model in using system dynamics,” BT Technology Journal, Vol.21, No.2, pp.158-169.

System Dynamics Modeling for Determining Optimal Ship Sizes and Types in Coastal Liner Services
49
MILLER, G.R., CABLE, J.M., MCDONALD, A.K., BOND, B., FRANZ, T.E., WANG, L., GOU, S., TYLE, A.P., ZOU, C.B. and SCOTT, R.L. (2012), “Understanding eco hydrological connectivity in savannas: A system dynamics modelling approach,” Ecohydrol, Vol.5, pp.200-220.
MIYASHITA, K. (1982), “A quarterly econometric analysis of ship investment planning behaviour in the world bulk carrier industry,” Maritime Policy & Management: The Flagship Journal of International Shipping and Port Research, Vol.9, No.2, pp.115-133.
NG, A.K.Y. and KEE, J.K.Y. (2008), “The optimal ship sizes of container liner feeder services in Southeast Asia: A ship operator’s perspective,” Maritime Policy & Management, Vol.35, No.4, pp.353-376.
NIELSEN, S. and NIELSEN, E.H. (2008), “System dynamics modelling for a balanced scorecard,” Management Research News, Vol.31, No.3, pp.169-188.
OJOAWO, G.B., AGBEDE, O.A. and SANGODOYIN, A.Y. (2012), “System dynamics modeling of dumpsite leachate control in ogbomosoland, nigeria,”Journal of Environmental Protection, Vol.3, pp.120-128.
OZBAYRAK, M., PAPADOPOULOU, T.C. and AKGUN, M. (2007), “Systems dynamics modelling of a manufacturing supply chain system,” Simulation Modelling Practice and Theory, Vol.15, pp.1338-1355.
PARK, M., LEE, S.H .and KIM, W. (2009), “Strategies for design-build in Korea using system dynamics modeling,” Journal of Construction Engineering and Management, Vol.135, pp.1125-1137.
POLES, R. (2013), “System dynamics modelling of a production and inventory system for remanufacturing to evaluate system improvement strategies,” International Journal Production Economics, Vol.144, pp.189-199.
PRASAD, D. and MALL, R.N. (2012), “Replacement analysis for defected products: A system dynamic modeling approach,” International Journal of Engineering Science and Technology (IJEST), Vol. 4, No.7, pp.3140-3144.
RAJASEKARAM, V., MCBEAN, G.A. and SIMONOVIC, S.P. (2010), “A systems dynamic modelling approach to assessing elements of a weather forecasting system,” Atmosphere-Ocean, Vol.48, No.1, pp.1-9.
REDDI, K.R., LI, W., WANG, B. and MOON, Y. (2013), “System dynamics modelling of hybrid renewable energy systems and combined heating and power generator,” International Journal of Sustainable Engineering, Vol.6, No.1, pp.31-47.

System Dynamics Modeling for Determining Optimal Ship Sizes and Types in Coastal Liner Services
50
RODRIGUES, L.L.R., GUPTA, K. and MOTLAGH, F.G. (2012), “Vehicle fuel consumption modelling: A system dynamics approach,” Proceedings of the World Congress on Engineering, Vol.III, WCE 2012, July 4 - 6, 2012, London, U.K.
SHAFIEI, E., STEFANSSON, H., ASGEIRSSON, E.I., DAVIDSDOTTIR, B. and RABERTO, M. (2013), “Integrated agent-based and system dynamics modelling for simulation of sustainable mobility,” Transport Reviews: A Transnational Trans disciplinary Journal, Vol.33, No.1, pp.44-70.
SIMONOVIC, S.P. and LI, L. (2003), “Methodology for assessment of climate change impacts on large-scale flood protection system,” Journal of Water Resources. Planning Management, Vol.129, pp.361-372.
SUŠNIK, J., VAMVAKERIDOU-LYROUDIA, L.S., SAVI , D.A. and KAPELAN, Z. (2012), “Integrated system dynamics modelling for water scarcity assessment: Case study of the Kairouan region,” Science of the Total Environment, Vol.440, pp.290–306.
TRAPPEY, A.J.C., TRAPPEY, C.V., HSIAO, C.T., OU, J.J.R. and CHANG, C.T. (2012), “System dynamics modelling of product carbon footprint life cycles for collaborative green supply chains,” International Journal of Computer Integrated Manufacturing, Vol.25, No.10, pp.934-945.
WANG, W.T. (2011), “System dynamics modeling for examining knowledge transfer during crises,” System Research and Behavioral Science, Vol.28, pp.105-127.
ZARGHAMI, M. and AKBARIYE, S. (2012), “System dynamics modeling for complex urban water systems: Application to the city of Tabriz, Iran, Resources,” Conservation and Recycling, Vol. 60, pp.99-106.
ZHONG, H.W. (2000), “AHP method on the weight of entropy and it's application in ship investment decision making,” Journal of Shanghai Maritime University, Vol.1, pp.99-103.