Embed Size (px)
Citation preview

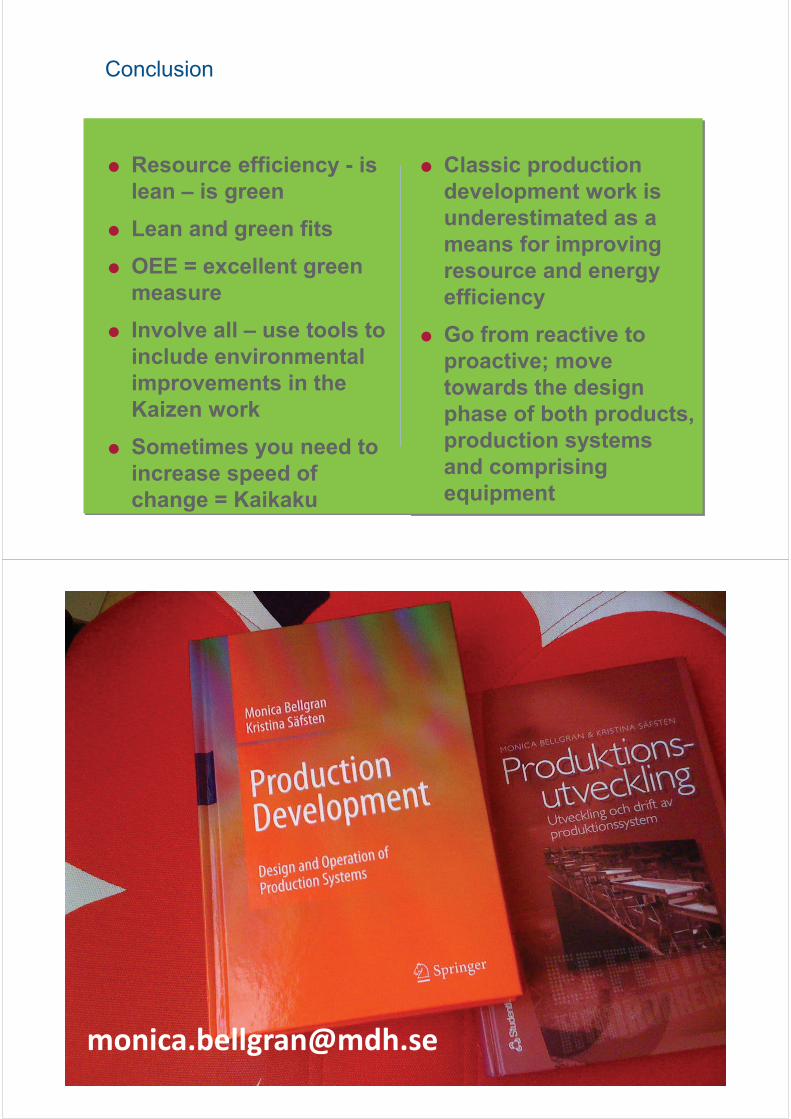
Competitive and sustainable production Monica Bellgran Mälardalen University
Integrated research profile on ”Innovation and Product realisation” – 3 divisions
Innovation and product realisation
Innovation management
Management and organisation to realise new products, services, business models, technologies or production systems.
Product realization
Processes /methods to develop, manufacture and deliver goods and services.
• Product industrialization • Production system design • Sustainable production
Design and Visualization
Analysis and interpretation of images, room and text, based on human centred design.
Three practice oriented research groups with a common PhD education
What is competitiveness?
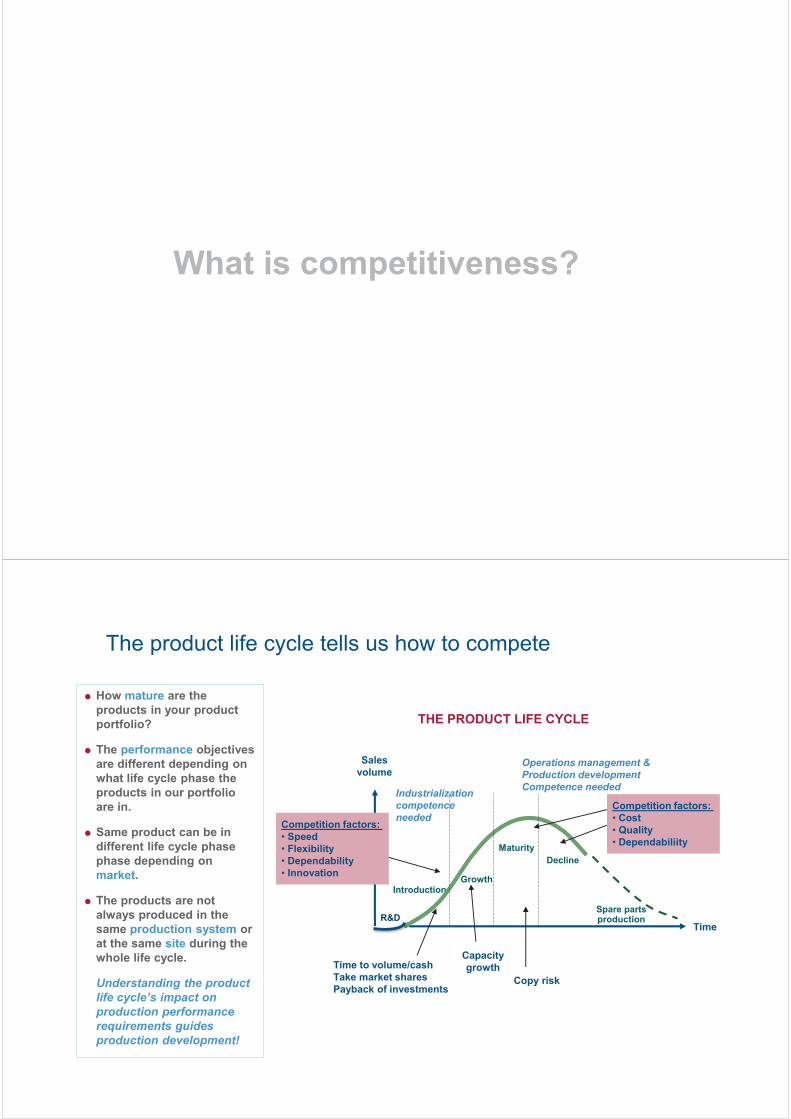
The product life cycle tells us how to compete
How mature are the products in your product portfolio?
The performance objectives are different depending on what life cycle phase the products in our portfolio are in.
Same product can be in different life cycle phase phase depending on market.
The products are not always produced in the same production system or at the same site during the whole life cycle.
Understanding the product life cycle’s impact on production performance requirements guides production development!
Time
Introduction Growth
Maturity Decline
Sales volume
Time to volume/cash Take market shares Payback of investments
Copy risk
Capacity growth
THE PRODUCT LIFE CYCLE
Competition factors: • Cost • Quality • Dependabiliity
Competition factors: • Speed • Flexibility • Dependability • Innovation
Industrialization competence needed
Operations management & Production development Competence needed
R&D Spare parts production
Industrial Sales volume
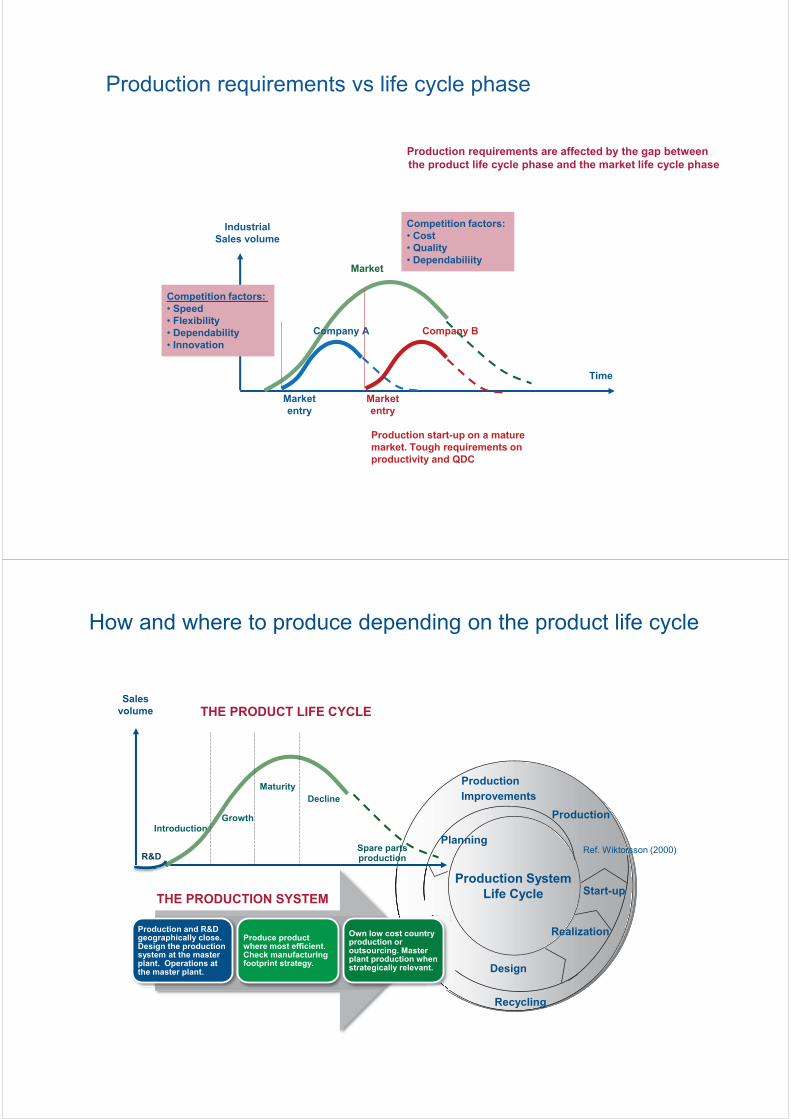
Production requirements are affected by the gap between the product life cycle phase and the market life cycle phase
Competition factors: • Cost • Quality • Dependabiliity
Production requirements vs life cycle phase
Time
Market
Company A
Market entry
Market entry
Production start-up on a mature market. Tough requirements on productivity and QDC
Company B
Competition factors: • Speed • Flexibility • Dependability • Innovation
Time
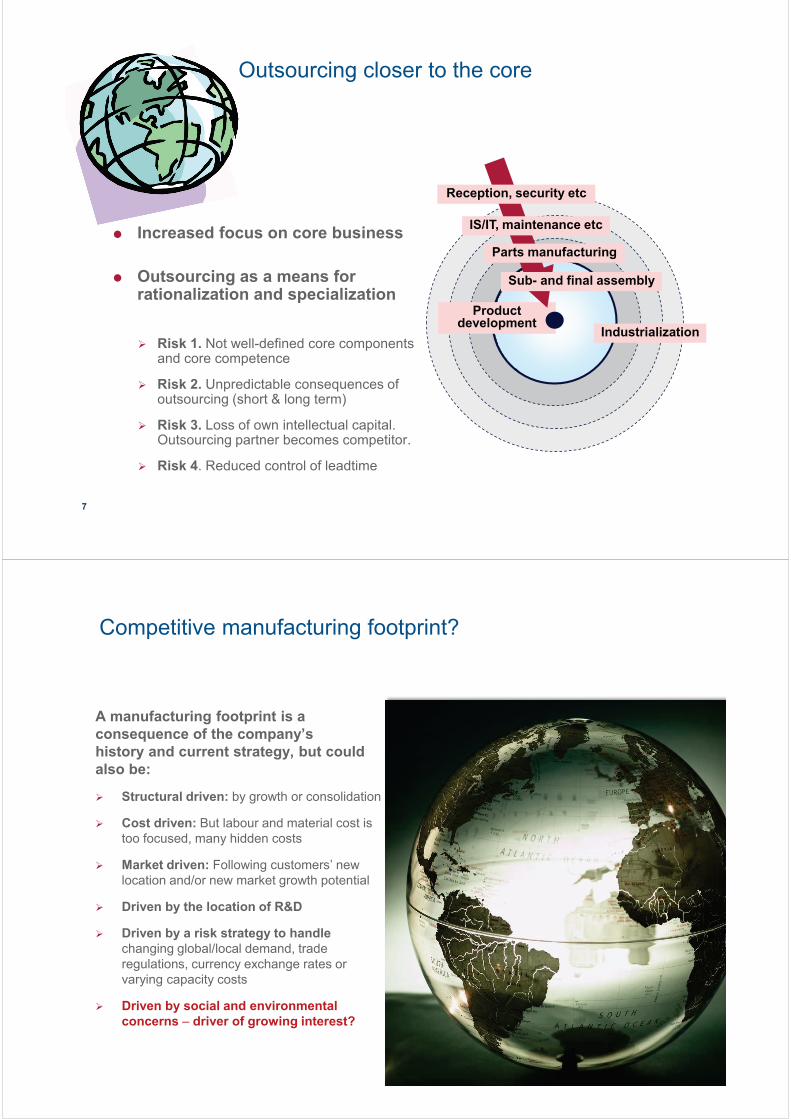
Planning
Design
Realization
Production
Production Improvements
Recycling
Start-up
Ref. Wiktorsson (2000)
Production System Life Cycle
How and where to produce depending on the product life cycle
Introduction Growth
Maturity Decline
Sales volume THE PRODUCT LIFE CYCLE
R&D Spare parts production
Production and R&D geographically close. Design the production system at the master plant. Operations at the master plant.
Produce product where most efficient. Check manufacturing footprint strategy.
Own low cost country production or outsourcing. Master plant production when strategically relevant.
THE PRODUCTION SYSTEM
Outsourcing closer to the core
Increased focus on core business
Outsourcing as a means for rationalization and specialization
Risk 1. Not well-defined core components and core competence
Risk 2. Unpredictable consequences of outsourcing (short & long term)
Risk 3. Loss of own intellectual capital. Outsourcing partner becomes competitor.
Risk 4. Reduced control of leadtime
Industrialization Product
development
Reception, security etc
IS/IT, maintenance etc
Parts manufacturing
Sub- and final assembly
7
A manufacturing footprint is a consequence of the company’s history and current strategy, but could also be:
Structural driven: by growth or consolidation
Cost driven: But labour and material cost is too focused, many hidden costs
Market driven: Following customers’ new location and/or new market growth potential
Driven by the location of R&D
Driven by a risk strategy to handle changing global/local demand, trade regulations, currency exchange rates or varying capacity costs
Driven by social and environmental concerns – driver of growing interest?
Competitive manufacturing footprint?
Build the factory… Industrialize new products… Run the factory…
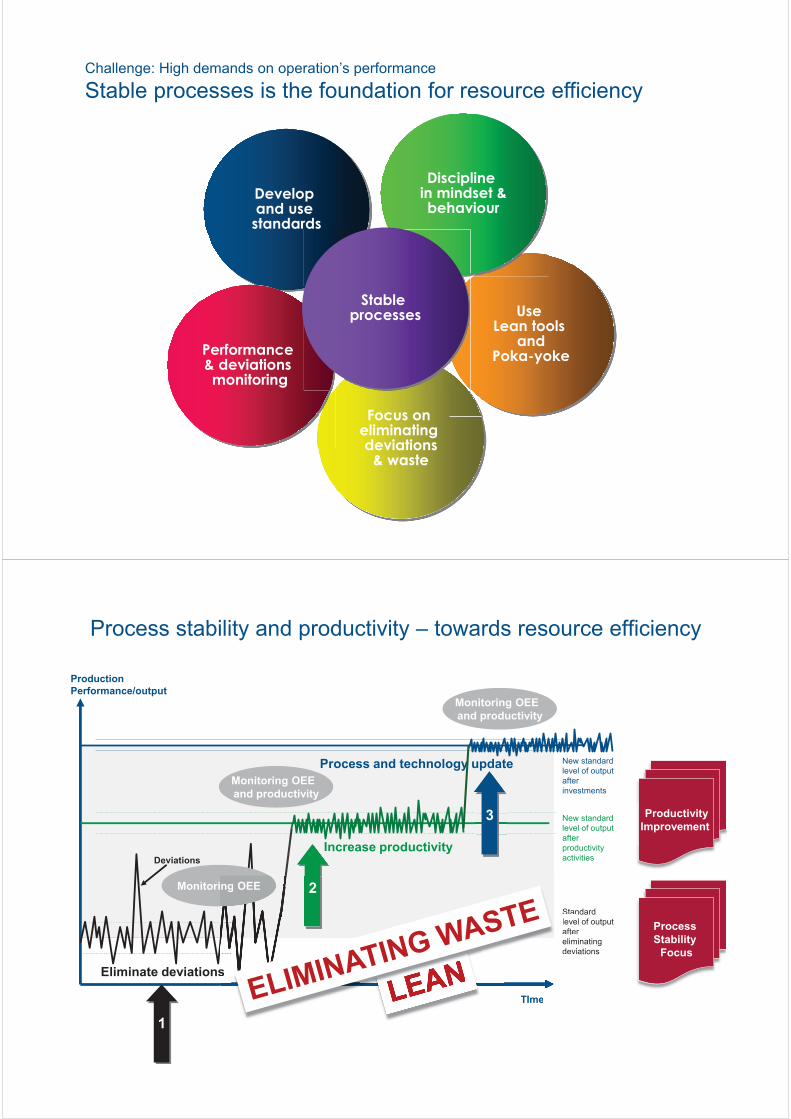
Focus on eliminating deviations
& waste
Use Lean tools
and Poka-yoke
Discipline in mindset & behaviour
Develop and use
standards
Performance & deviations monitoring
Challenge: High demands on operation’s performance
Stable processes is the foundation for resource efficiency
Stable processes
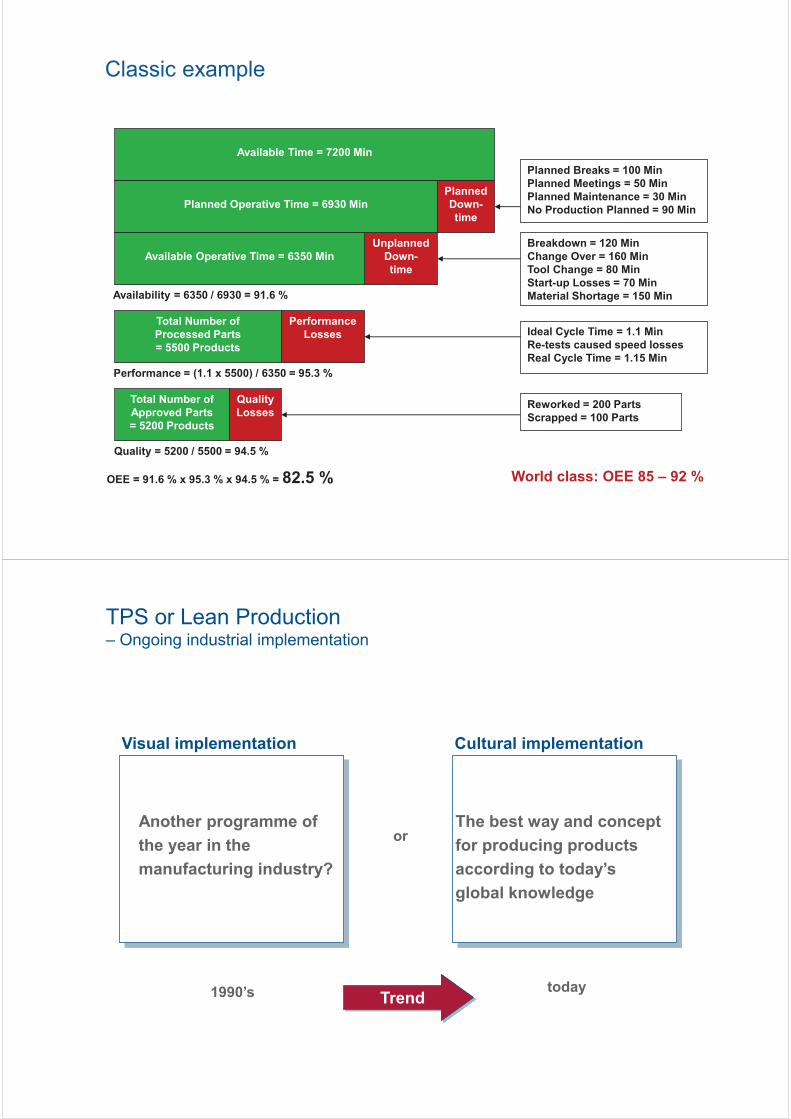
Process stability and productivity – towards resource efficiency
Process and technology update
Deviations
Eliminate deviations
Increase productivity
Process Stability
Focus
Productivity Improvement
Production Performance/output
TIme
Monitoring OEE
New standard level of output after productivity activities
Standard level of output after eliminating deviations
New standard level of output after investments
Monitoring OEE and productivity
Monitoring OEE and productivity
In
s
ng OEE
Stanleveafterelimdevi
TIme
g OEE 2
3
1
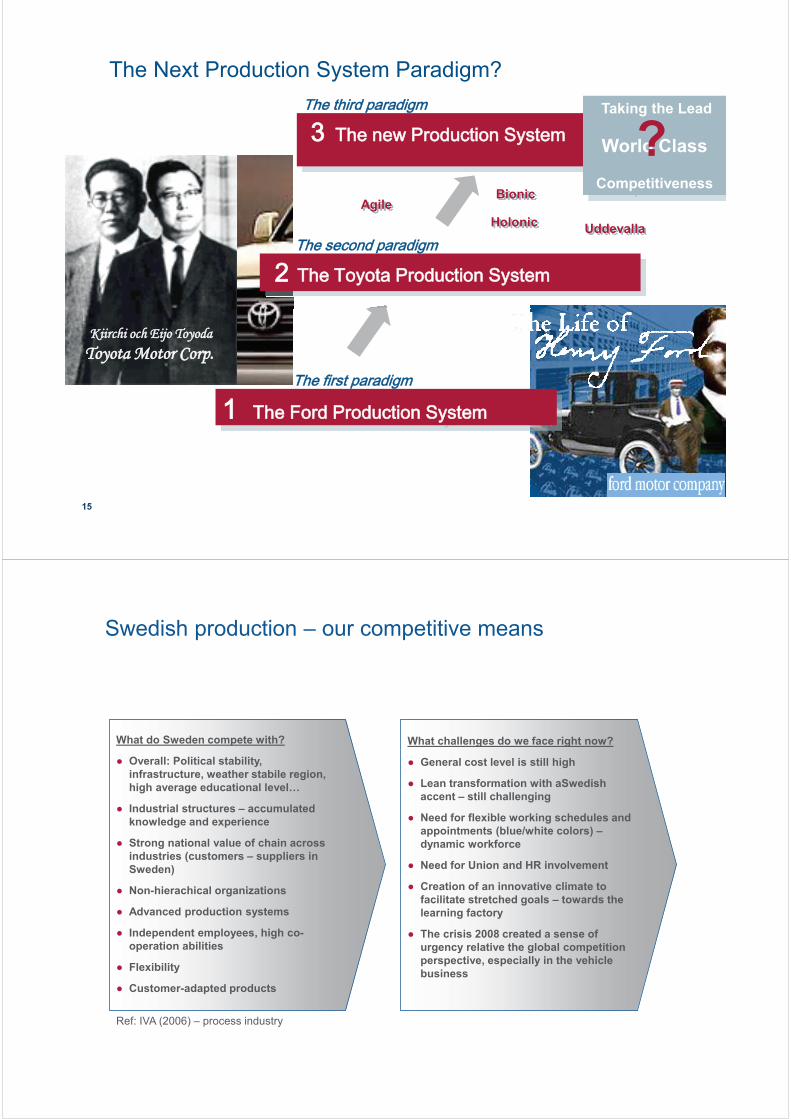
Available Time = 7200 Min
Planned Breaks = 100 Min Planned Meetings = 50 Min Planned Maintenance = 30 Min No Production Planned = 90 Min
Breakdown = 120 Min Change Over = 160 Min Tool Change = 80 Min Start-up Losses = 70 Min Material Shortage = 150 Min
Ideal Cycle Time = 1.1 Min Re-tests caused speed losses Real Cycle Time = 1.15 Min
Reworked = 200 Parts Scrapped = 100 Parts
Planned Down- time
Unplanned Down- time
Total Number of Processed Parts = 5500 Products
Performance Losses
Total Number of Approved Parts = 5200 Products
Quality Losses
Planned Operative Time = 6930 Min
Available Operative Time = 6350 Min
Availability = 6350 / 6930 = 91.6 %
Performance = (1.1 x 5500) / 6350 = 95.3 %
Quality = 5200 / 5500 = 94.5 %
OEE = 91.6 % x 95.3 % x 94.5 % = 82.5 % World class: OEE 85 – 92 %
Classic example
TPS or Lean Production – Ongoing industrial implementation
Another programme of the year in the manufacturing industry?
The best way and concept for producing products according to today’s global knowledge
or
Trend 1990’s today
Visual implementation Cultural implementation
15
KKiirchi och Eijo Toyoda Toyota Motor Corp.
Taking the Lead
World Class
Competitiveness
The Next Production System Paradigm?
Holonic
Bionic Agile
Uddevalla
?
Swedish production – our competitive means
What challenges do we face right now?
● General cost level is still high
● Lean transformation with aSwedish accent – still challenging
● Need for flexible working schedules and appointments (blue/white colors) – dynamic workforce
● Need for Union and HR involvement
● Creation of an innovative climate to facilitate stretched goals – towards the learning factory
● The crisis 2008 created a sense of urgency relative the global competition perspective, especially in the vehicle business
What do Sweden compete with?
● Overall: Political stability, infrastructure, weather stabile region, high average educational level…
● Industrial structures – accumulated knowledge and experience
● Strong national value of chain across industries (customers – suppliers in Sweden)
● Non-hierachical organizations
● Advanced production systems
● Independent employees, high co-operation abilities
● Flexibility
● Customer-adapted products
Ref: IVA (2006) – process industry
17
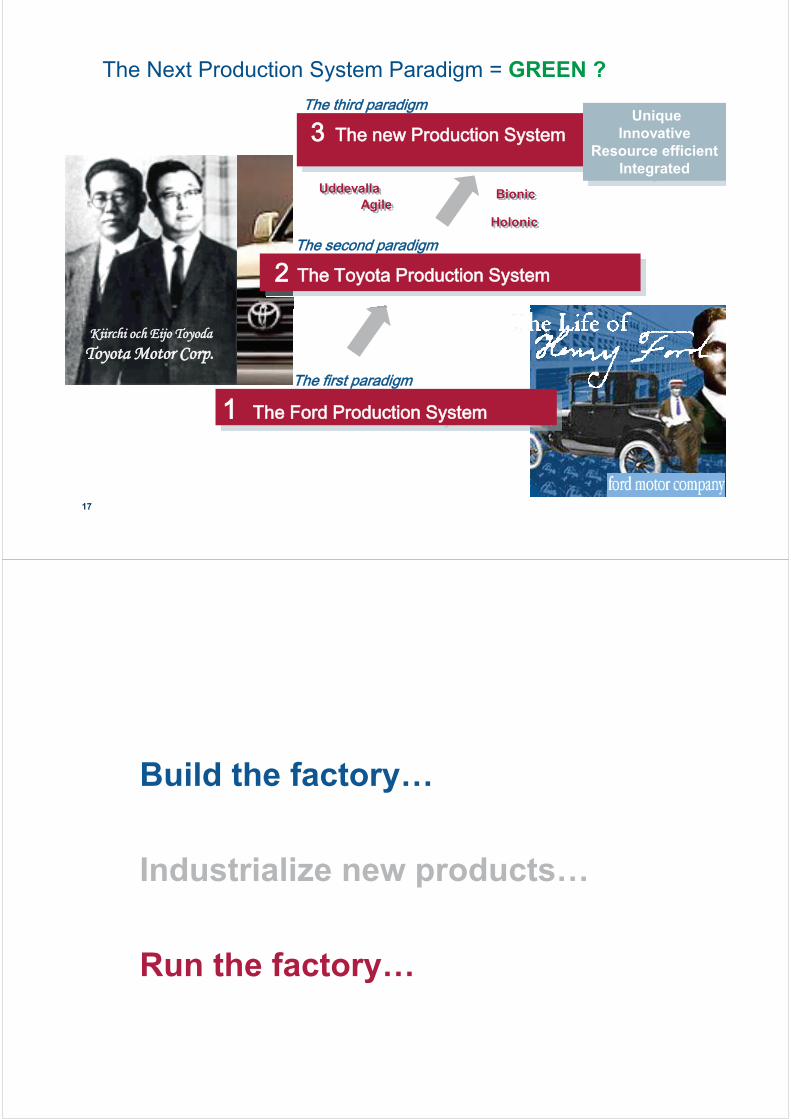
KKiirchi och Eijo Toyoda Toyota Motor Corp.
Unique Innovative
Resource efficient Integrated
The Next Production System Paradigm = GREEN ?
Holonic
Bionic Agile AgileA il
Uddevalla
Build the factory… Industrialize new products… Run the factory…
19
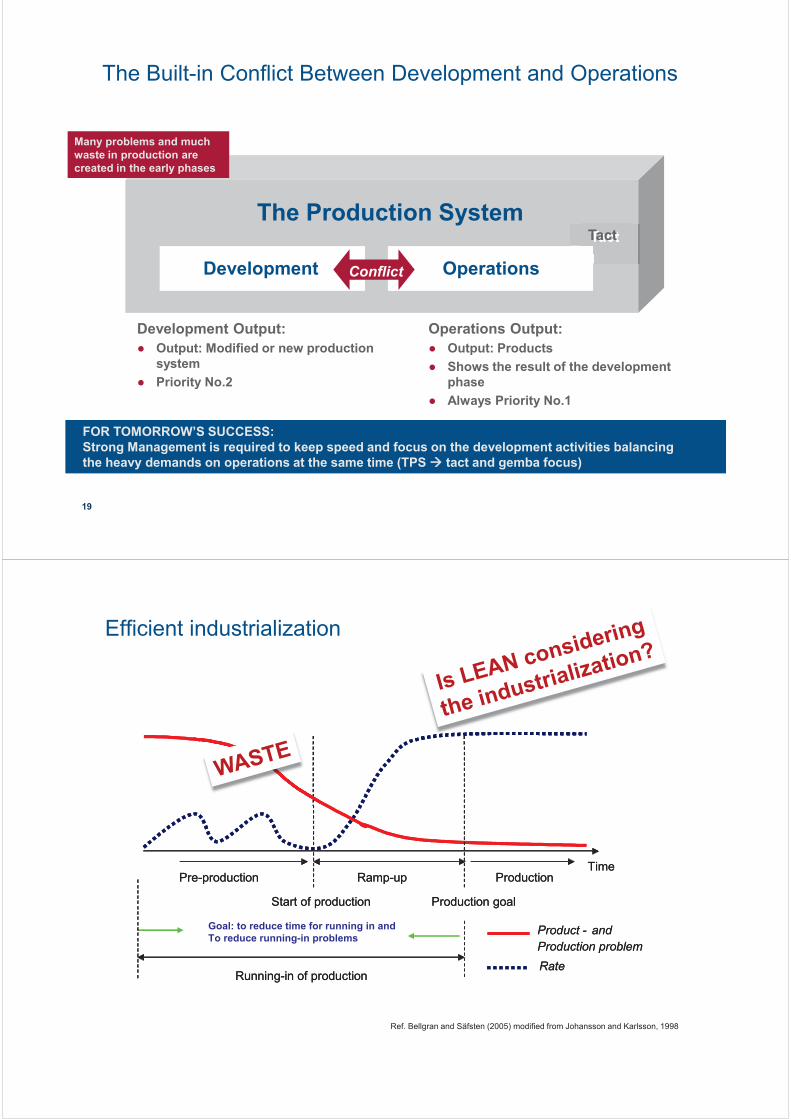
The Built-in Conflict Between Development and Operations
The Production System
Development Operations Conflict
Development Output: ● Output: Modified or new production
system ● Priority No.2
Operations Output: ● Output: Products ● Shows the result of the development
phase ● Always Priority No.1
Tact
FOR TOMORROW’S SUCCESS: Strong Management is required to keep speed and focus on the development activities balancing
the heavy demands on operations at the same time (TPS tact and gemba focus)
Many problems and much waste in production are created in the early phases
Goal: to reduce time for running in and To reduce running-in problems
Time
Start of production
Pre-production Ramp-up Production
Production goal
Running-in of productionRate
Product - and Production problem
Time
Start of production
Pre-production Ramp-up Production
Production goal
Running-in of productionRate
Product - and Production problem
Ref. Bellgran and Säfsten (2005) modified from Johansson and Karlsson, 1998
Efficient industrialization
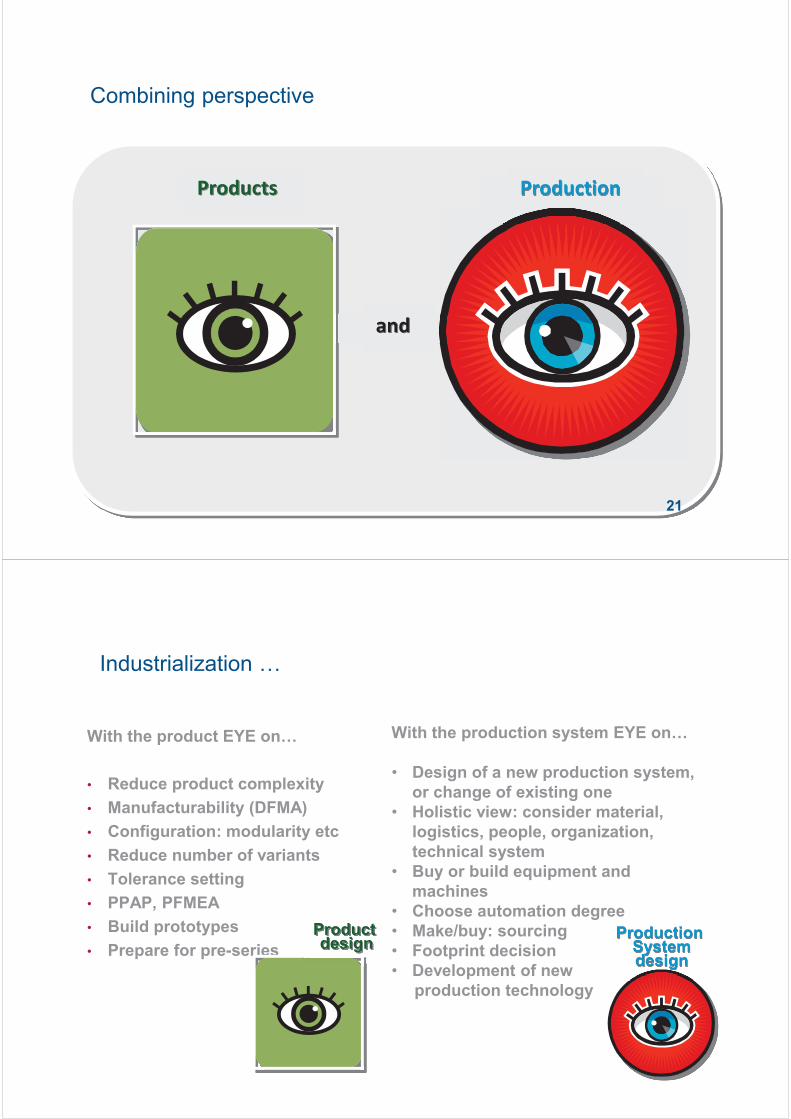
Products Production
Combining perspective
and
21
With the product EYE on…
• Reduce product complexity • Manufacturability (DFMA) • Configuration: modularity etc • Reduce number of variants • Tolerance setting • PPAP, PFMEA • Build prototypes • Prepare for pre-series
Product design Production
System design
Industrialization …
With the production system EYE on… • Design of a new production system,
or change of existing one • Holistic view: consider material,
logistics, people, organization, technical system
• Buy or build equipment and machines
• Choose automation degree • Make/buy: sourcing • Footprint decision • Development of new production technology
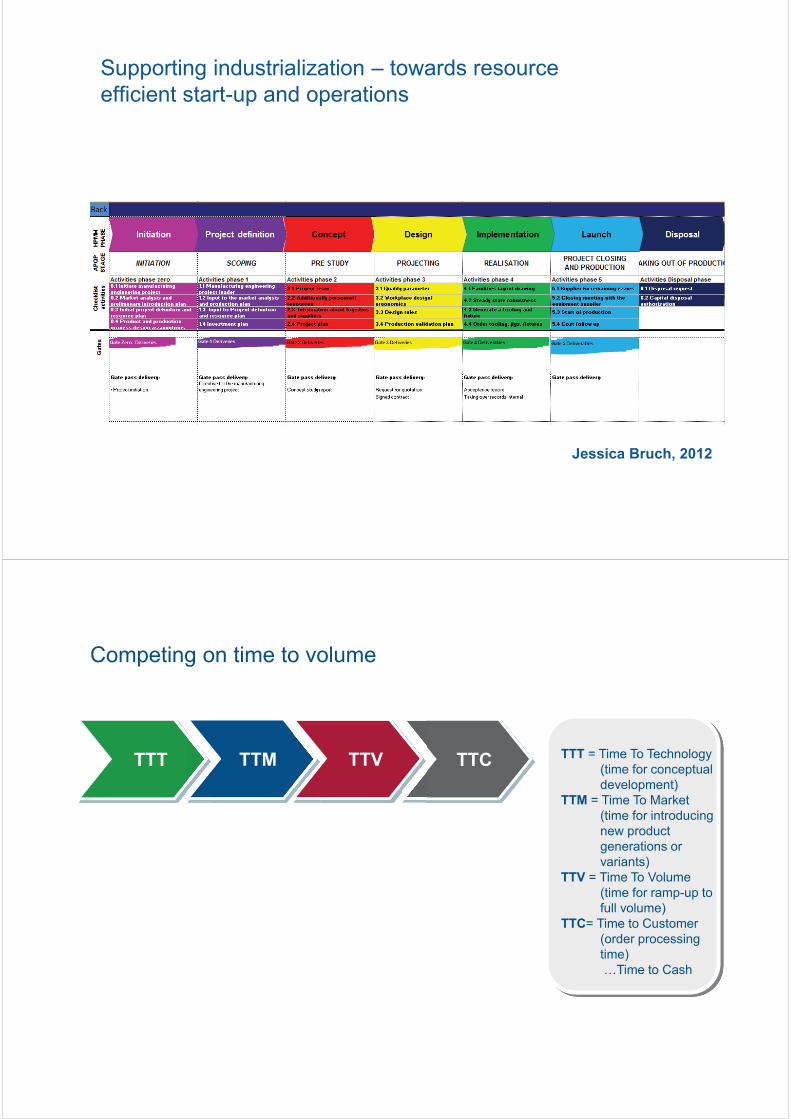
Supporting industrialization – towards resource efficient start-up and operations
Jessica Bruch, 2012
TTT TTM TTC TTV TTT = Time To Technology (time for conceptual development)
TTM = Time To Market (time for introducing new product generations or variants)
TTV = Time To Volume (time for ramp-up to full volume)
TTC= Time to Customer (order processing time)
…Time to Cash
Competing on time to volume
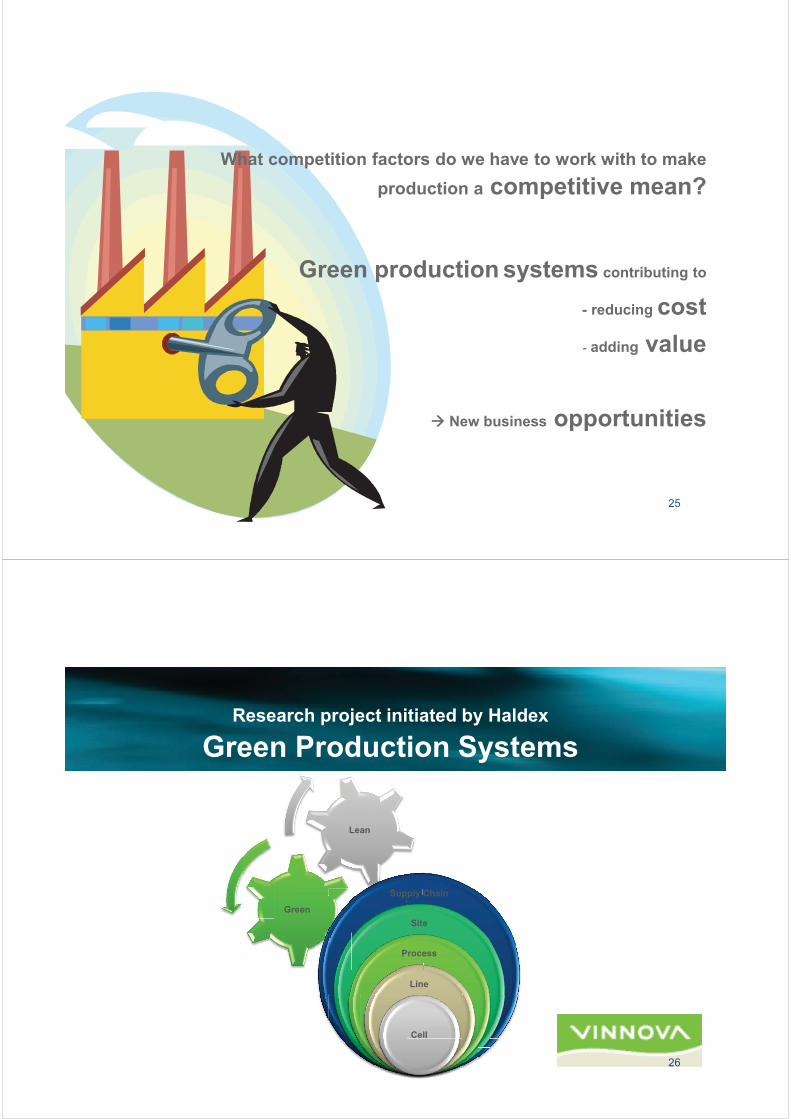
What competition factors do we have to work with to make production a competitive mean?
Green production systems contributing to
- reducing cost - adding value
New business opportunities
25
2013-10-15
Research project initiated by Haldex Green Production Systems
Clean
Green
Lean
Supply Chain
Site
ClProcess
ClClClCllClClClCllCllClCllClllClClClClCCCCCClClClCCCCCCClllllCCCCCClCCCCCCCCCCCCCCCCCCClCCCCCCCCCCCClCCCCCCC eeeeeeeeeeeeeeeeeeeeeeeeeeeeeeeeeaeaeaaeaeaeaeaaaaaaaeaeaaeaaeaeaaaeaeaeaeaeaeaeaaeeeeaeaeaeaeaeaaeeeaaeaeeeeaaeaeaeaeeeaeaeaeaeeeeaeaeeaeeannnnnnnnnnnnnnnnnnnnnnnLine
Cell
26
alfdex
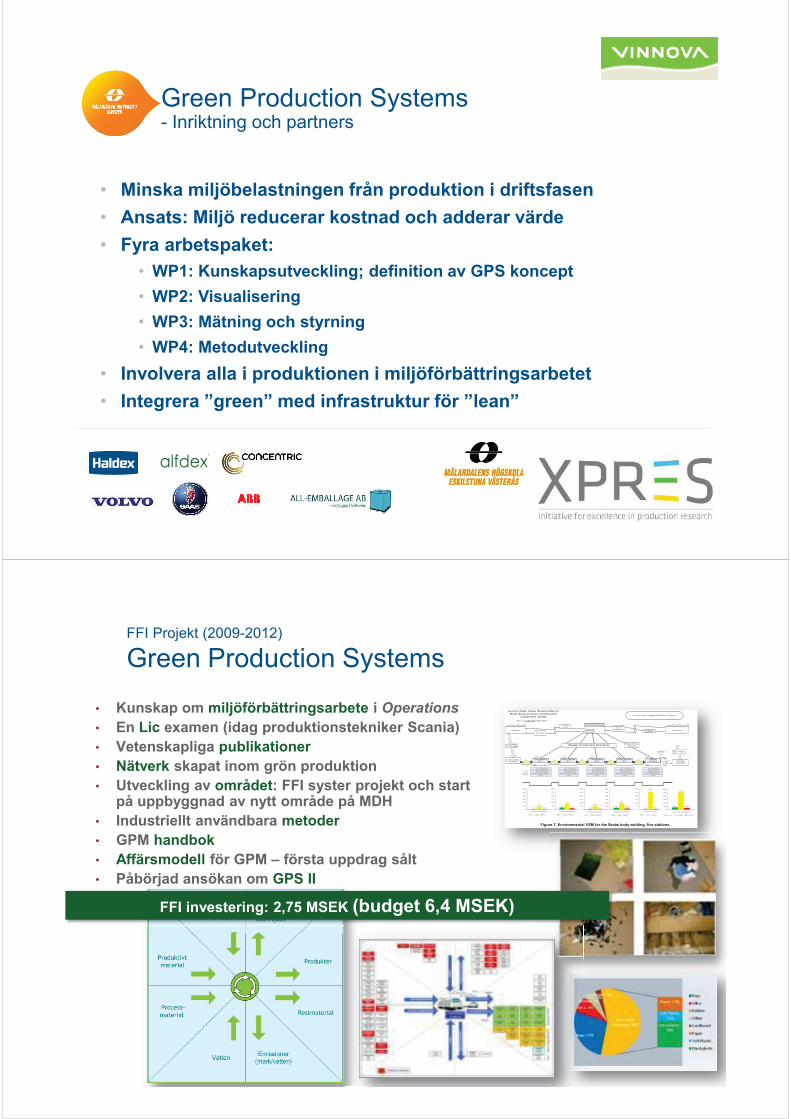
Green Production Systems - Inriktning och partners
• Minska miljöbelastningen från produktion i driftsfasen • Ansats: Miljö reducerar kostnad och adderar värde • Fyra arbetspaket:
• WP1: Kunskapsutveckling; definition av GPS koncept • WP2: Visualisering • WP3: Mätning och styrning • WP4: Metodutveckling
• Involvera alla i produktionen i miljöförbättringsarbetet • Integrera ”green” med infrastruktur för ”lean”
FFI Projekt (2009-2012)
Green Production Systems
Tack-weldingNo 1
Robot weldingNo 1
Tack-weldingNo 2
Robot weldingNo 2
Manualfinishing
2 2 2
C/T = 1.20 hrs
C/O = 10 mins
Uptime = 98%
Working Time = 29,520 sec
2 shifts
C/T = 1.80 hrs
C/O = 10 mins
Uptime = 100%
Working Time = 29,520 sec
2 shifts
C/T = 2.00 hrs
C/O = 10 mins
Uptime = 95%
Working Time = 29,520 sec
2 shifts
C/T = 1.60 hrs
C/O = 10 mins
Uptime = 100%
Working Time = 29,520 sec
2 shifts
C/T = 3.25 hrs
C/O = 15 mins
Uptime = 95%
Working Time = 29,520 sec
2 shifts
Production Planning
MAPICS
Weekly Production Schedule
CustomerSupplier
80 pcs / month
20 pcs / week
9 hrs / shift
0.8 hrs break time / shift
2 shiftsDaily DeliverySchedule
1.5 days
I
12
1.5 daysof
productiondemand
Laser CuttingForming
TuesdayThursday
PaintingAssembly
1 X day
90/60/30 daysforecast
0030 0040 0050 0060 0070
Daily DeliverySchedules
Daily faxes
6 weeksforecast
3
I
1.2 hrs 1.8 hrs 2 hrs 1.6 hrs 3.25 hrs
Current State Value Stream Map forBody Shop at Volvo Construction
Equipment, Braås
Takt Time= 492 min / 4 pcs= 123 min= 2.05 hrs
1111
I I I I
0.125 days 0.125 days 0.125 days 0.125 days
Item no 11194273 KORG A40E
0.366 days Total Lead Time =2.366 days
Total Value AddingTime = 9.85 hrs
Environmental Targets and Goals in 5 years:
3,07
40,7
4,630
50
100
150
200
250
300
Energy Consumption
VA NNVA NVA
28
79,72
17,81
0
50
100
150
200
250
300
Energy Consumption
VA NNVA NVA
7,32
50,57
4,870
50
100
150
200
250
300
Energy Consumption
VA NNVA NVA
28
89,5
17,81
0
50
100
150
200
250
300
Energy Consumption
VA NNVA NVA
3,05
252,79
9,7
0
50
100
150
200
250
300
Energy Consumption
VA NNVA NVA
69,44
513,28
54,82
0
100
200
300
400
500
600
Total Energy Consumption
Total VA Total NNVA Total NVA
Figure 7. Environmental VSM for the Braås body welding, five stations.
• Kunskap om miljöförbättringsarbete i Operations • En Lic examen (idag produktionstekniker Scania) • Vetenskapliga publikationer • Nätverk skapat inom grön produktion • Utveckling av området: FFI syster projekt och start
på uppbyggnad av nytt område på MDH • Industriellt användbara metoder • GPM handbok • Affärsmodell för GPM – första uppdrag sålt • Påbörjad ansökan om GPS II
FFI investering: 2,75 MSEK (budget 6,4 MSEK)
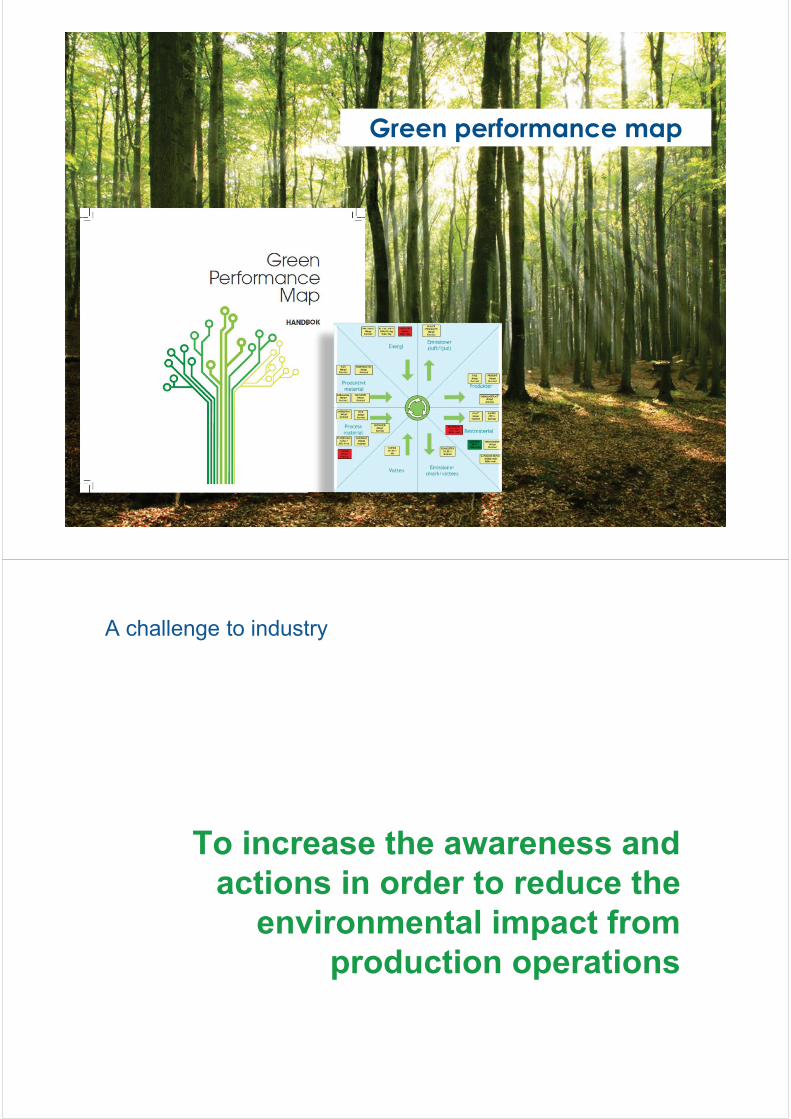
Green performance map
To increase the awareness and
actions in order to reduce the environmental impact from
production operations
A challenge to industry
- Engage all in environmental improvements. - Measure and follow up – use relevant KPI’s.
- Identify ”double KPI’s”: performance and green
Engage all employees – important for both lean and green
From reactive to proactive
Put tough environmental requirements on the design and purchase of new LEAN
and GREEN production equipment
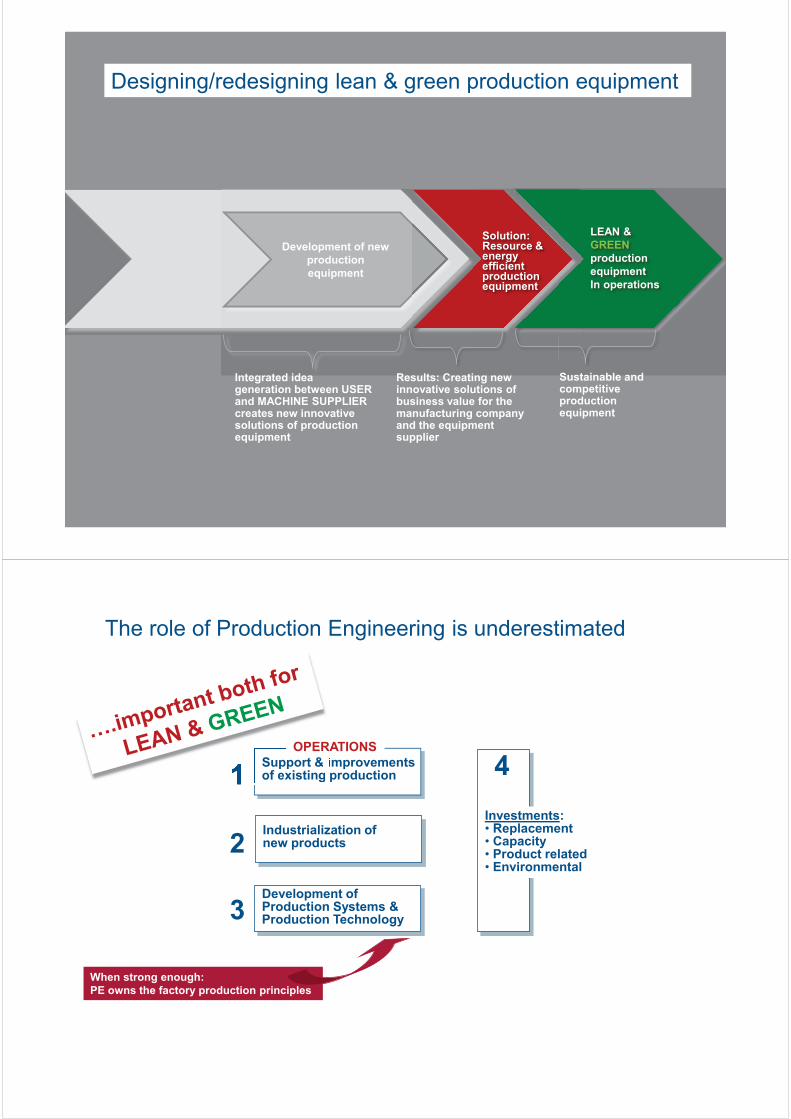
Designing/redesigning lean & green production equipment
Development of new
production equipment
Results: Creating new innovative solutions of business value for the manufacturing company and the equipment supplier
Solution: Resource & energy efficient production equipment
Integrated idea generation between USER and MACHINE SUPPLIER creates new innovative solutions of production equipment
LEAN & GREEN production equipment In operations
Sustainable and competitive production equipment
Investments: • Replacement • Capacity • Product related • Environmental
Industrialization of new products
Support & improvements of existing production
Development of Production Systems & Production Technology
1
2
3
4
When strong enough: PE owns the factory production principles
The role of Production Engineering is underestimated
OPERATIONS imp
RASupport & iof existing
OPER
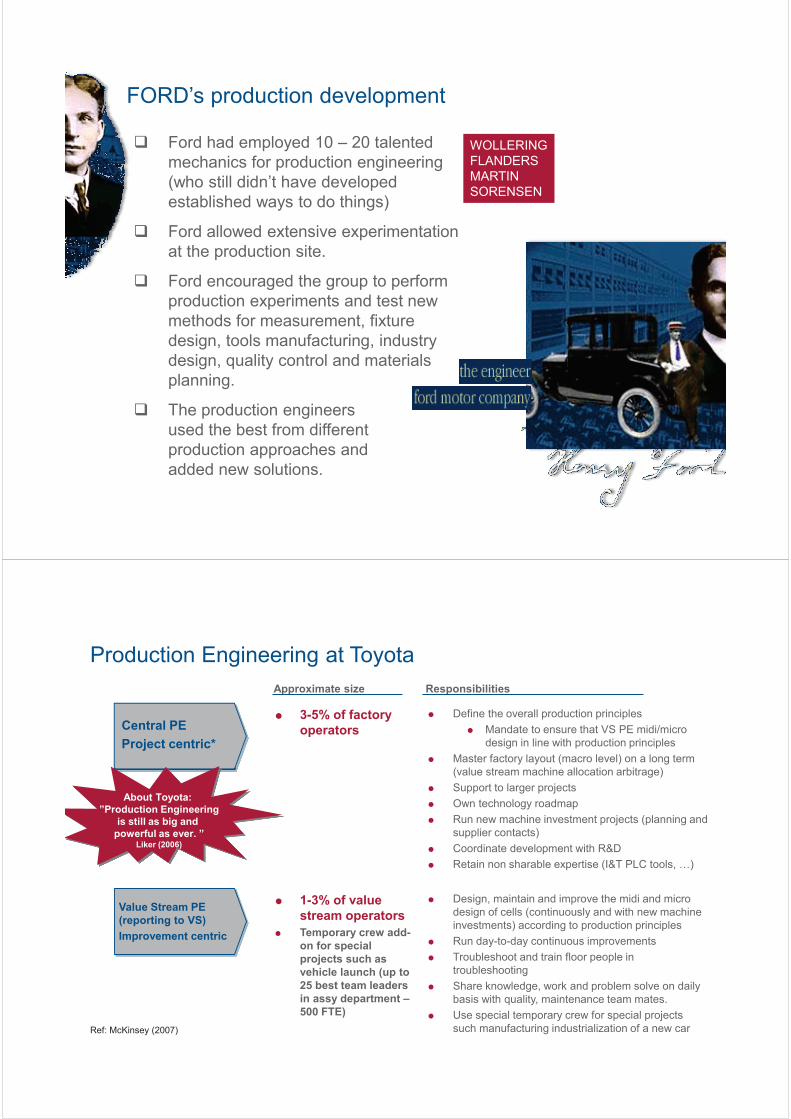
Ford had employed 10 – 20 talented mechanics for production engineering (who still didn’t have developed established ways to do things)
Ford allowed extensive experimentation at the production site.
Ford encouraged the group to perform production experiments and test new methods for measurement, fixture design, tools manufacturing, industry design, quality control and materials planning.
The production engineers used the best from different production approaches and added new solutions.
WOLLERING FLANDERS MARTIN SORENSEN
FORD’s production development
Central PE Project centric*
Responsibilities Approximate size
3-5% of factory operators
Define the overall production principles Mandate to ensure that VS PE midi/micro design in line with production principles
Master factory layout (macro level) on a long term (value stream machine allocation arbitrage) Support to larger projects Own technology roadmap Run new machine investment projects (planning and supplier contacts) Coordinate development with R&D Retain non sharable expertise (I&T PLC tools, …)
Value Stream PE (reporting to VS) Improvement centric
1-3% of value stream operators Temporary crew add-on for special projects such as vehicle launch (up to 25 best team leaders in assy department – 500 FTE)
Design, maintain and improve the midi and micro design of cells (continuously and with new machine investments) according to production principles Run day-to-day continuous improvements Troubleshoot and train floor people in troubleshooting Share knowledge, work and problem solve on daily basis with quality, maintenance team mates. Use special temporary crew for special projects such manufacturing industrialization of a new car
About Toyota: ”Production Engineering
is still as big and powerful as ever. ”
Liker (2006)
Production Engineering at Toyota
Ref: McKinsey (2007)
Toyota benchmark – Reference to No of Production Engineers and Production Developers at Toyota
3-5 % of factory operators – Production Developers 1-3 % of value stream operators – Production Engineers
Estimated No PE and PD for a company of 500 blue collar:
500 factory operators (including all blue collar) 15-25 PD Of them: 400 value stream operators 4-12 PE Total Production Engineering Staff: 19 – 37 PD + PE
Factors affecting the number of PE and PD:
Size of company OEM or supplier Business: assembly and/or machining Product complexity and production volume Production complexity Management mindset
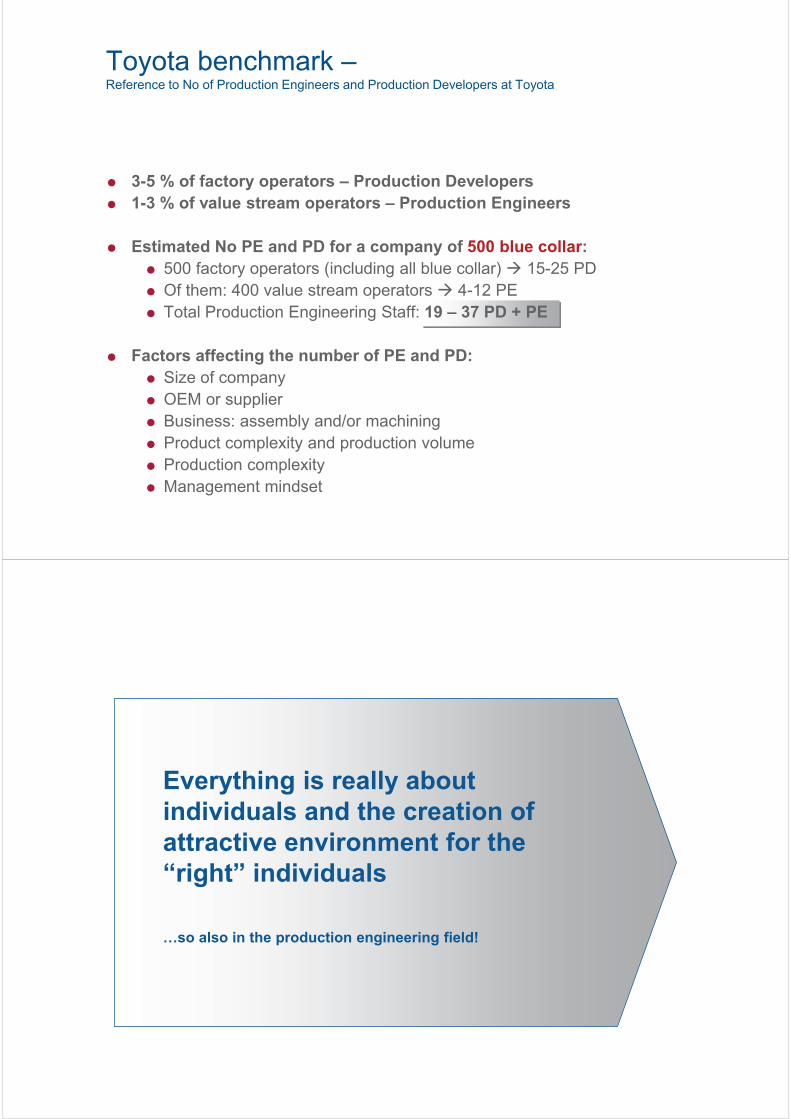
Everything is really about individuals and the creation of attractive environment for the “right” individuals …so also in the production engineering field!
Conclusion
Resource efficiency - is lean – is green Lean and green fits OEE = excellent green measure Involve all – use tools to include environmental improvements in the Kaizen work Sometimes you need to increase speed of change = Kaikaku
Classic production development work is underestimated as a means for improving resource and energy efficiency Go from reactive to proactive; move towards the design phase of both products, production systems and comprising equipment