Embed Size (px)
Citation preview
Sustainability Indicators for Municipal Solid Waste Treatment
Case study - The City of Stockholm:landfill vs. incineration
A m a i a Z a b a l e t a
Master of Science ThesisStockholm 2008


Amaia Zabaleta
Master of Science ThesisSTOCKHOLM 2008
Sustainability Indicators for Municipal Solid Waste Treatment
Case study - The City of Stockholm: landfill vs. incineration
PRESENTED AT
INDUSTRIAL ECOLOGY ROYAL INSTITUTE OF TECHNOLOGY
Supervisor & Examiner:
Monika Olsson

TRITA-IM 2008:26 ISSN 1402-7615 Industrial Ecology, Royal Institute of Technology www.ima.kth.se
II
ABSTRACT
Sustainability Indicators (SIs) have been used with many different purposes, but never
before inside a Waste Management Planning (WMP) process. In this report, a list of
indicators has been designed so that the sustainability of a Waste Treatment Technique
(WTT) for Municipal Solid Waste (MSW) in a specific situation is evaluated. The creation
of this list is the consequence of a deep information seeking process on SIs, on MSW’s
treatment techniques and of the use, as a base, of the indicators created by the Department of
Economic and Social Affairs of the United Nations. In order to assess the usefulness of the list
designed, The City of Stockholm has been chosen. A satisfactory result has been obtained:
the SIs selected for this specific use, give a suitable picture and enough information of the
studied situation. However, additional applications (in other contexts) are necessary for a
more complete validation and for improving the weakest points.

III
ACKNOWLEDGEMENTS
I would like to express my sincere gratitude to my supervisor Monika Olsson for her
continual support during this work, for her supervision, for her suggestions and guidance,
for the time of discussion we had and for sharing her knowledge and experience with me.
Special thanks to Nils Lundkvist, from Traffic Administration, Department for Waste
Management of The City of Stockholm, who gave me the opportunity to have an interview
and whose help was vital to give a practical approach to this thesis.
I would like to thank also all the people who made possible the information gathering for
the Case Study of this thesis, specially from Statistics Sweden and Stockholm Vatten AB.
My great thanks to all my friends here in Stockholm that with their everyday support,
encouragement, help and understanding have made possible this thesis.
Y por último me gustaría agradecer a toda mi familia, en especial a mis aitas y a Iñaki, todo su cariño, su
ayuda, la confianza puesta en mi y el haber hecho posible todo esto. Muchísimas gracias también a mis
amigos y amigas que desde la distancia y con sus visitas han sabido transmitirme todo su apoyo y cariño.
Stockholm, 2008-06-18
Amaia Zabaleta

1
TABLE OF CONTENTS
LIST OF FIGURES……………………………………………………………………...4 LIST OF TABLES………………………………………………………………………..5 1. INTRODUCTION…………………………………………………………………….6
1.1. AIM AND OBJECTIVES…………………...…………………………...…...7
1.2. METHODOLOGY……………………………………………………..…....8
2. SUSTAINABILITY INDICATORS
2.1. INTRODUCTION: THE NEED OF INDICATORS………………………9
2.2. DEFINITION……………………………………………………………......9
2.3. PURPOSE AND OBJECTIVES…………………………………………....10
2.4. PRINCIPLES, CHARACTERISTICS AND REQUIREMENTS…………..11
2.5. BENEFITS AND PROBLEMS OF USING SIs………………………..…..11
2.6. DIFFERENT TYPES OF SIs………………………………………………12
2.7. STEPS TO DEVELOP A SI PROGRAMME……………………………....13
2.8. SIs’ VALIDATION…………………………………………………………13
3. WASTE TREATMENT TECHNIQUES
3.1. MUNICIPAL SOLID WASTE (MSW)………………………………….......15
3.2. LANDFILL
3.2.1. Introduction……………………………………………………….16
3.2.2. Equipment and processes in landfills………………………...…….16
3.2.3. Advantages of landfills……………………………………………..18
3.2.4. Effects and disadvantages of landfills……………………………....18
3.3. INCINERATION
3.3.1. Introduction……………………………………………………….19
3.3.2. Equipment and process in incineration…………………………….19
3.3.3. Advantages of incineration………………………………………...21
3.3.4. Effects and disadvantages of incineration………………………….21
3.4. COMPOSTING
3.4.1. Introduction……………………………………………………….22
3.4.2. Process and methods in Composting………………………………22
3.4.3. Advantages of Composting………………………………………...24

2
3.4.4. Effects and disadvantages of Composting…………………………24
3.5. ANAEROBIC DIGESTION
3.5.1. Introduction……………………………………………………….25
3.5.2. Process of Anaerobic Digestion…………………………………....25
3.5.3. Advantages. Anaerobic Digestion vs. Composting………………....26
3.5.4. Effects and disadvantages of Anaerobic Digestion………………....26
4. INDICATOR SELECTION
4.1. INTRODUCTION: COMPLEX TASK……………………………………28
4.2. SUSTAINABILITY INDICATOR’S SELECTION: FOLLOWED BASE
AND JUSTIFICATIONS…………………………………………………..28
4.3. CLASSIFICATION OF SIS: SPECIAL FEATURES OF EACH
WTT………………….............................................................................................55
5. CASE STUDY: THE CITY OF STOCKHOLM: LANDFILL VS. INCINERATION
5.1. AIM OF THE CASE STUDY AND INITIAL CONDITIONS……………64
5.2. METHODOLOGY OF WORK FOR THE CASE STUDY……………......65
5.3. INTRODUCTION
5.3.1. General information of Stockholm………………………………...65
5.3.2. General information of current situation of Waste Treatment and
Management in Stockholm……………………………………….67
5.4. IMPORTANT LOCAL CONDITIONS: PRIORITY POINTS……………68
5.5. INDICATORS FOR STOCKHOLM………………………………………70
5.6. SUMMARY OF THE INDICATORS FOR STOCKHOLM AND
INTERPRETATION FOR LANDFILL AND INCINERATION………..99
5.7. DISCUSSION OF THE CASE STUDY…………………………………..105
5.8. CONCLUSION OF THE CASE STUDY………………………………...108
6. DISCUSSION……………………………………………………………………….109
7. CONCLUSION……………………………………………………………………..111
8. REFERENCES……………………………………………………………………...112
APPENDIX 1………………………………………………………………………….119

3
APPENDIX 2………………………………………………………………………….122
REFLECTIONS AND COMMENTS from Traffic Administration, Department for Waste
Management of The City of Stockholm………………………………………………………123
4
LIST OF FIGURES
Figure 1: Picture of a landfill
Figure 2: Diagram of an generic Incineration Plant
Figure 3: Diagram of a compost pile
Figure 4: Picture of a Anaerobic Digestion plant
Figure 5: Stockholm by City District
Figure 6: Unemployment rate in 2001 in The City of Stockholm
Figure 7: Population Changes Stockholm 1940-2006, prediction 2007-2016
Figure 8: GHG emission trends in Sweden 1990-2010
Figure 9: GHG emissions by sectors in Sweden 2005 and prediction for 2010
Figure 10: SO2 concentration levels in Stockholm 1984-2006
Figure 11: NOx concentration levels in Stockholm 1992-2006
Figure 12: CO concentration levels in Stockholm 1991-2006
Figure 13: O3 concentration levels in Stockholm 1990-2006
Figure 14: PM10 concentration levels in Stockholm 1996-2006
Figure 15: Water exploitation index. Total water abstraction per year as percentage of long-
term freshwater resources in 1990 and 2002
Figure 16: Water Pollution in Lake Mälaren 1970-2007
Figure 17: Water pollution by phosphorus and water transparency 1969-2007
Figure 18: Regional Gross Domestic Product per capita in UE member states
Figure 19: Share of Total Energy Supply in Sweden in 2005
Figure 20.a: Fuel Share of Total Primary Energy Supply in 2005 for the World
Figure 20.b: Fuel Share of Total Primary Energy Supply in 2005 for the OECD countries
Figure 21: World Map of Köppen-Geiger Climate
5
LIST OF TABLES
Table 1: General Composition of MSW
Table 2: List of Sustainability Indicators of the United Nations and selected indicators
Table 3: Indicators that will affected the decision and indicators that will be affected after
the decision for each WTT
Table 4: Educational background for population 25-64 years old Stockholm 2006
Table 5: Changes in Population in Stockholm
Table 6: Tourists in hotels in Stockholm
Table 7: Land use change in Stockholm 2004-2008
Table 8: Water consumption etc. (m3 million)
Table 9: Nature reserves, nature management areas and wildlife protection areas 2005
Table 10: Proportion of population using computers and internet in Sweden
Table 11: Total R&D expenditure as percent of GDP of Sweden
Table 12: R&D expenditure as percent of GDP 2000-2005
Table 13: Proportion of MSW treatment in Stockholm (%)
Table 14: Composition of MSW in Stockholm 1993-2003
Table 15: Waste Collected excluding recycling in Stockholm 1995-2006
Table 16: Composition and amount of recycling in Stockholm 1995-2006
Table 17: Temperatures and precipitation in Stockholm
Table 18: Summary table of Stockholm’s Case Study

6
1. INTRODUCTION
Demographic changes, economic development, industrialization, urbanization and climate
changes. These are some of the main reason of waste amount and composition changes.
Waste is already a real problem in some places all over the world and it is predicted to
become in a short- or medium-term in others.
Dangerous environmental consequences, health problems, lack of space and inappropriate
living conditions. These are some of the main effects that are occurring or are likely to
appear as a consequence of waste problems.
In conclusion, the importance of this issue is evident and in order to avoid future problems
or decrease the effects of the current ones, a suitable Waste Management Planning (WMP)
is totally necessary. This planning should include [1]:
1. Basic information about the current situation: production of waste, treatment
techniques, installations for elimination or recycling, etc.
2. Priority objectives for waste management: forecast on waste generation, definitions of
recycling and future objectives, emission standards of installations, etc.
3. Instruments for reaching the proposed objectives: new infrastructures, rehabilitation of
installations, establishment of organisational structures (collection, financing), definition of
legislative or economic instruments, etc.
This report is going to be focused only on Municipal Solid Waste (MSW). However, it must
be considered that the definition of MSW varies from place to place.
As mentioned before, the consequences of a bad Waste Management cover environmental,
social and economical fields. Therefore, in order to go through all of them, the point of
view of Sustainable Development (SD) is going to be adopted. Under this philosophy, what
is pretended with this report is to design a suitable tool which tries to put in practice all the
points about WMP cited above. In a more specific way, the report is going to provide a list

7
of Sustainability Indicators (SIs) to be used while discussing about the sustainability of a
Waste Treatment Technique (WTT) in a specific situation.
SIs have been broadly used with different purposes, but never before with this concrete
aim. Accordingly, this paper pretends to be the starting point of what is considered such a
necessary researching issue.
The report is divided on four main sections. In the first one, the main features of SIs are
presented. The second one gives the main clues about the four WTTs considered (landfill,
incineration, composting and anaerobic digestion). The following part shows the list of SIs
selected and, finally, in the last one a Case Study of The City of Stockholm, which tries to
validate the indicators chosen, is developed.
1.1. AIM AND OBJECTIVES
As cited above, the major aim of the project is to find the indicators to be used while
discussing about the sustainability of a WTT for MSW in a specific situation. The specific
targets for completing this aim are:
- Define “Sustainability Indicator”
- Analyse the work made in the field until the present
- Analyse and determine the most important points of each WTT
- Analyse and choose the criteria to select the SIs
- Select the SIs
- Analyse how to validate SIs
- Validate the SIs: Case Study

8
1.2. METHODOLOGY
This paper has been written based on the information collected by different methods. A
deep literary survey using scientific papers, books and different internet sources was the
first one. In addition, an interview at the Traffic Administration, Waste Management
Department of The City of Stockholm was held. On it, the SIs selection was presented and
useful recommendations were received. Finally, several statistical sources and personal
contacts have been used specially for the information gathering of the Case Study.

9
2. SUSTAINABILITY INDICATORS
2.1. INTRODUCTION: THE NEED OF INDICATORS
As a consequence of the information technology revolution, a rapid increase in the volume
and availability of the data on the social, economic and physical environments has risen.
But unfortunately “the rate at which usable information is produced from these data is
increasing only very slowly” [2]. A way to make as much of this information as useful as
possible, is using indicators. But it is necessary to consider from this starting point that, an
indicator is created to simplify the information given by a system, so, as in every
simplification process, information is lost. Hopefully, if this indicator is designed properly,
the lost information will not considerably change the answer to the question they have
been designed for [2].
The use of indicators is rising, in one way, due to the increasing demand of environmental
issue’s information. Nowadays, the information given by these indicators is vital for policy-
makers, for law fulfilment on this area and for decision making. So, due to the importance
of this issue, it is completely necessary to make a correct choice and use of the indicators.
2.2. DEFINITION
Different authors define indicators differently. So, many ambiguities and contradictions
appear regarding the general concept of an indicator, not only of a sustainability indicator.
An indicator has been defined as a variable [3], a parameter [4], a measure [5], a statistical
measure [6], a proxy for measure [5], a value [4], a meter or measuring instrument [7], an
index [8], a piece of information [9], etc. So, this fact shows the complexity of defining
this concept. However, some of the most explicit and complete definitions found are the
following: “An indicator is a variable which supplies information on other variables which
are difficult to access (…) and can be used as bechmarker to take a decision” [10] or
“alternative measures (…) enable us to gain an understanding of a complex system (…) so
that effective management decisions can be taken that lead towards initial objectives” [11].
Both definitions of an indicator imply:

10
“1.- an information function: to give simplified information about complex systems or of
immeasurable criteria
2.- a decision aid function: to achieve the initial objectives” [12]
According to this, a Sustainability Indicator is going to be the indicator that shows any
characteristic or gives any information about the sustainability of a process, system and/or
activity.
In this specific case, a SI is going to give information to help in the decision making of
implementing or not an specific WTT. But before going further, it is necessary to define
“sustainability” or “sustainable development”. The widely known definition of SD states
that “it has to meet the needs of the present without compromising the ability of future
generations to meet their own needs” [13] and that implies, of course, a compromise
among economic, social and environmental aspects that in some way have to be balanced
in order to achieve a long term sustainability. So, it is necessary to pay attention and select
properly, not only to environmental indicators, but also to economic and social ones [14].
This necessity gives a high level of complexity to the study, because “the problem with
trying to monitor and evaluate progress towards sustainability development is not the lack
of potential indicators, it is their multiplicity and their interdependence” [15].
2.3. PURPOSE AND OBJECTIVES
In general, SIs are used to promote action, but apart from that other more specific
objectives arise. The main functions of them are:
“
- To assess conditions and trends
- To compare across places and situations
- To assess conditions and trends in relation to goals and targets
- To provide early warming information
- To anticipate future conditions and trends” [15]
They are also used in policy development and fulfilment determination.

11
In this specific project, SIs are going to be in one way a kind of indicators used to try to
predict what is going to happen in a hypothetic future situation. Thus, the complexity of
the task is explicit. In order to make the job more clear, “SIs should be accompanied by a
target value identifying desirable conditions (or at least trends) and threshold values
identifying problem, critical and irreversible levels” [2]. These targets are going to be
specific for each case since what can be sustainable in one situation can be completely
unsustainable in another one.
2.4. PRINCIPLES, CHARACTERISTICS AND REQUIREMENTS
Before selecting the SIs, “it is necessary to specify the sustainability principles that are
going to be adopted” [2]. One of the deepest work made until the moment about SIs’
principles, characteristics and requirements has been the Bellagio Project hold by the
International Institute for Sustainable Development (IISD), whose result are the Bellagio Principles.
“These principles serve as guidelines for the whole of the assessment process including the
choice and design of indicators, their interpretation and communication of the result. They
are interrelated and should be applied as a complete set. They are intended for use in
starting and improving assessment activities of community groups, non-government
organizations, corporations, national governments, and international institutions” [16] (see
the Bellagio Principles in Appendix 1).
In this specific study, these principles are going to be followed since they are really
comprehensive and they consider all the most important aspects. However, apart from
them, it is really important to assure that these SIs are perfectly understood by all their
users and that are specific enough for the treated situation, that is, achieving the best
possible balance between local and global issues.
2.5. BENEFITS AND PROBLEMS OF USING SIs
The main advantage of using indicators is the possibility they give to identify problems, to
develop policies, to relate different phenomena, etc. simplifying the complexity of the
systems. This is specially important while considering sustainability issues because the
cause-and-effect chains between economic, social and environmental aspects are complex.
However, at the same time, this is also a big problem. When a deep process of

12
simplification is needed in order to have enough useful information, an important risk
appears due to the possibility to lose too much information. In conclusion, it is necessary
to find an equilibrium between simplification and representativeness. Only in this way, SIs
are going to be useful.
2.6. DIFFERENT TYPES OF SIs
Different classifications can be made within SIs according to different aspects:
a) According to the specific purpose and framework considered:
“
- Core Environmental Indicators (CEI): designed to help track environmental
progress and the factors involved in it, and analyse environmental policies.
- Key Environmental Indicators (KEI): reduced set of the core indicators, that serve
wider communication purposes. They inform the general public and provide key
signals to policy makers.
- Sectorial Environmental Indicators (SEI): designed to help integrate environmental
concerns into sectorial policies. Each set focuses on a specific sector.
- Indicators derived from Environmental accounting: designed to help integrate
environmental concerns into economic and resource management policies.
- Decoupling Environmental Indicators (DEI): measure the decoupling of
environmental pressure from economic growth. They are valuable for determining
whether countries are on track towards sustainable development [17].”
b) According to the spatial scale:
- Global Scale
- Local Scale: more specific than the global one’s
c) According to the temporal scale:
- Short term indicator
- Long term indicator

13
d) According to the aggregation level [12]:
- Simple Indicators: resulting from the estimation or measurement of an indicative
variable
- Composite Indicators: obtained by aggregation of several variables or simple
indicators
2.7. STEPS TO DEVELOP AN SI PROGRAMME
The main steps to be followed are the following [2]:
1. Clear definition of the objectives of the indicators programme
2. Definition of SD, and sustainability principles to be applied
3. Definition of the issues that are important both locally and globally
4. Selection of the indicators
5. Indicators’ validation
The two first steps have been already made, the last three points are going to be carried out
in Sections 3, 4 and 5.
2.8. SIs� VALIDATION
As every tool used to take decisions, SIs need to be validated. This is what different authors
say, but not all of them propose a way to do it. A general framework to validate indicators
is the one that considers the “design validation”, the “output validation” and the “end-use
validation”. Below is a short explanation of each kind of validation step (from [12]):
- “Design validation”: or conceptual validation. It tries to answer if the indicator is
scientifically founded or not. This validation is useful when it is carried by expert
judgements for the selection of variables which should be measured as indicator
- “Output validation”: it is used to determine whether the indicator informs about reality
and it is realistic or not. They are three different ways to answer this question, the visual
procedure, the statistical procedure and the judgement of experts

14
- “End-use validation”: this part deals with the usefulness of an indicator as benchmark for
decision making. This validation is done by the users, so is going to determine also if the
users understand what is being indicated by the indicators and if the results are being
interpreted correctly by end-users (something specially important with complex issues like
sustainability)
The validation process is vital to assure the usefulness and credibility of SIs, but it has to be
taken into account that in all validation process an important subjectivity charge is involved
too.

15
3. WASTE TREATMENT TECHNIQUES The information used for this section has mainly taken from the course of Environmental
Technology at the University of the Basque Country (2006), [18].
3.1. MUNICIPAL SOLID WASTE
In general, the MSW fraction is composed by these materials:
Table 1. General Composition of MSW
However, the percentage of each of these components on MSW varies from place to place
according specially to changes in these factors:
1. Seasonal changes
2. Location differences
3. Economic differences
Different climate and different eating and living habits are going to define composition of
the MSW.
General composition Typical composition Specific composition
ORGANIC
Biodegradable material Food and vegetables
Paper and cardboard Paper and cardboard
Plastics HDPE, LDPE, PVC…
Clothes and fabrics Leather, rubber, fabrics…
Garden waste Leaves, grass…
Wood Wood
Organic wastes Bones..
INORGANIC
Metals Cans, aluminium…
Glass Non-colours and colours
Soil and ashes Soil and ashes
Non-classified materials Voluminous objects

16
In conclusion, one of the first things to do before taking any decision is to analyse the
composition of a place’s MSW and its possible variation. Additionally, it is important to
consider since the beginning of the study the definition of MSW, which varies from place
to place.
3.2. LANDFILL
3.2.1. Introduction
The disposal of waste in landfills has been the historical way to get rid of waste. However,
nowadays new legislation is appearing (specially in developed countries) to try to restrict it
as much as possible, considering that the disposal of the waste should be the last option
while deciding what to do with it.
Landfills are places where waste is dumped in a controlled and studied way (with organized
cells structure). These installations have to be constructed in well selected places according
to ground’s characteristics, climatologic conditions, hydrology, local environmental
conditions, land availability, etc. It is also essential the long-term design of these projects
because they are works to be controlled during many years (while they are being used and
later on).
3.2.2. Equipment and processes in landfills
A landfill is composed of many different well-organized waste piles (see Figure 1). Biogas is
produced inside because of organic material’s biodegradation and also leachate as a
consequence of the adsorption of waste’s compounds with the rainfall. Therefore, gas and
leachate removal systems are installed.

17
Figure 1: Picture of a landfill [[[[19]]]]
Different transformation processes occur in landfills. The main of them are the following:
a) Physical processes:
- Lateral diffusion of landfill’s gases (produces in the biodegradation of the
organic material)
- Leachate’s movements and migrations
- Movements of the dumping material
b) Chemical processes:
- Solution and dragging of the waste materials with the leachate (considered
toxic waste due to the substances that the rain water has dragged)
- Water and chemical compounds evaporation in the landfill’s gases
- Volatile Organic Compounds’ (VOC’) adsorption in the dumping material
- Organic compound’s decomposition and dehalogenization
- Redox reactions in metals and metallic salts’ solution
- Possible reactions between the waterproof material and some organic
compounds
c) Biological processes:
- Gas production processes (mainly CO2 and CH4)
- Aerobic and anaerobic digestion

18
So, a landfill needs a good land covering material (it is established by law in many places
nowadays), a gas removal system and a leachate removal and cleaning installation. The gas
generated as a result of organic fraction’s degradation can be used for energy production.
3.2.3. Advantages of landfills
The main important positive point of choosing landfill for waste treatment is that it is
applicable for the whole of the MSW, what implies that it is not necessary to use another
additional technique. In addition, it is more economical than, for example, incineration and
its contribution to Climate Change is lower than in other process.
3.2.4. Effects and disadvantages of landfills
The main common problems and risks that can appear are:
a) Environmental problems:
1. Uncontrolled leaks and gas-bags formation
2. Emission of pollutant and greenhouse effect gases (GHGs) to the atmosphere
3. Discharge or uncontrolled leaks of leachate or polluted water
4. Uncontrolled reproduction of insects
5. Gases leak of uncontrolled waste
6. Odour
In conclusion, the correct design and development of a landfill is really important.
b) Social problems:
Due to bad historical practises in landfills, nowadays an important social rejection
exists against them. Some of the reasons given for it are:
1. Odour and insects problems
2. Large amount of land used for the landfill that can be used for another
applications (agriculture, house building, etc.)
19
3. Bad management of the post-landfill
c) Economic problems:
1. Initial investments: the main investment to be done at the beginning in landfills is
for the material covering the bottom land and for the gas and leachate control
installation.
2. Process investments: leachate cleaning and transport from the waste generation point
to the landfill, which is usually far from them because of the social and
environmental problems mentioned above.
But apart from this, it is important to consider that one of the main disadvantages of
landfills compared to other techniques is the big amount of land needed. This issue can be
a real problem in some places where land availability is not large and other uses are more
profitable. In addition to this an essential point is that only from the gas generated a profit
can be made.
3.3. INCINERATION
3.3.1. Introduction
This process consists of the complete combustion of the waste. The heat generated is used
to produce energy afterwards, and because of this point it is one of the most preferred
technology in the present.
3.3.2. Equipment and process in incineration
An incineration plant should have the following elements (see Figure 2):
1. Combustion chamber, with the supplying system
2. Post-combustion chamber
3. Energy recovery system (not compulsory for the incineration, but really useful
nowadays)
4. Vapour and gases treatment system

20
5. Chimney for smoke outlet, with a control system
Figure 2: Diagram of an generic Incineration Plant [[[[20]]]]
The waste is delivered in the storage place and is transported to the furnace through the
dosing funnel. The furnace has three important elements: the grids (which hold the waste),
the refractory material (to keep the heat produced during the combustion) and the combustion
chamber (where the combustion takes place). Once the waste in there, the combustion
process occurs. If all the parameters are correctly established, the combustion is going to
be almost total. Apart from the produced heat, two products are obtained: an
incombustible solid/liquid (ashes) and a gaseous phase that is leaded to the second
combustion chamber (post-combustion chamber). Here its complete oxidation takes place.
Due to this process, this chamber is considered the first step of the gases treatment. There
are many different combustion technologies (with different grids design). One of the most
used nowadays is the fluidised bed.
The gas that still remains after the second combustion process needs to be treated before it
is emitted to the atmosphere. This stream will contain particles and also hazardous
compounds, so a dry cleaning is going to be necessary (with bag filters or cyclones) as well
as wet or catalytic cleaning (for substances like NOx, SO2…). So water is needed, and a new
liquid stream appears here, that is going to need an special treatment. After this cleaning
process the gases are going to be released through the chimney, which design is necessarily
important.

21
As mentioned before, nowadays it is considered senseless to incinerate the waste without
energy recovery. Normally, this kind of incinerators (with energy recovery) require special
characteristics as pelletized waste feed, homogenized heating value, smaller size of the
installation, bigger size of the waste preparation plant, better pollution control and the
removal of metals, plastics and glass that are responsible for the pollution and heat
absorption. This last point requires an important separation process, so the costs and
benefit of the process have to be analysed. The objects removed can also be recycled, what
involves other industries in the process.
3.3.3. Advantages of incineration
The main advantages of using this way of waste elimination are the little terrain necessity,
the possibility to be installed near to the waste generation points, the important decrease of
the waste volume, the capacity to cope with waste generation fluctuations (using different
furnaces of small size) and finally, the possibility to sale of sub products what decreases the
operational costs.
3.3.4. Effects and disadvantages of incineration
The most important problems that arise are:
a) Environmental problems:
1. Emission of CO2 (green house effect) and the rest substances that have not been
removed in the previous gas treatment
2. Generation of dioxins and furans
3. Production of important amounts of ashes
4. Use of water for the removal of hazardous substances from the gas stream. In
conclusion, the need of this water treatment appears
5. Noise and odour
b) Social problems:
1. Important social rejection due to the proximity of the installation

22
2. Noise and odour
c) Economic problems:
1. High initial investment, specially for the systems used to avoid atmospheric
pollution
2. High operational cost, comparing to other waste treatment options
In conclusion, the proximity from the waste generation point to the incineration
installation has both positive and negative effects. On the one hand, it avoids the
long transportation distances, what reduces the cost and the pollution. But on the
other hand, it carries the mentioned problems of odour, noise and the proximity of
the pollution point.
Another important disadvantage is that, if accidental or scheduled stops happen in the
plant, another waste treatment system is needed. So, it can not be the only treatment
system in an specific place.
3.4. COMPOSTING
3.4.1. Introduction
This technique consists of the aerobic bio-decomposition of the organic material in the
MSW. Its aim is to generate an organic product to be used as an agriculture soil improver.
So, this technique is only applicable for the organic fraction of the MSW, which makes a
previous separation process necessary.
3.4.2. Process and methods in Composting
The process that takes place is the following:
Org. mat. + O2 + bacteria àààà compost + other bacteria + CO2 + H2O + NH3 + heat
Apart from these products, other like VOC’s can also appear [19].

23
The use of compost is not new, and many studies have been done to prove the high quality
of this product as an agricultural soil improver.
The main process requirements are the following:
1. Temperature: it has specific evolution between 15 and 60ºC. It is an exothermic
process.
2. Moisture: 50-60% is the optimum. It is necessary for the bacteria necessary in the
process
3. Oxygen: 15-20% is the best range for the correct development of the process
4. C/ N ratio: about 30 is the right relation. This process needs nutrients
5. pH: it varies among the process from 5 to 8
6. The size of the organic material and the biochemical composition are important
aspects to be considered
Nowadays compost is produced in different ways in a industrial scale. Some of them are:
1. In piles: the organic material is spread on the land forming triangular piles. The
waste does not need a previous treatment, and regular injections are made with
manure. It is necessary to turn over the piles periodically and the ventilation is a
good way to increase the compost’s quality. This techniques usually need 2-3
months (see Figure 3)
2. In silos: the waste is put inside the silo from the top part and the air from the
bottom. They are usually reactors of 2-3 metres, with systems to mix the waste.
Despite of this, this system is preferred for homogeneous waste
3. With rotatory drums: is the same technique as the one just above but with the
rotation, a better mixture is obtained

24
Figure 3: Diagram of a compost pile [[[[21]]]]
3.4.3. Advantages of Composting
The main advantages of the process are that it does not produce a big amount of pollutant
compounds, it avoids the pollution of the synthetic production of other fertilizers, it avoids
the introduction in the ecosystem of synthetic nutrients and it is a really economical
process compared to other alternatives.
3.4.4. Effects and disadvantages of Composting
The main problems of the process are:
a) Environmental problems:
1. The need of land
2. Odour
3. Emission of CH4, NH3 and VOC’s
4. Discharge or uncontrolled leaks of leachate or polluted water
b) Social problems:
1. The need of land
2. Odour

25
c) Economic problems:
1. The separation of the organic material from the rest puts up the price
As this technique has many points in common with anaerobic digestion, it is going to be
better analysed later on (Section 3.5.3.).
3.5. ANAEROBIC DIGESTION
3.5.1. Introduction
This process is based on the anaerobic biodegradation of the organic material. So it is similar
to the composting but without oxygen and in an industrial reactor (see Figure 4). Two
different products are obtained from this process: biogas and a solid residue. The first one
is used for the energy obtaining and the second one as an agriculture fertilizer or can be
directly incinerate [22].
According to some studies, this is frequently the most cost-effective biological treatment
due to its high energy recovery and to its limited environmental impact [23].
3.5.2. Process of Anaerobic Digestion
Nowadays, many different reactor configurations exist and are being studied, but the bases
of all of them are the same: absence of oxygen. Apart from this, the temperature and the
pH are the two parameters that influence more the process.
Different techniques have been developed to increase the efficiency of the process, some
of them have been: pre-composting, mechanical pre-treatment, solubilization by other
means and, one of the preferred, co-digestion with other organic material [23].

26
Figure 4: Picture of a Anaerobic Digestion plant [[[[24]]]]
3.5.3. Advantages. Anaerobic Digestion vs. Composting
Because of the similarities between composting and anaerobic digestion, a comparison
between them is necessary. Much work has done in the issue, but the ones which use
holistic approach tools (LCA, LCC, etc.) are the most reliable. The advantages of this
process are the emission of less VOC’s and less GHGs. In addition, some studies have
shown that anaerobic digestion is more energy efficient than incineration and composting
[25].
In general, the composting and anaerobic digestion processes are better seen by the society
than the incineration. So, less rejection is going to appear.
3.5.4. Effects and disadvantages of Anaerobic Digestion
a) Environmental problems:
1. Despite that the digestite (primary product from composting) can be directly
used as a soil improver, the effluent of the anaerobic digestion needs to be treated
2. Gas emissions: VOC’s, GHGs, etc.

27
b) Social problems:
Not identified
c) Economic problems:
1. It is more expensive than the composting, it needs a larger investment and the
overall process is more complex
The last two techniques are only applicable to the organic fraction of the MSW, so other
techniques are needed for the other waste’s treatment.

28
4.- INDICATOR SELECTION
4.1. INTRODUCTION: COMPLEX TASK
The indicators’ establishment is a hard task since they must cover all the important aspects
of each specific situation and be at the same time manageable and simple. Due to the broad
purpose of these indicators, in some specific cases some of them are not going to be
applicable and others essential. Another really important point of these indicators is the
information availability. Sometimes an indicator is really useful for something, but the data
availability is limited or inexistent.
4.2. SUSTAINABILITY INDICATOR�S SELECTION: FOLLOWED
BASE AND JUSTIFICATIONS
After the deep information searching done on Sustainability Indicators (Section 2) and
Waste Treatment Techniques (Section 3), the main important characteristics of the
indicators were determined as well as the weaknesses and advantages of each technique.
This analysis was done in the holistic approach of Sustainability, that is, considering
environmental, economic and social aspects. However, in this next step of trying to identify
the SIs for this specific project, the necessity to work in a different way has been
determined.
As mention in Section 2, SIs have many inter-connexions and it seems to be easier and more
clear to work in a different way, not trying to separate indicators in these three groups, but
doing it in a thematic way (with general themes and sub-themes) [26]. For the SIs’ set, the
indicators and structure followed in “Indicators of Sustainable Development: Guidelines and
Methodologies Third Edition” edited by the Department of Economic and Social Affairs of the
United Nations is going to be used. The different themes identified on it are the following:
1. Poverty
2. Governance
3. Health
4. Education

29
5. Demographics
6. Natural Hazards
7. Atmosphere
8. Land
9. Oceans, seas and coasts
10. Freshwater
11. Biodiversity
12. Economic Development
13. Global Economic Partnership
14. Consumption and Production Patterns
The following table (Table 2) shows all the indicators chosen in the report mentioned, and
the ones selected for this specific project (bigger and bolded):
Table 2: List of Sustainability Indicators of the United Nations and selected indicators
THEME SUB-THEME CORE INDICATOR OTHER INDICATOR Poverty Income poverty Proportion of
population living below national poverty line
Proportion of population below $1 a day
Income inequality Ratio of share in national income of highest to lowest quintile
Sanitation Proportion of population using an improved sanitation facility
Drinking water Proportion of population using an improved water source
Access to energy Share of households without electricity or other modern energy services
Percentage of population using solid fuels for cooking
Living conditions Proportion of urban population living in slums
Governance Corruption Percentage of population having paid bribes
Crime Number of intentional homicides per 100,000 population

30
Health Mortality Under-five mortality rate
Life expectancy at birth
Healthy life expectancy at birth
Health care delivery Percent of population with access to primary health care facilities
Contraceptive prevalence rate
Immunization against infectious childhood diseases
Nutritional status Nutritional status of children
Health status and risks Morbidity of major diseases such as HIV/AIDS, malaria, tuberculosis
Prevalence of tobacco use
Suicide rate
Education Education level Gross intake ratio to last grade of primary education
Life long learning
Net enrolment rate in primary education
Adult secondary (tertiary) schooling attainment level
Literacy Adult literacy rate
Demographics Population Population growth rate
Total fertility rate
Dependency ratio
Tourism Ratio of local residents to tourists in major tourist regions and destinations
Natural hazards Vulnerability to natural hazards
Percentage of population living in hazard prone areas
Disaster preparedness and response
Human and economic loss due to natural disasters
Atmosphere Climate change Carbon dioxide emissions
Emissions of greenhouse gases
Ozone layer depletion Consumption of ozone depleting substances
Air quality Ambient concentration of air pollutants in urban areas
Land Land use and status Land use change
Land degradation
Desertification Land affected by desertification

31
Agriculture Arable and permanent cropland area
Fertilizer use efficiency
Use of agricultural pesticides
Area under organic farming
Forests Proportion of land area covered by forests
Percent of forest trees damaged by defoliation
Area of forest under sustainable forest management
Oceans, seas and coasts
Coastal zone Percentage of total population living in coastal areas
Bathing water quality
Fisheries Proportion of fish stocks within safe biological limits
Marine environment Proportion of marine area protected
Marine trophic index
Area of coral reef ecosystems and percentage live cover
Freshwater Water quantity Proportion of total water resources used
Water use intensity by economic activity
Water quality Presence of faecal coliforms in freshwater
Biochemical oxygen demand in water bodies
Wastewater treatment Biodiversity Ecosystem Proportion of
terrestrial area protected, total and by ecological region
Management effectiveness of protected areas
Area of selected key ecosystems
Fragmentation of habitats
Species Change in threat status of species
Abundance of selected key species
Abundance of invasive alien species
Economic development Macroeconomic performance
Gross domestic product (GDP) per capita
Gross saving
Investment share in GDP
Adjusted net savings as percentage of gross national income (GNI)
Inflation rate
Sustainable public finance Debt to GNI ratio
Employment Employment-population ratio
Vulnerable employment
Labor productivity and unit labor costs

32
Share of women in wage employment in the non-agricultural sector
Information and communication technologies
Internet users per 100 population
Fixed telephone lines per 100 population
Mobile cellular telephone subscribers per 100 population
Research and development
Gross domestic expenditure on R&D as a percent of GDP
Tourism Tourism contribution to GDP
Global economic partnership
Trade Current account deficit as percentage of GDP
Share of imports from developing countries and from LDCs
Average tariff barriers imposed on exports from developing countries and LDCs
External financing Net Official Development Assistance (ODA) given or received as a percentage of GNI
Foreign direct investment (FDI) net inflows and net outflows as percentage of GDP
Remittances as percentage of GNI
Consumption and production patterns
Material consumption Material intensity of the economy
Domestic material consumption
Energy use Annual energy consumption, total and by main user category
Share of renewable energy sources in total energy use
Intensity of energy use, total and by economic activity
Waste generation and management
Generation of hazardous waste
Generation of waste
Waste treatment and disposal
Management of radioactive waste
Transportation Modal split of passenger transportation
Modal split of freight transport
Energy intensity of transport

33
The explanation of the choice of each indicator is presented in the paragraphs below. In
order to make it as clear as possible, a Brief definition and Description from the report of
“Indicators of Sustainable Development: Guidelines and Methodologies Third Edition” for each
selected indicator is going to be shown, followed by a motivation for the selection of each
one:
1. POVERTY
a) Income poverty: Proportion of population living below national poverty line
�Brief definition: The proportion of the population with a standard of living below the poverty
line as defined by the national government. National estimates are based on population-weighted
subgroup estimates derived from household surveys.
Description: The indicator (also known as national poverty rate) is a standard measure of poverty,
especially income poverty. It provides information on progress towards poverty alleviation, a central
objective and requirement of sustainable development. The national poverty rate is one of the core
measures of living standards and it draws attention exclusively towards the poor.” [26]
Justification: it is useful to know the level of poverty of the country, that is, the
percentage of people below the average of wealth. It is necessary to consider this
information before taking any decision and the main reason is that, depending on
the income level, the consumption habits are going to be different, and in
consequence, the waste generation and composition. The possibility to afford the
investment of one technique or another is going to be determined also by this
indicators, or in general by the indicators of this theme. But this piece of
information must be considered with other, being especially important the “Income
inequality” (next indicator).
b) Income inequality: Ratio of share in national income of highest to lowest
quintile
�Brief definition: The ratio of the share in national income (or consumption) accruing to the
highest 20 percent of the population to the share accruing to the lowest 20 percent.
Description: The indicator shows the extent of inequality in income distribution within a country.
Inequality in outcomes such as income or consumption and inequality in opportunities hinder
human development and are detrimental to long-term economic growth. Poor people generally have

34
less voice, less income, and less access to services than wealthier people. When societies become
more equitable in ways that lead to greater opportunities for all, the poor stand to benefit from a
“double dividend.” Empirical studies suggest that the impact of growth on poverty reduction is
greater when initial income inequality is lower.” [26]
Justification: due to the same reason given in the justification of the first indicator,
the income inequality, is going to carry out waste inequality (in amount and
composition) through a region, city or country considered. The collection of the
waste and the infrastructure for it are going to be different also between high and
low income areas. It is important to consider this information before deciding the
sustainability of an specific technique.
c) Drinking water: Proportion of population using an improved water source
�Brief definition: Proportion of population with access to an improved drinking water source in a
dwelling or located within a convenient distance from the user’s dwelling. Improved drinking water
sources include bottled water; rainwater; protected boreholes springs and wells; public stand-pipes
and piped connections to houses.
Description: The provision of adequate sanitation is necessary for poverty alleviation and to
protect human health and the environment. The indicator monitors progress in the accessibility of
the population to improved water sources. Accessibility to improved water sources is fundamental
to decrease the faecal risk and frequency of associated diseases. It is also a universal human
development indicator. When broken down by geographic (such as rural/urban zones) or social or
economic criteria, it also provides tangible evidence of inequities.” [26]
Justification: apart from the information of inequity and poverty that gives, as it is
mentioned, it is substantial because from the WTTs considered, landfill and
incineration are directly related to water quality and/or pollution. If the proportion
of population using an improved water source is not big, it would not be really
adequate to use these kind of technologies that need water treatment.
d) Living conditions: Proportion of urban population living in slums
�Brief definition: The proportion of urban population lacking at least one of the following five
housing conditions: Access to improved water; access to improved sanitation facilities; sufficient,
not overcrowded, living area; structural quality/durability of dwellings; security of tenure.

35
Description: This is a key indicator measuring the adequacy of shelter. Overcrowding, inadequate
housing, lack of water and sanitation are manifestations of poverty. They deprive residents from
their human rights, are associated with certain categories of health risks and are often detriments to
future development. An increase of this indicator is sign of deteriorating living conditions in urban
areas. Disaggregating the indicator by type of housing conditions gives further information on the
severity of inadequate living conditions.” [26]
Justification: it is possible that in places with low shelter adequacy, the organization
of the waste disposal and treatment is not really good. And at the same time this
indicator is related to the waste type, composition and amount (for the slum
building many material can be recycled and used).
2. GOVERNANCE
a) Corruption: percentage of population having paid bribes
�Brief definition: Percentage of population having been asked or having complied to expectation
by government officials to pay a bribe for his or her services.
Description: The indicator measures prevalence of corruption among government officials through
crime surveys. A decline of this indicator is a sign of progress on the corruption component of good
governance. Good governance is essential for sustainable development.” [26]
Justification: it is not one of the most directly important indicators, but it can give
useful information about the government’s control, what is an important
requirement for sustainable development.
3. HEALTH
a) Mortality: Life expectancy at birth
�Brief definition: The average number of years that a newborn could expect to live, if he or she
were to pass through life subject to the age-specific death rates of a given period.
Description: The indicator measures how many years on average a new-born is expected to live,
given current age-specific mortality risks. Life expectancy at birth is an indicator of mortality
conditions and, by proxy, of health conditions.” [26]

36
Justification: as it is mentioned in the description above of the indicator, health
conditions are directly related to this indicator. As the WTTs considered in this
project are related to pollution problems, they are going to be related also to health
problems. Thus, the importance of this aspect.
b) Nutritional status: Nutritional status of children
�Brief definition: Percentage of underweight (weight-for-age below -2 standard deviation (SD) of
the WHO Child Growth Standards median) among children under five years of age; percentage of
stunting (height-for-age below -2 SD of the WHO Child Growth Standards median) among children
under five years of age; and percentage of overweight (weight-for-height above +2 SD of the WHO
Child Growth Standards median) among children under five years of age.
Description: The purpose of this indicator is to measure long term nutritional imbalance and
malnutrition resulting in undernutrition (assessed by underweight and stunting) and overweight.
Anthropometric measurements to assess growth and development, particularly in young children,
are the most widely used indicators of nutritional status in a community.” [26]
Justification: apart from the information about poverty that is going to give, it is
also going to measure, in one way, nutritional habits, so waste generation habits.
c) Health status and risks: Morbidity of major diseases such as HIV/AIDS,
malaria, tuberculosis
�Brief definition: Prevalence and/or incidence of major diseases such as HIV/AIDS, malaria,
tuberculosis. The indicator is measured separately for relevant major diseases, typically in cases per
100,000 people.
Description: The indicator measures the morbidity caused by major diseases. The goals of
sustainable development can only be achieved in the absence of a high prevalence of debilitating
diseases. HIV/AIDS, malaria, tuberculosis and other diseases are major impediments to sustainable
development, especially in many developing countries. The indicator also provides information on
the success of measures to fight major diseases. For that purpose, especially over a longer horizon,
measuring death rates of major diseases is also important.” [26]
Justification: it can be useful to have some information about the possible health
risks. This can be specially important in landfill and composting due to the insect
problems that can appear which could be determinant for the development of these
kind of illnesses.

37
4. EDUCATION
a) Education level: Gross intake ratio to last grade of primary education
�Brief definition: Total number of new entrants in the last grade of primary education, regardless
of age, expressed as a percentage of the population of the theoretical entrance age to the last grade
of primary education. The indicator is also called Primary Completion Rate.
Description: The indicator measures whether or not the entire eligible school age population has
access to school and whether or not they complete the full primary cycle. Universal primary
education is an important goal of the international sustainable development agenda. Education is a
process by which human beings and societies reach their fullest potential. It is critical for promoting
sustainable development and improving the capacity of people to address environment and
development issues.” [26]
Justification: a good educational level is vital for the SD of a place. While deciding
if a specific technique is sustainable or not, a certain educational level is required to
assure a suitable installation and development of it. In addition to this, a high
educational level, can be related to a high environmental awareness, what it is really
important in this specific case.
b) Literacy: Adult literacy
�Brief definition: The proportion of the adult population aged 15 years and over that is literate.
Description: This indicator provides a measure of the stock of literate persons within the adult
population who are capable of using written words in daily life and to continue to learn. It reflects
the accumulated accomplishment of education in spreading literacy. Any shortfall in literacy would
provide indications of efforts required in the future to extend literacy to the remaining adult illiterate
population. “[26]
Justification: it can be used the same justification as for the previous indicator.

38
5. DEMOGRAPHICS
a) Population: Population growth rate
�Brief definition: The average annual rate of change of population size during a specified period. It
is often reported separately for urban and rural areas.
Description: The population growth rate measures how fast the size of population is changing. If
reported separately for urban and rural area, it provides a measure of urbanization. The high growth
of urban populations, caused by rates of natural increase (excess of births over deaths) in urban
areas, migration from rural to urban areas and the transformation of rural settlements into urban
places, is of concern in many countries. In settings where the conditions for sustainable agricultural
and rural development are not in place, high rates of rural population growth could negatively affect
the use of land, water, air, energy and other resources.” [26]
Justification: really useful to see how fast the place is changing, and specially useful
when the rate is differenced for urban and natural areas, due to the possible
consequences in waste composition and amount. In order to assure the
sustainability of a future waste treatment plant, is necessary to have this
information.
b) Tourism: Ratio of local residents to tourists in major tourist regions and
destinations
�Brief definition: The number of visitors (tourists and same day visitors) divided by the number of
local residents in tourist regions and destinations. It can be reported separately for the whole year
and for peak seasons or days.
Description: The ratio can indicate total and seasonal pressure on the environmental and social
resources of host regions and populations. While tourism represents a key source of income and
employment in most tourist receiving regions and destinations, it also exerts considerable pressure
on the environmental and socio-cultural resources of host populations, especially in peak periods.
Negative environmental and social impacts of tourism can be prevented and mitigated with
appropriate planning, management and monitoring of tourism activities, following integrated
approaches and sustainability principles.” [26]
Justification: tourism can have really important environmental and social-cultural
consequences. It is vital for future planning within a country. Tourists have usually
different eating habits (so different waste composition), involve population changes

39
during the year (so different waste amount), bring eating habit’s and cultural
changes (with possible future changes), etc.
6. NATURAL HAZARDS
a) Vulnerability to natural hazards: Percentage of population living in hazard
prone areas
�Brief definition: The percentage of national population living in areas subject to significant risk of
prominent hazards: cyclones, drought, floods, earthquakes, volcanoes and landslides. The indicator
may be calculated separately for each relevant prominent hazard. The risk of death in a disaster
caused by natural hazards is a function of physical exposure to a hazardous event and vulnerability
to the hazard. The indicator measures the risk at sub-national scale by using historical and other data
on hazards and on vulnerability. The sub-national risk levels are then aggregated to arrive at national
values.
Description: This indicator contributes to a better understanding of the level of vulnerability to
natural hazards in a given country, thus encouraging long-term, sustainable risk reduction programs
to prevent disasters. High vulnerability means higher exposure to natural catastrophes in the absence
of disaster reduction measures. Disasters caused by vulnerability to natural hazards have a strong
negative impact on the development process in both industrialized and developing countries.” [26]
Justification: it is an important information while considering future planning as in
this specific case. It would be senseless to plan an incineration plant (which
involves an important starting investment) in a place with a high risk of natural
hazards.
7. ATMOSPHERE
After the overview done in waste treatment technologies, the main aspects
identified within this field are: greenhouse gases (CO2, CH4, N2O, H2O…), toxic
substances and particles (O3, PM10, PM2’5, SO2, NO2, Pb, CO, VOC’s…).

40
a) Climate change:
a.1.) Carbon dioxide emissions
�Brief definition: Anthropogenic emissions, less removal by sinks, of carbon dioxide (CO2). In
addition to total emissions, sectoral CO2 emissions can be considered. The typical sectors for which
CO2 emissions/removals are estimated are energy, industrial processes, agriculture, waste, and the
sector of land use, land-use change and forestry (LULUCF).
Description: This indicator measures the emissions of carbon dioxide, which is known to be the
most important, in terms of impact on global warming, anthropogenic greenhouse gas (GHG). A
doubling of the CO2 concentration in the atmosphere is believed to cause an increase in the global
mean temperature of 1.5 to 4.5°C, which is expected to have a very negative impact on economic,
social and environmental conditions in most countries of the world.” [26]
a.2.) Emissions of greenhouse gases
�Brief definition: Anthropogenic emissions, less removal by sinks, of the main greenhouse gases
(GHGs) carbon dioxide (CO2), methane (CH4), nitrous oxide (N2O), hydrofluorocarbons (HFCs),
perfluorocarbons (PFCs), sulphur hexafluoride (SF6). Emissions of CH4, N2O, HFCs, PFCs and SF6
can be converted to CO2 equivalents using the so-called global warming potentials (GWPs) provided
in assessments of the Intergovernmental Panel on Climate Change.
Description: This indicator measures the emissions of the six main GHGs which have a direct
impact on climate change, less the removal of the main GHG CO2 through sequestration as a result
of land-use change and forestry activities. An increase of greenhouse gas concentration in the
atmosphere contributes to global warming, which is a major global challenge to sustainable
development. For countries that have committed to reduce or stabilize their GHG emissions under
the Kyoto Protocol of the United Nations Framework Convention on Climate Change, the
indicator also provides information on the fulfilment of this global commitment.” [26]
Justification: the second indicator of the two just above, is more complete. So, if
this is available, this is going to be the one used. It is well-know the importance of
Climate Change. It is a globally important point, which has to be solved locally.
b) Air quality: Ambient concentration of air pollutants in urban areas
�Brief definition: Ambient air pollution concentrations of ozone, particulate matter (PM10, and
PM2,5, if those are not available: SPM, black smoke), sulphur dioxide, nitrogen dioxide, lead.

41
Additional air pollutants are carbon monoxide, nitrogen monoxide and volatile organic compounds
including benzene (VOCs). The priority is collection of the indicator in large cities.
Description: The indicator provides a measure of the state of the environment in terms of air
quality and is an indirect measure of population exposure to air pollution of health concern in urban
areas. Improving air quality is a significant aspect of promoting sustainable human settlements.” [26]
Justification: necessary information because of the pollution points identified in the
Section 3 about WTTs.
8. LAND
a) Land use and status:
a.1.) Land use change
�Brief definition: The indicator measures changes of the distribution of land uses within a country
over time. Broad land use categories are: Arable land, permanent cropland, permanent pasture,
forests and woodland, built-up areas, other. Finer classifications may be chosen, if available and
appropriate.
Description: The indicator provides information on changes in the productive or protective uses of
the land resource to facilitate sustainable land use planning and policy development. Such
information is useful in identifying opportunities to protect land uses or promote future allocation
aimed at providing the greatest sustainable benefits for people. Economically, changes in land use
will, for example, result in changes in possible agricultural production and influence employment
opportunities. From an environmental point of view, unsustainable land use is an important factor
in land degradation, may pose a threat to ecosystems, and lead to natural habitat loss and landscape
changes.” [26]
Justification: the information that this indicator gives for sustainable land use
planning is completely necessary, specially considering the sustainability of
establishing a landfill.

42
a.2.) Land degradation
�Brief definition: The share of land which due to natural processes or human activity is no longer
able to sustain properly an economic function and/or the original ecological function. Degraded
land includes land affected by soil erosion, deterioration of the physical, chemical and biological or
economic properties of soil and/or long-term loss of natural vegetation.
Description: The indicator measures the extent of land degradation, which is an impediment to
sustainable development in general, and to sustainable agriculture in particular. In many developing
countries it is a major cause of poverty and further environmental damage due to overuse of
national resources. The indicator can also be seen as an overall measure of the reduction in quality
of land resources.” [26]
Justification: useful information to know about land conditions, availability and
quality. This point is specially important in composting, landfill and anaerobic
digestion processes (see the effects of each one in Section 3).
a.3.) Land availability
Amount of available land.
Justification: this indicator does not appear in the list of SIs where the rest of
indicators have been taken from. Even if the indicator of “Land use change” can
give information about land availability, it has been considered that due to the
importance of this point, this should be an additional indicator.
b) Agriculture
b.1.) Arable and permanent cropland area
�Brief Definition: Arable and permanent crop land is the total of “arable land” and “land under
permanent crops”. Arable land is the land under temporary crops, temporary meadows for mowing
or pasture, land under market and kitchen gardens and land temporarily fallow (for less than five
years); and land under permanent crops is the land cultivated with crops that occupy the land for
long periods and need not be replanted after each harvest.

43
Description: This indicator shows the amount of land available for agricultural production and,
inter alia, the cropland area available for food production. In many developing countries, rising food
and fibre demand and a decline in farm sizes forces small farmers to extend cultivation to new areas,
which are fragile and not suitable for cultivation. Crop intensification, which has contributed
significantly to agricultural growth in recent years, can ease the pressure on cultivating new lands but
farm practices adopted for raising yields can also, in some situations, damage the environment. This
indicator is of value to land planning decision making.” [26]
Justification: this indicator can be useful to know the land availability, as well as the
possible competition between land use. So it is important for future land planning.
Apart from that, it can show the amount of substrate available for the biological
treatment (as waste or also for co-digestion with it).
b.2.) Fertilizer use efficiency
�Brief definition: The indicator measures the extent of fertilizer use recovery in agriculture per
crop unit. Data on the quantities of fertilizers used are converted into the three basic nutrient
components and aggregated. The three components are nitrogen (N), phosphorous (P205), and
potassium (K20). Nutrient components of crops and their by-products are based on their
standardized chemical composition.
Description: This indicator shows the potential environmental pressure from inappropriate
fertilizer application. Intensive fertilizer application is linked to nutrient losses that may lead to
eutrophication of water bodies, soil acidification, and potential contamination of water supply with
nitrates. In many countries, intensification of agricultural production is a response to increases in
food demand and in the scarcity of agricultural land. It is necessary that this intensification keeps
negative impacts to the resource base and the wider environment within bounds so that the
sustainability of the system is not threatened.” [26]
Justification: it can be difficult to find this indicator, but as the compost obtained
after the composting and the anaerobic digestion, is going to be used as a fertilizer,
efficiency of the current used fertilizers it is an interesting data.

44
b.3.) Area under organic farming
�Brief definition: Ratio of total utilized agricultural area occupied by organic farming to total
utilized agricultural area. Organic farming involves holistic production management systems, for
crops and livestock, emphasizing the use of management practices in preference to the use of off-
farm inputs. The indicator may be extended to cover organic forestry and aquaculture.
Description: This indicator shows the importance of organic farming. Organic farming contributes
to reducing environmental loading on soil and water resources and pressure on biodiversity. The
reduction of use of pesticides, herbicides and other chemicals, combined with enhanced
management of natural resources, not only improves the health of ecosystems but also fosters the
health of animals and people and increases income generation and communities’ self-reliance.” [26]
Justification: important information, if available, to establish whether the
composting and anaerobic digestion is appropriate or not, since their product
(compost) is going to be used with this purpose. If any available data about the
usage as fertilizers of co-products and sub-products of any industry is available, it
can be added.
c) Forests: Proportion of total area covered by forests
�Brief definition: The indicator measures the share of forest area in total land area. When possible
the area of primary forest should also be reported on. The forest area is defined as “land spanning
more than 0.5 hectares with trees higher than 5 metres and a canopy cover of more than 10 percent,
or trees able to reach these thresholds in situ. The indicator may further distinguish between primary
and other forests. The primary forest area is defined as “Naturally regenerating forest of native
species, where there are no clearly visible indications of human activities and the ecological
processes are not significantly disturbed.
Description: The indicator allows for monitoring changes in the area covered by forests over time.
A continuing and fast decreasing forest area in a country might be an alarm signal of unsustainable
practices in the forestry and agricultural sector. Forests provide many significant resources and
functions including wood products and non-wood products, recreational opportunities, habitat for
wildlife, conservation of biological diversity, water and soil, and play a crucial role in the global
carbon cycle. They support employment and traditional uses. Primary forests are usually associated
with high levels of biological diversity, particularly in tropical regions. The area of primary forest is
an important indicator of the status of the forest ecosystem as a whole.” [26]

45
Justification: this core indicator is not directly useful in this specific case, but it
gives information about biodiversity (changes can cause important diseases), and
also about the so important carbon cycle (very important for the CO2 equilibrium,
etc).
9. OCEANS, SEAS AND COASTS
None useful indicator
10. FRESHWATER
a) Water quantity: Proportion of total water resources used
�Brief definition: Total annual volume of groundwater and surface water withdrawn from its
sources for human use (in the agricultural, domestic and industrial sectors), expressed as a
percentage of the total volume of water available annually through the hydrological cycle (total
renewable water resources). The terms water resources and water use are understood as freshwater
resources and freshwater use.
Description: The indicator shows the degree to which total renewable water resources are being
exploited to meet the country’s water demands and is thus a measure of water scarcity. Scarce water
could have negative effects on sustainability constraining economic and regional development, and
leading to loss of biodiversity. It is an important measure of a country’s vulnerability to water
shortages.” [26]
Justification: apart from the information it gives about SD, it is necessary to know
about water scarcity because incineration needs water for the combustion air
treatment.
b) Water quality
b.1.) Presence of faecal coliforms in freshwater
�Brief definition: The proportion of freshwater resources destined for potable supply containing
concentrations of faecal coliforms which exceed the levels recommended in the World Health
Organization (WHO) Guidelines for Drinking-water Quality.

46
Description: The indicator assesses the microbial quality of water available to communities for
basic needs. It identifies communities where contamination of water with human and animal excreta
at source or in the supply poses a threat to health. Diarrhoeal diseases, largely the consequence of
faecal contamination of drinking-water supplies, are the major cause for morbidity and mortality in
many developing countries, especially among children. Frequent diarrhoeal episodes, even without
fatal consequences, disrupt children’s development and education, which, in the longer term, can
have serious consequences for sustainable development. “[26]
Justification: this indicator is related to the presence of organic material in water.
As waste treatment is also related to water quality, specially in the landfill and
composting cases, it is necessary to consider this indicator together with other ones.
b.2.) Wastewater treatment
�Brief definition: Proportion of wastewater that is treated, in order to reduce pollutants before
being discharged to the environment, by level of treatment (primary, secondary or tertiary).
Description: This indicator assesses the potential level of pollution from domestic and
industrial/commercial point sources entering the aquatic environment, and monitors progress
towards reducing this potential within the framework of integrated water resources management. It
helps to identify communities where wastewater treatment action is required to protect the
ecosystem. Untreated or insufficiently treated wastewater can result in increased nutrient levels, high
levels of organic matter and hazardous substances, posing threats to aquatic ecosystems and human
health.” [26]
Justification: it is not a core indicator, but it would be really useful to know this
information in order to determine the quality of the water, because more
information that the given by the indicator above is needed for that.
11. BIODIVERSITY
a) Ecosystem: Proportion of terrestrial area protected, total and by ecological
region
�Brief definition: The indicator is defined as the share of terrestrial area that has been reserved by
law or other effective means to protect part or all of the enclosed environment. It can be calculated
separately for different terrestrial ecological regions. The indicator may also be disaggregated by
management category of the protected areas.

47
Description: The indicator represents the extent to which areas important for conserving
biodiversity, cultural heritage, scientific research (including baseline monitoring), recreation, natural
resource maintenance, and other values, are protected from incompatible uses. It shows how much
of each major ecosystem is dedicated to maintaining its diversity and integrity. Protected areas are
essential for maintaining ecosystem diversity in countries and ecological regions, in conjunction with
management of human impacts on the environment.” [26]
Justification: it is important to have this information specially while determining
the sustainability of landfill and composting. These two waste treatment options
need important amounts of land, so this information is essential.
b) Species: Change in threat status of species
�Brief definition: This indicator is an index based on the number of species in each category of the
IUCN Red List (Least Concern, Near Threatened, Vulnerable, Endangered, Critically Endangered,
Extinct in the Wild, Extinct), and the number of species changing categories between assessments as
a result of genuine improvement or deterioration in status. The indicator is an adaptation of the
IUCN Red List Index, the best known and most accepted methodology for assessing trends in the
status of threatened species at a global level.
Description: The indicator allows monitoring the extinction risk of species over time. Extinct and
endangered species constitute a major loss of biodiversity, which plays a critical role in overall
sustainable development. The indicator also illustrates the effectiveness of local, national, regional
and global measures to protect endangered species.” [26]
Justification: it is useful to consider that in landfills specially, problems can appear
with insects’ uncontrolled reproduction. These points have importance in health
but also in species changes if the effect is really big. So, information like the given
by this indicator can be specially useful in some cases.

48
12. ECONOMIC DEVELOPMENT
a) Macroeconomic performance
a.1.) Gross domestic product (GDP) per capita
�Brief definition: Levels of gross domestic product (GDP) per capita are obtained by dividing
annual or period GDP at current market prices by population. A variation of the indicator could be
the growth of real GDP per capita which is derived by computing the annual or period growth rate
of GDP in constant basic producers’ or purchasers’ prices divided by corresponding population.
GDP is the sum of value-added of all production units including all taxes and subsidies on products
which are not included in the valuation of output.
Description: The indicator is a basic economic growth indicator and measures the level and extent
of total economic output. It reflects changes in total production of goods and services. It is a
powerful summary indicator of economic development, even though it does not account for social
and environmental cost of production and consumption.” [26]
Justification: it is necessary to know the economic situation of the country.
a.2.) Investment share in GDP
�Brief definition: This indicator refers to the share of investment in total production. It is obtained
by calculating gross capital formation as percentage of gross domestic product. Gross capital
formation (investment) is defined as the total value of gross fixed capital formation plus changes in
inventories and acquisitions less disposal of valuables. Gross fixed capital formation is the total
value of produced assets used in the production process for more than one year.
Description: The investment ratio gives an indication of the relative importance of investment as
opposed to, for example, consumption. Acquisitions of capital goods provide important
information on future economic performance of a society by widening and deepening the capital
stock. The indicator measures, thus, an important element of the sustainable development process,
especially in developing countries with low amounts productive capital.” [26]
Justification: it is useful to inform about the future development of the country in
the economic field, which is actually related to the rest of the fields.

49
b) Suitable public finance: Debt to GNI ratio
�Brief definition: The indicator can be defined as the total amount of outstanding debt issued by
the general government divided by gross national income. Total debt consists of external debt (debt
held by non-residents) and internal debt (held by residents). For countries where external debt is a
major concern, the indicator can alternatively or additionally be defined as total external debt
(private and public) divided by GNI.
Description: With regard to public debt, the indicator is a standard measure of public finance. Debt
constitutes a burden for future generations as it reduces the amount available for their consumption
and investments. High and increasing debt ratios can be seen as an indication of unsustainable pub-
lic finances. With regard to external debt, this is one of the indicators that measures the burden of
servicing the external debt of a country in relation to its total income (GNI). While external
borrowing is a method of supplementing savings and financing the investment gap in a country, an
unsustainable external debt burden will choke development.” [26]
Justification: it is important in order to predict future scenarios. The debt can carry
future financial, social and environmental problems, and it is necessary to take it
into account for future planning.
c) Information and communication technologies: Internet users per 100 population
�Brief definition: The indicator is computed by first dividing the number of Internet users by total
population, and then multiplying by 100. Internet users are those who use the Internet from any
location. The Internet is defined as a world-wide public computer network that provides access to a
number of communication services including the World Wide Web and carries email, news,
entertainment and data files. Internet access may be via a computer, Internet-enabled mobile phone,
digital TV, games machine etc. Location of use can refer to any location, including work.
Description: The number of Internet users is a measure of Internet access and use. As an
information distribution system, the Internet and its usage provide opportunities for bringing
education and information within the reach of all. It can significantly shorten time lags as well as
open up a new range of information resources. It also provides significant, new economic
opportunities as well as possibilities for more environment-friendly options for the marketplace.”
[26]
Justification: it gives an idea of how advanced the country is in new technologies,
what is related to culture habits, and, in conclusion to waste generation.

50
d) Research and development: Gross domestic expenditure on R&D as a
percentage of GDP
�Brief definition: Gross domestic expenditure on scientific research and experimental
development (R&D) expressed as a percentage of Gross Domestic Product (GDP). Gross domestic
expenditure on R&D (GERD) activities are defined as the total intramural expenditure on research
and development performed on the national territory during a given period. This includes both
current costs and capital expenditures.
Description: This ratio provides an indication of the level of financial resources devoted to R&D in
terms of their share of the GDP. R&D is essential for expanding the knowledge basis and
developing new and improved products in the economy. It is a critical component of future
economic growth. Moreover, R&D on issues relevant for sustainable development increases the
scientific basis for informed decision-making in this area.” [26]
Justification: despite it is not a core indicator for the Commission of SD (CSD), it
is really important to know how much effort is made in the country in research and
development before deciding if an specific WTT is sustainable or not. If the
percentage is high, it can indicate that research is going to be done in the area in
order to future improvements, etc.
13. GLOBAL ECONOMIC PARTNERSHIP
None useful indicator
14. CONSUMPTION AND PRODUCTION PATTERNS
a) Material consumption: Domestic material consumption
�Brief Definition: Domestic Material Consumption (DMC) is defined as the weight of the total
amount of materials directly used in the economy (used domestic extraction plus imports), minus
the materials that are exported. Materials may be broken down by type of material (minerals,
biomass, fossil fuels).
Description: DMC is a useful indicator, as it provides an assessment of the absolute level of use of
resources. Primary production of raw materials, processing of the materials into products, and
ultimate disposal of the waste material has major environmental impacts. The indicator provides a
basis for policies to increase the efficient use of raw materials in order to conserve natural resources

51
and reduce environment degradation resulting from primary extraction, material processing,
manufacturing and waste disposal.” [26]
Justification: useful to know something about domestic material consumption
patterns. In fact, this is directly related to waste generation.
b) Energy use: Share of renewable energy sources in total energy use
�Brief definition: The share of renewable sources in total primary energy supply or total energy
consumption. Renewable energy sources are divided into non-combustible (geothermal, hydro,
solar, wind, tide and wave) and combustible renewables and waste (biomass, animal products,
municipal waste and industrial waste). Non-renewables are fossil fuels (coal, crude oil, petroleum
products, gas) and nuclear.
Description: The promotion of energy, and in particular of electricity from renewable sources of
energy, is a high priority of sustainable development for several reasons. Energy from renewables
can increase energy security and lead to diversification of energy supply. It reduces environmental
degradation caused by non-renewable energy sources, contributes to the mitigation of climate
change and reduces the depletion of natural resources.” [26]
Justification: essential to know the amount of energy obtained from biomass, what
is important in this case because the organic material of the waste can be used with
this purpose (incineration and fermentation).
c) Waste generation and management
c.1.) Generation of waste
�Brief definition: The amount of all waste, both hazardous and non-hazardous, generated by
selected main groups of industries or sectors of the economy, expressed per capita and per unit of
value added (in US $) by economic activity (at constant prices).
Description: The main purpose is to show the trend in the generation of waste produced by
different human activities. Waste represents a considerable loss of resources both in the form of
materials and energy. The treatment and disposal of the generated waste may cause environmental
pollution and expose humans to harmful substances and bacteria, and therefore impact on human
health. Waste generated per unit of value-added shows if there is decoupling of waste generation
from economic growth.” [26]

52
Justification: really important. But the project is about MSW. So what is needed is
the generation of MSW. So the indicator that is going to be used is the “Generation
of MSW”.
c.2.) Waste treatment and disposal
�Brief definition: Percentage of waste which is recycled; composted; incinerated; and landfilled on
a controlled site.
Description: The indicator measures the proportion of waste generated which is recycled,
composted, incinerated, or landfilled on a controlled site. It gives an indication of the environmental
impact of waste management in the country. The proper treatment and disposal of waste is
important from an environmental and social viewpoint but can be an economic burden on
industries, municipalities and households. The amount of waste recycled and composted reduces the
demand for raw materials, leading to a reduction in resource extraction. There may also be a benefit
of increased income generation for the urban poor through recycling schemes.” [26]
Justification: essential indicator to know the current situation before taking any
decision.
Apart from these indicators above, it is essential for this project to have other kind of basic
information of the studied situation:
15. WASTE�S CHARACTERISTICS
a) Composition, with seasonal variations
Some indicators above give information about composition of waste, but it is
important to know it explicitly as well as its variations. This information is going to
give an idea of other characteristics, such as, moisture (specially important for
composting) and heating value (essential information for incineration) of the waste.
b) Amount and type of recycled waste

53
Information to be used while considering the waste amount production. It is going
to give information about Waste Management practices. Depending on the amount
of waste recycled and how the system is organized, a general picture of the Waste
Management in the studied place is going to be drawn.
16. LEGISLATION FRAMEWORK
a) The existence of laws in Waste Management and their quality
Information like which law standards are followed (EU ’s laws, USA’s law, etc.),
waste law’s hierarchy or organization (local authority’s influence, etc.) and Waste
Management politics (taxes for waste production, etc.) are important points to
consider before making any decision in the field.
b) The fulfilment of them
The indicator about “Corruption” is related to it.
17. CLIMATIC CONDITIONS AND HYDROLOGY
a) Precipitation Rate
It is really important specially for landfill and composting.
b) Usual temperatures and changes
Essential information for composting and landfills, due to the consequences in the
process development, and for incineration in order to know have an overall idea of
how much energy is consumed in the country or region among different seasons.

54
18. GEOGRAPHICAL CONDITIONS
a) Geographical overall description
b) Topographical map
This point above is really important for landfill and composting.
c) Roads and possible routes for waste transportation
19. OTHERS
a) Odour
b) Noise
Both are difficult things to measure, that is why a good indicator is going to be the
amount of complaints made by inhabitants in the country/region related to these
two points.

55
4.3. CLASSIFICATION OF SIs: SPECIAL FEATURES OF EACH
WTT
From the list of indicators selected, two broad and important groups can be distinguished.
On the one hand, the indicators that are going to influence directly the decision making
and, on the other hand, the ones that are going to be mainly influenced after the decision
making, but obviously are going to condition the decision too. The indicators in the second
group are the ones that are going to be changed after the establishment of the technology.
This classification is going to vary from technique to technique.
In Section 2 about SIs, was stated that “indicators must be coupled with a target or trend
(specific for each local situation), so that the later discussion about sustainability is more
clear”. However, in this step, when the local conditions are still unknown, is not possible to
develop this point. As a consequence of this, the necessity of choosing a system to evaluate
the general sustainability of each technique arises. It has been decided to do it by measuring
the change produced in the situation that exists when the decision must be taken. This can
be done in a qualitative or quantitative way. But as argued before, the lack of specific
information in this step, makes difficult the quantitative measurement. So the changes are
going to be assessed by saying if they are positive or negative, what is the same, if they are
going to carry improvements or worsening to the current situation.
For the determination of which kind of indicator each one is, it is going to be assumed that
once a decision is taken, the waste treatment technique is going to be installed in the proper
way, fulfilling all the requirements and that it is going to work in the suitable way.
It is necessary to consider that most of the indicators in the list are going to have influence
in the decision, directly or indirectly (in example, the land availability for incineration is not
essential, but if it is small, it is going to mean that this technique can be the right one).
The keys needed to understand Table 3 are the following:
�: it has influence in the decision making ��: it has a really important influence in the decision making
+/-: positive/negative effects in the indicator after the decision making
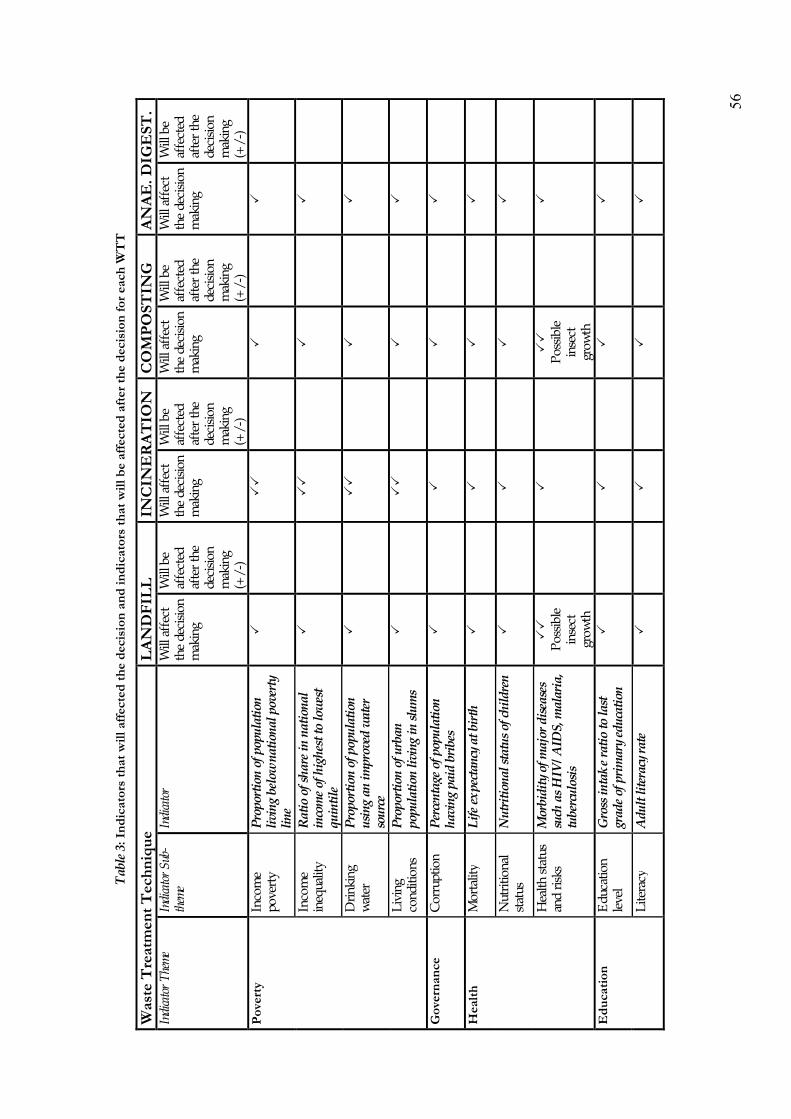
56
Tab
le 3
: In
dic
ato
rs t
hat
wil
l af
fect
ed t
he
dec
isio
n a
nd
in
dic
ato
rs t
hat
wil
l b
e aff
ecte
d a
fter
th
e d
ecis
ion
fo
r ea
ch W
TT
Wast
e T
reatm
ent
Tec
hn
iqu
e
LA
ND
FIL
L
INC
INE
RA
TIO
N
CO
MP
OS
TIN
G
AN
AE
. D
IGE
ST
. In
dica
tor T
hem
e In
dica
tor S
ub-
them
e In
dica
tor
Will
aff
ect
the
deci
sion
m
akin
g
Will
be
affe
cted
af
ter
the
deci
sion
m
akin
g (+
/-)
Will
aff
ect
the
deci
sion
m
akin
g
Will
be
affe
cted
af
ter
the
deci
sion
m
akin
g (+
/-)
Will
aff
ect
the
deci
sion
m
akin
g
Will
be
affe
cted
af
ter
the
deci
sion
m
akin
g (+
/-)
Will
aff
ect
the
deci
sion
m
akin
g
Will
be
affe
cted
af
ter
the
deci
sion
m
akin
g (+
/-)
Po
vert
y
Inco
me
pove
rty
Pro
port
ion
of
popu
lati
on
livi
ng
belo
w n
atio
nal
pov
erty
li
ne
�
��
�
�
Inco
me
ineq
ualit
y R
atio
of
sha
re i
n n
atio
nal
in
com
e of
hig
hes
t to
low
est
qu
inti
le
�
��
�
�
Dri
nkin
g w
ater
P
ropo
rtio
n o
f po
pula
tion
u
sin
g an
im
prov
ed w
ater
so
urc
e
�
��
�
�
Liv
ing
cond
itio
ns
Pro
port
ion
of
urb
an
popu
lati
on l
ivin
g in
slu
ms
�
��
�
�
Go
vern
an
ce
Cor
rupt
ion
P
erce
nta
ge o
f po
pula
tion
h
avin
g pa
id b
ribe
s �
�
�
�
Hea
lth
M
orta
lity
Lif
e ex
pect
ancy
at
birt
h
�
�
�
�
Nut
riti
ona
l st
atus
N
utr
itio
nal
sta
tus
of c
hil
dre
n
�
�
�
�
Hea
lth
stat
us
and
risk
s M
orbi
dit
y of
maj
or d
isea
ses
such
as
HIV
/A
IDS,
mal
aria
, tu
berc
ulo
sis
��
P
ossi
ble
inse
ct
grow
th
�
��
P
ossi
ble
inse
ct
grow
th
�
Ed
uca
tio
n
E
duca
tion
le
vel
Gro
ss i
nta
ke
rati
o to
las
t gr
ade
of p
rim
ary
edu
cati
on
�
�
�
�
Lit
erac
y A
du
lt l
iter
acy
rate
�
�
�
�

57
Dem
og
rap
hic
s P
opul
atio
n
Pop
ula
tion
gro
wth
rat
e �
�
�
�
Tou
rism
R
atio
of
loca
l re
sid
ents
to
tou
rist
s in
maj
or t
ouri
st
regi
ons
and
des
tin
atio
ns
�
��
Se
nsit
ive
to
chan
ges
in
was
te
amou
nt
�
�
Natu
ral
haza
rds
Vul
nera
bilit
y to
nat
ural
ha
zard
s
Per
cen
tage
of
popu
lati
on
livi
ng
in h
azar
d p
ron
e ar
eas
�
��
H
igh
init
ial
inve
stm
ent
�
�
Atm
osp
her
e
Clim
ate
chan
ge
Car
bon
dio
xid
e em
issi
ons
-
--
-
-
Em
issi
ons
of g
reen
hou
se
gase
s
-
--
-
-
Air
qua
lity
Am
bien
t co
nce
ntr
ati
on o
f ai
r po
llu
tan
ts i
n u
rban
are
as
-
--
-
-
Lan
d
Lan
d us
e an
d st
atus
L
and
use
ch
ange
��
B
ig a
mou
nt
of la
nd
need
ed
+
Sust
aina
ble
bene
fits
for
pe
ople
��
L
ittl
e am
ount
of
land
ne
eded
. R
educ
tion
of
the
was
te
volu
me
��
B
ig a
mou
nt
of la
nd
need
ed
+
Sust
aina
ble
bene
fits
for
pe
ople
�
Lan
d d
egra
dat
ion
��
- �
�
�
Agr
icul
ture
A
rabl
e an
d p
erm
anen
t cr
opla
nd
are
a �
�
��
A
mou
nt o
f su
bstr
ate
for
this
te
chni
que
��
A
mou
nt o
f su
bstr
ate
for
this
te
chni
que
Fer
tili
zer
use
eff
icie
ncy
�
�
��
+
��
+
Are
a u
nd
er o
rgan
ic f
arm
ing
�
�
��
+
��
+
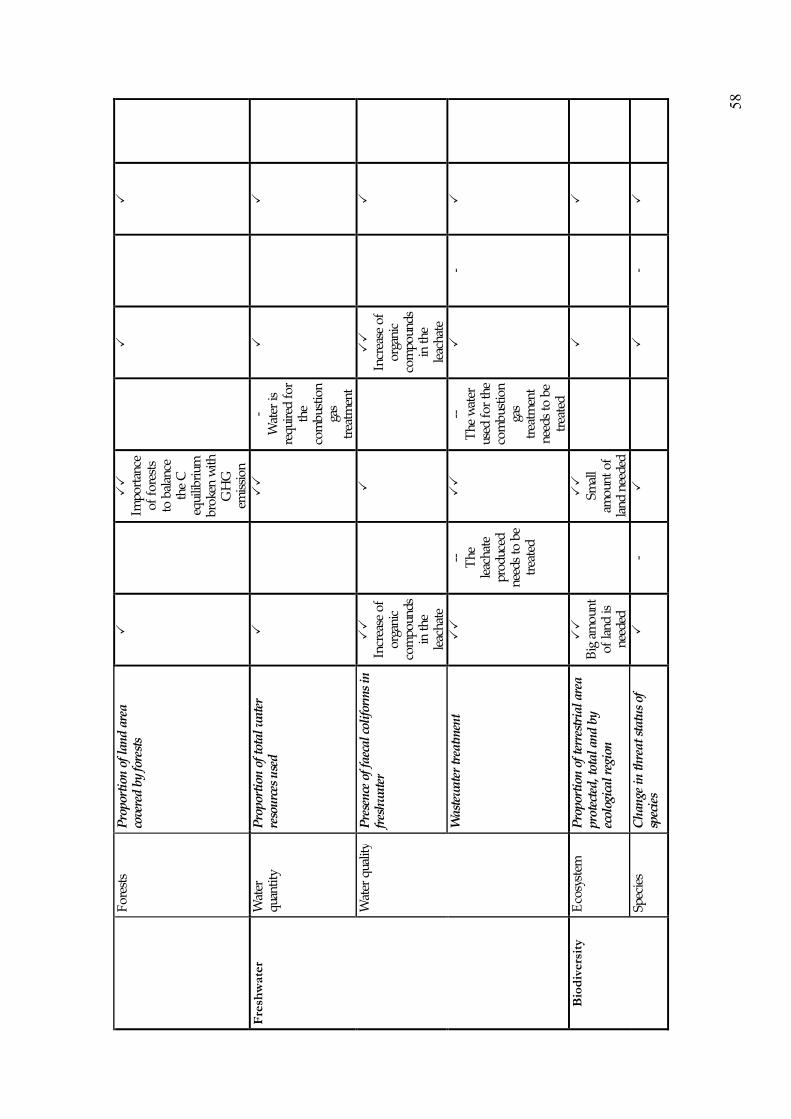
58
For
ests
P
ropo
rtio
n o
f la
nd
are
a co
vere
d b
y fo
rest
s �
��
Im
por
tanc
e of
for
ests
to
bal
ance
th
e C
eq
uilib
rium
br
oken
wit
h G
HG
em
issi
on
�
�
Fre
shw
ate
r W
ater
qu
anti
ty
Pro
port
ion
of
tota
l w
ater
re
sou
rces
use
d
�
��
-
Wat
er is
re
quir
ed f
or
the
com
bust
ion
gas
trea
tmen
t
�
�
Wat
er q
ualit
y P
rese
nce
of
faec
al c
olif
orm
s in
fr
esh
wat
er
��
In
crea
se o
f or
gani
c co
mp
ound
s in
the
le
acha
te
�
��
In
crea
se o
f or
gani
c co
mp
ound
s in
the
le
acha
te
�
Was
tew
ater
tre
atm
ent
��
--
T
he
leac
hate
pr
oduc
ed
need
s to
be
trea
ted
��
--
T
he w
ater
us
ed f
or t
he
com
bust
ion
gas
trea
tmen
t ne
eds
to b
e tr
eate
d
�
- �
Bio
div
ersi
ty
Eco
syst
em
Pro
port
ion
of
terr
estr
ial
area
pr
otec
ted
, tot
al a
nd
by
ecol
ogic
al r
egio
n
��
B
ig a
mou
nt
of la
nd is
ne
eded
��
Sm
all
amou
nt o
f la
nd n
eede
d
�
�
Spec
ies
Ch
ange
in
th
rea
t st
atu
s of
sp
ecie
s �
- �
�
- �

59
Eco
no
mic
d
evel
op
men
t M
acro
econ
om
ic
perf
orm
ance
Gro
ss d
omes
tic
prod
uct
(G
DP
) pe
r ca
pita
�
�
�
�
Inve
stm
ent
shar
e in
GD
P
�
�
�
�
Sust
aina
ble
publ
ic f
inan
ce
Deb
t to
GN
I ra
tio
�
�
�
�
Info
rmat
ion
and
com
mun
icat
ion te
chno
logi
es
Inte
rnet
use
rs p
er 1
00
popu
lati
on
�
�
�
�
Res
earc
h an
d de
velo
pmen
t G
ross
dom
esti
c ex
pen
dit
ure
on
R&
D a
s a
perc
ent
of G
DP
�
�
�
�
Co
nsu
mp
tio
n a
nd
p
rod
uct
ion
p
att
ern
s
Mat
eria
l co
nsum
ptio
n
Dom
esti
c m
ater
ial
con
sum
pti
on
�
�
�
�
Ene
rgy
use
Shar
e of
ren
ewab
le e
ner
gy
sou
rces
in
tot
al e
ner
gy u
se
�
+
�
++
�
�
+
Was
te
gene
rati
on
and
man
agem
ent
Gen
erat
ion
of
was
te
�
�
�
�
Was
te t
rea
tmen
t an
d d
ispo
sal
�
+
�
+
�
+
�
+
Wast
e�s
Ch
ara
cter
isti
cs
Com
posi
tion
(w
ith
sea
son
al v
aria
tion
s)
�
�
�
�
Am
oun
t an
d t
ype
of r
ecyc
led
was
te
�
�
�
�
Leg
isla
tio
n
fram
ewo
rk
Ex
iste
nce
of
law
s in
Was
te M
anag
emen
t (W
M)
and
th
eir
qu
alit
y
�
�
�
�
Dat
a of
bri
bes
paid
in
th
e fi
eld
�
�
�
�
Cli
mati
c P
reci
pita
tion
Rat
e ��
�
�
�
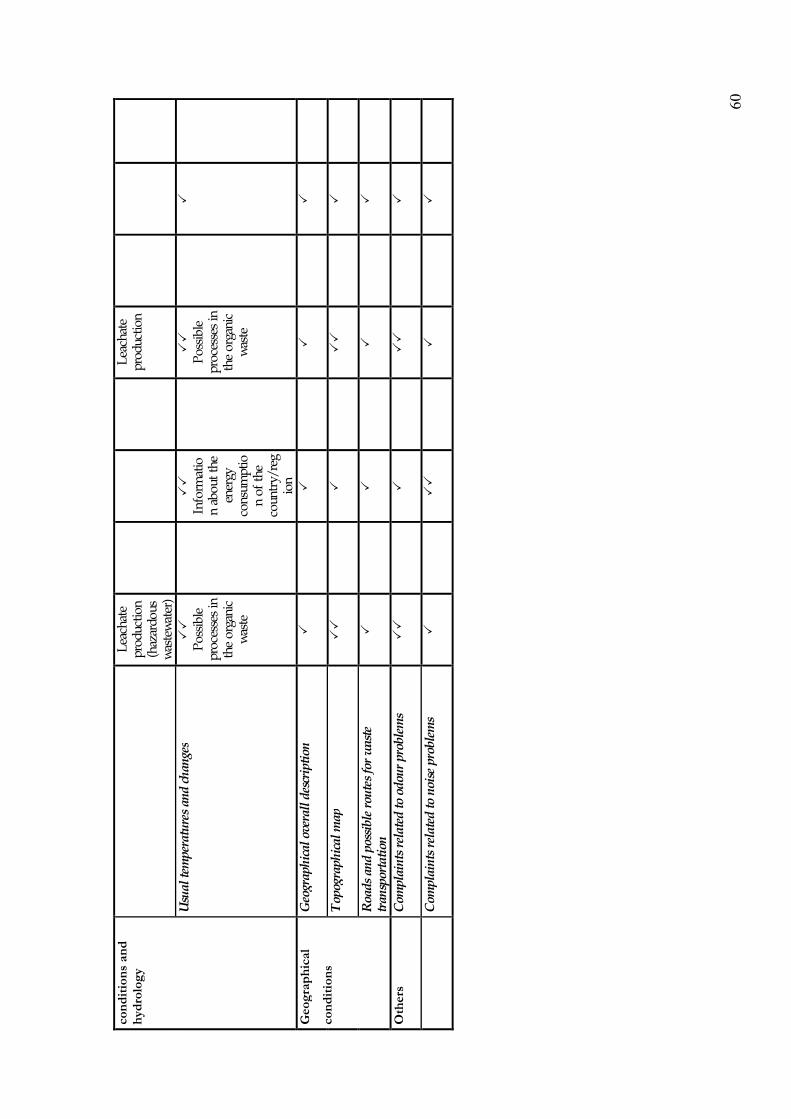
60
con
dit
ion
s an
d
hyd
rolo
gy
Lea
chat
e pr
oduc
tion
(h
azar
dous
w
aste
wat
er)
Lea
chat
e pr
oduc
tion
Usu
al t
empe
ratu
res
and
ch
ange
s ��
P
ossi
ble
proc
esse
s in
th
e or
gani
c w
aste
��
In
form
atio
n ab
out
the
ener
gy
cons
umpt
ion
of t
he
coun
try/
reg
ion
��
P
ossi
ble
proc
esse
s in
th
e or
gani
c w
aste
�
Geo
gra
ph
ical
con
dit
ion
s
Geo
grap
hic
al o
vera
ll d
escr
ipti
on
�
�
�
�
Top
ogra
phic
al m
ap
��
�
��
�
Roa
ds
and
pos
sibl
e ro
ute
s fo
r w
aste
tr
ansp
orta
tion
�
�
�
�
Oth
ers
Com
plai
nts
rel
ated
to
odou
r pr
oble
ms
��
�
��
�
C
ompl
ain
ts r
elat
ed t
o n
oise
pro
blem
s �
��
�
�

61
In the following paragraphs the most important points of Table 3 are discussed:
Poverty: the initial and operational investment of each technology is going to be different.
In conclusion, as incineration needs the highest, the poverty level is specially important in
this case.
Health: a high level of health problems related to lack of hygiene or insect growth can be
totally important to determine whether landfill and composting are appropriate for the
specific situation considered or other technologies without these problems are better. But it
is also important to mention that if the change caused in the region or area considered is
from a non-waste treatment situation to a waste treatment situation, a positive change is
going to appear.
Demographics: incineration is more sensitive to changes in the waste amount than the
other technologies. These changes as a consequence of demographic changes due to, for
example, tourism, would make necessary an additional furnace. That is why this
information is specially important before making any decision.
Natural Hazards: as mentioned above, incineration requires a high initial and operational
investment. In conclusion, is it important to consider if the region is a hazard prone area
before making any investment.
Atmosphere: every technology emits pollutant gases to the atmosphere, but is incineration
the one that has the most important air emissions.
Land: changes in the land use are related to land availability. This is a really important point
for techniques that need a big amount of it (landfill and composting) as well as for the ones
that does not need almost land (incineration specially because anaerobic digestion is not
valid for all the waste). According to “Land degradation”, special attention need to be paid
to landfill, which is going to contribute to it making the land no longer able to sustain
properly an economic function and/or the original ecological function at all. As in
composting only organic material is disposed of, the degradation is not so drastic.

62
It can be considered that the choice of a landfill can reduce the “Land availability” for
agricultural production, but this is not necessarily going to be like this if the landfill is
constructed in a sustainable way.
Is going to be assumed that the “Fertilizer use efficiency” is going to affect the decision of
choosing or not composting and anaerobic digestion, but at the same time if one of these
technologies is chosen that the decision is only going to improve the previous situation.
The “Proportion of land area covered by forests” is not going to change whichever it is the
technology chosen if it is constructed in a sustainable way. But this is an specially important
point for incineration due to the high emissions of green house gases emitted while
combusting the waste. Actually, this is a global issue and not necessarily a country poor in
forest is going to suffer more from these emissions. However, related with possible
institutional agreements, a high level of this indicator, can carry advantages for a specific
country. For example, with a big amount of forests the agreed levels of emissions of GHGs
can be higher.
Freshwater: the leachate produced in landfill and composting is going to add organic
material to freshwater, what is not going to be appropriate if the “Presence of faecal
coliforms” in freshwater is really high. However, additional information about water
quality, such as nutrients, salts, metals and persistent organic compounds is required. Apart
from that, the current situation of “Wastewater treatment” is specially essential while
deciding if landfill and incineration are suitable because the first one needs the treatment of
the leachate and the second one of the combustion gas. In the case of the composting, this
aspect is important but not as in the two cases mentioned above, because in this case
hazardous compounds are not so abundant.
Biodiversity: the “Proportion of terrestrial area protected, total and by ecological region” is
particularly important for landfill (where a lot of land is required) and for incineration
(where little terrain is needed). If this indicator is high the second one is going to be one of
the best options. Apart from that but according also to biodiversity, it has been considered
the “Change in threat status of species”. Even if no really drastic, possible changes can
appear as a consequence of possible insect growth.
63
Consumption and production patterns: the amount of energy obtained from combustible
waste is going to increase specially with the incineration. It is also essential to consider that
the decision taken is going to try to improve the current situation about waste treatment.
Climatic conditions and hydrology: leachate is produced in landfill and composting when it
rains over the waste disposed of in the land, but in the first one it is hazardous wastewater
because the water is in contact with toxic waste (plastics…) and it can adsorb toxic
compounds.
The temperatures is an important point to consider in all the techniques, but due to
different reasons. In landfill and composting it is vital since the different processes that
may occur in organic waste depend on temperature, so the speed of decomposition of the
waste may change and other processes occur. However, it is important for incineration and
anaerobic digestion due to another reason. The importance here relies on the information
that “Usual temperatures and changes” can give about the variations on energy
consumption and changes on it during different seasons.
Table 3 makes possible a better understanding of the indicators and clarifies many points
that are going to be vital while using the SIs’ list, as for example in the Case Study of the
following section (Section 5).

64
5. CASE STUDY. The City of Stockholm: landfill vs. incineration
Section 2.8. explains the most the important points of SI’s validation. Three different kind of
SI’s validation are mentioned: “Design Validation”, “Output Validation” and “End use
validation”. The first one is to answer if this indicator is scientifically founded or not. Since
the source where the indicators have been taken can be considered a serious source
(Department of Economic and Social Affairs of the United Nations), it is going to be assumed that
this validation is previously made. The “Output validation” deals with the determination of
how the indicators show the reality of the situation they have been designed for. This is the
validation that has been done with the justifications given for each one. And finally, the
“End use validation” is the one that tries to establish whether the chosen indicators are
useful or not for the specific situation treated. This is going to be made with the practical
application of the indicators on an specific Case Study. With it, the list of indicators
presented above can be changed, removing some of them and/or adding other.
But it is important to consider that for each specific case, different indicators are going to
be the important and useful ones, and that is why the validation is going to be made with
different criteria and paying attention to different aspects.
5.1. AIM OF THE CASE STUDY AND INITIAL CONDITIONS
The general aim of this Case Study is to validate the SIs selected in the previous section.
With this purpose, The City of Stockholm has been chosen due to the wide data availability
and proximity. The task is going to be to determine whether incineration is sustainable or
not for Stockholm, or in contrast, it is better to dispose of MSW in landfill. This decision is
going to be taken based on Stockholm’s current situation, that is almost the 100% of the
MSW is incinerated.

65
5.2. METHODOLOGY OF WORK FOR THE CASE STUDY
The first step is to gather the essential information about the city so that a general picture
of it is drawn. After that, it is necessary to identify which are going to be the major issues
(from Table 3) affecting the decision since in this specific case only the important points for
incineration and landfill are going to be considered. This means that a prioritizing exercise
is needed.
Different information sources are going to be used. On the one hand, reported statistics
for Stockholm, or more general ones for Sweden sometimes, and on the other hand,
personal contact with Nils Lundkvist from Traffic Administration, Department for Waste
Management of The City of Stockholm, Staffan Brantingson and Jennica Wallenborg from
Statistics Sweden (SBC) and Christer Lännergren, from Stockholm Vatten AB has been held.
Once all the information required has been collected, after a deep discussion process is
developed, an answer to the asked question is going to be given.
5.3. INTRODUCTION
5.3.1. General information of Stockholm
The City of Stockholm is the capital of Sweden and it is located in the south east coast of
the country, where the Lake Mälaren enters the Baltic sea. In 2006, the city had 782.885
inhabitants [27] and 1.918.104 in the region (County of Stockholm) [28]. The city is
divided in 14 districts that can be seen in the Figure 5 (next page).
Some of the most relevant features of the city (or the County when no more specific
information is available) are the following. The County of Stockholm is the administrative
and commercial centre of Sweden as well as being the most dynamic and growing region
[29]. The region is the most important for the Swedish economy and, in consequence, its
development [29]. Actually, approximately one quarter of all companies in the country are
registered here and the region generates approximately 38 % of the entire country's GDP,
while its share of the population amounts to 22 % [30].

66
Figure 5: Stockholm by City District [[[[27]]]]
Compared to the rest of the country, the region has the highest average income, the largest
proportion of gainfully employed, the highest demographic growth, the youngest
population and the highest average education level [30].
The most important economic activities in the city are: Financial Services, ICT, Retail,
Tourism, Fashion, Design, Media and Security [30].
Around the 90% of the of the dwelling are residential houses and 10% single family houses
[31].

67
5.3.2. General information of current situation of Waste Treatment and
Management in Stockholm
MSW in Stockholm includes only waste from households, for companies and organizations
other regulations apply. The MSW is composed of different kind of waste and each one is
collected with a different system (all the information bellow from [32]):
Domestic waste: is the waste produced at home as a consequence of everyday habits and
activities. There are around 55.000 collection points in the city, where around 5 million
tonnes of waste is collected everyday by the 75 refuse vehicles. The collection is carried out
by a contractor, whose services are hired by The City of Stockholm.
Bulky waste: is the waste that due to its size, weight and material can not be included in
domestic waste (furniture, household utensils and tools). In apartments blocks where a
room for bulky waste exists it has to be disposed there, but if it is not any special room for
this, a fee must be paid to order the collection to a contractor hired and approved by The
City of Stockholm. Apart from this, there are five recycling centres in the city where this
waste can be disposed of for free.
Waste from electrical and electronic equipment: this is the waste of items which require a battery or
a plug to function (computers, ovens, etc.). The way to dispose of this waste is the same as
for bulky waste, but in this case there is only one recycling place where this waste can be
put and if the size is up to a microwave oven, it can be also put in a mobile hazardous
waste collection point.
Hazardous waste: it is the waste dangerous for people and the environment and that is why
should never be placed in household waste or poured down the drain. There are special
hazardous waste collection points in Stockholm situated beside some petrol stations and at
the recycling centres. The City of Stockholm hires the contractors that empty and manage
these centres. There is also a mobile hazardous waste collection, which deals with
hazardous waste free of charge. Apart from that, batteries, medications, some paints, etc.
are collected in shops, petrol stations, pharmacies, etc.

68
Food waste: it consists of discarded food items such as vegetables, fruit, bread, meat, fish and
poultry. This waste can be separated from the rest and that is why “bins for food waste
intended for biological treatment are available from The City of Stockholm” [33].
Once the collection has finished, almost the 100% of the MSW produced in Stockholm is
incinerated. Only a small amount (around the 1-2% in 2007) is biologically treated for
biogas production. This percentage is planned to increase by 2012 and reach the amount of
18.000 t/year [34].
The decision of incinerating the main part of the MSW in Stockholm was taken in 1900,
and the first incineration plant was built and started working in 1909. The main reason
found for that was future problems to find available land for landfills [34]. More
information about Waste Management in the city is available later (Section 5.5.- Legislation
Framework).
5.4. IMPORTANT LOCAL CONDITIONS: PRIORITY POINTS
The SIs identified in Section 4 can be used with different purposes and in different contexts.
In this specific case the boundaries are clear since the framework is restricted to the city of
Stockholm and only two of the four waste treatment techniques are going to be considered
(landfill and incineration). In Table 3, which are the indicators that are going to affect the
decision and are the ones that are going to be affected were identified for all the
techniques. So, on it which are the most relevant points to be determined for landfill and
incineration appear. Those are the necessary ones to have enough (but not excessive, so
that it is manageable) information about the situation considered. The objective is not to
use all the indicators in order to have as much information as possible, it is to have the
necessary information to make a decision.
For this specific case, it can be inferred from Table 3 that all the indicators are necessary
and useful except Agricultural indicators: “Area under organic farming”, “Fertilizer use
efficiency” and “Arable and permanent cropland area”. The main reason is that they
provide information for composting and for anaerobic digestion, more than for the other
two techniques considered.

69
Sometimes even if the necessary information of an indicator is available, it is difficult to
evaluate what it indicates. In order to be able to make the right decision, apart from
searching information for Stockholm and/or Sweden, information from other places is
going to be necessary. In this way, a comparison of the current situation of the city with
other places, is going to allow the right interpretation of the data collected providing an
actual picture of Stockholm. Also, experts’ judgement is going to be used in some cases,
before making any interpretation of the information collected.

70
5.5. INDICATORS FOR STOCKHOLM1
1. POVERTY
a) Income poverty: Proportion of population living below national poverty line
Information not available.
The most similar data found is that in 2006, 66.031 employees earned less than
39.700 kr (Price Basic Amount2) from the 444.919 employees living in Stockholm
City and 8.845 employees from the 356.385 living and employed in Stockholm. So
in the first case the 14,8% and in the second one the 2,5%. One year before, in
2005, these percentages were: 15,2% and 2,6%, respectively with a Price Basic
Amount in this case of 39.400 kr [35].
Interpretation: in this case as the project is about MSW in Stockholm, the
important thing is the data about people living in Stockholm in general (working in
or outside the city). So, the 14,8 and 15,2 percentages are the useful ones. In the
group of people earning less money than the Price Basic Amount, people that are
e.g. temporary out of work or that are working and studying at the same time are
included. Before making any wrong interpretation of these percentages, the SBC
Sveriges BostadsrättasCentrum was asked. Staffan Brantingson from the Unit for company
and registering based employment statistics of SBC reinforced that these
percentages are higher than in other municipalities of Sweden, but in share of the
total employed population for each municipality it is a low share in Stockholm that
earned less than 39.700 kr during the year 2006. It is difficult to compare these
values with others from other countries since in each the way to measure a manage
poverty is different. This information must be coupled with the rest indicators
about poverty.
1 Note that the numerology of indicators in Section 4 and here it has not been the same, since the indicators
of two of the themes (“Oceans, seas and coasts” and “Global economic partnership”), have not been used.
2 Price Basic Amount: calculated based on changes in the general price level, in accordance with the National
Insurance Act (1962:381). The Increased Price Basic Amount is rounded to the nearest SEK 100 [28]. People
earning less than this quantity are financed from social insurance contributions [36].

71
b) Income inequality: Ratio of share in national income of highest to lowest
quintile
The information found is not exactly the “Ratio of share in national income of
highest to lowest quintile”, it is the “Share of income or consumption of the
poorest 20% (%)” and for Sweden, not particularly for Stockholm. This value is
9.1. The type of survey used: Household or labour force survey. Figure estimated
from Income Distribution Survey (HINK) in 2000. It is a Global Monitoring Data
so the figure is regularly produced by the designated agency for the global
monitoring, based on country data. However, there is no corresponding figure at
the country level, because the indicator is defined for international monitoring only
(example: population below 1$ a day). (23rd August 2007, [37]).
Interpretation: the poorest 20% people have the 9,1% of the total income of the
country. Considering the maximum percentage can be the 20%, and comparing to
other countries, it is a high percentage [38]. Thus, the income inequality in Sweden,
is not really high.
c) Drinking water: Proportion of population using an improved water source
Generally for Sweden: 100% (2004, [37])
Interpretation: it is an indicator of lack of poverty and income equality too.
d) Living conditions: Proportion of urban population living in slums
Information not available.
But it has been found that another indicator which is the “Unemployment rate
within the different districts of a city” can be used to show the social differences
within the city [39]. The following map shows the situation of Stockholm in 2001.

72
Figure 6: Unemployment rate in 2001 in The City of Stockholm [[[[39]]]]
Interpretation: apart from showing that the unemployment rate of the city is in
general low, the figure confirms that there were not significant differences between
the unemployment rate within the different districts in the city. Combining this
information with the one given by the indicators above, an idea of the low
probability or low level of “Proportion of urban population living in slums” can be
deduced.
2. GOVERNANCE
a) Corruption: Percentage of population having paid bribes
Information not available.
The most similar indicator that has been found is the “Reported offences per 1.000
of mean population”. For The County of Stockholm this indicator was 177 in 2006
[28]. Another indicator can be the “Prison population per 100.000 people” that was
82 in 2007 for the whole country [38].
Interpretation: there is no comparative data for the first indicator, but looking at
the second one and comparing it to the rest of countries, it is not high [38]. So it
can be establish that there are not big problems with corruption in the city.

73
3. HEALTH
a) Mortality: Life expectancy at birth
In 2006 this indicator was 83 years for women and 78.1 for men [27]. Another
indicator used in order to have this information is the “Life expectancy index”. The
maximum value of it it is 1 and 0, the minimum. For Sweden (not available for
Stockholm exclusively), is 0, 925 [38].
Interpretation: life expectancy is high, so the problems related to health and other
kind of risks (natural hazards, etc.) does not seem to be a real problem.
b) Nutritional status: Nutritional status of children
Information not available.
Interpretation: information about “Nutritional Status of children” has not been
determined, and it has been assumed by the World Health Organization (WHO)
that no important nutritional status problems are going to appear since Sweden is a
developed country [40].
c) Health status and risks: Morbidity of major diseases such as HIV/AIDS,
malaria, tuberculosis
The following information is for the whole country:
- HIV prevalence among population aged 15-24 years
People living with HIV, 15-49 years old, percentage: 0.2 (estimated), (14th
August 2007, [37])
AIDS deaths, percentage: 100 (4ht October 2007, [37])
- Malaria: not essential here

74
- Incidence, prevalence and death rates associated with tuberculosis
Tubercolosis incidence per 10000 population:
Tubercolosis prevalence rate per 10000 population: 5 (estimated) (16th
August 2007, [37])
Tubercolosis death rate per 10000 population: 0.6 (20th August 2007, [37])
Interpretation: as predicted in the interpretation of the indicator “Life expectancy
at birth”, health problems are not a big deal for the country.
4. EDUCATION
a) Education level: Gross intake ratio to last grade of primary education
It is the 99.8 (both male and female). The figure is the one produced and
disseminated by the country (including data adjusted by the country to meet
international standards) (27th July 2007, [37]).
Interpretation: high educational level.
b) Literacy: Adult literacy
Information not available.
But information about educational background for population between 25 and 64
years old in Stockholm in 2006 has been found. The percentage of people (458.571
people between the age range mention) with each different background is:
Table 4: Educational background for population 25-64 years old Stockholm 2006 [[[[28]]]]
Primary School Secondary School High School No information
% of people 25-
64 years old
12 35 51 2

75
Interpretation: trying to compare these data with others from other places, it has
been found that for most of the developed or high income countries, data about
adult literacy has not been determined since it is assumed that it is going to be high.
5. DEMOGRAPHICS
a) Population: Population growth rate
Table 5: Changes in Population in Stockholm [[[[27]]]]
YEAR POPULATION
1750 60.018
1800 75.517
1850 93.070
1900 300.624
1930 502.213
1950 744.143
1980 647.214
1990 674.452
2000 750.348
2004 765.044
2005 771.038
2006 782.885
Figure 7: Population Changes Stockholm 1940-2006, prediction 2007-2016 [[[[27]]]]

76
The population growth rate is between 0,7 and 2,7 [28].
Population density: 42 people per ha land [27], the highest in the country.
Interpretation: the population of the city has grown quite fast in the last years,
compared to other regions in the country. Comparing to other cities of Europe, it is
a quite fast growth, but it does not seem to be a problem for the city (just a
consequence of economic growth) [39].
b) Tourism: Ratio of local residents to tourists in major tourist regions and
destinations
The most similar information found is the following:
Table 6: Tourists in hotels in Stockholm [[[[27]]]]
Year/month Tourists
1995 3493,6
2000 4161,6
2005 5001,9
2006 5347,9
January 311,8
February 330,8
March 379,2
April 386,1
May 478,9
June 479,5
July 569,7
August 619,7
September 497,8
October 475,6
November 446,5
December 372,3
It is only for tourism in Stockholm, and the ratio can be calculated like:
Population 2006 [27]/ tourists in hotels 2006= 782.885 / 5347,9= 146,4

77
Interpretation: the “Ratio of local residents to tourists in major tourist regions and
destinations” is high. What means that, the tourism is not an aspect that is going to
carry significant changes in MSW composition. In addition to this, the variation in
the amount of tourists within the year is not really significant, so no big changes in
the MSW amount along the year are expected. Anyway, these data do not show the
total tourism data. And what is more important, changes in MSW composition are
more likely in other kind of tourism, such as rents of houses or apartments in the
coast, etc. This is what occurs in Stockholm’s Archipelago, but it is not included in
Stockholm City Municipality.
6. NATURAL HAZARDS
a) Vulnerability to natural hazards: Percentage of population living in hazard
prone areas
Information not available.
Interpretation: After the information seeking about natural hazards in Stockholm
done, as no information about potential natural hazards in the history has been
found [41], it is going to be considered that the city is not located in a risky region.
However, as a consequence of Climate Change, the city, as other places all over the
word, can suffer its future effects (flooding, temperature changes, etc.). But due to
Stockholm’s location, the one that can be the most dangerous is the increase of the
sea level. This point is something to take into account in a next step, while deciding
where the waste treatment plant is going to be located.
7. ATMOSPHERE
a) Climate change:
a.1.) Carbon dioxide emissions
The indicator below is going to be considered instead, since it includes emissions of
other GHGs.
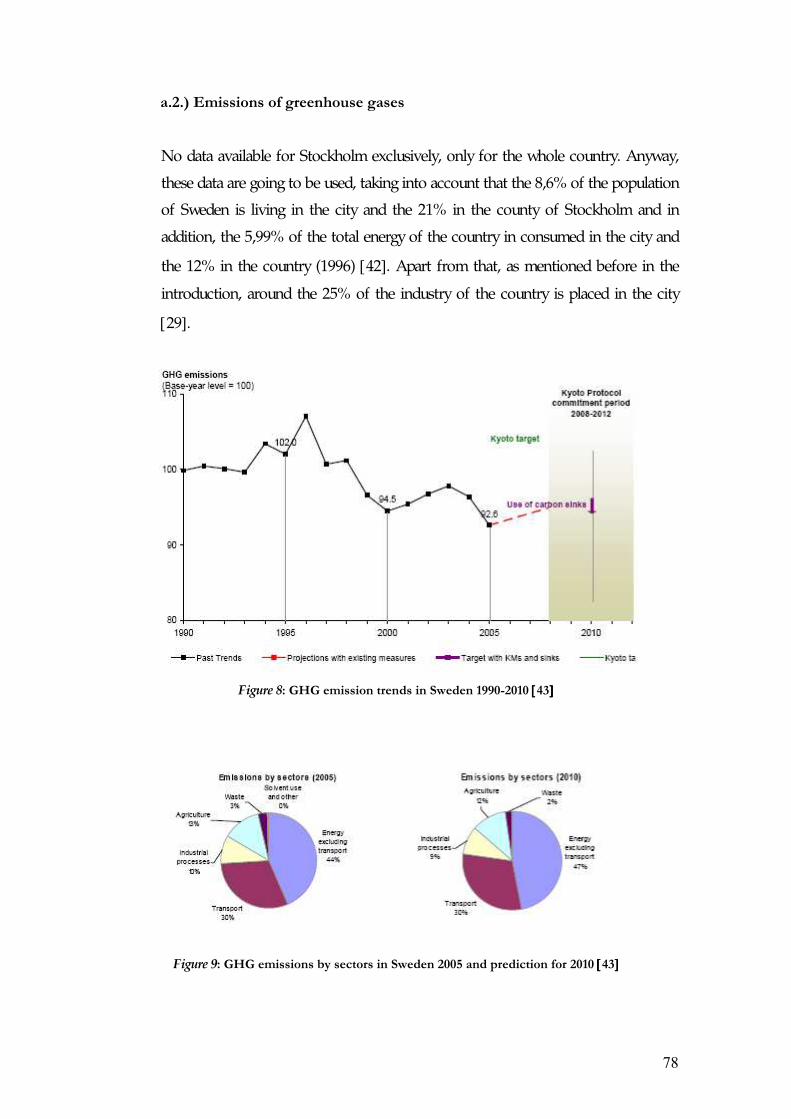
78
a.2.) Emissions of greenhouse gases
No data available for Stockholm exclusively, only for the whole country. Anyway,
these data are going to be used, taking into account that the 8,6% of the population
of Sweden is living in the city and the 21% in the county of Stockholm and in
addition, the 5,99% of the total energy of the country in consumed in the city and
the 12% in the country (1996) [42]. Apart from that, as mentioned before in the
introduction, around the 25% of the industry of the country is placed in the city
[29].
Figure 8: GHG emission trends in Sweden 1990-2010 [[[[43]]]]
Figure 9: GHG emissions by sectors in Sweden 2005 and prediction for 2010 [[[[43]]]]

79
The emissions of CO2 in Sweden are equivalent to around 5.7 tonnes per person
per year [33]. In general, this figure is low in comparison with other developed
countries, but considerably high comparing to many developing countries.
Considering Global carbon dioxide emissions, it has been found that “are
equivalent to around four tonnes per person. (…) Countries such as the United
States, Canada and Australia have emissions of around 20 tonnes per person, while
emissions in developing countries average around 2 tonnes of carbon dioxide per
person” [43].
Interpretation: Sweden has relatively low GHG emissions per capita mainly
because energy is produced largely by hydropower and nuclear power, and as a
consequence of the increasing renewable energy use [43]. But it is also important to
consider that Sweden has less industry than some of the countries mentioned.
In a report about the development of the Swedish Climate Strategy [33], it is
mentioned that the ambitious future targets for Sweden related to GHGs’
emissions will be met. With this purpose a comprehensive strategy has been
developed which contains national instruments and other common to the whole of
the UE. Some of them are energy and carbon dioxide taxes, ban on the landfilling
of combustible and organic waste, electricity certificates, etc.
b) Air quality: Ambient concentration of air pollutants in urban areas
Torkel Knutssonsgatan: is a street with high traffic level in the south of the city (Södermalm)
Figure 10: SO2 concentration levels in Stockholm 1984-2006 [[[[27]]]]

80
Hornsgatan and Sveavägen are two streets of Stockholm (in the south and north respectively) with high traffic
levels. Normvärde: is the emission limit permitted
Figure 11: NOx concentration levels in Stockholm 1992-2006 [[[[27]]]]
In a preliminary analysis of data reported under the EU National Emission Ceilings
Directive (NEC Directive) by Member States at the end of 2007 done by the European
Environment Agency [44], was determined that Sweden is not going to have
problems to meet the legally-binding 2010 emission ceilings of SO2, but in
contrast, measurements need to be taken to reduce the NOx limits.
Figure 12: CO concentration levels in Stockholm 1991-2006 [[[[27]]]]

81
Figure 13: O3 concentration levels in Stockholm 1990-2006 [[[[27]]]]
Figure 14: PM10 concentration levels in Stockholm 1996-2006 [[[[27]]]]
Interpretation: nowadays the main problems with air pollution are the ones with
NOx, O3 and in some places with PM10.

82
8. LAND
a) Land use and status:
a.1.) Land use change
The differences between 2004 and 2008 are shown in the following table (no data
available from previous years):
Table 7: Land use change in Stockholm 2004-2008 [[[[27]]]]
Year Urban
area (ha)
Natur
area and
parks (ha)
Other use
area (ha)
Land area
(ha)
Water
area (ha)
Total area
(ha)
2004 8788 6723 3260 18771 2818 21589
2008 8788 6723 3263 18774 2818 21592
Interpretation: no changes in land use. But data of some more years ago would be
necessary to guarantee this statement and to see a more clear evolution.
a.2.) Land degradation
Information not available.
a.3.) Land availability
See map in Appendix 2.
Interpretation: If a map of the city is observed [45], it is easy to identify the lack of
area to build a landfill. This would require an area consisting of hundreds of land
hectares.
Apart from that, an important point to consider is the land price. Although no
specific figures about land price have been found, the increase of land prices is a
real phenomenon in the city [46].

83
b) Forests: Proportion of total area covered by forests
No available data for the city, only for the county of Stockholm [28]:
Land area of the county of Stockholm: 651.900 ha
Total land covered by forests (2001-2005): 269.00 ha
So, approximately the 41% of the land is covered by forests.
Interpretation: it is a high proportion of land the one covered by forests. This
decreases the problems with GHG emissions but makes difficult the establishment
of a landfill since it is an engineering construction that grows progressively.

84
9. FRESHWATER
a) Water quantity: Proportion of total water resources used
No available data for Stockholm in particular, but for the whole country it has been
estimated that only the 2% of the gross annual water availability was used in 2006
[47].
Figure 15: Water exploitation index. Total water abstraction per year as percentage of long-term
freshwater resources in 1990 and 2002 [[[[48]]]]
Stockholm is almost entirely dependent on Lake Mälaren for the water supply.
Additionally, it is a reserve supply in Lake Bornsjön only sufficient for some months
and ordinarily used for 2 or 3 weeks each summer in order to keep the system
running. The average total outflow from Lake Mälaren since 1968 has been about
4.700 Mm3/year (minimum 1.320 Mm3 in 1976 and maximum 7.830 Mm3 in 2000).
However, the three water extraction systems used have extracted about 200
Mm3/year, which is about the 4% of the available outflow. In summer months, this
figure is higher, the average water outflow is about 590 Mm3/year. What means
that if it is assumed that the same amount of water is extracted every month, the
8% of the available water is used (all the information in this paragraph from [49]).

85
Interpretation: water scarcity is not a problem in the city.
b) Water quality
b.1.) Presence of faecal coliforms in freshwater
Information not available. The information found is in general about water quality:
Otjänligt means unsuitable, anmärkning criticism, complaint, observation and tjänligt sustainable. All of them
referred to bathing suitability.
Figure 16: Water Pollution in Lake Mälaren 1970-2007 [[[[27]]]]
Figure 17: Water pollution by phosphorus and water transparency 1969-2007 [[[[27]]]]

86
Interpretation: the aim of the original indicator is to give a clue about water quality,
but as mentioned in the justification of why it has been chosen, other
complementary information is necessary to know exactly the quality of the water.
This two figures have been chosen for it because they give a general idea of water
quality and suggest at the same time which can be the main problem. The first
figure (Figure 17) shows how the main proportion of water has a suitable quality for
bathing and the second (Figure 18) how the transparency of the water is becoming
higher. This means less particles (mainly algae) are blooming in the water
progressively.
b.2.) Wastewater treatment
The information found is not exactly the one described by this indicator.
Table 8: Water consumption etc. (106 m3) in The City of Stockholm [[[[27]]]]
2002 2003 2004 2005 2006
Drinking
Water
treatment-
Production
133,1 131,3 129,3 129,6 132,6
Drinking
Water
treatment-
Distribution
133,1 131,3 129,3 129,6 132,6
Consumption 105,4 104,5 102,7 102,6 104,5
Wastewater
treatment
151,6 134,7 145,1 143,6 147,7
Interpretation: It can be seen how the 100% of wastewater is treated. However, it
is not specified the quality of this treatment, and it would be useful to have
information about it.

87
10. BIODIVERSITY
a) Ecosystem: Proportion of terrestrial area protected, total and by ecological
region
No data available for the city in particular, only for the whole county.
Table 9: Nature reserves, nature management areas and wildlife protection areas 2005 [[[[28]]]]
Natural Reserves Nature management areas Wildlife protection areas
Number Area (ha) Number Area (ha) Number Area (ha)
Total Of
which
land
area, %
Total Of
which
land
area, %
Total Of
which
land
area, %
204 85.228 32 15 13.923 58 31 1.805 28
The same sources says that no substantial changes have occurred since 1998.
Interpretation: these numbers are not in particular for Stockholm. Anyway, they
show how in total 100.956 ha are protected from the 531.793,6 ha total area of
Sweden, that is around the 19%. It does not give enough information about
Stockholm’s situation in this field.
b) Species: Change in threat status of species
Information not found.

88
11. ECONOMIC DEVELOPMENT
a) Macroeconomic performance
a.1.) Gross domestic product (GDP) per capita
In order to have a comparative data, the GDP per capita (PPP US$) indicator is
going to be used. This is one of the different ways to express GDP, and PPP means
Purchasing Power Parities. For Sweden in general, this value was in 2005, 32,525.
And the same year for some other countries was: USA 41,890, Spain 27,169,
Poland 13,847 and Ecuador 4,341 [38].
Interpretation: Sweden has a high GDP per capita comparatively with other
countries. What means that the country does not have important economic
problems, and in conclusion no significant development problems.
The following picture shows another indicator for GDP, the Regional GDP per
capita in UE member states.
Figure 18: Regional Gross Domestic Product per capita in UE member states [[[[39]]]]
It can be seen how Stockholm’s region has the highest level of GDP.

89
a.2.) Investment share in GDP
The investment share in GPD of Sweden in 2006 was the 19%.
Interpretation: it has not been found this information for other countries, so it is
difficult to make a good interpretation of this figure.
b) Suitable public finance: Debt to GNI ratio
Information not found.
c) Information and communication technologies: Internet users per 100 population
In general for Sweden, the use of computers and internet is the following:
Table 10: Proportion of population using computers and internet in Sweden [[[[28]]]]
Use of 1998 2005
Computers 53 80
Internet 31 72
Interpretation: the use of new technologies has increased a lot in the last years,
reaching high levels nowadays.

90
d) Research and development: Gross domestic expenditure on R&D as a
percentage of GDP
Data available for Sweden in general.
Table 11: Total R&D expenditure as percent of GDP of Sweden [[[[28]]]]
Year Total R&D expenditure as percent of GDP
1995 3,32
1997 3,51
1999 3,62
2001 4,25
2003 3,95
2005 3,88
Some figures from other countries (average for 2000-2005):
Table 12: R&D expenditure as percent of GDP 2000-2005 [[[[38]]]]
Norway 1,74
USA 2,68
China 1,44
South Africa 0,68
Israel 4,46
Interpretation: Sweden is the second country in the world that invests more in
R&D. Actually the region of Stockholm received in 2000 and 2002 awards from the
European Commission for the Excellence for Innovative Region, due to the high investment
in R&D [29].
According to the classification made by The World Bank for the 185 countries
members of it, Sweden has a high income [50]. Moreover, in a ranking made by the
same organization for 146 of the countries, it is established that Sweden has the
highest 9th GDP per capita (US$) [50]. In conclusion, even if no data is available
for some indicators, or for others no information has found in order to make a
clear interpretation, it can be assumed that no economy problems exit in the
country, and in consequence, in The City of Stockholm.

91
12. CONSUMPTION AND PRODUCTION PATTERNS
a) Material consumption: Domestic material consumption
Information not found.
b) Energy use: Share of renewable energy sources in total energy use
Data available for the whole country.
Figure 19: Share of Total Energy Supply in Sweden in 2005 [[[[51]]]]
Figure 21. a Figure 21. b
Figure 20. a: Fuel Share of Total Primary Energy Supply in 2005 for the World [[[[52]]]]
Figure 20. b Fuel Share of Total Primary Energy Supply in 2005 for the OECD countries [[[[52]]]]

92
More specifically for Stockholm and according to the necessity of data about
energy production from incineration of waste: the average energy production with
incineration of MSW is 2 TWh for district heating (the 14% of the total district
heating) and 500 GWh of electricity [34]. The average calorific value of the waste is
2,7 MWh/tonne.
Interpretation: as it can be seen from the figures above, Sweden is over both the
world and OECD countries1 average in energy supply from renewable sources.
That is why the energy production in the incineration can be considered as high.
c) Waste generation and management
c.1.) Generation of waste
(answered later)
c.2.) Waste treatment and disposal
Table 13: Proportion of MSW treatment in Stockholm (%) [[[[27]]]]
1995 2000 2004 2005 2006
Incineration 90 100 98 99 99
Landfill 10 0 1 0 0
Other 0 0 1 1 1
The household waste is sent to Högdalen incineration plant and the energy produced
there is used for district heating and electricity production. This plant, which started
working in 1969, has four boiler fed by MSW and an additional one with biofuels
from various sources.
1OECD countries: Australia, Finland, Ireland, Netherlands, Spain, Austria, France, Italy, New Zealand, Sweden,
Belgium, Germany, Japan, Norway, Switzerland, Canada, Greece, Korea, Poland, Turkey, Czech Republic,
Hungary, Luxembourg, Portugal, United Kingdom, Denmark, Iceland, Mexico, Slovak Republic, United
States [51].

93
Interpretation: almost all the waste in Stockholm is incinerated and the energy
recovered for practical uses. In this way the volume and amount of waste in
landfills is reduced considerably.
13. WASTE�S CHARACTERISTICS
a) Composition, with seasonal variations and b) Amount and type of recycled
waste
According to a study of household waste composition in Stockholm developed by
the Traffic Administration, Department for Waste Management, the composition
of the MSW in Stockholm between 1993 and 2003 was the following:
Table 14: Composition of MSW in Stockholm 1993-2003 [[[[53]]]]
Nov-93 (%) Oct-98 (%) Nov-03 (%)
Packaging glass 5,0 4,8 4,7
Other glass 0,0 0,3 0,3
Packaging cardboard 8,9 8,3 8,2
Newspaper/magazines paper 9,8 5,7 7,9
Other paper 3,4 7,5 8,3
Packaging hard plastic (high density) 2,4 2,3 2,5
Other plastic 5,7 7,0 5,9
Packaging metal 2,4 2,3 1,6
Other metal 0,2 0,5 0,6
Textiles 1,6 2,3 3,3
Napkins 7,8 8,3 9,6
Electronic Waste 0,6 0,7 0,5
Batteries 0,1 0,1 0,1
Hazardous waste 0,1 0,2 0,2
Inert waste 4,5 2,8 1,6
Organic waste 42,7 41,1 40,2
Garden and forestry waste 3,0 3,2 2,6
Drugs 0,0 0,2 0,2
Others 1,8 2,4 1,7
No available data about seasonal variations on waste composition.

94
Table 15: Waste Collected excluding recycling in Stockholm 1995-2006 [[[[27]]]]
Waste collected (t) Waste per person (kg)
Year 1995 2000 2005 2006 1995 2000 2005 2006
Amount 229.436 212.999 232.141 235.253 322,6 238,9 301,1 300,5
The amounts and fractions of waste that are recycled are presented in Table 16.
Table 16: Composition and amount of recycling in Stockholm 1995-2006 [[[[27]]]]
Waste collected (t) Waste per person (kg)
Year 1995 2000 2005 2006 1995 2000 2005 2006
Total
recycling
amount
- 75.377 71.066 70.986 - 100,5 92,2 90,7
Small
Batteries
13 9 10 9 0,0 0,0 0,0 0,0
Car Batteries 108 134 198 284 0,2 0,2 0,3 0,4
Refrigerators
and freezers
- 1174 - - - 1,5 - -
Newspaper 42.349 61.039 55.848 55.311 59,6 81,3 72,4 70,7
Glass 8.590 12.307 13.333 13.998 12,1 16,4 17,3 17,9
Hard plastic - 441 925 728 - 0,6 1,2 0,9
Other
hazardous
waste
186 300 752 656 0,3 0,4 1 0,8
So, around the 23% of the total MSW is recycled.
Interpretation: even if changes in MSW amount and composition can be observed,
none of them are significant enough to influence the decision looked for in this
Case Study.
From a report on Environmental Data of the OECD [54], it can be deduced that the
amount of waste produced in Sweden (in general) is lower than the average of
Europe and USA, but higher than in most of the developing countries. From the
same report some differences within countries are figured out. For example, the
proportion of carton and paper in Sweden is high and the plastic and metal

95
percentages are quite low, compared to other countries of the OECD. This is
tightly related to consumption habits, so important differences with developing
countries can be expected.
The recycled amount is high and the detailed statistics about the recycled materials
can show the good practices in the field.
14. LEGISLATION FRAMEWORK
a) The existence of laws in Waste Management and their quality
Stockholm, as the capital of Sweden, has to follow the standards established by the
Environment Department of the European Commission. In those, the control and
management of environmental aspect as waste treatment and management are
relegated to national and municipal governments. However, from the European
Commission some instructions, in some cases Directives (e.g. Directive
2000/76/EC of the European Parliament and of the Council of 4 December 2000
on the incineration of waste), have been established in order to have an
standardized and common framework for all the members [55].
In Sweden the Waste Management is regulated by national and municipal
authorities. “At national level, the most important regulations are the
Environmental Code, the Waste Act and the ordinances on producer responsibility.
These are complemented by several other ordinances and laws, which regulate
specific types of waste, transport, waste treatment, and other relevant areas. At a
municipal level, local waste management is regulated by the local bylaws on waste
collection and disposal for Stockholm municipality, and waste collection fees” [33].
The Stockholm City Council passes a waste collection fee to owners of each
building in order to gather money to finance the Waste Management in the city.
With this fee people have access to all the processes mentioned previously about
waste disposal and gathering. As Nils Lundkvist, from the Traffic Administration-
Department for Waste Management, explained the fee includes also incineration
tax and deposit tax (the whole process). The taxes are based on the amount of
waste sent to the incinerator plant and to the amount of slag and ashes sent to

96
landfill after incineration. The incineration tax varies according to the electricity
production. If the electricity production is higher than the 15% of the total energy-
production (heat and electricity), the tax is as low as possible, around 80 sek per
tonne sent to the incinerator. In contrast, if the there is no electricity production
the tax is the maximum, around 450 sek per tonne. The tax value is calculated
linearly with this limits daily, and is declared to the National Financial
Administration monthly.
Related to this, the Swedish Government has decided that the producers of
packaging or packaged goods (or companies that import, fill or sell them) have the
responsibility for the existence of a collection system where customers can dispose
of packaging for recycling. The same applies to newspapers and waste paper. With
this purpose packaging and newspapers producers have created five material
companies which cooperate under the name “The Packaging and Newspaper
Collection Service” (FTIAB); all operations are managed on a non-profit basis [33].
Interpretation: a well defined hierarchy exists to organize the Waste Management at
the national and municipal level. Clearly established regulations have been designed
to guarantee the suitable treatment and management of the MSW: necessary
separations, collection practices, producer’s responsibility politics, etc. So, it can be
stated that the legislation framework in Stockholm is the appropriate one to
guarantee a satisfactory MSW treatment and management.
b) The fulfilment of them
Information not found.
15. CLIMATIC CONDITIONS AND HYDROLOGY
a) Precipitation Rate
b) Usual temperatures and changes

97
Figure 21: World Map of Köppen-Geiger Climate [[[[56]]]]
Table 17: Temperatures and precipitation in Stockholm [[[[57]]]]
Precipitation (mm) Temperature (ºC)
2006 1961/90 2006 1961/90
January 10 39 -2,3 -2,8
February 28 27 -2,7 -3,0
March 28 26 -2,9 0,1
April 28 30 5,4 4,6
May 46 30 11,4 10,7
June 32 45 17,0 15,6
July 33 72 20,8 17,2
August 146 66 19,2 16,2
September 23 55 15,6 11,9
October 98 50 9,8 7,5
November 43 53 4,9 2,6
December 34 46 4,9 -1,0
Year 549 539 8,5 6,6
Interpretation: the climate in Stockholm is temperate with warm summers and wet
according to the figure (Figure 21) and data (Table 17) above.

98
16. GEOGRAPHICAL CONDITIONS
a) Geographical overall description
Although no really detailed information is required in this point of the decision
making process, it could be useful to consider that The City of Stockholm is built
on 14 islands, communicated by bridges. In general the city is plain, there are not
big mountains in the surroundings.
b) Topographical map
c) Roads and possible routes for waste transportation
These last two points are too specific in this step. They are going to be useful in a
later step, after the decision about which of both techniques is more sustainable has
been taken.
17. OTHERS
a) Odour
b) Noise
Information not available.
Interpretation: it is completely difficult to attain this information. Both are going to
be consequences of the totally necessary waste treatment processes. If their design
is developed in a sustainable way, all the necessary means will be used to try avoid
both noise and odour problems.

99
5.6. SUMMARY OF THE INDICATORS FOR STOCKHOLM AND
INTERPRETATION FOR LANDFILL AND INCINERATION
The following Table 18 tries to summarize the most important information obtained for
each indicator. Moreover, on it, the clues to determine which of both techniques is more
sustainable in this case have been included. The system used for it is the following: which
of the two techniques is more favoured according to each point’s information is presented
by using a “�” and when the indicator shows that both techniques are suitable in the same
extent, a “=” is used. When information to determine which of both techniques is more
favoured has not been found, a “0” can be read.

100
Tab
le 1
8: S
um
mary
tab
le o
f S
tock
ho
lm�s
Case
Stu
dy
Ind
icato
r
Th
eme
Ind
icato
r
Su
b-t
hem
e
Ind
icato
r IN
FO
RM
AT
ION
FO
R
ST
OC
KH
OL
M
Lan
dfi
ll
Inci
ner
ati
on
Po
vert
y
Inco
me
pove
rty
Pro
port
ion
of
popu
lati
on
livi
ng
belo
w n
atio
nal
pov
erty
lin
e
Info
rmat
ion
not
fou
nd. F
rom
info
rmat
ion
of o
ther
indi
cato
rs: 1
4,8%
of
the
popu
lati
on
earn
ed le
ss t
han
the
PB
A (
2006
)
=
=
Inco
me
ineq
ualit
y
Rat
io o
f sh
are
in
nat
ion
al
inco
me
of h
igh
est
to l
owes
t
qu
inti
le
9,1%
. Inc
om
e eq
ualit
y =
=
Dri
nkin
g w
ater
P
ropo
rtio
n o
f po
pula
tion
usi
ng
an i
mpr
oved
wat
er
sou
rce
100%
. =
=
Liv
ing
cond
itio
ns
Pro
port
ion
of
urb
an
popu
lati
on l
ivin
g in
slu
ms
Info
rmat
ion
not
fou
nd. F
rom
info
rmat
ion
of o
ther
indi
cato
rs: n
o bi
g di
ffer
ence
s in
livin
g co
ndit
ions
=
=
Go
vern
an
ce
Cor
rupt
ion
P
erce
nta
ge o
f po
pula
tion
hav
ing
paid
bri
bes
Info
rmat
ion
not
fou
nd. F
rom
info
rmat
ion
of o
ther
indi
cato
rs: n
o bi
g co
rrup
tio
n
prob
lem
s
=
=
Hea
lth
M
orta
lity
Lif
e ex
pect
ancy
at
birt
h
83 f
or w
omen
, 78,
1 fo
r m
en. H
igh
life
expe
ctan
cy
=
=
Nut
riti
ona
l
stat
us
Nu
trit
ion
al s
tatu
s of
ch
ild
ren
Info
rmat
ion
not
fou
nd
0 0
Hea
lth
stat
us
Mor
bid
ity
of m
ajor
dis
ease
s G
ood
heal
th s
tatu
s, a
nd li
ttle
ris
ks
=
=

101
and
risk
s su
ch a
s H
IV/
AID
S, m
alar
ia,
tube
rcu
losi
s
Ed
uca
tio
n
Edu
cati
on le
vel
Gro
ss i
nta
ke
rati
o to
las
t
grad
e of
pri
mar
y ed
uca
tion
99,8
. Hig
h ed
ucat
iona
l lev
el
=
=
Lit
erac
y A
du
lt l
iter
acy
rate
H
igh
=
=
Dem
og
rap
hic
s P
opul
atio
n
Pop
ula
tion
gro
wth
rat
e 0,
7-2,
7. F
ast,
but
not
a b
ig p
rob
lem
for
the
city
=
=
Tou
rism
R
atio
of
loca
l re
sid
ents
to
tou
rist
s in
maj
or t
ouri
st
regi
ons
and
des
tin
atio
ns
Hig
her
than
146
=
=
Natu
ral
haza
rds
Vul
nera
bilit
y to
natu
ral h
azar
ds
Per
cen
tage
of
popu
lati
on
livi
ng
in h
azar
d p
ron
e ar
eas
Info
rmat
ion
not
fou
nd. F
rom
info
rmat
ion
of o
ther
indi
cato
rs: p
ossi
ble
futu
re p
robl
ems
wit
h se
a le
vel i
ncre
ase
=
=
Atm
osp
her
e
Clim
ate
chan
ge
Car
bon
dio
xid
e em
issi
ons
Is g
oin
g to
be
used
the
nex
t in
dic
ator
inst
ead
0 0
Em
issi
ons
of g
reen
hou
se
gase
s
The
y do
not
mea
n a
prob
lem
for
the
cit
y
�
(em
its
but
prod
uces
ener
gy)
Air
qua
lity
Am
bien
t co
nce
ntr
ati
on o
f ai
r
poll
uta
nts
in
urb
an a
reas
Pos
sibl
e pr
obl
ems
wit
h N
Ox,
O3
and
PM
10
�
Lan
d
Lan
d us
e an
d
stat
us
Lan
d u
se c
han
ge
No
sign
ific
ant
chan
ges
�
Lan
d d
egra
dat
ion
In
form
atio
n n
ot f
ound
0
0

102
Lan
d a
vail
abil
ity
L
ow
�
For
ests
P
ropo
rtio
n o
f la
nd
are
a
cove
red
by
fore
sts
41%
. Hig
h pr
opor
tio
n
�
Fre
shw
ate
r W
ater
qua
ntit
y P
ropo
rtio
n o
f to
tal
wat
er
reso
urc
es u
sed
8% f
or t
he c
ity,
2%
for
the
cou
ntry
. No
wat
er s
carc
ity
�
Wat
er q
ualit
y P
rese
nce
of
faec
al c
olif
orm
s in
fres
hw
ater
Info
rmat
ion
not
fou
nd. F
rom
info
rmat
ion
of o
ther
indi
cato
rs: n
o w
ater
qua
lity
prob
lem
s
�
Was
tew
ater
tre
atm
ent
Info
rmat
ion
not
fou
nd. F
rom
info
rmat
ion
of o
ther
indi
cato
rs: 1
00%
of
the
was
tew
ater
is t
reat
ed
=
=
Bio
div
ersi
ty
Eco
syst
em
Pro
port
ion
of
terr
estr
ial
area
prot
ecte
d, t
otal
an
d b
y
ecol
ogic
al r
egio
n
Info
rmat
ion
not
fou
nd
0 0
Spec
ies
Ch
ange
in
th
rea
t st
atu
s of
spec
ies
Info
rmat
ion
not
fou
nd
0 0
Eco
no
mic
dev
elo
pm
ent
Mac
roec
ono
mic
perf
orm
ance
Gro
ss d
omes
tic
prod
uct
(GD
P)
per
capi
ta
GD
P p
er c
apit
a (P
PP
US$
) fo
r Sw
eden
:
32,5
25. H
igh
GD
P p
er c
apit
a
�
In
vest
men
t sh
are
in G
DP
19
%. I
nfor
mat
ion
not
foun
d fo
r a
good
inte
rpre
tati
on
�
Sust
aina
ble
Deb
t to
GN
I ra
tio
Info
rmat
ion
not
fou
nd
0 0

103
publ
ic f
inan
ce
Info
rmat
ion
and
com
mun
icat
ion
tech
nolo
gies
Inte
rnet
use
rs p
er 1
00
popu
lati
on
For
Sw
eden
: 72.
Hig
h
�
Res
earc
h an
d
deve
lopm
ent
Gro
ss d
omes
tic
expe
nd
itu
re
on R
&D
as
a pe
rcen
t of
GD
P
3,88
. Rea
lly h
igh
�
Co
nsu
mp
tio
n a
nd
pro
du
ctio
n
patt
ern
s
Mat
eria
l
cons
umpt
ion
Dom
esti
c m
ater
ial
con
sum
pti
on
Info
rmat
ion
not
fou
nd
0 0
Ene
rgy
use
Shar
e of
ren
ewab
le e
ner
gy
sou
rces
in
tot
al e
ner
gy u
se
Aro
und
18%
for
Sw
eden
. Hig
h p
erce
ntag
e
14%
of
dist
rict
hea
ting
of
the
city
fro
m
inci
nera
tio
n
�
Was
te
gene
rati
on a
nd
man
agem
ent
Gen
erat
ion
of
was
te
235.
253
t in
200
6, 3
00,5
kg
per
pers
on. H
igh
�
Was
te t
rea
tmen
t an
d d
ispo
sal
99%
inci
nera
tion
��
Wast
e�s
Ch
ara
cter
isti
cs
Com
posi
tion
(w
ith
sea
son
al v
aria
tion
s)
Fol
low
s th
e tr
ends
of
high
inco
me
plac
es.
Info
rmat
ion
not
fou
nd a
bout
sea
sona
l
chan
ges
�
Am
oun
t an
d t
ype
of r
ecyc
led
was
te
23
% o
f th
e M
SW. H
igh
amou
nt
=
=
Leg
isla
tio
n
fram
ewo
rk
Ex
iste
nce
of
law
s in
Was
te M
anag
emen
t (W
M)
and
th
eir
qu
alit
y
Suit
able
Was
te M
anag
emen
t
�
Dat
a of
bri
bes
paid
in
th
e fi
eld
In
form
atio
n n
ot f
ound
0 0
Cli
mati
c P
reci
pita
tion
Rat
e H
igh
�

104
con
dit
ion
s an
d
hyd
rolo
gy
Usu
al t
empe
ratu
res
and
ch
ange
s T
empe
rate
, wit
h w
arm
sum
mer
s
�
Geo
gra
ph
ical
con
dit
ion
s
Geo
grap
hic
al o
vera
ll d
escr
ipti
on
P
lain
and
hig
h pe
rcen
tage
of
wat
er, b
ut n
ot
nece
ssar
y in
thi
s po
int
0 0
Top
ogra
phic
al m
ap
Not
nec
essa
ry in
thi
s po
int
of t
he s
tudy
0 0
Roa
ds
and
pos
sibl
e ro
ute
s fo
r w
aste
tr
ansp
orta
tion
Not
nec
essa
ry in
thi
s po
int
of t
he s
tudy
0
0
Oth
ers
Com
plai
nts
rel
ated
to
odou
r pr
oble
ms
In
form
atio
n n
ot a
vaila
ble.
Not
nec
essa
ry in
this
poi
nt o
f th
e st
udy
0 0
C
ompl
ain
ts r
elat
ed t
o n
oise
pro
blem
s In
form
atio
n n
ot a
vaila
ble.
Not
nec
essa
ry in
this
poi
nt o
f th
e st
udy
0 0

105
5.7.- DISCUSSION OF THE CASE STUDY
Considering all the poverty indicators together, it can be determined that in Stockholm
there are not important poverty problems and established also that no substantial
differences exit between inhabitants. All this is an indicator of the consumption habits of
people in the city and also of similarities on MSW composition and amount within the city.
Together with the information given by these indicators, if the system of pension prevision
is analyzed, a broad and experienced structure is observed [46], which tries to cover all the
poverty problems.
The lack of corruption can reveal that problems, such as MSW theft in landfills are not
going to be really likely. In addition to this, in can be presumed that problems with
environmental corruption are not going to be usual neither. So, as with poverty indicators,
any of the techniques considered can be chosen.
All the indicators related to health expose that in general the health status of the country is
high, and risks are not elevated.
Even if more information would be necessary, by and large the educational level of the
country is eminent, what indicates that well prepared people to design and sustain the waste
treatment plant are going to be in the city or country. This makes it more sustainable.
Additionally, the high educational level suggests that the environmental awareness of the
citizens can be notable. But at the same time “NIMBY” (Not In My Back Yard) problems
are going to be more likely. This can be a critical point because many problems exist
nowadays, specially in developed countries, while deciding to build or not incineration
plants or landfill next to urban areas.
The little information gathered about demographics establish that no critical population
changes occur neither due to births, deaths and/or migrations, nor because of tourism. So
valuable changes are not expected because of that, in MWS composition and amount.
With the information given by all the indicators discussed above, both landfill and
incineration would be sustainable in Stockholm.

106
Even if some compounds’ air concentration levels are nearly exceeded, managing the waste
treatment plant in a proper way, the air pollution issues does not seem to be a decisive
aspect to reject one WTT or to choose in between them. However, this does not mean that
this aspect is not important. High O3, PM10 and NOx concentrations are a negative point
for choosing incineration. On the contrary, although CO2 is emitted in incineration, energy
is produced, and the use of other non-renewable energy sources is reduced. With landfills
also biogas is produced, but the amount of energy obtained per waste unit is lower and
methane leakage can take place.
Unfortunately, it has not been possible to get any information about land degradation. This
would have been completely useful to decide about the sustainability of landfills in
Stockholm. Nevertheless it has been identified the lack of land availability in the city, which
is a critic point that can condition completely the decision, and make incineration the best
option. The lack of big changes on land use can related to this point too, that is, there is
not enough available land where make considerable changes. Apart from that, the high
percentage of land covered by forests is a positive point related to possible Climate Change
problems as well as being an indicator of lack of land availability. Another decisive point is
the land price. Although no figures have been found, the increasing trend recognized,
makes weaker the choice of landfills. All in all, the building of a landfill in Stockholm
would be a hard point.
The high water availability in the city makes possible the use of any technique that requires
water, even more considering that the wastewater treatment is guaranteed. So, incineration,
which needs water for combustion gas’ cleaning, would be suitable considering water
quality and quantity. Furthermore, the possible problems with water quality that are likely
to appear in landfills as a consequence of leaks, can be another reason with which reject
landfill for this specific case.
Although some data are not available, with the information handled, as mention in the
point of Economic Development, Sweden is considered a high income country, and
indicators like “GDP per capita”, “Internet users” or “Gross domestic expenditure on
R&D as a percentage of GDP” corroborate it. A high income is the basic starting point for
the development of the rest aspects. But the appropriate management of the economic

107
resources is required to assure it. The trends in the last years and the development of social,
environmental and economic politics show that this is working properly.
Related to consumption and production patterns, even if more information would be
required, Stockholm follows the trends of a developed city, but if comparisons are made
with other European cities, Stockholm does not show the highest consumption levels. This
can be a consequence of traditional habits or of high environmental awareness.
These last two points show how the city can afford the investment of incineration (higher
than of landfill). In addition, the last recommendations from experts and recent and future
policies establish that the use of landfills must be reduced as much as possible (landfill
ban), using them only for waste that any other alternative more sustainable has not been
found for and also landfills’ requirements are getting harder. In this way all the adverse
health and environmental consequences of landfill pretend to be avoided as well as the
reduction of climate change effects. Apart from that, as mentioned before, more energy is
produced combusting waste than with the digestion process in landfills.
Concerning waste composition and energy production, it can be established that the
percentage of combustible waste is high, and the energy produced by Stockholm’s
incinerator covers an important part of the total energy production. This is anther point in
favour of incineration. Additionally, the high amount of waste produced, make more
suitable incineration due to the possibility it gives to reduce the volume of waste.
As mentioned before, a well defined hierarchy exists to organize the waste management at
the national and municipal level and the legislation framework in Stockholm is the
appropriate one to guarantee a satisfactory MSW treatment and management. What means
that whichever they are the decisions taken in this field, they are going to be studied and
well found decisions.
The high amount of precipitation, that would produce a high amount of leachate is another
indicator that makes more sustainable incineration too. Additionally, variations in
temperature enlarge the necessity of finding sustainable energy sources so that the high

108
energy demand of heating during cold periods is covered polluting as less as possible. This
last point benefits also the choice of incineration.
5.8.- CONCLUSION OF THE CASE STUDY
Once all the points have been studied and considered, it can be concluded that incineration
is a more sustainable solution for MSW treatment than landfill for The City of Stockholm.
It is a clear result: only one of the points considered (Ambient concentration of air
pollutants in urban areas) points out landfill as a better choice. All the remaining key points
such as lack of poverty, high educational level, strong economy, high development, high
water availability, Climate Change policies and lack of land availability, show how the
incineration of MSW in Stockholm is the right treatment. Even if some indicator’s
information is missing, the result is so clear that it does not seem to be likely to be changed
anyway.
The result of the Case Study has been the one expected. On the one hand, the current
situation (almost the 100% of the MSW is incinerated) and on the other hand, the new
recommendations by experts and policies of reducing landfills use and trying to produce
energy whenever is possible, were the main reasons that suggested this result in advance.
This fact can be used to discuss about the validation of the choice made on SIs for the
determination of the sustainability of WTTs in specific situations. This point is included in
the general discussion of the report (next Section 6).

109
6.- DISCUSSION
The major aim of the Case Study is to validate the SIs selected. However, it is necessary to
consider that as for each specific case, some indicators are applicable and others no, only
the general usefulness of them is going to be proved, and not of the whole list.
Nevertheless, in this particular case almost the whole list of indicators has been used, and
that is why it can be assumed without taking much risks that the validation process is going
to be convincing.
The result of the Case Study of The City of Stockholm has been really clear and as
mentioned in its discussion, it has fit in with the expected one. The first and more clear
interpretation is that the SIs selected have worked properly: they have given a result that
apart of being the expected one, it represents the current situation of the city.
However, there are some points that must be analyzed. For some of the indicators selected
information has not been found (in some cases is simply not available), and for others
some alternative indicators have been used that show the same idea.
The indicators of whom any kind of information has been found are: “Land degradation”,
“Change in threat status of species”, “Debt to GNI ratio” and “Domestic Material
Consumption”. This can suggest that maybe this indicators should be removed from the
list and try to find alternative ones not to lose the information they should have given.
Nevertheless, the lack of information of these indicators does not mean that this
information is not available at all. It is possible that it has not been found due to the limited
time of the project.
For other indicators, although the information found has not been exactly the one
described by them, other similar or intuitive data have been collected. These indicators
have been: “Proportion of population living bellow national poverty line”, “Ratio of share
in national income of highest to lowest quintile”, “Proportion of urban population living in
slums”, “Percentage of population having paid bribes”, “Adult literacy”, “Ratio of local
residents to tourists in major tourist regions and districts”, “Percentage of population living
in hazard prone areas”, “Presence of faecal coliforms in freshwater”, “Wastewater

110
treatment”, “Energy obtained by incineration”. Additionally, for some other indicators the
data collected have been for the whole country, not specifically for the city. The number of
this kind of indicators has been considerably high considering that in Sweden and
Stockholm the amount and quality of statistics is important. This point suggest that some
changes could be done in the definitions of some of these SIs. Even so it is important to
think that if the same list is used in other context it is quite likely to find difficulties to
gather information about other indicators, specially if it is a developing country. So, this
point suggests that even if the Case Study developed gives some clues about the indicators
validation, more studies in other different situations would be necessary for a more
complete and objective judgement. Additionally, the indicators have been used for landfill
and incineration only, what means that they must be used also for composting and
anaerobic digestion
After finishing with the Case Study, it can not be stated neither that it has been identified the
necessity of removing any of the indicators selected nor to add others. All the indicators
used have given enough and useful information. One can wonder whether some indicators
like the ones of poverty are necessary or not for Stockholm, since it is well-know the high
income and development level of the city. However, in order to avoid unexpected results
and do not miss important information, it is strongly recommended not to take any
information as previously known.
Nevertheless a point that is missing is the consideration of stakeholders’ opinion since this
is a part of a decision making process. It is important to know citizens’ opinion about
current Waste Management system, as well as, their awareness (do they know what is
dangerous? what is happening? etc.). The problem is that this has an important subjective
charge and the way to make it as objective as possible is not really clear yet, as a
consequence of the lots of interests involved.

111
7.- CONCLUSION
All in all, it can be concluded that the objective of the report has been met: a useful list of
indicators has been designed to use while deciding about the sustainability of WTTs in a
specific situation, although some limitations have been recognized and further research is
required.
In addition, the indicators in this list follow the Bellagio Principles presented in Section 2.4. and
the process and steps to find them has been the one declared in Section 2.7. So not only the
purpose has been reached, but also methodology has been the appropriate one.
As a consequence of the necessity of an suitable Waste Management Planning and of the
integration of SD philosophy in all the fields, this list of indicators pretends to be the
starting point for coupling both concepts. The interesting aspect now is to continue
working in the field, improving the result obtained in this report and going even further. It
would be interesting is to use these indicators or more specifically designed ones for other
steps or parts of the broad WMP process: deciding the location of the plants, the transport
routes, collection methods, etc. And also in projects where more specific targets have
previously been established.
Finally, the ideal point would be to work until the use of these indicators reaches political
decisions’ levels, as well as to extend the use of SIs to other crucial fields. And this is
actually the intention declared by Stockholm’s Waste Management Department as it can be
read in the letter received from them (page 123).

112
8.- REFERENCES
[1] European Conference on Waste Management Planning,
http://ec.europa.eu/environment/waste/plans/index.htm (3 June 2008)
[2] Mitchel, G., (1996) Problems and Fundamentals of Sustainable Development Indicators.
Sustainable Development, vol.4, 1-11. The Environmental Centre, University of Leeds,
Leeds, UK
[3] Chevalier, S., Choiniere, R., Bernier, L., et al. (1992) User Guide to 40 Community Health
Indicators. Community Health Division, Health and Welfare Canada, Ottawa
[4] OECD (1993) Organization for Economic Cooperation and Development Core Set of Indicators for
Environmental Performance Reviews. A Synthesis Report by Group on the State of the Environment.
OECD, Paris.
[5] McQueen, D., & Noak, H. (1988) Health Promotion Indicators: Current status, issues and
problems. Health Promotion 3, 117-125
[6] Tunstall, D. (1992) Developing Environmental Indicators: Definitions, framework and issues.
Background Materials for the World Resources Institute. Workshop on Global
Environmental Indicators, Washington, D.C.. World Resources Institute, Washington,
D.C.
[7] Adriaanse, A. (1993) Environmental Policy Performance Indicators. SDV Publishers, The
Hague
[8] Hammond, A., Adriaanse, A., Rodenburg, E., Bryant, D., and Woodward, R. (1995)
Environmental Indicators: A systematic approach to measuring and reporting on environmental policy
performance in the context of sustainable development, World Resources Institute, Washington,
D.C.

113
[9] Bakkes, J.A., van den Born, G.J., Helder, J.C. Swart, R.J., Hope, C.W., and Parker,
J.D.E. (1994) An overview of Environmental Indicators: State of the Art and Perspectives.
UNEP/EART. 94-01; RIVM/402001001. Environmental Assessment Sub-Programme;
UNEP, Nairobi.
[10] Gras, R., Benoit, M., Deffontaines, J.P., Duru, M., Lafarge, M., Langlet, A., Osty, P.L.,
(1989). Le Fait Technique en Agronomie, Activité Agricole, Concepts et Méthodes d’Étude. Institut
National de la Recherche Agronomique, L’Hamarttan, Paris, France
[11] Mitchell, G., May, A., McDonald, A., (1995) PICABUE: a methodological framework for the
development of indicators of sustainable development. International Journal of Sustainable
Development and Word ecology 2, 104-123
[12] C. Bockstaller, P. Girardin (2003) How to validate environmental indicators, Science Direct-
Agricultural Systems 76, 639-653
[13] Commission on Environment and Development (WECD) (1987). Our Common Future.
Oxford: Oxford University Press
[14] Brian Ogle R., (2001) The need of socio-economic and environmental indicators to monitor
degraded ecosystems rehabilitation: a case study from Tanzania, Elsevier- Agriculture, Ecosystems
and Environment 87, 151-157
[15] Moldan, B., Billharz, S. (1997) Sustainability Indicators: Report of the project on Indicators of
Sustainable Development. Ed. Wiley Scope 58
[16] International Institute for Sustainable Development (IISD), (1997) Assessing Sustainable
Development: Principles in Practice. ISSD
[17] OECD (2003) OECD Environmental Indicators: Development, Measurement and Use. OECD,
Paris
114
[18] Navazo Muñoz, M. (2006) “Tecnología del Medio Ambiente. 4º Ingeniería Química. Apuntes
del curso”, School of Engineering of Bilbao, University of the Basque Country (Course’s
Notes)
[19] Eurowaste Sanitary Landfills, http://www.eurowaste.20m.com/custom3.html (3 June
2008)
[20] Stockholm Convention on Persistent Organic Pollutants (December 2004) Advanced
Draft: Guidelines on best available techniques and provisional guidance on best environmental practices
relevant to Article 5 and Annex C of the
[21] Composting: Art and Science of Organic Waste Conversion to a Valuable Soil
Resource, http://www.region18.com/composting.htm (3 June 2008)
[22] Mata- Alvarez, J., Macé, S., Llabrés, P, Department of Chemical Engineering,
University of Barcelona (2000) Review paper: Anaerobic digestion of organic solid wastes. An
overview of research achievements and perspectives, Bioresource Technology 74 (2000) 3±16
[23] Hammes, F., Kalogo, Y., Verstraete, W., (1999) Anaerobic digestion technologies for closing
the domestic water, carbon and nutrient cycles. Proceedings of the Second International
Symposium on Anaerobic Digestion of Solid Wastes, Barcelona, vol. 1.
[24] HAASE Energietechnik Gruppe, http://www.haase-energietechnik.de/en/News/ (3
June 2008)
[25] Edelmann, W., Joss, A., Engeli, H., (1999) Two step anaerobic digestion of organic solid wastes.
Proceedings of the Second International Symposium on Anaerobic Digestion of Solid
Wastes, Barcelona, vol. 2.
[26] Indicators of Sustainable Development: Guidelines and Methodologies Third Edition,
Economic and Social Affairs, United Nations, New York (2007)

115
[27] Statistisk Arsbok för Sverige 2008, Sveriges officiella statistik, Statistiska centralbyran
[28] Statistisk Arsbok för Stockholm 2008, USK Utrednings och Staistikkontoret
[29] The Office of Regional Planning and Urban Transportation- Regionplane- och
trafikkontoret Stockholms Läns Lansdsting, http://www.rtk.sll.se/english/index.htm (2
June 2008)
[30] Stockholm Business Region,
http://www.stockholmbusinessregion.se/templates/page____39389.aspx?epslanguage=E
N (3 June 2008)
[31] Data Guide- Stockholm 2008, http://www.stockholm.se/-/English/Statistics/ (5 June
2008)
[32] Waste Management in Stockholm- Traffic Administration, Department of Waste
Management
[33] Swedish Energy Agency-Swedish Environmental Protection Agency, The Development
of the Swedish Climate Strategy- A summary of the data produced byt The Swedish Energy Agency and
The Swedish Environmental Protection Agency ahead of Checkpoint 2008.
http://www.naturvardsverket.se/upload/english/06_climate_change/pdf/the_developme
nt_of_the_swedish_climate_strategy.pdf (30 May 2008)
[34] Personal contact with Nils Lundkvist from Stockholm’s Renhållningsnämnd- Traffic
Administration, Department of Waste Management
[35] Personal contact with Staffan Brantingson from ”Enheten för företags- och
registerbaserad sysselsättningsstatistik”, SBC
[36] European Foundation for the Improvement of Living and Working Conditions,

116
http://www.eurofound.europa.eu/emire/SWEDEN/ANCHOR-PENSION-SE.htm (31
May 2008)
[37] Indicators for Millenium Development Goals (MDGs) for Sweden, Statistics United Nations,
Department of Economic and Social Affairs, United Nations,
http://mdgs.un.org/unsd/mdg/Data.aspx (17 May 2008)
[38] 2007/ 2008 Human Development Report for Sweden, United Nations Development
Programme, http://hdrstats.undp.org/countries/data_sheets/cty_ds_SWE.html (19 May
2008)
[39] State of European Cities Report- Adding value to the European Urban Audit, European
Union, Regional Policy (May 2007)
[40] World Health Organization (WHO)- WHO Statistical Information System (WHOSIS),
http://www.who.int/whosis/en/index.html (1 June 2008)
[41] European Research in Natural Hazards and Risk Management, http://www.eu-
medin.org/index.php (1 June 2008)
[42] Personal contact with Jennica Wallenborg from Statistics Sweden (SBC)
[43] European Commision-Environment, Climate Change-Greenhouse Gas Emissions
Monitoring and reporting, Country profiles (Sweden),
http://ec.europa.eu/environment/climat/pdf/countries/2007/sweden.pdf (23 May 2008)
[44] Preliminary analysis of data reported under the EU National Emission Ceilings
Directive (NEC Directive) by Member States at the end of 2007- European Environment
Agency http://www.eea.europa.eu/highlights/more-eu-member-states-to-miss-2010-air-
pollutant-limits (23 May 2008)
[45] Stockholms Stadsbyggnadskontor KartagoWeb,
http://www.map.stockholm.se/kartago/ (30 May 2008)

117
[46] Land prices policies in European cities-A comparative survey, City of Amsterdam-
Development Corporation (September 2005),
http://www.oga.amsterdam.nl/bijlagen/downloads/land_price_policy_in_european_cities.
pdf (5 June 2008))
[47] OECD in Figures 2006-2007 Edition, Organization for Economic Cooperation and
Development (OECD),
http://www.oecdobserver.org/news/fullstory.php/aid/1988/OECD_in_Figures_2006-
2007.html (17 May 2008)
[48] European Environment Agengy,
http://dataservice.eea.europa.eu/atlas/viewdata/viewpub.asp?id=1114 (25 May 2008)
[49] Personal contact with Christer Lännergren, from Stockholm Vatten AB
[50] The World Bank- Data & Research,
http://econ.worldbank.org/WBSITE/EXTERNAL/EXTDEC/0,,menuPK:476823~page
PK:64165236~piPK:64165141~theSitePK:469372,00.html (1 June 2008)
[51] Share of Total Energy Supply of Sweden 2005, IEA- International Energy Agency,
http://www.iea.org/textbase/stats/pdf_graphs/SETPESPI.pdf (25 May 2008)
[52] Key World Energy Statistics 2007, IEA- International Energy Agency
[53] Plockstudie av hushållsavfall, november 2003, Renhållningsförvaltningen-Miljö och
Utveckling
[54] OECD Environmental Data-Compendium 2006/2007 Waste,
http://www.oecd.org/dataoecd/60/59/38106368.pdf (25 May 2008)

118
[55] Europa-Activities of the European Union. Summaries of Legislation, Environment-
Waste Management, http://europa.eu/scadplus/leg/en/s15002.htm (26 May 2008)
[56] Kottek, M., Grieser, J., Beck, C., Rudolf, B., Rubel, F. (2006) World Map of the
Köppen-Geiger climate classification updated,
http://docserver.ingentaconnect.com/deliver/connect/schweiz/09412948/v15n3/s1.pdf?
expires=1212480584&id=44524696&titleid=1292&accname=Guest+User&checksum=7
D289BA83D7C0830A8BEA93D56216654 (3 June 2008)
[57] SMHI, Sveriges meteorologiska och hydrologiska institut, www.smhi.se (30 May 2008)

119
APPENDIX 1: Bellagio Principles [[[[2]]]]
1. GUIDING VISION AND GOALS
Assessment of progress toward sustainable development should:
- be guided by a clear vision of sustainable development and goals that define that
vision
2. HOLISTIC PERSPECTIVE
Assessment of progress toward sustainable development should:
- include review of the whole system as well as its parts
- consider the well-being of social, ecological, and economic sub-systems, their state
as well as the direction and rate of change of that state, of their component parts,
and the interaction between parts
- consider both positive and negative consequences of human activity, in a way that
reflects the costs and benefits for human and ecological systems, in monetary and
non-monetary terms
3. ESSENTIAL ELEMENTS
Assessment of progress toward sustainable development should:
- consider equity and disparity within the current population and between present
and future generations, dealing with such concerns as resource use, over-
consumption and poverty, human rights, and access to services, as appropriate
- consider the ecological conditions on which life depends
- consider economic development and other, non-market activities that contribute
to human/social well-being
4. ADEQUATE SCOPE
Assessment of progress toward sustainable development should:
- adopt a time horizon long enough to capture both human and ecosystem time
scales thus responding to needs of future generations as well as those current to
short term decision-making
- define the space of study large enough to include not only local but also long
distance impacts on people and ecosystems

120
- build on historic and current conditions to anticipate future conditions - where we
want to go, where we could go
5. PRACTICAL FOCUS
Assessment of progress toward sustainable development should be based on:
- an explicit set of categories or an organizing framework that links vision and goals
to indicators and assessment criteria
- a limited number of key issues for analysis
- a limited number of indicators or indicator combinations to provide a clearer
signal of progress
- standardizing measurement wherever possible to permit comparison
- comparing indicator values to targets, reference values, ranges, thresholds, or
direction of trends, as appropriate
6. OPENNESS
Assessment of progress toward sustainable development should:
- make the methods and data that are used accessible to all
- make explicit all judgments, assumptions, and uncertainties in data and
interpretations
7. EFFECTIVE COMMUNICATION
Assessment of progress toward sustainable development should:
- be designed to address the needs of the audience and set of users
- draw from indicators and other tools that are stimulating and serve to engage
decision-makers
- aim, from the outset, for simplicity in structure and use of clear and plain language
8. BROAD PARTICIPATION
Assessment of progress toward sustainable development should:
- obtain broad representation of key grass-roots, professional, technical and social
groups, including youth, women, and indigenous people- to ensure recognition of
diverse and changing values
- ensure the participation of decision-makers to secure a firm link to adopted
policies and resulting action

121
9. ONGOING ASSESSMENT
Assessment of progress toward sustainable development should:
- develop a capacity for repeated measurement to determine trends
- be iterative, adaptive, and responsive to change and uncertainty because systems
are complex and change frequently
- adjust goals, frameworks, and indicators as new insights are gained
- promote development of collective learning and feedback to decision-making
10. INSTITUTIONAL CAPACITY
Continuity of assessing progress toward sustainable development should be assured by:
- clearly assigning responsibility and providing ongoing support in the decision-
making process
- providing institutional capacity for data collection, maintenance, and
documentation
supporting development of local assessment capacity

122
AP
PE
ND
IX 2
: M
ap
of
Th
e C
ity
of
Sto
ckh
olm
[ [[[45] ]]]

123
REFLECTIONS AND COMMENTS from Traffic
Administration, Department for Waste Management of The
City of Stockholm
SUSTAINABILITY INDICATORS FOR
MUNICIPAL SOLID WASTE TREATMENT
Case Study. The City of Stockholm: landfill vs. incineration
By Amaia Zabaleta
Reflections and comments
The report on sustainable indicators for municipal solid waste treatment has, as I see, in
a very interesting way shown that it is possible to use sustainable indicators when make
decisions and evaluation of decision on waste treatment.
As a result of this report we will more careful study the report and try to use sustainable
indicators in further work with Waste Management Plan and project on waste treatment.
In that work I think this report can give us possibilities for better and well reinforced
decisions.
I also hope that this report will give new ideas for how to look on selection of waste
treatment for new treatment facilities. This will hopefully also mean that sustainable
indictors will have a continued development.
Nils Lundkvist
Manager Technical Strategy
City of Stockholm
Traffic-Office, Department for Waste Management
2008-06-23
Department for Waste Management Nils Lundkvist 08-508 465 60 [email protected]


TRITA-IM 2008:26 ISSN 1402-7615 Industrial Ecology, Royal Institute of Technology www.ima.kth.se