Embed Size (px)
Citation preview


ii
ABSTRACTDespite applications of foamed bitumen technology in pavement construction in various places around the world, there are still several aspects about this technology that are not clear. In addition, knowledge on foamed bitumen technology is mainly empirical and lacks scientific basis. This study addresses some of the aspects for foamed bitumen technology such as:Investigation of any effects in binder composition during the production process for foamedbitumen; assessment of the effect of bitumen source on foamed bitumen characteristics;development of a rational method to optimise foamed bitumen characteristics and conditions;evaluation of aggregate particle coating within foamed bitumen mixes; further improvements in the mix design procedure specifically the method of compaction and optimum bitumen content determination stages are suggested.
Fourier transform infrared spectroscopy techniques were used to investigate any changes in bitumen composition after the production process of foamed bitumen. Fourier transform infrared tests were done on foamed bitumen and neat bitumen specimens for two bitumens with similar penetration grades. Foamed bitumen characteristics of three bitumens were established by producing foamed bitumen at temperatures of 150ºC up to 180ºC and foamant water contents of 1, 2, 3, 4 and 5%. From the analysis of variation of foamed bitumen characteristics (maximum expansion ratio and half-life) at different temperatures a new method based on the equi-viscous bitumen temperature to optimize foamed bitumen conditions and characteristics was proposed. Rice density and surface energy concepts were used to evaluate aggregate particle coating with foamed bitumen. A granite aggregate divided into three different size fractions and three sets of foamed bitumen produced from three bitumen penetration grades were used. A gyratory laboratory compaction procedure for laterite gravels treated with foamed bitumen was established using the modified locking concept. Three laterite gravels with different chemical composition were mixed with foamed bitumen produced from one penetration bitumen grade. The resulting mixes were compacted up to 200 gyrations and the corresponding compactioncurve defined in terms of height versus number of gyrations noted. In addition, the optimum moisture content requirements at the modified locking point were determined. 3D packing theory concepts, primary aggregate structure porosity and an indirect tensile strength criterion were employed to determine optimum bitumen content for foamed bitumen mixes.
Fourier infrared techniques revealed that foaming did not cause any changes in the bitumenchemistry, implying that the foamed bitumen production process may possibly be a physical process. Characterisation of foamed bitumen produced from three bitumen penetration grades showed that foamed bitumen characteristics (maximum expansion ratio and half-life) weremainly influenced by binder viscosity rather than the source. The equi-viscous temperature seemed to provide a suitable criterion at which foamed bitumen with optimum characteristicscould be produced. Rice density results showed that aggregate size fraction, binder expansion ratio and viscosity influenced aggregate particle coating. For the coarser aggregate fraction, results revealed that binder coating seemed to be mainly influenced by temperature. Whilst for fine aggregate fraction the coating was mainly influenced by surface area. Surface energy results revealed that foamed bitumen exhibited better coating attributes than neat bitumen. A new laboratory compaction procedure for laterite gravels treated with foamed bitumen based on the modified locking point was developed. The modified locking point represents the state at which
iii
maximum aggregate particle interlock occurs when mixes are compacted in the field. It is based on the analysis of the rate of change for the gyratory compaction curve. The compaction curve in this case is defined in terms of compaction height versus number of gyrations. Gradation analysis beyond the modified locking point showed that aggregate particle breakdown occurred. Analysis of the optimum moisture at the modified locking point revealed that the moisture conditions wereless than the aggregate optimum moisture conditions. It is recommended that this point be used to determine the optimal compaction characteristics of foamed bitumen mixes.
Aggregate structure porosity and an indirect tensile strength criteria can be used to determine the bitumen content that could be used in design of foamed bitumen mixes. This would reduce the amount of resources required since the bitumen content could be estimated prior to carrying out the actual laboratory work given that the aggregate grading is known. The aggregate structure can be divided (based on 3D packing theory) into oversize, primary, and secondary structures. The primary structure is mostly responsible for carrying loads whilst the secondary structure fills the voids within the primary structure and provides support to the primary structure. The aggregate size particles constituting the primary structure are deduced as a function of standard sieve sizes using the packing theory concepts. The minimum sieve size for the primary structure is proposed as 1 mm. The oversize structure consists of aggregate particles whose size is greater than the maximum size for the primary structure. The secondary structure consists of aggregate particles whose size is below the minimum size for the primary structure. The primary aggregate structure porosity can be used to establish the starting bitumen content; the bitumen content at which this porosity is 50% is chosen as the initial bitumen content. Indirect tensile strengthvalues corresponding to 50% primary porosity are determined as well as the bitumen contents and compared against the recommended minimum values.

iv
ACKNOWLEDGEMENTSI am greatly indebted to the guidance, advice and support provided by my supervisors: Professor Björn Birgisson of Highway and Railway Engineering, KTH, Stockholm; Associate ProfessorUmaru Bagampadde, Department of Civil and Environmental Engineering, Makerere University;Dr. Alvaro Guarin, my assistant supervisor, from the Department of Civil and Architectural Engineering at KTH, during the course of my studies. Further, I also appreciate his assistance with laboratory work, thesis editing and administrative issues. The funding by Swedish International Development Agency (Sida) and Makerere University is highly appreciated. The extra funding from the Division of Highway and Railway Engineering, KTH is also gratefully acknowledged. The assistance by Dr. Michael Behn formely of Highway and Railway Engineering, KTH in editing of Paper II and in carrying out the study is highly appreciated. Thehelp in characterisation of laterite gravels by Mr. Fred Nsubuga Mukasa formerly of the Department of Civil and Environmental Engineering, Makerere University was very useful. The assistance accorded by emeritus Professor Ulf Isacsson of Highway and Railway Engineering,KTH in the earlier part of the study is also highly appreciated.
Many thanks to: Dr. Denis Jelagin, Ali Butt, Ebhrahim, Anohe, Michael Behn, Jane Salmosson of Highway and Railway Engineering for their assistance in carrying out the foamed bitumencharacterisation tests. Also, Ali and Jane’s assistance in characterising the bitumens is gratefully acknowledged. The assistance by Per Redelius, Hilde and Javid of Nynas AB of Sweden in providing various types of bitumen, and help with FTIR and DSC tests is highly appreciated. Iam grateful to Dr. Denis Jelagin’s help in carrying out the ITS tests, Jonas Ekblad and staff of NCC, Stockholm for their help in testing for the resilient modulus, ITS, and Rice density. The administrative help by Agneta Arnius (formerly of Highway and Railway Engineering, KTH)and Pia Lundqvist, Highway and Railway Engineering, KTH is forever to be remembered.Further, the assistance by the coordinators of the Sida project, Prof. Mackay Okure, College of Engineering, Design, Art and Technology, Makerere University and Dr. Inga Britt Werner,School of Architecture and the Built Environment, KTH is highly acknowledged. Am grateful to my fellow PhD students at Highway and Railway Engineering, KTH and Makerere University for their assistance towards my studies. To Åsa Lyne, Florentina Farcas, Parisa of KTH thanks for sharing offices with me over the years. To Tabitha Sentongo thanks for picking me up and dropping me at Entebbe airport during the earlier part of the study. Hassan thanks for continuing where Tabitha stopped! Mrs. Margret Mulondo (aka Mama Abigail) thanks for your prayers and moral support these carried me through. Dr. Robinah Kulabako of the Department of Civil and Environmental Engineering, Makerere University thank you very much for your advice and encouragement towards the completion of my studies.
To my family (mama, daddy, Eria, Ruth and other siblings) thanks for your prayers, support and for taking care of my small apartment in Uganda while I was in Sweden. I am also grateful for the emotional support, advice, friendships accorded by Mrs. Odette Munyasanga (aka Mama Odette), Ingemar Hulthen, Jacob Chakuhwa, Esther Nyiramugisha, Lydia Joyce Uwera, Sarah, Shadi, Kate, Reem, Hamam of Sweden and many other friends thanks for sharing my burdens,continuously praying and caring for me, God richly bless you guys!. Pastor James Godly thanks for praying for me whenever you came to Sweden. Mama Odette thanks for providing me a home away from home, for constantly caring about the progress of my studies and mothering me in Sweden, I know that God brought you to Sweden for such a time as this. Finally, I wish to thank the good LORD for His mercy and grace availed towards me on this journey! Ebenezar!

v
DEDICATION
To my parents, brother & my other siblings: Dr. F. M. Kiyaga, Mabel Kiyaga and Eria Kiriminga thanks for standing with me through thick and thin! I am not sure whether you
understood what I was doing but thanks for being there for me anyway!

vi
TABLE OF CONTENTS
ABSTRACT............................................................................................................................................ii ACKNOWLEDGEMENTS.................................................................................................................... iv
DEDICATION........................................................................................................................................v
LIST OF APPENDED PAPERS...........................................................................................................viii AUTHORS’ CONTRIBUTIONS ........................................................................................................... ix
1.0. INTRODUCTION ......................................................................................................................1 1.1. BACKGROUND ............................................................................................................................................. 1 1.2. PROBLEM STATEMENT ................................................................................................................................. 1 1.3. OBJECTIVES ................................................................................................................................................. 2 1.4. SCOPE .......................................................................................................................................................... 2
2.0. LITERATURE REVIEW............................................................................................................4 2.1. FOAMED BITUMEN (PAPER I) ....................................................................................................................... 4 2.2. CHARACTERISTICS OF FOAMED BITUMEN (PAPERS I AND V) ....................................................................... 5 2.3. OPTIMUM FOAMED BITUMEN CONDITIONS AND CHARACTERISTICS (PAPERS II AND V) ............................... 6 2.4. COMPACTION OF FOAMED BITUMEN MIXES (PAPER III) ............................................................................... 6 2.5. MIX DESIGN FOR FOAMED BITUMEN MIXES (PAPER IV) ............................................................................... 7 2.6. SUMMARY OF LITERATURE .......................................................................................................................... 7
3.0. MATERIALS AND METHODS (Papers II, III, IV)....................................................................8 3.1. MATERIALS ................................................................................................................................................. 8
3.1.1. Bitumen..................................................................................................................................................8 3.1.2. Foamed bitumen ....................................................................................................................................8 3.1.3. Aggregates .............................................................................................................................................9 3.2. Methods .................................................................................................................................................9 3.2.1. Bitumen Characterisation tests (Paper II)...........................................................................................10 3.2.2. Foamed bitumen characterisation (Paper II) ......................................................................................11 3.2.3. Aggregate densities..............................................................................................................................12 3.2.4. Rice density tests..................................................................................................................................12 3.2.5. Surface energy tests .............................................................................................................................13 3.2.6. Laterite gravel tests .............................................................................................................................13 3.2.7. Gyratory compaction (Paper III).........................................................................................................15 3.2.8. Optimum bitumen content determination (Paper IV)...........................................................................15
4.0. RESULTS, ANALYSIS AND DISCUSSION (II-IV)................................................................ 17 4.1. FOAMING EFFECTS ON BINDER CHEMISTRY (PAPER II) .............................................................................. 17 4.2. FOAMED BITUMEN CHARACTERISTICS AND CONDITIONS (PAPER II) .......................................................... 18
4.2.1. Effects of bitumen temperature, foamant water content and binder source.........................................18 4.2.2. Optimum foamed bitumen characteristics and conditions...................................................................20
4.3. AGGREGATE PARTICLE COATING (PAPER II) .............................................................................................. 24 4.3.1. Rice density results ..............................................................................................................................24 4.3.2. Surface energy results..........................................................................................................................27
4.4. COMPACTION CHARACTERISTICS OF FOAMED BITUMEN TREATED MATERIALS (PAPER III) ........................ 29 4.5. OPTIMUM BITUMEN CONTENT DETERMINATION (PAPER IV) ...................................................................... 33
4.5.1. Aggregate structure porosity ...............................................................................................................33 4.5.2. ITS and Porosity criteria .....................................................................................................................34
4.6. GENERAL DISCUSSION ............................................................................................................................... 34 4.6.1. Effects of production process on bitumen composition........................................................................34 4.6.2. Optimum foamed bitumen conditions and characteristics...................................................................35 4.6.3. Effects of binder source on foamed bitumen characteristics ...............................................................35 4.6.4. Evaluation of aggregate particle coating ............................................................................................35

vii
4.6.5. Mix design for foamed bitumen mixes..................................................................................................36 5.0. CONCLUSIONS AND RECOMMENDATIONS ..................................................................... 38
5.1. Conclusions .............................................................................................................................. 38
5.2. Recommendations..................................................................................................................... 40
REFERENCES...................................................................................................................................... 41
APPENDED PAPERS........................................................................................................................... 46
viii
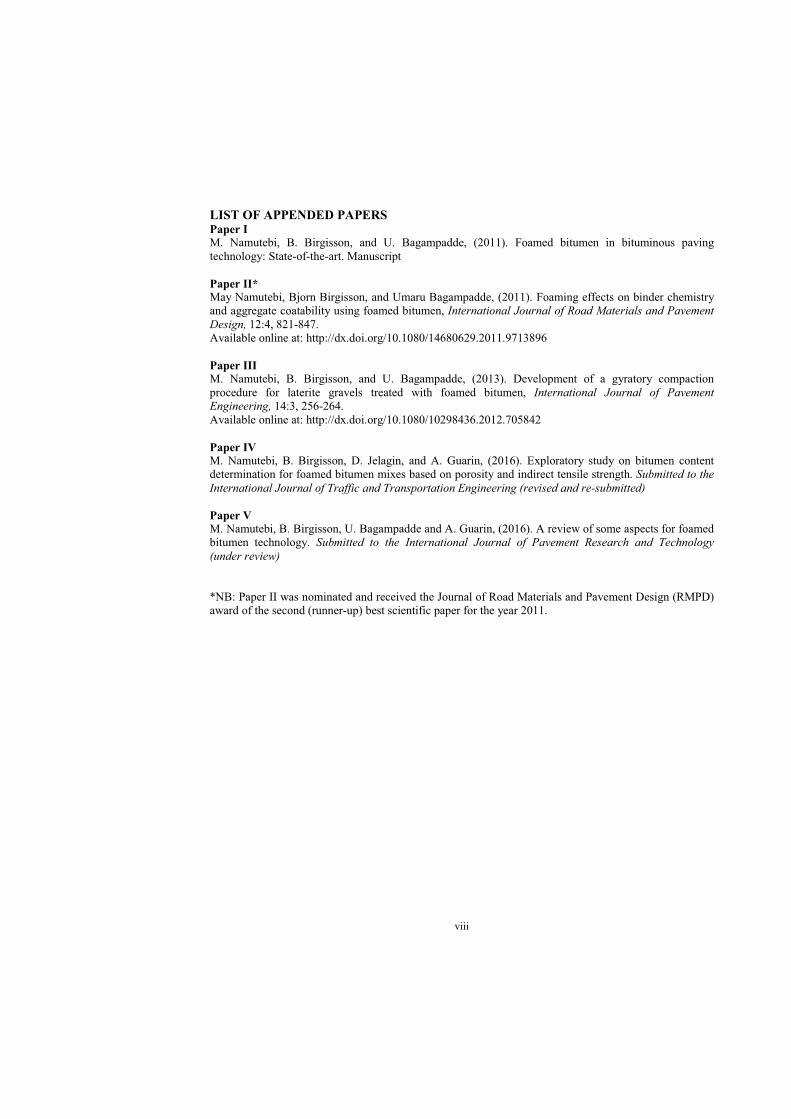
LIST OF APPENDED PAPERSPaper IM. Namutebi, B. Birgisson, and U. Bagampadde, (2011). Foamed bitumen in bituminous paving technology: State-of-the-art. Manuscript
Paper II*May Namutebi, Bjorn Birgisson, and Umaru Bagampadde, (2011). Foaming effects on binder chemistry and aggregate coatability using foamed bitumen, International Journal of Road Materials and Pavement Design, 12:4, 821-847.Available online at: http://dx.doi.org/10.1080/14680629.2011.9713896
Paper IIIM. Namutebi, B. Birgisson, and U. Bagampadde, (2013). Development of a gyratory compaction procedure for laterite gravels treated with foamed bitumen, International Journal of Pavement Engineering, 14:3, 256-264.Available online at: http://dx.doi.org/10.1080/10298436.2012.705842
Paper IVM. Namutebi, B. Birgisson, D. Jelagin, and A. Guarin, (2016). Exploratory study on bitumen content determination for foamed bitumen mixes based on porosity and indirect tensile strength. Submitted to the International Journal of Traffic and Transportation Engineering (revised and re-submitted)
Paper VM. Namutebi, B. Birgisson, U. Bagampadde and A. Guarin, (2016). A review of some aspects for foamed bitumen technology. Submitted to the International Journal of Pavement Research and Technology(under review)
*NB: Paper II was nominated and received the Journal of Road Materials and Pavement Design (RMPD)award of the second (runner-up) best scientific paper for the year 2011.

ix
AUTHORS’ CONTRIBUTIONS
In Paper I, Namutebi formulated the paper outline, and wrote the paper. Birgisson and Bagampadde assisted with formulating the paper outline and editing.
In Paper II, Namutebi, Birgisson and Bagampadde planned the experimental work. Namutebi performed the experimental work and analysis as well as writing and revising the paper. Birgisson and Bagampadde assisted in data analysis and editing of the paper.
In Paper III, Namutebi and Birgisson planned the experimental work. Namutebi performed the experimental work, analysis, writing and revising the paper. Birgisson assisted in the data analysis and editing of the paper. Bagampadde assisted in editing of the paper.
In Paper IV, Namutebi, Birgisson, Guarin and Jelagin planned and formulated the paper content.Namutebi performed the analysis, writing and revising the paper. Birgisson, Guarin, Jelagin assisted in the analysis.
In Paper V, Namutebi prepared the paper manuscript. Birgisson assisted with formulating the paper content and editing. Bagampadde and Guarin assisted in editing of the paper.


1
1.0. INTRODUCTION
1.1. BackgroundIn recent times the world has been hit with increasing challenges (such as decrease in natural material resources, increasing human populations) in securing sustainable natural resources for construction,especially good quality ones. These challenges have affected the way various industries can carry out their activities. The road construction industry is no exception; it has also been affected by theaforementioned challenges. These challenges have posed a need for innovations and improved methods of construction and maintenance of pavements. Foamed bitumen is one such innovative technology that hasbeen applied in the road industry. It consists of liquid bitumen, water (in gaseous and liquid states) as well as air. It is produced when hot bitumen is exposed to water under pressure and exists for a short time period. Foamed bitumen is combined with pre-wetted aggregates to form foamed bitumen mixes or foamed bitumen treated materials. In pavement construction, it accrues various mix advantages such as improved mix strength and durability, and reduced binder contents. In addition, foamed bitumen technology, enables the use of a wide range of aggregates, energy savings during the mix processing asaggregates are normally at ambient temperatures, environmental friendliness as no toxins are released into the environment, improved workability since mixes can stay for longer time periods provided moisture loss is prevented, propensity of using labour intensive methods since mixes are normally at ambienttemperature, and reduced costs (Saleh, 2007; Jenkins, 2000; Muthen, 1998; Akeroyd and Hicks, 1988;Castedo et al., 1983).
Foamed bitumen was first used in road construction in the mid 1950s when Csanyi (Csanyi and Fung, 1959, 1957 and 1956) injected steam into hot bitumen; Csanyi acquired patent rights for this innovation. Further, Csanyi used it as a binder for soils and marginal aggregates. In the late 1960s, Mobil Oil Company of Australia acquired the patent rights for Csanyi's technology and made modifications to the production process of foamed bitumen (Lee, 1981; Bowering and Martin, 1976); instead of using steam,cold water was instead injected into hot bitumen. In addition, they developed an expansion chamber (where water under pressure combined with hot bitumen) and a nozzle system through which the foamed bitumen was dispersed onto the aggregates. In the early 1990s, patent rights to the foamed bitumen technology by Mobil Oil expired and other companies started manufacturing new equipment to produce and work with foamed bitumen. Also, other countries apart from Australia gained access to the foamed bitumen technology. However, despite being widely applied in pavement construction, some aspects of the foamed bitumen technology are still not well understood. These are highlighted in section 1.2. Thisstudy was undertaken to address some of these aspects.
1.2. Problem statementFoamed bitumen is produced when small quantities of water normally at room temperature and air (under pressure) are injected into hot bitumen. Under these production conditions, the binder is more likely to be exposed to ageing due to the presence of air and water which promote ageing. Thus there is a need to investigate whether any changes in binder composition occurred during the foam production process.Also, approaches to determine the optimum foamed bitumen conditions (temperature, foamant water content) and characteristics (maximum expansion ratio and half-life) have been proposed. However, they seem not to be adequate to properly determine the optimum foamed bitumen conditions and characteristics. Thus, a rational approach is required to determine the optimum foamed bitumencharacteristics. In addition, foamed bitumen has been characterised by various parameters such as maximum expansion ratio, half-life, minimum viscosity, and coefficient of foamability. These may beinfluenced by foamant water content, bitumen temperature, source, type, and composition, temperature of

2
the vessel into which foam is dispersed, water, air and bitumen pressure, and additives (Lesuer et al., 2004; Wirtgen, 2004; Jenkins, 2000; Castedo et al., 1984; Brennen et al., 1983). However, limited literature exists on the effects of bitumen source on foamed bitumen characteristics.
Foamed bitumen combines with aggregate particle sizes of less than 63 m or 75 m (Sunarjono, 2008; Castedo et al., 1983; Csanyi and Fung, 1956) and sand aggregate fractions (between 2 mm and 63 m) (Jenkins, 2000). This forms a mortar that binds the coarser particles into a composite mass (Jenkins, 2000). Preferential coating of the filler can possibly be attributed to a higher surface area and hence higher surface forces. However, limited literature exists on the quantitative determination of proportionate preference of foamed bitumen for the fines versus the coarser particles.
Furthermore, there is lack of insight into some aspects of mix design using foamed bitumen. One such aspect is the laboratory compaction of foamed bitumen mixes. Most researchers have recommended compaction of foamed bitumen mixes at number of gyrations that yield the maximum dry density of the aggregate as determined from the Proctor method. However, these methods of compaction (gyratory and Proctor) are different. In addition, there is need to explore moisture requirements at the compaction stage. Also, there seems to be no suitable method that can be used to establish optimum binder requirements for foamed bitumen mixes.
1.3. ObjectivesThe study was carried out against the following objectives:
Main ObjectivesTo evaluate/investigate some aspects of foamed bitumen technology such as assessment of aggregate particle coating with foamed bitumen, influence of the foam production process on binder composition, mix design considerations such as determination of compaction conditions and optimum binder content.
Specific Objectives(i). Investigating the influence of foamed bitumen production process on binder composition.
(ii). Development of a rational method for determining optimum foamed bitumen conditions andcharacteristics.
(iii). Evaluation of the effects of binder source onto foamed bitumen characteristics.
(iv). Assessment of aggregate particle coating within foamed bitumen mixes.
(v). Establishment of a laboratory gyratory compaction procedure for laterite gravels treated with foamed bitumen.
(vi). Development of a method to determine the optimum bitumen content for foamed bitumen mixes.
1.4. ScopeIn this study, conventional penetration grade bitumens were used. Foamed bitumen was produced from these bitumens. Granite aggregates were used in evaluation of aggregate particle coating in foamed

3
bitumen treated materials. Granite aggregates were used in the analysis of aggregate particle coating with foamed bitumen because they were readily available. Laterite gravels were used in the development of a gyratory compaction procedure and method to determine the optimum binder content. The effects of the foamed bitumen production process on bitumen composition were investigated using infrared spectroscopy techniques. Foamed bitumen characteristics, including maximum expansion ratio and half-life for three penetration grade bitumens from different sources were studied to gain insight into the effects of bitumen source on foamed bitumen characteristics. Furthermore, aggregate particle coating in materials treated with foamed bitumen was studied using measured changes in Rice density and surface energy. A gyratory compaction procedure based on maximum aggregate particle interlock for laterite gravels treated with foamed bitumen was developed. A method to determine optimum binder requirements for foamed bitumen mixes was developed based on a gradation framework, aggregate structure porosity and strength criteria, strength criteria was defined in terms of the indirect tensile strength.


5
2.2. Characteristics of foamed bitumen (Papers I and V)
Foamed bitumen has been characterised by the maximum expansion ratio, half-life, foam index, minimum viscosity as well as the coefficient of foamability (Jenkins, 2000; Wirtgen 2004; Lesueur et al., 2004; Asphalt Academy, 2009). The maximum expansion ratio and half-life are the main parameters that have been used in characterisation of foamed bitumen. These parameters can be easily measured, although they appear empirical. Although the foam index combines both the maximum expansion ratio and half-life, attempts by other researchers to apply it in determination of foamed bitumen conditions (bitumen temperature, foamant water content) have not yielded definite values (Saleh, 2006; Sunarjono, 2008; Namutebi et al., 2011). Using viscosity as a measure of foamed bitumen characteristic would be measuring the fundamental property of the foam. However, viscosity determination of the foam using direct equipment insertion may lead to distortion of the foam structure and thus the resulting measured viscosity may not be the true viscosity of the foam.
The aforementioned foamed bitumen characteristics are influenced by foamant water content, bitumen temperature, viscosity, type and composition as well as the temperature of the vessel in which the foamed bitumen is collected. The maximum expansion ratio increases with increasing water contents and temperature, while the half-life decreases (Brennen et al, 1983; Wirtgen, 2004; He and Wong, 2006). This can be explained by the presence of more water being made available as water contents increase. As more steam being produced, it leads to the formation of more bubbles. This in turn leads to an increase in maximum expansion ratio. The decrease in half-lives can be attributed to increased coarsening/thinning effects of the bubbles and reduced binder viscosity as temperature increases. When small bubbles are absorbed by large ones, the bitumen film thickness surrounding the bubbles reduces causing the bubbles to collapse (Wirtgen, 2004; Sunarjono, 2008). As binder viscosity decreases, surface tension of the bitumen films decreases, and the steam pressure within the bubbles exceeds the surface tension of the bitumen which leads to collapse of bubbles (Jenkins, 2000). Although, decreasing viscosity can also lead to reduction in the surface tension in the lamellae of the bubbles and thus reduce the plateau border suction which in turn leads to delay of foam collapse (Sunarjono, 2008). However, this may rarely occur since reduction in viscosity will lead to decrease in surface tension for both the lamellae and the Plateau border (Sunarjono, 2008).
Bitumens with lower viscosities (soft grades) foam more readily and have high values of maximum expansion ratio and half-lives than those with higher viscosities (hard grades) (Abel, 1978; Bissada, 1987;Namutebi, 2011). However, He and Wong’s (2006) study on decay properties of two bitumen grades revealed that the hard bitumen grade (with higher viscosities) gave higher maximum expansion ratios compared to those with a soft grade (with lower viscosities) at the same bitumen temperature, air pressure and water content levels. In case of half-life values, a reverse trend was observed; half-lives were higher for the soft grade compared to those of hard grade bitumen. The variation was attributed to differences in viscosities for the two grades of bitumen. This is contrary to results reported by Abel (1978), Bissada (1987) and Namutebi (2011). Thus there seems to be other factors such as bitumen composition that could possibly influence the foamed bitumen characteristics. In He and Wong’s study, the bitumen composition was not considered. Lesueur et al. (2004) deduced that bitumen composition did not significantlyinfluence the foamed bitumen characteristics as compared to bitumen temperature and water content. Thus, limited literature exists on the effects of bitumen composition on the foamed bitumencharacteristics. This study was undertaken to establish foamed bitumen characteristics of different bitumen grades and from different sources, as well as to gain more insights into the foamed bitumencharacteristics of different bitumen grades and composition.

6
2.3. Optimum foamed bitumen conditions and characteristics (Papers II and V)Since the maximum expansion ratio and half-life vary differently with foamant water contents and bitumen temperatures, there is need to determine the optimum bitumen temperature, and foamant water content that would lead to optimum foamed bitumen characteristics. Approaches such as Wirtgen, foam index, minimum foam viscosity (Jenkins, 2000; Wirtgen, 2004; Saleh, 2006) have been proposed to establish optimum bitumen temperature and foamant water content. In the Wirtgen approach, the average foamant water content at which minimum values of expansion ratio and half-life occur is taken as the foamant water content; in this approach there is no temperature optimisation. With the foam index approach, the foamant water content at which the optimum foam index occurs is considered as one that will lead to optimum foamed bitumen characteristics. Although, the foam index is a function of maximum expansion ratio and half-life, attempts by other researchers to apply it have not yielded definite optimum points (Sunarjono, 2008; Namutebi, 2011). The minimum viscosity approach involves determining the foamant water content at which the viscosity is lowest. This foamant water content is considered as the one that will yield the optimum foamed bitumen characteristics. Similarly as in the case of the Wirtgen approach, there is no bitumen temperature optimization, although a bitumen temperature exceeding 160ºC is recommended (Wirtgen, 2004). Generally, the aforementioned approaches seem to be inadequate in determining the optimum foamed bitumen characteristics and conditions.
2.4. Compaction of foamed bitumen mixes (Paper III)
Compaction of any pavement material requires suitable equipment that will aid in achieving a composite mass that can be able to withstand the stresses that will be applied to the pavement structure. In addition, moisture conditions within the material should be at optimum level to provide the required lubrication during the compaction process. Although various laboratory compaction methods have been used in the compaction of foamed bitumen mixes, the gyratory compaction method has been recommended as it best simulates the roller action in the field. However, it is not clear how the number of gyrations can be determined as well as the moisture content level at which compaction can be carried out. Jenkins (2000) and Sunarjono (2008) recommended gyratory compaction at the number of gyrations that yielded the aggregate maximum dry density as determined from the Proctor method of compaction. However, gyratory and Proctor compaction methods are different and certainly the densities achieved in either method of compaction may not be equal. Moisture conditions at compaction within foamed bitumen mixes also need to be optimised so that the required mix strength after compaction is achieved. Although some work has been undertaken to establish the moisture requirements at the mixing stage, limited work exists on moisture requirements at the compaction stage.
In this study, the locking concept was modified and employed to establish the gyratory compaction conditions. The locking point represents the state of maximum aggregate interlock. Any compaction after this locking point would lead to aggregate particle break down and this would compromise the resulting strength of the mix and its durability. This concept of locking point was first defined by Vavrik and Carpenter (1998) for dense graded hot mixes, as the first three gyrations that are at the same compaction height preceded by two gyrations at the same height. However, application of the compaction height as a measure of locking point in this study did not yield any definite number of gyrations for any of the mixes in this study. Instead, the rate of change of compaction was used as a measure of resistance to compaction. The number of gyrations at which the resistance to compaction increased significantly was taken as the modified locking point. In this study, the optimum moisture content for laterite gravels treated with foamed bitumen required to achieve maximum dry density was determined at the modified locking point.

7
2.5. Mix design for foamed bitumen mixes (Paper IV)Mix design involves various procedures concerned with the optimization of the different constituents of the given mix such that the mix fulfills the purpose for which it is designed. One of the major aims of mix design is to establish a suitable binder content. Mix design methods for foamed bitumen mixes are dependent on concepts for hot bituminous mix design and yet these materials are different. Empirical properties such as Marshall stability and flow have been employed in the mix design of foamed bitumen treated materials in order to select a suitable binder content (Lee, 1981; Abel, 1978; Bowering and Martin, 1976). Recently, other mechanical tests such as indirect tensile strength, resilient modulus, and tri-axial have been used (Asphalt Academy, 2009). However, it has been observed that the indirect tensile strength may increase with increasing bitumen contents thus not attaining a maximum value. This kind of trend presents a challenge of selecting appropriate binder content value. In this study, a method based on porosity of the primary aggregate structure and indirect tensile strength is proposed to establish an optimum binder content for foamed bitumen mixes.
2.6. Summary of literatureIn general, foamed bitumen when brought into contact with pre-wetted aggregates combines with the fine fraction (normally minus 2mm). However, it is not clear why this is so; this study has provided some possible insights into this mechanism of action by foamed bitumen. Ageing susceptibility of foamed bitumen at the production stage has not been studied extensively despite ageing factors (water and air) being present during foamed bitumen production. This study analyzed the changes in bitumencomposition before and after foaming in order to ascertain whether binder ageing has occurred.
Although various methods are available to determine optimum foamed bitumen characteristics (maximum expansion ratio and half-life) and conditions (bitumen temperature and foamant water content), they seem to be inadequate. Also, it is not clear how the optimum bitumen temperature required to produce foamed bitumen can be deduced. This calls for either improvement in these existing methods or establishment of other methods to aid in determining optimum foamed bitumen characteristics and conditions. In addition, limited research has been done to investigate the influence of bitumen composition on foamed bitumen characteristics. In this study, a method to establish optimum foamed bitumen characteristics and conditions is established. Attempts are made to analyze how bitumen composition affects the resulting foamed bitumen characteristics.
Mix design for foamed bitumen mixes or treated materials is mainly based on design concepts for hot bituminous mixes and yet foamed bitumen mixes differ from hot bituminous mixes. Moreover, foamed bitumen mixes incorporate various constituent materials such as aggregates, bitumen, water and additives (such as lime and cement). Quantities for these constituent materials need to be optimised in order to produce a mixture that would good performance. Optimum compaction moisture levels required for foamed bitumen mixes also need to be established, since presently only mixing moisture conditions are established. In this study, methods to determine the number of gyrations required to compact foamed bitumen mixes in the laboratory and optimum bitumen content are developed. In addition, optimum moisture levels at which laboratory compaction for foamed bitumen mixes can be carried out are proposed.

9
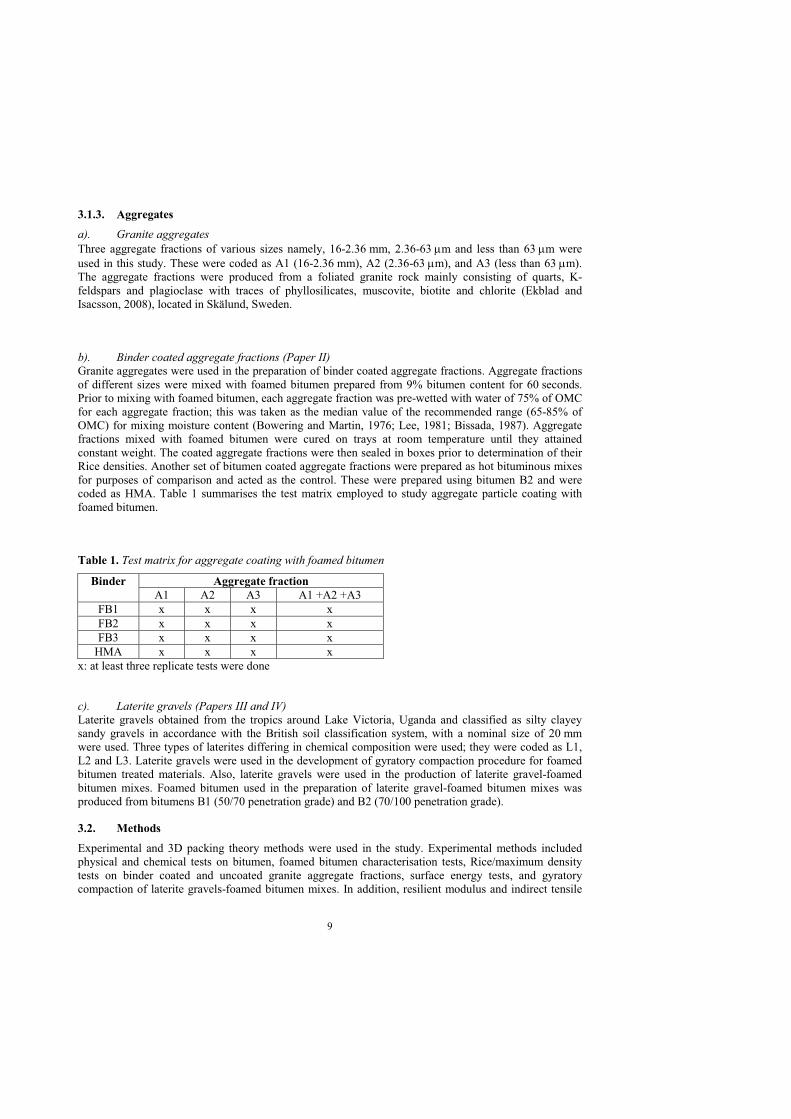
3.1.3. Aggregates
a). Granite aggregatesThree aggregate fractions of various sizes namely, 16-2.36 mm, 2.36-63 m and less than 63 m were used in this study. These were coded as A1 (16-2.36 mm), A2 (2.36-63 m), and A3 (less than 63 m).The aggregate fractions were produced from a foliated granite rock mainly consisting of quarts, K-feldspars and plagioclase with traces of phyllosilicates, muscovite, biotite and chlorite (Ekblad and Isacsson, 2008), located in Skälund, Sweden.
b). Binder coated aggregate fractions (Paper II)Granite aggregates were used in the preparation of binder coated aggregate fractions. Aggregate fractions of different sizes were mixed with foamed bitumen prepared from 9% bitumen content for 60 seconds. Prior to mixing with foamed bitumen, each aggregate fraction was pre-wetted with water of 75% of OMC for each aggregate fraction; this was taken as the median value of the recommended range (65-85% of OMC) for mixing moisture content (Bowering and Martin, 1976; Lee, 1981; Bissada, 1987). Aggregate fractions mixed with foamed bitumen were cured on trays at room temperature until they attained constant weight. The coated aggregate fractions were then sealed in boxes prior to determination of their Rice densities. Another set of bitumen coated aggregate fractions were prepared as hot bituminous mixes for purposes of comparison and acted as the control. These were prepared using bitumen B2 and were coded as HMA. Table 1 summarises the test matrix employed to study aggregate particle coating with foamed bitumen.
Table 1. Test matrix for aggregate coating with foamed bitumen
Binder Aggregate fractionA1 A2 A3 A1 +A2 +A3
FB1 x x x xFB2 x x x xFB3 x x x x
HMA x x x xx: at least three replicate tests were done
c). Laterite gravels (Papers III and IV)Laterite gravels obtained from the tropics around Lake Victoria, Uganda and classified as silty clayey sandy gravels in accordance with the British soil classification system, with a nominal size of 20 mm were used. Three types of laterites differing in chemical composition were used; they were coded as L1, L2 and L3. Laterite gravels were used in the development of gyratory compaction procedure for foamed bitumen treated materials. Also, laterite gravels were used in the production of laterite gravel-foamed bitumen mixes. Foamed bitumen used in the preparation of laterite gravel-foamed bitumen mixes was produced from bitumens B1 (50/70 penetration grade) and B2 (70/100 penetration grade).
3.2. Methods
Experimental and 3D packing theory methods were used in the study. Experimental methods included physical and chemical tests on bitumen, foamed bitumen characterisation tests, Rice/maximum density tests on binder coated and uncoated granite aggregate fractions, surface energy tests, and gyratory compaction of laterite gravels-foamed bitumen mixes. In addition, resilient modulus and indirect tensile

10
strength tests were undertaken on laterite gravel-foamed bitumen mix specimens. The following sections describe the experimental methods used in the study.
3.2.1. Bitumen Characterisation tests (Paper II)
Both physical and chemical tests were employed in characterisation of the bitumens used in the study.Physical tests involved undertaking traditional rheological tests on the representative bitumen specimens. Physical tests included; penetration at 25oC, softening point, Brookfield viscosity, specific gravity and density. Chemical tests involved the determination of bitumen composition using Fourier Transform techniques, acid number and wax content determination using Differential Scanning Calorimetry (DSC) techniques. Table 2 summarises the various tests, standards and parameters measured by these tests.
Table 2. A summary of bitumen test methods
Test method Standard Parameter
Penetration EN 1426 Penetration at 25oC
Ring and ball EN 1427 Softening point (oC)
Brookfield viscosity SS-EN 13302 Dynamic viscosity at temperatures of 135, 140, 150, 160, 170, and 180°C
(in Pa. s)
Density and Specific gravity
SS-EN 15326 Specific gravity and density at 25oC
Fourier Transform Infrared spectroscopy
(FTIR)
Method is briefly described below
Binder functional groupsin both neat and foamed
conditions
Acid number determination
ASTM D 664:95 Acid number
Differential Scanning Calorimetry (DSC)
Method is briefly described below
Wax content
Chemical tests
a). Fourier Transform Infrared spectroscopy (FTIR)This was used to investigate the binder functional group composition before and after the foamed bitumenproduction process, thus deducing whether foaming induces any ageing of the binder. The Fourier transform spectrometer, Nicolet 380 FTIR was used to analyse the composition of the samples. The method of attenuated total reflectance (ATR) with a diamond cell was used. Two penetration grade bitumens, B2 and B3, of similar grade but sourced from different sources were analysed. Bitumen samples in neat and foamed conditions that had been cooled to room temperature were heated to 180oCfor 15 minutes. Hot bitumen was then poured into a diamond cell and pressed with a diamond surface. Specimens for a second and third replicates were taken after 15 minutes interval. Scanning was done at a resolution of 4 cm-1, wave numbers of 4000 cm-1 up to 400 cm-1 and 32 scans. Table 3 summarises the test matrix followed.

11
Table 3. Test matrix for FTIR test
Bitumen Neat FoamedB2 x xB3 x x
x: represents at least three replicates
b). Differential Scanning Calorimetry (DSC)This test was carried out to determine the wax content of bitumens B2 and B3. Approximately 15 mg of bitumen specimen was weighed in an open pan and placed in the calorimeter cell under the nitrogen blanket. The specimen together with a reference empty pan were heated to 120oC to help in wax dissolution and then cooled at a rate of 10oC/min to -120oC. The changes in heat energy in the bitumen specimen with respect to the reference pan were determined at different temperatures and thermographs were plotted. From these thermographs the wax content was deduced. This wax content represents the total amount of wax in bitumen comprising macrocrystalline, microcrystalline and amorphous waxes. In computation of wax content, a specific heat capacity value of 121.3 J/g °C was used which is the estimated average value for natural wax in bitumen (Redelius, Lu and Isacsson, 2002).
3.2.2. Foamed bitumen characterisation (Paper II)
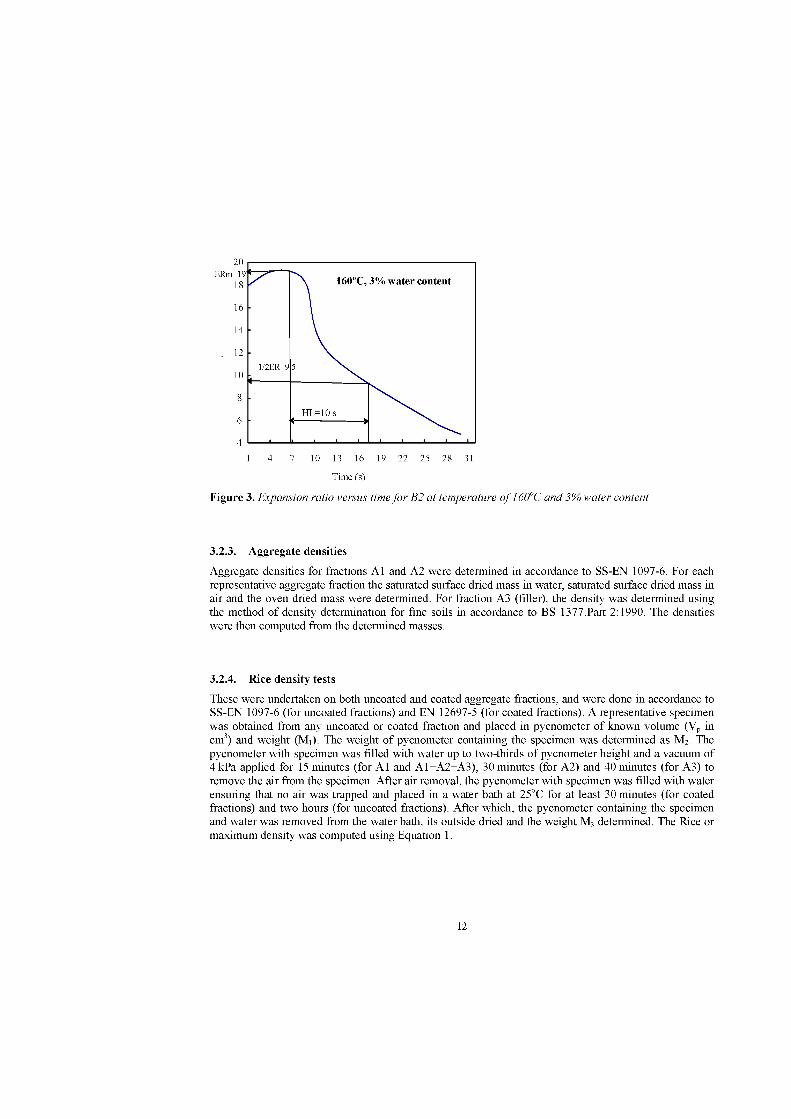
Foamed bitumen was characterised with maximum expansion ratio and half-life parameters. Liquid bitumen of 500 g mass at a given temperature was mixed with a given quantity of foamant water under an air pressure in an expansion chamber of the foam plant equipment to produce foamed bitumen. The bitumen temperature was varied from 150oC up to 180oC in increments of 10oC. While the foamant water content (FWC) was varied from 1% up to 5% in increments of 1%. Air and water pressures were maintained at 0.5 and 0.6 bars respectively. A dipstick with five marks each mark representing an expansion ratio was placed in the foam immediately after foam dissipation. Video clips of the foamed bitumen were recorded using a digital camera and later analysed in order to deduce the maximum expansion ratio and half-life. Maximum expansion ratio (ERm) and half-life (HL) values were deduced from plots of expansion ratio versus time as shown in Figure 3. ERm and HL at a given bitumen temperature were in turn plotted against FWCs, in order to obtain the optimum foamed conditions and characteristics.

13
mm w
3 2 1mm
p 3 2
w3Where: rature in kg/m
M -MV M -M
-1000
is the Rice density,All weights were determined in grammes.
Table 4 summarises the test matrix employed in determination of Rice densities for both uncoated and coated aggregate fractions.
Table 4. Test matrix for Rice density tests on un coated and coated aggregate fractions
Binder Aggregate fractionA1 A2 A3 A1+A2+A3
None x x x XFB1 x x x XFB2 x x x XFB3 x x x X
Control x x x Xx: at least three replicates
3.2.5. Surface energy tests
The Wilhelmy Plate method was used to determine the contact angle and thus the surface energy of foamed bitumen. Foamed bitumen was produced from bitumen B2 at 4.5% bitumen content, bitumen temperature of 160oC and 2% foamant water content. Clean glass slides (24 mm by 40 mm) were immersed in foamed bitumen and conditioned by storage in desiccators for 24 hours. The glass slides were then mounted in the Wilhelmy Plate device and the test started. Slides where immersed in a probe liquid with known surface energy properties for contact angle determination. Three probe liquids namely, deionised water, glycerol and diiodomethane were used. The bitumen coated slides were dipped 5 mminto and retracted from each of the three probe liquids. Graphs of slide mass against depth of immersion during the immersion and retraction stages of the test were plotted. Using the manual option, smooth portions of the graphs were selected to compute the contact angles. At the end of the test, the stage was lowered in order to remove the slide from the probe liquid and discarded. Three slides were tested with each probe liquid. The above procedure was repeated with slides coated with neat bitumen for comparison purposes.
3.2.6. Laterite gravel tests
Physical and chemical characterisation tests were done on the laterite gravels, Table 5 summarises thephysical tests.

14
Table 5. Physical tests for laterite gravels based on British Standards
Test Standard Parameter
Natural moisture content BS 1377: Part 2:1990 Moisture contentParticle density BS 1377: Part 2:1990 Particle density
pH BS 1377: Part 3: 1990 pH
Sieve analysis BS 1377: Part 2: 1990 Percentage passing a given sieve sizeAtterberg limits BS 1377: Part 2:1990 Liquid limit, plastic limit & plasticity
indexModified Proctor compaction BS 1377: Part 4:1990 Optimum moisture content and
maximum dry densityCalifornia Bearing Ratio BS 1377: Part 4:1990 Soaked CBR
Chemical testsChemical tests were done to determine the chemical composition of laterite gravels. X-ray fluorescence (XRF) techniques were used. These showed that the gravels mainly consisted of iron oxide, silica, aluminium oxide and traces of titanium and manganese (see Table 6). These mineral compounds are typical constituents of laterites (Alexander and Cady, 1962; Maignien, 1966; Prescott and Pendleton, 1966; Charman, 1988). Laterite gravel L1 contained the highest amount of iron oxide followed by L2 and L3 (see Table 6). L3 contained the highest amount silica followed by L1 and L2. The silica- sesquioxide ratio which combines all the major chemical compositions (silica, iron and aluminium oxides) for all gravels was less than 2 (Table 6). This ratio being less than 2 indicates that the gravels are true laterites (Gidigasu, 1976; Charman, 1988).
Table 6. Chemical composition for laterite gravels
Component Unit Laterite gravelL1 L2 L3
Iron oxide (Fe2O3) % 65.6 51.2 44.8
Aluminium oxide (Al2O3) % 10.5 19.3 19.8
Silica (SiO2) % 26.6 22.2 32.1
Titanium (TiO2) % 1.00 1.00 1.16
Manganese oxide (Mno2) % 0.02 0.02 0.03
Silica-sesquioxide ratio, Kr = SiO2/(Fe2O3 + Al2O3)
0.350 0.315 0.497
pH 6.31 5.93 5.70

15
3.2.7. Gyratory compaction (Paper III)
Foamed bitumen mixes consisting of laterite gravels and foamed bitumen (produced from binder B2) where prepared at 4.5% bitumen content and 75% of OMC (optimum moisture content of the gravels only) as mixing water content. Mixes were compacted at the OMC using a gyratory compactor at a vertical pressure of 600 kPa, and an angle of gyration of 1.25o up to 200 gyrations. Plots of the average compaction height versus number of gyrations were done and curves fitted using regression analysis.
Since application of the original locking point as defined by Vavrik and Carpenter (1998) did not yield any definite number of gyrations, a modified locking point was proposed. This modified locking point was defined as the point at which the resistance to compaction was greatest, and thus was used to establish the number of gyrations at which the mixes achieved maximum aggregate interlock. The rate of change for compaction curve was used as a measure of the state of compaction. Also, gradation analysis using wet sieving was done to assess whether there were any changes in gradation of the gravels after compaction at the modified locking point and after 200 gyrations. In addition, sensitivity analysis of compaction moisture for the different mixes at the number of gyrations that gave the modified locking point was done at 60%, 75%, 90% and 100% of OMC in order to establish the optimal moisture conditions for compaction.
3.2.8. Optimum bitumen content determination (Paper IV)
Aggregate framework3D packing theory concepts were used to divide the aggregate into three structures namely; oversize, primary, and secondary aggregate structures. The gradation for the laterite gravels was analysed, percentage retained at each sieve size was determined. This was followed by determination of the average weighted particle diameter at each sieve size. This average weighted particle diameter was a function of consecutive sieve sizes and volumetric concentrations for these sieve sizes. The primary aggregate structure was taken to constitute aggregate particles whose corresponding sieve sizes were interacting; the interaction was represented by the average weighted particle diameter falling within the required limits. A cut-off sieve size of 1.0 mm was considered to be minimum sieve size for the primary aggregate structure. Also, a minimum concentration of 45% was taken for aggregate particles to constitute the primary structure. The oversize structure was taken as aggregate particles whose sieve size was above the maximum primary structure size. Whilst the secondary structure consisted of aggregate particles whose sieve sizes ranged from the minimum sieve size for the primary structure up to and below 0.063 mm size.
Aggregate structure porosityThe porosity for the primary and secondary aggregate structures were determined using volumetric relationships. The porosity was determined from the ratio of voids volume voids to total volume. For the primary aggregate structure, the void volume consisted of: secondary structure, effective bitumen, air, and residual moisture volumes. Whereas the total volume consisted of the primary aggregate structure and voids volumes. Similarly for the secondary structure, the void volume consisted of: effective bitumen, air, and residual moisture volumes. While the total volume for the secondary aggregate structure consisted ofthe secondary structure and voids volumes.
Bitumen contentTwo criteria were used in establishing the bitumen content of a given foamed bitumen mix. By considering the variation of primary structure porosity versus bitumen content, the bitumen content that

16
gives 50% primary structure porosity was taken as the minimum bitumen content. The 50% porosity was taken as the median value for a 45-55% range recommended by e.g. Lambe and Whitman (1979). Further, by considering the variation of primary structure porosity versus indirect tensile strength (ITS), the ITS values corresponding to 50% porosity were noted, these were compared against the recommended minimum ITS values. If the ITS values corresponding to 50% porosity exceed the minimum ITS values, the corresponding bitumen contents are noted from the plots showing the variation of ITS versus bitumen content.

17
4.0. RESULTS, ANALYSIS AND DISCUSSION (II-IV)
4.1. Foaming effects on binder chemistry (Paper II)
The Fourier transform infrared spectra obtained for neat and foamed bitumen samples coincided over the entire wave number range from 4000 to 400 cm-1 for both binders tested (Figure 4). Analysis of the spectra revealed that there were no significant differences in carbonyl and sulphoxide peak areas for neat and foamed specimens for all the bitumens studied. Carbonyl and sulphoxide compounds are indicative of bitumen ageing. The carbonyl peak occurred at around 1700 cm-1 wave number and sulphoxides at
1030 cm-1 for both bitumens.
Figure 4. FTIR spectra for neat and foamed bitumen for B2 and B3
From these results, it was deduced that the production process of foamed bitumen did not lead to any chemical functional group compositional changes within the binder. This could be attributed to short time periods the bitumen is exposed to water and air in the foam plant, which may not be enough to cause ageing to occur within the binder. Hot bitumen was exposed to air and water in the expansion chamber of the foam plant for average time of 3.8 seconds. Further, these results could imply that foaming might be a physical process, involving physical forces such as exchange of thermal energy, surface tension and does not involve any chemical changes of the bitumen. However, if the binder were exposed to the ageing promoters (air and water in this case) for longer time periods then binder ageing is expected to occur, as exposure time to ageing promoters is one of the factors that influences binder ageing (Read and Whiteoak, 2003). Studies by Twagira and Jenkins (2009) on ageing of bituminous stabilised materials revealed that short term ageing would occur in foamed bitumen if bitumen was circulated in the foam plant for longer time periods (more than eight hours) whilst at high temperatures (between 170°C and 180°C).
0.00
0.05
0.10
0.15
0.20
0.25
0.30
0.35
0.40
0.45
0.50
5001 0001 5002 0002 5003 0003 5004 000
Abs
orba
nce
Wave number (cm-1)
B2- Neat B2- Foamed
0.00
0.05
0.10
0.15
0.20
0.25
0.30
0.35
0.40
0.45
0.50
5001 0001 5002 0002 5003 0003 5004 000
Abs
orba
nce
Wave number (cm-1)
B3- Neat B3- Foamed

18
4.2. Foamed bitumen characteristics and conditions (Paper II)
4.2.1. Effects of bitumen temperature, foamant water content and binder source
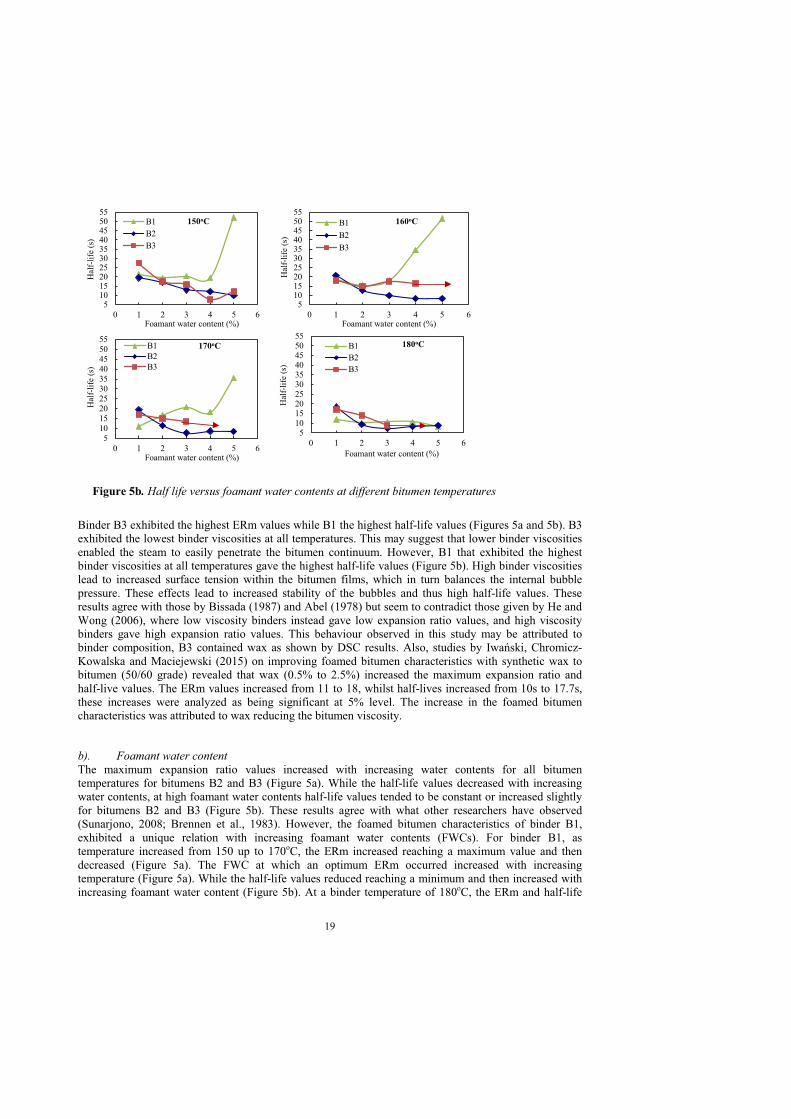
a). Bitumen temperatureAs the bitumen temperature was varied from 150oC to 180oC, maximum expansion ratio values (ERms)increased while the half-life values (HL) reduced for all binders (Figures 5a and 5b). This could be attributed to more thermal energy being made available to convert water into steam as bitumen temperature increased. This in turn led to production of more bubbles and thus high expansion ratio values. The reduction in half-life values as the temperature increased can be explained by lower surface tension forces within bitumen bubble films (as a result of reduced binder viscosity) that are exceeded by the internal steam pressure (Jenkins, 2000; Sunarjono, 2008). Also, due to the likelihood of many bubbles touching each other frequently, small bubbles are absorbed by the larger ones which leads to lamellae (of larger bubbles) thinning and thus rupture (Sunarjono, 2008).
Figure 5a. Maximum expansion ratio versus foamant water content at different bitumen temperatures
5101520253035
0 1 2 3 4 5 6
Expa
nsio
n ra
tio
Foamant water content (%)
150oCB1B2B3
5101520253035
0 1 2 3 4 5 6
Expa
nsio
nra
tio
Foamant water content (%)
160oCB1B2B3
5
10
15
20
25
30
35
0 1 2 3 4 5 6
Expa
nsio
n ra
tio
Foamant water content (%)
170oCB1B2B3
5
10
15
20
25
30
35
0 1 2 3 4 5 6
Expa
nsio
n ra
tio
Foamant water content (%)
180oCB1B2B3
19
Figure 5b. Half life versus foamant water contents at different bitumen temperatures
Binder B3 exhibited the highest ERm values while B1 the highest half-life values (Figures 5a and 5b). B3 exhibited the lowest binder viscosities at all temperatures. This may suggest that lower binder viscosities enabled the steam to easily penetrate the bitumen continuum. However, B1 that exhibited the highest binder viscosities at all temperatures gave the highest half-life values (Figure 5b). High binder viscosities lead to increased surface tension within the bitumen films, which in turn balances the internal bubble pressure. These effects lead to increased stability of the bubbles and thus high half-life values. These results agree with those by Bissada (1987) and Abel (1978) but seem to contradict those given by He and Wong (2006), where low viscosity binders instead gave low expansion ratio values, and high viscosity binders gave high expansion ratio values. This behaviour observed in this study may be attributed to binder composition, B3 contained wax as shown by DSC results. Also, studies by , Chromicz-Kowalska and Maciejewski (2015) on improving foamed bitumen characteristics with synthetic wax to bitumen (50/60 grade) revealed that wax (0.5% to 2.5%) increased the maximum expansion ratio and half-live values. The ERm values increased from 11 to 18, whilst half-lives increased from 10s to 17.7s, these increases were analyzed as being significant at 5% level. The increase in the foamed bitumen characteristics was attributed to wax reducing the bitumen viscosity.
b). Foamant water contentThe maximum expansion ratio values increased with increasing water contents for all bitumen temperatures for bitumens B2 and B3 (Figure 5a). While the half-life values decreased with increasing water contents, at high foamant water contents half-life values tended to be constant or increased slightlyfor bitumens B2 and B3 (Figure 5b). These results agree with what other researchers have observed (Sunarjono, 2008; Brennen et al., 1983). However, the foamed bitumen characteristics of binder B1, exhibited a unique relation with increasing foamant water contents (FWCs). For binder B1, astemperature increased from 150 up to 170oC, the ERm increased reaching a maximum value and then decreased (Figure 5a). The FWC at which an optimum ERm occurred increased with increasing temperature (Figure 5a). While the half-life values reduced reaching a minimum and then increased with increasing foamant water content (Figure 5b). At a binder temperature of 180oC, the ERm and half-life
510152025303540455055
0 1 2 3 4 5 6
Hal
f-life
(s)
Foamant water content (%)
150oCB1B2B3
510152025303540455055
0 1 2 3 4 5 6
Hal
f-life
(s)
Foamant water content (%)
160oCB1B2B3
510152025303540455055
0 1 2 3 4 5 6
Hal
f-life
(s)
Foamant water content (%)
170oCB1B2B3
510152025303540455055
0 1 2 3 4 5 6
Hal
f-life
(s)
Foamant water content (%)
180oCB1B2B3

20
values increased and decreased, respectively, with increasing foamant water contents (Figures 5a and 5b).This behaviour may be attributed to lack of enough heat energy to convert a substantial amount of water into steam, it was visually observed that less steam was expelled during foam collapse at temperatures less than 180oC. Also, from this behaviour it can be deduced that there seems to be a viscosity related limit on the ERm at any given temperature for binder B1.
Further, analysis of actual foamant water converted into steam using the Universal gas law revealed that not all foamant water was converted into steam for all the bitumens used in the study. Generally bitumen B3 exhibited the highest amount of water converted into steam at foamant water contents above 2%, and thus gave the highest ERm values.
c). Binder sourceAlthough, bitumens B2 and B3 were obtained from different sources, they exhibited similar foam behaviour unlike B1 that was obtained from the same source as B2. This may suggest that the grade or viscosity mainly influenced the foamed bitumen characteristics. Also, the presence of wax within the binder B3 seems to enhance its foamed bitumen characteristics as this binder B3 yielded the highest ERmvalues.
4.2.2. Optimum foamed bitumen characteristics and conditionsThe bitumen temperature and foamant water content that can lead to production of foam with the highest ERm and half-life values are desired. Attempts to apply the foam index (FI) as suggested by Jenkins (2000) to deduce optimum bitumen temperature and foamant water content that would yield optimum foamed bitumen characteristics and conditions were futile. Figure 6 shows the variation of FI with foamant water content and bitumen temperature. From Figure 6 it is clear that the FI varied differently with various temperatures and foamant water contents. No clear trends were obtained as a result it could not be used to deduce optimum foamed bitumen conditions.
Figure 6. Foam index versus FWC and bitumen temperature
20
30
40
50
60
70
80
90
100
110
120
0 1 2 3 4 5 6
Foam
Inde
x (s
econ
ds)
Foamant water content (%)
B2 150oC160oC170oC180oC
20
30
40
50
60
70
80
90
100
110
120
140 150 160 170 180 190
Foam
Inde
x (s
econ
ds)
Temperature (oC)
B2 1%2%3%4%5%


22
Table 7. Summary of optimum foaming conditions by Wirtgen approach
Bitumen Bitumen Temperature
(oC)
Foamant water content (%)Expansion ratio (15)
Half life (16 s)
Average
B1 160 3.0 2.2 3B2 150 1.6 2.3 2B3 150 1.4 3 2
NOTE:- Average foamant water contents were rounded off to the nearest whole number.
Further, it can be deduced that the optimum binder temperatures (Table 7 and Figure 8) exhibit viscosities that lie within or near the recommended binder viscosity (0.15-0.19 Pas) range suitable for mixing with the aggregates (ASTM D2493). This may suggest that foaming at or near the equi-viscous temperatures leads to foam with optimum characteristics.
Figure 8. Bitumen viscosity versus temperature
Therefore, considering variation of foamed bitumen characteristics (ERm and HL) at or near the equi-viscous temperature, the optimum foamant water content is taken at the point where the break in the ERmversus FWC curve first occurs. The ERm and HL values at this FWC are obtained and checked against the recommended values, see Figures 9 and 10. The values of the foamed bitumen characteristics obtained using this method are summarised in Table 8.
0.01
0.1
1
130 140 150 160 170 180 190
Vis
cosi
ty (P
a.s)
Temperature (oC)
B1 B2
B3
Mixing range (0.15-0.19 Pas)


24
The optimum FWCs obtained for the bitumens using the equi-viscous approach (Table 8) agree with those obtained by the Wirtgen approach (Table 7). Thus determining the foamed bitumen characteristics (ERm and HL) at or near the equi-viscous temperature could lead to foamed bitumen that exhibitsoptimum characteristics. Interestingly, when the equi-viscous approach is applied to Sunarjono’s results (2008) (see Paper V), it yields acceptable ERm and HL values in view of Wirtgen’s (2004) guidelines for ERm and HL.
4.3. Aggregate particle coating (Paper II)
4.3.1. Rice density resultsThe Rice densities for the different coated aggregate fractions are summarised in Table 9a. As expected, for all binders, the Rice densities for coated fractions were less than the maximum densities of the uncoated aggregate fractions; implying that all fractions were coated with the binder to some extent.Aggregate fraction A1 (coarse) gave the highest Rice density followed by A2 (sand) and A3 (filler) the lowest for all binders. This implies that most of the binder was concentrated in A3 compared to fractions A1 and A2.
Table 9a. Rice densities for coated aggregate fractions
Binder Rice density (kg/m3)Aggregate fraction
A1 A2 A3 A1 + A2 + A3No binder 2646 2672 2749 2678
FB1 2579 2372 2287 2350FB2 2614 2386 2285 2391FB3 2573 2369 2294 2307
HMA 2320 2319 2287 2319
For foamed bitumen binders, the coated aggregate filler fraction A3 gave the lowest density followed by A1 +A2 +A3 (fraction with coarse, sand and filler particles), A2 (sand) and A1 (coarser fraction) with the highest Rice density (Table 9a). The difference in Rice densities across the aggregate fraction was significant at 5% level. Since lower Rice densities are indicative of higher bitumen amounts and higher Rice densities lower bitumen amounts within a given coated aggregate fraction, this implies that most of the binder was concentrated within the filler fraction for foamed bitumen binders. Also, probably due to the differences in aggregate sizes, the smaller (filler) fraction easily attaches itself to the foamed bitumen bubbles unlike say the coarse fraction. The large size of the coarse particles may cause the foamed bitumen bubbles to burst easily when they come into contact with the aggregate particles. This in turn may lead to rapid steam condensation forming water onto the aggregate surfaces, with the water on the aggregate surfaces, making these particles hydrophobic to the binder. However, this is still a hypothesis.
Statistical analysis of differences in Rice densities for aggregate fractions coated with foamed bitumen binders, showed that there were no significant differences in Rice densities across the different foamed bitumen binders (p value of 0.13 exceeded 0.05, see Table 9b) at 5% significant level. However, significant differences occurred across the different aggregate fractions (p value of 0.00 was less than 0.05, see Table 9b) at 5% significant level. This may suggest that the aggregate fraction size mainly influenced the Rice densities and thus the aggregate coating.

25
Table 9b. ANOVA analysis Rice densities for aggregate fractions & foamed bitumen binders
Source of Variation SS df MS F p-value F critFoamed bitumen binders 2304.62 2 1152.31 2.87 0.13 5.14
Aggregate fractions 153538.3 3 51179.42 127.54 0.00 4.76Error 2407.76 6 401.29Total 158250.6 11
When the coarser fraction A1 was heated (see Table 9a for the HMA), the Rice density on average reduced by 10% compared to A1 coated with foamed bitumen. This may be explained by the temperature effect, the hot coarser aggregate fraction A1 takes more binder when heated than when at room temperature. Further, for the hot mixed aggregate fractions (HMA), there were no significant differences in Rice densities for the different aggregate fractions.
Theoretical binder film thicknessThe theoretical binder film thickness was computed as a function of effective binder volume, aggregate surface area and weight, see Equations 2 up to 5 (Roberts et al., 1996). From the Rice density values, the corresponding aggregate effective densities, and effective binder volume (total volume of the binder less amount absorbed) were computed. This effective binder volume was used to estimate the theoreticalbinder film thickness for each of the aggregate fractions.
se ww
mm bit
w mm
1 - bEffective density, [2]b -
Where: b is the bitumen content by total weight of the mix,
bit
se sbba bit
se sb
re water and Rice densities respectively, G is the binder specific gravity.
Binder absorbed by aggregate weight (%), P = 100 [3]
bit sb
eff t abs
Where: densities respectively.
Effective volume, V = V - V
t abs
eff
agg
[4]Where: V , V are binder total and absorbed volumes respectively.
1000VTheoretical film thickness, t( m)= SA W
agg
[5]
Where: SA is the aggregate surface area, W is the aggregate weight.
The computed theoretical film thicknesses are summarised in Table 10a. The coarse aggregate fraction, A1, seems to exhibit the highest film thickness followed by the sand fraction, A2, and then the filler, A3 for both foamed and hot mixed bitumens. However, these results seem to contradict those predicted by the

26
Rice densities, which show that for foamed bitumen, the coated fraction A3 possesses a higher film thickness since most of the binder seems to be concentrated within this fraction. This may be explained by the smaller aggregate surface area for the coarser fractions which gives higher film thickness. While the higher aggregate surface area for the finer fraction tends to reduce the thicknesses.
Theoretical film thicknesses by the HMA fractions (that acted as the control) are higher than those exhibited by foamed bitumen binders (Table 10a). In addition, coated aggregate fractions A1 and A2 with foamed bitumen binders FB1 and FB3 exhibited higher film thicknesses than those with FB2. This can be explained by the high expansion ratio (for FB3) and viscosity (for B1) values, which lead to thicker film thicknesses onto the aggregate particles.
Table 10a. Summary of binder film thicknesses
Binder Theoretical binder film thickness ( m)
Aggregate fractionA1 A2 A3 A1+A2+A3
FB1 35.97 5.91 2.94 9.42FB2 31.32 5.73 2.95 9.08FB3 36.89 5.96 2.89 10.36
HMA(control)
75.07 6.66 2.94 10.63
Statistical analysis using two way ANOVA revealed that significant differences at 5% level existed in binder film thickness across the various aggregate fractions at any given binder (p value of 0.00 was less than 0.05, see Table 10b). However, no significant differences occurred in binder film thicknesses across the binders at any given aggregate fraction (p value of 0.39 was greater than 0.05, see Table 10b). These results are in agreement with those of Rice densities, which revealed that the aggregate fraction mainly influenced the Rice density. Also, there were no significant differences in theoretical film thicknesses for the coated fine aggregate fractions A2 and A3 for all binders. These results may suggest that aggregate particle coating is mainly influenced by the aggregate particle size.
Table 10b. ANOVA analysis for binder film thicknesses
Source of Variation SS df MS F p-value F critBinders 339.86 3 113.29 1.13 0.39 3.86
Aggregate fractions 4548.69 3 1516.23 15.15 0.00 3.86Error 900.98 9 100.11Total 5789.54 15
Comparison of film thicknesses for coated aggregate fractions with foamed bitumens with those exhibited by the control (HMA), it can be deduced that on average the thickness for A1 were 50%, 90% for A2, and 100% for A3, (these percentages are expressed as a proportion of the corresponding control film thicknesses). This may imply that when film thickness is employed as a design criterion in foamed bitumen mix design, then only the aggregate surface area of size 2.36mm and less need to be considered in computation of the aggregate surface area, this is according to the aggregate tested.

27
Also, the benefit of heating aggregates seems to be significant for coarser aggregates, as the film thickness for control is twice thicker than for the foamed bitumen coated fraction, A1. For finer particles, aggregate temperature does not appear to affect the film thickness. Instead for this fraction the surface area mainly influences the film thickness.
4.3.2. Surface energy resultsThe summary of advancing contact angles obtained with three probe liquids, and the computed surface energy components for bitumen and foamed bitumen are shown in Table 11. Foamed bitumen gave lower advancing contact angles and higher surface energy components compared to those obtained with neat bitumen (Table 11). This may suggest that as bitumen is foamed its adhesive abilities are improved, since low contact angles and high surface energy components indicate good wetting.
Table 11. Summary of Contact angles and Surface energy components
Specimen Advancing contact angles (o) Surface energy (10-3 N/m)Liquid LW - +
Deionised water
Glycerol Diiodomethane
Bitumen (B2) 95.4 90.0 53.8 29.43 2.31 0.00 29.43Foamed bitumen at maximum expansion
80.2 59.1 34.1 38.85 2.35 1.29 42.33
Foamed bitumen after collapse*
93.1 79.8 47.3 32.72 1.85 0.03 33.19
NOTE: *: slides were coated after steam expulsion. LW is Lifshitz-van der waals, - is the base, + is the acid and total surface energy components respectively.
After foam collapse, the contact angles increased and surface energy components decreased, tending towards those for neat bitumen. This implies that after collapse foamed bitumen tends to possess similar adhesive abilities as those of neat bitumen. Also, an increase in the polar component is observed as the bitumen is foamed. This increase in the polar component may result from the water that is produced from steam condensation and the liquid water that still exists within the foam. This can be further supported by computation estimates of water converted into steam and moisture loss results (Paper II), not all water is converted into steam and thus some water still exists within the foam. The possibilities of steam condensation occurring around the glass plate during the sampling exercise for foamed bitumen specimens were considered to be negligible. However, further research is required to quantify the effects of steam condensation on the polar component of foamed bitumen.
By combining the surface energy values obtained in Table 11 with typical surface energy values of granite aggregates, LW = 56.34, + = 43.59, - = 782.71 (10-3 N/m), (Masad et al., 2006), the work of cohesion, work of adhesion (in wet and dry conditions) and compatibility ratio between the bitumen or the foamed bitumen and aggregate fractions were computed (Table 12).

28
Table 12. Summary of Work of Cohesion and Adhesion, Compatibility ratio
Binder Work of cohesion
(10-3
N/m)
Work of adhesion (10-3 N/m) Compatibility ratio
For foamed bitumen
In dry conditions
In wet conditions
a b c d e = -c/dNeat bitumen (B2) 58.86 101.51 -238.22 0.43Foamed bitumen at
maximum expansion
84.66 241.47 177.36 -181.52 0.98
Foamed bitumen after collapse
66.38 303.26 113.52 -229.10 0.50
Note: LW, + and - for water were taken as 21.8, 25.5, 25.5 (10-3 N/m) respectively (Hefer et al., 2006). Negative sign indicates release of energy.
The work of cohesion was computed from Equation 6:
LW
A A A A A
A
A A A
W 2 [6]
Where: W is the work of cohesion,
, base components of the material respectively.
The work of adhesion between foamed bitumen and aggregate was computed from equation 7:
ly.respective water,andaggregatesbitumen,foamedrefer to wandAf,subscripts:Where2222222222W
7 W
wA-wAw
-fwfAfA
-f
LWw
LWf
LWf
LWA
LWw
LWAfAf
AwfwfAAf
The work of adhesion between bitumen and aggregate in dry conditions was computed from equation 8:
LW LW
AB A B AB A B A B A B
AB
A B
W [8]
Where: W is the work of adhesion between aggregates and bitumen,
,
AB
LW LW
A B
ergy for aggregates and bitumen, respectively,
egates and bitumen,
components for aggregates and bitumen, respe,
A B
A B
ctively,
y for aggregates and bitumen, respectively,
y for , respectively.
,
, aggregates and bitumen

29
The work of adhesion between bitumen and aggregate in wet conditions was computed from equation 9:
ABw Aw Bw AB= [9]
Where: subscripts A, B, w refer to aggregates, bitumen and wat
W
Aw Bw AB
er respectively,
y between materials represented by the subscripts.
It was assumed that the surface energy was independent of the aggregate size.
Foamed bitumen at maximum expansion gave higher values of work of cohesion and adhesion,compatibility ratio compared to those by neat bitumen (Table 12). This may suggest that foamed bitumen exhibits better coating abilities than neat bitumen. However, no statistical analysis could be made to assess whether these differences were significant, since no replicate samples of foamed bitumen were tested during surface energy measurements.
The magnitude of work of adhesion in wet conditions for the foamed bitumen at maximum expansion is less than that for bitumen and foamed bitumen at collapse. It is desired that this work of adhesion in wet conditions be as low as possible, so as to reduce the displacement of the binder from the aggregate surface (Bhasin and Little, 2007). This may suggest that foamed bitumen at maximum expansion may offer a better resistance to water displacement than neat bitumen. On the other hand, the work of adhesion in wet conditions for foamed bitumen after collapse is similar to that for neat bitumen. This implies that after foam collapse, when a greater portion of water in form of steam has escaped, the foamed bitumen tends to behave like neat bitumen.
4.4. Compaction characteristics of foamed bitumen treated materials (Paper III)
a). Locking pointThe locking point concept as defined by Vavrik and Carpenter (1998) was modified to yield definite number of gyrations. The modified locking point was defined as the first point at which two gyrations at the same gradient of slope for the compaction curve were preceded by two gyrations at same gradient of slope. The compaction curve was defined by the relation of average compaction height versus number of gyrations. For all laterite gravel-foamed bitumen mixes studied, the compaction height decreased rapidly during the initial number of gyrations and then became linear indicating that the rate of change compaction had decreased (Figure 11). From visual observations, it was deduced that the point at which the compaction curve became linear occurred after 50 gyrations. Thus, the points before 50 gyrations aided in identifying the locking points for the different mixes.
The compaction curve defined in terms of height versus number of gyrations for all the three foamed bitumen laterite gravel mixes could be best fitted with a logarithmic relation (Figure 11). From these relations, the gradient of slope expressed as a second derivative was determined at each number of gyrations. The modified locking point was taken as the first point at which two gyrations at same gradient of slope were preceded with two gyrations with the same value of gradient of slope. The number of gyrations at which locking was achieved are summarised in Table 13a. The number of gyrations for the mixes at which maximum interlock was achieved varied from 40 to 46. At this number of gyrations it would imply that if such a material were to constitute a pavement, then the material would be stable within the pavement.

30
Figure 11. Average compaction height versus number of gyrations for mixes
Table 13a. Locking points for the different gravels
Laterite gravels
Locking point (No. of
gyrations)L1 45L2 46L3 40
Gradation analysis using wet sieving at the number of gyrations that gave the modified locking point showed that there was hardly any aggregate particle break aggregate down for L3 at 40 gyrations, (Figure 12a). While aggregate particle break down occurred for L1 and L2 laterite gravels at 45 and 46 gyrations respectively, (Figure 12a). Further, gradation analysis at 200 gyrations using wet sieving showed that there was aggregate particle break down for all the gravels studied, (Figure 12b).
In addition, gradation analysis using wet sieving at 44 gyrations (the average of the modified locking point for all gravels); showed that hardly any aggregate particle break down occurred for L3, (Figure 12a). While for L1 and L2 aggregate particle break down still occurred, (Figure 12a). Hence, even if the number of gyrations are further reduced for L1 and L2, still aggregate particle break down would occur. It should be noted that although aggregate particle break down occurred for L1 and L2 at their modified locking points, this break down was lower than that which occurred at 200 gyrations.
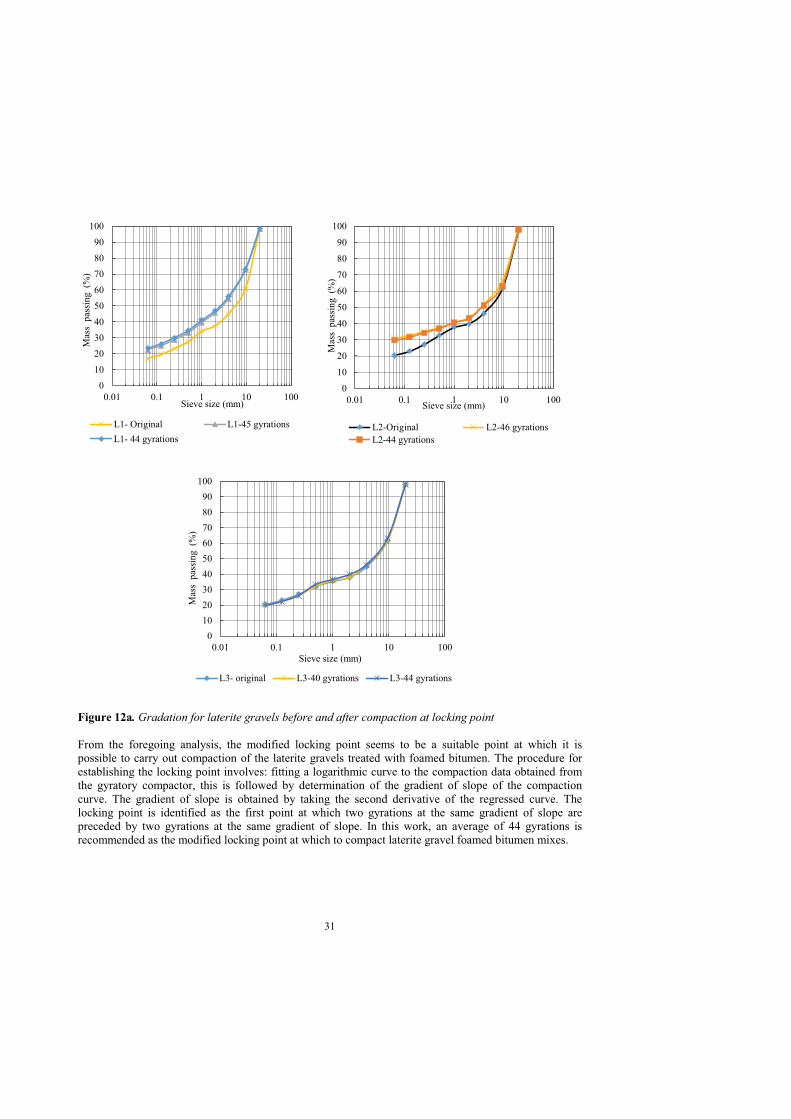
31
Figure 12a. Gradation for laterite gravels before and after compaction at locking point
From the foregoing analysis, the modified locking point seems to be a suitable point at which it is possible to carry out compaction of the laterite gravels treated with foamed bitumen. The procedure for establishing the locking point involves: fitting a logarithmic curve to the compaction data obtained from the gyratory compactor, this is followed by determination of the gradient of slope of the compaction curve. The gradient of slope is obtained by taking the second derivative of the regressed curve. The locking point is identified as the first point at which two gyrations at the same gradient of slope are preceded by two gyrations at the same gradient of slope. In this work, an average of 44 gyrations is recommended as the modified locking point at which to compact laterite gravel foamed bitumen mixes.
0
10
20
30
40
50
60
70
80
90
100
0.01 0.1 1 10 100
Mas
s pa
ssin
g (%
)
Sieve size (mm)
L1- Original L1-45 gyrationsL1- 44 gyrations
0
10
20
30
40
50
60
70
80
90
100
0.01 0.1 1 10 100
Mas
s pa
ssin
g (%
)
Sieve size (mm)
L2-Original L2-46 gyrationsL2-44 gyrations
0102030405060708090
100
0.01 0.1 1 10 100
Mas
s pa
ssin
g (%
)
Sieve size (mm)
L3- original L3-40 gyrations L3-44 gyrations

32
Figure 12b. Gradation for laterite gravels before and after compaction at 200 gyrations
b). Compaction optimum moisture contentThe dry density increased as the moisture content increased reaching a maximum and then decreased with increasing moisture content. From the plots of dry density versus moisture content at modified locking points, the moisture content that gave the maximum dry density was taken as the optimum compaction moisture content for a given mix. The optimum compaction moisture content at the modified locking points of 45, 46 and 40 gyrations, varied from 86% up to 92% of OMC (optimum moisture content of the gravels only) for the different mixes (Table 13b). It can be observed that optimum compaction moisture content for compaction is less than the OMC for all the gravels tested, this shows that gyratory compaction of foamed bitumen mixes should be done at moisture conditions below the OMC. Also, the maximum dry densities for the mixes are less that than those for the various laterite gravels only, this can be attributed to the presence of the binder within these mixes that tends to increase the volume which in turn reduces the density. Therefore, future compaction of mixes of laterite gravels and foamed bitumen could be done at the number of gyrations that lead to modified locking point and optimum compaction moisture conditions.
0102030405060708090
100
0.01 0.1 1 10 100
Mas
s pa
ssin
g (%
)
Sieve size (mm)
L1- Original L1- 200 gyrations
0102030405060708090
100
0.01 0.1 1 10 100
Mas
s pa
ssin
g (%
)
Sieve size (mm)
L2-Original L2-200 gyrations
0102030405060708090
100
0.01 0.1 1 10 100
Mas
s pa
ssin
g (%
)
Sieve size (mm)
L3- original L3- 200 gyrations
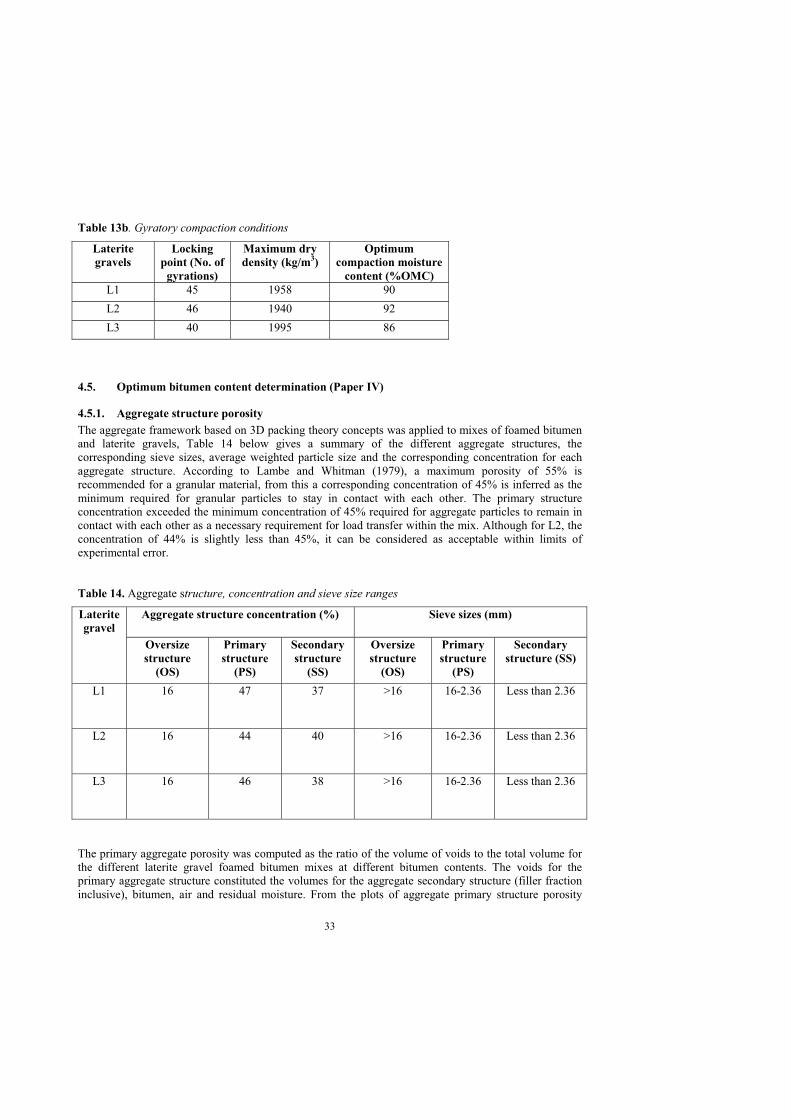
33
Table 13b. Gyratory compaction conditions
Laterite gravels
Locking point (No. of
gyrations)
Maximum dry density (kg/m3)
Optimum compaction moisture
content (%OMC)L1 45 1958 90L2 46 1940 92L3 40 1995 86
4.5. Optimum bitumen content determination (Paper IV)
4.5.1. Aggregate structure porosityThe aggregate framework based on 3D packing theory concepts was applied to mixes of foamed bitumen and laterite gravels, Table 14 below gives a summary of the different aggregate structures, the corresponding sieve sizes, average weighted particle size and the corresponding concentration for each aggregate structure. According to Lambe and Whitman (1979), a maximum porosity of 55% is recommended for a granular material, from this a corresponding concentration of 45% is inferred as the minimum required for granular particles to stay in contact with each other. The primary structure concentration exceeded the minimum concentration of 45% required for aggregate particles to remain in contact with each other as a necessary requirement for load transfer within the mix. Although for L2, the concentration of 44% is slightly less than 45%, it can be considered as acceptable within limits of experimental error.
Table 14. Aggregate structure, concentration and sieve size ranges
Laterite gravel
Aggregate structure concentration (%) Sieve sizes (mm)
Oversize structure
(OS)
Primary structure
(PS)
Secondary structure
(SS)
Oversize structure
(OS)
Primary structure
(PS)
Secondary structure (SS)
L1 16 47 37 >16 16-2.36 Less than 2.36
L2 16 44 40 >16 16-2.36 Less than 2.36
L3 16 46 38 >16 16-2.36 Less than 2.36
The primary aggregate porosity was computed as the ratio of the volume of voids to the total volume for the different laterite gravel foamed bitumen mixes at different bitumen contents. The voids for the primary aggregate structure constituted the volumes for the aggregate secondary structure (filler fractioninclusive), bitumen, air and residual moisture. From the plots of aggregate primary structure porosity
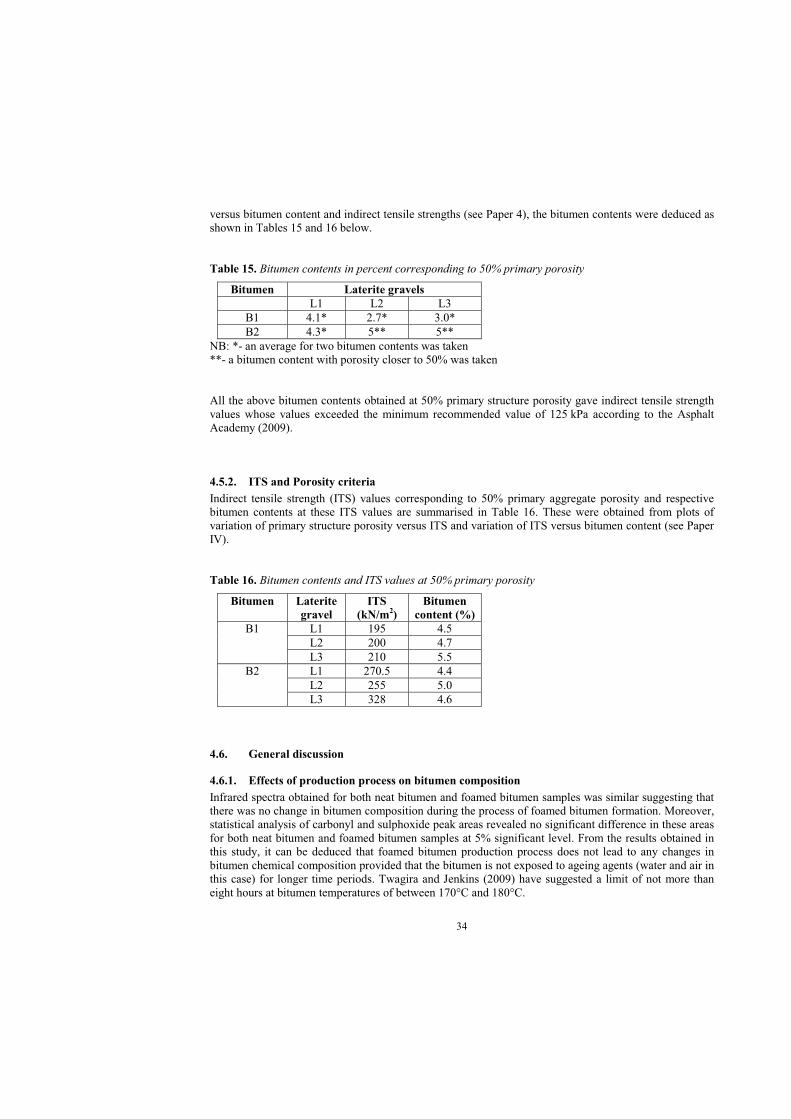
34
versus bitumen content and indirect tensile strengths (see Paper 4), the bitumen contents were deduced as shown in Tables 15 and 16 below.
Table 15. Bitumen contents in percent corresponding to 50% primary porosity
Bitumen Laterite gravelsL1 L2 L3
B1 4.1* 2.7* 3.0*B2 4.3* 5** 5**
NB: *- an average for two bitumen contents was taken**- a bitumen content with porosity closer to 50% was taken
All the above bitumen contents obtained at 50% primary structure porosity gave indirect tensile strength values whose values exceeded the minimum recommended value of 125 kPa according to the Asphalt Academy (2009).
4.5.2. ITS and Porosity criteriaIndirect tensile strength (ITS) values corresponding to 50% primary aggregate porosity and respective bitumen contents at these ITS values are summarised in Table 16. These were obtained from plots of variation of primary structure porosity versus ITS and variation of ITS versus bitumen content (see Paper IV).
Table 16. Bitumen contents and ITS values at 50% primary porosity
Bitumen Laterite gravel
ITS (kN/m2)
Bitumen content (%)
B1 L1 195 4.5L2 200 4.7L3 210 5.5
B2 L1 270.5 4.4L2 255 5.0L3 328 4.6
4.6. General discussion
4.6.1. Effects of production process on bitumen compositionInfrared spectra obtained for both neat bitumen and foamed bitumen samples was similar suggesting that there was no change in bitumen composition during the process of foamed bitumen formation. Moreover, statistical analysis of carbonyl and sulphoxide peak areas revealed no significant difference in these areas for both neat bitumen and foamed bitumen samples at 5% significant level. From the results obtained in this study, it can be deduced that foamed bitumen production process does not lead to any changes in bitumen chemical composition provided that the bitumen is not exposed to ageing agents (water and air in this case) for longer time periods. Twagira and Jenkins (2009) have suggested a limit of not more than eight hours at bitumen temperatures of between 170°C and 180°C.

35
4.6.2. Optimum foamed bitumen conditions and characteristicsAs highlighted in sections 2 and 4.22, methods that are presently available to determine optimum foamed bitumen conditions (bitumen temperature and foamant water content) and characteristics (maximum expansion ratio and half-life) seem not to be adequate. A study on trends of foamed bitumen characteristics (maximum expansion ratio versus foamant water content; half-life versus foamant water content) at various temperatures seem to suggest that if foamed bitumen could be produced at bitumen temperatures closer to the equi-viscous range (Figure 8) then optimum foamed characteristics would be obtained. In addition, the foamant water content that leads to the production of the foam with optimum characteristics can be determined once the corresponding maximum expansion ratio and half-life trends with foamant water content are established. When this approach is applied to results from other researchers acceptable values of maximum expansion ratio and half-life are obtained (see Paper V).
4.6.3. Effects of binder source on foamed bitumen characteristicsBitumens B1 and B2 that were obtained from the same source yielded different trends for maximum expansion ratio versus foamant water content; and half-life versus foamant water content (Figures 5a and 5b). It should be noted that these bitumens B1 and B2 of different grades although they were obtained from different sources yielded similar trends for maximum expansion ratio versus foamant water content; and half-life versus foamant water content (Figures 5a and 5b). Bitumen B3, exhibited the lowest viscosity at bitumen temperatures between 135°C up to 180°C, followed by B2 and B1 had the highest viscosity values (Figure 8). Results from foamed bitumen characteristics (maximum expansion ratio versus foamant water content; and half-life versus foamant water content) seem to reveal that bitumen viscosity rather than source mainly influences foamed bitumen characteristics. Thus, results from this study have yielded some insights into whether binder source influences foamed bitumen characteristics.
4.6.4. Evaluation of aggregate particle coatingAggregate particle coating within foamed bitumen mixes was analysed using Rice densities, theoretical binder film thickness and surface energy. Analysis of Rice densities revealed that bitumen binder was mainly concentrated within the filler fraction as well as the aggregate fraction that constituted all the sizes (both coarse and fine fractions) in the case of aggregate fractions coated with foamed bitumen binders. Further, it was shown through statistical analysis that the aggregate fraction size was the main factor that influenced Rice densities and not foamed bitumen binders. In comparison to Rice densities obtained for aggregate fractions that were prepared as hot mixes, no significant differences in Rice densities occurred at 5% level for all aggregate fractions. In addition, Rice densities for A1 fraction (coarse fraction) when compared with that for A1 fraction mixed with foamed bitumen binders decreased by 10% on average. This was attributed to the temperature effect, increased temperature (in hot mixes) enabled this fraction A1 to be coated with more binder than when it was mixed with foamed bitumen binders at room temperature.
When binder film thickness for each aggregate fraction coated with foamed bitumen binders is compared with that for corresponding control (hot mixed) one, on average binder film thickness for coarse was 50%; for fine fraction was 90%; for filler was 100%; and for the case of coarse, fine and filler fractions combined was 90%. As the aggregate fraction size decreased the proportion of binder film thickness increased for aggregate fractions coated with foamed bitumen binders. In the case of the aggregate fraction constituting coarse, fine and filler fractions, when coated with foamed bitumen the film thickness

36
proportion of 90% was similar to that for fine fraction. This shows the benefit of including all aggregate particle sizes within a given foamed bitumen mix. When all aggregate particle sizes are present in a given foamed bitumen mix, then aggregate particle coating with the binder is improved.
Surface energy results seemed to suggest that foamed bitumen exhibited better wetting (better coating) abilities compared to neat bitumen. Foamed bitumen yielded lower contact angles and higher surface energy components compared to neat bitumen. However, these surface energy results are not conclusive as they were performed on only one bitumen.
Generally, Rice densities and theoretical binder film thicknesses suggested that aggregate particle coating was mainly affected by the aggregate particle size. For the coarse fraction A1, temperature mainly affected the binder film thickness. While for the fine fraction, surface area affected the binder film thickness.
4.6.5. Mix design for foamed bitumen mixesMix design procedures for foamed bitumen mixes are based on those for hot bituminous mixes and yet these categories of mixes are very different. In this study, attempts were made to develop a gyratory compaction procedure based on the concept of locking point and a method to establish the optimum binder content for foamed bitumen mixes based on 3-D packing theory concepts and indirect tensile strength criteria.
Laboratory gyratory compactionThe locking point representing the stage at which maximum aggregate particle interlock is achieved during compaction of mixes. As noted in Paper III, the locking point as originally defined by Vavrik and Carpenter (1998) was modified to determine the number of gyrations at which to compact foamed bitumen laterite gravel mixes using gyratory compaction. This modified locking point was defined as the first point at which two gyrations at the same gradient of slope for compaction curve were preceded by two gyrations at the same gradient of slope. The compaction curve being defined in terms of height versus number of gyrations. For all three foamed bitumen laterite gravel mixes studied, the compaction height decreased rapidly during the first gyrations of compaction and became relatively constant thereafter (this occurred after 50 gyrations) as gyrations increased. This stage of decrease in compaction height represents the expulsion of air voids and aggregate particles coming in close contact to each other as air voids are being expelled. The relatively constant stage of constant height shows that aggregate particles have reached a state of maximum aggregate particle interlock, any further gyrations applied after this stage may thus lead to particles breaking down as a result of the compaction process.
A regressed logarithmic relation was fitted to each compaction curve for each mix and second derivative determined at each number of gyrations; second derivative defined the gradient of slope. The first point at which two gyrations at the same gradient of slope were preceded with two gyrations with the same gradient of slope was taken as the modified locking point (see Paper III). Gradation analysis done at modified locking point gyrations for the different mixes revealed that one gravel, L3 did not undergo aggregate particle break down at this point. Although, the other two gravels L1 and L2 did undergo aggregate particle break down at the modified locking point gyrations, this break down was less than that occurred at 200 gyrations which was the final number of gyrations all mixes were compacted up to. The modified locking points (represented by number of gyrations) for the three mixes studied were 45 for L1; 46 for L2 and 40 for L3; with the average being 44 gyrations. It is interesting to note that all the modified locking points were less than 50 gyrations, it was observed that after 50 gyrations the compaction height was more or less constant.
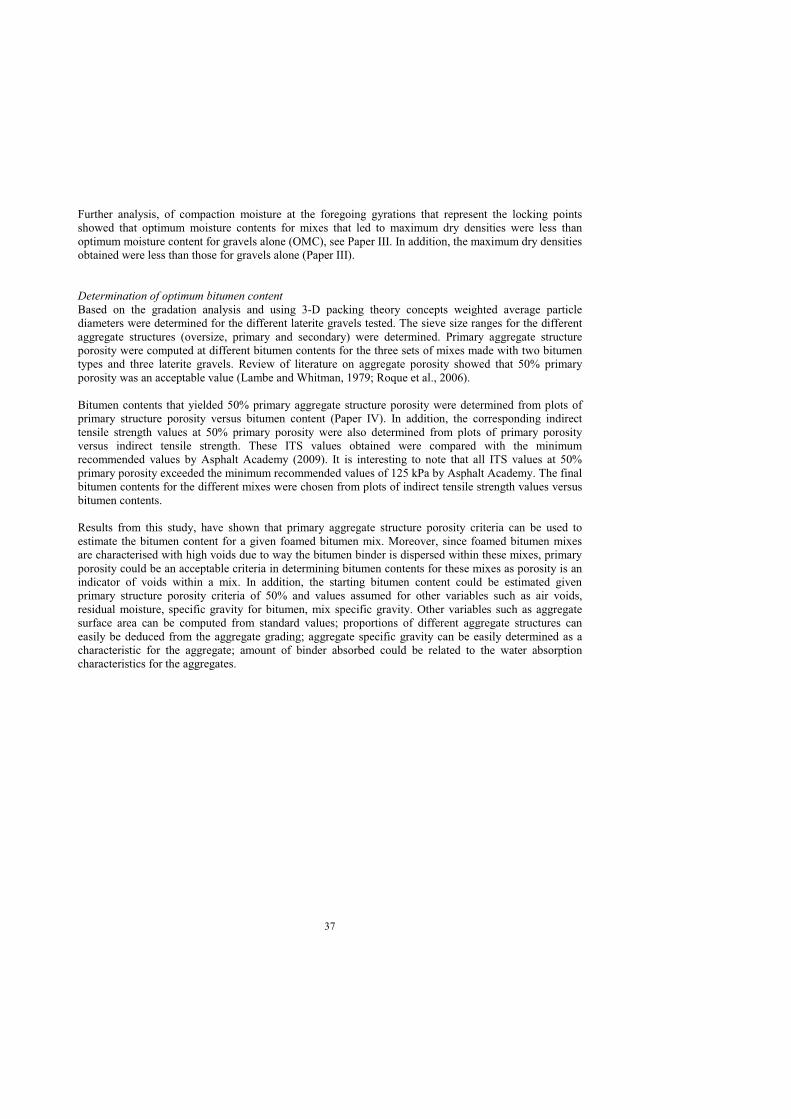
37
Further analysis, of compaction moisture at the foregoing gyrations that represent the locking points showed that optimum moisture contents for mixes that led to maximum dry densities were less than optimum moisture content for gravels alone (OMC), see Paper III. In addition, the maximum dry densities obtained were less than those for gravels alone (Paper III).
Determination of optimum bitumen contentBased on the gradation analysis and using 3-D packing theory concepts weighted average particle diameters were determined for the different laterite gravels tested. The sieve size ranges for the different aggregate structures (oversize, primary and secondary) were determined. Primary aggregate structure porosity were computed at different bitumen contents for the three sets of mixes made with two bitumen types and three laterite gravels. Review of literature on aggregate porosity showed that 50% primary porosity was an acceptable value (Lambe and Whitman, 1979; Roque et al., 2006).
Bitumen contents that yielded 50% primary aggregate structure porosity were determined from plots of primary structure porosity versus bitumen content (Paper IV). In addition, the corresponding indirect tensile strength values at 50% primary porosity were also determined from plots of primary porosity versus indirect tensile strength. These ITS values obtained were compared with the minimum recommended values by Asphalt Academy (2009). It is interesting to note that all ITS values at 50% primary porosity exceeded the minimum recommended values of 125 kPa by Asphalt Academy. The final bitumen contents for the different mixes were chosen from plots of indirect tensile strength values versus bitumen contents.
Results from this study, have shown that primary aggregate structure porosity criteria can be used to estimate the bitumen content for a given foamed bitumen mix. Moreover, since foamed bitumen mixes are characterised with high voids due to way the bitumen binder is dispersed within these mixes, primary porosity could be an acceptable criteria in determining bitumen contents for these mixes as porosity is an indicator of voids within a mix. In addition, the starting bitumen content could be estimated given primary structure porosity criteria of 50% and values assumed for other variables such as air voids, residual moisture, specific gravity for bitumen, mix specific gravity. Other variables such as aggregate surface area can be computed from standard values; proportions of different aggregate structures can easily be deduced from the aggregate grading; aggregate specific gravity can be easily determined as a characteristic for the aggregate; amount of binder absorbed could be related to the water absorption characteristics for the aggregates.

38
5.0. CONCLUSIONS AND RECOMMENDATIONSThis study has addressed some aspects of foamed bitumen technology, such as ageing susceptibility of binder as a result of the foam production process, effect of binder source on foam characteristics, development of a method to determine optimum foam conditions (foamant water content and temperature) and characteristics (maximum expansion ratio and half-life), as well as evaluation of aggregate particle coating with foamed bitumen. In addition, a laboratory gyratory compaction procedurebased on aggregate particle interlock defined in terms of a numerical value has been developed for foamed bitumen mixes. A method to determine optimum binder content based on porosity and indirect tensile strength has been developed.
5.1. Conclusions
Effects of foaming on bitumen composition
Fourier transform infrared techniques revealed that there were no significant changes in carbonyl and sulphoxides functional groups (these groups are indicative of ageing) of the bitumens after foaming. These observations suggest that foaming does not lead to bitumen ageing although factors conducive for ageing exist during the foam production process. This could possibly be attributed to the short period of time the bitumen is exposed to ageing factors (water and air). In this study hot bitumen was exposed to water and air in an expansion chamber of the foam plant for a period of 3.8 s, which may not be long enough to induce significant ageing to the binder.
Optimum foamed bitumen characteristics
i. Foamed bitumen characteristics (expansion ratio and half-life) seemed to be influenced mainly by the viscosity rather than the bitumen source.
ii. A method based on determination of foamed bitumen characteristics at or near the equi-viscous temperature seems to result into optimum foam characteristics. Thus, after binder viscosity determination, the temperature whose viscosity lies within mixing range viscosity (0.15-0.19 Pas) can be taken as the optimum foam temperature. The expansion and half-life versus foamant water content plots are then established for this temperature. The optimum FWC is taken as the point where break in the ER- FWC curve first occurs. The corresponding HL value obtained is checked against the recommended guide values.
iii. Theoretical analysis of the thermal aspects of the foam system has shown that foam temperature is less than bitumen temperature, and also not all foamant water is converted into steam. The assertion that not all foamant water is converted into steam was supported by laboratory results for binders B1 and B2 at 160°C, which revealed that water existed within the foam at maximum expansion and after collapse.
Aggregate particle coating with foamed bitumen
i. Aggregate size fraction seemed to mainly affect the Rice densities and theoretical binder film thickness of the resulting mixes in case of foamed bitumen binders as revealed by the analysis of variance of Rice densities and theoretical film thicknesses.
ii. Foamed bitumen was mainly concentrated in 2.36 mm and less aggregate fractions. Thus, when using film thickness as a criterion in foamed bitumen mix design, only the surface area for these fractions should be considered.

39
iii. When various aggregate particle sizes exist within the aggregate, the binder is then well distributed as illustrated by Rice density results.
iv. Other factors such as maximum expansion ratio of foamed bitumen and binder viscosity influence aggregate particle coating.
v. Aggregate temperature influenced the theoretical film thickness for coarser particles. While for finer particles, the theoretical film thickness was mainly influenced by surface area rather than the temperature.
vi. Surface energy results suggest that foamed bitumen seems to possess better coating attributes compared to neat bitumen. Foamed bitumen exhibited lower contact angles and higher surface energy components compared to those of neat bitumen.
vii. The work of cohesion and adhesion in dry conditions for foamed bitumen was higher than for neat bitumen. Similarly, the work of adhesion in wet conditions for foamed bitumen was lower than for neat bitumen. This may suggest that foamed bitumen is more likely to form strong adhesive bonds with granite aggregates than neat bitumen.
Compaction based on modified locking point concept
i. The modified locking point is proposed for use in determination of the number of gyrations at which to compact laterite gravels treated with foamed bitumen. This point is deduced from the rate of change of the compaction curve.
ii. The procedure for determining this locking point involves:
o Fitting a logarithmic regression curve to the compaction curve
o Obtaining the gradient of slope for the curve
o The modified locking point is taken as the first point at which two gyrations at the same gradient of slope are preceded by two gyrations at the same gradient of slope. In this study, the modified locking point varied from 40 to 46 gyrations for the mixes studied.
iii. Gradation analysis revealed that there was hardly any aggregate particle break down for one of the laterite gravels (L3) at the modified locking point. Although, some break down occurred for L1, but itwas much lower than that which occurred at 200 gyrations.
iv. The optimum moisture for compaction of the mixes at the modified locking point gyrations was less than the optimum moisture content for the gravels only (OMC), ranging from 86% to 92% of OMC. Results have shown that gyratory compaction of foamed bitumen treated materials can be carried out at moisture conditions that are less the optimum moisture conditions of the aggregates only, as compaction of the mixes at 100% OMC led to lower densities.
Optimum binder content
The aggregate gradation framework based on the 3D packing theory concepts can be used to characterizethe aggregate structure of foamed bitumen mixes into: oversize, primary, and secondary structures. The primary aggregate structure porosity and indirect tensile strength criteria can be used to determine the optimum bitumen content for foamed bitumen mixes. This method would provide a rational and cost effective way of estimating a bitumen content for use in design of a given foamed bitumen mixture.
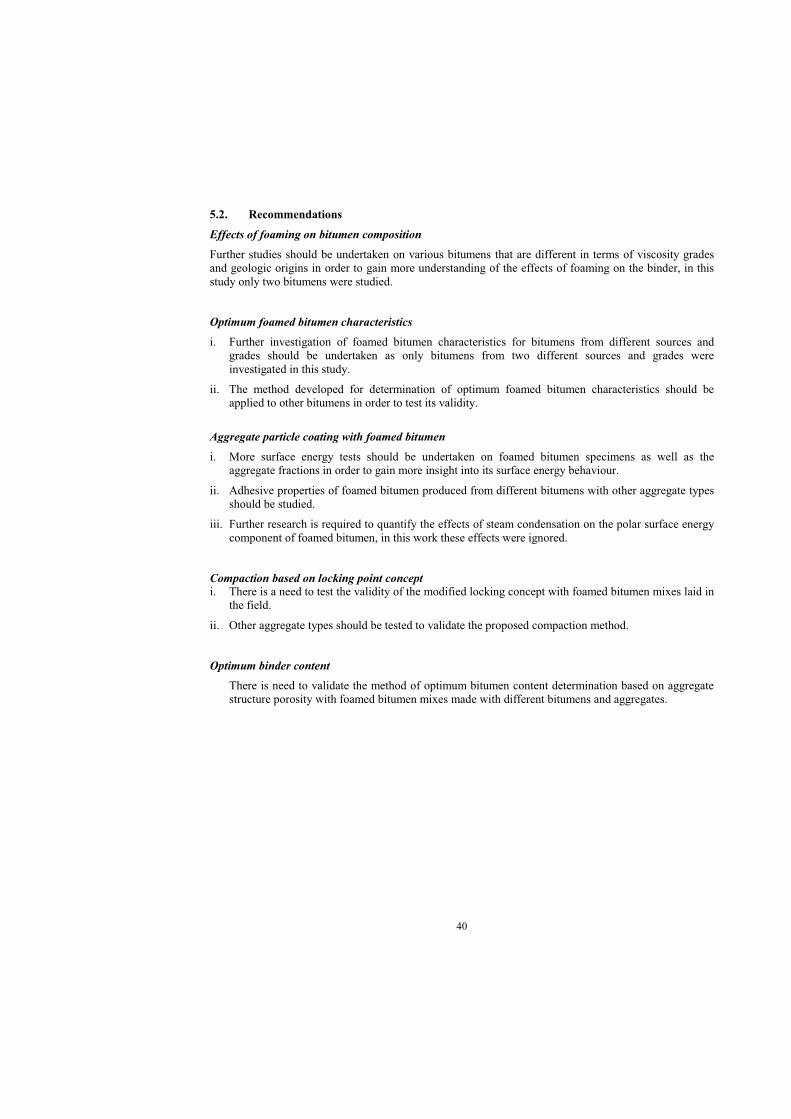
40
5.2. Recommendations
Effects of foaming on bitumen composition
Further studies should be undertaken on various bitumens that are different in terms of viscosity grades and geologic origins in order to gain more understanding of the effects of foaming on the binder, in this study only two bitumens were studied.
Optimum foamed bitumen characteristics
i. Further investigation of foamed bitumen characteristics for bitumens from different sources and grades should be undertaken as only bitumens from two different sources and grades were investigated in this study.
ii. The method developed for determination of optimum foamed bitumen characteristics should be applied to other bitumens in order to test its validity.
Aggregate particle coating with foamed bitumen
i. More surface energy tests should be undertaken on foamed bitumen specimens as well as the aggregate fractions in order to gain more insight into its surface energy behaviour.
ii. Adhesive properties of foamed bitumen produced from different bitumens with other aggregate types should be studied.
iii. Further research is required to quantify the effects of steam condensation on the polar surface energy component of foamed bitumen, in this work these effects were ignored.
Compaction based on locking point concepti. There is a need to test the validity of the modified locking concept with foamed bitumen mixes laid in
the field.
ii. Other aggregate types should be tested to validate the proposed compaction method.
Optimum binder content
There is need to validate the method of optimum bitumen content determination based on aggregate structure porosity with foamed bitumen mixes made with different bitumens and aggregates.

41
REFERENCESAbel F. (1978). Foamed asphalt base stabilization. Presented at 6th Asphalt Paving Seminar, Colorado
State University, Fort Collins.
Akeroyd F. M. L. and Hicks B. J. (1988). Foamed bitumen road recycling. Highways January. Volume
56, No. 1933, 42-45.
Alexander L. T. and Cady, J. G. (1962). Genesis and Hardening of Laterite in Soils. US Department of
Agricultural, Technology Bulletin, 1282:90.
Asphalt Academy, (2009). Technical guideline: Bitumen stabilised materials. A guide for the design and
construction of bitumen emulsion and foamed bitumen stabilised materials, TG 2, First Edition,
Asphalt Academy, Pretoria, South Africa, May 2009.
American Society for testing Materials, (1995). ASTM D2493, Standard Viscosity-Temperature Charts
for Asphalts. ASTM.
Bhasin Amit and Little Dallas N. (2007). Characterization of aggregate surface energy using universal
sorption device. Journal of Materials in Civil Engineering, Volume 19, No. 8. ASCE, 634-641.
Bissada Amir F. (1987). Structural response of foamed-asphalt-sand mixtures in hot environments.
Transportation Research Record 1115. Transportation Research Board, National Research
Council, Washington D.C,134–149.
Bowering R. H. and Martin C. L., (1976). Foamed Bitumen: Production and application of mixtures.
Evaluation and performance of pavements. Proceedings Association of Asphalt Paving
Technologists. Volume 45 (pp. 453-473). Asphalt Paving Technology.
Brennen M., Tia M., Altschaeffl A., and Wood L. E., (1983). Laboratory investigation of the use of
foamed asphalt for recycled bituminous pavements, Transportation Research Record 911, 1983,
Transportation Research Record Board, National Research Council, Washington DC, 80-87.
British Standards Institution, (1990). BS 1377: Part 2:1990. Methods of test for soils for engineering
purposes. Classification tests. British Standards Institution.

42
British Standards Institution, (1990). BS 1377: Part 3:1990. Methods of test for soils for engineering
purposes. Chemical and electro-chemical tests. British Standards Institution.
British Standards Institution, (1990). BS 1377: Part 4:1990. Methods of test for soils for engineering
purposes. Compaction related tests. British Standards Institution.
Castedo-Franco. H. L., and Wood Leonard E., (1983). Stabilization with foamed asphalt of aggregates
commonly used in low-volume roads. Transportation Research Record 898. Low-Volume Roads:
Third International Conference, 1983 (pp. 297-302). Transportation Research Board. National
Research Council, Washington, D. C. 1983.
Charman J. H., 1988. Laterite in road pavements. London: CIRIA.
Csanyi L. H and Fung H., (1956). Mortar theory for use of Ungraded aggregates in bituminous mixes.
Highway Research Board Bulletin No. 109.
Csanyi L. H., (1957). Foamed asphalt in bituminous paving mixtures. Highway Research Board Bulletin
161. National Research Council, Washington DC, 108-122.
Csanyi L. H., (1959). Foamed asphalt. Technical Bulletin No. 240. American Road Builders Association,
Washington, DC.
Ekblad J., and Isacsson, U., (2008). Influence of water and mica content on resilient properties of coarse
granular materials. International Journal of Pavement Engineering, Vol. 9, No. 3, June 2008,
Taylor and Francis Ltd, 215-22.
European Standards, 2007. EN 12697-5, Bituminous mixtures- Test methods for hot mix asphalt- Part 5:
Determination of maximum density. European Committee for Standardization (CEN).
European Standards, 2007. EN 1426, Bitumen and bituminous binders- Determination of needle
penetration. European Committee for Standardization (CEN).
European Standards, 2007. EN 1427, Bitumen and bituminous binders- Determination of the softening
point- Ring and Ball method. European Committee for Standardization (CEN).
Fu P., Harvey J. T., Jones D., and Chao Y., (2008). Understanding internal structure characteristics of
foamed asphalt mixes with fracture face image analyses. Journal of the Transportation Research
43
Board, No. 2057, Transportation Research Board of the National Academies, Washington, D.C.,
2008, 20–27. DOI: 10.3141/2057-03
Gidigasu M., D. (1976). Laterite soil engineering. Pedogenesis and engineering principles. Amsterdam:
Elsevier Scientific Publishing Company.
He G. and Wong W., (2006). Decay properties of foamed bitumens. Journal of Construction and Building
Materials. Volume 20, 866-77.
Hefer Arno W., Bhasin Amit, Little Dallas N. P. E., (2006). Bitumen surface energy characterization
using a contact angle approach. Journal of Materials in Civil Engineering, Volume 18, No. 6.
ASCE, 759-767.
M., Anna Chomicz-Kowalska A., and Maciejewski K., (2015). Application of synthetic wax for
improvement of foamed bitumen parameters. Journal of Construction and Building Materials.
Volume 83, 62-69.
Jenkins K. J., (2000). Mix design considerations for cold and half-warm bituminous mixes with emphasis
on foamed bitumen. Unpublished PhD dissertation, University of Stellenbosch. South Africa.
Lambe T. W. and Whitman R. V., (1979). Soil mechanics. SI version. New York. John Wiley & Sons Inc.
pp29-31
Lee D. Y., (1981). Treating marginal aggregates and soils with foamed asphalt. Proceedings of the
Association of Asphalt Paving Technologists, Volume 50 (pp. 211-250). Asphalt Paving
Technology.
Lesuer Didier, He`le`ne Clech, Aline Brosseaud, Christian Such, Bogdan Cazacliu, Burgard Koenders, …
Jacques Bonvallet, (2004). Foamability and foam stability. International Journal of Road
Materials and Pavement Design, Vol. 5, No. 3, Hermes Science Publications, France, 277-302.
Maignien R., (1966). Review of research on laterites. UNESCO.
Masad E., C. Zollinger, R. Bulut, D. Little and Lytton R., (2006). Characterization of HMA moisture
damage using surface energy and fracture properties. Journal of the Association of Asphalt
Paving Technologists, Volume 75, 713-754.

44
Muthen K., M. (1998). Foamed asphalt mixes- Mix design procedure. Pretoria: SABITA Ltd & CSIR
Transportek.
Namutebi M. (2011). Some aspects of foamed bitumen technology. Unpublished Licentiate thesis in
Highway Engineering, Royal Institute of Technology, Stockholm. TRITA-VBT 11:05, ISBN
978-91-7415-910-3
Namutebi M., Birgisson B., and Bagampadde U. (2011) Foaming effects on binder chemistry and
aggregate coatability using foamed bitumen, International Journal of Road Materials and
Pavement Design, Vol 12, No. 4. Lavoisier, Paris, 821-847. DOI:10.3166/RMPD.12.
Prescott J. A., C. B. E. F.R.S. and Pendleton R., L. (1966). Laterite and Lateritic soils. Technical
communication NO. 47 of the Commonwealth Bureau of Soil Sciences, Rothansted, Harpenden:
England: Commonwealth Agricultural Bureaux, pp1, 16-17.
Read J. and Whiteoak D, (2003). The Shell bitumen handbook (5th ed.). London: Thomas Telford.
Redelius P., Lu X., and Isacsson U., (2002). Non-classical wax in bitumen. International Journal of Road
Materials and Pavement Design, Vol 3, No. 1. Lavoisier, Paris.
Roberts L. Freddy, Kandhal Prithvi S., Brown E. Ray, Lee Dah-Hinn, Kennedy Thomas W., (1996). Hot
mix asphalt materials, mixture design, and construction (2nd ed). Maryland: National Asphalt
Pavement Association Research and Education Foundation, pp188, 202-204.
Roque R., Birgisson B., Kim S., and Guarin A., (2006). Development of mix design guidelines for
improved performance of asphalt mixtures. Florida Department of Transportation. Final Report.
UF Project No. 49104554032-12
Saleh M. F., (2006). Characterisation of foam bitumen quality and the mechanical properties of foam
stabilised mixes. 10th International Conference on Asphalt Pavements. Quebec, Canada.
Saleh M. F., (2007). Cost evaluation of foam bitumen and other stabilisation alternatives. International
Journal of Pavement Engineering, Vol 8, No. 2. Taylor & Francis, 157 – 161. DOI:
10.1080/10298430601149585.

45
SS-EN 1097-6, (2000). Tests for mechanical and physical properties of aggregates- Part 6: Determination
of particle density and water absorption. Swedish Standards Institute (SIS).
SS-EN 13302, (2003). Bitumen and bituminous binders- Determination of viscosity of bitumen using a
rotating spindle apparatus. Swedish Standards Institute (SIS).
SS-EN 15326, (2007). Bitumen and bituminous binders- Measurement of density and specific gravity-
Capillary-stoppered pycnometer method. Swedish Standards Institute (SIS).
Sunarjono Sri, Ir., M. T., (2008). Influence of foamed bitumen characteristics on cold mix asphalt
properties. Unpublished PhD Thesis, University of Nottingham, UK.
Twagira M. E. and Jenkins K. J., (2009). Age hardening behaviour of bituminous stabilized materials.
In Loizos, Partl, Scarpas & Al-Qadi (eds), Advanced Testing and Characterization of Bituminous
Materials. Taylor & Francis Group, London, ISBN 978-0-415-55854-9.
Vavrik, W.R. and Carpenter, S.H., (1998). Calculating air voids at specified number of gyrations in
Superpave gyratory compactor. Transportation Research Record 1630. Washington, DC:
National Research Council.
Wirtgen, (2004). Cold Recycling Manual, (2nd ed.). Wirtgen GmbH.

46
APPENDED PAPERS


Foamed Bitumen in Bituminous Paving Technology: State-of-the-art May Namutebi1, Björn Birgisson1 and Umaru Bagampadde2 1: Division of Highway and Railway Engineering KTH- Royal Institute of Technology, Brinellvägen 23 100 44 Stockholm Sweden [email protected] [email protected] 2: Department of Civil and Environmental Engineering School of Engineering, Makerere University P. O. Box 7062 Kampala, Uganda [email protected]
ABSTRACT. Foamed bitumen consists of hot liquid bitumen through which water in form of steam bubbles has been dispersed. In contact with moist aggregates, it combines with the fine fraction forming some kind of mortar that binds the rest of the aggregate particles into a composite mass. In this way, it water proofs the aggregate particles and imparts strength to the aggregate. A review and synthesis of literature on foamed bitumen has been undertaken in order to gain understanding of the foamed bitumen technology. The characteristics and mechanism of foamed bitumen, mix design, properties, types, performance modeling and advantages and disadvantages, test methods of foamed bitumen mixtures are dealt with. Case studies where foamed bitumen has been applied in pavement construction are also included.
KEYWORDS: Foamed bitumen, Foamed bitumen mixes/mixtures, state of the art
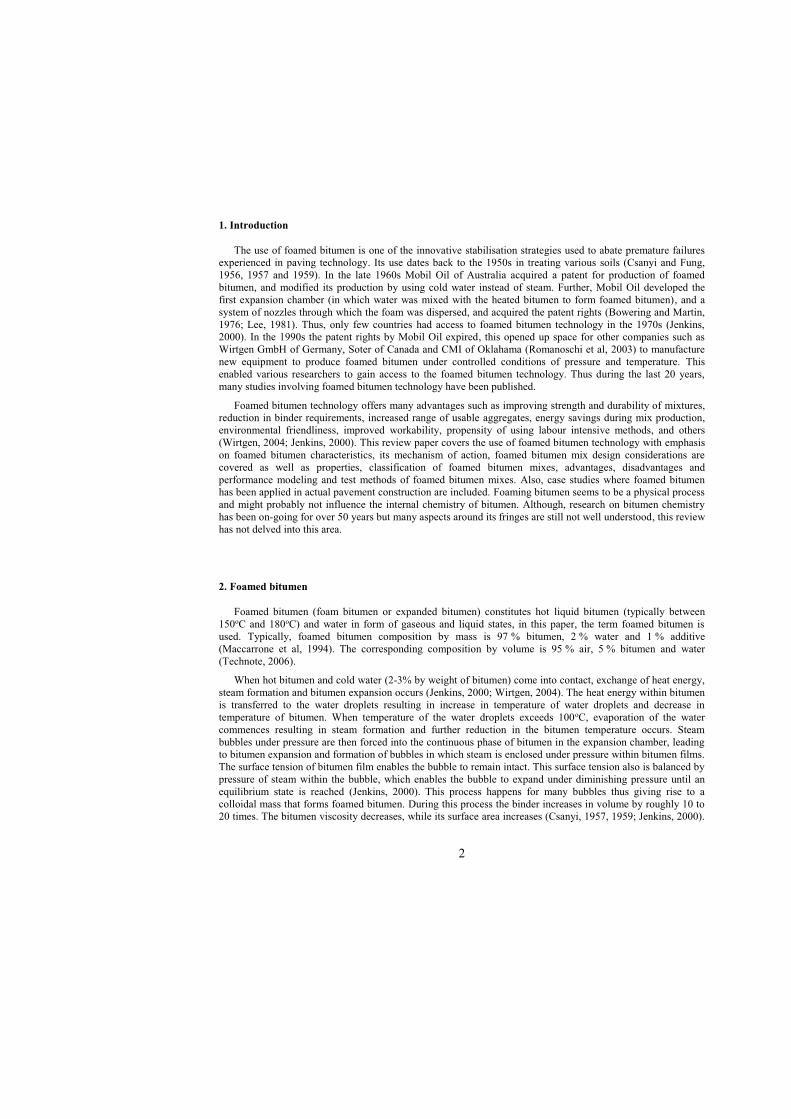
2
1. Introduction
The use of foamed bitumen is one of the innovative stabilisation strategies used to abate premature failures experienced in paving technology. Its use dates back to the 1950s in treating various soils (Csanyi and Fung, 1956, 1957 and 1959). In the late 1960s Mobil Oil of Australia acquired a patent for production of foamed bitumen, and modified its production by using cold water instead of steam. Further, Mobil Oil developed the first expansion chamber (in which water was mixed with the heated bitumen to form foamed bitumen), and a system of nozzles through which the foam was dispersed, and acquired the patent rights (Bowering and Martin, 1976; Lee, 1981). Thus, only few countries had access to foamed bitumen technology in the 1970s (Jenkins, 2000). In the 1990s the patent rights by Mobil Oil expired, this opened up space for other companies such as Wirtgen GmbH of Germany, Soter of Canada and CMI of Oklahama (Romanoschi et al, 2003) to manufacture new equipment to produce foamed bitumen under controlled conditions of pressure and temperature. This enabled various researchers to gain access to the foamed bitumen technology. Thus during the last 20 years, many studies involving foamed bitumen technology have been published.
Foamed bitumen technology offers many advantages such as improving strength and durability of mixtures, reduction in binder requirements, increased range of usable aggregates, energy savings during mix production, environmental friendliness, improved workability, propensity of using labour intensive methods, and others (Wirtgen, 2004; Jenkins, 2000). This review paper covers the use of foamed bitumen technology with emphasis on foamed bitumen characteristics, its mechanism of action, foamed bitumen mix design considerations are covered as well as properties, classification of foamed bitumen mixes, advantages, disadvantages and performance modeling and test methods of foamed bitumen mixes. Also, case studies where foamed bitumen has been applied in actual pavement construction are included. Foaming bitumen seems to be a physical process and might probably not influence the internal chemistry of bitumen. Although, research on bitumen chemistry has been on-going for over 50 years but many aspects around its fringes are still not well understood, this review has not delved into this area.
2. Foamed bitumen
Foamed bitumen (foam bitumen or expanded bitumen) constitutes hot liquid bitumen (typically between 150oC and 180oC) and water in form of gaseous and liquid states, in this paper, the term foamed bitumen is used. Typically, foamed bitumen composition by mass is 97 % bitumen, 2 % water and 1 % additive (Maccarrone et al, 1994). The corresponding composition by volume is 95 % air, 5 % bitumen and water (Technote, 2006).
When hot bitumen and cold water (2-3% by weight of bitumen) come into contact, exchange of heat energy, steam formation and bitumen expansion occurs (Jenkins, 2000; Wirtgen, 2004). The heat energy within bitumen is transferred to the water droplets resulting in increase in temperature of water droplets and decrease in temperature of bitumen. When temperature of the water droplets exceeds 100oC, evaporation of the water commences resulting in steam formation and further reduction in the bitumen temperature occurs. Steam bubbles under pressure are then forced into the continuous phase of bitumen in the expansion chamber, leading to bitumen expansion and formation of bubbles in which steam is enclosed under pressure within bitumen films. The surface tension of bitumen film enables the bubble to remain intact. This surface tension also is balanced by pressure of steam within the bubble, which enables the bubble to expand under diminishing pressure until an equilibrium state is reached (Jenkins, 2000). This process happens for many bubbles thus giving rise to a colloidal mass that forms foamed bitumen. During this process the binder increases in volume by roughly 10 to 20 times. The bitumen viscosity decreases, while its surface area increases (Csanyi, 1957, 1959; Jenkins, 2000).

3
This in turn enhances the adhesion and coatability potential of the bitumen with the aggregates at ambient temperatures.
In general, foamed bitumen falls under the class of liquid foams, since a gaseous phase (steam) is dispersed within a liquid phase (bitumen). Thus the physical characteristics of liquid foams also apply to foamed bitumen. Microscopically, a typical liquid foam constitutes various gas bubbles separated by thin films of liquid known as lamellae forming the face of the bubble. These bubbles have various sizes and are randomly distributed. The tubes of liquid at the junctions between the lamellae are known as Plateau borders (named after a Belgian scientist). The vertices where the Plateau borders meet are called nodes, Figure 1 illustrates the typical foam structure.
Figure 1. A schematic diagram showing a foam structure (Breward, 1999)
However, after some time due to drainage processes (caused by Plateau border suction, gravitational forces, bubble coarsening) and the pressure inside the bubbles exceeding the surface tension of the bitumen films or elongation limit of the bitumen films (Sunarjono, 2008; Jenkins, 2000), these processes lead to bubble collapse and thus foam collapse. The Plateau border suction process involves flow of the liquid from the lamellae into the Plateau borders. This leads to thinning of the lamellae and thus the liquid film rupture. However, if surfactants are present these may reduce the liquid surface tension and thus reduce its flow from the lamellae to the Plateau borders giving a more stable foam. Studies by Barinov (1990) on properties of bituminous foams showed that an increase in asphaltene content improved stability and expansion ratio of the foams. This would imply that bitumens with high asphaltene content would produce more stable foams. However, recent studies on bitumen composition have shown that bitumen consists of groups of molecules that are polar and non-polar, and groups such as asphaltenes may not exist (Redelius, 2004). Gravitational forces tend to force the liquid portion, which is denser than the gas, to the bottom of the foam. Consequently, the lamellae become thin with time and eventually rapture leading to collapse of the foam.
Also when large and small bubbles make contact, high pressure inside the small bubble diffuses through the liquid film separating the two bubbles until the small bubble is fully absorbed by the larger one. However, absorption of small bubbles into larger ones leads to thinning/coarsening and eventual rupture of the lamellae of the large bubbles. If the lamellae of many large bubbles rupture, then collapse of the foam occurs.
Foamed bitumen has been used applied to a wide range of applications such as, a stabilizing agent for marginal and poor aggregates, soils (heavy clayey sandy and granular soils) (Csanyi and Fung, 1956; Acott, 1979; Lee, 1981; Joubert et al, 1989; Pierre and Yves, 1997), a recycling agent for reclaimed asphalt pavement to form new pavement layers during maintenance works (Maccarrone et al, 1994; Akeroyd and Hicks, 1988; Engelbrecht, et al, 1985; Van Wijk and Wood, 1983; Brennen et al, 1983), production of surfacing materials for low volume roads, road base and subbase course materials (Larcombe and Newton, 1968).
Plateau border
Node Lamella

4
Mechanism of action
When the foamed bitumen is mixed with moist aggregates, it combines with the fines fraction present in the aggregates. It also partially coats the coarse aggregates and this imparts to the mix a mortar and friction load carrying mechanisms where forces in the mix are partly supported by the mortar and friction from aggregate to aggregate contacts. However, a scientific explanation why foamed bitumen combines with the fines has not been found in the literature. Studies carried out by Castedo and Wood (1983) also supported the above mechanism. This illustrates that the amount of fines is an important factor in foamed bitumen mixes. Further, from electron microscope observations on the structure of foamed bitumen mixes, revealed that foamed bitumen droplets coated the filler fraction (fraction that passes the 75 �m sieve) first, forming mastic (mixture of water, filler and bitumen (Jenkins, 2000). This mastic then combines with the sand fraction (fraction that passes the 2.36 mm sieve but it is retained on the 75 �m sieve) forming mortar (mixture of mastic and sand fraction). The resulting mortar adheres to the coarser particles. Thus, adequate fines and sand fraction are crucial for aggregate treatment with foamed bitumen (Jenkins 2000).
2.1. Characteristics of Foamed Bitumen
Generally, expansion ratio and half life are the primary parameters that have been used in characterising foamed bitumen. Others such as foam index, minimum viscosity, coefficient of foamability have been recently devised.
Half life (HL)
This is the time taken for foamed bitumen to reduce to half of its maximum volume (Jenkins, 2000; Asphalt Academy, 2009; Wirtgen, 2004). It is measure of foam stability and indicative of its rate of collapse. It determines the length of mixing period of foamed bitumen with moist aggregates. Short half lives may result into the bitumen reverting to a high viscosity in a short time before mixing with aggregate, which is not favourable for mixing. On the contrary, long half lives allow complete mixing resulting in good mix workability. Foamants may be added to enhance or increase the half life of bitumen. Half life should be long enough to ensure proper mixing of the fines with foamed bitumen. Different researchers have proposed different minimum values for half life and expansion ratio summarised in Table 1. It can be observed that the proposed minimum half life values vary widely from 8 to 180 seconds; probably these variations are attributed to different types of bitumen, foamant water content and temperature during foam production.
Table 1. Minimum half life (HL) and expansion ratio (ER) values found in literature
HL (s) ER Comment(s) Reference(s) 120-180 10-15 Produced by 1-2% foamant water content. Bowering and
Martin (1976) 40-80 6-12 Mitvalsky (1979) ≥20 8-15 Ruckel et al. (1983) ≥12 10 Muthen (1998) ≥8 ≥10 For stabilising a material at 25°C Wirtgen (2004) ≥20 Read and Whiteoak
(2003) >10 For 50/70 and 70/100 penetration grade bitumen. Sunarjono (2008) >5 For 160/220 penetration grade bitumen.

5
Expansion ratio/Foam ratio (ER)
This is the ratio of maximum volume of foamed bitumen to the original bitumen volume (Jenkins, 2000; Wirtgen, 2004). It is a measure of foam viscosity and determines how well bitumen is dispersed in a mix. With time, after foam formation, this ratio reduces. Figure 3 shows variation of expansion ratio with time. ER is measured in the laboratory immediately after spraying foam, (normally after 5 seconds of spraying time). Jenkins (2000) modelled the process of foam decay (change of expansion ratio with time) during spraying by employing principles of isotopic decay and back calculation theory and deduced correction factors, c between the measured expansion ratio, ERm and actual expansion ratio, ERa. He argued that measured expansion ratio (after spraying) does not take into account expansion that occurs during the spraying process, and thus the need for correction factors.
Figure 3. Relation between expansion ratio and time (Namutebi, 2011)
Jenkins (2000) also analysed the process of foamed bitumen decay after spraying and developed equation [1].
1/2
-ln2 tτ
1/2
ER(t) = ERm e [1]Where: ER(t) is the expansion ratio at time, t, ERm is the maximum expansion ratio, τ is the half life.
Lesueur et al (2004) modelled the decay process (expansion ratio versus time) as a power law shown in equation [2].
a
1 2
1 2
ERm tER(t) [2]2
Where: ER(t), ERm, t and are defined as in [1],
a is a constant between 0.3 and 1.2.
�
�
� �� � �� �
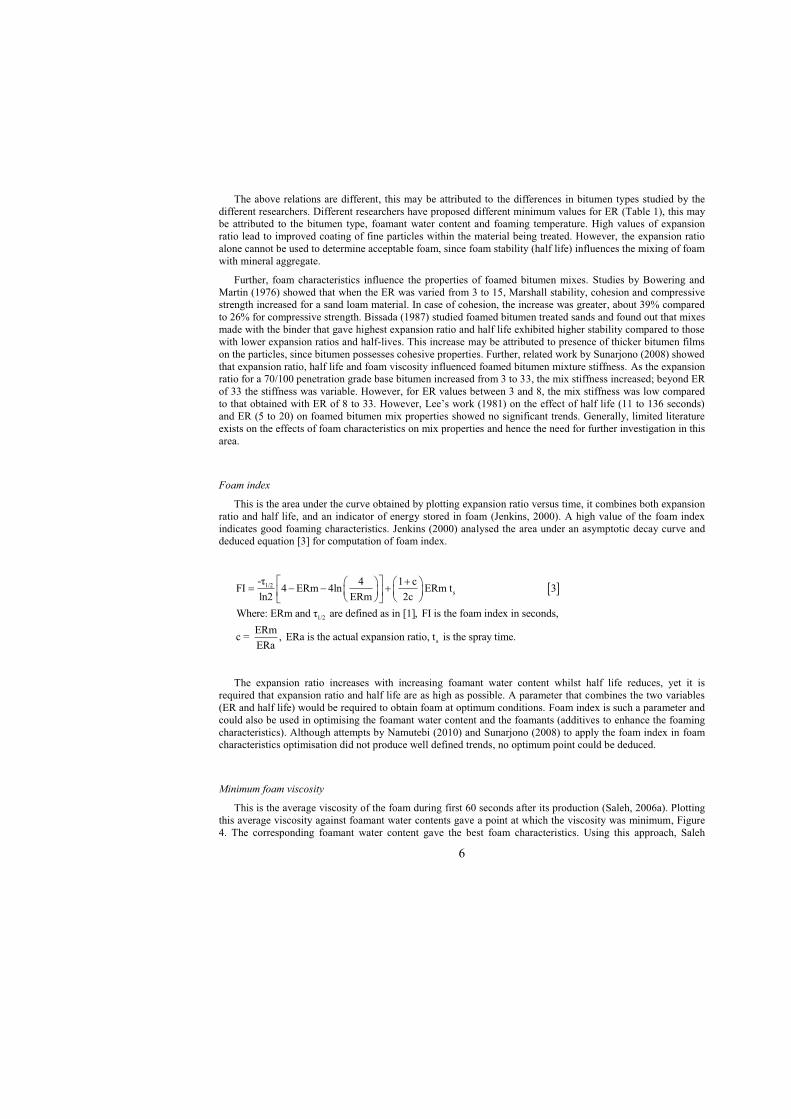
6
The above relations are different, this may be attributed to the differences in bitumen types studied by the
different researchers. Different researchers have proposed different minimum values for ER (Table 1), this may be attributed to the bitumen type, foamant water content and foaming temperature. High values of expansion ratio lead to improved coating of fine particles within the material being treated. However, the expansion ratio alone cannot be used to determine acceptable foam, since foam stability (half life) influences the mixing of foam with mineral aggregate.
Further, foam characteristics influence the properties of foamed bitumen mixes. Studies by Bowering and Martin (1976) showed that when the ER was varied from 3 to 15, Marshall stability, cohesion and compressive strength increased for a sand loam material. In case of cohesion, the increase was greater, about 39% compared to 26% for compressive strength. Bissada (1987) studied foamed bitumen treated sands and found out that mixes made with the binder that gave highest expansion ratio and half life exhibited higher stability compared to those with lower expansion ratios and half-lives. This increase may be attributed to presence of thicker bitumen films on the particles, since bitumen possesses cohesive properties. Further, related work by Sunarjono (2008) showed that expansion ratio, half life and foam viscosity influenced foamed bitumen mixture stiffness. As the expansion ratio for a 70/100 penetration grade base bitumen increased from 3 to 33, the mix stiffness increased; beyond ER of 33 the stiffness was variable. However, for ER values between 3 and 8, the mix stiffness was low compared to that obtained with ER of 8 to 33. However, Lee’s work (1981) on the effect of half life (11 to 136 seconds)
and ER (5 to 20) on foamed bitumen mix properties showed no significant trends. Generally, limited literature exists on the effects of foam characteristics on mix properties and hence the need for further investigation in this area.
Foam index
This is the area under the curve obtained by plotting expansion ratio versus time, it combines both expansion ratio and half life, and an indicator of energy stored in foam (Jenkins, 2000). A high value of the foam index indicates good foaming characteristics. Jenkins (2000) analysed the area under an asymptotic decay curve and deduced equation [3] for computation of foam index.
� �1/2s
1/2
-τ 4 1 cFI 4 ERm 4ln ERm t 3ln2 ERm 2c
Where: ERm and τ are defined as in [1], FI is the foam index in seconds, ERmc = , ERa is the actual expansERa
� �� � � �� � � �� � � �� � � �
sion ratio, t is the spray time.
The expansion ratio increases with increasing foamant water content whilst half life reduces, yet it is required that expansion ratio and half life are as high as possible. A parameter that combines the two variables (ER and half life) would be required to obtain foam at optimum conditions. Foam index is such a parameter and could also be used in optimising the foamant water content and the foamants (additives to enhance the foaming characteristics). Although attempts by Namutebi (2010) and Sunarjono (2008) to apply the foam index in foam characteristics optimisation did not produce well defined trends, no optimum point could be deduced.
Minimum foam viscosity
This is the average viscosity of the foam during first 60 seconds after its production (Saleh, 2006a). Plotting this average viscosity against foamant water contents gave a point at which the viscosity was minimum, Figure 4. The corresponding foamant water content gave the best foam characteristics. Using this approach, Saleh

7
(2006a) observed that foams considered poor using the foam index approach could mix well with aggregates. Characterising foam using viscosity is a good idea since viscosity is a fundamental property. However, foams keep on changing with time and directly measuring their viscosity may lead to foam distortion and thus making it difficult to measure the true viscosity of the foam. Presently no researcher except Saleh has used this minimum foam viscosity parameter to characterise foamed bitumen.
Figure 4. Minimum viscosity versus foamant water content (Saleh, 2006a)
Coefficient of foamability
This is the ratio of maximum expansion at a given bitumen temperature to the optimum foamant water content at that temperature, it is expressed in units of one per percent (Lesueur et al., 2004). From a study on foamed bitumen produced from three different penetration grade bitumens, it was deduced that this coefficient was independent of temperature and constant for given bitumen (Lesueur et al., 2004). This coefficient varied between 2 and 3, these values where low as a result of the nozzle geometry that required high foamant water contents (foamant water contents of 3% to over 10% where used). Lesueur et al. (2004) proposed this parameter as a possible characterisation parameter for foamed bitumen. Apparently no researcher except Lesueur et al has used this as a characterisation parameter.
Factors influencing foam characteristics
Foam characteristics are influenced by various factors such as foamant water content, bitumen type and composition, bitumen temperature during foaming, bitumen and water pressure, additives and temperature of vessel into which foam is collected. Table 2 shows a summary of these factors.
Optimum foamant water content

8
Table 2. Summary of factors that influence foam characteristics
Factor Comment(s) Reference(s) Foamant water content
As foamant water content increases, ER increases but HL decreases. This is due to more steam being made available and thus many bubbles being created. However, this leads to intense interactions between the bubbles that results into bubble coarsening, pressure inside the bubble exceeds bitumen elongation which in turn leads to reduced half life of the foam.
Brennen et al (1983) Wirtgen (2004) He and Wong (2005)
Bitumen type and composition
Bitumens with lower viscosities foam more readily and give foams with high ER and HLs. Bitumens with high parafins (saturates) content exhibited high HLs and foam index values than those with low amounts of parafins.
Bissada (1987) Abel (1978) Jenkins (2000)
Bitumen source
Bitumens from Venezuela (high acid content) exhibit better foaming characteristics than bitumens from other sources. However, limited information exists on the effects of binder source and composition on foam characteristics.
Wirtgen (2004)
Bitumen temperature
As bitumen temperature increases, the ER increases whilst HL reduces, this is due to more heat energy being made available to convert more water into steam, but bubbles frequently contact each other this leads to lamellae thinning and thus reduced HL. Also, temperature increase leads to reduction in binder viscosity and thus the bitumen foams more readily.
Bissada (1987)
Bitumen and water pressure
High pressures cause bitumen and water to disperse thus encouraging formation of many small bubbles within the foam; this enhances ER and HL values. These small bubbles constituting the foam translate into a large contact area being available, implying that the foam would be dispersed very well into the aggregate.
Wirtgen (2004)
Table 2 is continued to next page

9
Table 2. Continued
Factor Comment(s) Reference(s) Additives Additives such as metallic stearates, anti-
stripping agents such as lime, diesel, improve foam characteristics. While additives such as silicone affect the foam characteristics negatively.
Abel (1978) Castedo et al. (1984) Kendall et al. (1999) Maccarrone et al (1994) Kendall et al. (1999)
If the vessel temperature into which foam is dispersed is low, a temperature gradient may be created between the foam and the vessel. This causes the steam to loose heat in a very short time thus leading to a quick collapse of foam and reducing its half life. -It is recommended that the vessel for foam collection be heated to at least 75oC for 30 minutes before foam collection.
Asphalt Academy (2002)
3. Foamed bitumen mixtures
These consist of foamed bitumen and moist aggregates mixed and compacted at ambient temperatures. Aggregates in this context refer to mineral or crushed aggregate, unbound or granular materials and soils. These mixtures maybe used for wearing, road base or subbase courses, and are also referred to as foamed bitumen treated materials or foamixes. The aggregates need not be heated, although some studies have shown that better mixes would be obtained if aggregate temperature was raised from 40oC to 90oC (Jenkins, 2000).
3.1. Mix design
Before undertaking any design of foamed bitumen mixes, it is important that factors like the nature of material to be treated (aggregates), fluid considerations (bitumen and water for mixing and compaction), bitumen type, mixing, compaction, and curing methods are considered. In the following sections these factors are discussed.
Aggregates
The suitability of aggregates to be treated with foamed bitumen has been mainly based on quantity of the fine fraction (filler and sand fractions), and to some extent the plasticity and temperature. Table 3 summarises these factors.

10
Table 3. Aggregate factors influencing foamed bitumen mix design Factor Comment(s) Reference(s) Grading a. Filler
fraction
3-5% minimum recommended filler fraction. Csanyi (1960) Castedo-Franco et al. (1982)
35-40% maximum recommended filler fraction. Lee (1981)
4% minimum recommended filler fraction. Sakr and Manke (1985) 5% minimum recommended filler fraction. Bissada (1987) 5-20% filler fraction for aggregates to be used in heavy traffic conditions. 20-35% filler fraction for aggregates to be used in light traffic conditions.
Akeroyd and Hicks (1988)
4-20% filler fraction Asphalt Academy (2009)
b. Plasticity
Aggregates should have some plasticity before treatment with foamed bitumen.
Ramanujam and Jones (2007)
Maximum PI of 10%, otherwise pre-treat the aggregates with lime or cement.
Asphalt Academy (2009), Lewis (1998)
If PI exceeds 8%, then pre-treat aggregates with lime.
Ruckel et al. (1983)
PI of 8-24% Csanyi (1959) Aggregate temperature
Minimum temperature should be between 13oC and 23oC for aggregates to be treated with foamed bitumen.
Bowering and Martin (1976)
Minimum temperature of 10oC Wirtgen (2004)
Electron microscope observations on mastics (mixture of foamed bitumen, filler fraction and water) revealed that fine particles with size greater than 30 �m were encapsulated with bitumen and that they were connected with bitumen threads (Jenkins, 2000). The smaller particles (less than 2 �m or clay sized particles) located themselves in bitumen films over coarser particles as well as the threads. Sunarjono (2008) determined the binder distribution within a given foamed bitumen mixture using sieving and soluble binder content tests. His results showed that the filler fraction (less than 75�m) was best coated with binder with about 80% of coated particle surface area and also the maximum aggregate fraction size to be coated with the binder was 6.3 mm. These observations illustrate that the filler fraction acts as carrier or a disperser of the foamed bitumen and therefore this fraction must be present in any material to be treated with foamed bitumen. Generally the filler fraction amount recommended ranges from 3 to 40%. This filler fraction influences the mix properties. Sakr and Manke (1985) illustrated that mixes with high filler content exhibited high stabilities. However, the effects on mixes of other aggregate properties such as porosity, mineralogy have not been considered.
Fluid considerations
This includes consideration of moisture and binder contents. Prior to adding foamed bitumen to an aggregate, the aggregate is pre-wetted with water. This water performs the following functions (Csanyi, 1960; Jenkins, 2000; Khweir, 2007):
-transports and disperses the bitumen droplets during mixing,

11
-separates and envelopes the fine particles with thin layers of moisture that provide channels through which foamed bitumen can penetrate to coat the mineral particles,
-acts as a lubricant enabling mix workability at ambient temperatures, -acts as a compaction aid, reducing internal friction during mix compaction. Different moisture contents are required for foamed bitumen mixtures during mixing, compaction and curing
stages. Thus, the moisture content of a given foamed bitumen mixture needs to be optimised at each of these stages. It has been observed that little water results in inadequate dispersion of the binder throughout the mix and reduction in mix workability. On the other hand, too much water results into long curing periods and reduction in mix properties such as strength, density, etc.
Mixing and compaction moisture contents
Mixing moisture content is the amount of water that is added to the aggregate prior to addition of foamed bitumen. The compaction moisture content is the total amount of water required to achieve maximum compaction of the mix; since at maximum compaction strength properties such as stability, indirect tensile strength, and unconfined compressive strength are optimised. These water contents aids in foamed bitumen dispersion within the mix, separates the fine particles and suspends them in a liquid providing a channel through which foamed bitumen may penetrate to coat the particles, and improves workability and compaction of the mixture. A study by Jenkins (2000) on foamed bitumen mastics revealed that adding water to the filler fraction stiffened the resulting foamed bitumen mastic, stiffer mastic is expected to provide good resistance to permanent deformation. This shows that the mixing water increases stiffness of foamed bitumen mixes. Table 4 summarises recommended mixing and compaction moisture contents as found in literature.
Table 4. Mixing and compaction moisture contents as found in the literature Moisture content (%) Comment(s) Reference(s) Mixing Compaction At fluff point Fluff point is the
moisture content at which a given aggregates exhibits the greatest loose volume.
Bowering (1970) Brennen et al. (1983) Little et al. (1983)
65-85 of OMC 65-85 of OMC Strength properties such as stability are highest in this range of moisture content.
Bowering and Martin (1976) Lee (1981) Bissada (1987)
Empirical relationa Mixing moisture content
Moisture content is a function of OMC, fines and bitumen content.
Sakr and Manke (1985)
Empirical relationb OMC OMC is reduced by a certain amount in order to obtain the mixing water content.
Wirtgen (2005 and 2004)
Sensitivity analysis at 60, 80 and 100 of OMC
OFCc Compaction moisture includes water and binder quantities.
Jenkins (2000)
60 of OMC 80 of OMC OMC is obtained using vibratory hammer.
Asphalt Academy (2009)
80-90 of OMC 80-90 of OMC Khweir (2007)

12
NB: a: Mixing water content = 8.92 + 1.48OMC + 0.4PF – 0.39BC; where: OMC is optimum moisture content of aggregates, PF is the percentage of fines content, BC is the bitumen content. b: Mixing water content = OMC – MCred, where: MCred = 0.3OMC – 0.6 (for modified Proctor OMC), MCred = 0.4OMC – 0.8 (for standard Proctor OMC) and MCred = 0 for OMC less than 2%. c: OFC = optimum fluids content determined by preparing mixes at optimum mixing.
The amount of water is an important parameter in a foamed bitumen mixture; too little water impedes the dispersion of the binder, workability and compaction whilst too much water leads to increase in the curing time, reduction in strength of the compacted mix (Brennen et al., 1983).
Bitumen
It is imperative that the bitumen to be used in the foaming process gives the acceptable foaming characteristics; however studies have shown that virtually all bitumen types can be foamed. Csanyi’s work (1959) on treating various types of aggregates and soils with foamed bitumen showed that bitumens with penetration values ranging from 5 to over 300 would be foamed. It is recommended that mechanical characteristics such indirect tensile strength, resilient modulus, etc be determined for a range of binder contents and the design binder content be selected as the binder content at which these properties are optimised (Muthen, 1998). Table 5 illustrates typical binder contents for different aggregate fractions.
Table 5. Typical foamed bitumen contents relative to key aggregate fractions (Wirtgen, 2004; Muthen, 1998)
Percentage passing sieve size (%)
Foamed bitumen addition (% of dry aggregates)
4.75 mm 0.075 mm < 50 (gravels) 3.0 – 5.0 2.0 – 2.5 5.0 – 7.5 2.0 – 3.0 7.5 – 10.0 2.5 – 3.5 > 10.0 3.0 – 4.0 > 50 (sands) 3.0 – 5.0 2.0 – 3.0 5.0 – 7.5 2.5 – 3.5 7.5 – 10.0 3.0 – 4.0 > 10.0 3.5 – 4.5
Mixing techniques
The mixing process for foamed bitumen is a dynamic one since foamed bitumen starts to collapse the moment it gets into contact with a cold wet aggregate. It is imperative that the mixer employed produces enough energy to ensure that intimate mixing of the foamed bitumen and aggregate occurs. Care should be taken that stripping of the binder from the aggregate particles does not occur. Various mixers are available such as free-fall, drum, blenders, and pug mill mixers (Jenkins, 2000) for production of bituminous mixes. It is important that the mixer employed for use with foamed bitumen mixes adequately mixes the foamed bitumen with the aggregate before foamed bitumen decays completely. Pug mill mixers (basically consisting of a semi-circular bowl with two shafts having blades that churn the materials around) are recommended for use with foamed bitumen mixes in the laboratory, since they produce representative foamed bitumen mixes in comparison to other types of mixers (Asphalt Academy, 2009; Csanyi, 1959). These mixers provide sufficient volume in the

13
mixing chamber and energy of agitation ensuring that the mineral aggregate is airborne when it makes contact with the foamed bitumen.
Further, the mixing time should be long enough to allow the fine particles to be coated by the foam but not too long to avoid stripping of the binder from aggregate particles. A mixing time of 20 to 30 seconds is recommended for use in the laboratory when manufacturing foamed bitumen mixes (Asphalt Academy, 2009). From Sunarjono’s work (2008) it was observed that a mixing time of 60 seconds led to a well distribution of the mortar (mixture of foamed bitumen and fines) within the aggregate mass compared to mixing times of 2, 5 and 10 seconds; thus Sunarjono (2008) recommended a mixing time of 1 to 2 minutes.
Compaction
Compaction of the mixture of aggregates with foamed bitumen should simulate the field conditions such as voids content, density, and particle orientation after rolling. Various compaction methods have been employed in laboratory compaction of foamed bitumen mixes such as Marshall, Kneading, Hugo hammer, Kango hammer, vibratory hammer, Texas gyratory and other gyratory methods. The gyratory and vibratory hammer methods best simulate the field conditions of compaction. Table 6 summarises the different compaction methods.
Table 6. Compaction methods for foamed bitumen mixes as found in the literature
Compaction method
Comment(s) Reference(s)
Hveem kneading compactor
Bowering (1970) Bowering and Martin (1976) Lee (1981)
Marshall hammer Compaction is through impact action
Lee (1981) Brennen et al. (1983 Wirtgen (2004)
Texas gyratory compactor
Little et al. (1983)
Gyratory compactor
20 revolutions and ram pressure of 1.38 MPa.
Brennen et al. (1983)
150 cycles, angle of gyration of 3o, ram pressure of 0.54 MPa for 150 mm diameter moulds. For 100 mm diameter moulds, angle of gyration of 2o and ram pressure of 0.25 MPa.
Maccarrone et al. (1994) Saleh (2004)
Hugo hammer* 10.438 kg hammer falls through a 456 mm height, compaction is through impact and kneading.
Weston et al. (2002)
Kango hammer** 5 kg hammer falls through a 7 mm height, compaction is through vibration at a frequency of 45 Hz.
Weston et al. (2002)
Vibratory hammer Asphalt Academy (2009) NB: *: Was developed at University of Stellenbosch, South Africa

14
**: Was developed at University of Nottingham, United Kingdom.
Curing
After production and compaction of the foamed bitumen mixes, the mixes need to develop the required strength through a process known as curing. This involves expulsion of water from a mixed and compacted material through evaporation, particle charge repulsion or pore pressure induced flow paths and finally the spreading and coating of the aggregate particles by the bitumen (Jenkins, 2000; Asphalt academy, 2009). This process may go on for some time period ranging from a few days to years. The process of moisture loss leads to increased strength and stiffness of the material. For a pavement layer constituting a foamed bitumen mix, the curing process would be a function of air temperature, relative humidity, precipitation, depth of a layer, air permeability of the compacted mix, and drainage conditions at the boundary layer (Jenkins, 2000; Khweir, 2007). Various researchers have proposed different laboratory curing methods and the equivalent field cure conditions. It is very important that laboratory conditions simulate field conditions. Table 7 summarises of the different laboratory cure methods and corresponding equivalent field cure conditions as suggested by different researchers.
Table 7. Curing methods as found in the literature Curing method Comments Reference(s) Laboratory method* Equivalent field cure 3 days at room temperature (air cure) 3 days at 49oC
Csanyi (1960)
3 days at 60oC Bowering (1970) 3 days at 60oC Construction period +
early field life Bowering & Martin (1976)
6 – 10 months Acott (1979) 1 year Maccarrone et al. (1994)
Lancaster et al. (1994) 1 day in mould Short term Ruckel et al. (1983) 1 day in mould & 1 day at 40oC
Between 7 and 14 days (Intermediate)
Ruckel et al. (1983)
1 day in mould & 3 days at 40oC
30 days (Long term) Ruckel et al. (1983)
10 days in air & 50 hours at 60oC
Van Wijk and Wood (1983)
3 days at ambient temperature & 4 days vacuum desiccation
Little et al. (1983)
3 days at 23oC Roberts et al. (1984) 1 day in mould at room temperature & 3 days at 60oC
Lewis (1998)
Table 7 continued to next page

15
Table 7. Continued Curing method Comments Reference(s) Laboratory method* Equivalent field cure 72 hours at 40oC. For mixes
to be used in traffic conditions of less than 3 MESA
Asphalt Academy (2009)
20 hours at 30oC followed with 48 hours at 40oC sealed.
Represents long term cure conditions with 43 to 50% of OMC moisture contents.
For mixes to be used in traffic conditions exceeding 3 MESA
NB: *: Curing in an unsealed state in the oven, unless otherwise stated.
However, it can be expected that curing conditions could differ from region to region depending on the climatic conditions. In order to simulate field conditions, the curing temperature can be taken as the expected temperature of the pavement layer in the field, determined from pavement temperature and depth relations such as FHWA equations (SHRP, 1994) shown in equation [4].
� � � �2 3T T 1 0.063d 0.007d 0.004d 4
Where: T is the temperature of the layer located at depth d in inches under pavement
surface, T T
d surf
d
surf ai
� � � �
� 20.00618Lat 0.2289Lat 24.4,
T , T are the maximum pavement surface and average air temperatures respectively,
Lat is latitude in degrees.
r
surf air
� � �
Mix design procedures
The design of foamed bitumen mixes basically involves optimisation of the foam characteristics of given foamed bitumen, determination of the aggregate gradation, optimum foamed bitumen content, strength and durability characteristics (stability, tensile strength, stiffness, moisture susceptibility, etc). Previously, mix design procedures were based on Marshall stabilities and densities. More recently, asphalt design methods have shifted away from Marshall methods of design to dynamic test procedures such as indirect tensile test, dynamic creep, and others, due to availability of test equipment and because these tests measure fundamental material properties. Table 8 summarises the different mix design procedures used in the laboratory.

16
Table 8. Summary of mix design procedures used in the laboratory Mix design procedure
Moisture content requirements at:
Compaction Curing
a). Mixing b).Compaction Muthen (1998) OMC OMC Marshall
hammer 72 hours in oven at 60oC
Asphalt Academy (2009)
60% of OMC 80% of OMC Vibratory hammer method
24 hours in mould followed by 72 hours in oven at 40oC while sealed.
Wirtgen (2004) Empirical relation
OMC Marshall hammer
24 hours in mould followed by 72 hours in oven at 40oC
3.2. Properties
Properties such as density, voids content, tensile strength, stability, California bearing ratio (CBR), shear strength, compressive strength, stiffness, fatigue resistance, temperature and moisture susceptibility, creep, ageing suceptibility, permanet deformation are employed in the characterisation of foamed bitumen mix properties. Most of these are also employed in characetrisation of hot bituminous mix properties. Table 9 summarises the properties that have been employed in characterisation of foamed bitumen mixes.
Table 9. Typical properties of foamed bitumen mixtures/treated materials
Property Typical values Comment(s) Reference(s) Indirect tensile strength (ITS)
200-550 kPa
Bowering and Martin (1976)
200 kPa For dry specimens tested at 25oC and 0.87 mm/sec
Maccarrone et al. (1984)
100 kPa For wet specimens tested at 25oC and 0.87 mm/sec
Minimum value of 125 kPa
Dry indirect tensile strength
Asphalt Academy (2009)
Minimum value of 50 kPa
Wet indirect tensile strength
Soaked stability Marshal quotient
3.5 kN 1.5 kN/mm
Akeroyd and Hicks (1988) Akeroyd (1989)
Table 9 continued to next page

17
Table 9 continued
Property Typical values Comment(s) Reference(s) Shear strength c=160 kPa
Angle of friction- 45o Cohesion- 330 kPa Angle of friction- 36o
For crushed rock base with 2% foamed bitumen and 1% cement. For gravel base with 3% foamed bitumen and 1% cement
Wirtgen (2004)
Vane shear strength
155 kPa To limit permanent deformation to less than 15 mm at 40oC
Acott and Myburgh (1983)
Hveem resistance 65 Dynamic cone penetrometer
13.5 mm/blow
Vane shear strength Dynamic cone penetrometer
300 kPa 8 mm/blow
Properties for the mix at time of construction
Joubert et al. (1989)
Unconfined compressive strength (UCS)
500 kPa Specimens soaked for 4 days
Bowering (1970)
700 kPa Specimens cured for 3 days at 60oC
-For 150mm diameter specimens compacted to 100% modified Proctor
Wirtgen (2004)
Resilient modulus (loading time of 50 ms, 25oC)
6000 MPa For dry mixes Lancaster et al. (1994)
1500 MPa For wet mixes 1500 MPa For mixes to be used
as pavement layers Maccarrone et al. (1984)
Creep modulus Minimum of 20 MPa
Muthen (1998)
Retained strength Minimum of 50 %
Lewis (1998), Engelbrecht et al (1985)
Tensile strength
A pavement layer is subjected to repeated tensile stresses due to applied traffic loads. These tensile stresses lead to formation of tensile cracks within the layer. It is therefore important that the material constituting a pavement layer exhibits adequate tensile strength to withstand these tensile stresses. As in the case of hot bituminous mixes, the tensile strength of foamed bitumen mixes is expressed in terms of indirect tensile strength (ITS). The ITS test has been used in preference to Marshall Stability to evaluate the strength characteristics of bitumen stabilised materials. The ratio of ITS for wet to ITS for dry samples known as tensile strength retained or tensile strength ratio defines the moisture susceptibility of foamed bitumen treated mixes. Further, Engelbrecht et al (1985) observed that the ITS values for foamed bitumen treated materials were higher than those of materials treated with either cutbacks or bitumen emulsions. This would imply that foamed bitumen

18
mixes are less susceptible to moisture damage than mixes treated with cutbacks or emulsions. Studies on foamed bitumen treated mixes have shown that the ITS increases as the binder content increases reaching a maximum value and then reducing with increasing binder content. The foamed bitumen content at which the maximum value of wet ITS occurs is normally taken as the optimum binder content (Mallick and Hendrix, 2004). ITS also varies with curing conditions, Engelbrecht et al. (1985) observed that the higher the curing temperature, the higher the ITS and the lower the residual moisture content. Recommended values of ITS by various researchers are shown in Table 9, these values are low in comparison to those for hot bituminous mixes whose ITS values exceed 500 kPa, this could be attributed to high amounts of binder within the hot mixes.
Stability and California bearing ratio (CBR)
The Marshal stability increases with increasing binder content; mixes then attain a maximum value which then reduces with increasing binder content (Bowering and Martin, 1976). The recommended values of stability for foamed bitumen mixes for use in pavement layers are shown in Table 9. The CBR values of poor aggregates such as sands have been improved on addition of foamed bitumen. Bowering (1970) showed that the soaked CBR of sands treated with foamed bitumen was in range of 50-80% compared to 11% for sands that had not been treated with foamed bitumen, this represents an increase of four to six times. Also, Lee (1981) indicated that the CBR of foamed bitumen mixes consisting of 20% loess and 80% sand increased from 2% (for loess and sand without foamed bitumen) to 11% after three days of curing, and then to 108% after seven days of curing. This represents a fiftyfold increase in CBR. However, for foamed bitumen mixes made with pit run gravel (with high CBR values without foamed bitumen) there was no increase in the CBR after being treated with foamed bitumen. From these results, it can be deduced that materials with low values of CBR would be improved by addition of foamed bitumen. However, stability and CBR parameters are no longer used as characterisation parameters for bituminous mixes because of the advent of more sophisticated equipment that can measure more fundamental based parameters such as tensile strength and resilient modulus.
Shear strength
The shear strength of foamed bitumen materials consists of cohesion and friction components (Asphalt Academy, 2009). The cohesion is due to the mastic (bitumen and fines) well as the friction is due to the aggregate-aggregate particle contact. Wirtgen (2004) observed that foamed bitumen increases the cohesion of granular materials (such as crushed rock, gravel) by 50% and the angle of friction reduced by 8-9o. The increase in cohesion is due to presence of bitumen and the reduction in angle of friction can be attributed to the slight reduction in particle to particle contact by the presence of foamed bitumen. Studies by Jenkins (2000) on foamed bitumen mixes through triaxial tests revealed that foamed bitumen led to increase in cohesion in excess of 100 kPa after moderate curing of the specimens. In addition, there was a reduction in the angle of friction of less than 10o compared to the values for granular mixes without foamed bitumen. The strain at maximum applied axial stress was higher for foamed bitumen mixes than for granular materials. From Jenkins et al (2007) it was deduced that the deviator stress ratio was a critical parameter in stress analysis of foamed bitumen mixes. The critical deviator stress for foamed mixes was found to be in a range of 50-55% for permanent axial strain of less than 5% and one million number of load applications compared to 40-45% for coarse granular materials. Also, studies undertaken by Acott and Myburgh (1983) on mixes manufactured from sands treated with foamed bitumen and used in the actual pavement revealed that the shear strength increased with time. A tenfold increase from 35 kPa to over 400 kPa was observed after two years since the mixes had been laid. All this illustrates that incorporation of foamed bitumen into a granular material improves its strength and deformation properties.
Resilient modulus/Stiffness
Foamed bitumen increases the resilient modulus of a given unbound material (Jenkins, 2000; Saleh, 2007). This increase in resilient modulus is attributed to strong cohesive bonds resulting from presence of bitumen. The resilient modulus of foamed bitumen mixes exhibits stress dependent behaviour (resilient modulus increases with increasing total stress) like for granular materials (Jenkins, 2000; Nataatmadja, 2002; Fu and Harvey, 2007; Saleh, 2007b). This stress dependent behaviour is exhibited by mixes with less than 4% bitumen content having no cement added, and conditioned with cyclic loading (Jenkins, 2000). This conditioning simulates the trafficking effect by construction traffic on the mix in the field. The resilient modulus models as a function of

19
stress are shown in equations [5] and [6] for foamed bitumen mixes without active filler such as cement and with less than 4% binder content (Jenkins, 2000):
6 8
6 8
k k
31 1r 3 r 5 7
1f 30 1f
k k
d dr r 5 7
df 0 df
σσ σM - σ - model: M = k 1- k [5]σ σ σ
σ σθM - θ- model: M = k 1- k [6]σ θ σ
� �� � � �� �� � � �� �
� �� � � �� �� � � �� �
1 3 d
1f df
30 0
Where: σ , σ are major and minor principal stresses respectively, σ is the deviator stress, σ , σ are major and deviator stresses at failure respectively, θ is the total stress, σ , θ are refer 5 6 7 8ence values = 1kPa, k , k , k , k are regression constants.
Foamed bitumen mixes without active filler, whose bitumen content exceeds 4% and have not been conditioned with cyclic pulses do not exhibit the stress dependent behaviour (Jenkins, 2000). Also the resilient modulus is influenced by temperature and rise time. Maccarrone et al. (1994) observed that 50% reduction in resilient modulus occurred when the rise time was increased from 30 ms to 120 ms. Nataatmadja (2002) reported that the stiffness of foamed bitumen mixes consisting of 1.5-4.2% binder contents reduced by 30 to 44% when the temperature was increased from 10oC to 40oC. Fu and Harvey (2007) observed from cyclic triaxial and falling weight deflectometer tests that the resilient modulus/stiffness reduced with increasing temperature. From this study, equation [8] was deduced showing the variation of resilient modulus with temperature. This reduction in resilient could be attributed to bitumen softening as the temperature is increased.
� �
0
0
r 0 0
Mr rα(T-T )(T )=10 M (T) [8]
Where: M T is the resilient modulus at reference temperature T ,α is the temperature sens
� �r
itivity coefficient,M T is the resilient modulus at temperature T.
Further, the resilient modulus of foamed bitumen mixes (as part of a given pavement layer) decreases as
traffic loading increases reaching a constant value (Long and Theyse, 2004; Wirtgen, 2004; Asphalt Academy, 2009). The phase of reduction of resilient modulus is known as effective fatigue life and that for constant resilient modulus is known as equivalent granular state or constant stiffness state (Long and Theyse, 2004). Thus, it is imperative that this reduction in resilient modulus be taken into account when undertaking mechanistic analysis of pavements constituting foamed bitumen mixes.
Fatigue resistance
Foamed bitumen mixes with binder content exceeding 3.5% are considered to exhibit behaviour similar to hot asphalt mixes; they are expected to have defined fatigue lives (Jenkins, 2000). According to Little et al (1983) and Saleh (2007b) who studied fatigue characteristics of the mixes, it was observed that these mixes had short fatigue lives compared to those of hot bituminous mixes, although the materials could be used in the subbase or road base layers. Saleh (2007b) deduced the following models 9 and 10 for fatigue behaviour of foamed bitumen mixes.

20
� �-3 -1.2207 2f
-2.525 -1.9256 2f r
N = 7.67x10 ε (with R = 0.979) 9
N = 0.3208 ε M (with R = 0.996) 1� �f
r
0
Where : N is the number of load applications to failure,ε is the initial bending strain, M is the resilient modulus.
It can be noted that the first model is similar to the fatigue model for hot bituminous mixes. Similarly,
Maccarrone et al (1994) suggested that fatigue relations for hot bituminous mixes were also applicable to foamed bitumen mixes. Also, Bissada (1987) predicted that since foamed bitumen asphalt mixes are considered to lie between granular and hot mixes, their fatigue characteristics might be expected to be inferior to those of hot bituminous mixes. Although Lancaster (1994) reports on TRL research where the fatigue performance was comparable to dense graded hot bituminous mixes, the findings of Lancaster (1994) seem to contradict those of Little et al (1983) and Bissada (1987). Thus, fatigue characteristics of foamed bitumen mixes is an area that requires further research in order to gain insight into the fatigue behaviour of these mixes.
Temperature susceptibility
This defines the variation of properties such as indirect tensile strength, resilient modulus of a given mix with temperature. It has been observed that foamed bitumen mixes are not temperature susceptible in comparison to the hot bituminous mixes due to low binder contents. Bissada (1987) and Saleh (2007b) observed that foamed bitumen mixes were not temperature susceptible as compared to hot asphalt mixes, although the tensile strength and resilient modulus of foamed bitumen mixes decreased with increasing temperature (varied from 25oC to 50oC). This can be attributed to low binder contents, the larger particles are not coated with the binder. Friction exists between the larger particles and is maintained at high temperatures unlike in hot asphalt mixes where all particles. However, the viscosity of bitumen-fines mortar reduces at high temperatures thus accounting for the decrease in tensile strength and resilient modulus at high temperatures.
Moisture susceptibility
Ideally, it would be expected that a bitumen binder would reduce moisture susceptibility of the unbound material. Instead it has been observed that foamed bitumen mixes exhibit high susceptibility to moisture, and thus their strength characteristics are highly moisture dependent. This can probably be attributed to low binder contents and the high voids content of these mixes (Castedo et al., 1984; Muthen, 1998). Studies by Castedo-Franco et al (1983) on foamed bitumen mixes made with gravel showed that the resilient modulus reduced by 70% when mixes were exposed to water, illustrating the susceptibility of foamed bitumen mixes to moisture damage. Various researchers such as Castedo et al (1984), Asphalt Academy (2009), Wirtgen (2004), and others have recommended addition of hydraulic additives such as lime, cement, anti-stripping agents, etc to reduce the moisture susceptibility of these mixes. An additive like lime would attract water towards itself thus preventing the stripping of the binder from an aggregate. Alternatively, lime in form of a fine grained material stiffens the mix leading to improvement in strength (Castedo et al, 1984). Further, addition of anti-stripping agents could reduce this moisture susceptibility. However, limited literature is available on the effect of anti-stripping agents like amines on properties of foamed bitumen mixes. It has been reported that the type and quality of fines influence the moisture susceptibility (Bissada 1987), high plasticity and quantity of fines render the mix moisture susceptible. It has been reported that higher bitumen contents reduce the moisture susceptibility because higher densities are attained leading to lower permeabilities and to increased coating of the fines with the binder (Castedo et al, 1984; Muthen, 1998).
The Asphalt Academy (2009) recommends introducing moisture within foamed bitumen mix specimens (in a triaxial cell) in pulses and determining the cohesion. The ratio of cohesion of wet specimens to that for dry specimens defines the moisture susceptibility. This method simulates the actual moisture movements in the field as a result of repetitive traffic within the material and steady state saturation levels are achieved in a very short time (normally 3.2 minutes). Ruckel et al (1983) recommended the Asphalt Institute method of moisture exposure procedure in evaluation of moisture susceptibility of foamed bitumen mixes. In this method, laboratory

21
specimens are placed in a vacuum desiccator immersed in water and subjected to a vacuum of 100 mm of mercury whilst being covered with water for one hour. At least the top of the specimen should be covered with 13 mm of water. The vacuum is then released slowly and the specimen allowed to soak in water for another one hour. Ruckel et al recommended that the vacuum saturation method be carried out after specimens have been cured through intermediate or long term cure conditions. The method of vacuum saturation takes a short time but subjects the specimen to severe moisture conditions that may not occur in practice. Ruckel et al. deduced that the vacuum saturation method of moisture exposure simulates the effects of prolonged exposure of the mix to sub surface moisture such as in cases of heavy rains. Chen et al (2006) proposed moisture conditioning using the capillary method that involves soaking specimens that are 62 mm long in 6 mm of water and then determining the indirect tensile strength after 10 days. He asserts that this capillary conditioning closely simulated field conditions. Thus, care is needed to ensure that the strength of foamed bitumen mixes after moisture exposure is maintained within reasonable limits. Moisture susceptibility is established by determining the ratio of wet strength to the dry one expressed as a percentage.
Ageing susceptibility
Foamed bitumen mixes are characterised by high voids and uneven binder coating of the aggregate particles, factors that expose these mixes to ageing agents such as air. A study on mastics (filler, water and bitumen) prepared using foamed bitumen, revealed that for mastics cured at 40oC, the change in softening point as measured by the Ring and Ball test was small in comparison to other temperatures above 40oC (Jenkins, 2000). It was concluded that at the curing temperature of 40oC, there was little effect on ageing of the bitumen. However, this study was only done on the mastic portion of the mix, and the other aggregate fractions of the mix were not included. Generally, limited literature exists on the ageing susceptibility of foamed bitumen mixes, thus there is need for further research in this area.
Permanent deformation
This refers to the total cumulative strains within a given mix as a result of applied stresses. Foamed bitumen mixes are expected to provide good resistance to permanent deformation which possibly is attributed to the presence of fines and water that is added to the mix during the mixing stage to stiffen the mastic (filler, water and bitumen). This stiffness enhances the ability of the mix to take up plastic strains and thus good resistance to permanent deformation (Jenkins, 2000). Bissada (1987) analysed permanent deformation characteristics of sands treated with foamed bitumen using the creep test. This study showed that foamed bitumen sands were less susceptible to permanent deformation than the corresponding hot mixes with the same grading. Also work by He and Wong (2007) on permanent deformation of foamed asphalt mix containing reclaimed asphalt pavement materials illustrated that foamed bitumen mixes were less susceptible to permanent deformation compared to hot mixes. This low susceptibility to permanent deformation can also possibly be attributed to the low bitumen contents within these mixes. Also, the amount of fines within the foamed bitumen mix influences the permanent deformation characteristics. From Bissada’s work (1987) it was observed that the creep stiffness of mixes with more fines was higher compared to those with lower amounts. Since permanent deformation is directly proportional to the reciprocal of stiffness, this implies that mixes with high fines content would exhibit low permanent deformation or strains under applied loads than those with low fines content.
Attempts have been made to model the permanent behaviour of foamed bitumen mixes in terms of the number of load cycles deduced from the expected traffic, models [11] and [12] have been deduced to model this behaviour (Jenkins, 2000).

22
� �
For foamed bitumen mixes with 4% bitumen content and no active filler:α βln(N)
ε 11p 1000For foamed bitumen mixes wit
�� �� � �
� �
h active filler content of 2% maximum:NB DN 1000ε A C e 1 12p 1000
Where: ε is the permanent deformation, N is the number of load cycles, p
� �� � � �� � �� � � �
α, β, A, B, C and D are model parameters.
Long and Theyse (2004) developed transfer functions for foamed bitumen treated materials from heavy vehicle simulator test sections and laboratory data. They consist of the stiffness reduction (models reduction in resilient modulus) and permanent deformation (models constant stiffness behaviour) phase functions. These functions take into account reductions in the resilient modulus of foamed bitumen treated materials. The following equations [13] and [14] define the two phases for a given road category according to the South African standards (Long and Theyse, 2004).
� �b
ε6.339 0.708ε
F,FB
F,FB
For stiffness reduction phase:
Category A: N 10 13Where: N is the effective fatigue life of foamed bitume
�� �� � �� �� �� � � ��
b
n layer,ε, ε are the maximum tensile strain and strain at break respectively.
� �cem-2.047 11.938RD 0.0726PS-1.628SR 0.691bit
PD,FB
PD,FB
For permanent deformation phase:
10 Category A: N 1430
Where: N is the number of load repetitions, RD is the
�� �� � � � �� � � �
�
relative density,PS is the plastic strain (%), SR is the stress ratio, cem is the cement to bitumen contents ratio.bit
The above functions were developed with materials that had been treated with cement and foamed bitumen. Materials without cement or with other types of active filler such as lime were not included in the development of the functions.
Generally, foamed bitumen mix properties such as tensile strength, stability, shear strength, compressive strength, resilient modulus have been extensively studied. While properties such as fatigue resistance, creep, ageing susceptibility have not been studied in detail, thus the need for furthe rresearch on these properties.
3.3. Classification
Attempts have been undertaken to classify foamed bitumen mixtures by Asphalt Academy (2009). Three classes have been identified on the basis of the properties of the aggregate used, mixtures and traffic. Table 10
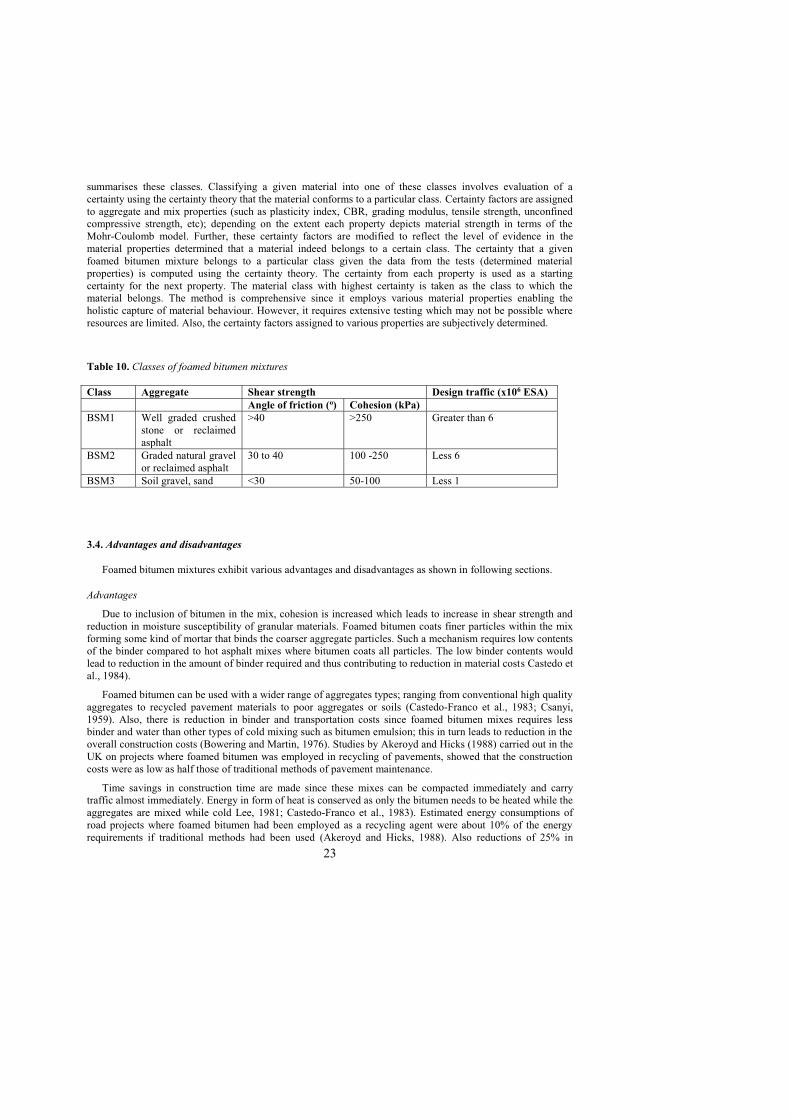
23
summarises these classes. Classifying a given material into one of these classes involves evaluation of a certainty using the certainty theory that the material conforms to a particular class. Certainty factors are assigned to aggregate and mix properties (such as plasticity index, CBR, grading modulus, tensile strength, unconfined compressive strength, etc); depending on the extent each property depicts material strength in terms of the Mohr-Coulomb model. Further, these certainty factors are modified to reflect the level of evidence in the material properties determined that a material indeed belongs to a certain class. The certainty that a given foamed bitumen mixture belongs to a particular class given the data from the tests (determined material properties) is computed using the certainty theory. The certainty from each property is used as a starting certainty for the next property. The material class with highest certainty is taken as the class to which the material belongs. The method is comprehensive since it employs various material properties enabling the holistic capture of material behaviour. However, it requires extensive testing which may not be possible where resources are limited. Also, the certainty factors assigned to various properties are subjectively determined.
Table 10. Classes of foamed bitumen mixtures Class Aggregate Shear strength Design traffic (x106 ESA) Angle of friction (o) Cohesion (kPa) BSM1 Well graded crushed
stone or reclaimed asphalt
>40 >250 Greater than 6
BSM2 Graded natural gravel or reclaimed asphalt
30 to 40 100 -250 Less 6
BSM3 Soil gravel, sand <30 50-100 Less 1
3.4. Advantages and disadvantages
Foamed bitumen mixtures exhibit various advantages and disadvantages as shown in following sections.
Advantages
Due to inclusion of bitumen in the mix, cohesion is increased which leads to increase in shear strength and reduction in moisture susceptibility of granular materials. Foamed bitumen coats finer particles within the mix forming some kind of mortar that binds the coarser aggregate particles. Such a mechanism requires low contents of the binder compared to hot asphalt mixes where bitumen coats all particles. The low binder contents would lead to reduction in the amount of binder required and thus contributing to reduction in material costs Castedo et al., 1984).
Foamed bitumen can be used with a wider range of aggregates types; ranging from conventional high quality aggregates to recycled pavement materials to poor aggregates or soils (Castedo-Franco et al., 1983; Csanyi, 1959). Also, there is reduction in binder and transportation costs since foamed bitumen mixes requires less binder and water than other types of cold mixing such as bitumen emulsion; this in turn leads to reduction in the overall construction costs (Bowering and Martin, 1976). Studies by Akeroyd and Hicks (1988) carried out in the UK on projects where foamed bitumen was employed in recycling of pavements, showed that the construction costs were as low as half those of traditional methods of pavement maintenance.
Time savings in construction time are made since these mixes can be compacted immediately and carry traffic almost immediately. Energy in form of heat is conserved as only the bitumen needs to be heated while the aggregates are mixed while cold Lee, 1981; Castedo-Franco et al., 1983). Estimated energy consumptions of road projects where foamed bitumen had been employed as a recycling agent were about 10% of the energy requirements if traditional methods had been used (Akeroyd and Hicks, 1988). Also reductions of 25% in

24
energy while using foamed bitumen in production of road construction materials have been reported (Saleh, 2007a). Environmental side effects resulting from the evaporation of volatiles from these mixes are avoided since curing does not result in release of volatiles as compared to cutbacks (Bowering and Martin, 1976; Castedo-Franco et al., 1983; Saleh, 2007a).
Foamed bitumen mixes can be stockpiled with no risk of binder runoff, leaching, and reduction in strength provided that moisture losses are prevented (Engelbrecht et al., 1985; Castedo-Franco et al., 1983; Lee, 1981). Also since these mixes can remain for much extended time periods, the usual time constraints of achieving compaction, shaping and finishing of a given pavement layer are avoided; thus exhibiting good workability. Also, they can be laid in adverse weather conditions (such as cold weather or light rain) without affecting the workability or the quality of the finished layer (Castedo-Franco et al., 1983). Further, these mixes can be placed using human labour, this can accrue employment opportunities for people in developing countries with vast amounts of cheap and readily available labour (Jenkins, 2000).
Disadvantages
When used for surfacing, the mixes exhibit low abrasion resistance (Bowering and Martin, 1976); though success of these mixes as surfacing layers have been reported (Larcombe and Newton, 1968). Studies carried out in Canada and North America, suggested that the low abrasion resistance could be eliminated by attention to aggregate grading and use of slightly higher bitumen contents. The use of surface active agents designed to modify aggregate surfaces before addition of the foam has also been found to improve abrasion resistance (Bowering and Martin, 1976). Generally, these mixes are limited to being used for surfacing applications because they exhibit a low resistance to ravelling and also due to their susceptibility to ageing as a result of high surface area of bitumen being exposed (Jenkins, 2000). However, anti-oxidants may be added to the mix to reduce ageing.
The mixes exhibit low early strength, thus it is recommended that when laid in the field should not be trafficked early; alternatively additions of 2 % lime or cement may be added to improve the early strength( Maccarrone et al., 1994).
The design methods for these mixes are relatively still new since the rapid evolution of the foamed bitumen technology has just started (Kendall et al., 1999; Wirtgen, 2004). Also, special purpose equipment is required to produce foamed bitumen, which may be expensive (Kendall et al., 1999).
Production of the mixes requires that bitumen is heated (up to temperatures of 150oC to 180oC); this posses the risk of burning to potential users (Kendall et al., 1999). Thus, personnel working with foamed bitumen need to wear protective clothing such as hand gloves, overalls, gum boots, etc.
4. Test methods
Test methods employed in the analysis of hot bituminous mixes and granular materials have also been used in the determination of foamed bitumen mixture properties; since these mixes exhibit both granular and visco-elastic behaviour. The tests are fundamental or mechanical, and empirical. Also, insitu tests such as the falling weight deflectometer, ground penetrating radar (Loizos and Plati, 2007), dynamic cone penetrometer tests (Acott and Myburgh, 1983), etc have been employed in testing of pavements were foamed bitumen mixes are part of the pavement layer system. Table 11 shows a summary of tests that have been employed in characterisation of foamed bitumen mixes.

25
Table 11. Tests for foamed bitumen mixes and properties obtained Test Engineering
properties Performance properties
Reference(s)
Indirect Tensile strength (ITS)
Tensile strength Fracture resistance Jenkins (2000)
Repeated load indirect tensile
Resilient modulus Load spreading ability Asphalt Academy (2002)
Triaxial Cohesion and angle of friction, Resilient modulus
Permanent deformation resistance Load spreading ability
Jenkins (2000) Wirtgen (2004)
Unconfined compressive strength
Compressive strength Crushing resistance Bowering and Martin (1976) Jenkins (2000) Wirtgen (2004)
Marshall stability Hveem Cohesiometer Hveem Stabilometer
Stability, plastic deformation Cohesion Resistance
Permanent deformation resistance
Bowering and Martin (1976) Bowering (1970)
Vane shear
Shear strength
Permanent deformation resistance
Acott and Myburgh (1983)
California Bearing Ratio (CBR)
Relative penetration by a standard plunger
Bowering (1970) Lee (1981)
Static creep Dynamic creep
Plastic deformation Permanent deformation resistance
He and Wong (2006)
Repeated load Indirect Tensile (ITT)
Resilient modulus or stiffness
Load spreading ability Sunarjono (2008)
5. Case studies
Foamed bitumen technology has been applied in pavement construction in order to determine or understand the field behaviour of the mixes under actual traffic and weather conditions. The sections below outline some of the case studies where foamed bitumen has been employed as a pavement material. From these case studies, it can be deduced that foamed bitumen allows use of locally available materials such as sands, loess and this in turn can lead to cost savings. Also, it can be employed in recycling of road asphalt pavement (RAP) material.

26
5.1. Iowa case studies (Csanyi and Fung, 1956)
The mixes used in this case study consisted of sand-loess and sand-limestone dust mixes. The sand-loess mix was made up of 75% sand, 25% loess and 6% of 150/200 penetration grade bitumen. The sand-limestone dust mix was made up of 67% fine sand, 33% limestone dust and 5.5% of 150/200 penetration grade bitumen. During the production of these mixes, the aggregates were heated up to 177oC temperature and mixed with foamed bitumen that was produced by the atomization process. In the atomization process, the bitumen was heated to temperatures of 160oC to 180oC and dispersed under pressure through a series of nozzles onto the aggregates; this process leads to formation of many droplets within the binder. These mixes were either laid as wearing course materials with thickness varying from 13 mm up to 25 mm or as road base materials with thickness ranging from 88 mm up to 175 mm. The test sections used in this study represented typical secondary roads in Iowa. The following observations were made during the paving operations:
Mixes could not be rolled hot; 40oC was the best rolling temperature. Mixes could not be compacted with a steel tandem roller when the depth was less than 25 mm instead pneumatic rollers performed better.
Mixes with the right amount of binder were workable. For mixes containing limestone dust, the binder content was a very critical parameter; excess amounts of binder caused the mix to ball up and made it difficult to spread the mix.
The following observations were made when sections were opened to traffic:
Under hot weather conditions with the highest temperature of 35oC, parked cars left shallow tyre prints in the pavement surface but moving traffic did not cause any rutting or shoving of the pavement surface. However, with time the tyre prints left by parked vehicles were smoothened out by moving traffic.
Hair cracks that occurred during the construction stage were healed at the time of trafficking the pavement. After several weeks under traffic the pavement sections became firmer. Further, when the temperature reduced to below 0oC, it was observed that no cracks, abrasion wear and damage from tyre chains and snow ploughing occurred to the test sections. This illustrated that the mixes performed well under cold conditions.
During the spring conditions, alligator cracks were observed over small areas, these were attributed to weakening of the subgrade during the thaw conditions. Also in one or two places the pavement test sections subsided slightly, this was again attributed to subgrade settlement.
From this study, it was concluded that the foamed bitumen formed a mortar which consisted of thin films of bitumen coating mineral dust particles; this mortar then binds the rest of aggregate particles into a composite mass that forms the mixture. Thus such paving mixtures produced from ungraded aggregates such as loess, limestone dust, and sand using foamed bitumen could be used in secondary roads.
5.2. Pavement section in North Texas (Chen et al, 2006)
This section consisted of a 4.8 km length pavement that was rehabilitated using foamed bitumen recycling. The new pavement structure constituted a 50 mm asphalt concrete as the surfacing that was laid onto a foamed bitumen base which in turn overlaid the subgrade. The base was constructed from surfacing and base layers, with PG64-22 bitumen and 1% cement. Also, another pavement section consisting of a lime stabilised base was built adjacent to this section for comparison purposes. Figure 5 illustrates the pavement section before and after rehabilitation.

27
Figure 5. Pavement structure before and after rehabilitation using foamed bitumen
However, eight months after the re-construction some cracking was observed on the section with the foamed bitumen base. Further, after one year severe alligator cracking and rutting of as much as 50 mm deep had occurred over a 120 m length section of the 4.8 km long section that had a base treated with foamed bitumen. A study was then undertaken to determine the cause of failure in this section. Various field tests, such as falling weight deflectometer, seismic pavement analyser, ground penetrating radar, and dynamic cone penetrometer (DCP) were undertaken over the entire 4.8 km length section. In addition to field tests, laboratory tests such as gradation, moisture content, and indirect tensile strength were conducted on cores from the asphalt concrete and foamed bitumen base layers, as well as the subgrade material. Also, moisture susceptibility tests were undertaken on foamed bitumen treated material samples. These involved exposing samples to moisture either through soaking in water for 24 hours or using the capillary method, in which 62 mm thick samples were soaked in 6 mm of water for 10 days after which the indirect tensile strength was determined. The results obtained are summarised in Table 12.
The variation of deflection for the lime stabilised base section was much lower compared to that of the foamed bitumen treated base, which is on average twice that for the lime stabilised section. The distressed section with the foamed bitumen base, exhibited higher deflections compared to the section without distresses (but with foamed bitumen base), Table 13. These high deflections were due to loss in strength.
The base moduli computed from the DCP results for the distressed section were lower compared to those for the section without distresses. However, the subgrade moduli were relatively constant throughout the distressed and undistressed sections. Thus, probably the subgrade was not responsible for the observed distresses.
Table 12. A summary of field and laboratory results Property Layer
Lime base
Foamed bitumen base Subgrade
Distressed section
Intact section Distressed section
Intact section
Deflection (mm)
0.51-1.02 0.25-2.29
0.38-2.29 0.25-1.02 Modulus (N/m2)
137-172 172-483 69
Dielectric constant
8 10
Asphalt concrete
Foamed bitumen base
Subgrade
250mm
50mm
Asphalt concrete
Flexible base
Subgrade
114m
150mm
a). Before b). After

28
Table 12 continued to next page Table 12 continued Property Layer
Lime base
Foamed bitumen base Subgrade
Distressed section
Intact section Distressed section
Intact section
Wet tensile strength
68 78
Stiffness 110 Density (kg/m3)
103 110
Moisture content (%)
14.5 15
Plasticity index (%)
16 24
Gradation Within specified limits except for the 9.5mm sieve
Within specified limits except for smaller sieves where gradation fell below the limits
It was visually observed that the foamed bitumen base in the distressed section was loose and lacked
cohesion compared to that for the undistressed section which was intact. Results from the ground penetrating radar showed that the foamed bitumen treated section had a higher dielectric constant than the lime stabilised section, Table 13. This would imply that that the foamed bitumen treated section had higher moisture content than the lime stabilised section as the dielectric constant is directly proportional to the amount of water.
Laboratory tests conducted on the asphalt concrete material to determine the binder content, gradation and penetration showed that the differences in results for the asphalt concrete material obtained from the distressed and undistressed sections were less than 10%. This implies that there was no significant difference in asphalt concrete properties between distressed and intact sections. Thus the asphalt concrete layer was probably not responsible for the distresses observed. The subgrade laboratory stiffness determined from the free-free resonant column method was on average constant average for both the intact and distressed sections. This implies that probably the subgrade was not responsible for the distresses observed. The plasticity index for the intact section was higher than that for the distressed section. This would imply that the failures observed could not have been caused by the plasticity of the base material but probably by external factors.
Moisture susceptibility tests revealed that samples (subjected to capillary conditioning) from the intact area had on average a higher retained strength than those from the distressed areas. Employing a standard retained strength of 75%, samples from the intact section with foamed bitumen treated base could resist moisture unlike those from the distressed section.
From this study, it was concluded that the observed distresses (rutting and alligator cracking) were due to the localised failure of part of the section with a foamed bitumen treated base. This base failure was attributed to high moisture in the subgrade, fine gradation and inconsistencies in construction at this particular section. Further, it was recommended that the binder or the cement content would have been increased to counteract the effects of water from the subgrade.

29
5.3. Brown’s road (Bowering and Martin, 1976)
This road was a tourist road serving an ocean surf beach and was located about 96 km from Melbourne, Australia. The pavement structure was made up of bituminous seal laid over a road base 200 mm thick consisting of clean and silty sand with 5% foamed bitumen content Sands were employed as these were occurring abundantly in the area. The bitumen used in producing the foamed bitumen was a 60 penetration grade type and confirmed to the requirements of Australian Standard AS 10-1967. During construction phase the following observation(s) were made:
The road base CBR as determined by the dynamic cone penetrometer varied from 8-11% after completion of compaction to 17-27% after opening to light traffic and weather for a period of 1-2 weeks. In addition, during this period the moisture content of the road base was almost constant at OMC to OMC +2%, reaching OMC + 4% within the top 50 mm.
During trafficking period the following observations were made:
It was observed that after a two year period the CBR increased to 94% (this represents an increase of over threefold). The moisture content reduced over the two year period to 30-60% of that existing when the bituminous seal was applied. Further, no cracking and rutting occurred on the road over this two year period. Non-destructive tests carried out on the road using the Rayleigh wave technique revealed that the dynamic Young’s modulus increased by 50% three weeks after mixing and compaction of the base layer, and after four
months the Young’s modulus was three times that of the original material.
From this case study, it can be deduced that the strength properties such as modulus, CBR, and shear strength of foamed bitumen mixtures increase with time as the mixture experiences the impacts of traffic loads.
5.4. Kleinvlei road (Acott and Myburgh, 1983)
This road was a 0.6 km in length and falls under a collector road type in Cape Town, South Africa. It was divided into four sections with different road base aggregate treated with 3% foamed bitumen produced from 60/70 penetration grade bitumen. The aggregates used in the road base included aoelian costal deposit with 10% filler, 67% of aeolian sand with 33% quarry overburden blend, 50% aeolian sand with 50% quarry overburden, 25% aeolian sand with 75% quarry overburden blend. The base layer was 150 mm thick and was underlain by an aeolian sand subgrade; a chip and spray bituminous seal was applied two months after construction of the road base. The following observations were made over a five year monitoring period:
After 20 months, the average daily traffic in the northbound and south bound lanes was 40 and 25 equivalent single 80-kN axle loads (these values of traffic are low). The base deflection reduced from 0.4 to 0.6 mm to about 0.2 to 0.3 mm after four years. This was attributed to increase in stiffness of the foamed bitumen treated base and consolidation of the layer. This possibly implies that the base could adequately protect the sand subgrade from the effects of traffic.
The vane shear strength of the road base increased from below 50 kPa up to 500 kPa over 4.5 years, this is a nine fold increase in shear strength. The dynamic cone penetration value reduced over a 4.5 year period, penetration reduced from 7 to 24 mm per blow to 3 to 5 mm per blow. Reduced penetration shows increased stiffness of the layers.
All sections were rated as being of acceptable quality by an inspection panel. The typical rut depth measured for the three sections was 7 mm with one section having a rut depth of 10 to 12 mm. This rut depth of 10 to 12mm was attributed to a higher deformation in the outer wheel path as a result of poor bitumen dispersion in the mix.
From these observations, it can be concluded that poor materials such as sands can be stabilised with foamed bitumen to form materials for road base layers to be used in low traffic pavements. Generally all the above case studies have demonstrated the potential of foamed bitumen as a road construction material.

30
6. Conclusions
Foamed bitumen consists of hot bitumen through which water has been dispersed temporarily forming a foam state with the liquid state consisting of liquid bitumen and steam in the gaseous state. It exists for a short period of time and can be classified as liquid foam. Expansion ratio, half life, foam index, minimum foam viscosity and coefficient of foamability currently are the parameters employed in foamed bitumen characterisation. However, these seem not to be adequate in characterising the foam. Since the expansion ratio and half life vary differently it is not possible to optimise the two parameters. Attempts by other researchers to use the foam index in foam characteristics optimisation have not been successful. Other parameters such as minimum viscosity and coefficient of foamability have been employed by few researchers. Thus there is need to devise a rational method to determine optimum foam characteristics.
Foamant water, type and composition of bitumen, bitumen temperature, bitumen source, bitumen and water pressure, additives, temperature of vessel in which foam is collected influences the foam characteristics. However, few studies have been carried out on effects of bitumen source and composition on foam characteristics.
Foam characteristics exert an influence on the resulting properties of foamed bitumen mixes, although few studies have been carried out to study in detail the effects of foam characteristics on the resulting mixes.
Bitumen within a given foamed bitumen mixture is concentrated in the fine fraction, this leads to the bitumen being dispersed within the mix. This implies that for a material to be treated with foamed bitumen must contain both the fine and filler fractions. A minimum of 3-5% fine fraction is recommended; although there seems to be no scientific explanation in literature of why foamed bitumen combines with the fines. Aggregate grading and properties such as plasticity have been used as the main factors to determine the suitability of the material to be treated with foamed bitumen, other factors such as mineralogy, porosity have not been employed.
Foamed bitumen mix properties such as stability, tensile strength, fatigue, moisture susceptibility are inferior to those of hot bituminous mixes due to probably low binder contents and also uncoated large aggregate particles. However, foamed bitumen mixes are less susceptible to temperature variation and permanent deformation compared to hot bituminous mixes, this being possibly attributed to small amounts of the binder within the foamed bitumen mix and uncoated large aggregate particles. Foamed mixes are susceptible to damage arising out of moisture and ageing due to high voids and small quantities of bitumen binder within these mixes; thus there is need to devise solutions that can mitigate against moisture and ageing damages. Also, the effects of anti-stripping agents on the property of moisture susceptibility of the foamed bitumen mixes should be further investigated.
An attempt has been made to model the performance of foamed bitumen mixes in terms of the variation of the resilient modulus with different applied stresses, and the permanent deformation in terms of the number of load applications; however other effects such as moisture on the resilient modulus have not been included.
Tests such as indirect tensile strength, triaxial, dynamic creep, Marshall stability, Hveem stabilometer, Hveem cohesiometer, California bearing ratio, unconfined compressive strength can be employed in characterisation of materials that have been stabilised with foamed bitumen. Although tests such as Marshall stability, Hveem stabilometer, Hveem cohesiometer, California bearing ratio do not measure fundamental characteristics of the mixes. Generally tests that are used in characterisation of hot bituminous mixes and granular materials are also employed in characterisation of foamed bitumen mixes.
Attempts have been made to classify foamed bitumen mixes on the basis of traffic, aggregate and mix properties into three material classes. The certainty theory has been applied to evaluate the relative contribution of each of aggregate and mix properties to the Mohr-Coulomb model. Although the method of classification is

31
comprehensive, but requires extensive testing and also the certainty factors used are subjectively assigned to the aggregate and material properties.
Acknowledgments The authors are grateful for the financial assistance accorded by Swedish Development Agency (Sida) of Sweden. The resources at Väg and Ban Teknik, KTH- Royal Institute of Technology, Sweden are highly appreciated.
References
Abel F., “Foamed asphalt base stabilization”, Presented at 6th Asphalt Paving Seminar, Colorado State University, Fort Collins, 1978.
Acott S. M., ”Sand stabilisation using foamed bitumen”, Proceedings of Third Conference on Asphalt Pavements for Southern Africa, Vol. 2, Durban 1979, p. 155-172.
Acott S. M. and Myburgh P. A., “Design and performance study of sand bases treated with foamed asphalt”, Low-Volume Roads: Third International Conference, 1983, Transportation Research Record 898. Transportation Research Board, National Research Council, Washington DC. p. 290-296.
Akeroyd F. M. L. and Hicks B. J. (1988), “Foamed bitumen road recycling”, Highways January, London. Vol. 56, No. 1933, 1988, p. 42-45.
Akeroyd F. M. L., “Advances in foamed bitumen technology”, 5th Conference on Asphalt Pavements for Southern Africa, Swaziland, 1989, p. VIII-1 – VIII-4.
Asphalt Academy, “Technical guideline: Bitumen stabilised materials”, A guide for the design and construction of bitumen emulsion and foamed bitumen stabilised materials, TG 2, First Edition, Asphalt Academy, Pretoria, South Africa, May 2009.
Barinov E. N., “Formation and properties of bituminous foams”, Journal of Chemistry and Technology of Fuels and Oils, 1990, Springer, New York, p. 544-548.
Bissada Amir F., “Structural response of foamed-asphalt-sand mixtures in hot environments”, Transportation Research Record 1115, 1987, Transportation Research Board, National Research Council, Washington DC, p. 134–149.
Bowering R. H., “Properties and behaviour of foamed bitumen mixtures for road building”, Proceedings of the 5th Australian Road research Board Conference, held in Canberra, Australia, 1970, p. 38-57.
Bowering R. H. and Martin C. L., “Foamed Bitumen: Production and application of mixtures, Evaluation and performance of pavements”, Proceedings of Association of Asphalt Paving Technologists, Vol. 45, 1976, Asphalt Paving Technology, p. 453-473.
Brennen M., Tia M., Altschaeff A., and Wood L. E., “Laboratory investigation of the use of foamed asphalt for recycled bituminous pavements” Transportation Research Record 911, 1983, Transportation Research Record Board, National Research Council, Washington DC, p. 80-87.
Brennen M., Tia M., Altschaeffl A. and Wood L. E., << A laboratory investigation on the use of foamed asphalt for recycled bituminous pavements >>, Purdue University, West Lafayette, in Joint Highway Research Project, January 1981.
Breward C. J. W., << Mathematics of foam >>, Doctor of Philosophy Thesis, 1999, University of Oxford, UK, p. 1-11.
Castedo-Franco L. H.; Wood L. E., and AltschaeffA. G., << Laboratory mix design procedure for foamed asphalt mixtures >>, 1992, Indiana Department of Highways, Indianapolis.

32
Castedo-Franco. H. L., and Wood Leonard E., “Stabilization with foamed asphalt of aggregates commonly used in low-volume roads”, Low-Volume Roads: Third International Conference, 1983, Transportation Research Record 898, Transportation Research Board, National Research Council, Washington, DC, p. 297-302.
Castedo H., Beaudoin C. C., Wood L. E., and Altschaeffl A. G., “Durability characteristics of foamed asphalt mixtures”, Proceedings of the 29th Annual Canadian Technical Asphalt Association Conference, held in Montreal, Canada, 1984, p. 102-122.
Chen D., Bilyeu J., Scullion T., Nazarian S., and Chiu C., “Failure investigation of a foamed-asphalt highway project”, Journal of Infrastructure Systems, Vol. 12, No. 1, 2006, ASCE, p. 33-40.
Csanyi L. H and Fung H., “Mortar theory for use of ungraded aggregates in bituminous mixes”, Highway Research Board, 1956, Bulletin No. 109.
Csanyi L. H., “Foamed asphalt in bituminous paving mixtures”, Highway Research Board, Bulletin 161, 1957, National Research Council, Washington DC, p. 108-122.
Csanyi L. H., “Foamed asphalt”, Technical Bulletin No. 240, 1959, American Road Builders Association, Washington, DC.
Csanyi L. H., << Bituminous mixes prepared with foamed asphalt >>, Bulletin 189, 1960, Iowa Engineering Experiment Station, Ames.
Engelbrecht J. C., Roberts F. L. and Kennedy T. W., “Cold recycled mixtures, with emphasis on the curing of foamed specimens - a laboratory study”, Annual Transportation Convention, Session – Maintenance of the Transport Infrastructure, held in Pretoria, 1985, Vol. S. 350 TI, p. 7.
Fu P. and Harvey J. T., “Temperature sensitivity of foamed asphalt mix stiffness: field and lab study”, International Journal of Pavement Engineering, Vol. 8, No. 2, June 2007, Taylor and Francis group, UK, p. 137-145.
Gauteng HVS- Heavy Vehicle Simulator, << Interim Guidelines for the Design and Use of Foamed Bitumen Treated Materials >>, Available Online: http://www.gautrans-hvs.co.za/foamed%20bitumen.html. Accessed on 11/04/2005.
He G. and Wong W., “Decay properties of foamed bitumens”, Journal of Construction and Building Materials, 2005, Article in press, Available online at: www.elsevier.com/locate/conbuildmat, Elsevier Ltd, p. 1-12.
He G. and Wong W., “Laboratory study on permanent deformation of foamed asphalt mix incorporating reclaimed asphalt pavement materials”, Journal of Construction and Building Materials, Vol. 21, 2007, Elsevier Ltd, p. 1809-1819.
Huang Yang H., Pavement analysis and design, Prentice Hall, Inc, USA, 1993, p. 316-317, 328-329.
Jenkins K. J., << Mix design considerations for cold and half-warm bituminous mixes with emphasis on foamed bitumen >>, PhD dissertation, 2000, University of Stellenbosch, South Africa, 2000.
Jenkins K. J, Long F. M. and Ebels L. J., “Foamed bitumen mixes= shear performance?”, International Journal of Pavement Engineering. Vol. 8, No. 2, 2007, Taylor & Francis, United Kingdom, p. 85-98.
Joubert G., Poolman S. and Strauss P. J., “Foam bitumen stabilised sands as an alternative to gravel bases for low volume roads”, Proceedings of 5th Conference on Asphalt Pavements for South Africa (CAPSA 89), Swaziland, 5-9 June, 1989, Section 8, p. 21-5.
Kendall M., Baker B., Evans P., and Ramanujam J., “Foamed bitumen stabilisation” Southern Region Symposium, 1999.
Khweir K., “Performance of foamed bitumen stabilised mixtures”, Proceedings of the Institution of Civil Engineers, Transport 160 Issue TR2, 2007, Institution of Civil Engineers, p. 67-72.
Lancaster J., McArthur L., and Warwick R., “VICROADS experience with foamed bitumen stabilisation”, Proceedings of 17th ARRB Conference held in Gold coast, Queensland, 15-19 August, 1994, Vol. 17, Part 3, p. 193-211.
Larcombe L. A. and Newton R., “The use of foamed bitumen premix as a surface course for rural pavements”, Proceedings of 4th ARRB Conference, Vol. 4, 1968, Part 2, p. 1567-79.
Lee D. Y., “Treating marginal aggregates and soils with foamed asphalt”, Proceedings of the Association of Asphalt Paving Technologists, Vol. 50, 1981, Asphalt Paving Technology, p. 211-250.
Lesuer Didier, He`le`ne Clech, Aline Brosseaud, Christian Such, Bogdan Cazacliu, Burgard Koenders, Pierre-Jean Ce`rino and Jacques Bonvallet, “Foamability and foam stability”, International Journal of Road and Pavement Design, Vol. 5, No. 3, 2004, Hermes Science Publications, France. p. 277-302.

33
Lewis A. J. N. and Lindsay R.,“Foamed bitumen- A cost effective treatment for road building materials”, Proceedings of the 1st Asia Pacific Conference on Transportation and Environment, 13-15 May 1998.
Little Dallas N., Button Joe W., and Epps Jon A., “Structural properties of laboratory mixtures containing foamed asphalt and marginal aggregates”, Transportation Research Record 911, 1983, Transportation Research Board, Washington D.C., p. 104-113.
Loizos A. and Plati C., “Ground penetrating radar as an engineering diagnostic tool for foamed asphalt treated pavement layer”, International Journal of Pavement Engineering, Vol. 8, No. 2, 2007, Taylor & Francis, U.K., p. 147-155.
Long F. and Theyse H. (2004). “Mechanistic-empirical structural design models for foamed and emulsified bitumen treated materials” Proceedings of the 8th Conference on Asphalt Pavements for Southern Africa (CAPSA’04), 12-16 September 2004, Sun City South Africa, p. 102.
Maccarrone S., Holleran G., Leonard D. J. and Hey S., “Pavement recycling using foamed bitumen”, Proceedings of 17th ARRB Conference held in Gold Coast, Queensland, 15-19 August, 1994, Vol. 17, Part 3, p. 349-365.
Mallick Rajib B. and Hendrix Grant Jr., “Use of foamed asphalt in recycling incinerator ash for construction of stabilized base course”, Journal of Resources Conservation and Recycling, Vol. 42, 2004, p. 239-248, Available Online: www.elsevier.com/locate/resconrec
Mitvalsky V., << Foamed asphalt and foamed mixes >>, Douglas Oil Company, Los Angeles, California., Technical Report, 1979.
Muthen K. M., << Foamed asphalt mixes- Mix design procedure >>, Contract Report No. CR-98/077, 1998, SABITA Ltd & CSIR Transportek, Pretoria.
Namutebi May, << Some aspects of foamed bitumen technology>>, Licentiate Thesis in Highway Engineering, KTH Architecture and the Built Environment, 2011.
Nataatmadja A.,“Foamed bitumen mix: soil or asphalt?”, Proceedings of the 9th conference on Asphalt Pavements, August 17-22, 2002, Copenhagen, Denmark.
Pierre Hotte, Yves Thériault, “Foamed asphalt stabilization not only for low-volume roads” Proceedings of the 1997 Conference of the Northeast Association of State Transportation Officials, 1997, Congrés de la Northeast Association of State Transportation Officials, p. 113-125.
Read J. and Whiteoak D., The shell bitumen handbook, 5th Edition, Shell UK Oil Products, Limited, 2003.
Roberts F. L., Engelbrecht J. C. and Kennedy T. W., “Evaluation of recycled mixtures using foamed bitumen”,
Transportation Research Record 968, 1984, Transportation Research Board, National Research Council, Washington D.C., p. 78-85.
Ramanujam J. M. and Jones J. D., “Characterization of foamed bitumen stabilisation”, International Journal of Pavement Engineering, Vol. 8, No. 2, 2007, Taylor and Francis, U.K., p. 111-122.
Redelius Per, “Bitumen solubility model using Hansen solubility parameter”, Journal of Energy and Fuels, Vol. 14, No. 4, 2004, American Chemical Society, p. 1087-1092.
Romanoschi S. A., Hossain M., Heizzman M., and Gisi A. J., “Foamed asphalt stabilized reclaimed asphalt pavement: A promising technology for mid-western roads”, Proceedings of the 2003 Mid-Continent Transportation Research Symposium, Ames, Iowa, August 2003. Iowa State University.
Ruckel P. J., “Foamix asphalt- An alternative mixing method”, Paper presented at the 22nd Annual Kansas Asphalt Paving Conference, November 1978, The University of Kansas, Lawrence, Kansa.
Ruckel P. J., Acott S. M. and Bowering R. H., “Foamed-asphalt paving mixtures: Preparation of design mixes and treatment of test specimens”, Transportation Research Record 911, 1983, Transportation Research Board, National Research Council, Washington D.C., p. 88-95.
Sakr Hazem A. and Philip G. Manke, “Innovations in Oklahoma foamix design procedures” Transportation Research Record 1034, 1985, Transportation Research Board, Washington D.C., p. 26-34.
Saleh M. F., “Cost evaluation of foam bitumen and other stabilisation alternatives”, International Journal of Pavement Engineering, Vol. 8, No. 2, June 2007a, Taylor and Francis group, U.K., p. 157-161.
Saleh M. F., “Effect of rheology on the bitumen foamability and mechanical properties of foam bitumen stabilised mixes”,
International Journal of Pavement Engineering, Vol. 8, No. 2, June 2007b, Taylor and Francis group, U.K., p. 99-110.

34
Saleh M. F., “Characterisation of foam bitumen quality and the mechanical properties of foam stabilised mixes” 10th International Conference of Asphalt Pavements, 2006a, Quebec, Canada.
Saleh M. F., << Detailed experimental investigation of foam-stabilised mixes >>, Transfund New Zealand Research report No. 258, 2004.
Somayaji Shan, Civil engineering materials 2nd Edition, Prentice Hall, Upper Saddle River, New Jersey, USA, 2001, p. 354-392.
Strategic Highway Research Program (SHRP), << Weather database for the super pave mix design systems >>, SHRP-A-648, Washington DC, 1994.
Sunarjono Sri, Ir., M. T., << Influence of foamed bitumen characteristics on cold mix asphalt properties >>, Doctoral Thesis, 2008, Nottingham Transportation Engineering Centre, University of Nottingham.
Technote 11, Foamed bitumen, Available online: http://www.slurry.com/technology_technote11.shtml, Accessed on 20th June 2006.
Van Wijk A. and Wood L. E., “Use of foamed asphalt in recycling of an asphalt pavement” Transportation Research Record 911, 1983, Transportation Research Board, National Research Council, Washington D.C., p. 96-103.
Weaire D., “Foam Physics”, Journal of Advanced Engineering Materials, Vol. 4, Issue No. 10, 2002, Wiley-VCH Verlag GmbH & Co., p. 723-725.
Weaire D. and Hutzler S., The physics of foams, Oxford University Press, Oxford, 1999.
Weston C. T., Amsterdam E. V. and Jenkins K. J., “A study into mechanical properties of foamed bitumen stabilised materials”, Proceedings of 21st Annual South African Transport Conference, 15-19 July 2002.
Whiteoak D., The Shell Bitumen Handbook, Shell Bitumen, U.K, 1991.
Wirtgen, Laboratory-scale foamed bitumen plant WLB 10, Wirtgen GmbH, 2001.
Wirtgen, Cold Recycling Manual, Second Edition, Wirtgen GmbH, 2004, p. 76-89.
Wirtgen, Foamed bitumen mix design procedure using the Wirtgen WLB 10, Wirtgen group, 2005.


Road Materials and Pavement Design. Volume 12 – No. 4/2011, pages 821 to 847
Foaming Effects on Binder Chemistry and Aggregate Coatability using Foamed Bitumen May Namutebi* — Björn Birgisson* — Umaru Bagampadde** * Division of Highway and Railway Engineering KTH- Royal Institute of Technology Brinellvägen 23, 100 44 Sweden [email protected] [email protected]
** Department of Civil Engineering Makerere University P.O. Box 7062 Kampala, Uganda [email protected] ABSTRACT. Foaming effects on binder chemistry were investigated using two bitumens from different sources with similar grades. Infrared spectroscopy techniques were done on neat and foamed bitumen samples. Aggregate particle coating with foamed bitumen was studied using Rice density and surface energy concepts. Infrared spectra results showed that foaming does not change the bitumen chemistry. Rice density tests showed that the aggregate size mainly influenced binder coating of aggregate particles, bitumen was mostly concentrated within the fine fraction where foamed bitumen was used. Surface energy results revealed that foamed bitumen possesses higher coating attributes than neat bitumen. Film thickness results implied that aggregate size and surface area, expansion ratio and binder viscosity influences binder thickness. KEYWORDS: Foamed Bitumen, Ageing, Surface Energy, Aggregate Coating, Rice Density, Theoretical Binder Film Thickness.
DOI:10.3166/RMPD.12.821-847 © 2011 Lavoisier, Paris

822 Road Materials and Pavement Design. Volume 12 – No. 4/2011
1. Introduction
The challenges of global warming call for environmentally friendly technologies in construction, operation and maintenance of transportation infrastructure such as roads. Binding aggregates using foamed bitumen offers an innovative strategy in paving technology. Foamed bitumen accrues various advantages such as improved mix strength and durability, reduced binder content, increased spectrum of aggregates usable, energy savings during the mix processing, environmental friendliness as no toxins are released into the environment, improved workability, propensity of using labour intensive methods, and others.
Foamed bitumen consists of bubbles of hot bitumen encapsulating steam, it is produced when small quantities of cold water (2-3% by weight of bitumen) under pressure are injected into hot bitumen at 150oC up to180oC (Wirtgen, 2004; Jenkins, 2000; Castedo et al., 1984; Csanyi, 1957). During this process exchange of heat energy occurs between bitumen and water leading to steam formation. The steam under pressure is forced into the bitumen continuum forming bubbles that constitute foamed bitumen. With time, due to drainage of the liquid bitumen as a result of suction and gravitational forces, coarsening of bubbles, the foamed bitumen collapses (Jenkins, 2000; Sunarjono, 2008). However, under these production conditions the binder is more likely to be exposed to ageing due to the presence of air and water which promote ageing. Also, limited literature exists on the effects of foaming on binder composition.
Foamed bitumen has been characterised by various parameters such as maximum Expansion Ratio (ERm), Half Life (HL), minimum viscosity, and coefficient of foamability. ERm is the ratio of maximum volume of foamed bitumen to the volume of original bitumen (Jenkins, 2000; Wirtgen, 2004). It is indicative of foam viscosity and shows how well the bitumen will be dispersed in the mix. At a given bitumen temperature and foamant water content, the expansion ratio rises to a maximum (ERm) and then reduces with time. Half Life (HL) is the time taken for the foam to settle to half its maximum volume, it is a measure of foam stability and an indication of its rate of collapse. However, the expansion ratio (ERm) increases with increasing foamant water content while the Half Life (HL) reduces, thus both parameters cannot be optimised simultaneously.
The foam index is the area under the plot of expansion ratio versus time (Jenkins, 2000), it is an indicator of the energy stored in the foam. Attempts by other researchers to apply the foam index in foam characteristics optimisation have not been successful (Sunarjono, 2008), as no optimum point could be obtained. Minimum viscosity is the average foam viscosity within the first 60 seconds of its production (Saleh, 2006). A plot of this average viscosity versus foamant water contents, exhibits a minimum point at which the foamant water content gives the best foam characteristics (Saleh, 2006). Characterising the foam using the average viscosity is a good idea since viscosity is a fundamental property. However, measuring foam viscosity by direct testing may lead to foam distortion and

Foam Effects and Aggregate Coatability 823
unreliable results. The coefficient of foamability is defined as the ratio of ERm at a given bitumen temperature to the optimum foamant water content at that temperature, it is expressed in units of one per percent (Lesueur et al., 2004). Lesueur et al. (2004) showed that this coefficient (varying between 2 and 3) was independent of temperature and constant for given bitumen.
Also, there seems to be no rational method for determination of optimum foam characteristics. In this paper an attempt is made to devise such a method to establish optimum foam characteristics.
The above characteristics are influenced by foamant water content, bitumen temperature, source, type, and composition, temperature of the vessel into which foam is dispersed, water, air and bitumen pressure, additives (Brennen et al., 1983; Castedo et al., 1984; Jenkins, 2000; Wirtgen, 2004; Lesueur et al., 2004). ERm increases with increasing water contents and temperature, while the half life decreases (Brennen et al., 1983; Wirtgen, 2004; He and Wong, 2005). This is due to more water being made available, which leads to the formation of more bubbles, thus increase in ERm of the foam. Reduced half lives can be attributed to coarsening/thinning effects and reduced viscosity as temperature increases. When small bubbles are absorbed by large ones, the bitumen film thickness surrounding the bubbles reduces causing the bubbles to collapse (Wirtgen, 2004). As the viscosity decreases, the surface tension of the bitumen films decreases, and the steam pressure within the bubbles exceeds the surface tension of the bitumen and bubbles collapse. Barinov (1990) illustrated that increasing the asphaltenes fraction of the bitumen increased the ERm and HL. Asphaltenes act as surfactants reducing the surface tension in the bubbles lamellae and thus reduce the plateau border suction, which in turn leads to delay of foam collapse. However, Lesueur et al. (2004) deduced that bitumen composition did not significantly influence foam characteristics. Limited information exists on the effects of binder composition onto foam characteristics.
Previous research has shown that foamed bitumen combines with material less than 63 m or 75 m (Csanyi and Fung, 1956; Sunarjono, 2008) and sand aggregate fractions (between 2mm and 63 m) (Jenkins, 2000). This forms a mortar that binds the coarser particles into a composite mass (Jenkins, 2000). Preferential coating of the filler can possibly be attributed to a higher surface area and hence higher surface forces. Limited previous research has been found by the authors on quantitative determination of proportionate preference of foamed bitumen for the fines versus the coarser ones. In this paper, the effects of foaming on bitumen chemistry and binder composition on foam characteristics are studied. Also, a rational method to establish optimum foam characteristics is devised. Aggregate particle coating with foamed bitumen is studied using the concepts of Rice density and surface energy.

824 Road Materials and Pavement Design. Volume 12 – No. 4/2011
2. Effects of foaming on bitumen chemistry
Limited literature exists on the effects of foaming on bitumen chemistry, yet during production of foamed bitumen, the binder is exposed to conditions (air and water) that promote oxidative ageing. Thus a study was designed to establish any effects of foaming on bitumen chemistry. The influence of foaming on bitumen chemistry was studied using two bitumens of similar penetration grades but obtained from different sources. Fourier Transform Infrared spectrometry (FTIR) techniques were used to investigate different components of the bitumen before and after foaming. These techniques involve subjecting a sample to light waves from an infrared source and determining the wavelengths that are absorbed by the sample. When a sample is subjected to the light waves, the molecules within the sample are excited and absorb some wavelengths of the light and the balance is transmitted to a detector. These light waves transmitted to the detector are measured and converted by an anolog to digital converter to a form that can be used by the computer software. The computer software performs Fourier transforms within a few seconds and a spectrum is produced. This spectrum is a graphical display of the amount of light absorbed by the sample at various wave numbers. The size and position of peaks at different wave numbers are characteristic of certain compounds within the sample. In this study peaks for carbonyls and sulphoxides compounds were used as a guide to establish any differences in the chemical composition of binders, since carbonyls and sulphoxides compounds are indicative of ageing.
2.1. Materials
Two penetration grade bitumens namely, 70/100 from Venezuela and 80/100 from a different unknown source were used in the study. For purposes of consistency and clarity with previous studies these were coded as B2 (Venezuela) and B3 (unknown). B3 was known to contain wax, whose quantities were determined in the study using differential scanning calorimetry techniques. For each of these bitumens, an infrared spectrum was obtained for neat and foamed bitumen specimens. Table 1 shows a matrix of tests performed.
Table 1. Matrix of FTIR tests performed
Sample Neata Foamedb
B2 x x
B3 x x
NOTE.– x: represents at least three replicates, a: Neat samples were produced at – bitumen temperature of 150oC for both binders, b: Foamed bitumen samples were produced at bitumen temperature of 150oC and 2% foamant water content. All samples were cooled to room temperature before FTIR testing.

Foam Effects and Aggregate Coatability 825
2.2. Test methods
2.2.1. Differential Scanning Calorimetry (DSC)
DSC was undertaken on neat samples of B2 and B3. Heating and cooling cycles were applied to a given bitumen specimen and a reference pan at temperatures of 120oC and -120oC according to method used by Nynas laboratory. 15mg of bitumen sample was weighed in a pan and placed in a DSC cell under nitrogen blanket. The sample was then heated to 120oC and then cooled at a rate of 10oC/min to -120oC, followed by heating to 120oC at the same rate. The changes in heat energy in the bitumen specimen with respect to the reference pan were determined at different temperatures and thermographs plotted. From these thermographs the wax content was deduced.
2.2.2. Fourier Transform Infrared spectroscopy (FTIR)
FTIR was used to analyse the composition of the samples. The method of Attenuated Total Reflectance (ATR) with a diamond cell was used. Bitumen samples of B2 and B3 in both neat and foamed conditions that had been cooled to room temperature were heated to 180oC for 15 minutes, hot bitumen was then poured into a diamond cell and pressed with a diamond surface. Specimens for a second and third replicates were taken after 15 minutes interval. Prior to scanning with bitumen specimens, background scans using the diamond cell only were undertaken in order to eliminate the cell effects. Scanning was done at a resolution of 4, wave numbers of 4000 up to 400 cm-1 and 32 scans using a Nicolet 380 FTIR.
2.3. Results, analysis, and discussions
2.3.1. Thermographs
From the thermographs, it was confirmed that B3 contained wax. A thermograph obtained for the endothermic/melting region is shown in Figure 1. A peak occurred between temperatures of 30oC and 10oC for B3 while no peak occurred for B2 (Figure 1). This peak is indicative of wax melting, and confirmed the presence of wax in the sample. Assuming a bitumen wax specific heat capacity of 121.3J/goC (this is an estimated value developed by Nynas AB for natural wax in bitumen), the wax content for B3 was computed as an average value of 7.2%. Thus it was confirmed that B3 was waxy and therefore different from B2 although they both exhibited similar penetration grades.

826 Road Materials and Pavement Design. Volume 12 – No. 4/2011
Figure 1. Heat flow against temperature, showing the melting regions for binders B2 and B3
2.3.2. Infrared spectra
The infrared spectra obtained for B3 in neat and foamed conditions at different wave numbers are shown in Figure 2. From this figure there seems to be no difference between the spectra for neat and foamed bitumen. Similarly, for B2 both spectra (for neat and foamed bitumen) coincided. This may imply that there is no change in chemical functionality of the binder as a result of the foaming process. The carbonyls peak occurred at 1800-1683 cm-1 for B2 and 1705-1695 cm-1 band for B3. The carbonyl stretch for B3 was narrower than that for B2, while the sulphoxides occurred at 1050-987 cm-1 for B2 and 1040-1020 cm-1 band for B3. For both binders the carbonyl peak occurred at 1700cm-1 and the sulphoxides one at 1030 cm-1. Due to binder heating during preparation of samples for FTIR, the water evaporated and could not be detected in the spectra of all foamed bitumen samples.
Peak areas obtained by integration at these stretches were analysed and are summarised in Table 2. Two way analysis of variance of the differences in peak areas (at 5% significant level) showed that there were no significant differences in peak areas for neat and foamed bitumen for any binder. In addition, there were no significant differences in carbonyls and sulphoxides peak areas for binder B2 and B3 for a given neat or foamed condition. This may possibly imply that these binders contained the same carbonyls and sulphoxides. However, since the binders were obtained from different sources, the amounts of other functional groups may be different, analysis of other functional groups was not considered in this study. In addition, thermographs from differential scanning calorimetry revealed that B3 contained wax.

Foam Effects and Aggregate Coatability 827
Figure 2. Infrared spectra for B3
The presence of carbonyls can be attributed to ketones or hydrogen bonded carboxylic acids. Ketones are formed as a result of bitumen oxidation and carboxylic acids occur naturally (Petersen, 1986). In this case, the carbonyls may be attributed to the presence of carboxylic acids as the bitumen acid numbers were 2.63 for B2 and 1.52 for B3.
Table 2. Peak areas for carbonyls and sulphoxides stretches
Carbonyls Sulphoxides Sample
Neat Foamed Neat Foamed
B2 0.14 0.19 0.20 0.19
B3 0.32 0.32 0.19 0.20 In summary, infrared analysis has shown that foaming the bitumen does not lead
to its ageing although factors conducive for ageing exist during its production. These observations agree with Sunarjono (2008) findings on foamed bitumen from short term ageing tests, when he observed that the penetration of the collapsed foam (from 70/100 grade) that had been aged was comparable to that of the original aged bitumen, foam penetration was 46 dmm compared to 45 dmm for neat bitumen.
Also, work by Twagira and Jenkins (2009) on age hardening behaviour of bitumen stabilized materials showed that the foam process does not lead to significant change in bitumen physical properties (penetration, softening point and

828 Road Materials and Pavement Design. Volume 12 – No. 4/2011
viscosity at 60oC), provided that the bitumen between temperatures of 170oC and 180oC is not circulated for more than eight hours in the foam plant. In this study, the samples tested were produced at 150oC and bitumen circulation time in the foam plant was less than two hours.
The observations made in this study could possibly be explained by the short period of time the bitumen is exposed to water and air. In this study hot bitumen was exposed to water and air in an expansion chamber for an average time of 3.8 seconds. This time may not be long enough to expose the bitumen to ageing factors. In addition, the temperature of 150oC at which the bitumen samples were produced may not have been high enough to induce ageing.
3. Aggregate coating with foamed bitumen
Foamed bitumen preferentially mixes with the filler fraction forming a mastic (Csanyi and Fung, 1956, Castedo and Wood, 1983). This mastic then combines with the sand fraction forming a mortar (Jenkins, 2000). In this study, Rice density and surface energy concepts were used to provide insights into why foamed bitumen preferentially coats the filler and fine fractions.
3.1. Materials
3.1.1. Bitumen
Three penetration grade bitumens namely 50/70, 70/100, and 80/100, were used in the study. They were coded as B1, B2 and B3 respectively. B1 and B2 were from Venezuela, however the source of B3 was unknown. All the three were supplied by Nynas AB of Sweden. They were characterised by their penetration (EN1426), ring and ball- softening point (EN1427), specific gravity (SS-EN 15326), total acid number (ASTM D664) and dynamic viscosities at various temperatures (SS-EN 13302). These characteristics are summarised in Table 3.
3.1.2. Aggregate fractions
The aggregates used in this study were obtained from a foliated granite rock containing quarts, K-feldspars and plagioclase with traces of phyllosilicates, muscovite, biotite and chlorite (Ekblad and Isacsson, 2008). This granite rock is located in Skälunda quarry, Sweden. The aggregates were separated into three size fractions, 16-2.36 mm, 2.36-0.063 mm and less than 63 m. These were coded as A1 (16-2.36 mm), A2 (2.36-0.063 mm), and A3 (less than 63 m).

Foam Effects and Aggregate Coatability 829
Table 3. Properties of bitumens
Property Bitumen
grade source
B1 50/70 Venezuela
B2 70/100 Venezuela
B3 80/100 unknown
Penetration at 25oC (0.1 mm) 50.3 79.0 82.0 Softening point, (oC) 50.4 44.7 46.3 Specific gravity 1.028 1.026 1.046 Total acid number, (mg KOH/g) - 2.63 1.52 Brookfield viscosity, (Pas) at 135oC 0.485 0.344 0.207 at 140oC 0.370 0.284 0.162
at 150oC 0.236 0.176 0.107 at 160oC 0.159 0.120 0.073 at 170oC 0.110 0.084 0.053
at 180oC 0.078 0.062 0.041
3.1.3. Coated aggregate fractions
Each aggregate fraction was mixed with foamed bitumen (prepared from 9% bitumen content) for 60 seconds. Prior to mixing the fractions with foamed bitumen, each fraction was pre-wetted with water representing 75% of the Proctor optimum moisture content (OMC) for each fraction. Pre-wetting water of 75% of OMC was taken as the median value of the recommended range (65-85% of OMC) for mixing moisture content (Bissada, 1987; Lee, 1981; Bowering and Martin, 1976). Fractions mixed with foamed bitumen were cured on trays at room temperature until they attained constant weight. Rice density tests were then undertaken on each of the fractions. Another set of bitumen coated aggregate fractions were prepared to act as controls. Aggregate fractions A1, A2, A3 and all fractions reconstituted together in the appropriate proportions were heated to 150oC for three hours and mixed with 9% bitumen content. After cooling, these coated fractions were sealed in boxes until their maximum density was determined. Figure 3 shows the gradation curve used to reconstitute the aggregate fractions. Table 4 summarises the test matrix employed.
Table 4. Test matrix for Rice density
Aggregate fraction Binder
A1 A2 A3 A1 +A2 + A3 FB1 x x x x FB2 x x x x FB3 x x x x Control x x x x
NOTE.– FB1, FB2, FB3 is foamed bitumen produced from 50/70, 70/100 and 80/100 bitumen grades respectively. Control is hot 70/100 penetration grade bitumen mixed with heated A1, A2, A3 and fraction consisting of all sizes. x- at least three replicates.
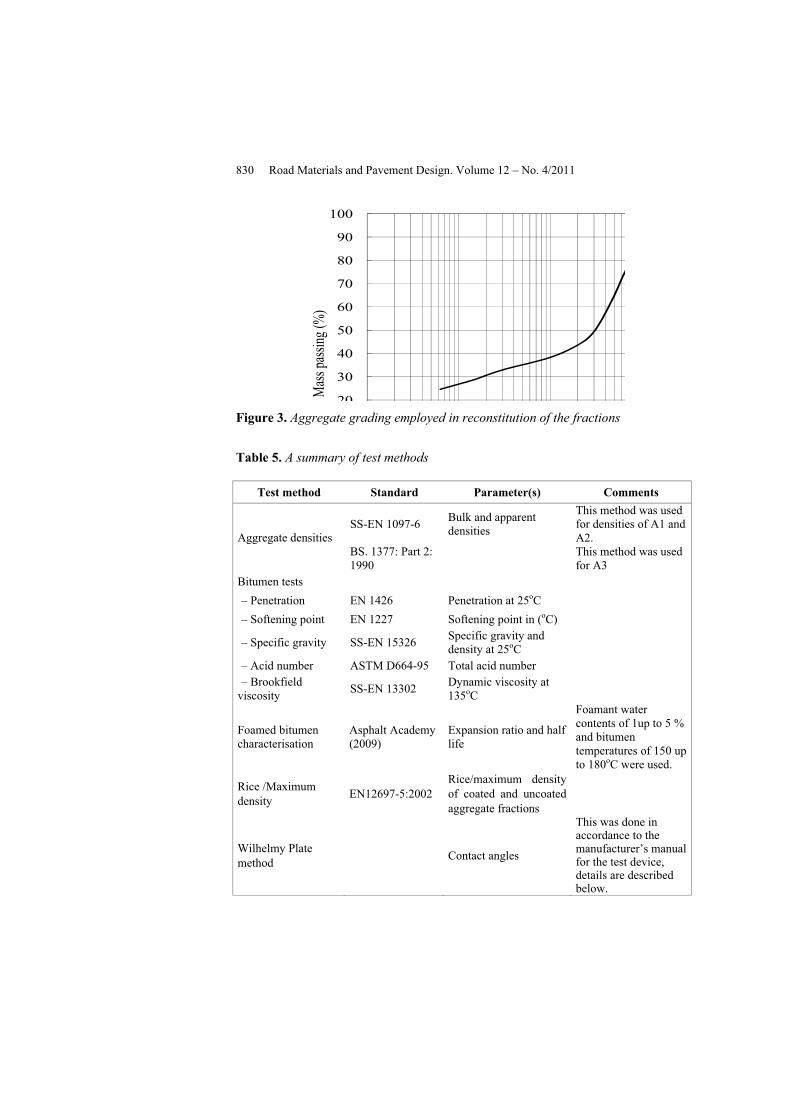
830 Road Materials and Pavement Design. Volume 12 – No. 4/2011
20
30
40
50
60
70
80
90
100
Mass
passi
ng (%
)
Figure 3. Aggregate grading employed in reconstitution of the fractions
Table 5. A summary of test methods
Test method Standard Parameter(s) Comments
SS-EN 1097-6 Bulk and apparent densities
This method was used for densities of A1 and A2. Aggregate densities
BS. 1377: Part 2: 1990 This method was used
for A3 Bitumen tests – Penetration EN 1426 Penetration at 25oC – Softening point EN 1227 Softening point in (oC)
– Specific gravity SS-EN 15326 Specific gravity and density at 25oC
– Acid number ASTM D664-95 Total acid number – Brookfield
viscosity SS-EN 13302 Dynamic viscosity at 135oC
Foamed bitumen characterisation
Asphalt Academy (2009)
Expansion ratio and half life
Foamant water contents of 1up to 5 % and bitumen temperatures of 150 up to 180oC were used.
Rice /Maximum density EN12697-5:2002
Rice/maximum density of coated and uncoated aggregate fractions
Wilhelmy Plate method
Contact angles
This was done in accordance to the manufacturer’s manual for the test device, details are described below.
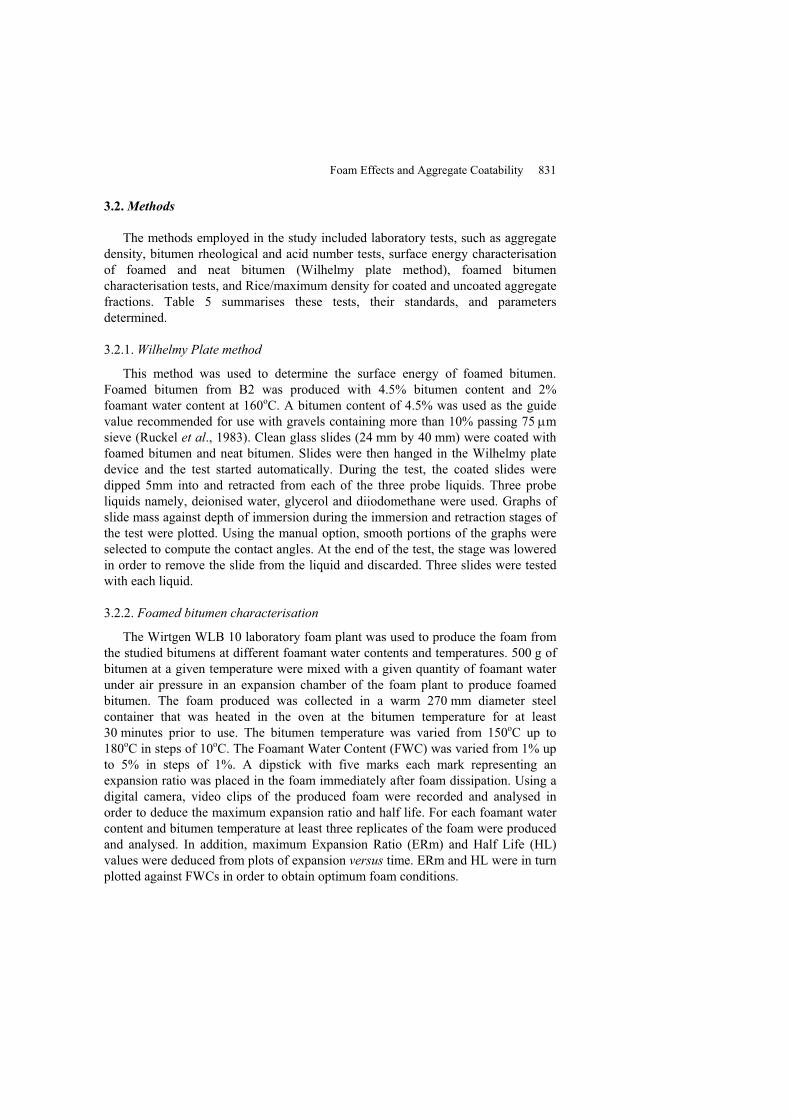
Foam Effects and Aggregate Coatability 831
3.2. Methods
The methods employed in the study included laboratory tests, such as aggregate density, bitumen rheological and acid number tests, surface energy characterisation of foamed and neat bitumen (Wilhelmy plate method), foamed bitumen characterisation tests, and Rice/maximum density for coated and uncoated aggregate fractions. Table 5 summarises these tests, their standards, and parameters determined.
3.2.1. Wilhelmy Plate method
This method was used to determine the surface energy of foamed bitumen. Foamed bitumen from B2 was produced with 4.5% bitumen content and 2% foamant water content at 160oC. A bitumen content of 4.5% was used as the guide value recommended for use with gravels containing more than 10% passing 75 m sieve (Ruckel et al., 1983). Clean glass slides (24 mm by 40 mm) were coated with foamed bitumen and neat bitumen. Slides were then hanged in the Wilhelmy plate device and the test started automatically. During the test, the coated slides were dipped 5mm into and retracted from each of the three probe liquids. Three probe liquids namely, deionised water, glycerol and diiodomethane were used. Graphs of slide mass against depth of immersion during the immersion and retraction stages of the test were plotted. Using the manual option, smooth portions of the graphs were selected to compute the contact angles. At the end of the test, the stage was lowered in order to remove the slide from the liquid and discarded. Three slides were tested with each liquid.
3.2.2. Foamed bitumen characterisation
The Wirtgen WLB 10 laboratory foam plant was used to produce the foam from the studied bitumens at different foamant water contents and temperatures. 500 g of bitumen at a given temperature were mixed with a given quantity of foamant water under air pressure in an expansion chamber of the foam plant to produce foamed bitumen. The foam produced was collected in a warm 270 mm diameter steel container that was heated in the oven at the bitumen temperature for at least 30 minutes prior to use. The bitumen temperature was varied from 150oC up to 180oC in steps of 10oC. The Foamant Water Content (FWC) was varied from 1% up to 5% in steps of 1%. A dipstick with five marks each mark representing an expansion ratio was placed in the foam immediately after foam dissipation. Using a digital camera, video clips of the produced foam were recorded and analysed in order to deduce the maximum expansion ratio and half life. For each foamant water content and bitumen temperature at least three replicates of the foam were produced and analysed. In addition, maximum Expansion Ratio (ERm) and Half Life (HL) values were deduced from plots of expansion versus time. ERm and HL were in turn plotted against FWCs in order to obtain optimum foam conditions.
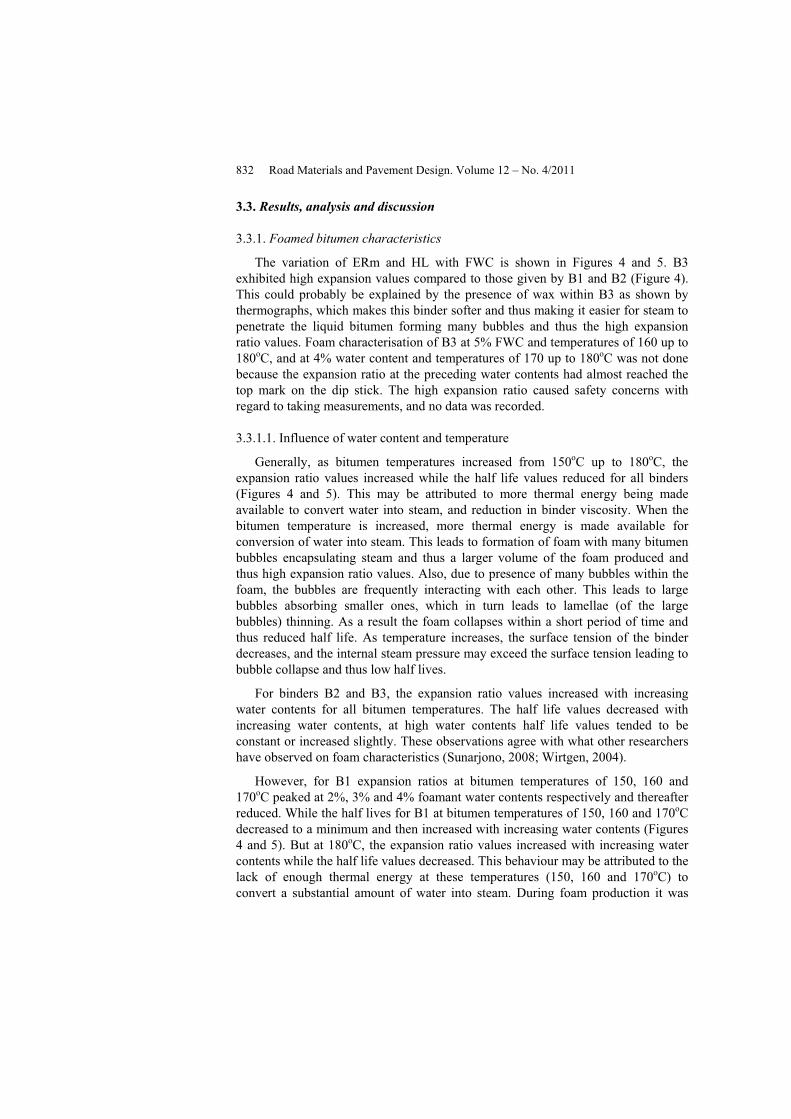
832 Road Materials and Pavement Design. Volume 12 – No. 4/2011
3.3. Results, analysis and discussion
3.3.1. Foamed bitumen characteristics
The variation of ERm and HL with FWC is shown in Figures 4 and 5. B3 exhibited high expansion values compared to those given by B1 and B2 (Figure 4). This could probably be explained by the presence of wax within B3 as shown by thermographs, which makes this binder softer and thus making it easier for steam to penetrate the liquid bitumen forming many bubbles and thus the high expansion ratio values. Foam characterisation of B3 at 5% FWC and temperatures of 160 up to 180oC, and at 4% water content and temperatures of 170 up to 180oC was not done because the expansion ratio at the preceding water contents had almost reached the top mark on the dip stick. The high expansion ratio caused safety concerns with regard to taking measurements, and no data was recorded.
3.3.1.1. Influence of water content and temperature
Generally, as bitumen temperatures increased from 150oC up to 180oC, the expansion ratio values increased while the half life values reduced for all binders (Figures 4 and 5). This may be attributed to more thermal energy being made available to convert water into steam, and reduction in binder viscosity. When the bitumen temperature is increased, more thermal energy is made available for conversion of water into steam. This leads to formation of foam with many bitumen bubbles encapsulating steam and thus a larger volume of the foam produced and thus high expansion ratio values. Also, due to presence of many bubbles within the foam, the bubbles are frequently interacting with each other. This leads to large bubbles absorbing smaller ones, which in turn leads to lamellae (of the large bubbles) thinning. As a result the foam collapses within a short period of time and thus reduced half life. As temperature increases, the surface tension of the binder decreases, and the internal steam pressure may exceed the surface tension leading to bubble collapse and thus low half lives.
For binders B2 and B3, the expansion ratio values increased with increasing water contents for all bitumen temperatures. The half life values decreased with increasing water contents, at high water contents half life values tended to be constant or increased slightly. These observations agree with what other researchers have observed on foam characteristics (Sunarjono, 2008; Wirtgen, 2004).
However, for B1 expansion ratios at bitumen temperatures of 150, 160 and 170oC peaked at 2%, 3% and 4% foamant water contents respectively and thereafter reduced. While the half lives for B1 at bitumen temperatures of 150, 160 and 170oC decreased to a minimum and then increased with increasing water contents (Figures 4 and 5). But at 180oC, the expansion ratio values increased with increasing water contents while the half life values decreased. This behaviour may be attributed to the lack of enough thermal energy at these temperatures (150, 160 and 170oC) to convert a substantial amount of water into steam. During foam production it was
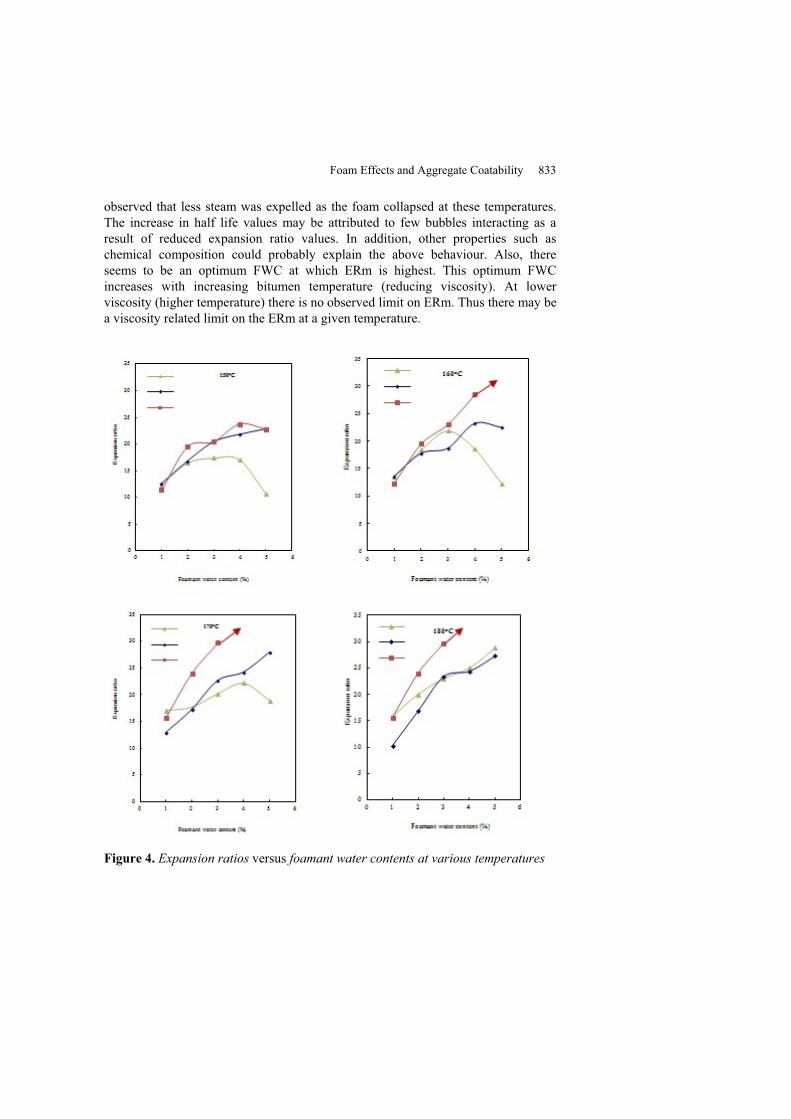
Foam Effects and Aggregate Coatability 833
observed that less steam was expelled as the foam collapsed at these temperatures. The increase in half life values may be attributed to few bubbles interacting as a result of reduced expansion ratio values. In addition, other properties such as chemical composition could probably explain the above behaviour. Also, there seems to be an optimum FWC at which ERm is highest. This optimum FWC increases with increasing bitumen temperature (reducing viscosity). At lower viscosity (higher temperature) there is no observed limit on ERm. Thus there may be a viscosity related limit on the ERm at a given temperature.
Figure 4. Expansion ratios versus foamant water contents at various temperatures

834 Road Materials and Pavement Design. Volume 12 – No. 4/2011
Figure 5. Half lives versus foamant water contents at various bitumen temperatures
3.3.1.2. Water converted into steam
Applying the Universal gas law (Equation [1]) to the foam system, the theoretical and actual steam volumes can be computed. Therefore the actual amount of water converted into steam can be deduced.
PV = nRT [1]Where: P = pressure in atm (P = 1), V = volume in litres,
n = number of mole masss (mol) = , Atomic mass
22.414R = Universal constant (atm.l/mole K) , T = temperature in K.273.16
The actual mass of water can be computed as follows (Equation [2]):

Foam Effects and Aggregate Coatability 835
PV Mass of water, Mwn = = , RT Atomic mass of water
Making Mw the subject:22.414Assuming atomic mass of water = 18.02g/mol, R= , P=1 atmosphere273.16
VMw = 219.61 T
b b
Where: V = (ERm -1)V , ERm = expansion ratio, V = bitumen volume,T=100+273.16. [2]
Figure 6 summarises the ratio of actual water converted into steam (as percentage of bitumen weight) to foamant water content versus binder temperature for various foamant water contents as computed from Equation [2].
Figure 6. Ratio of water converted into steam to foamant water content versus bitumen temperatures for various foamant water contents

836 Road Materials and Pavement Design. Volume 12 – No. 4/2011
For all binders not all foamant water was converted into steam since all ratios are less than one (Figure 6). Also, the actual amount of water converted into steam exhibited the same trend as that for ERm. At FWCs of 2% and above, B3 exhibited the highest actual amounts of water converted into steam for all temperatures. This explains why the ERm values for B3 were highest. However, B1 and B2 exhibited higher amounts water converted into steam than B3 at 1% FWC for temperatures of 150 and 160oC.
Also, actual determination of water within the foam system (after foam collapse) using the weight loss method for binders B1 and B2 at a temperature of 160oC, showed that not all water was converted into steam (Figure 7). The actual proportion of water converted into steam decreases with increasing foamant water content at a given temperature (Figure 7), this trend is in agreement with computations of water converted into steam (Figure 6). This can be explained by the increasing amount of water that requires more heat energy from the bitumen at a given temperature.
However, values of water converted into steam for B1 and B2 at 160oC from the weight loss method and gas law (Equation [2]) are not exactly equal due to the assumptions made in Equation [2] (such as temperature of foam system being 100oC) and experimental errors. Although, the weight loss method and gas law have shown that water still exists within the foam, the FTIR spectra did not reveal any water peaks due to binder heating during FTIR sample preparations that led to possible water evaporation.
Figure 7. Ratio of water converted into steam to foamant water content versus foamant water contents for binders B1 and B2 at 160oC

Foam Effects and Aggregate Coatability 837
3.3.1.3. Optimum foam conditions
Attempts to compute the foam index did not produce well defined optimum foam conditions. Thus the idea of using this index to establish the optimum conditions was not employed. For B1, the expansion ratio values were highest at 180oC temperature but the lowest half life values for all foamant water contents occurred at this temperature. The expansion ratio is indicative of the amount of foam available to coat the aggregate particles. Thus higher expansion ratios with acceptable half life values are desired. Thus, 160oC was considered as the optimum temperature since expansion ratio values were highest at this temperature compared to those at 150 and 170oC for B1. From the foam characteristics of B2, it was observed that the highest ERm (for foamant water contents above 2%) and lowest half life values for all water contents were obtained at temperatures of 170oC and 180oC (Figure 4). However, the temperature of 150oC exhibits the highest half life values for foamant water contents 2% and above. Therefore this is taken as the optimum temperature for B2. For B3 the half life values at 150oC are the highest in comparison to those at other temperatures (Figure 5). Thus this can be taken as the optimum foaming temperature for this binder.
It can be deduced that the bitumen viscosities for the chosen temperatures of 160oC (B1), 150oC (B2) lie within the recommended mixing range viscosity of 0.15-0.19 Pas (ASTM D2493) for a given binder (Figure 8). This may suggest that producing foam at or near the equiviscous temperature (at which the viscosity lies within the recommended mixing range) would lead to foam with optimum characteristics. However, this insight is purely empirical since foamed bitumen when in contact with cold aggregates may not expand the same magnitude as in a laboratory foaming process.
Figure 8. Binder viscosity versus temperature
Mixing range 0.15-0.19 Pa s

838 Road Materials and Pavement Design. Volume 12 – No. 4/2011
Further, assessment of variation of ERm versus foamant water contents at the equiviscous temperatures optimum foamant water content for each binder was deduced as the water content at which a break in the curve first occurs (Figure 9). The half life values at these foamant water contents were then checked whether they are acceptable. The optimum foam conditions of temperature, foamant water content, ERm and HL for the binders are summarised in Table 9.
Table 9. Summary of optimum foaming conditions
Bitumen Parameter
B1 B2 B3
Temperature (oC) 160 150 150
FWC (%) 3 2 2
ERm 22 17 20
HL (s) 18 17 17
Figure 9. Optimum foam characteristics for binder B1
The values of ERm and HL obtained at the optimum temperature and foamant water content agree with Wirtgen’s recommendation of minimum expansion ratio and half life of 10 and 8 seconds, respectively, for stabilising a given material at 25oC (Wirtgen, 2004). Generally, though B1 and B2 were obtained from the same source, they exhibited different foam behaviour. While B2 and B3 obtained from different sources but of the same grade exhibited similar foam behaviour. This may be attributed to the difference in penetration grades, binder viscosity and composition. Also, the above results suggest that binder viscosity (temperature)

Foam Effects and Aggregate Coatability 839
greatly influence the foam characteristics. Further, the equiviscous temperature can be used as a rational way of establishing the foam characteristics.
3.3.2. Rice densities
The Rice or maximum density is the ratio of mass of a given aggregate-bitumen mixture to the total volume, air voids excluded, at a given temperature. The total volume is the sum of the volumes of aggregate solids, aggregate impermeable and permeable voids (not filled with the binder), and the binder (Roberts et al., 1996). From this density, the aggregate effective density can be computed, and thus the effective volume of the binder (total volume of the binder less the amount absorbed), that is used to estimate the theoretical binder film thickness. In doing the Rice density tests, care was taken to separate aggregate particles to ensure that bitumen balls were not included in the samples tested. The Rice densities for the different aggregate coated fractions are shown in Table 10.
Table 10. Rice densities for coated aggregate fractions
Rice density (kg/m3) Aggregate fraction Binder
A1 A2 A3 A1 + A2 + A3
No binder 2646 2672 2749 2678
FB1 2579 2372 2287 2350
FB2 2614 2386 2285 2391
FB3 2573 2369 2294 2307
Control 2320 2319 2287 2319
NOTE.– FB1, FB2, FB3 foamed bitumen produced from B1, B2, B3 respectively.
For all binders, A1 (coated coarse fraction) exhibited the highest Rice density followed by A2 (sand fraction) and A3 (filler fraction) (Table 10). Since lower and higher Rice densities are indicative of higher and lower binder amounts respectively, this implies that the binder is most concentrated in A3 followed by A2 and that little binder exists in A1. Also, for all binders, the Rice densities for all coated fractions are less than the maximum densities of the uncoated aggregate fractions. This implies that all aggregate fractions are coated with the binders to some extent.
Analysis of variance at 5% significance level was used to analyze whether there were or no significant differences in densities across the binders and aggregate fractions. Comparisons of uncoated and coated aggregate fraction Rice densities across the binders showed that the densities for uncoated fractions were significantly
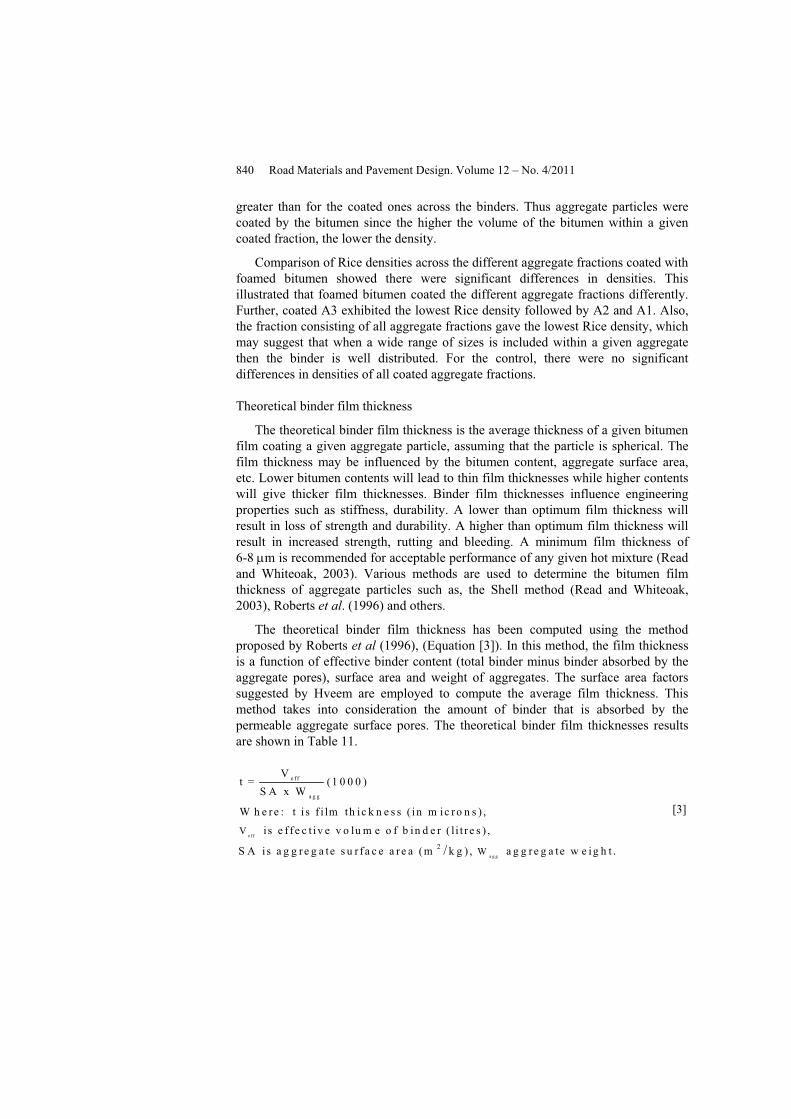
840 Road Materials and Pavement Design. Volume 12 – No. 4/2011
greater than for the coated ones across the binders. Thus aggregate particles were coated by the bitumen since the higher the volume of the bitumen within a given coated fraction, the lower the density.
Comparison of Rice densities across the different aggregate fractions coated with foamed bitumen showed there were significant differences in densities. This illustrated that foamed bitumen coated the different aggregate fractions differently. Further, coated A3 exhibited the lowest Rice density followed by A2 and A1. Also, the fraction consisting of all aggregate fractions gave the lowest Rice density, which may suggest that when a wide range of sizes is included within a given aggregate then the binder is well distributed. For the control, there were no significant differences in densities of all coated aggregate fractions.
Theoretical binder film thickness
The theoretical binder film thickness is the average thickness of a given bitumen film coating a given aggregate particle, assuming that the particle is spherical. The film thickness may be influenced by the bitumen content, aggregate surface area, etc. Lower bitumen contents will lead to thin film thicknesses while higher contents will give thicker film thicknesses. Binder film thicknesses influence engineering properties such as stiffness, durability. A lower than optimum film thickness will result in loss of strength and durability. A higher than optimum film thickness will result in increased strength, rutting and bleeding. A minimum film thickness of 6-8 m is recommended for acceptable performance of any given hot mixture (Read and Whiteoak, 2003). Various methods are used to determine the bitumen film thickness of aggregate particles such as, the Shell method (Read and Whiteoak, 2003), Roberts et al. (1996) and others.
The theoretical binder film thickness has been computed using the method proposed by Roberts et al (1996), (Equation [3]). In this method, the film thickness is a function of effective binder content (total binder minus binder absorbed by the aggregate pores), surface area and weight of aggregates. The surface area factors suggested by Hveem are employed to compute the average film thickness. This method takes into consideration the amount of binder that is absorbed by the permeable aggregate surface pores. The theoretical binder film thicknesses results are shown in Table 11.
e f f
e f f
a g g
V
Vt = (1 0 0 0 )
S A x W
W h e re : t i s f i lm th ic k n e s s ( in m ic ro n s ) ,
i s e f f e c t iv e v o lu m e o f b in d e r ( l i t r e s ) ,
S A i s a g g re g a te s u r f a c e a r
a g g
2 We a (m k g ) , a g g re g a te w e ig h t ./
[3]
Foam Effects and Aggregate Coatability 841
Table 11. Theoretical binder film thicknesses
Theoretical binder film thickness ( m) Aggregate fraction Binder
A1 A2 A3 A1+A2+A3
FB1 35.97 5.91 2.94 9.42
FB2 31.32 5.73 2.95 9.08
FB3 36.89 5.96 2.89 10.36
Control 75.07 6.66 2.94 10.63
The coarse aggregate fraction, A1, seems to exhibit the highest film thickness followed by the sand fraction, A2, and the filler, A3 for both foamed and hot mixed bitumens (Table 11). However, these results contradict visual observations and Rice densities, which show that fraction A3 should possess a highest film thickness since most of the binder seems to be concentrated within this fraction. This may be explained by the higher surface area of A3 compared to that of A1 and A2 that leads to lower thickness for A3.While the smaller aggregate surface area for coarser fraction gives higher thickness values for A1.
The thicknesses of A1 and A2 coated with FB1 and FB3, are greater than when those fractions are coated with FB2. This can be explained by the higher expansion ratio values for FB1 and FB3 compared to those for FB2 (Table 9). In addition, the high viscosity of B1 (Figure 8) also accounts for these high thicknesses. The film thickness ratios for foamed bitumen coated fraction to the corresponding control coated fraction are: 0.5 for A1, 0.9 for A2 and 1.0 for A3. There ratios imply that as the aggregate size fraction reduces, the coating with foamed bitumen improves. However, the thicknesses computed are theoretical and are only indicative of possible aggregate particle coating.
3.3.3. Surface energy
Surface energy or surface free energy is the work done in increasing a unit area of the surface in a vacuum and is denoted by the Greek letter or . In terms of molecular theory the concept of surface energy can be explained as follows, the molecules within the bulk of a given material experience forces of attraction from neighbouring molecules, these forces are balanced within the bulk of the material. However, for the surface molecules these intermolecular forces are not balanced since they have fewer neighbouring molecules. Thus, the surface molecules tend to be pulled inwards, this imparts some kind of energy onto these surface molecules, and the surface molecules tend to have some kind of excess energy and thus the concept of surface energy or surface free energy. In this paper the term surface energy represented by letter is used.

842 Road Materials and Pavement Design. Volume 12 – No. 4/2011
Two theories have been proposed to explain the origin of surface energy namely, Fowkes and acid-base (Good-van Oss-Chaudhury or GVOC) theories. The Fowkes theory states that surface energy is the sum of all forces acting on the surface of a given material (Fowkes, 1964). While the acid-base theory states that the surface energy is divided into three components namely, the non-polar (Lifshitz- van der Waals forces component, LW), the Lewis acid (electron acceptor) and base (electron donor) components (van Oss et al., 1988). The van der Waals forces act between molecules and may consist of dipole-dipole interactions (Keesom forces), random orienting dipole-induced dipole (induction or Debye forces) and fluctuating dipole-induced dipole (dispersion forces or London forces) (van Oss et al., 1988). The Lifshitz-van der Waals (dispersive component) represents the non polar interactions and the acid-base component represents the polar interactions (Hefer and Little, 2006). The van der Waals and the acid-base components represent forces that play a major role in formation of adhesive and cohesive bonds at interfaces of materials. The acid-base theory is used in this study and is expressed as shown in Equation [4].
LW -+
LW
-+
here: is the total surface energy, is the Lifshitz-van der Waals component,
is the
= + W
+ --+
+ -
acid base component ( =2 ),
and are the acid and base components, respectively.
[4]
The surface energy components for bitumen and foamed bitumen were computed from the advancing contact angles obtained with three probe liquids using Equation [5]. Results are shown in Table 12. Advancing angles were used in the computation of the surface energy components since the slides are not contaminated with the test liquid during the advancing stage, unlike in the receding stage.
LW LW + - - +
L L B L B L B
LLW LWL B
1+cos = 2 + 2 + 2 [5] Where: is the total surface energy of the liquid,
, are Lifshitz-van der Waals component+ +L B- -L B
s for liquid and binder resepctively,
, are acid components for liquid and binder respectively,
, are base components for liquid and binder respectively.
From these results (Table 12), foamed bitumen exhibited the highest surface energy compared to neat bitumen and foamed bitumen after collapse. However, the surface energy of foamed bitumen after collapse is close to that of neat bitumen within limits of experimental error. The Lifshitz van der Waals surface energy component increased by 32% as bitumen was foamed and by 11% after foam collapse. This possibly shows that foaming increases the surface energy of the

Foam Effects and Aggregate Coatability 843
bitumen, however since only one binder was tested further work in this area is required.
Table 12. Summary of surface energy components
Sample Surface energy component, (10-3 N/m)
Neat bitumen (B2)
Foamed bitumen at maximum expansion
Foamed bitumen after collapse*
van der Waals, LW 29.43 38.85 32.72
Base, - 2.31 2.35 1.85
Acid + 0.00 1.29 0.03
Total, 29.43 42.33 33.19
* Slides were coated after steam expulsion.
Further, an increase in the polar surface energy component occurred when bitumen was foamed. This is likely due to the presence of water which is a polar material within the foam, not all water is converted into steam as deduced from Figure 6. Also, moisture loss results on the foam tested showed that 0.72% (3.6 g) and 1.81% (9 g) of water out of the total 2% (10 g) was present within the foam after collapse and at maximum expansion respectively. These results are consistent with previous findings by Sunarjono (2008) and Jenkins (2000). This polar component reduces after foam collapse as a result of steam expulsion. Another factor that may affect the polar component is water that possibly results from steam condensation onto glass slides during sample preparations. Also, it can be noted that Lifshitz van der Waals component is the dominant contributor to the total surface energy for both foamed and neat bitumen. The acid-base surface energy component for both bitumen and foamed bitumen is relatively small in comparison to the Lifshitz van der Waals component. These observations agree with the findings of other researchers. Generally, the total surface energy of the bitumen and foamed bitumen lie within the recommended range of 15 to 45x10-3 N/m (Little and Bhasin, 2006).
4. Summary and concluding remarks
In this paper, the effects of foaming on binder chemical composition were studied using Fourier transform infrared spectroscopy techniques. Also, a rational method to determine optimum foam characteristics has been devised and effects of binder composition of foam characteristics were studied. Aggregate particle coating with foamed bitumen was studied using Rice density and surface energy concepts.

844 Road Materials and Pavement Design. Volume 12 – No. 4/2011
4.1. Foaming effects on bitumen composition
Based on the results obtained in this study, it can be deduced that foaming the bitumen does not lead to changes in bitumen chemistry, as the infra red spectra for both neat and foamed were similar for a given bitumen from a particular source. This could possibly be explained by the short period of time the bitumen is exposed to water and air. In this study hot bitumen was exposed to water and air in an expansion chamber for an average time of 3.8 seconds, which may not be long enough to expose the bitumen to ageing factors. Also, the bitumen temperature of 150oC at which the bitumen samples were produced may not have been high enough to induce ageing. Further, studies on effects of foaming with bitumen of different penetration grades and sources are recommended in order to gain more insight on the effects of foaming on bitumen chemistry.
4.2. Foam characteristics
For the three binders studied, foam characteristics seem to be influenced by the penetration grade rather than the source of bitumen. Binders (B2 and B3) from different sources but with similar grades exhibited similar foam behaviour while binder B1 of a hard grade, exhibited different foam behaviour. Also, the presence of wax within the binder enhances foam characteristics, as revealed by the higher ERm values of B3 (that contained wax) compared to those of B1 and B2. The optimum foam characteristics can be obtained once the equiviscous temperature (with a viscosity lying within the mixing range of 0.15-0.19 Pas) is known. However, investigation of foam characteristics of more binders from different sources and grades is recommended since in this study only two sources and grades were investigated. Also, there is need to modify the measuring equipment (dipstick) for the WLB 10 foam plant so that foamed bitumen that exhibits expansion ratio values exceeding 30 can be characterised. In this study, such foams were not studied due to safety concerns during physical measurements.
4.3. Aggregate particle coating
From the Rice densities of the coated aggregate fractions studied, it can be deduced that aggregate size fraction influences the coating of the aggregate particles by foamed bitumen. Most of the bitumen is concentrated within the filler fraction when both foamed and neat bitumen are used. This could be attributed to higher surface area of this fraction and thus high surface forces that lead to a higher affinity for the binder within this fraction. The sand fraction is also a foamed bitumen carrier, this agrees with the findings of Jenkins (2000). The coated aggregate specimen consisting of all aggregate fractions exhibited the lowest Rice density when coated with foamed bitumen. This may imply that when different aggregate

Foam Effects and Aggregate Coatability 845
sized particles are present within a given aggregate then foamed bitumen is well distributed.
Theoretical film thickness results in this study have shown that aggregate surface area, expansion ratio (ERm), binder viscosity seem to influence the film thickness. High aggregate surface area leads to reduced thickness. Coated A3 with largest surface area gave the lowest thickness. Also, high ERm leads to increased thickness. Thicknesses of A1 and A2 coated with FB1 and FB3 (with higher ERm) were greater than those of the same fractions coated with FB2 (with lower ERm). However, film thicknesses calculated are only theoretical and may not represent the actual aggregate particle coating in practice.
4.4. Surface energy
From the results obtained in this work, foamed bitumen seems to possess better coating attributes compared to neat bitumen, since it exhibited lower contact angles and higher total surface energy compared to neat bitumen. The polar component of the bitumen increased on foaming implying the existence of water within the foam. These results suggest that foamed bitumen is more likely to form strong bonds with aggregates than neat bitumen. However, the differences were not statistically analysed as no replicate samples were tested for foamed bitumen due to resource constraints. Further, the effects of steam condensation on the polar component of foamed bitumen need to be quantified. Also, more surface energy tests should be done on foamed bitumen specimens and the aggregates in order to gain more insight into its energy surface energy behaviour.
Acknowledgements
The financial assistance by Sida (Swedish Development Agency) of Sweden towards the study is highly appreciated. Michael Behn’s help in editing this paper is highly appreciated. The assistance by Hilde Soenen of Nynas, Antwerp in carrying out FTIR on bitumen samples is gratefully acknowledged. The efforts of Per Redelius of Nynas AB, Sweden in soliciting for various types of bitumen and also allowing the authors to use Nynas laboratory to undertake DSC are gratefully acknowledged. The assistance by Prof. Airey Gordon and Naveed Ahamed of Nottingham Transportation Engineering Centre, University of Nottingham in carrying out surface energy tests on bitumen is also appreciated.
5. References
Asphalt Academy, Technical guideline: Bitumen stabilised materials. A guideline for the design and construction of bitumen emulsion and foamed bitumen stabilised materials TG 2, Second Edition, 2009, Asphalt Academy, Pretoria, South Africa.

846 Road Materials and Pavement Design. Volume 12 – No. 4/2011
ASTM D2493, “Standard Viscosity-Temperature Charts for Asphalts”, 1995.
ASTM D 664-95, “Standard Test method for acid number of petroleum products by potentiometric titration”.
Barinov E.N., “Formation and properties of bituminous foams”, Journal of Chemistry and Technology of Fuels and Oils, 1990, Springer, New York, p. 544-548.
Bhasin A., Little D.N., “Characterization of aggregate surface energy using universal sorption device”, Journal of Materials in Civil Engineering, Vol. 19, No. 8, 2007, ASCE, p. 634-641.
Brennen M., Tia M., Altschaeffl A.G., Wood L.E., “Laboratory investigation of the use of foamed asphalt for recycled bituminous pavements”, Transportation Research Record 911, 1983, Transportation Research Record Board, National Research Council, Washington DC, p. 80-87.
BS 1377-2:1990, “Methods of test for soils for Civil Engineering purposes. Classification tests”, British Standards Institution.
BS 1377-4:1990, “Methods of test for soils for Civil Engineering purposes. Compaction related tests”, British Standards Institution.
Castedo H., Beaudoin C.C., Wood L.E., Altschaeffl A.G., “Durability characteristics of foamed asphalt mixtures”, Proceedings of the 29th Annual Canadian Technical Asphalt Association Conference, 1984, Montreal, Canada, p. 102-122.
Csanyi L.H., Fung H., “Mortar theory for use of Ungraded aggregates in bituminous mixes”, Highway Research Board, Bulletin No. 109, 1956.
Ekblad J., Isacsson U., “Influence of water and mica content on resilient properties of coarse granular materials”, International Journal of Pavement Engineering, Vol. 9, No. 3, June 2008, Taylor and Francis Ltd, p. 215-227.
EN 12697-5:2002, “Bituminous mixtures - Test methods for hot mix asphalt - Part 5: Determination of the maximum density”, CEN.
EN 1426:2007, “Bitumen and bituminous binders- Determination of needle penetration”, CEN
EN 1427:2007, “Bitumen and bituminous binders- Determination of softening point. Ring and ball method”, CEN.
EN 13302:2003, “Bitumen and bituminous binders- Determination of viscosity of bitumen using a rotating spindle apparatus”, CEN.
Fowkes F.M., “Attractive forces at interfaces”, Journal of Industrial and Engineering Chemistry, Vol. 56, No. 12, 1964, p. 40-52.
Hefer A.W., Bhasin A., Little D., “Bitumen surface energy characterization using a contact angle approach”, Journal of Materials in Civil Engineering, ASCE, Vol. 18, No. 6, 2006, p. 759-767.
Hefer A., Little D., “Adhesion in bitumen-aggregate systems and quantification of the effects of water on the adhesive bond”, Research Report ICAR-505-1, 2005, International Center for Aggregates Research.

Foam Effects and Aggregate Coatability 847
ATI Mattsson, “Infinity Series FTIR Spectrometer User’s manual”, 1995.
Jenkins K. J., Mix design considerations for cold and half-warm bituminous mixes with emphasis on foamed bitumen, PhD dissertation, 2000, University of Stellenbosch, South Africa.
Lesueur D., Clech H., Brosseaud A., Such C., Cazacliu B., Koenders B., Cèrino P., Bonvallet J., “Foamed bitumens. Foamability and foam stability”, International Journal of Road Materials and Pavement Design, Vol. 8, No. 3, 2004, p. 277-302.
Little D.N., Bhasin A., “Using surface energy measurements to select materials for asphalt pavement”, Final Report, 2006, NCHRP Project No. 9-37.
Petersen J.C., “Quantitative functional group analysis of asphalts using differential infrared spectrometry and selective chemical reactions. Theory and application”, Transportation Research Record, No. 1096, 1986, p. 1-11.
PRA, “Surface energy and contact angle measurements of solids”, Available online at: http://www.pra.org.uk/technical/testingphysicalsurfacetension.htm, accessed on 9/11/2007.
Read J., Whiteoak D., The shell bitumen handbook, Fifth Edition, 2003, Shell UK Oil Products Limited.
Ruckel P.J., Acott S.M., Bowering R.H., “Foamed-asphalt paving mixtures: Preparation of design mixes and treatment of test specimens”, Transportation Research Record 911, 1983, p. 88-95.
SS-EN 1097-6:2000, “Tests for mechanical and physical properties of aggregates- Part 6: Determination of particle density and water absorption”, Swedish Standards Institute.
SS-EN 15326:2007, “Bitumen and bituminous binders- Measurement of density and specific gravity- Capillary-stoppered pycnometer method”, Swedish Standards Institute.
Skupien D., Gaskell D.R., “The surface tensions and foaming behaviour of melts in the system CaO-FeO-SiO2”, Journal of Metallurgical and Materials Transactions B, Vol. 31B, 2000, p. 921-925.
Sunarjono Sri Ir. M.T., Influence of foamed bitumen characteristics on cold mix asphalt properties, Thesis submitted to University of Nottingham for the degree of Doctor of Philosophy, 2008.
Twagira M.E., Jenkins K.J., “Age hardening behaviour of bituminous stabilized materials”, 7th International Rilem Symposium ATCBM09 on Advanced Testing and Characterization of Bituminous Materials, 2009, Rhodes Palace, Rhodes, Greece, p. 239-249.
van Oss. C.J., Chaudhury. M.K., Good R.J., “Interfacial Lifshitz-van der Waals and polar interactions in macroscopic systems”, Chemical Review, Vol. 88, No. 6, 1988, p. 927-941.
Wirtgen, Cold Recycling Manual, Second Edition, Wirtgen GmbH, 2004, p. 76-89.
Received: 20 August 2010 Accepted: 5 June 2011


Development of a gyratory compaction procedure for laterite gravels treated withfoamed bitumen
May Namutebia*, Bjorn Birgissona and Umaru Bagampaddeb
aRoyal Institute of Technology, Highway and Railway Engineering, Brinellvagen 23, Stockholm 10044, Sweden; bMakerere University,Department of Civil and Environmental Engineering, P.O. Box 7062, Kampala, Uganda
(Received 12 April 2011; final version received 20 June 2012)
Determining of the optimum density of the compacted foamed bitumen-treated materials is an important part of determiningthe field placement conditions. Laterite gravels tend to be highly susceptible to breakdown during laboratory compactionwith the standard Proctor hammer, which may not be representative of field conditions. In this paper, a new method ispresented for determining the optimal compaction characteristics of laterite gravels–foamed bitumen mixes. A gyratorycompactor was used for compaction. The modified locking point concept was used to determine the number of gyrations tocompact mixes of laterite gravels and foamed bitumen. The optimal compaction moisture content was subsequentlyestablished at this point. The average number of gyrations that gave the locking point was 44; optimum moisture content(OMC) for compaction varied from 86% to 92% for gravels only. The modified locking point seems to be suitable fordetermining the optimal compaction characteristics of these mixes.
Keywords: foamed bitumen; laterite gravels; gyratory compaction; locking concept; moisture content
1. Introduction
Foamed bitumen constitutes hot bitumen that has been
heated to high temperatures (normally between 1508C and
1808C) with small quantities of water (typically 2–3% by
weight of the bitumen) and air (Csanyi 1957, Castedo et al.
1984, Jenkins 2000). When the cold water comes into
contact with the hot bitumen, it turns into steam as a
result of heat exchange between bitumen and water. As the
steam gets trapped within the bitumen, the results are the
formation of many small bitumen bubbles encapsulating
the steam.After a fewminutes, the steamevaporates and the
bitumen regains its original properties. During the foaming
process, the binder increases to roughly 10–20 times its
original volume, its viscosity is reduced considerably and
the surface area increases (Csanyi 1957, Jenkins 2000).
This results in an increase in the adhesion between the
foamed bitumen and aggregate surfaces. Foamed bitumen
has been used widely for roadbed stabilisation of various
aggregates ranging from good quality to marginal and poor
aggregates. In contact with moist aggregates, the foam
results in the bitumen combining with the fines forming a
mastic that binds the rest of the aggregate particles in a
composite mass (Lee 1981, Castedo-Franco and Wood
1983, Jenkins 2000, Wirtgen 2004).
Moisture in the foamed bitumen materials plays
various roles such as transporting and dispersing the
bitumen during the mixing process, lubricating the mix
enabling it to be worked at ambient temperatures, and
aiding in compaction of the materials (Csanyi 1960,
Jenkins 2000, Sunarjono 2008). In order to determine
optimum compaction and strength conditions of foamed
bitumen-stabilised aggregates, additional water is typi-
cally introduced to the aggregates before foam addition
(Csanyi 1960). For the mixture, both the method of
compaction and moisture conditions during compaction
play an important role in achieving optimum density and
strength conditions. The method of compaction should
ideally simulate the actual compaction of the mix in the
field, and the moisture conditions should be optimised to
achieve the maximum strength, as too low or too high
moisture contents could lead to sub-optimal compaction
and low strength (Brennen et al. 1983).
Various researchers have recommended determination
of the mixing moisture requirements to be based solely on
the optimum moisture content (OMC) of the aggregates
without bitumen (Bowering and Martin 1976, Lee 1981,
Bissada 1987). This approach ignores the additional
effects of the foamed bitumen on the compaction process.
Similarly, limited work exists on the determination of
optimum moisture required at the compaction stage (Sakr
and Manke 1985, Jenkins 2000). Various different
laboratory compaction methods for foamed bitumen
mixes have been used such as Marshall, gyratory,
Hugo hammer, Kango hammer and vibratory hammer
(Namutebi et al. 2009). Of these methods, the gyratory
compaction method has been recommended to best
q 2013 Taylor & Francis
*Corresponding author. Email: [email protected]
International Journal of Pavement Engineering, 2013
Vol. 14, No. 3, 256–264, http://dx.doi.org/10.1080/10298436.2012.705842
Dow
nloa
ded
by [K
ungl
iga
Tekn
iska
Hog
skol
a], [
May
Nam
uteb
i] at
09:
22 2
0 A
pril
2013

simulate the roller action in the field (e.g. Sunarjono 2008).
In summary, it is not clear how to determine the optimum
compaction level used for optimising the moisture content
of pre-wetted aggregates in the presence of the foamed
bitumen.
Sunarjono (2008) and Jenkins (2000) proposed
gyratory compaction of foamed bitumen mixes at the
number of gyrations that yielded the maximum dry density
of the aggregate as determined from Proctor or modified
AASHTO compaction methods. However, both compac-
tion methods (Proctor and gyratory) compact the material
in different ways. The gyratory method involves
application of a vertical pressure to the mould containing
the material to be compacted while the mould is rotated at
an angle, resulting in controlled shearing of the material.
The Proctor method involves impact loads repeatedly
being applied to the material compacted, using a hammer
that is dropped onto the material through a known height.
Therefore, these two methods of compaction are different
since they compact materials through different mechan-
isms, and equating densities from both methods may not
be logical.
Laterite gravels tend to be friable and break down
easily during compaction. In this study, the locking point
concept proposed by Vavrik and Carpenter (1998) was
evaluated and eventually modified for use in determining
the number of gyrations for achieving maximum aggregate
interlock without inducing significant material breakdown
in the process. The locking point determines the point at
which maximum interlock of the aggregate particles
occurs; after maximum interlock any extra compaction
would lead to aggregate breakdown. In this study, the
OMC for laterite gravels treated with foamed bitumen
required to achieve maximum dry density was determined
at the locking point.
1.1 Locking point concept
It is a well-known fact that during compaction in the field,
a stage is reached where the aggregate resistance to
compaction increases considerably. In other words, there
is a great degree of interlocking between the aggregate
particles. Hence, during compaction in the laboratory it
becomes important to identify the stage at which the mix
exhibits this interlocking. This point of interlocking is
called locking point. This locking point concept was first
defined by Vavrik and Carpenter (1998) for dense-graded
hot mix asphalt. The locking point is defined as the first
three gyrations that are at the same height preceded by two
gyrations at the same height, the height is in millimetres
and rounded to a single decimal place (Vavrik and
Carpenter 1998). In this study, this locking point concept is
evaluated for use in determining an optimal compaction
point for laterite gravels treated with foamed bitumen.
2. Materials and methods
2.1 Materials
2.1.1 Bitumen
A conventional bitumen of grade 70/100 was used in this
study. It was produced from the Venezuela crude and
supplied by Nynas AB of Sweden. The physical properties
of the bitumen were characterised by the penetration (EN
1426), Ring and Ball softening point (EN 1427), specific
gravity (SS-EN 15326) and dynamic viscosities at various
temperatures (SS-EN 13302). These properties are
summarised in Table 1.
2.1.2 Foamed bitumen
The foamed bitumen used in this study was produced from
the 70/100 penetration grade bitumen. The foamed
bitumen was produced at the optimum conditions of
foamant water content of 2% and bitumen temperature of
1508C, and the expansion ratio and half-life of this foam
were 17 and 17 s, respectively (Namutebi et al. 2011).
2.1.3 Aggregates
The aggregates usedwere laterite gravels obtained from the
tropics around Lake Victoria region. The laterites were
classified as silty clayey sandy gravels in accordance with
the British Soil Classification System with a nominal size
of 20mm. Their properties are summarised in Table 2.
Table 2. Properties of laterite gravels used.
Chemicalcomposition
Lateritesample
Ironoxide
Sesquioxideratio OMC (%)
Maximum drydensity (kg/m3)
L1 65.6 0.350 14.0 2100L2 51.2 0.315 14.0 2040L3 44.8 0.497 13.9 2084
Table 1. Physical properties of bitumen.
Bitumen
PropertyGrade;source
70/100;Venezuela Standard
Penetration at258C (0.1mm)
79.0 EN 1426
Softening point (8C) 44.7 EN 1427Specific gravity 1.026 SS-EN 15326Brookfieldviscosity (Pa s)
At 1508C 0.176 SS-EN 13302At 1608C 0.120At 1708C 0.084At 1808C 0.062
International Journal of Pavement Engineering 257
Dow
nloa
ded
by [K
ungl
iga
Tekn
iska
Hog
skol
a], [
May
Nam
uteb
i] at
09:
22 2
0 A
pril
2013

The chemical composition of the laterite gravels was
determined using X-ray diffraction procedure. The
sesquioxide ratio was computed as the ratio of silica to
the sum of iron and aluminium oxides, whereas the OMC
andmaximum dry density were obtained from the modified
Proctor method according to BS 1377: Part 4:1990.
The grading of laterite gravels used in the study was
modified such that it lay in the middle of the ideal zone
band recommended by Akeroyd (1989) for aggregates
treated with foamed bitumen (Figure 1).
2.2 Methods
2.2.1 Production of mixes
Laterite gravels treated with foamed bitumen were
prepared at 4.5% bitumen content and 75% of OMC of
the laterite gravels only. The OMC was determined using
the modified Proctor method on the gravels only without
the presence of foamed bitumen. The mixing moisture
content of 75% of OMC was used as a median value of
recommended range of 65–85% of OMC (Bowering and
Martin 1976, Lee 1981, Bissada 1987).
The bitumen content of 4.5% was used as a
recommended value for use with gravels containing
more than 10% passing the 75mm sieve (Ruckel et al.
1983). Prior to adding foamed bitumen, the laterite gravels
were pre-wetted with the mixing water content and left for
24 h. Then, foamed bitumen was added to the pre-wetted
laterites in a pug mill mixer and mixing was done for 60 s.
Before adding the foamed bitumen to the gravels in the
mixer, it was ensured that the gravels were airborne so that
the foam could adhere to the gravels. The mixes were
removed from the mixer and placed in airtight containers
awaiting compaction.
2.2.2 Gyratory compaction
Mixes of laterite gravels with foamed bitumen were
compacted at the OMC of laterite gravels only using a
gyratory compactor (Servopac from Australia) at a vertical
pressure of 600 kPa and an angle of gyration of 1.258. Thevertical pressure of 600 kPa and an angle of gyration of
1.258 were used as recommended gyratory compaction
conditions for soils (Browne 2006), as the behaviour of
foamed bitumen-treated materials is considered to be
similar to that of granular materials.
Mixeswere compacted up to 200 gyrations, as results of
trial compaction of mixes at different number of gyrations
showed that after 200 gyrations the final dry density was
constant. Specimens were compacted in 100-mm diameter
moulds and to the final average height of 102mm, at least
three replicates were compacted for each laterite. The
average height at each number of gyration was determined.
2.2.3 Optimum compaction moisture content
Laterite gravel–foamed bitumen mixes were compacted at
the different number of gyrations that gave the locking
point, and the moisture content varied from 60%, 75%,
90% and 100% of OMC (OMC being the optimum
moisture content of the gravels only) in order to establish
the moisture conditions required for optimal compaction.
After compaction at any given moisture content, speci-
mens were taken from the compacted sample for moisture
content determination. At least three replicates were
compacted at each value of the moisture content. Graphs
of dry density versus moisture content were drawn in order
to deduce the optimum moisture conditions for compac-
tion (see Figure 5).
3. Results, analysis and discussions
3.1 Locking point
The locking point concept was used to determine the
number of gyrations to compact laterite gravels treatedwith
foamed bitumen. The average compaction heights for the
mixes at the different number of gyrations are summarised
in Table 3. The italicized numbers (in Table 3) show the
heights that meet the Vavrik and Carpenter (1998)
condition. Initially, the locking point as defined by Vavrik
and Carpenter (1998) was used. The number of gyrations
that lead to the stage of maximum resistance was identified
as the first three gyrations at the same compaction height
preceded with two gyrations at the compaction height.
These gyrations are summarised in Table 4.
For L1, L2 and L3, the mix dry density after 100
gyrations had reached a constant value. This may indicate
that aggregate particle locking could possibly be achieved
below these 100 gyrations. Also, gradation analysis at 80
and 200 gyrations for L1 and L2 revealed aggregate
particle breakdown. Also for L2, gradation analysis at 100
gyrations showed that there was aggregate particle
breakdown. For L3, aggregate particle breakdown
occurred at 64 and 200 gyrations.
0
10
20
30
40
50
60
70
80
90
100
0 0 1 10 100Sieve size (mm)
Mas
s pas
sing
(%)
Less su
itable
zone
Idea
l zon
eLaterite grading used
Figure 1. Laterite gravel gradation.
M. Namutebi et al.258
Dow
nloa
ded
by [K
ungl
iga
Tekn
iska
Hog
skol
a], [
May
Nam
uteb
i] at
09:
22 2
0 A
pril
2013
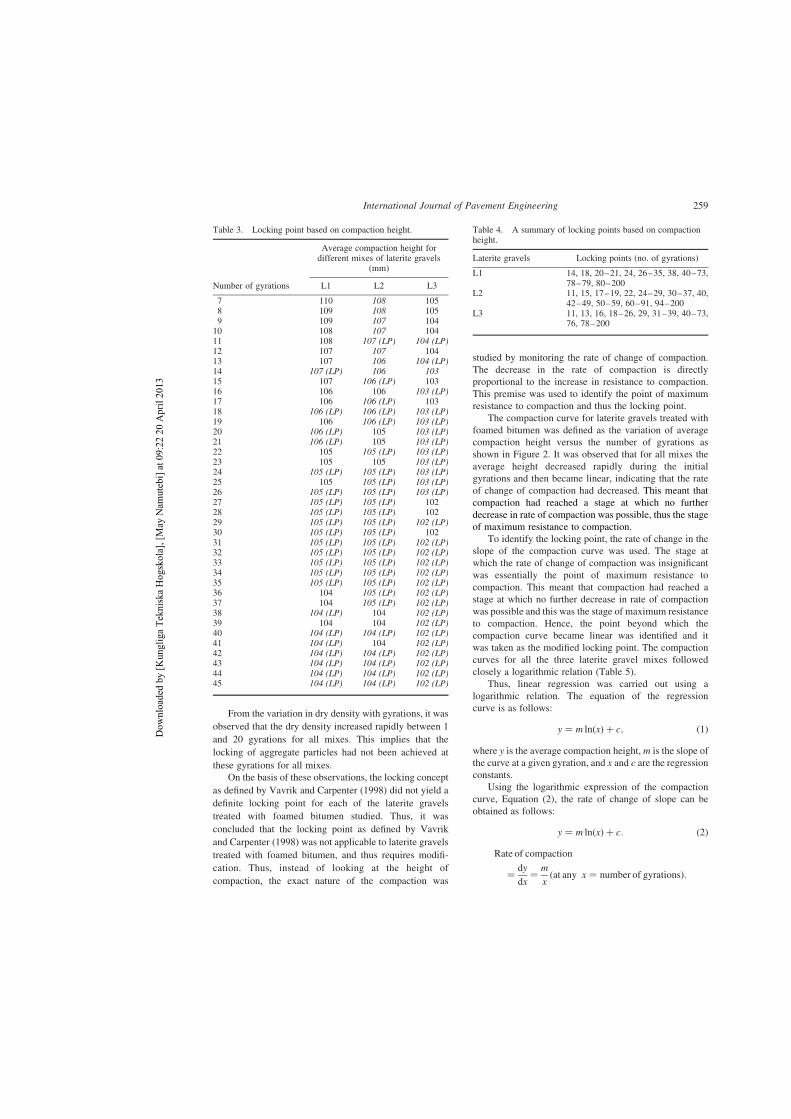
From the variation in dry density with gyrations, it was
observed that the dry density increased rapidly between 1
and 20 gyrations for all mixes. This implies that the
locking of aggregate particles had not been achieved at
these gyrations for all mixes.
On the basis of these observations, the locking concept
as defined by Vavrik and Carpenter (1998) did not yield a
definite locking point for each of the laterite gravels
treated with foamed bitumen studied. Thus, it was
concluded that the locking point as defined by Vavrik
and Carpenter (1998) was not applicable to laterite gravels
treated with foamed bitumen, and thus requires modifi-
cation. Thus, instead of looking at the height of
compaction, the exact nature of the compaction was
studied by monitoring the rate of change of compaction.
The decrease in the rate of compaction is directly
proportional to the increase in resistance to compaction.
This premise was used to identify the point of maximum
resistance to compaction and thus the locking point.
The compaction curve for laterite gravels treated with
foamed bitumen was defined as the variation of average
compaction height versus the number of gyrations as
shown in Figure 2. It was observed that for all mixes the
average height decreased rapidly during the initial
gyrations and then became linear, indicating that the rate
of change of compaction had decreased. This meant that
compaction had reached a stage at which no further
decrease in rate of compaction was possible, thus the stage
of maximum resistance to compaction.
To identify the locking point, the rate of change in the
slope of the compaction curve was used. The stage at
which the rate of change of compaction was insignificant
was essentially the point of maximum resistance to
compaction. This meant that compaction had reached a
stage at which no further decrease in rate of compaction
was possible and this was the stage of maximum resistance
to compaction. Hence, the point beyond which the
compaction curve became linear was identified and it
was taken as the modified locking point. The compaction
curves for all the three laterite gravel mixes followed
closely a logarithmic relation (Table 5).
Thus, linear regression was carried out using a
logarithmic relation. The equation of the regression
curve is as follows:
y ¼ m lnðxÞ þ c; ð1Þwhere y is the average compaction height, m is the slope of
the curve at a given gyration, and x and c are the regression
constants.
Using the logarithmic expression of the compaction
curve, Equation (2), the rate of change of slope can be
obtained as follows:
y ¼ m lnðxÞ þ c: ð2ÞRate of compaction
¼ dy
dx¼ m
xðat any x ¼ number of gyrationsÞ:
Table 3. Locking point based on compaction height.
Average compaction height fordifferent mixes of laterite gravels
(mm)
Number of gyrations L1 L2 L3
7 110 108 1058 109 108 1059 109 107 10410 108 107 10411 108 107 (LP) 104 (LP)12 107 107 10413 107 106 104 (LP)14 107 (LP) 106 10315 107 106 (LP) 10316 106 106 103 (LP)17 106 106 (LP) 10318 106 (LP) 106 (LP) 103 (LP)19 106 106 (LP) 103 (LP)20 106 (LP) 105 103 (LP)21 106 (LP) 105 103 (LP)22 105 105 (LP) 103 (LP)23 105 105 103 (LP)24 105 (LP) 105 (LP) 103 (LP)25 105 105 (LP) 103 (LP)26 105 (LP) 105 (LP) 103 (LP)27 105 (LP) 105 (LP) 10228 105 (LP) 105 (LP) 10229 105 (LP) 105 (LP) 102 (LP)30 105 (LP) 105 (LP) 10231 105 (LP) 105 (LP) 102 (LP)32 105 (LP) 105 (LP) 102 (LP)33 105 (LP) 105 (LP) 102 (LP)34 105 (LP) 105 (LP) 102 (LP)35 105 (LP) 105 (LP) 102 (LP)36 104 105 (LP) 102 (LP)37 104 105 (LP) 102 (LP)38 104 (LP) 104 102 (LP)39 104 104 102 (LP)40 104 (LP) 104 (LP) 102 (LP)41 104 (LP) 104 102 (LP)42 104 (LP) 104 (LP) 102 (LP)43 104 (LP) 104 (LP) 102 (LP)44 104 (LP) 104 (LP) 102 (LP)45 104 (LP) 104 (LP) 102 (LP)
Table 4. A summary of locking points based on compactionheight.
Laterite gravels Locking points (no. of gyrations)
L1 14, 18, 20–21, 24, 26–35, 38, 40–73,78–79, 80–200
L2 11, 15, 17–19, 22, 24–29, 30–37, 40,42–49, 50–59, 60–91, 94–200
L3 11, 13, 16, 18–26, 29, 31–39, 40–73,76, 78–200
International Journal of Pavement Engineering 259
Dow
nloa
ded
by [K
ungl
iga
Tekn
iska
Hog
skol
a], [
May
Nam
uteb
i] at
09:
22 2
0 A
pril
2013

Rate of change of compaction of compaction curve
¼ d2y
dx2¼ 2m
x2ðat any x ¼ number of gyrationsÞ:
The rate of change of compaction was defined by the
rate of change of slope (gradient of slope), and was
determined as the second derivative of the equation of best
fit for the compaction curve, Equation (2). The modified
locking point was identified as the first point at which two
gyrations at the same gradient of slope were preceded by
two gyrations at the same gradient of slope. The gradient
was taken up to four decimal places (Table 6). The reason
this was chosen as the locking point was based on the fact
that the change in dry density was insignificant at this
stage, and this trend was consistently observed in all the
mixes. Thus, based on this study, the locking points for
these mixes were identified as described above and are
summarised in Table 7.
Figure 2. Average compaction height versus number of gyrations for laterite gravels treated with foamed bitumen.
Table 5. Logarithmic relations for compaction curves.
Lateritegravels Relation
Coefficient ofdetermination, R 2
L1 y ¼ 22.331 ln(x) þ 114.03 0.8001L2 y ¼ 21.849 ln(x) þ 111.99 0.8186L3 y ¼ 21.532 ln(x) þ 108.37 0.7807
Table 6. Locking point based on the gradient of slope.
Laterite gravels
Gyrations L1 L2 L3
36 0.0018 0.0014 0.001237 0.0017 0.0014 0.001138 0.0016 0.0013 0.001139 0.0015 0.0012 0.001040 0.0015 0.0012 0.0010 (MLP)41 0.0014 0.0011 0.000942 0.0013 0.0010 0.000943 0.0013 0.0010 0.000844 0.0012 0.0010 0.000845 0.0012 (MLP) 0.0009 0.000846 0.0011 0.0009 (MLP) 0.000747 0.0011 0.0008 0.000748 0.0010 0.0008 0.000749 0.0010 0.0008 0.0006
Note: MLP, modified locking point. Italicized numbers show the conditions formodified locking point.
M. Namutebi et al.260
Dow
nloa
ded
by [K
ungl
iga
Tekn
iska
Hog
skol
a], [
May
Nam
uteb
i] at
09:
22 2
0 A
pril
2013
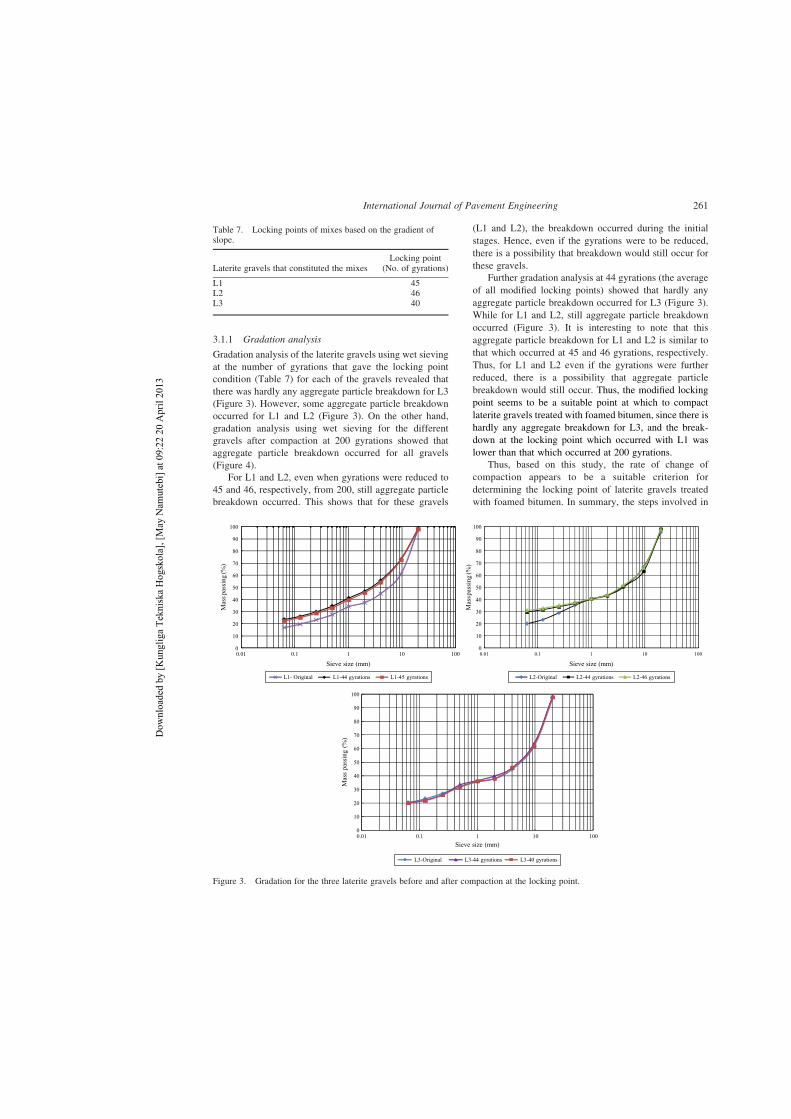
3.1.1 Gradation analysis
Gradation analysis of the laterite gravels using wet sieving
at the number of gyrations that gave the locking point
condition (Table 7) for each of the gravels revealed that
there was hardly any aggregate particle breakdown for L3
(Figure 3). However, some aggregate particle breakdown
occurred for L1 and L2 (Figure 3). On the other hand,
gradation analysis using wet sieving for the different
gravels after compaction at 200 gyrations showed that
aggregate particle breakdown occurred for all gravels
(Figure 4).
For L1 and L2, even when gyrations were reduced to
45 and 46, respectively, from 200, still aggregate particle
breakdown occurred. This shows that for these gravels
(L1 and L2), the breakdown occurred during the initial
stages. Hence, even if the gyrations were to be reduced,
there is a possibility that breakdown would still occur for
these gravels.
Further gradation analysis at 44 gyrations (the average
of all modified locking points) showed that hardly any
aggregate particle breakdown occurred for L3 (Figure 3).
While for L1 and L2, still aggregate particle breakdown
occurred (Figure 3). It is interesting to note that this
aggregate particle breakdown for L1 and L2 is similar to
that which occurred at 45 and 46 gyrations, respectively.
Thus, for L1 and L2 even if the gyrations were further
reduced, there is a possibility that aggregate particle
breakdown would still occur. Thus, the modified locking
point seems to be a suitable point at which to compact
laterite gravels treated with foamed bitumen, since there is
hardly any aggregate breakdown for L3, and the break-
down at the locking point which occurred with L1 was
lower than that which occurred at 200 gyrations.
Thus, based on this study, the rate of change of
compaction appears to be a suitable criterion for
determining the locking point of laterite gravels treated
with foamed bitumen. In summary, the steps involved in
0
10
20
30
40
50
60
70
80
90
100
0.01 0.1 1 10 100
Mas
s pas
sing
(%)
Sieve size (mm)
0
10
20
30
40
50
60
70
80
90
100
0.01 0.1 1 10 100
Mas
s pas
sing
(%)
Sieve size (mm)
0
10
20
30
40
50
60
70
80
90
100
0.01 0.1 1 10 100
Mas
s pa
ssin
g (%
)
Sieve size (mm)
L1- Original L1-44 gyrations L1-45 gyrations L2-Original L2-44 gyrations L2-46 gyrations
L3-Original L3-44 gyrations L3-40 gyrations
Figure 3. Gradation for the three laterite gravels before and after compaction at the locking point.
Table 7. Locking points of mixes based on the gradient ofslope.
Laterite gravels that constituted the mixesLocking point
(No. of gyrations)
L1 45L2 46L3 40
International Journal of Pavement Engineering 261
Dow
nloa
ded
by [K
ungl
iga
Tekn
iska
Hog
skol
a], [
May
Nam
uteb
i] at
09:
22 2
0 A
pril
2013

identifying the locking point based on the above-discussed
concepts are as follows:
(1) Fitting a logarithmic curve to the compaction curve
obtained from the gyratory compactor.
(2) Obtaining the gradient of slope of the compaction
curve by taking the second derivative of the regressed
curve.
(3) The locking point is identified as the first point at
which two gyrations at the same gradient of slope are
preceded by two gyrations at the same gradient of
slope. This was on average close to 40 gyrations for
the laterite gravel–foamed bitumen mixes evaluated.
3.2 Optimum compaction moisture content for lateritegravel mixes
The dry density increased as the moisture content
increased reaching a maximum and then reduced with
increasing moisture content (Figure 5). This illustrates that
moisture is an important requirement in compaction of
foamed bitumen mixes. Also, the dry density versus
moisture content curve obtained with foamed bitumen-
treated laterites is similar to that obtained for the gravels
without foamed bitumen. This shows that foamed
bitumen-treated materials to some extent exhibit granular
material behaviour. The maximum dry density and the
optimum compaction moisture content as a proportion of
the OMC for the gravels only for each of the gravels are
shown in Table 8.
The OMC of compaction for the different mixes is less
than the OMC for the laterite gravels only for all the
gravels tested, and it varied from 86% up to 92% of OMC
(Table 8). These results reveal that the compaction of
foamed bitumen mixes should be done at moisture
conditions below the OMC. Also, the maximum dry
densities achieved are less than those for the various
gravels only; this can be attributed to the presence of the
0
10
20
30
40
50
60
70
80
90
100
0.01 0.1 1 10 100
Mas
s pas
sing
(%)
Sieve size (mm) Sieve size (mm)
0
10
20
30
40
50
60
70
80
90
100
0.01 0.1 1 10 100
Mas
s pas
sing
(%)
Mas
s pas
sing
(%)
0
10
20
30
40
50
60
70
80
90
100
0.01 0.1 1 10 100
Sieve size (mm)
L3-original L3-200 gyrations
L2-Original L2-200 gyrationsL1-Original L1-200 gyrations
Figure 4. Gradation for the three gravels before and after compaction at 200 gyrations.
M. Namutebi et al.262
Dow
nloa
ded
by [K
ungl
iga
Tekn
iska
Hog
skol
a], [
May
Nam
uteb
i] at
09:
22 2
0 A
pril
2013

binder within these mixes which tends to increase the
volume which in turn reduces the density. Also, these
results reveal that gyratory compaction of foamed
bitumen-treated materials should be undertaken at
moisture conditions that are less than the OMC of the
gravels only, since compaction of the materials at 100%
OMC gave lower densities.
4. Conclusions
The locking point concept as defined by Vavrik and
Carpenter (1998) did not yield a definite locking point.
Instead, a modified locking point was used to establish the
number of gyrations at which laterite gravels treated with
foamed bitumen would be compacted. This modified
locking point is based on the rate of change of the
compaction curve. Using this modified locking point, a
procedure is proposed to assess the optimal compaction
conditions for laterite gravels–foamed bitumen mixes.
This involves fitting a logarithmic regression curve to the
compaction curve, obtaining the gradient of slope for the
curve, and then the modified locking point is taken as the
first point at which two gyrations at the same gradient of
slope are preceded by two gyrations at the same gradient of
slope.
On the basis of the above procedure, the number of
gyrations at which the locking point occurred varied from
40 up to 46 for the different foamed bitumen laterite gravel
mixes studied. In general, an average of 44 gyrations is
considered to give the modified locking point of the mixes
studied. Gradation analysis at the modified locking point
revealed that there was hardly any aggregate particle
breakdown for one (L3) of the laterite gravels. Although
L1 and L2 suffered aggregate particle breakdown at the
locking point of 44 gyrations, the breakdown was less than
that which occurred at 200 gyrations. While gradation
analysis beyond the locking point (at 200 gyrations)
revealed that there was aggregate particle breakdown for
all the laterite gravels.
Thus, based on this study, the modified locking point
seems to be a suitable point at which to compact laterite
gravels treated with foamed bitumen. However, there is a
need to test the validity of the modified locking concept
with mixes laid in the field and other aggregate types.
Figure 5. Dry density versus moisture content for laterite–foamed bitumen mixes at 44 gyrations.
Table 8. Summary of optimal compaction conditions.
Sample
Locking point(No. of
gyrations)
Maximumdry density(kg/m3)
Optimum compactionmoisture content
(%OMC)
L1 45 1958 90L2 46 1940 92L3 40 1995 86
Note: OMC is the optimummoisture content for the laterite gravels only determinedusing the modified Proctor method.
International Journal of Pavement Engineering 263
Dow
nloa
ded
by [K
ungl
iga
Tekn
iska
Hog
skol
a], [
May
Nam
uteb
i] at
09:
22 2
0 A
pril
2013

The optimum compaction moisture conditions for
laterite gravels treated with foamed bitumen at the
modified locking point were determined through sensi-
tivity analysis. The compaction OMC was less than the
OMC for the gravels only, ranging from 86% to 92% of
OMC. Thus, future gyratory compaction of these mixes
will be conducted at these compaction optimum moisture
content conditions. In addition, gyratory compaction of
foamed bitumen-treated materials can be carried out at
moisture conditions that are less than the optimum
moisture conditions of the aggregates only, as compaction
of the materials at 100% OMC gave lower densities.
Acknowledgements
The authors are grateful for the financial assistance by SwedishInternational Development Agency (SIDA) towards this work.Also, the resources at Division of Highway and RailwayEngineering of KTH, Sweden, are highly appreciated.
References
Akeroyd, F.M.L., 1989. Advances in foamed bitumen technology.5th conference on asphalt pavements for Southern Africa,Swaziland, VIII-1–VIII-4.
Bissada Amir, F., 1987. Structural response of foamed-asphalt-sand mixtures in hot environments. Transportation ResearchRecord 1115. Washington, DC: Transportation ResearchBoard, National Research Council, 134–149.
Brennen, M., Tia, M., Altschaeff, A. and Wood, L.E., 1983.Laboratory investigation of the use of foamed asphalt forrecycled bituminous pavements. Transportation ResearchRecord 911. Washington, DC: Transportation ResearchRecord Board, National Research Council, 80–87.
Bowering, R.H. and Martin, C.L., 1976. Foamed Bitumen:production and application of mixtures. Evaluation andperformance of pavement. Proceedings association ofasphalt paving technologists. Vol. 45, Association of AsphaltPaving Technologists, New Orleans, Louisiana, 453–473.
Browne, M.J., 2006. Feasibility of using a gyratory compactor todetermine compaction characteristics of soil, Thesis (PhD).University of Montana, USA.
British Standards Institute, 1990. BS 1377: Part 4:1990.Methodsof test for soils for engineering purposes. Compaction relatedtests.
Castedo, H., Beaudoin, C.C., Wood, L.E. and Altschaeffl, A.G.,1984. Durability characteristics of foamed asphalt mixtures.Proceedings of the 29th annual canadian technical asphaltassociation conference, 102–122.
Castedo-Franco, H.L. and Wood Leonard, E., 1983. Stabilizationwith foamed asphalt of aggregates commonly used in low-volume roads. Low-Volume roads: Third international
conference, 1983. Transportation Research Record 898.Transportation Research Board, National Research Council,297–302.
Csanyi, L.H., 1957. Foamed asphalt in bituminous pavingmixtures. Highway Research Board Bulletin, 161, 108–122.
Csanyi, L.H., 1960. Bituminous mixes prepared with foamedasphalt. Bulletin No. 189, Iowa Engineering ExperimentStation, Iowa State University.
European Committee for Standardization, 2007. SS-EN1426:2007.Bitumen and bituminous binders – Determinationof needle penetration.
European Committee for Standardization, 2007. SS-EN1427:2007. Bitumen and bituminous binders – Determi-nation of the softening point – Ring and Ball method.
European Committee for Standardization, 2003. SS-EN13302:2003. Bitumen and bituminous binders – Determi-nation of viscosity of bitumen using a rotating spindleapparatus.
Jenkins, K.J., 2000. Mix design considerations for cold and half-warm bituminous mixes with emphasis on foamed bitumen,Thesis (PhD dissertation). University of Stellenbosch, SouthAfrica.
Lee, D.Y., 1981. Treating marginal aggregates and soils withfoamed asphalt. Proceedings of the association of asphaltpaving technologists. Vol. 50, 211–250.
Namutebi, M., Birgisson, B. and Bagampadde, U., 2011.Foaming effects on binder chemistry and aggregate coat-ability using Foamed bitumen. International Journal of RoadMaterials and Pavement design, 12 (Issue 4/2011), 821–847.
Namutebi, M., Bagampadde, U. and Isacsson, U., 2009.Stabilisation of road construction materials using foamedbitumen, state-of-the-art review. Division of Highway andRailway Engineering, KTH, Stockholm.
Ruckel, P.J., Acott, S.M. and Bowering, R.H., 1983. Foamed-asphalt paving mixtures: preparation of design mixes andtreatment of test specimens, Transportation Research Record911, 88–95.
Sakr, H.A. and Manke, P.G., 1985. Innovations in Oklahomafoamix design procedures. Transportation Research Record1034, 1985. Washington, DC: Transportation ResearchBoard, 26–34.
Swedish Standards Institute, 2007. SS-EN 15326:2007. Bitumenand bituminous binders – Measurement of density andspecific gravity – Capillary-stoppered pycnometer method.
Swedish Standards Institute, 2003. SS-EN 13302:2003. Bitumenand bituminous binders – Determination of viscosity ofbitumen using a rotating spindle apparatus.
Sunarjono Sri, Ir.M.T., 2008. Influence of foamed bitumencharacteristics on cold mix asphalt properties, Thesis (PhD).University of Nottingham, UK.
Vavrik, W.R. and Carpenter, S.H., 1998. Calculating air voids atspecified number of gyrations in Superpave gyratorycompactor. Transportation Research Record 1630.Washington, DC: National Research Council.
Wirtgen, 2004. Cold recycling manual. 2nd ed. Wirtgen GmbH,76–89.
M. Namutebi et al.264
Dow
nloa
ded
by [K
ungl
iga
Tekn
iska
Hog
skol
a], [
May
Nam
uteb
i] at
09:
22 2
0 A
pril
2013


1
Original research paper 1
2
Exploratory study on bitumen content 3
determination for foamed bitumen mixes 4
based on porosity and indirect tensile 5
strength 6
7
May Namutebia,b, *, Björn Birgissona, Alvaro Guarina, and Denis Jelagina 8
9
a Division of Highway and Railway Engineering, KTH- The Royal Institute of Technology, Brinellvägen 23, SE 10
100 44, Sweden 11 b Department of Civil and Environmental Engineering, Makerere University, P. O. Box 7062, Kampala, Uganda 12
13
Abstract 14
Optimum bitumen content determination is one of the major aims for foamed bitumen mix 15
design. However, mix design procedures for foamed bitumen mixes are still under 16
development. In this paper a method to determine the optimum bitumen content for a given 17
foamed bitumen mix based on primary aggregate structure porosity and indirect tensile 18
strength criteria is proposed. Using packing theory concepts, the aggregate gradation is 19
divided into three aggregate structures namely; oversize, primary and secondary 20
structures. Porosity for the primary aggregate structure is determined for given bitumen 21
contents. A maximum value for porosity of 50% for the primary aggregate structure is used 22
to choose an initial bitumen content. Furthermore, a minimum indirect tensile strength 23

2
criteria is suggested to refine this bitumen content. This method enables a bitumen content 24
value to be chosen prior the start of experimental work, as porosity is expressed in terms 25
of physical parameters such as aggregate and binder specific gravity, aggregate gradation 26
which are known before the mix design process. The bitumen content is then later refined 27
when the indirect tensile strength is determined in the laboratory. This method would 28
reduce on resources such as time and materials that may be required during the mix 29
design procedure. 30
Keywords: 31
Foamed bitumen; Bitumen content; Aggregate; Porosity; Gradation framework; Indirect tensile 32
strength 33 *Corresponding author. Tel.: +256-772577122. E-mail addresses: [email protected] (M. Namutebi), [email protected] (B. Birgisson), [email protected] (A. Guarin), [email protected] (D. Jelagin).

3
1 Introduction 34
Foamed bitumen consists of hot bitumen, small quantities of water (typically 2-3% by weight of the 35
bitumen) and air (Csanyi, 1957; Castedo et al., 1984, and Jenkins, 2000). It is produced when water 36
and air are injected into hot bitumen at temperatures of 150°C to 180°C. Foamed bitumen was first used 37
in road construction in the 1950s by Csanyi of Iowa State University. He treated various soils with 38
foamed bitumen; the foamed bitumen used was produced with steam and hot penetration grade bitumen 39
(Csanyi and Fung, 1956, 1957 and 1959). In the late 1960s, Mobil Oil of Australia acquired the patent 40
for foamed bitumen technology and modified the process of foamed bitumen production by using cold 41
water instead of steam. Also, an expansion chamber and a system of nozzles where the foamed bitumen 42
was produced and dispersed respectively were developed (Bowering and Martin, 1976 and Lee, 1981). 43
The patent rights for foamed bitumen technology by Mobil Oil expired in the early 1990s, and other 44
companies such as Wirtgen group manufactured new equipment, also various researchers gained 45
access to the technology. Foamed bitumen may be used to stabilize a wide range of aggregates ranging 46
from good quality to marginal aggregates. In addition, soils such as sand, granular, and recycled 47
aggregates from pavements have been successfully treated with foamed bitumen (Csanyi, 1957 and 48
1959; Lee, 1981; and Asi, 2001). In contact with pre-wetted aggregates foamed bitumen combines with 49
the fines (particles whose size is less than 2 mm) forming bitumen mortar that binds the rest of the 50
aggregate particles in a composite mass (Jenkins, 2000). 51
52
1.1 Mix design for foamed bitumen mixes 53
Mix design involves procedures that are concerned with the formulation of optimum quantities for the 54
various mix constituents such that the resulting mix will be able to fulfil the application it is intended for. 55
In general, mix design for foamed bitumen mixes involves the following steps: 56
57
1.1.1 Aggregates, foamed bitumen conditions and characteristics 58
Aggregates, bitumen type, bitumen temperature, foamant water content are selected. Aggregates must 59
fulfil gradation requirements. Compaction characteristics (optimum moisture content and maximum dry 60

4
density) of the aggregates are also determined. The bitumen temperature at which to produce the 61
foamed bitumen is chosen normally through sensitivity analysis. The bitumen temperature and foamant 62
water content that yield the best foamed bitumen characteristics (maximum expansion ratio and 63
acceptable half-life) are chosen. 64
65
1.1.2 Bitumen content determination 66
At this stage, the optimum bitumen content is determined. Mixes with different bitumen contents 67
(additives such as lime or cement may be used) are produced and specimens made. Different 68
compaction and curing methods may be employed in the production of the specimens. Volumetric 69
properties such as bulk specific gravity, air voids are determined for the different specimens. In addition, 70
mix specimens are tested for mechanical properties such as indirect tensile strength, Marshall stability, 71
unconfined compressive strength, and resilient modulus. The optimum bitumen content may be 72
determined as that bitumen content that yields either the maximum or minimum value of the mechanical 73
or volumetric property. Some researchers have proposed that the optimum bitumen content be 74
determined on the basis of volumetric properties such as bulk specific gravity and air voids. Whilst others 75
have recommended that it should be based on bitumen content that yield the minimum or maximum 76
value of the indirect tensile strength (Muthen, 1998). Others such as Wirtgen (2012) and Asphalt 77
Academy (2009) have recommended taking the bitumen content that gives the minimum acceptable dry 78
or wet indirect tensile strength as the optimum bitumen content. 79
80
However, using volumetric properties such as bulk specific gravity may not be appropriate as bulk 81
density involved in computing the bulk specific gravity is normally determined from dimensional analysis. 82
Since foamed bitumen mixes are characterized with high air voids (values of 5% to 32% have been 83
reported) (Csanyi, 1959 and Lee, 1981) it is not possible to use the surface dried method to determine 84
the bulk specific gravity as in the case of hot asphalt mixes. Further, mechanical properties such as 85
indirect tensile strength may increase with the addition of bitumen thus not attaining an optimum value. 86
This kind of trend presents a challenge in selecting an appropriate bitumen content value. Yet the 87
optimum bitumen content should yield mixes with adequate strength and durability as well as minimizing 88

5
cost. 89
90
1.1.3 Further mechanical testing 91
Further mechanical testing such as triaxial, creep may be carried out on mix specimens made at the 92
optimum bitumen content. 93
94
1.2 Aggregate gradation 95
Within bituminous mixes aggregates constitute the largest component, therefore aggregate properties 96
(such as gradation, physical and chemical properties) and the way aggregate particles are arranged or 97
packed within the mixes would influence the resulting mix properties. Within foamed bitumen mixes, 98
studies have revealed that some mix properties such as permanent deformation and temperature 99
susceptibility are mainly influenced by aggregate particle interlock. For example, Sakr and Manke (1985) 100
showed that the Marshall stability of foamed bitumen mixes was greatly influenced by aggregate particle 101
interlock rather than bitumen viscosity. Sunarjono (2008) analysed the effect of foamed bitumen 102
characteristics on permanent deformation (in terms of the axial strain) for foamed bitumen mix 103
specimens; he observed that permanent deformation was mainly influenced by the aggregate skeleton 104
and binder type rather than foamed bitumen characteristics. Jenkins and Martin (2001) recommended 105
the use of voids in mineral aggregates (VMA) for the sand fraction as a parameter to select suitable 106
aggregate gradation for use with foamed bitumen mixes. They illustrated that the VMA for the sand 107
fraction decreased with increasing sand fraction reaching a minimum (VMA of 30.5% with sand fraction 108
of 15%) and then increased with further addition of sand fraction. The VMA was only determined for the 109
sand fraction and not the coarser fraction of the aggregate. 110
111
In hot mixes, studies have been done to evaluate mix performance using aggregate gradation. For 112
example, Roque et al. (2006) proposed a gradation framework defined in terms dominant aggregate 113
size range (DASR) that is mainly responsible for supporting applied loads within a hot mix. Further, 114
Roque et al. (2006) proposed and validated DASR porosity as a criterion to evaluate the performance 115
of hot mixes. Lira et al. (2012) developed a gradation model for hot mixes based on 3D packing concepts 116
6
and volumetric relationships, this model identified the aggregate size ranges (expressed in standard 117
sieve sizes) and quality (expressed in terms of porosity and coordination number) for the primary 118
structure responsible for supporting applied loads in a hot mix. Lira et al.’s model was able to distinguish 119
between hot mixes with good and bad rutting resistance. The above studies reveal the importance of 120
the aggregate structure as well as aggregate characteristics such as porosity within bituminous mixes. 121
122
Mix design methods for foamed bitumen mixes are still under development and rely mainly on principles 123
used in hot mix design. In this paper, primary aggregate porosity and a strength criteria based on the 124
indirect tensile strength are proposed to determine optimum bitumen content for a given foamed bitumen 125
mix. The aggregate porosity is determined for the primary aggregate structure. The primary aggregate 126
structure is determined using a gradation framework that is based on 3D packing concepts. 127
128
2.0 Aggregate gradation framework 129
Aggregate gradation is defined as the distribution of different particle sizes within a given aggregate. 130
The distribution of aggregate particle sizes is based on the percentage of aggregate material that passes 131
different standard sieve sizes. This method of determining aggregate particle size on the basis of 132
standard sieves gives an estimation of the various particle sizes within any given aggregate material. 133
The aggregate within a given foamed bitumen mix is divided into oversize, primary, and secondary 134
structures. The primary structure consists of coarser aggregate particles connected to each other either 135
through aggregate to aggregate interlock or through bitumen mortar (mix of mastic and fines). The 136
secondary structure consists of aggregate particles whose size is less than the primary structure and 137
the filler size inclusive. These aggregate particles are either embedded within the bitumen mortar or 138
they fill up the voids between the coarser aggregate particles that constitute the primary structure. The 139
oversize fraction consists of aggregate particles whose size is greater than that for primary structure; 140
due to its low concentration this fraction hardly contributes to load support. The different sieve size 141
ranges constituting the oversize, primary and secondary structures are deduced as shown in the 142
following sections. 143
144

7
2.1 Primary aggregate structure 145
In foamed bitumen mixes the coarse fraction largely provides support for the applied loads being 146
augmented by the bitumen mortar (mix of fines and bitumen). Thus, the coarse aggregate fraction forms 147
the basis of the primary structure. Assuming that aggregates within any foamed bitumen mix can be 148
represented by spheres of equal diameter packed in certain way, the 3D packing theory (based on 149
geometry of packing for spheres in a given space) is used to determine the sieve size range for the 150
primary structure. A review of the packing theory is briefly made below. 151
152
2.1.1 3D Packing theory 153
In packing theory, it has been observed that spheres of equal diameter can be packed in 3D four packing 154
arrangements namely; cubic, orthorhombic, tetragonal-sphenoidal and rhombohedral (Graton and 155
Fraser, 1935; Taylor, Milly and Jaffe, 1990; Yu and Rowe, 2012). These packing arrangements derive 156
their names from the shape of a 3D six-sided box formed by joining the eight sphere centres (Graton 157
and Fraser, 1935). 158
Each of these packing arrangements can be characterized with a packing density or concentration 159
(representing space occupied by spheres), porosity (representing void space), coordination number 160
(representing number of contact points with neighboring spheres per unit volume), and packing factor. 161
These characteristics are derived by analyzing the geometry of any given packing arrangement. Table 162
1 presents a summary of the different packing arrangements and their characteristics. As one moves 163
from the cubic packing arrangement to rhombohedral, the porosity decreases whilst the concentration 164
and the number of contact points increases (Table 1). The cubic arrangement represents the loosest 165
arrangement and rhombohedral the densest packing arrangement. 166
167
168
169
170
171
172

8
Table 1. Packing arrangements and their characteristics (Graton and Fraser, 1935; Taylor, Milly and 173
Jaffe, 1990; Cooke and Rowe, 1999) 174
Packing
arrangement
Number of
contact
points
Porosity (%) Packing density
(concentration)
(%)
Volume of
a unit cell
Packing
factor,
αm
Cubic
Ortho-rhombic
Tetragonal-
sphenoidal
Rhombohedral
6
8
10
12
47.64
39.54
30.19
25.95
52.36
60.46
69.81
74.05
d3
23d3
0.75d3
2d3
1
2 3
0.75
21
NB: d is sphere diameter 175
176
2.1.2 Interactive sizes within Primary aggregate structure 177
Since the primary structure is mainly responsible for transfer of applied loads, aggregate particles 178
constituting this structure must be in contact (interact) with each other as this is required for load transfer. 179
The aggregate particle sizes that are in contact (interact) with each other constitute the interactive sizes. 180
The standard sieve sizes are used to estimate the aggregate particle sizes and thus the sizes for the 181
different structures. To obtain the aggregate particle sizes that contribute to the primary structure, the 182
weighted average aggregate particle size as proposed by Yidet et al. (2013) is determined for the 183
various sieve sizes as shown in Eq. (1) and (2). It is derived as follows: 184
Considering aggregate particles retained between two consecutive sieves with sizes of D1 and D2 185
(where D1 is greater than D2); assuming that if aggregate particles (retained onto these two sieves) were 186
represented by particles with an average size; then the volume of particles with an average size would 187
be equal to the volume of particles retained in these two consecutive sieves. 188
189
Volume of particles with average size = Σ Volume of particles retained onto two consecutive sieves 190
191

9
Assuming aggregate particles are spherical, thus sphere volume = volume of particles and sieve size is 192
equal to particle size 193
194
Where: D1, D2 are the sieve sizes for two consecutive sieves 1 and 2 (D1, is greater than D2) respectively, 195
φ1, φ2 are concentrations (percentage retained by volume) for two consecutive sieves 1 and 2 196
respectively. 197
Make Davg the subject; 198
199
200
201
The average weighted diameter, Davg represents the average aggregate particle size for aggregate 202
particles between two consecutive sieve sizes. To determine the interaction between the sieve sizes, 203
the limits for weighted average size are determined as shown in the following sections. 204
205
Maximum/Upper limit sieve size 206
For the maximum sieve size for the primary aggregate structure, if one moves from the loosest packing 207
arrangement which is represented by cubic packing arrangement with concentration (packing density) 208
of 0.524 (Table 1) at particle size D1 to the densest state represented by the 3D rhombohedral packing 209
arrangement with concentration of 0.74 at particle size D2. This implies that concentration φ1 for D1 sized 210
particles is 0.52 and that for D2 sized particles, φ2=0.74-0.52=0.22 such that a densest state is reached 211
at size D2. When these concentration values are substituted in Eq. (2), then the maximum limit size for 212
the average weighted size, Davg for the primary structure is given as shown in Eq. (3). 213
214


11
in equation (5), the minimum concentration of 0.22 is obtained. To achieve a maximum concentration 236
of 0.74 at particle size D2 then concentration would increase by 0.74 – 0.22= 0.52. Thus, φ1=0.22 and 237
φ2=0.52. When these values are substituted in the Eq. (2) for weighted average particle diameter, the 238
lower limit for the weighted average is obtained as shown in Eq. (6). 239
240
241
242
Therefore by combining Eq. (3) and (6) the limits for the average weighted particle size Davg limits are 243
shown in Eq. (7). 244
245
246
247
Sieve sizes (representing aggregate particle sizes) with average weighted particle diameter lying within 248
the limits shown in Eq. (7) are considered to be interacting or in contact with each other and therefore 249
part of the primary structure. It may be possible to have different ranges of interacting sizes, in this 250
scenario the primary structure with highest concentration should be considered. The upper limit for the 251
average weighted size is a function of moving from a loosest packing arrangement (cubic) to the densest 252
one (rhombohedral packing arrangement). The rhombohedral 3D packing arrangement simulates the 253
densest state of compaction. The lower limit is a function of the minimum separation distance required 254
for particles to remain in contact derived from geometric considerations. 255
256
Considering the fact that porosity of a granular material consisting of equal sized particles in a loose 257
state is in the range of 45-55% (Lambe and Whitman, 1979); from this it can be inferred that in a granular 258
material for particles to be in contact with each other or to interact with each other (as particle interaction 259
is a necessary requirement for load transfer), the porosity must be less than 55%. Based on this 260
maximum porosity value (i.e. 55%), a packing density (i.e. volume filled by particles) of 45% is obtained 261

12
(from 100-55=45%). Therefore, a minimum packing density or concentration of 45% is required for 262
particles to remain in contact with each other or interact with each other. The packing density or 263
concentration may represent the aggregate mass or volume retained at any given sieve size within the 264
gradation of the aggregate. Therefore, the minimum packing density (concentration) of 45% required 265
for particles to interact with each other can act as a condition for a given aggregate size to qualify as 266
part of the primary structure. The minimum packing density of 45% corresponds to a maximum porosity 267
of 55% required for granular particles to remain in contact with each other. 268
269
2.1.3 Lower sieve size limit for primary structure 270
Studies have shown that aggregate particles sized 2.36 mm-0.063 mm and filler (less than 0.063 mm) 271
have a higher affinity for foamed bitumen than the coarser ones (Lee, 1981; Jenkins, 2000 and Fu et 272
al., 2008). Further, analysis of aggregate particle gradations used by other researchers in foamed 273
bitumen mixes (by the authors) have shown that the primary structure could extend up to the 1.18 mm 274
sieve size. Thus 1.0 mm sieve size is proposed as the cut-off sieve size for the primary structure. 275
276
In summary, the primary aggregate structure constitutes aggregate particles that are interacting with 277
each other and their sizes are determined from Eq. 2 and 7 above. In addition, the minimum 278
concentration for the primary structure should be at least 45% (minimum concentration required for 279
granular particles to remain in contact with each other), these two conditions are used to assess whether 280
aggregate particles of a particular size are part of the primary structure. The minimum cut-off sieve size 281
for the primary structure is proposed as 1.0 mm. 282
283
2.2 Oversize and Secondary aggregate structures 284
2.2.1 Oversize aggregate structure 285
Any sieve size greater than the maximum sieve size for the primary structure is considered to be part 286
of the oversize structure. The minimum sieve size for this structure should be equal to the maximum 287
sieve size for the primary structure and the maximum sieve size should be the aggregate maximum 288
size. This oversize structure does not take part in supporting the applied loads as its concentration is 289
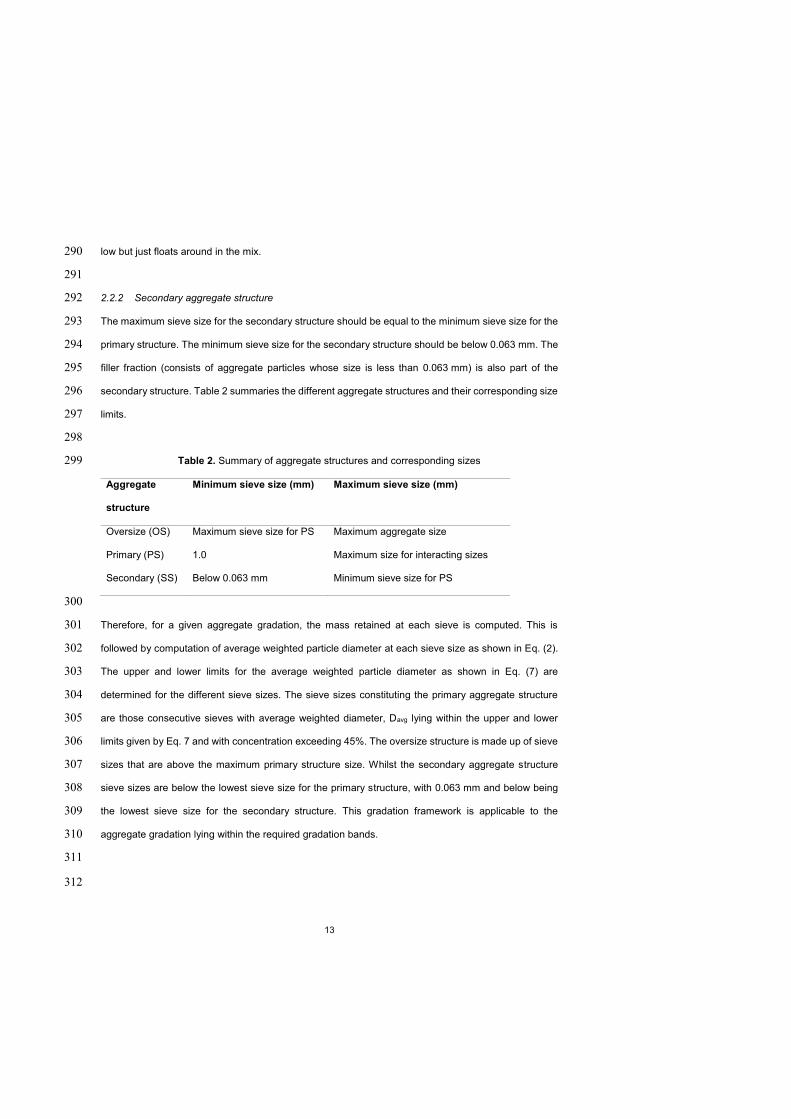
13
low but just floats around in the mix. 290
291
2.2.2 Secondary aggregate structure 292
The maximum sieve size for the secondary structure should be equal to the minimum sieve size for the 293
primary structure. The minimum sieve size for the secondary structure should be below 0.063 mm. The 294
filler fraction (consists of aggregate particles whose size is less than 0.063 mm) is also part of the 295
secondary structure. Table 2 summaries the different aggregate structures and their corresponding size 296
limits. 297
298
Table 2. Summary of aggregate structures and corresponding sizes 299
Aggregate
structure
Minimum sieve size (mm) Maximum sieve size (mm)
Oversize (OS)
Primary (PS)
Secondary (SS)
Maximum sieve size for PS
1.0
Below 0.063 mm
Maximum aggregate size
Maximum size for interacting sizes
Minimum sieve size for PS
300
Therefore, for a given aggregate gradation, the mass retained at each sieve is computed. This is 301
followed by computation of average weighted particle diameter at each sieve size as shown in Eq. (2). 302
The upper and lower limits for the average weighted particle diameter as shown in Eq. (7) are 303
determined for the different sieve sizes. The sieve sizes constituting the primary aggregate structure 304
are those consecutive sieves with average weighted diameter, Davg lying within the upper and lower 305
limits given by Eq. 7 and with concentration exceeding 45%. The oversize structure is made up of sieve 306
sizes that are above the maximum primary structure size. Whilst the secondary aggregate structure 307
sieve sizes are below the lowest sieve size for the primary structure, with 0.063 mm and below being 308
the lowest sieve size for the secondary structure. This gradation framework is applicable to the 309
aggregate gradation lying within the required gradation bands. 310
311
312
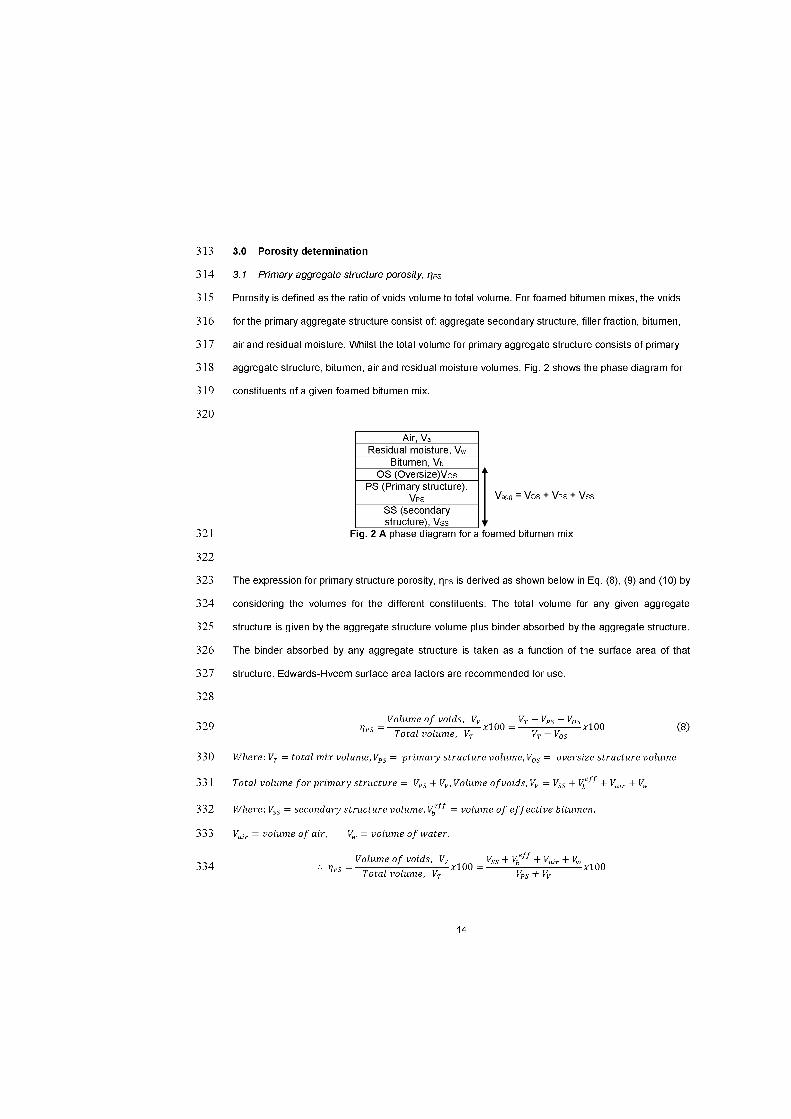

15
335
336
337
338
339
NB: Bitumen volume absorbed by the aggregate structure is considered as part of the total aggregate 340
volume. 341
342
343
344
345
346
347
348
349
350
351
352
353
354
355
356

16
357
358
359
Substituting for the different volume components (VPS, VSS, Vbeff, Vair, and Vw) in Eq. (9): 360
361
362
363
364
3.2 Secondary aggregate structure porosity, ηSS 365
Similarly as in the case of primary structure, the secondary structure porosity is the ratio of the volume 366
of voids to total volume of the secondary structure. The voids for the secondary structure consist of: 367
filler fraction, bitumen, air and residual moisture (Fig. 2). Whilst the total volume for secondary structure 368
consists of secondary structure aggregate, filler, bitumen, air and residual moisture volumes. The 369
expression for secondary structure porosity, ηSS is derived as shown below in Eq. (11) and (12). 370
371
372
373
374
Substituting for the different volume components (VSS, Vbeff, Vair, and Vw) in Eq. (11): 375
376

17
377
378
379
3.3 Variation of aggregate structure porosities with bitumen content 380
Since fine portion of the aggregate (normally less than 2.36 mm) exhibits a higher affinity for foamed 381
bitumen (Jenkins, 2000); it can be hypothesized that in contact with pre-wetted aggregates foamed 382
bitumen combines with the fine fraction of the aggregate forming bitumen mortar. This bitumen mortar 383
then coats the coarser aggregate particles. The compaction process promotes the coating of the coarser 384
aggregate particles by the bitumen mortar. Therefore when foamed bitumen is added to a pre-wetted 385
aggregate, the secondary structure (which consists of the fines) combines with the foamed bitumen, 386
this leads to reduction in the voids within the secondary structure and thus reduction in secondary 387
structure porosity. Whilst further increase in bitumen will lead to increase in voids within the secondary 388
structure, as a result of the voids being filled with additional bitumen and thus increase in its porosity. 389
Fig. 3 illustrates the typical variation of secondary structure porosity and bitumen content. 390
391
Similarly, considering the primary aggregate structure, when bitumen is added to the pre-wetted 392
aggregates, the voids within the primary structure start to be filled with the secondary structure and 393
bitumen. This leads to a decrease in the voids volume of the primary structure and thus decrease in the 394
primary structure porosity. However after a certain bitumen content, any further addition of bitumen 395
would lead to increase in the voids within the primary structure as the added bitumen together with the 396
secondary structure gets in between primary structure particles thus increasing the volume of voids. 397
This increase in voids is followed by the increase in primary structure porosity. Fig. 3 illustrates the 398
typical variation of primary structure porosity and bitumen content. 399
400


19
gives 50% porosity) are chosen; specimens are then made at these bitumen contents and tested for 420
indirect tensile strength. 421
422
4.2 Strength criteria 423
The indirect tensile test is recommended as it is a common and simple test to carry out. Moreover, 424
equipment for this test is readily available in typical highway engineering laboratories. Indirect tensile 425
strength values (ITS) at primary aggregate porosity of 50% are determined, these are compared the 426
minimum recommended values. The Asphalt Academy (2009) recommends minimum values dry and 427
wet indirect tensile strength of 125 kPa and 50 kPa, respectively for 100 mm diameter foamed bitumen 428
mix specimens. These ITS values may be obtained from plots of primary porosity versus indirect tensile 429
strength. The final bitumen contents are then obtained from plots of indirect tensile strength versus 430
bitumen content. 431
432
5.0 Application of the design procedure 433
The above proposed procedure was applied to mixes of foamed bitumen and laterite gravels and the 434
following results were obtained. Firstly, the experimental work involved is briefly described. 435
436
5.1 Experimental procedure 437
Three laterite gravel samples (coded L1, L2 and L3) and two penetration grade bitumens of 50/70, 438
70/100 coded B1 and B2 respectively were used in the study. The bitumens were supplied by Nynas 439
AB of Sweden. The laterite gravels were sourced from the Lake Victoria region around the equator. 440
Chemical analysis showed that the silica-sesquioxide ratios (ratio of silica to iron and aluminium oxide) 441
for the laterite gravels were 0.35 for L1, 0.315 for L2 and 0.497 for L3. Laterite gravel gradation was 442
adjusted to fit in the ideal zone band for aggregates required for foamed bitumen mixes. The physical 443
properties of the bitumens are shown in Table 3. Foamed bitumen mix specimens consisting of laterite 444
gravels and foamed bitumen were made. The bitumen content was varied from 2% up to 6% in 445
increments of 1%. The foamed bitumen used in the production of the mixes was at the optimum 446
conditions of bitumen temperature and foamant water contents as determined by Namutebi et al., (2011) 447

20
(Table 3). 448
449
Table 3. Bitumen physical properties, foam conditions and characteristics (Namutebi et al., 2011) 450
Property Bitumen B1 B2 Grade 50/70 70/100
Penetration at 25oC (0.1 mm) Softening point (°C) Specific gravity Brookfield viscosity (Pas) Foamed bitumen conditions & characteristics: Bitumen temperature (°C) Optimum foamant water content (%) Maximum expansion ratio Half-life (s)
at 135°C at 140°C at 150°C at 160°C at 170°C at 180°C
50.3 50.4 1.028 0.485 0.370 0.236 0.159 0.110 0.078 160 3 22 17
79.0 44.7 1.026 0.344 0.284 0.176 0.120 0.084 0.062 150 2 17 17
451
Pre-wetted gravel specimens were mixed with foamed bitumen after 24 hours, more moisture was 452
added to the mixture of gravels and foamed bitumen in order to bring the moisture conditions to the 453
compaction moisture levels. These mixes were left for 24 hours after which mixes were compacted at 454
the locking point in moulds of 100 mm diameter. Curing of the compacted specimens was then done; 455
this involved leaving the specimens sealed at room temperature for 24 hours followed by placing them 456
in the oven at 40�C for 72 hours. After curing, specimens were then cooled and sealed for indirect tensile 457
strength testing. Cured mix specimens were conditioned at a temperature at 20°C for at least 30 458
minutes. Mix specimens were then placed between the top (loading ram plate) and bottom plates in the 459
MTS (Material testing system) equipment. A compressive load, P was applied at a deformation rate of 460
50.8mm/min to the diametrical axis of the specimen until failure. The maximum load, P that failed the 461
specimen was recorded and used to compute the indirect tensile strength. Indirect tensile strength in 462
units of kPa was computed from 2Px 103/�D h, where D and h are specimen diameter and height in mm 463
respectively. 464
465

21
5.2 Aggregate structures 466
When the aggregate framework in section 2.0 was applied to the gradation for laterite gravels the sieve 467
size ranges for oversize structure, primary structure, and secondary structures as well as the 468
corresponding concentration summarised in Table 5 were obtained. Table 4 illustrates the derivation of 469
the interactive sieve sizes for the primary aggregate structure for laterite gravel L1. These interactive 470
sieve sizes are highlighted (Table 4). 471
472
Table 4. Determination of oversize, primary and secondary structures for L1 473
Sieve size (mm)
Mass passing (%)
%retained per sieve (concentration)
Weighted average particle diameter (mm), Davg
Lower limit for Davg (mm)
Upper limit for Davg (mm)
Does Davg lie within limits?
Sieve size ranges
31.5 22.4 16 11.2 8 4 2.36 1.18 1 0.5 0.25 0.125 0.063 0
100 99 84 67 57 45 37 34 34 28 23 20 17 0
0 1 15 17 10 12 8 3 0 6 5 3 3 17
22.40 16.22 12.66 9.49 4.74 2.93 1.69 1.15 0.51 0.31 0.16 0.08 0.00
24.23 17.30 12.14 8.65 4.46 2.60 1.32 1.05 0.56 0.28 0.14 0.07 0.00
27.56 19.65 13.88 9.82 5.54 3.12 1.63 1.12 0.69 0.35 0.17 0.09 0.00
FALSE FALSE TRUE TRUE TRUE TRUE FALSE FALSE FALSE TRUE TRUE TRUE TRUE
31.5-22.4 22.4-16 16-11.2 11.2-8 8-4 4-2.36 2.36-1.18 1.18-1 1-0.5 0.5-0.25 0.25-0.125 0.125-0.063 0.063-0
NB: Gradation was based on wet sieving, Davg= D1D2[(φ1+ φ2)/(φ1D23 + φ2D13 )]1/3; Lower limit for Davg: 474
Davg= 1.51D1D2/(D23+2.36D13 )1/3; Upper limit for Davg: Davg= 1.51D1D2/(2.36D23+D13 )1/3. The highlighted 475
cells show sieve sizes that are interacting. 476
477
478
479
480
481

22
Table 5. Laterite gravel structures their concentration and sieve size ranges 482
Laterite gravel
Aggregate structure concentration (%) Sieve sizes (mm)
Oversize structure (OS)
Primary structure (PS)
Secondary structure (SS)
Oversize structure (OS)
Primary structure (PS)
Secondary structure (SS)
L1 L2 L3
16 16 16
47 44 46
37 40 38
>16 >16 >16
16-2.36 16-2.36 16-2.36
Less than 2.36 Less than 2.36 Less than 2.36
483
The aggregate oversize structure sieve size ranged between 16 mm and 31.5 mm, whilst the primary 484
structure the sieve size ranged between 16 mm to 2.36 mm for all laterite gravels. The secondary 485
structure size ranged from 2.36 mm and below for all laterite gravels (Table 5). The laterite gravel 486
grading was based on wet gradation since this represents the true gradation of the gravels. The primary 487
structure concentration exceeded 45% the minimum concentration required for aggregate particles to 488
remain in contact with each other, (with the exception for laterite gravel L2) as deduced from Lambe 489
and Whitman’s suggestion (1979) and as discussed in section 2.1.2 of this paper. For laterite gravel L2, 490
the concentration for the primary structure of 44% is closer to 45% within limits of experimental error. 491
492
5.3 Aggregate structure porosity 493
Primary aggregate structure porosity was determined as shown in Eq. (10) in section 3.1. Plots of 494
primary aggregate structure porosity versus bitumen content were made and are shown in Fig. 4. 495
496


24
best represents the variation of primary porosity with bitumen content as it describes what actually 516
happens in practice unlike the Fourier model that yields different peaks at different bitumen contents. It 517
is not clear why mixes made with bitumen B2 exhibited such a trend of a Fourier model. However, such 518
variations illustrate the complex nature of foamed bitumen mixes. 519
520
Table 6. Model equations and corresponding parameters 521
Mix Model equation R2 Adjusted R2
95% confidence intervals
1st term 2nd term, 3rd term
Constant, last term,
L1-B1 L2-B1 L3-B1 L1-B2 L2-B2 L3-B2
ηPS = 0.08x2 - 0.77x + 51.5 �PS = 0.36x2 – 2.09x + 51.4 �PS = 0.57x2 – 3.31x + 51.1 �PS=50.8+ 0.61cos(1.04x) + 2.3 sin(1.04x) �PS=53.6-1.453cos(1.272x) + 0.7896 sin(1.272x) �PS=53.6 -1.24cos(2.5x) -0.204 sin(2.5x)
0.73 0.70 0.90 0.83 0.93 0.83
0.56 0.53 0.84 0.58 0.83 0.57
-0.099, 0.27 -0.07, 0.78 0.22, 0.92 48.8, 52.8 52.6, 54.6 52.1, 55.2
-1.9, 0.38 -4-76, 0.59 -5.50, -1.13 -3.4, 4.6; -1.06, 5.6 -3.3, 0.41; -3.2, 4.8 -3.49, 1.00; -5.39, 4.99
49.9, 53.1 47.4, 55.2 48.01, 54.19 0.58, 1.49 0.71, 1.83 1.33, 3.66
NB: �PS primary structure porosity, x= bitumen content 522
523
When a criteria of 50% primary aggregate structure porosity is considered as discussed in section 2.1.2; 524
the acceptable bitumen contents as deduced from Fig. 4 for the different laterite gravel foamed bitumen 525
mixes are summarized in Table 7. It is interesting to note the obtained bitumen contents at 50% primary 526
structure porosity (in Table 7) all yield ITS values that exceed 125 kPa (see Figure 6), the minimum dry 527
ITS value recommended by Asphalt Academy (2009). 528
529
530
531
532
533

25
Table 7. Bitumen contents corresponding to 50% primary porosity 534
Bitumen Laterite gravel
Bitumen content (%)
Primary porosity, ��PS (%)
B1 B2
L1 L2 L3 L1 L2 L3
4.1* 2.7* 3.0* 4.3* 5** 5**
50 50 50 50 52.4 52.7
NB: *- an average for two or more bitumen contents was taken. **- a bitumen content with porosity 535
closer to 50% was taken 536
537
5.4 Indirect Tensile strength and Primary Aggregate porosity 538
The variation of primary aggregate structure porosity with indirect tensile strength is shown in Fig. 5. 539
Generally, primary aggregate structure porosity decreased as the indirect tensile strength increased 540
reaching a minimum value. As the porosity increased further from a minimum value the indirect tensile 541
strength increased (see Fig. 5). This increase in porosity could possibly be attributed to the increase in 542
bitumen content that in turn leads to increase in the voids. From Fig. 6, as the bitumen content increased 543
the indirect tensile strength increased. 544
545
The indirect tensile strength (ITS) values corresponding to the primary aggregate structure porosity of 546
50% are deduced from Fig. 5 for the different mixes and are summarized in Table 8. It can be observed 547
that the ITS values at 50% primary structure porosity exceed the minimum dry ITS value of 125 kPa 548
recommended by Asphalt Academy (2009) (see Table 8). 549
550
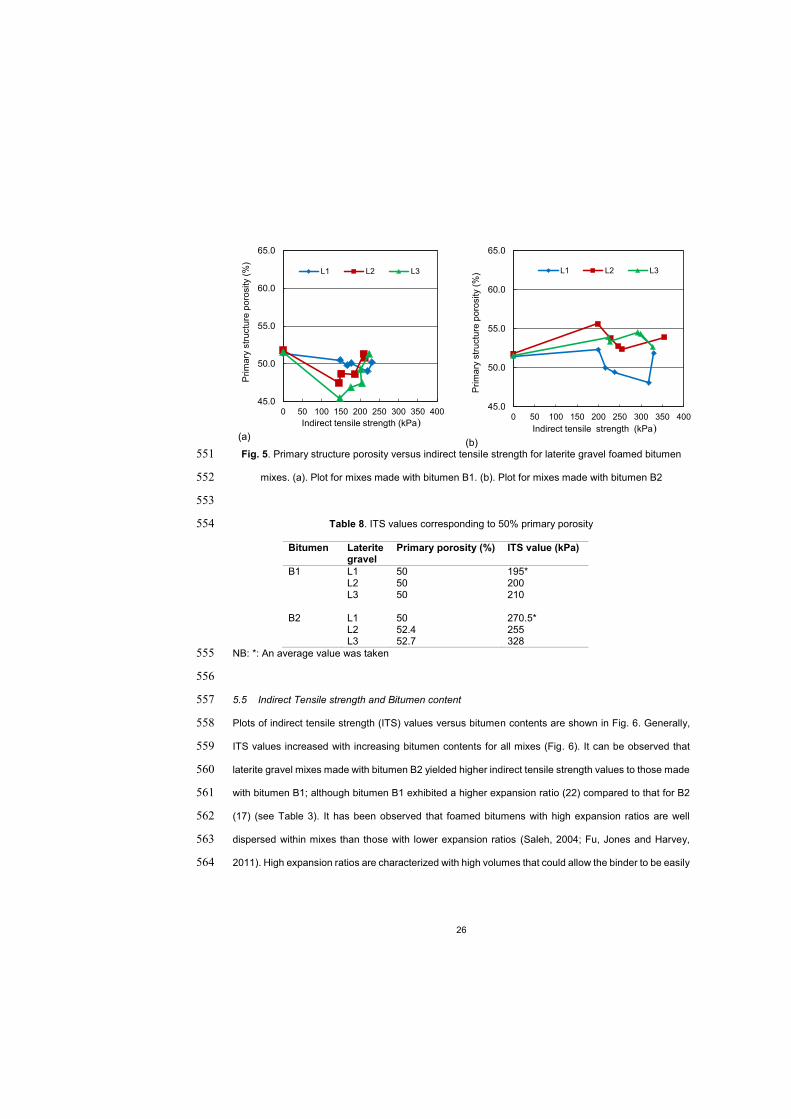
26
(a)
(b) Fig. 5. Primary structure porosity versus indirect tensile strength for laterite gravel foamed bitumen 551
mixes. (a). Plot for mixes made with bitumen B1. (b). Plot for mixes made with bitumen B2 552
553
Table 8. ITS values corresponding to 50% primary porosity 554
Bitumen Laterite gravel
Primary porosity (%) ITS value (kPa)
B1 B2
L1 L2 L3 L1 L2 L3
50 50 50 50 52.4 52.7
195* 200 210 270.5* 255 328
NB: *: An average value was taken 555
556
5.5 Indirect Tensile strength and Bitumen content 557
Plots of indirect tensile strength (ITS) values versus bitumen contents are shown in Fig. 6. Generally, 558
ITS values increased with increasing bitumen contents for all mixes (Fig. 6). It can be observed that 559
laterite gravel mixes made with bitumen B2 yielded higher indirect tensile strength values to those made 560
with bitumen B1; although bitumen B1 exhibited a higher expansion ratio (22) compared to that for B2 561
(17) (see Table 3). It has been observed that foamed bitumens with high expansion ratios are well 562
dispersed within mixes than those with lower expansion ratios (Saleh, 2004; Fu, Jones and Harvey, 563
2011). High expansion ratios are characterized with high volumes that could allow the binder to be easily 564
45.0
50.0
55.0
60.0
65.0
0 50 100 150 200 250 300 350 400
Prim
ary
stru
ctur
e po
rosi
ty (%
)
Indirect tensile strength (kPa)
L1 L2 L3
45.0
50.0
55.0
60.0
65.0
0 50 100 150 200 250 300 350 400
Prim
ary
stru
ctur
e po
rosi
ty (%
)
Indirect tensile strength (kPa)
L1 L2 L3

27
dispersed within the mix. Mixes with well dispersed foamed bitumen are expected to yield higher 565
strengths than those in which foamed bitumen is not well dispersed. Sunarjono (2008) suggested that 566
foam viscosity and method of mixing (type of mixer, mixing time) could be other parameters that 567
influence mix performance. 568
569
Results in this study seem to contradict observations made by other researchers such as Saleh (2004) 570
and Fu et al. (2011); this may be explained by the lower bitumen viscosities exhibited by bitumen B2 571
compared to those for bitumen B1 (Table 3). These lower viscosities could possibly lead to a good 572
dispersion of bitumen B2 within the mixes and formation of bitumen mortar that is more elastic which 573
can support higher tensile stresses than say a stiffer mortar that results when mixes are made with 574
bitumen B1 with high viscosities. He and Wong (2008) from their study on evaluation of moisture effects 575
on the strength and permanent deformation for foamed bitumen mixes containing recycled asphalt 576
pavement (RAP) materials, showed that mixes made with bitumen 100 pen (a high penetration grade 577
bitumen and lower viscosity) yielded higher indirect tensile strengths than those made with 60 pen (a 578
low penetration grade bitumen and high viscosity). He and Wong’s observation could be explained by 579
the lower viscosity exhibited by the 100 pen grade bitumen compared to the 60 pen bitumen. This low 580
viscosity bitumen could led to formation of less stiff bitumen mortar that could resist higher tensile 581
stresses than a more stiffer bitumen mortar that resulted with the higher viscosity bitumen. Results from 582
this study agree with observations made in He and Wong’s study. Also, results from this study seem to 583
suggest that bitumen viscosity is also a factor that could influence the resulting mix properties such as 584
ITS. However, other factors such as bitumen composition that were not considered in this study could 585
possibly affect the indirect tensile strength results. 586
587
Between 2% and 5% bitumen contents for both B1 and B2 mixes containing gravel L3 generally yielded 588
higher ITS values compared to those with L1 and L2 (Fig. 6). This may possibly be attributed to the high 589
fines content (material less than 0.063 mm) for L3. From wet gradation results, L3 and L2 yielded the 590
highest amount of fines (20%) and L1 had the lowest amount of fines (17%). The higher fines content 591
may lead to the formation of bitumen mortar that is more elastic and thus enhancing the resistance of 592
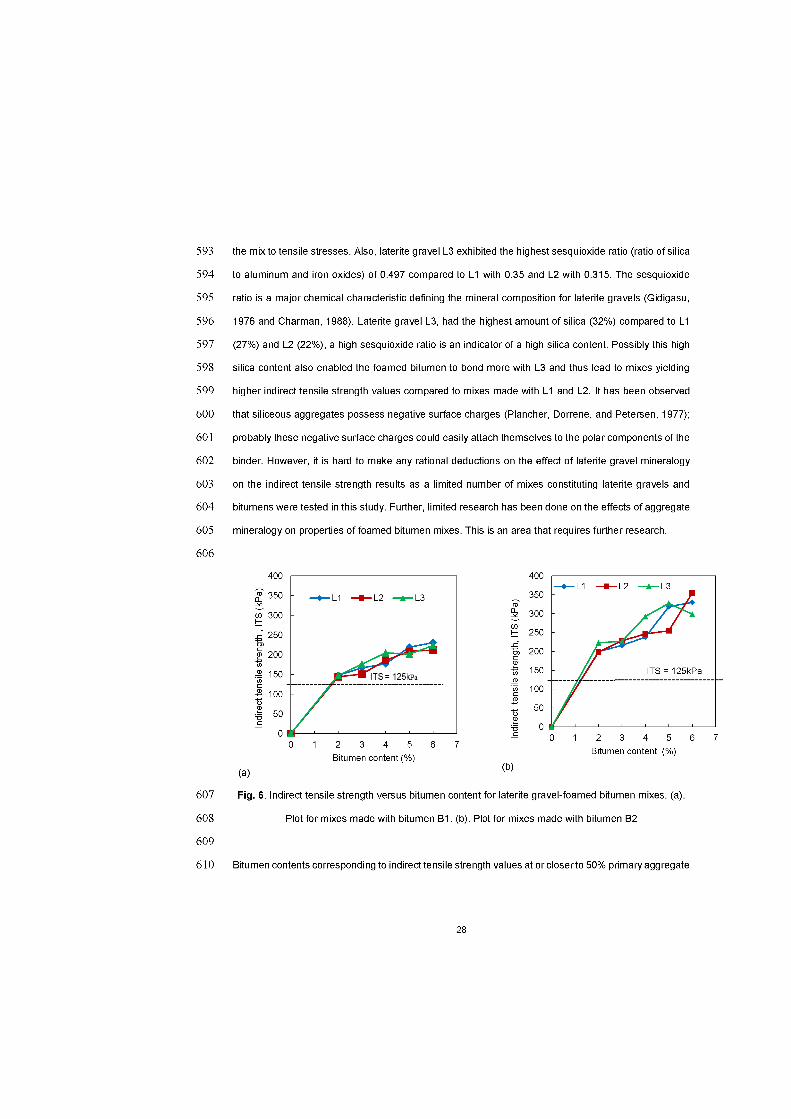

29
structure porosity are deduced from plots of ITS versus bitumen content in Fig. 6 and are summarized 611
in Tables 8 and 9. If 60% is taken as the minimum retained indirect tensile strength ratio (ratio of wet 612
indirect tensile strength to the dry value) as recommended by Asphalt Academy (2009), the estimated 613
wet ITS values all exceed 75 Pa the minimum wet ITS value (see Table 9). Mix samples were not tested 614
for wet ITS in this study due to resource constraints. Also, the dry indirect tensile strength values exceed 615
the minimum value of 125 kPa recommended by the Asphalt Academy (2009) (see Tables 8 and 9). 616
This supports primary aggregate structure porosity as a parameter that can be used to determine 617
bitumen contents for foamed bitumen mixes. 618
619
Table 9. Bitumen contents in percent from ITS versus bitumen content plots 620
Bitumen Laterite gravel
ITS (kPa)
Bitumen content
(%)
Estimated wet ITS (kPa)
B1
B2
L1 L2 L3
L1 L2 L3
195 200 210
270.5 255 328
4.5 4.7 5.5
4.4 5.0 4.6
117 120 126
162 153 197
621
In summary, the procedure to determine the optimum bitumen content consists of establishing the 622
different aggregate structures (oversize, primary and secondary) followed by computation of the porosity 623
for the primary structure. The bitumen content at or closer to 50% primary structure porosity is chosen 624
at first. Indirect tensile strength is determined for foamed bitumen specimens made with bitumen 625
contents at, closer and above the bitumen content corresponding to 50% primary structure porosity. 626
The bitumen content that leads to a minimum indirect tensile strength of 125 kPa is chosen as the final 627
optimum bitumen content. 628
629
5.6 Practical applications of the study 630
Results from this study if applied in practice can aid in determining the optimum bitumen content 631
expeditiously. A few trial foamed bitumen mixes can be made with an estimated bitumen content 632

30
determined initially from the aggregate and bitumen physical properties such as specific gravity, 633
proportions of the different aggregate structures (oversize, primary and secondary) as these can easily 634
be determined from aggregate gradation which is known or has been chosen. The binder absorbed can 635
be estimated by the water absorption capacity of the aggregate. Aggregate surface area values for the 636
different aggregate structures can be determined from Hveem standard values. Assumed values can 637
be used for porosity (say 50%), air voids and residual moisture content. Foamed bitumen mix specimens 638
could be produced at bitumen contents below, at and above the estimated bitumen content (as a 639
function of aggregate and bitumen properties as well as guide values for porosity, air voids, residual 640
moisture and surface area) and tested for ITS. From the analysis of plots of porosity versus bitumen 641
content and ITS versus bitumen content, an optimum bitumen content that satisfies recommended ITS 642
values can be chosen. 643
644
6.0 Summary and Concluding Remarks 645
The aggregate gradation framework based on the 3D packing theory was used to characterize the 646
aggregate structure of foamed bitumen mixes into: oversize, primary, and secondary aggregate 647
structures. Using the primary structure aggregate porosity of 50%, bitumen contents corresponding to 648
primary aggregate structure porosity of 50% were determined. The starting bitumen content could be 649
estimated given primary structure porosity criteria of 50% and values assumed for other variables such 650
as air voids, residual moisture, specific gravity for bitumen, mix specific gravity. Other variables such as 651
aggregate surface area can be computed from standard values; proportions of different aggregate 652
structures can easily be deduced from the aggregate grading; aggregate specific gravity can be easily 653
determined as a characteristic for the aggregate as well as the amount of binder absorbed could be 654
related to the water absorption characteristics for the aggregates. 655
656
Further, mixes are made at these bitumen contents (corresponding to primary porosity of 50%) below, 657
closer as well as above and tested for indirect tensile strength. The lowest bitumen content that yields 658
the minimum indirect tensile strength value is taken as the optimum bitumen content. Determining the 659
bitumen content for use in design of a given foamed bitumen mixture using aggregate porosity provides 660

31
a rational and cost effective way of estimating binder requirements. Also, this eliminates the need of 661
carrying out complex tests such as triaxial tests which are not available in many highway laboratories 662
and are time consuming. Further, this reduces on the number of bitumen contents that may be 663
considered in mix design, since only bitumen contents (say three sets of bitumen contents) closer to the 664
identified bitumen content that yields a 50% primary porosity may be used. However, this procedure 665
needs to be validated with other foamed bitumen mixes made with various bitumen types and contents 666
as well as different aggregate types. Also, wet ITS values need to be considered in order to incorporate 667
the durability aspect for foamed bitumen mixes. 668
669 Study limitations 670
Wet indirect tensile strength values need to be considered in choosing the final bitumen content as 671
foamed bitumen mixes are characterized with high voids. In this study, wet ITS values were not 672
determined for the laterite gravel-foamed bitumen mixes due to resource constraints. Also, the 3D 673
packing theory used in dividing the aggregate into the different structures is based on spheres and yet 674
in reality aggregate particles are hardly spherical in shape. In addition, aggregate particle sizes are 675
estimated with standard sieve sizes. Despite these limitations, this research prompts the use of the 676
aggregate porosity concept in foamed bitumen mix design and should be pursued further. 677
678
Acknowledgments 679
The financial assistance from the Swedish International Development Agency, and Division of Highway 680
and Railway Engineering, KTH, Stockholm is highly appreciated. The laboratory resources at Division 681
of Highway and Railway Engineering, KTH are highly appreciated. Also, the assistance by Jonas Ekblad 682
of NCC and Ehsan, Division of Highway and Railway Engineering in testing of the specimens is 683
gratefully acknowledged. 684
685
References 686
Asi, I. M., 2001. Stabilization of Sebkha soil using foamed asphalt. Journal of Materials in Civil 687
Engineering 13 (5), 325-331. 688

32
Asphalt Academy, 2009. Technical guideline: Bitumen stabilised materials. A guide for the design and 689
construction of bitumen emulsion and foamed bitumen stabilised materials, TG2, second ed. Asphalt 690
Academy, Pretoria. 691
Bowering, R. H., Martin, C. L., 1976. Foamed Bitumen: Production and application of mixtures. 692
Evaluation and performance of pavement. Proceedings Association of Asphalt Paving Technologists 693
45, 453-473. 694
Castedo, H., Beaudoin, C. C., Wood, L. E., Altschaeffl, A. G., 1984. Durability characteristics of foamed 695
asphalt mixtures. In: Proceedings of the 29th Annual Canadian Technical Asphalt Association 696
Conference, held in Montreal, Canada, 1984, 102-122. 697
Charman J. H., 1988. Laterite in road pavements. ODA/TRL Special Publication 47. CIRIA, London 698
Cooke, A. J., Rowe, R. K., 1999. Extension of porosity and surface area models for uniform porous 699
media. Journal of Environmental Engineering 125, 126-136. 700
Coussot, P., 2005. Rheometry of pastes, suspensions, and granular materials. Applications in industry 701
and environment. John Wiley & Sons Inc., New Jersey, 43 702
Csanyi, L. H., Fung, H., 1956. Mortar theory for use of Ungraded aggregates in bituminous mixes. 703
Highway Research Board 109. 704
Csanyi, L. H., 1957. Foamed asphalt in bituminous paving mixtures. Highway Research Board 161, 705
108-122. 706
Csanyi, L. H., 1959. Foamed asphalt. Technical Bulletin 240. 707
Fu, P., Harvey, J. T., Jones, D., Chao, Y., 2008. Understanding internal structure characteristics of 708
foamed asphalt mixes with fracture face image analyses. Journal of Transportation Research 709
Record Board 2057, 20-27. 710
Fu, P., Jones, D., Harvey, J. T., 2011. The effects of asphalt binder and granular material characteristics 711
on foamed asphalt mix strength. Journal of Construction and Building Materials 25, 1093–1101. 712
Graton, L. C., Fraser, H. J., 1935. Systematic packing of spheres with particular relation to porosity and 713
permeability. Journal of Geology 8 (43), 785-909. 714
Gidigasu M. D., 1976. Laterite soil engineering. Pedogenesis and engineering principles. Elsevier 715
Scientific Publishing Company, Amsterdam. 716

33
He, G., Wong, W., 2008. Effects of moisture on strength and permanent deformation of foamed asphalt 717
mix incorporating RAP materials. Journal of Construction and Building Materials 22, 30-40. 718
Jenkins, K. J., (2000). Mix design considerations for cold and half-warm bituminous mixes with 719
emphasis on foamed bitumen (PhD dissertation). University of Stellenbosch, Stellenbosch. 720
Jenkins, K., van de Ven Martin, (2001). Guidelines for the mix and performance prediction of foamed 721
bitumen mixes. In: Proceedings of Meeting the Transport Challenges in Sothern Africa, 20th South 722
African Transport Conference, South Africa, 16-20 July (2001). 723
Lambe, T. W., Whitman, R. V., 1979. Soil mechanics, SI version. John Wiley & Sons Inc., New York, 724
29-31 725
Lee, D. Y., 1981. Treating marginal aggregates and soils with foamed asphalt. Proceedings of the 726
Association of Asphalt Paving Technologists 50, 211-250. 727
Lira, B., Jelagin, D., Birgisson, B., 2012. Gradation-based framework for asphalt mixture. Journal of 728
Materials and Structures. 729
Muthen, K. M., 1998. Foamed asphalt mixes- Mix design procedure. SABITA Ltd & CSIR Transportek, 730
Pretoria. 731
Namutebi, M., Birgisson, B., Bagampadde, U., 2011. Foaming effects on binder chemistry and 732
aggregate coatability using foamed bitumen. International Journal of Road Materials and Pavement 733
Design 12 (4), 821-847. 734
Plancher, H., Dorrene, S. M., Petersen, J. C., 1977. Identification of chemical types strongly absorbed 735
at the asphalt-aggregate interface and their displacement by water. Proceedings of the Association 736
of Asphalt Paving technologists 46, 151-175. Association of Apshalt Paving Technologists, Seattle. 737
Roque, R., Birgisson, B., Kim, S., Guarin, A., 2006. Development of mix design guidelines for improved 738
performance of asphalt mixtures. Florida Department of Transportation, Final Report, UF Project 739
No. 49104554032-12. 740
Sakr H. A., Manke G.P., 1985. Innovations in Oklahoma foamix design procedures. Transportation 741
Research Record 1034, 26-34. 742
Saleh, M. F., 2004. New Zealand experience with foam bitumen stabilization. Journal of the 743
Transportation Research Record Board 1868, 40-49. 744

34
Sunarjono, M. T., 2008. Influence of foamed bitumen characteristics on cold mix asphalt properties (PhD 745
Thesis). University of Nottingham, Nottingham. 746
Taylor, S. W., Milly, P. C. D., Jaffe, P. R., 1990. Biofilm growth and the related changes in the physical 747
properties of a porous medium. 2. Permeability. Journal of Water Resources Research 26 (9), 748
2161-2169. 749
Wirtgen, 2012. Wirtgen Cold Recycling Technology. Wirtgen GmbH, Windhagen. 750
Yideti, T. F., Birgisson, B., Jelagin, D., Guarin, A., 2013. Packing theory-based framework to evaluate 751
permanent deformation of unbound granular materials. International Journal of Pavement 752
Engineering 14 (3), 309-320. 753
Yu, Y., Rowe, R. K., 2012. Improved solutions for porosity and specific surface of a uniform porous 754
medium with attached film. Journal of Environmental Engineering 138 (4), 436-445. 755
756
757
758
759


1
A review of some aspects for foamed bitumen technology
by
May Namutebi1*, Björn Birgisson1, Umaru Bagampadde2 and Alvaro Guarin1
1Division of Highway and Railway Engineering, KTH- Royal Institute of Technology,
Brinellvägen 23, SE 100 44, Sweden. [email protected], [email protected], [email protected]. 2Department of Civil and Environmental Engineering, School of
Engineering, Makerere University, Kampala, Uganda. [email protected]. *Corresponding author
Abstract Increasing global population, depletion of good quality aggregates, and environmental challenges, are exerting pressure on the road industry to construct pavements in a sustainable way. Technologies such as foamed bitumen are increasingly being considered as alternatives that could aid in averting some of the above challenges. In this paper, some aspects of foamed bitumen technology namely: ageing susceptibility of foamed bitumen during the production process; optimisation of foamed bitumen conditions and characteristics; evaluation of aggregate particle coating within foamed bitumen mixes; and laboratory compaction of foamed bitumen mixes are discussed in order to provide insights into this technology. Based on results from previous studies; it appears that binder ageing does not occur during the foam production process. Producing foamed bitumen at bitumen temperatures near to or at the equi-viscous temperature seems to lead to the production of foamed bitumen with acceptable characteristics. Finer aggregate particles (less than 2.36 mm sieve size) are better coated with foamed bitumen, while the coarser aggregate particles are hardly coated. Temperature seems to be the main factor that influences binder coating with coarser aggregate particles; while for finer aggregate particles, surface area appears to be a major factor. Laboratory compaction of foamed bitumen mixes at the modified locking point seems to better simulate the state of maximum aggregate particle interlock. This modified locking point presents a suitable point at which laboratory compaction of foamed bitumen mixes can be undertaken. The modified locking point is based on the rate of change of slope for a compaction curve. KEYWORDS: Foamed bitumen; Ageing; Foamed bitumen characteristics; Aggregate coating; Foamed bitumen mixes; Compaction 1
1 May Namutebi, Dept. Of Civil and Environmental Engineering, Makerere University, P. O. Box 7062, Kampala, Uganda

2
1.0. Introduction The use of foamed bitumen in road construction materials can be traced back to the late 1950s when Csanyi first applied it to soil stabilisation. Foamed bitumen used was produced with steam and hot penetration grade bitumen [1, 2, and 3]. In the late 1960s, Mobil Oil of Australia acquired the patent for foamed bitumen technology and modified the process of foamed bitumen production by using cold water instead of steam to produce foamed bitumen. Later, an expansion chamber and a system of nozzles where foamed bitumen was produced and dispersed were developed [4, 5]. When the patent rights by Mobil Oil expired in the early 1990s, other companies such as Wirtgen, and Sorter started manufacturing new equipment, this enabled various researchers and contractors to gain access to the foamed bitumen technology. Generally during the last 20 years, foamed bitumen technology has been put to various applications in the road industry. Foamed bitumen consists of penetration grade bitumen that has been heated to high temperatures, (typically between 150°C and 180°C), small quantities of water (2-3% by weight of the bitumen) and air [2, 6, and 7]. Figure 1 illustrates the process of foamed bitumen production. The foaming process reduces bitumen viscosity and increases its surface area making it well suited for mixing with pre-wetted aggregates. In contact with pre-wetted aggregates, foamed bitumen combines with fines (particles whose size is less than 2 mm) resulting in formation of bitumen mortar that binds the coarser aggregate particles into a composite mass; this mechanism implies that aggregates to be treated with foamed bitumen must contain adequate fines. Foamed bitumen is used to stabilise a wide range of aggregates ranging from high-quality to marginal or even poor aggregates. In addition, soils (such as heavy clayey, sandy or granular soils) and recycled aggregates (aggregates that have been used in any pavement layer before) have been successfully treated with foamed bitumen [1, 2, 4, 5, 8, and 9].
Figure 1. A schematic showing production of foamed bitumen (Sunarjono, 2008) Foamed bitumen offers various advantages such as improving strength and durability of mixtures, reduction in binder requirements, can be used with a wide range of aggregates, reduction in binder and transportation costs, energy savings during mix production, environmental friendliness as no volatiles are released in the air, improved workability, propensity of using labour intensive methods, among others [10, 11, and 12]. However, despite foamed bitumen being widely used since its inception in the 1950s and exhibiting

3
various benefits; several of its aspects are still not well understood. Some of the relevant aspects are discussed in this paper. 1.1. Binder ageing During the production process of foamed bitumen, agents that promote binder ageing such as oxygen are present within the air and water injected into the hot binder, thus there is a possibility that the binder may be exposed to ageing. Binder ageing may alter its chemical composition and thus its properties. Hardly any studies have been done to investigate the ageing susceptibility of the binder during the foam production process. Also, within foamed bitumen mixes the binder is not uniformly distributed as in the case of hot asphalt mixes. The binder appears to be scattered within foamed bitumen mixes; this way of binder distribution makes foamed bitumen mixes susceptible to ageing. Also, foamed bitumen mixes have typically exhibited high air voids content. For example, Lee [4] has observed air voids content varying from 7.5% to 32.3%. These high voids render these mixes highly susceptible to binder ageing. Further, Sunarjono [13] observed that there was an increase in complex modulus for binder extracted from foamed bitumen mix specimens in compared to that of the neat binder. Such increase in complex modulus was attributed to ageing of the binder within foamed bitumen mix specimens. 1.2. Foamed bitumen conditions and characteristics Foamed bitumen can be produced under different conditions of bitumen temperature and quantities of foamant water. The bitumen temperature provides the heat energy required to convert water into steam, as steam is needed in foamed bitumen formation. Parameters for foamed bitumen characterisation include: maximum expansion ratio (ERm), half-life (HL), foam index, minimum viscosity, and coefficient of foamability [7, 14, 15, and 16]. The maximum expansion ratio is the proportion of maximum volume of bitumen in the foamed state to original bitumen volume. Whilst half-life is the time taken for foamed bitumen to reduce to half its maximum volume [7, 16]. The maximum expansion ratio is a measure of foam viscosity whilst the half life is an indicator of the mixing period of foamed bitumen with pre-wetted aggregates. The foam index is a parameter that combines the maximum expansion ratio and half-life parameters; it is defined as the area under the curve of expansion ratio against time [7]. It is indicative of the energy stored in any given foam and is expressed in seconds. The minimum viscosity corresponds to the average viscosity of the foam within the first 60 seconds of its production [15]. The coefficient of foamability is defined as the ratio of maximum expansion at a given bitumen temperature to the optimum foamant water content at that temperature, it is expressed in units of one per percent [14]. Lesueur et al. [14] proposed this coefficient as a possible characterisation parameter for foamed bitumen; however hardly any researchers have attempted to use this coefficient. The maximum expansion ratio and half-life are parameters typically used to characterise foamed bitumen. Varying conditions of bitumen temperature and foamant water contents will produce foamed bitumen with different characteristics (maximum expansion ratio and half-life). Thus a set of conditions that would give foamed bitumen with the best characteristics are desired for use in production of foamed bitumen mixes. Studies have shown that the maximum expansion ratio increases with increasing bitumen temperature and foamant water content. On the other hand, half-life decreases with increasing bitumen temperature and foamant water content. Figure 2

4
shows the variation of maximum expansion ratio and half-life with foamant water content at a certain bitumen temperature.
Figure 2. Variation of maximum expansion ratio and half-life versus foamant water content The maximum expansion ratio (ERm) and half-life (HL) vary differently with foamant water contents and bitumen temperature, thus need arises to determine the optimum temperature and foamant water content that would give the best foamed bitumen characteristics. Various approaches have been used to establish the optimum foamed bitumen characteristics, these include the following: 1.2.1. Wirtgen This involves determination of the average foamant water contents at which the minimum expansion ratio and half life occur; this average foamant water content is considered as the optimum foamant water content [12], see Figure 3. This approach is relatively easy to use but it lacks more robust or rational basis; moreover it does not evaluate bitumen temperature optimisation.
Figure 3. Wirtgen approach to determine optimum foamant water content
Minimum HL > 8 s Minimum ER > 8
Optimum foamant water content

5
1.2.2. Foam index This involves plotting the foam index against the foamant water content. The foamant water content at which the maximum foam index occurs is taken as the optimum (Figure 4). The foam index is calculated as a function of maximum expansion ratio and half-life. Attempts to apply the foam index to characterise foamed bitumen by some researchers such as Saleh [15] and Sunarjono [13] have not yielded any optimum point for foamant water content or bitumen temperature. Figure 5 shows the variation of foam index with foamant water content and bitumen temperature for one of the bitumens analysed by Namutebi [17]. From Figure 5 it is apparent that no optimum point for bitumen temperature or foamant water content could be deduced.
Figure 4. Foam index versus foamant water content [7]
Figure 5. Variation of Foam index with foamant water content and bitumen temperature [17]
Optimum foamant water content

6
1.2.3. Minimum viscosity The foamant water content at which the lowest value of minimum viscosity occurs is considered as the optimum foamant water content, (Figure 6). However, measuring foam viscosity by direct equipment insertion may lead to foam distortion and unreliable results.
Figure 6. Minimum viscosity versus Foamant water content [15] The above discussed approaches seem to be inadequate in optimising the foamed bitumen conditions (bitumen temperature and foamant water content) and characteristics (maximum expansion ratio and half-life). Researchers such as Sunarjono [13] have concluded that choosing foamed bitumen characteristics was still a challenging task. This presents a need to determine a rational method that could be used to deduce the optimum foamed bitumen conditions and characteristics. This is addressed further in section 2.0. 1.3. Effects of foamed bitumen characteristics on mix properties Few studies have been done to investigate the effects of foamed bitumen characteristics on the resulting mixes. Bowering and Martin [5] observed that when the ERm was varied from 3 to 15 the cohesion and compressive strength for a sand loam material increased by 39% and 26% respectively. Studies by Bissada [18] on sands treated with foamed bitumen revealed that sands treated with the bitumen that exhibited the highest ERm and half-life yielded higher stability values compared to those with bitumens with lower ERm and half-lives. Also, Sunarjono [13] evaluated the effects of different values of expansion ratio and half-life on mixes of foamed bitumen and limestone aggregates, results from this study revealed that indirect tensile stiffness modulus (ITSM) for mixes produced at different bitumen temperatures at a given foamant water content were similar. However, indirect tensile stiffness modulus values increased to a maximum value with increasing foamant water contents and then decreased for a given bitumen temperature. On the other hand, permanent deformation measured in terms of axial strain using the repeated load axial test (RLAT) was not influenced by foamed bitumen characteristics but probably by the aggregate skeleton and binder type. Based on these results, Sunarjono [13] recommended minimum values for the expansion ratio, bitumen temperatures, and maximum foamant water contents for use with three bitumen types. However, these limits were developed based on one aggregate type (crushed limestone) and three bitumen types from one source only. However, Lee [4]
Optimum foamant water content

7
observed that ERm and half-life had no effect on foamed bitumen mix properties. From these studies, the effects of foamed bitumen characteristics on mix properties seem not to be clear and this is an area that requires further research. 1.4. Preferential coating of fines Studies have revealed that within foamed bitumen treated materials, the binder is mainly concentrated within the fine aggregate fraction. Some aggregate particles are partially coated with the binder while others are not; especially the large particles [4, 5, 7, 13, 18, 19, 20, and 21]. Electron microscope observations on the structure of foamed bitumen mixes by Jenkins [7] revealed that foamed bitumen first coated the filler portion (less than 0.063 mm or 0.075 mm) of the aggregate forming a mastic (mixture of bitumen and filler). This mastic then combined with the sand fraction (2-0.063 mm fraction) forming a mortar, which then acted as a binder between larger particles within the mix. The higher affinity for foamed bitumen exhibited by the fines may be attributed to the higher surface area of the fines and higher affinity for moisture than the coarser particles; these factors make it conducive for the foamed bitumen to combine with the fines. However, the extent of fine aggregate particle size ranges coated by foamed bitumen is not clear. Also, there is lack of information on other factors that may influence aggregate particle coating within foamed bitumen mixes such as aggregate particle texture and mineralogy. 1.5. Laboratory compaction of foamed bitumen mixes Compaction is one of the major steps involved in the production of foamed bitumen mixes either in the laboratory or field. Various laboratory compaction methods such as Hveem kneading compactor, Marshall hammer, gyratory compactor, Hugo hammer, Kango hammer, vibratory hammer have been used for foamed bitumen mixes [4, 5, 16, 22, 23, and 24]. However, the gyratory compaction method has been recommended as it best simulates the roller action of impact and shearing loading in the field. However, it is still not clear how the number of gyrations at which to compact a mix can be determined as well as the moisture content during compaction. Jenkins [7] and Sunarjono [13] recommended gyratory compaction at the number of gyrations that yielded the aggregate maximum dry density as determined from the Proctor method of compaction. However, gyratory and Proctor compaction methods are different and certainly the densities achieved in either method of compaction may not be equal. The Proctor method involves application of an impact load repeatedly using a hammer falling through a specified height. Whilst, in the gyratory method, an impact load and shearing through a kneading action are applied to the material at the same time, this induces horizontal shearing stresses within the material being compacted. In this paper, some aspects of the foamed bitumen technology such as analysis of binder ageing susceptibility during the foam production process, optimisation of foamed bitumen conditions and characteristics, evaluation of aggregate particle coating within foamed bitumen treated materials and a laboratory compaction procedure based on attaining maximum aggregate particle interlock are discussed further. 2.0 Effects of foam production process on binder composition Studies by the authors on the composition of binder after the foam production process using Fourier transform infrared spectrometry techniques revealed that there were no significant differences in peak areas for the spectra for both foamed bitumen and neat bitumen, Figure 7.

8
Similarly, Sunarjono [13] analysed the penetration of both foamed bitumen and neat bitumen; he observed that there was no significant difference in penetration for both materials. These results reveal that despite the presence of agents that promote bitumen ageing (air, water) during the production of foamed bitumen, binder ageing does not seem to occur during foamed bitumen production process. The lack of binder ageing may be explained by short time period the hot bitumen is exposed to water and air in the expansion chamber of the foam plant equipment. Normally in the laboratory during foamed bitumen characterisation 500 g of hot bitumen is sprayed into the expansion chamber, with binder flow rates of 100 g/sec on average, this gives a time period of 5 seconds which may be short to induce any ageing within the binder. Moreover, experience has shown that the binder flow rate within the foam plant barely exceeds 100 g/sec, this may reduce further the time the binder is exposed to ageing agents within the expansion chamber of the foam plant. Twagira and Jenkins [25] evaluated age hardening behaviour of bitumen stabilized materials (this included foamed bitumen mixes); they concluded that the foamed bitumen production process does not lead to significant change in bitumen physical properties (penetration, softening point and viscosity at 60°C), provided that the bitumen between temperatures of 170°C and 180°C was not circulated for more than eight hours in the foam plant. These results imply that bitumen at temperatures below 170°C may not be susceptible to ageing. Further, these results obtained can be explained by the fact that the binder is probably exposed to ageing agents for a short time period. These results may act as a guide when using foamed bitumen in the actual road construction.
Figure 7. Infrared spectra for binder, B3 However, within the foamed bitumen mixes, the air voids are high and not all aggregate particles are coated with the binder these make the binder susceptible to ageing. Thus, there is need to investigate the extent of binder ageing within foamed bitumen mixes and the resulting effects of this ageing on mix performance.

9
3.0. Optimisation of foamed bitumen conditions and characteristics Studies of foamed bitumen characteristics have shown that as binder temperature increases, the maximum expansion ratio (ERm) increases while half-life (HL) decreases with increasing foamant water content (FWCs) [7, 13, and 22], see Figures 8, 11 and 12. This kind of trend presents a challenge in choosing an optimum binder temperature and foamant water content. Namutebi et al. [26] observed a unique trend for a hard bitumen grade (50/70), in their study the ERm at bitumen temperatures between 150 and 170°C increased to a maximum value and decreased with increasing foamant water content (Figure 8). The HL values showed a reverse trend, they decreased to a minimum and increased at higher foamant water contents (at bitumen temperatures between 150 and 170°C). While at 180°C bitumen temperature, the HL values reduced with increasing FWCs (Figure 8).
Figure 8. ERm and half-life versus foamant water contents at different temperatures for a 50/70 grade [26] This behaviour could be attributed to binder viscosity as well as lack of enough thermal energy to convert all water into steam. Furthermore, the binder viscosity rather than bitumen source seemed to greatly influence the foamed bitumen characteristics. It was found that the optimum foamant water content increased with increasing bitumen temperature (or reduced bitumen viscosity). Although at higher temperatures (180°C) where the viscosity was lowest there was no observed limit on ERm. At this temperature, the ERm increased with increasing FWCs, (Figure 8). These results seem to suggest that there is probably a viscosity related limit on the ERm at a given temperature. The increase in HL values could be explained by the presence of fewer bubbles interacting as a result of reduced ERm values. 3.1. Equi-viscous approach Therefore, determining foamed bitumen characteristics at or near the equi-viscous temperature could possibly lead to obtaining foam with optimum characteristics. The equi-viscous temperature range is where the bitumens exhibit the same viscosity and it is within a range of 0.15-0.19 Pa.s [27], Figure 9. After identification of this temperature, then the


11
Figure 11. ERm and half-life versus foamant water contents at different temperatures for a 70/100 grade [13]
Figure 12. ERm and half-life versus foamant water contents at different temperatures for a 50/70 grade [13]
Figure 13. Bitumen viscosity at different temperatures


13
4.0. Evaluation of aggregate particle coating Adequate binder coating of the aggregate particles within foamed bitumen treated material or foamed bitumen mix would improve the strength such as flexibility, fatigue resistance and durability (moisture and permanent deformation resistance) of the material or mix. Low binder coating onto the aggregate particles may compromise strength and durability of any given foamed bitumen mix. As mentioned before, various studies have shown that within foamed bitumen mixes, the binder is mainly concentrated within the fine fraction and the larger particles may or may not be coated with the binder. The authors have evaluated different foamed bitumen mixes made with different size aggregate fractions using Rice density and theoretical film thickness concepts, they observed that when the coarse aggregate fraction was heated and mixed with hot bitumen, the Rice density reduced by 10% compared to when the coarse fraction was mixed with foamed bitumen produced from the same bitumen (foamed bitumen mixes with the different aggregate fractions were produced (mixed) at room temperature). This difference in Rice density could be attributed to the increased temperature; thus for the coarse aggregate fraction, temperature seemed to be a major factor in promoting binder coating. Comparisons of the theoretical binder film thickness for the coarser aggregate fraction (16 mm-2.36 mm) in hot mixes and foamed bitumen mixes showed that the coarse aggregate binder film thickness in hot mixes was twice that achieved in foamed bitumen mixes for the same fraction (Table 2). However for the fine aggregate fractions, aggregate temperature seemed not to be a major factor. The theoretical binder film thickness was computed as a function of binder effective volume, aggregate surface area and weight [28]. The binder film thicknesses achieved by the fine (2.36 mm-0 mm) and filler (less 0.063 mm) aggregate fractions in both foamed bitumen mixes and hot mixes were similar; no significant difference at 5% level that was observed in binder film thickness for these fractions (Table 2). Table 2. Theoretical binder film thicknesses for aggregate fractions
Binder Theoretical binder film thickness (��m) Aggregate fraction and size
Coarse (16-2.36 mm)
Sand (2.36-0.063mm)
Filler (less than 0.063 mm)
Whole (coarse + sand
+ filler) FB1 FB2 FB3
Hot mix
35.97 31.32 36.89 75.07
5.91 5.73 5.96 6.66
2.94 2.95 2.89 2.94
9.42 9.08
10.36 10.63
Source: Namutebi et al. [26] On the other hand, when various aggregate particle sizes were included in the mix, the binder seemed to be well distributed. Rice densities of the filler, fine and whole aggregate fractions (with various aggregate particle sizes) exhibited no significant variation from each other. Therefore, even if the aggregate filler and fine fractions seem to have a higher affinity for foamed bitumen than the coarser fractions, still other aggregate particle sizes are still required. Moreover, since foamed bitumen combines with the fine particles, this mechanism of binder distribution imparts two load carrying components in a foamed bitumen mix: Applied loads

14
maybe supported partly by bitumen mortar and partly by friction resulting from aggregate particle interlock. Fu et al. [21] estimated the contribution made by the mastic (bitumen and filler mixture) to the indirect tensile strength (ITS) of foamed bitumen mixes using fracture face image analysis for specimens tested for ITS; their results showed that the ITS for mastic phase was five times that for mineral filler without bitumen for specimens tested in a dry condition. Whilst for specimens tested in the wet condition, the ITS for the mastic phase was 14 times that for mineral filler without bitumen. Also, the mineral filler phase lost 81% of its ITS in wet condition compared to 45% lost by the mastic. These results, illustrate the importance of having enough filler within the aggregate prior to treatment with foamed bitumen. They also revealed that the filler fraction exhibits a higher affinity for foamed bitumen than the rest of the aggregate particles. In addition, Sakr and Manke [29] showed that the stability of foamed bitumen mixes was greatly influenced by the aggregate particle interlock than bitumen viscosity, indicating that applied loads may also be partially supported by aggregate particle interlock. Namutebi et al.’s study [26] assessed aggregate coating in terms of the theoretical binder film thickness; and this thickness is a function of the effective binder volume, aggregate surface area and weight [28]. It assumes that aggregate particles are coated with a uniform thickness and does not take into account the effects of compaction, aggregate shape and texture on the resulting film thickness and yet these factors may affect the final binder thickness onto the aggregate particles. Despite these short comings, the theoretical binder film thickness provides an estimation of the binder coating onto the aggregate particles. Other factors such as the maximum expansion ratio and binder viscosity have also influenced the theoretical binder film thickness. Foamed bitumen with higher maximum expansion ratio values and lower viscosity yielded thicker films onto the aggregate fractions compared to those with low values of maximum expansion ratio and high binder viscosity [17]. Moreover, it has been observed that binder viscosity rather than the source mainly influence the foamed bitumen characteristics. Since the process of foamed bitumen production seems to be mainly a physical process; influenced by aspects such as exchange of thermal energy, surface tension and drainage forces, then the resulting properties defined in terms of maximum expansion ratio and half-life parameters will also be mainly influenced by these physical aspects rather than by say binder composition. 5.0. Methods of laboratory compaction Laboratory compaction of materials that will be used in any pavement layer should simulate the real compaction of such material in the field. The mechanical means as well as moisture conditions within the material to be compacted are very important factors that will ensure that the material is compacted properly. Various laboratory compaction methods such as Hveem kneading compactor, Marshall hammer, Proctor hammer, Hugo hammer, Kango hammer, vibratory hammer and gyratory compactor have been used in compaction of foamed bitumen mixes throughout the years [4, 5, 16, 22, 23, and 24]. Gyratory compaction has been recommended for the laboratory compaction of foamed bitumen mixes as it best simulates the roller action in the field. However, there is no clear procedure to determine the number of gyrations and the moisture requirements for compaction of foamed bitumen mixes. Researchers such as Maccarrone et al. [23] recommended compacting at 150 gyrations whilst Sunarjono [13] and Jenkins [7] suggested compacting at number of gyrations that gave the aggregate maximum dry density as determined from the Proctor compaction (compaction by impact) method. It should be noted that equating densities from these two methods may not be

15
appropriate as both methods are different in their operation. Therefore, there is need to devise a rational method of determining the required number of gyrations and optimum moisture contents for compaction of foamed bitumen mixes. 5.1. Locking point Compaction of pavement materials in the field is carried out until the point of maximum aggregate resistance or to when maximum aggregate particle interlocking occurs. If compaction in the field is continued after the interlocking condition, aggregate particles may start to break apart. Identifying this condition in the laboratory would lead to compaction of specimens to a state that can simulate the actual compaction in the field. Namutebi et al. [30] evaluated the locking point concept in compaction of laterite gravels treated with foamed bitumen and showed that the concept as defined by Vavrik and Carpenter [31] gave a wide range of values as the number of gyrations at which to compact a mix (Table 3). Vavrik and Carpenter [31] defined the locking point as the first three gyrations at the same height preceded by two gyrations at the same height. A modified locking concept is proposed, it is defined as the point at which first two gyrations at the same rate of change of slope are preceded by two gyrations at the same rate of change of slope. The rate of change of slope is defined for the compaction height versus the number of gyrations curve. The modified locking concept involves: fitting the compaction curve (defined by height versus number of gyrations) obtained from gyratory compaction of a given mixture with a logarithmic relation; this is then followed by the computation of the rate of change of slope for compaction curve. The rate of change of slope is defined as the second derivative of the curve. The modified locking point is then identified as the first point at which two gyrations at the same grade of change of slope are preceded by two gyrations at the same rate of change of slope. Results for modified locking point for foamed bitumen-laterite gravel mixes are also shown in Tables 3 and 4. These results illustrate that the modified locking point yields a definite number of gyrations unlike the original locking point defined by Vavrik and Carpenter [31]. Table 3. Number of gyrations defining locking point
Laterite gravel Locking point* (number of gyrations)
Modified locking point (number of gyrations)
L1
L2
L3
14, 18, 20–21, 24, 26–35, 38, 40–73, 78–79, 80–200
11, 15, 17–19, 22, 24–29, 30–37,
40, 42–49, 50–59, 60–91, 94–200
11, 13, 16, 18–26, 29, 31–39,
40–73, 76, 78–200
45
46
40
Source: Namutebi et al. [30] *: as defined by Vavrik and Carpenter [31]

16
According to the gradation based framework for a given asphalt mix and unbound granular material recently developed at The Royal Institute of Technology (KTH), Sweden; the aggregate within a given asphalt mix or unbound material can be divided into: oversize, primary, secondary and filler structures [32, 33, and 34]. The primary structure supports the loads applied to the mix whilst the secondary structure fills the voids between the primary structure aggregate particles as well as providing stability to the mix. The primary and secondary aggregate structures can be characterised with a porosity parameter, porosity being defined as the ratio of volume of voids to total volume. When the primary and secondary aggregate structure porosities for laterite gravel-foamed bitumen mixes (in Table 4) are computed and a plot of number of gyrations against aggregate structure porosity made (Figure 15), it is observed that the primary and secondary aggregate structure porosities decreased as the number of gyrations increased. After the modified locking point these porosities tended to a constant value (Figure 15). The red coloured lines in Figure 15 show the modified locking points for the different mixtures. Porosities tending to a constant value after the modified locking point illustrate the condition of maximum aggregate particle interlock. Table 4. Modified locking point based on rate of change of slope
Gyrations Mixes of laterite gravels and foamed bitumen L1 L2 L3
36 37 38 39 40 41 42 43 44 45 46 47 48 49
0.0018 0.0017 0.0016 0.0015 0.0015 0.0014 0.0013 0.0013 0.0012
0.0012 (MLP) 0.0011 0.0011 0.0010 0.0010
0.0014 0.0014 0.0013 0.0012 0.0012 0.0011 0.0010 0.0010 0.0010 0.0009
0.0009 (MLP) 0.0008 0.0008 0.0008
0.0012 0.0011 0.0011 0.0010
0.0010 (MLP) 0.0009 0.0009 0.0008 0.0008 0.0008 0.0007 0.0007 0.0007 0.0007
Source: Namutebi et al. [30]
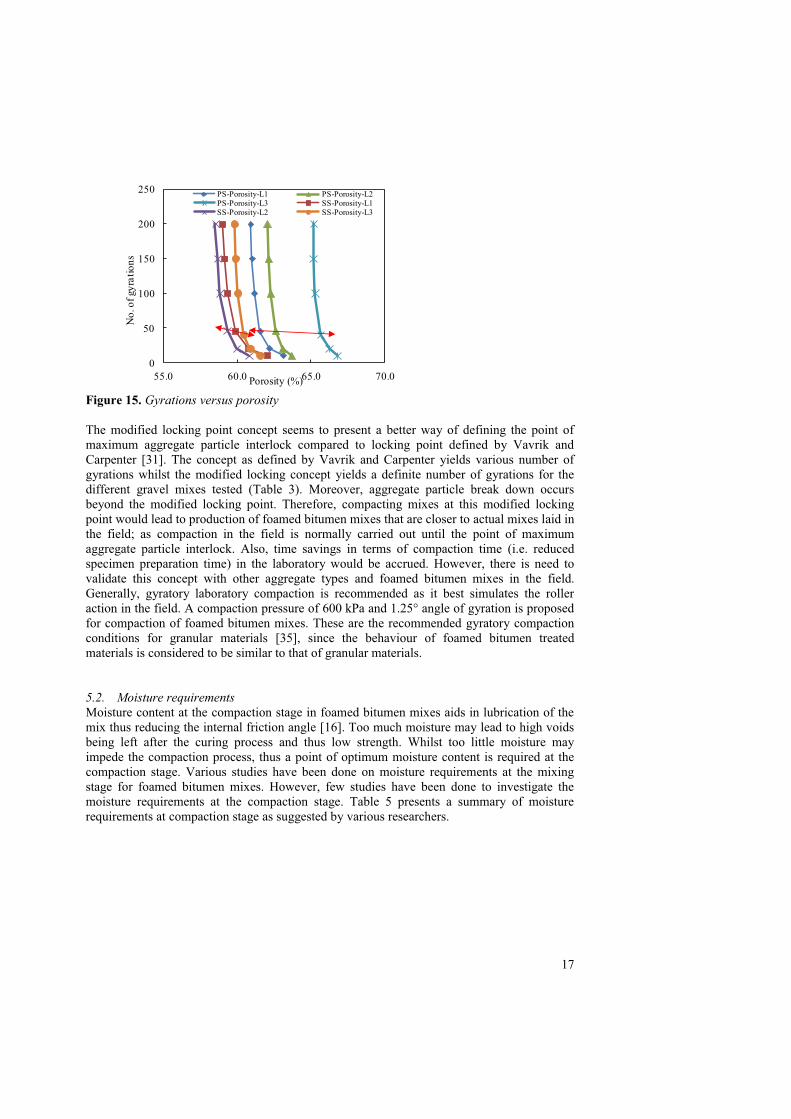
17
0
50
100
150
200
250
55.0 60.0 65.0 70.0
No.
of g
yrat
ions
Porosity (%)
PS-Porosity-L1 PS-Porosity-L2PS-Porosity-L3 SS-Porosity-L1SS-Porosity-L2 SS-Porosity-L3
Figure 15. Gyrations versus porosity The modified locking point concept seems to present a better way of defining the point of maximum aggregate particle interlock compared to locking point defined by Vavrik and Carpenter [31]. The concept as defined by Vavrik and Carpenter yields various number of gyrations whilst the modified locking concept yields a definite number of gyrations for the different gravel mixes tested (Table 3). Moreover, aggregate particle break down occurs beyond the modified locking point. Therefore, compacting mixes at this modified locking point would lead to production of foamed bitumen mixes that are closer to actual mixes laid in the field; as compaction in the field is normally carried out until the point of maximum aggregate particle interlock. Also, time savings in terms of compaction time (i.e. reduced specimen preparation time) in the laboratory would be accrued. However, there is need to validate this concept with other aggregate types and foamed bitumen mixes in the field. Generally, gyratory laboratory compaction is recommended as it best simulates the roller action in the field. A compaction pressure of 600 kPa and 1.25° angle of gyration is proposed for compaction of foamed bitumen mixes. These are the recommended gyratory compaction conditions for granular materials [35], since the behaviour of foamed bitumen treated materials is considered to be similar to that of granular materials. 5.2. Moisture requirements Moisture content at the compaction stage in foamed bitumen mixes aids in lubrication of the mix thus reducing the internal friction angle [16]. Too much moisture may lead to high voids being left after the curing process and thus low strength. Whilst too little moisture may impede the compaction process, thus a point of optimum moisture content is required at the compaction stage. Various studies have been done on moisture requirements at the mixing stage for foamed bitumen mixes. However, few studies have been done to investigate the moisture requirements at the compaction stage. Table 5 presents a summary of moisture requirements at compaction stage as suggested by various researchers.

18
Table 5. Moisture content at compaction as suggested by various researchers
Researcher Optimum moisture content at compaction
Comment(s)
1. Asphalt Academy [16]
2. Castedo-Franco et al. [10], Wirtgen [12]
3. Jenkins [7]
4. Macarrone et al. [23]
5. Sakr and Manke [29]
Be determined in the laboratory using vibratory
hammer compaction
As given by the optimum moisture content (OMC) for
aggregates
Be determined from sensitivity analysis of
moisture content (at levels of OMC-2%, OMC, OMC+2%) with dry density. OMC is the optimum moisture content of
aggregates.
Be determined from sensitivity analysis of
moisture content with dry density and resilient
modulus.
Determined from the following equation:
8.92+1.48OMC + 0.40PF – 0.39BC. Where: OMC is
aggregate optimum moisture content (%), PF is percentage passing No. 200 sieve, BC is
bitumen content (%)
Lubrication effects of the binder are ignored.
Equation had a coefficient of determination (R2) of 0.98
It was determined from foamed bitumen mixes made
from sands, it may not be extrapolated to other
aggregate types.
Some researchers in recommending compaction moisture content to be considered as the aggregate optimum moisture (OMC) have ignored the effects of the binder onto the compaction process. Namutebi et al. [30] from their work on compaction moisture at the modified locking point showed that the moisture was less than the OMC, and the compaction moisture content ranged from 85% to 92% of OMC for the different mixes. Analysis of dry densities for laterite gravel-foamed bitumen mixes at the OMC yielded lower densities than those below the OMC point. Since the optimum moisture content (OMC) for aggregates is determined from the routine tests; it is recommended that a sensitivity analysis for the compaction moisture content below the OMC point be done in order to establish the optimum moisture content at compaction.

19
6.0. Summary and Concluding remarks In this paper, some aspects of foamed bitumen technology such as assessment of binder ageing during the foamed bitumen production process is done; uncertainties involved in establishing foamed bitumen conditions and characteristics using various approaches are highlighted. Further, a more rational method is proposed to determine foamed bitumen characteristics and conditions. In addition, the inadequacies in determination of the optimum compaction characteristics of foamed bitumen mixes are also discussed. Compaction of foamed bitumen mixes at the locking point is proposed to address the inadequacies in the determination of compaction characteristics for foamed bitumen mixes. 6.1. Binder ageing during foam production There seems to be no binder ageing although ageing agents (air and water) are present during the foam production process. This observation seems to only be valid for bitumen temperatures that do not exceed 180°C and bitumen circulation time of less than eight hours within the foam plant. Thus in actual road construction care should be taken to ensure that the binder used to produce foamed bitumen is not heated to temperatures exceeding 180°C and circulated for not more than 8 hours within the plant in order to avoid binder ageing. However, within foamed bitumen mixes given the discontinuous distribution of the binder and high air voids, binder ageing is highly likely to occur within the mixes. Further research is required to investigate the extent of this ageing and its effects on mix performance. 6.2. Optimisation of foamed bitumen conditions and characteristics Foamed bitumen should be produced near or at the equi-viscous bitumen temperatures in order to obtain foamed bitumen with the optimum characteristics. The equi-viscous approach is recommended as a positive step in aiding of choosing the optimum foamed bitumen characteristics in a more rational way. Producing foamed bitumen at the equi-viscous temperature would lead to reduction resources such as materials and time. However, this approach needs to be validated with other bitumen types. 6.3. Evaluation of aggregate particle coating The fine aggregate fraction exhibits higher affinity for foamed bitumen in comparison to the coarse aggregate fraction. Temperature is the major factor that influences aggregate particle binder coating for the coarse aggregate fraction. Whilst for the fine aggregate fraction, the surface area seems to dominate binder coating of this fraction. Further, since the fine fraction of the aggregate seems to exhibit a high affinity for foamed bitumen, mixing could be done in two phases: The pre-wetted fine fraction at mixing moisture content could be added to the foamed bitumen first. After which, the coarse aggregate is added in a pre-wetted condition. Furthermore, the coarse aggregate could be heated to temperatures above 20oC but below 100oC prior to mixing it with the fine fraction-foamed bitumen mix. A temperature upper limit of 100oC is proposed to prevent conversion of the pre-wetting water into steam. A lower temperature of 20oC is proposed since normally foamed bitumen mixes in the laboratory are prepared at room temperature. However, further studies are required to determine the optimum temperature at which the coarse aggregates should be heated to. 6.4. Laboratory compaction Laboratory compaction of foamed bitumen mixes using a gyratory compactor should be carried out at the modified locking point, since application of this concept seems to yield

20
definite locking points unlike the locking point concept as defined by Vavrik and Carpenter (1998). It is suggested that compaction of foamed bitumen mixes using a gyratory compactor should be carried at a pressure of 600 kPa, angle of gyration of 1.25° and number of gyrations defining the modified locking point. However, further work is required to determine ranges of modified locking points which could act as guidelines for the compaction of foamed bitumen mixes. Also, the modified locking concept needs to be verified with different aggregate types and with actual foamed bitumen mixes in the field. In addition, the moisture requirements at the compaction stage should be considered at some points below the optimum moisture content for the aggregates. A sensitivity analysis using say three points with moisture content below the OMC for aggregates should be done in order to determine the optimum moisture at compaction. However, there is need to determine the ranges of compaction moisture contents as in the case of mixing moisture requirements were guide ranges exist already. These guidelines would aid in providing starting values for compaction of foamed bitumen mixes. Acknowledgments The financial assistance by the Swedish International Development Agency and Makerere University is highly appreciated. References [1] L. H. Csanyi, Foamed asphalt, Tech. Bull. American Road Builders Association,
Washington, DC. No. 240 (1959). [2] L. H. Csanyi, Foamed asphalt in bituminous paving mixtures, Highw. Res. Board
Bull. National Research Council, Washington DC. 161 (1957) 108-122. [3] L. H. Csanyi, H. Fung, Mortar theory for use of Ungraded aggregates in bituminous
mixes. Highw. Res. Board Bull. No. 109 (1956). [4] D. Y. Lee, Treating marginal aggregates and soils with foamed asphalt, Proceedings of
the Association of Asphalt Paving Technologists. Volume 50 (1981) 211-250. [5] R. H. Bowering, C. L. Martin, Foamed Bitumen: Production and application of
mixtures. Evaluation and performance of pavements, Proceedings Association of Asphalt Paving Technologists. Volume 45 (1976) 453-473.
[6] H. Castedo, C. C. Beaudoin, L. E. Wood, A. G. Altschaeffl, Durability characteristics of foamed asphalt mixtures, Proceedings of the 29th Annual Canadian Technical Asphalt Association Conference, held in Montreal, Canada, (1984) 102-122.
[7] K. J. Jenkins, Mix design considerations for cold and half-warm bituminous mixes with emphasis on foamed bitumen, PhD dissertation, University of Stellenbosch, South Africa (2010).
[8] S. M. Acott, P. A. Myburgh, Design and performance study of sand bases treated with foamed asphalt, Transportation Research Record, Low-Volume Roads: Third International Conference, 1983. Transportation Research Board, National Research Council, Washington DC. 898 (1983) 290-296.
[9] G. Joubert, S. Poolman, P. J. Strauss, Foam bitumen stabilised sands as an alternative to gravel bases for low volume roads, Proceedings of 5th Conference on Asphalt Pavements for South Africa (CAPSA 89), Swaziland, 5-9 June, 1989. Section 8, (1989) 21-5.
[10] H. L. Castedo-Franco, L. E. Wood, Stabilization with foamed asphalt of aggregates

21
commonly used in low-volume roads, Transportation Research Record 898. Low-Volume Roads: Third International Conference, 1983. Transportation Research Board. National Research Council, Washington, D. C. 1983. (1983) 297-302.
[11] M. F. Saleh, Cost evaluation of foam bitumen and other stabilisation alternatives. J. Pavement Eng. Vol. 8, No. 2, (2007) 157-161.
[12] Wirtgen, Wirtgen Cold Recycling Technology. Wirtgen GmbH. (2012). [13] Sr,i Ir., M. T. Sunarjono, Influence of foamed bitumen characteristics on cold mix
asphalt properties, Thesis submitted to University of Nottingham for the degree of Doctor of Philosophy, (2008).
[14] D. Lesuer et al., Foamability and foam stability, J. Road and Pavement Des. Volume 5, No. 3 (2004) 277-302.
[15] M. F. Saleh, Characterisation of foam bitumen quality and the mechanical properties of foam stabilised mixes, 10th International Conference on Asphalt Pavements, Quebec, Canada. (2006).
[16] Asphalt Academy, Technical guideline: Bitumen stabilised materials. A guide for the design and construction of bitumen emulsion and foamed bitumen stabilised materials. TG2, Second edition. Asphalt Academy, Pretoria, (2009).
17] M. Namutebi, Some aspects of foamed bitumen technology. Licentiate thesis in Highway Engineering. TRITA-VBT 11:05, ISBN 978-91-7415-910-3, KTH, Stockholm. (2011).
[18] A. F. Bissada, Structural response of foamed-asphalt-sand mixtures in hot environments, Trans. Res. Rec. Transportation Research Board, National Research Council, Washington D.C. 1115 (1987) 134–149.
[19] F. Abel, Foamed asphalt base stabilization, Presented at 6th Asphalt Paving Seminar, Colorado State University, Fort Collins. (1978).
[20] P.J. Ruckel, L. L. Kole, L. Abel, R. E. Zator, J. W. Button, J. A. Epps, Asphalt pavement construction: New material and techniques. ASTM STP 724, West Conshohocken, Pa. (1982) 93-109
[21] P. Fu, J. T. Harvey, D. Jones, Y. Chao, Understanding internal structure characteristics of foamed asphalt mixes with fracture face image analyses. Trans. Res. Rec. 2057, (2008) 20-27.
[22] M. Brennen, M. Tia, A. Altschaeff, L. E. Wood, Laboratory investigation of the use of foamed asphalt for recycled bituminous pavements, Trans. Res. Rec., Transportation Research Record Board, National Research Council, Washington DC. 911 (1983) 80-87.
[23] S. Maccarrone, G. Holleran, D. J. Leonard, S. Hey, Pavement recycling using foamed bitumen, Proceedings of 17th ARRB Conference held in Gold Coast, Queensland, 15-19 August, 1994. Volume 17, Part 3 349-365.
[24] C. T. Weston, E. V. Amsterdam, K. J. Jenkins, A study into mechanical properties of foamed bitumen stabilised materials, Proceedings of 21st Annual South African Transport Conference, 15-19 July 2002.
[25] M. E. Twagira, K. J. Jenkins, Age hardening behaviour of bituminous stabilized materials, 7th International Rilem Symposium ATCBM09 on Advanced Testing and Characterization of Bituminous Materials, 2009, Rhodes Palace, Rhodes, Greece. 239-249.
[26] M. Namutebi, B. Birgisson, U. Bagampadde, Foaming Effects on binder chemistry and aggregate coatability using foamed bitumen, J. Road Mater. Pavement Des. Volume 12, Issue 4 (2011) 821-847.
[27] ASTM, Standard viscosity-temperature charts for asphalts, ASTM D2493. ASTM (1995)

22
[28] L. F. Roberts, P. S. Kandhal, E. R. Brown, D. Y. Lee, T. W. Kennedy, Hot mix asphalt materials, mixture design, and construction, Second edition. National Asphalt Pavement Association and Education Foundation. (1996) 187-188.
[29] H. A. Sakr, G. P. Manke, Innovations in Oklahoma foamix design procedures. Trans. Res. Rec. Transportation Research Board, Washington DC. 1034 (1985) 26-34.
[30] M. Namutebi, B. Birgisson, U. Bagampadde, (2013) Development of a gyratory compaction procedure for laterite gravels treated with foamed bitumen, J. Pavement Eng. Volume 14, No, 3. (2013) 256-264.
[31] W. R. Vavrik, S. H. Carpenter, Calculating air voids at specified number of gyrations in Superpave gyratory compactor, Trans. Res. Rec. 1630, National Research Council, Washington DC. 1630 (1998).
[32] B. Lira, D. Jelagin, B. Birgisson, Gradation-based framework for asphalt mixture, J. Mater. Struct. RILEM. DOI 10.1617/s11527-012-9982-3. (2012).
[33] T. F. Yideti, B. Birgisson, D. Jelagin, A. Guarin, Packing theory-based framework to evaluate permanent deformation of unbound granular materials, J. Pavement Eng. Volume 14, No. 3 (2013) 309-320.
[34] P. K. Das, N. Kringos, B. Birgisson, Towards a multi-scale framework to optimize ageing resistance of asphaltic materials, Proceedings of the International RILEM Symposium on Multi-scale modelling and characterization of Infrastructure materials, held in Stockholm, Sweden, 11th -13th June, 2013. RILEM. 285-295.
[35] M. J. Browne, Feasibility of using a gyratory compactor to determine compaction characteristics of soil. Master of Science Thesis submitted to University of Montana, USA. (2006).