Embed Size (px)
Citation preview

Survival for oesophageal, stomach and small intestine cancers inEurope 1999-2007: Results from EUROCARE-5
Anderson, L. A., Tavilla, A., Brenner, H., Luttmann, S., Navarro, C., Gavin, A. T., ... Sant, M. (2015). Survival foroesophageal, stomach and small intestine cancers in Europe 1999-2007: Results from EUROCARE-5.European Journal of Cancer, 51(15), 2144-2157. https://doi.org/10.1016/j.ejca.2015.07.026
Published in:European Journal of Cancer
Document Version:Peer reviewed version
Queen's University Belfast - Research Portal:Link to publication record in Queen's University Belfast Research Portal
Publisher rights© 2015 Elsevier Ltd. This manuscript version is made available under the CC-BY-NC-ND 4.0 license http://creativecommons.org/licenses/by-nc-nd/4.0/, which permits distribution and reproduction for non-commercial purposes, provided the author and source are cited.
General rightsCopyright for the publications made accessible via the Queen's University Belfast Research Portal is retained by the author(s) and / or othercopyright owners and it is a condition of accessing these publications that users recognise and abide by the legal requirements associatedwith these rights.
Take down policyThe Research Portal is Queen's institutional repository that provides access to Queen's research output. Every effort has been made toensure that content in the Research Portal does not infringe any person's rights, or applicable UK laws. If you discover content in theResearch Portal that you believe breaches copyright or violates any law, please contact [email protected].
Download date:16. Feb. 2019

Survival for oesophageal, stomach and small intestine cancers: results from
EUROCARE-5.
Key words: oesophageal, stomach, small intestine, survival, Europe
L. A. Andersona, A. Tavilla
b, H. Brenner
c,d, S. Luttmann
e, C. Navarro
f,g,h, A.T. Gavin
a,i.
B. Holleczekj, B.T. Johnston
k, M.B. Cook
l, F. Bannon
a, M. Sant
m and the EUROCARE-5
Working Group14
.
a Centre for Public Health, School of Medicine, Dentistry and Biomedical Science,
Queen’s University Belfast, Northern Ireland.
b National Center of Epidemiology, Italian National Institute of Health, Rome, Italy.
c Division of Clinical Epidemiology and Aging Research and Division of Preventive
Oncology, German Cancer Research Center (DKFZ), Heidelberg, Germany.
d German Cancer Consortium (DKTK), German Cancer Research Center (DKFZ),
Heidelberg, Germany.
e Bremen Cancer Registry, Leibniz-Institute for Prevention Research and Epidemiology –
BIPS, Bremen, Germany.
f Department of Epidemiology, Murcia Regional Health Council, IMIB-Arrixaca, Murcia,
Spain.
g CIBER Epidemiología y Salud Pública (CIBERESP), Spain.

h Department of Health and Social Sciences, Universidad de Murcia, Murcia, Spain.
i Northern Ireland Cancer Registry, Queen’s University Belfast, Northern Ireland.
jSaarland Cancer Registry, Präsident Baltz Straße 5, 66119 Saarbrücken, Germany.
k Belfast Health and Social Care Trust, Belfast, Northern Ireland.
l Division of Cancer Epidemiology and Genetics, National Cancer Institute, National
Institutes of Health, Maryland, USA.
m Analytical Epidemiology and Health Impact Unit. Department of Preventive and
Predictive Medicine, Fondazione IRCCS Istituto Nazionale dei TumoriVia Venezian 1,
20133, Milan, Italy.
14EUROCARE-5 Working Group: Austria: M. Hackl, N. Zielonke (Austrian CR); W. Oberaigner
(Tyrol CR); Belgium: E. Van Eycken, K. Henau (Belgian CR); Bulgaria: Z. Valerianova, N.
Dimitrova (Bulgarian CR); Croatia: M. Sekerija (Croatian CR); Czech Republic: M. Zvolský, L.
Dušek (Czech National CR); Denmark: H. Storm, G. Engholm (Danish Cancer Society); Estonia: M.
Mägi (Estonian CR); T. Aareleid (National Institute for Health Development, Tallinn); Finland: N.
Malila, K. Seppä (Finnish CR); France: M. Velten (Bas Rhin CR); X. Troussard (Basse
Normandie Haematological malignancies CR); V. Bouvier, G. Launoy (Calvados Digestive Tract
Registry); A. V. Guizard (Calvados, General CR); J. Faivre*, A. M. Bouvier (Côte d'Or Digestive
Tract Registry, Burgundy); P. Arveux (Côte d'Or Gynaecologic CR); M. Maynadié (Côte d'Or
Haematological Malignancies CR); A. S. Woronoff (Doubs CR); M. Robaszkiewicz (Finistère
Digestive Tract Registry); I. Baldi (Gironde CNS CR); A. Monnereau (Gironde Haematological
Malignancies CR); B. Tretarre (Hérault CR); N. Bossard* (Hospices Civils de Lyon); A. Belot
(Hospices Civils de Lyon, FRANCIM); M. Colonna* (Isère CR); F. Molinié (Loire-Atlantique CR); S.
Bara (Manche CR); C. Schvartz (Marne & Ardennes, Thyroid CR); B. Lapôtre-Ledoux (Somme CR);
P. Grosclaude (Tarn CR); Germany: M. Meyer (Bavaria CR); R. Stabenow (Berlin CR; Brandenburg
CR; Mecklenburg-West Pomerania CR; Saxony CR; Saxony-Anhalt CR; Thüringen CR); S. Luttmann,
A. Eberle (Bremen CR, Leibniz Institute for Prevention Research and Epidemiology); H. Brenner
(German Cancer Research Center); A. Nennecke (Hamburg CR); J. Engel, G. Schubert-Fritschle
(Munich CR); J. Kieschke (Niedersachsen CR); J. Heidrich (North Rhine-Westphalia CR); B.
Holleczek (Saarland CR); A. Katalinic* (Schleswig-Holstein CR); Iceland: J. G. Jónasson, L.
Tryggvadóttir (Icelandic CR); Ireland: H. Comber (National Cancer Registry Ireland); Italy: G.
Mazzoleni, A. Bulatko (Alto Adige CR); C. Buzzoni (Associazione Italiana Registri Tumore); A.
Giacomin (Biella CR); A. Sutera Sardo, P. Mancuso (Catanzaro CR); S. Ferretti (Ferrara CR); E.
Crocetti, A. Caldarella (Firenze-Prato CR); G. Gatta*, M. Sant*, H. Amash, C. Amati, P. Baili*, F.
Berrino*, S. Bonfarnuzzo, L. Botta, F. Di Salvo, R. Foschi, C. Margutti, E. Meneghini, P. Minicozzi,

A. Trama (Fondazione IRCCS Istituto Nazionale dei Tumori, Milan); D. Serraino, L. Dal Maso (Friuli
Venezia Giulia CR, CRO Aviano National Cancer Institute); R. De Angelis*, M. Caldora, R.
Capocaccia*, E. Carrani, S. Francisci*, S. Mallone, D. Pierannunzio, P. Roazzi, S. Rossi, M.
Santaquilani, A. Tavilla (Istituto Superiore di Sanità, Rome); F. Pannozzo, S. Busco (Latina CR); L.
Bonelli, M. Vercelli (Liguria CR, IRCCS AOU SM-IST); V. Gennaro (Liguria Mesothelioma CR); P.
Ricci (Mantova CR); M. Autelitano, G. Randi (Milano CR); M. Ponz De Leon (Modena colorettali
CR); C. Marchesi, C. Cirilli (Modena CR); M. Fusco, M. F. Vitale (Napoli 3 South CR); M. Usala
(Nuoro CR); A. Traina, R. Staiti (Palermo Breast CR); F. Vitale, B. Ravazzolo (Palermo CR); M.
Michiara (Parma CR); R. Tumino (Ragusa CR); P. Giorgi Rossi, E. Di Felice (Reggio Emilia CR); F.
Falcini (Romagna CR); A. Iannelli (Salerno CR); O. Sechi, R. Cesaraccio (Sassari CR); S. Piffer
(Servizio Epidemiologia Clinica e Valutativa, Trento); A. Madeddu, F. Tisano (Siracusa CR); S.
Maspero, A. C. Fanetti (Sondrio CR); R. Zanetti, S. Rosso (Torino CR); P. Candela, T. Scuderi
(Trapani CR); F. Stracci, F. Bianconi (Umbria CR); G. Tagliabue, P. Contiero (Varese Province CR,
Fondazione IRCCS Istituto Nazionale dei Tumori); A. P. Dei Tos, S. Guzzinati (Veneto CR); Latvia:
S. Pildava (Latvian CR); Lithuania: G. Smailyte (Lithuanian CR); Malta: N. Calleja, D. Agius
(Malta National Cancer Registry, Health Information and Research); Norway: T. B. Johannesen
(Norwegian CR); Poland: J. Rachtan (Cracow CR); S. Góźdź, R. Mężyk (Kielce CR); J. Błaszczyk,
M. Bębenek (Lower Silesia CR, Wroclaw); M. Bielska-Lasota* (National Institute of Public Health-
NIH, Warszawa); Portugal: G. Forjaz de Lacerda (Açores CR); M. J. Bento, C. Castro (Northern
Portugal CR); A. Miranda, A. Mayer-da-Silva (Southern Portugal CR); Romania: F. Nicula, D. Coza
(The Oncology Institute "I. Chiricuta", Cluj-Napoca); Slovakia: C. Safaei Diba (Slovakian National
CR); Slovenia: M. Primic-Zakelj* (Cancer Registry of Republic of Slovenia); Spain: E. Almar, C.
Ramírez (Albacete. Castilla-La Mancha CR); M. Errezola, J. Bidaurrazaga (Basque Country CR); A.
Torrella-Ramos (Castellón-Valencia CR, breast); J. M. Díaz García, R. Jimenez-Chillaron (Cuenca
CR); R. Marcos-Gragera*, A. Izquierdo Font (Girona CR); M. J. Sanchez, D. Y. L. Chang (Granada
CR, CIBERESP, ibs.Granada); C. Navarro, M. D. Chirlaque (Murcia CR, CIBERESP, IMIB-
Arrixaca); C. Moreno-Iribas, E. Ardanaz (Navarra CR, CIBERESP); J. Galceran, M. Carulla
(Tarragona CR); Sweden: M. Lambe* (Regionalt cancercentrum and Karolinska Institutet); S. Khan
(Swedish CR); Switzerland: M. Mousavi (Basel CR); C. Bouchardy, M. Usel (Geneva CR); S. M.
Ess, H. Frick (Grisons-Glarus CR); M. Lorez (NICER); S. M. Ess, C. Herrmann (St. Gallen CR); A.
Bordoni, A. Spitale (Ticino CR); I. Konzelmann (Valais CR); The Netherlands: O. Visser, R.
Verhoeven (The Netherlands CR); UK-England: M. Coleman*, C. Allemani, B. Rachet (London
School of Hygiene and Tropical Medicine); J. Verne*, N. Easey, G. Lawrence, T. Moran, J. Rashbass,
M. Roche, J. Wilkinson (Public Health England); UK-Northern Ireland: A. Gavin, C. Donnelly
(Northern Ireland CR); UK-Scotland: D. H. Brewster (Scottish CR); UK-Wales: D. W. Huws, C.
White (Welsh Cancer Intelligence and Surveillance Unit); R. Otter*.
*EUROCARE Steering Committee
Corresponding author details:
Dr Lesley Anderson
Centre for Public Health
Queen’s University Belfast

Institute for Clinical Sciences Block B
Grosvenor Road
Belfast
BT12 6BJ
Tel: ++44 (0)28 9063 2315
Fax: ++44 (0)28 9023 5900
E-mail: [email protected]
Acknowledgements: We thank Chiara Margutti, Simone Bonfarnuzzo and Camilla
Amati for secretarial assistance.
Role of funding source
The study was funded by the Compagnia di San Paolo, the Fondazione Cariplo Italy, the
Italian Ministry of Health (Ricerca Finalizzata 2009, RF-2009-1529710) and the European
Commission (European Action Against Cancer, EPAAC, Joint Action No20102202). The
Northern Ireland Cancer Registry is supported by the Public Health Agency for N. Ireland. Dr
Michael Cook is funded by US Federal Funds. The Compagnia di San Paolo, the Fondazione
Cariplo Italy, the Italian Ministry of Health (Ricerca Finalizzata 2009, RF-2009-1529710)
and the European Commission (European Action Against Cancer, EPAAC, Joint Action
No20102202). The funding sources had no role in study design, the collection, analysis or
interpretation of data, the writing of the report, or the decision to submit the article for
publication.

Abstract
Background
European regional variation in cancer survival was reported in the EUROCARE-4 study
for patients diagnosed in 1995-1999. Relative survival (RS) estimates are here updated
for patients diagnosed with cancer of the oesophagus, stomach, and small intestine from
2000 to 2007. Trends in RS from 1999-2001 to 2005-2007 are presented to monitor and
discuss improvements in patient survival in Europe.
Materials and Methods
EUROCARE-5 data from 29 countries (87 cancer registries) were used to investigate 1-
and 5-year RS. Using registry-specific life-tables stratified by age, gender, and calendar
year, age-standardised ‘complete analysis’ RS estimates by country and region were
calculated for Northern, Southern, Eastern and Central Europe, and for Ireland and United
Kingdom (UK). Survival trends of patients in periods 1999-2001, 2002-2004, and 2005-
2007 were investigated using the ‘period’ RS approach. We computed the 5-year RS
conditional on surviving the first year (5-year conditional survival), as the ratio of age-
standardised 5-year RS to 1-year RS.
Results
Oesophageal cancer 1- and 5-year RS (40% and 12%, respectively) remained poor in
Europe. Patient survival was worst in Eastern (8%), Northern (11%), and Southern
Europe (10%). Europe-wide, there was a 3% improvement in oesophageal cancer 5-year
survival by 2005-2007, with Ireland and the UK (3%), and Central Europe (4%) showing
large improvements.

Europe-wide, stomach cancer 5-year RS was 25%. Ireland and UK (17%) and Eastern
Europe (19%) had the poorest 5-year patient survival. Southern Europe had the best 5-
year survival (30%), though only showing an improvement of 2% by 2005-2007.
Small intestine cancer 5-year RS for Europe was 48%, with Central Europe having the
best (54%), and Ireland and UK the poorest (37%). Five-year patient survival
improvement for Europe was 8% by 2005-2007, with Central, Southern, and Eastern
Europe showing the greatest increases (≥9%).
Conclusions
Survival for these cancer sites, particularly oesophageal cancer, remains poor in Europe
with wide variation. Further investigation into the wide variation, including analysis by
histology and anatomical sub-site, will yield insight to better monitor and explain the
improvements in survival observed over time.

Introduction
This article focuses on European relative survival (RS) estimates and trends for
oesophageal, stomach and small intestine cancer patients, diagnosed up to 2007, with
follow-up to December 31st 2008, as part of EUROCARE-5. Regional variation in RS
estimates throughout Europe has been consistently reported for cancer patients, including
upper gastrointestinal tract cancers, diagnosed in 1990-1994 [1], 1995-1999 [2] and 1999-
2007 [3].
Oesophageal cancer ranks as the eighth most common cancer worldwide with
approximately 5 cases per 100,000 diagnosed in Europe annually [4]. Two main
histological subtypes, adenocarcinoma (OAC) and squamous cell carcinoma (OSCC),
display regional variation in incidence across Europe [5]. Stomach cancer is the third
most common cause of cancer death globally [6]. Wide variation in stomach cancer
incidence across Europe has been reported with recent declines in most European
countries as a result of lifestyle changes, Helicobacter pylori detection and cancer
treatment. Incidence of non-cardia tumors is high in Southern Europe [7] which,
correspondingly, has the best 5-year patient survival [3]. While the small intestine
comprises 90% of the length of the bowel, small intestine cancers are rare with an age-
standardised incidence rate of 2 per 100,000 person-years in the USA [8] with lower
incidence rates reported within Europe [9]. Small intestine cancers exhibit a diverse
histology with adenocarcinomas, carcinoid (now classified as neuroendocrine),
lymphomas and sarcomas most common [10]. Incidence of small intestine cancers,
particularly neuroendocrine malignancies, have increased in the USA [11,12] and Sweden
[13], likely as a result of improved detection and classification. Neuroendocrine small
intestine cancers are the most common histological subtype and confer superior prognosis

compared to other small intestine entities [12]. Incidence of epithelial small intestine
cancers is reportedly highest in Northern and lowest in Eastern Europe [14]; possibly due
to geographic differences in diagnostic testing and variable capture by cancer registries.
Methods
Methods used for the analysis of EUROCARE-5 data are described in a dedicated paper
in this EJC issue [15]. Briefly, survival data were obtained from 29 countries, 21 with
100% national coverage, from 87 cancer registries. Countries were grouped into
Northern, Central, Southern and Eastern Europe and Ireland and UK.
All patients diagnosed with a primary and malignant oesophageal, stomach or small
intestine cancer, as identified by topography codes C15, C16 (cardia C16.0 and non-
cardia C16.1-C16.6) and C17, respectively, of the International Classification of Diseases
for Oncology, 3rd
edition (ICD-O-3), diagnosed from 2000-2007 were included. Patients
with morphology codes 9590-9989 (ICD-O-3), or who were diagnosed by death
certificate only (DCO), autopsy only, or censored with null survival time, were excluded.
Patients were not excluded if they had a previous primary tumour. All the registries with
less than 13% of DCO (for all cancers combined) were included in the analysis.
One-year RS, 5-year RS and 5-year RS conditional on surviving the first year after
diagnosis (5-year conditional) were estimated using the ‘complete’ cohort approach for
patients diagnosed 2000-2007 (with follow-up to 2008) stratified by gender and age-
group (i.e. 15-44, 45-54, 55-64, 65-74, 75 years or older) as previously described [15].
Age standardised survival [16] and European average estimates [15] are also provided.
Survival trends were estimated for countries with cases diagnosed between 1999 and

2007 (n=24 countries) with follow-up to 2008, using the ‘period’ approach [17] to
reliably predict 5-year survival in the years, 1999-2001, 2002-2004, and 2005-2007.
Results
Oesophageal, stomach and small intestine cancers were more common in men than
women, Table 1. Some countries in Eastern Europe had a high percentage of DCO cases.
Elsewhere in Europe the highest DCO rates were reported in Germany. Mean age at
diagnosis for oesophageal, stomach and small intestine cancers ranged from 60.7-71.6,
66.8-73.1 and 60.5-68.9 years, respectively, Table 1.
Oesophageal cancer
European average 1-year age-standardised RS was 39.9%, with 12.4% of patients
surviving 5-years, Figure 1. Patients in the Central Europe region, particularly Belgium,
had the best survival in Europe while survival was poorest in Eastern Europe. Lithuania
and Bulgaria had the lowest 5-year RS estimates. Conditional 5-year survival displayed
less heterogeneity across Europe, Figure 1.
Survival, at all follow-up time points investigated, decreased with increasing age, Figure
1. One-, 3- and 5-year age-standardised RS was higher in women than men across all
follow-up time points, Figure 1.
Overall oesophageal cancer 5-year age-standardised patient survival improved from 9.9%
to 12.6% between 1999-2001 and 2005-2007. Graphs of 5-year RS by region and Europe

overall are presented in Supplement 1. The largest regional improvements in 5-year RS
were observed in Ireland and UK and Central Europe with limited improvements
observed in Eastern or Southern Europe, (Table 2 and Supplement 1). Similar
improvements in patient survival were noted between 1999-2001 and 2002-2004, and
between 2002-2004 and 2005-2007 for most regions.
Stomach Cancer
One-year age-standardised RS for stomach cancer patients reached almost 50% with
substantial regional variation, see Figure 2. While the Eastern Europe region had the
poorest 1-year RS (38.4%), the 5-year RS was lowest in Ireland and UK (17.2%) region,
with similar survival across all UK countries. Southern Europe had the best 5-year patient
survival (29.6%) in Europe. While Eastern Europe had low 1- and 5-year RS, 5-year
conditional survival was better than in Northern Europe, and Ireland and UK. Wide
variation among countries was identified in 5-year RS estimates from 11.9% in Bulgaria
to 34.5% in Iceland. Survival, at all follow-up time points investigated, decreased with
increasing age, and women appeared to fare better than men.
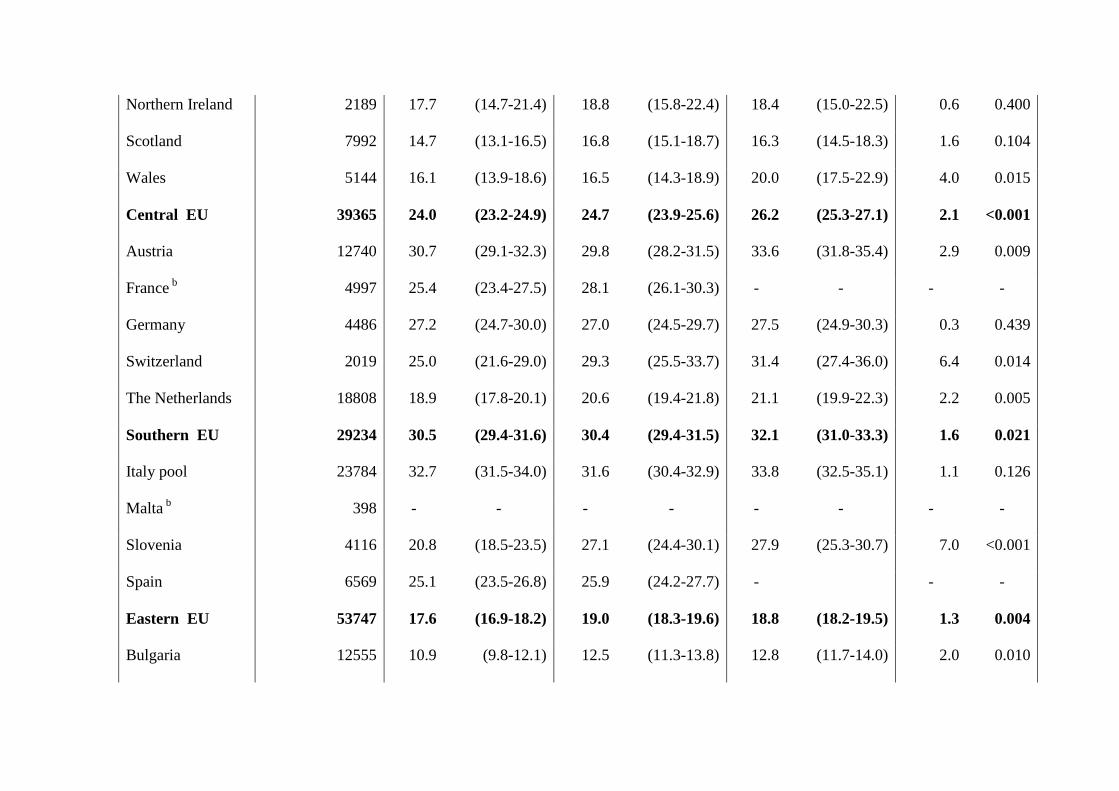
Overall 5-year patient survival increased absolutely by less than 2% points across Europe
between 1999-2001 and 2005-2007 (Table 3 and Supplement 2). The most marked
improvement in patient survival was in Slovenia from 1999-2001 (RS 20.8%) to 2002-
2004 (RS 27.1%), Table 3. Although no change was observed in 5-year RS in Northern
Europe, improved patient survival was evident in Denmark and Sweden with a decrease

in 5-year RS observed in Finland. The Netherlands had low RS compared to the rest of
Central Europe across all periods.
Southern and Central Europe had better patient survival for cardia and non-cardia cancers
than other regions, Table 4. Survival for non-cardia cancer patients was significantly
higher than for cardia cancer patients, Table 4. In Eastern Europe, as in Southern and
Central Europe, patients with non-cardia cancer predominated, Table 4.
Small Intestine Cancer
Small intestine cancer 1- and 5-year RS was 67.9% and 47.9%, respectively, see Figure 3.
Ireland and UK was the region with the worst 1-year patient survival at 58.8%. Croatia
was the country with the poorest 1-year RS (53.3%). The Central Europe region had the
best 5-year RS for small intestine cancer (53.9%) with the poorest in the Ireland and UK
region (36.9%). Wide country variation was identified in 5-year RS from 23.5% in Malta
to 58.6% in Switzerland. Five-year conditional survival in patients in Ireland and UK
remained significantly below the European average, Figure 3.
European patient survival declined with increasing age. Overall 1-, 3- and 5-year age-
standardised RS were slightly higher in women compared to men; particularly evident in
younger patients, Figure 3.
Overall 5-year RS increased from 40.5% to 48.7% from 1999-2001 until 2005-2007
(Table 5 and supplement 3). The largest improvements (>10% points) in patient survival

were observed in Italy, Austria, Czech Republic and Finland. All regions, except Ireland
and UK, showed a significant increase in survival from 1999-2001 to 2005-2007.
Discussion
European wide variation in patient survival was observed for all three cancer sites
investigated between regions. Country-specific patient survival also displayed wide
variation with several countries showing inconsistent estimates to their region, including
Denmark, the Netherlands, Bulgaria and Croatia. Survival of patients improved modestly
from 1999-2001 until 2005-2007 for all cancer sites. Oesophageal and stomach cancer 5-
year RS for Europe remained very poor. Small intestine cancer had the best overall 5-year
RS in Europe and displayed the largest improvement in patient survival.
Oesophageal cancer
European 1- and 5-year RS for oesophageal cancer patients remained poor (35.8% and
10.6%, respectively). With the exception of Central Europe, which maintained the highest
patient survival compared with other European regions as reported in EUROCARE-4
[18], RS in other European regions remained below that reported in the USA [19].
Eastern Europe, where OSCC predominates, continued to have the worst RS.
Geographical differences in the proportion of oesophageal cancer patients with histology
‘not otherwise specified’ between regions may account for some of these disparities (data
not shown). Additionally, differences in diagnostic accuracy may also account for
regional variation with potential misclassification of gastro-oesophageal tumours [20,21].
Cancer stage is a major predictor of cancer patient survival and differences in stage
distribution between countries and regions, as a result of early detection and/or diagnostic

practices, could also account for some of the observed disparity seen in Eastern Europe
[22,23].
Five-year RS for oesophageal cancer patients, for Europe as a whole, increased
marginally from 9.8% in 1999-2001 to 12.6% in 2005-2007. Central Europe and Ireland
and UK demonstrated the most marked improvement. This may be explained by
improvements in surgical techniques, adjuvant therapy, earlier diagnosis and/or
centralisation of treatment. The trends in Europe in mortality [24] and incidence [25] in
oesophageal cancer vary markedly across the countries in the study, but generally there is
tight correlation between them, suggesting that improvements in survival are not due to
over-diagnosis arising from increased surveillance. Variation in incidence trends may be
caused by regional changes in the risk-factor prevalence [26]. Obesity may be increasing
the incidence of OAC particularly in northern and western Europe, while reduction in
tobacco and alcohol consumption is reducing the incidence of OSCC [26]. The generally
better prognosis of patients diagnosed with EAC is not consistent across Europe [18].
Centralisation of treatment has produced a marked improvement in oesophageal cancer
patient survival with many European countries introducing such strategies in recent years.
Ireland and UK demonstrated comparatively better patient survival improvements for
oesophageal cancer than most Northern European countries in both time frames
investigated and in line with the centralisation of cancer services for oesophagogastric
cancer surgery implemented in the UK in 2001. While hospitals performing more than 40
oesophagectomies annually had lower 30-day postoperative mortality, this may not fully
explain regional differences in oesophageal or gastric cancer patient survival [27]. Other
factors, as highlighted by the International Benchmarking Partnership, may be important
such as late diagnosis, differences in public awareness of cancer symptoms, cancer stage,

morphology and topography, presence of co-morbidities, lifestyle factors such as cigarette
smoking, and access to optimum care [28]. Body mass index has also been shown to be a
prognostic marker for OSCC [29]. The fact that 5-year conditional patient survival is
rather similar across Europe indicates relevant differences in short term mortality and
points towards early diagnosis and access to care as important areas to consider with
regards to improvement of oesophageal cancer patient treatment and standardisation of
care.
Stomach cancer
One- and 5-year RS for stomach cancer patients remained low particularly in comparison
to 5-year survival of around 69% achieved in Asia [30]. Compared to Europe, stomach
cancer incidence in Asia is high, with a predominance of non-cardia tumours which have
better patient survival [31]. Screening programs and more aggressive treatment
undoubtedly contribute to the superior survival of patients seen in Asia but similar
strategies are unlikely to be cost-effective in comparatively low incidence countries
within Europe. Histological and staging variability across Europe may account for some
of the differences in stomach cancer patient survival observed between countries. Patient
survival improved overall in Europe from 1999-2001 to 2005-2007 particularly in
Denmark and the Czech Republic. Both mortality [20] and incidence [32] rates for
stomach cancer continue to fall for most countries during the period of this study,
suggesting no appreciable surveillance-driven over-diagnosis that could compromise
estimated survival improvement. A recent report using data from the World Health
Organisation reported lower stomach cancer mortality from 2000 onwards in the UK, the
USA, Japan and several European countries [33]. Centralisation of treatment for gastric
cancer was implemented in several European countries, including the UK, Denmark and

the Netherlands, in recent years despite reports of no survival benefit [27,34] for patients.
While 5-year RS was worst in Ireland and UK, improvements in the most recent time
period were observed particularly in Wales and England. While delayed diagnosis, first
line treatment, or post-operative mortality could explain the patient survival disadvantage
in Ireland and UK, other factors appear to be important given the poor 5-year conditional
patient survival. Lifestyle differences such as smoking behaviour, co-morbidities, cancer
stage and/or subtype could explain the variability observed across countries.
The decreasing 5-year RS in Finland and Norway could be related to the marked decrease
in incidence, mainly affecting distal stomach cancer [35], in these countries. Patients with
distal stomach cancer have better prognosis, as presented in this report, and this cancer is
more responsive to preventative measures than cancers arising in the cardia or proximal
stomach. As an effect of this selective incidence decrease, patient with proximal cancers,
who carry a worse prognosis, may have become relatively more frequent over time.
Small intestine cancer
European 1- and 5-year RS for patients with epithelial small bowel carcinomas diagnosed
from 1978-2002 were comparatively lower than those reported here for all small intestine
cancers, excluding lymphomas [14]. Incidence of epithelial small intestine cancers are
similar in Ireland and UK and Northern and Southern Europe [14] despite variation in RS.
Differences in cancer stage at diagnosis and subtype throughout Europe could explain the
reported variations in patient survival. The EUROCARE-5 data encompasses all small
intestine cancer histologies with the exception of lymphomas. Small intestine sarcomas
reportedly have worse prognosis than neuroendocrine cancers which have a more
favourable outcome [8,36]. Small intestine cancers are notoriously difficult to diagnose
due to their vague symptoms. Delays in diagnosis and treatment of small intestine cancer
patients are associated with poorer prognosis [37]. One-year RS was lower in Ireland and
UK as previously reported [14], and also in Denmark and several Eastern European
countries, suggesting that delayed diagnosis, at patient, primary care or referral stages,
might be an important factor. This would not however explain the poorer 5-year
conditional survival estimates in Ireland and UK, Denmark and Malta for those patients
who survived the first year post diagnosis.
Improved survival is reported across all European regions particularly in Northern,
Central and Eastern Europe for small intestine cancer patients. Increasing trends in small
intestine cancer incidence has been reported [11,12,13,38,39] but mortality rates have
remained stable or slightly increasing [38,39]. Given the low incidence and mortality
rates, and the heterogeneity of tumour types, it is difficult to say whether effective therapy
has increased patient survival [40]. Recent improvements in treatment of small intestine
sarcomas, with the use of tyrosine kinase inhibitors since 2001 [41] may have influenced
patient survival. Due to the low incidence of gastrointestinal stromal tumours [42], a rare
sarcoma sub-type, the effect on patient survival in large datasets like EUROCARE is
difficult to measure without ad hoc analyses.
Detailed discussion of the strengths and limitations of the EUROCARE-5 data are
available in the article by Rossi et al. in this issue [15]. Increasing survival trends after 5
years of follow-up were found in patients with poor prognosis cancer and aged 75 year
and older for Austria, Croatia, Germany, Poland and Slovakia, and may be related to
difficulties in the ascertainment of life status [43] or to DCO proportions [15]. Survival
estimates from these countries should be interpreted with caution. However, comparing

individual countries may provide more meaningful assessment of reasons for disparities
in patient survival; this is limited, however, for cancers with low incidence estimates such
as small intestine and oesophageal cancer as the standard errors become large. In
addition, the % DCO statistic for each country and cancer are available in Table 1, and
should inform comparisons being made between individual countries’ patient survival
estimates [44].
Conclusions
This article presents overall patient survival for three anatomical sub-sites: oesophagus,
stomach and small intestine. They provide some indication of areas that need further
investigation to determine the drivers of the variation in survival of cancer patients across
Europe. More in-depth investigation by anatomic sub-site and histology could explain the
variability observed and are planned using additional data from EUROCARE-5. The
historic nature of these large collaborative studies means that recent developments in
early detection, routes to treatment, changes to service provision and new treatment
modalities for patients will have had insufficient time to have a visible effect. Continued
monitoring of cancer survival across Europe will allow further evaluation of survival
differences to further promote the widespread application of effective diagnosis and
treatment modalities [45]. In summary, although improvements in survival have been
reported for cancers of the oesophagus, stomach and small intestine, survival remains
poor with wide variation across Europe.

References
[1] Sant M, Aareleid T, Berrino F, Bielska Lasota M, Carli PM, Faivre J, et al.
EUROCARE-3: survival of cancer patients diagnosed 1990-94--results and
commentary. Ann Oncol 2003;14 Suppl 5:v61–118.
[2] Berrino F, De Angelis R, Sant M, Rosso S, Bielska-Lasota M, Lasota MB, et al.
Survival for eight major cancers and all cancers combined for European adults
diagnosed in 1995-99: results of the EUROCARE-4 study. Lancet Oncol 2007;8:773–
83. doi:10.1016/S1470-2045(07)70245-0.
[3] De Angelis R, Sant M, Coleman MP, Francisci S, Baili P, Pierannunzio D, et al.
Cancer survival in Europe 1999-2007 by country and age: results of EUROCARE--5-a
population-based study. Lancet Oncol 2014;15:23–34. doi:10.1016/S1470-
2045(13)70546-1.
[4] Bosetti C, Levi F, Ferlay J, Garavello W, Lucchini F, Bertuccio P, et al. Trends in
oesophageal cancer incidence and mortality in Europe. Int J Cancer 2008;122:1118–
29. doi:10.1002/ijc.23232.
[5] Arnold M, Soerjomataram I, Ferlay J, Forman D. Global incidence of oesophageal
cancer by histological subtype in 2012. Gut 2015;64:381–7. doi:10.1136/gutjnl-2014-
308124.
[6] Ferlay J, Soerjomataram I I, Dikshit R, Eser S, Mathers C, Rebelo M, et al. Cancer
incidence and mortality worldwide: sources, methods and major patterns in
GLOBOCAN 2012. Int J Cancer 2014;136:E359–86. doi:10.1002/ijc.29210.

[7] Verdecchia A, Corazziari I, Gatta G, Lisi D, Faivre J, Forman D. Explaining gastric
cancer survival differences among European countries. Int J Cancer 2004;109:737–41.
doi:10.1002/ijc.20047.
[8] Qubaiah O, Devesa SS, Platz CE, Huycke MM, Dores GM. Small intestinal cancer: a
population-based study of incidence and survival patterns in the United States, 1992 to
2006. Cancer Epidemiol Biomarkers Prev 2010;19:1908–18. doi:10.1158/1055-
9965.EPI-10-0328.
[9] Haselkorn T, Whittemore AS, Lilienfeld DE. Incidence of small bowel cancer in the
United States and worldwide: geographic, temporal, and racial differences. Cancer
Causes Control 2005;16:781–7. doi:10.1007/s10552-005-3635-6.
[10] Schottenfeld D, Beebe-Dimmer JL, Vigneau FD. The epidemiology and pathogenesis
of neoplasia in the small intestine. Ann Epidemiol 2009;19:58–69.
doi:10.1016/j.annepidem.2008.10.004.
[11] Tsikitis VL, Wertheim BC, Guerrero MA. Trends of incidence and survival of
gastrointestinal neuroendocrine tumors in the United States: a seer analysis. J Cancer
2012;3:292–302. doi:10.7150/jca.4502.
[12] Bilimoria KY, Bentrem DJ, Wayne JD, Ko CY, Bennett CL, Talamonti MS. Small
bowel cancer in the United States: changes in epidemiology, treatment, and survival
over the last 20 years. Ann Surg 2009;249:63–71.
doi:10.1097/SLA.0b013e31818e4641.

[13] Lu Y, Fröbom R, Lagergren J. Incidence patterns of small bowel cancer in a
population-based study in Sweden: increase in duodenal adenocarcinoma. Cancer
Epidemiol 2012;36:e158–63. doi:10.1016/j.canep.2012.01.008.
[14] Faivre J, Trama A, De Angelis R, Elferink M, Siesling S, Audisio R, et al. Incidence,
prevalence and survival of patients with rare epithelial digestive cancers diagnosed in
Europe in 1995-2002. Eur J Cancer 2012;48:1417–24. doi:10.1016/j.ejca.2011.10.038.
[15] Rossi S, Baili P. Caldora M, Carrani E, Minicozzi P, Pierannunzio D et al. The
EUROCARE-5 database, qality checks and methods of statistical analysis. Eur J
Cancer 2015.
[16] Corazziari I, Quinn M, Capocaccia R. Standard cancer patient population for age
standardising survival ratios. Eur J Cancer 2004;40:2307–16.
doi:10.1016/j.ejca.2004.07.002.
[17] Brenner H, Gefeller O. An alternative approach to monitoring cancer patient survival.
Cancer 1996;78:2004–10.
[18] Gavin AT, Francisci S, Foschi R, Donnelly DW, Lemmens V, Brenner H, et al.
Oesophageal cancer survival in Europe: a EUROCARE-4 study. Cancer Epidemiol
2012;36:505–12. doi:10.1016/j.canep.2012.07.009.
[19] Ries LAG, Young JL, Keel GE, Eisner MP, Lin YD HM-J, editor. SEER Survival
Monograph: Cancer Survival Among Adults: U.S. SEER Program, 1988-2001, Patient
and Tumor Characteristics. NIH Pub. N. National Cancer Institute, SEER Program;
2007.

[20] Buas MF, Vaughan TL. Epidemiology and risk factors for gastroesophageal junction
tumors: understanding the rising incidence of this disease. Semin Radiat Oncol
2013;23:3–9. doi:10.1016/j.semradonc.2012.09.008.
[21] Marsman WA, Tytgat GNJ, ten Kate FJW, van Lanschot JJB. Differences and
similarities of adenocarcinomas of the esophagus and esophagogastric junction. J Surg
Oncol 2005;92:160–8. doi:10.1002/jso.20358.
[22] Walters S, Maringe C, Butler J, Brierley JD, Rachet B, Coleman MP. Comparability of
stage data in cancer registries in six countries: lessons from the International Cancer
Benchmarking Partnership. Int J Cancer 2013;132:676–85. doi:10.1002/ijc.27651.
[23] Maringe C, Walters S, Butler J, Coleman MP, Hacker N, Hanna L, et al. Stage at
diagnosis and ovarian cancer survival: evidence from the International Cancer
Benchmarking Partnership. Gynecol Oncol 2012;127:75–82.
doi:10.1016/j.ygyno.2012.06.033.
[24] Bosetti C, Bertuccio P, Malvezzi M, Levi F, Chatenoud L, Negri E, et al. Cancer
mortality in Europe, 2005-2009, and an overview of trends since 1980. Ann Oncol.
2013 Oct;24(10):2657-71.
[25] Lortet-Tieulent J, Renteria E, Sharp L, Weiderpass E, Comber H, Baas P, et al.
Convergence of decreasing male and increasing female incidence rates in major
tobacco-related cancers in Europe in 1988-2010. Eur J Cancer. 2015 Jun;51(9):1144-
63.

[26] Castro C, Bosetti C, Malvezzi M, Bertuccio P, Levi F, Negri E, et al. Patterns and
trends in esophageal cancer mortality and incidence in Europe (1980-2011) and
predictions to 2015. Ann Oncol. 2014 Jan;25(1):283-90.
[27] Dikken JL, van Sandick JW, Allum WH, Johansson J, Jensen LS, Putter H, et al.
Differences in outcomes of oesophageal and gastric cancer surgery across Europe. Br J
Surg 2013;100:83–94. doi:10.1002/bjs.8966.
[28] Forbes LJL, Simon AE, Warburton F, Boniface D, Brain KE, Dessaix A, et al.
Differences in cancer awareness and beliefs between Australia, Canada, Denmark,
Norway, Sweden and the UK (the International Cancer Benchmarking Partnership): do
they contribute to differences in cancer survival? Br J Cancer 2013;108:292–300.
doi:10.1038/bjc.2012.542.
[29] Watanabe M, Ishimoto T, Baba Y, Nagai Y, Yoshida N, Yamanaka T, et al. Prognostic
impact of body mass index in patients with squamous cell carcinoma of the esophagus.
Ann Surg Oncol 2013;20:3984–91. doi:10.1245/s10434-013-3073-8.
[30] Nashimoto A, Akazawa K, Isobe Y, Miyashiro I, Katai H, Kodera Y, et al. Gastric
cancer treated in 2002 in Japan: 2009 annual report of the JGCA nationwide registry.
Gastric Cancer 2013;16:1–27. doi:10.1007/s10120-012-0163-4.
[31] Yako-Suketomo H, Katanoda K. Comparison of time trends in stomach cancer
mortality (1990-2006) in the world, from the WHO mortality database. Jpn J Clin
Oncol 2009;39:622–3. doi:10.1093/jjco/hyp107.

[32] Arnold M, Karim-Kos HE, Coebergh JW, Byrnes G, Antilla A, Ferlay J, et al. Recent
trends in incidence of five common cancers in 26 european countries since 1988:
Analysis of the european cancer observatory. Eur J Cancer. 2015 Jun;51(9):1164-87.
[33] Matsuda A, Matsuda T. Time trends in stomach cancer mortality (1950-2008) in
Japan, the USA and Europe based on the WHO mortality database. Jpn J Clin Oncol
2011;41:932–3. doi:10.1093/jjco/hyr093.
[34] Van de Poll-Franse L V, Lemmens VEPP, Roukema JA, Coebergh JWW,
Nieuwenhuijzen GAP. Impact of concentration of oesophageal and gastric cardia
cancer surgery on long-term population-based survival. Br J Surg 2011;98:956–63.
doi:10.1002/bjs.7493.
[35] Schmassmann A, Oldendorf M-G, Gebbers J-O. Changing incidence of gastric and
oesophageal cancer subtypes in central Switzerland between 1982 and 2007. Eur J
Epidemiol 2009;24:603–9. doi:10.1007/s10654-009-9379-y.
[36] Zeeneldin AA, Saber MM, Seif El-Din IA, Frag SA. Small intestinal cancers among
adults in an Egyptian district: a clinicopathological study using a population-based
cancer registry. J Egypt Natl Canc Inst 2013;25:107–14.
doi:10.1016/j.jnci.2013.01.004.
[37] Bauer RL, Palmer ML, Bauer AM, Nava HR, Douglass HO. Adenocarcinoma of the
small intestine: 21-year review of diagnosis, treatment, and prognosis. Ann Surg Oncol
1994;1:183–8. 1.

[38]. Shack LG, Wood HE, Kang JY, Brewster DH, Quinn MJ, Maxwell JD, et al. Small
intestinal cancer in England & Wales and Scotland: Time trends in incidence,
mortality and survival. Aliment Pharmacol Ther. 2006 May 1;23(9):1297-306.
[39]. Klint A, Engholm G, Storm HH, Tryggvadottir L, Gislum M, Hakulinen T, et al.
Trends in survival of patients diagnosed with cancer of the digestive organs in the
nordic countries 1964-2003 followed up to the end of 2006. Acta Oncol. 2010
Jun;49(5):578-607.
[40] Karim-Kos HE, Kiemeney LA, Louwman MW, Coebergh JW, de Vries E. Progress
against cancer in the netherlands since the late 1980s: An epidemiological evaluation.
Int J Cancer. 2012 Jun 15;130(12):2981-9.
[41] Demetri GD. Identification and treatment of chemoresistant inoperable or metastatic
GIST: experience with the selective tyrosine kinase inhibitor imatinib mesylate
(STI571). Eur J Cancer 2002;38 Suppl 5:S52–9.
[42] Goodman MT, Matsuno RK, Shvetsov YB. Racial and ethnic variation in the
incidence of small-bowel cancer subtypes in the United States, 1995-2008. Dis Colon
Rectum 2013;56:441–8. doi:10.1097/DCR.0b013e31826b9d0a.
[43] Andersen MR, Storm HH, Eurocourse Work Package 2 Group. Cancer registration,
public health and the reform of the European data protection framework: Abandoning
or improving european public health research? Eur J Cancer. 2015 Jun;51(9):1028-38.
[44] Robinson D, Sankila R, Hakulinen T, Moller H. Interpreting international comparisons
of cancer survival: The effects of incomplete registration and the presence of death
certificate only cases on survival estimates. Eur J Cancer. 2007 Mar;43(5):909-13.

[45] Baili P, Di Salvo F, Marcos-Gragera R, Siesling S, Mallone S et al. Survival for all
cancer patients diagnosed between 1999 and 2007 in Europe: results of EUROCARE-
5, a population-based study. Eur J Cancer 2015.

Table 1: Number of cases, percentage Death Certificate Only (DCO) cases and mean age at diagnosis (years) for oesophageal, stomach and small
intestine cancers by country/region before exclusion of autopsy and DCO cases.
Oesophagus Stomach Small Intestine
All
cases Men Women
%
DCOa
Mean
age
All
cases Men Women
%
DCOa
Mean
age
All
cases Men Women
%
DCOa
Mean
age
Northern EU
Denmark 3,177 2,242 935 0 68.2 4,200 2,700 1,500 0 68.7 602 303 299 0 66.7
Finland 1,859 1,218 641 1.1 69.2 5,812 3,213 2,599 0.7 70.1 691 367 324 1.4 65.3
Iceland 121 87 34 0 71.6 281 171 110 0 72.5 47 27 20 0 66.2
Norway 1,466 1,041 425 0.8 70.1 4,521 2,717 1,804 0.6 72.5 836 441 395 0.2 66.9
Sweden 3,203 2,300 903 0 70.1 7,863 4,740 3,123 0 72.1 1,819 1,012 807 0 68.9
Ireland and UK
Ireland 2,706 1,707 999 0.8 69.7 3,701 2,297 1,404 1.6 69.8 392 228 164 1.5 65.3
UK-England 50,610 32,299 18,311 2.6 71.5 55,973 36,023 19,950 3.5 72.9 5,501 2,985 2,516 2.5 68.1
UK-Northern
Ireland 1,294 817 477 0.7 69.9 1,882 1,129 753 1.3 71.5 189 109 80 1.1 65.7

UK-Scotland 6,531 4,072 2,459 0.4 70.7 6,771 4,096 2,675 0.5 72.0 615 313 302 0.2 67.5
UK-Wales 3,530 2,196 1,334 2.4 71.2 4,324 2,706 1,618 3.8 73.1 413 210 203 1.9 68.2
Central EU
Austria 2,569 2,066 503 0 64.7 10,572 5,817 4,755 0 71.1 889 463 426 0 66.2
Belgiumb 3,984 3,054 930 0 66.3 6,737 4,146 2,591 0 71.6 856 457 399 0 66.6
Franceb 4,531 3,817 714 0 65.9 6,194 3,961 2,233 0 71.3 822 462 360 0 66.8
Germanyb 10,152 8,021 2,131 10.6 65.3 31,664 17,865 13,799 15.6 70.9 2,357 1,254 1,103 8.2 66.4
Switzerlandb 1,222 936 286 1.0 68.0 2,223 1,317 906 1.7 70.3 381 213 168 0 68.1
The Netherlands 11,654 8,355 3,299 0 67.6 16,208 10,268 5,940 0 69.9 1,769 920 849 0 66.0
Southern EU
Croatia 1,815 1,492 323 7.6 64.9 9,146 5,553 3,593 8.2 68.6 306 173 133 6.5 66.1
Italyb 5,600 4,178 1,422 1.5 68.9 36,113 20,960 15,153 1.6 72.6 2,248 1,259 989 1.2 68.6
Malta 94 69 25 8.5 68.2 359 216 143 5.0 70.0 31 13 18 3.2 60.5
Portugalb 2,619 2,201 418 0.1 63.7 14,723 8,931 5,792 0.1 67.2 641 366 275 0 66.3
Slovenia 739 607 132 2.3 64.9 3,772 2,314 1,458 2.4 68.9 162 95 67 0 65.1
Spainb 1,782 1,541 241 2.6 65.1 6,598 4,193 2,405 3.6 70.4 378 225 153 1.3 67.2
Eastern EU

Bulgaria 1,478 1,152 326 22.5 64.6 14,616 9,005 5,611 20.5 68.2 345 197 148 24.1 63.5
Czech Republic 3,680 3,090 590 5.1 63.6 13,760 7,996 5,764 4.6 69.3 1,019 559 460 3.9 65.4
Estonia 434 355 79 0 64.9 3,277 1,776 1,501 0.2 66.8 90 36 54 0 64.2
Latvia 881 739 142 6.5 63.8 5,324 2,948 2,376 6.6 67.0 114 52 62 11.4 65.8
Lithuania 1,180 1,022 158 4.8 63.1 7,047 4,095 2,952 4.2 67.2 176 83 93 8.5 65.8
Polandb 1,353 1,070 283 1.7 63.5 6,253 3,938 2,315 1.6 67.0 230 122 108 0 64.3
Slovakia 1,937 1,732 205 12.5 60.7 6,826 4,111 2,715 12.3 6\8.1 397 212 185 10.8 64.3
a Also includes ‘autopsy-only’ basis of diagnosis.
b Pooled rates as these countries did not have national coverage.

Table 2: Five-year relative survival (RS) and corresponding 95% confidence interval (CI) of oesophageal cancer in three periods (1999-
2001, 2002-2004, 2005-2007) by country, European region and European average, with p-values of differencesa between periods.
Number of cases
analysed across
all time periods
1999-2001 2002-2004 2005-2007
2005-2007
vs 1999-2001
% RS 95% CI % RS 95% CI % RS 95% CI Abs diff p-value
Europe 111006 9.9 (9.3-10.5) 11.7 (11.0-12.3) 12.6 (12.0-13.2) 2.7 <0.001
Northern EU 10471 9.1 (8.0-10.4) 11.3 (10.1-12.8) 10.8 (9.7-12.1) 1.7 0.023
Denmark 3401 4.6 (3.3-6.4) 9.0 (7.0-11.5) 9.7 (7.9-11.8) 5.1 <0.001
Finland 1959 9.6 (7.2-12.7) 12.9 (9.9-16.7) 12.1 (9.5-15.2) 2.5 0.108
Iceland b
129 -
- - - - - -
Norway 1572 8.4 (5.7-12.4) 12.5 (9.5-16.5) 10.9 (8.0-14.8) 2.5 0.150
Sweden 3411 13.3 (11.0-16.0) 12.3 (10.0-15.2) 10.6 (8.8-12.8) 2.7 0.052
Ireland and UK 67862 10.3 (9.8-10.8) 11.9 (11.4-12.4) 13.5 (13.0-14.1) 3.2 <0.001
Ireland 2816 11.9 (9.6-14.7) 15.3 (12.7-18.3) 16.7 (14.2-19.6) 4.8 0.005
England 52786 9.9 (9.4-10.6) 11.5 (10.9-12.1) 13.7 (13.1-14.3) 3.7 <0.001

Northern Ireland b
1389 9.6 (7.1-13.0) 14.6 (11.3-18.7) - - - -
Scotland 7142 10.0 (8.6-11.6) 11.7 (10.1-13.5) 11.1 (9.7-12.7) 1.1 0.157
Wales 3727 14.1 (11.7-17.1) 13.8 (11.6-16.4) 12.6 (10.5-15.0) 1.6 0.188
Central EU 18139 10.8 (9.9-11.8) 13.9 (12.8-15.0) 15.2 (14.2-16.2) 4.3 <0.001
Austria 2711 11.7 (9.4-14.6) 17.9 (15.1-21.2) 17.1 (14.6-20.0) 5.4 0.002
France 3365 13.0 (11.2-15.0) 11.2 (9.6-13.0) - - - -
Germany b
1804 16.1 (12.8-20.4) 13.7 (10.6-17.7) - - - -
Switzerland 1075 15.3 (11.4-20.5) 18.3 (14.3-23.4) 18.9 (14.6-24.4) 3.6 0.145
The Netherlands 11744 9.6 (8.6-10.8) 13.1 (11.9-14.5) 14.4 (13.3-15.7) 4.8 <0.001
Southern EU 4474 9.7 (8.2-11.6) 10.6 (9.0-12.5) 10.9 (9.2-12.7) 1.1 0.186
Italy 3278 10.7 (8.8-13.2) 12.4 (10.3-14.8) 11.0 (9.1-13.3) 0.3 0.432
Malta b
67 - - - - - - - -
Slovenia b 805 7.1 (4.2-12.1) - - 8.6 (5.5-13.6) 1.5 0.289
Spain 1792 7.9 (6.1-10.2) 7.9 (6.1-10.2) - - - -
Eastern EU 10063 7.3 (6.1-8.6) 7.4 (6.3-8.6) 8.1 (7.0-9.3) 0.8 0.175
Bulgaria b
1172 - - - - 6.7 (4.2-10.7) - -

Abs = absolute, Diff = Difference.
a Survival differences between periods have been assessed by the Z-test.
b Standardized Survival rates could not be calculated where one or more age specific rates are absent due to small number of cases.
Note: % difference is the relative difference.
Note: Empty fields of RS in France and Spain in 2007 are due to a limitation of analysis to periods 1999-2001 and 2002-2004 only.
Czech Republic 3496 7.3 (5.4-9.8) 9.2 (7.0-12.2) 11.4 (9.5-13.7) 4.2 0.003
Estonia b 485 - - - - - - - -
Lithuania b
1348 8.4 (5.6-12.5) 4.7 (2.9-7.5) - - - -
Poland b 1474 8.1 (5.3-12.4) 7.7 (5.3-11.3) 6.2 (4.0-9.7) 1.9 0.205
Slovakia b 111006 6.4 (3.9-10.3) 10.1 (6.4-15.6) - - - -
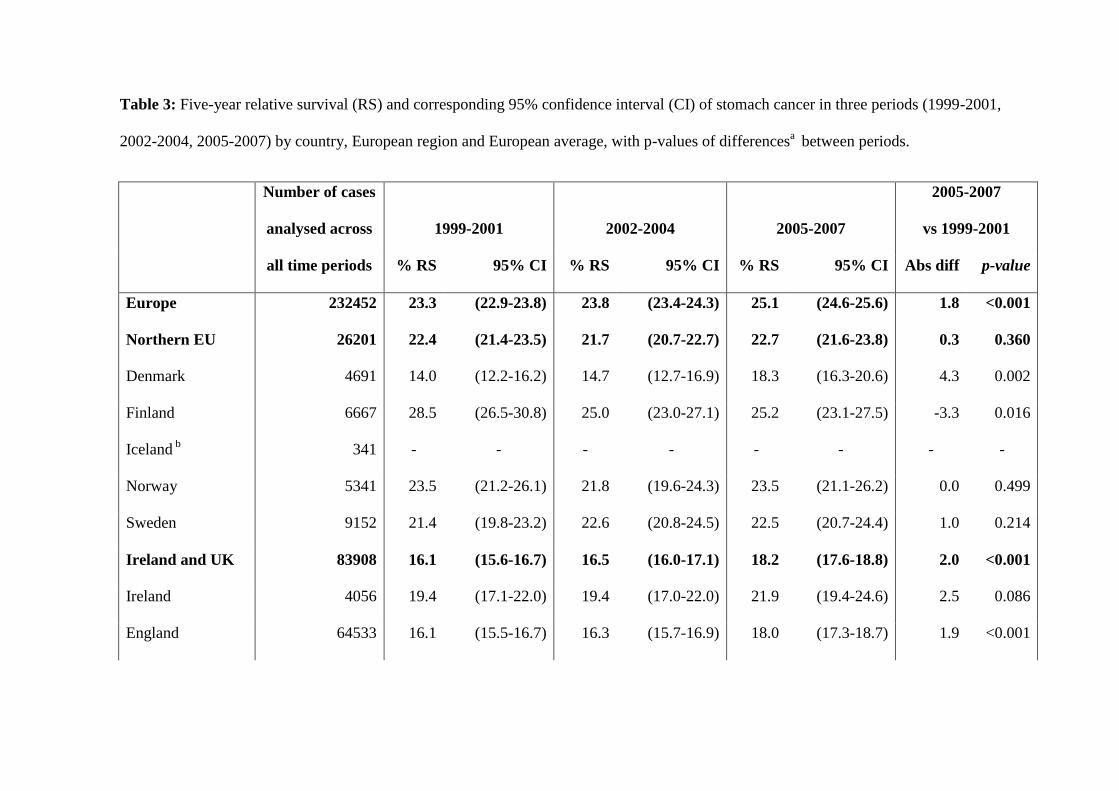
Table 3: Five-year relative survival (RS) and corresponding 95% confidence interval (CI) of stomach cancer in three periods (1999-2001,
2002-2004, 2005-2007) by country, European region and European average, with p-values of differencesa between periods.
Number of cases
analysed across
all time periods
1999-2001 2002-2004 2005-2007
2005-2007
vs 1999-2001
% RS 95% CI % RS 95% CI % RS 95% CI Abs diff p-value
Europe 232452 23.3 (22.9-23.8) 23.8 (23.4-24.3) 25.1 (24.6-25.6) 1.8 <0.001
Northern EU 26201 22.4 (21.4-23.5) 21.7 (20.7-22.7) 22.7 (21.6-23.8) 0.3 0.360
Denmark 4691 14.0 (12.2-16.2) 14.7 (12.7-16.9) 18.3 (16.3-20.6) 4.3 0.002
Finland 6667 28.5 (26.5-30.8) 25.0 (23.0-27.1) 25.2 (23.1-27.5) -3.3 0.016
Iceland b
341 - - - - - - - -
Norway 5341 23.5 (21.2-26.1) 21.8 (19.6-24.3) 23.5 (21.1-26.2) 0.0 0.499
Sweden 9152 21.4 (19.8-23.2) 22.6 (20.8-24.5) 22.5 (20.7-24.4) 1.0 0.214
Ireland and UK 83908 16.1 (15.6-16.7) 16.5 (16.0-17.1) 18.2 (17.6-18.8) 2.0 <0.001
Ireland 4056 19.4 (17.1-22.0) 19.4 (17.0-22.0) 21.9 (19.4-24.6) 2.5 0.086
England 64533 16.1 (15.5-16.7) 16.3 (15.7-16.9) 18.0 (17.3-18.7) 1.9 <0.001
Northern Ireland 2189 17.7 (14.7-21.4) 18.8 (15.8-22.4) 18.4 (15.0-22.5) 0.6 0.400
Scotland 7992 14.7 (13.1-16.5) 16.8 (15.1-18.7) 16.3 (14.5-18.3) 1.6 0.104
Wales 5144 16.1 (13.9-18.6) 16.5 (14.3-18.9) 20.0 (17.5-22.9) 4.0 0.015
Central EU 39365 24.0 (23.2-24.9) 24.7 (23.9-25.6) 26.2 (25.3-27.1) 2.1 <0.001
Austria 12740 30.7 (29.1-32.3) 29.8 (28.2-31.5) 33.6 (31.8-35.4) 2.9 0.009
France b
4997 25.4 (23.4-27.5) 28.1 (26.1-30.3) - - - -
Germany 4486 27.2 (24.7-30.0) 27.0 (24.5-29.7) 27.5 (24.9-30.3) 0.3 0.439
Switzerland 2019 25.0 (21.6-29.0) 29.3 (25.5-33.7) 31.4 (27.4-36.0) 6.4 0.014
The Netherlands 18808 18.9 (17.8-20.1) 20.6 (19.4-21.8) 21.1 (19.9-22.3) 2.2 0.005
Southern EU 29234 30.5 (29.4-31.6) 30.4 (29.4-31.5) 32.1 (31.0-33.3) 1.6 0.021
Italy pool 23784 32.7 (31.5-34.0) 31.6 (30.4-32.9) 33.8 (32.5-35.1) 1.1 0.126
Malta b
398 - - - - - - - -
Slovenia 4116 20.8 (18.5-23.5) 27.1 (24.4-30.1) 27.9 (25.3-30.7) 7.0 <0.001
Spain 6569 25.1 (23.5-26.8) 25.9 (24.2-27.7) -
- -
Eastern EU 53747 17.6 (16.9-18.2) 19.0 (18.3-19.6) 18.8 (18.2-19.5) 1.3 0.004
Bulgaria 12555 10.9 (9.8-12.1) 12.5 (11.3-13.8) 12.8 (11.7-14.0) 2.0 0.010
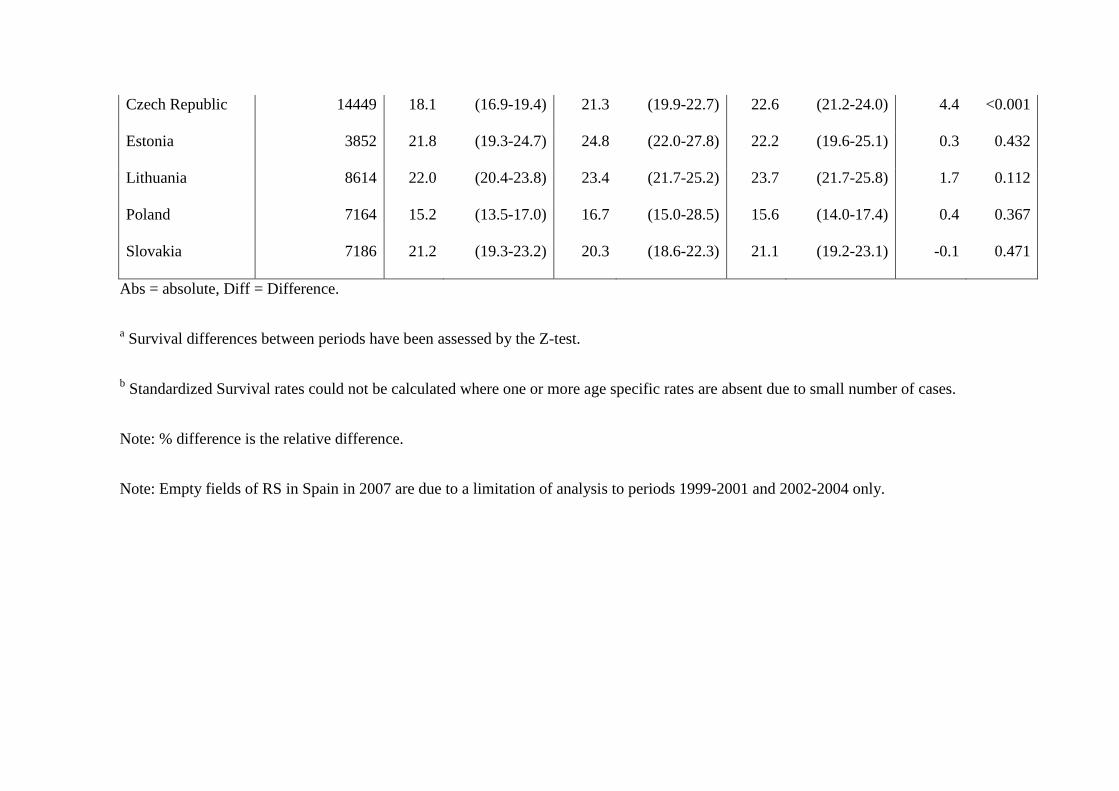
Czech Republic 14449 18.1 (16.9-19.4) 21.3 (19.9-22.7) 22.6 (21.2-24.0) 4.4 <0.001
Estonia 3852 21.8 (19.3-24.7) 24.8 (22.0-27.8) 22.2 (19.6-25.1) 0.3 0.432
Lithuania 8614 22.0 (20.4-23.8) 23.4 (21.7-25.2) 23.7 (21.7-25.8) 1.7 0.112
Poland 7164 15.2 (13.5-17.0) 16.7 (15.0-28.5) 15.6 (14.0-17.4) 0.4 0.367
Slovakia 7186 21.2 (19.3-23.2) 20.3 (18.6-22.3) 21.1 (19.2-23.1) -0.1 0.471
Abs = absolute, Diff = Difference.
a Survival differences between periods have been assessed by the Z-test.
b Standardized Survival rates could not be calculated where one or more age specific rates are absent due to small number of cases.
Note: % difference is the relative difference.
Note: Empty fields of RS in Spain in 2007 are due to a limitation of analysis to periods 1999-2001 and 2002-2004 only.

Table 4: Age-standardised 1-year, 5-year relative survival, and 5-year relative survival conditional on surviving 1 year, with 95% confidence
intervals, for cardia and non-cardia stomach cancers.
Cardia Non-cardia
No. of
cases
1-year 5-year Conditional No. of
cases
1-year 5-year Conditional
% RS 95% CI % RS 95% CI % RS 95% CI % RS 95% CI % RS 95% CI % RS 95% CI
Europe 48611 46.0 45.5-46.4 16.0 15.5-16.4 34.0 33.2-34.9 96020 54.6 54.3-54.9 30.5 30.1-30.9 66.3 65.9-66.8
Northern EU 5299 43.3 41.9-44.7 14.1 12.9-15.3 32.5 30.0-35.1 6027 55.2 53.8-56.5 28.6 27.1-30.2 51.9 49.4-54.5
Denmark 1687 41.0 38.6-43.4 12.8 10.8-15.0 31.2 26.8-36.2 1149 48.0 44.9-51.0 25.9 22.8-29.2 53.9 48.4-60.1
Finland 936 45.9 42.5-49.2 16.0 13.2-19.1 34.9 29.5-41.4 272 57.8 51.3-63.7 - - - -
Iceland 41 31.0 18.0-44.8 10.3 3.4-19.1 33.2 15.2-72.5 70 74.7 62.7-83.0 - - - -
Norway 967 43.9 40.6-47.1 15.4 12.7-18.5 35.2 29.6-42.0 1831 58.0 55.4-60.5 30.0 27.2-32.9 51.8 47.7-56.2
Sweden 1668 44.2 41.7-46.6 13.6 11.6-15.7 30.7 26.6-35.5 2705 55.9 53.7-58.0 28.0 25.6-30.4 50.1 46.3-54.1
Ireland and UK 19244 46.6 45.8-47.3 14.4 13.8-15.1 31.0 29.7-32.4 17457 48.4 47.5-49.3 23.2 22.3-24.0 47.9 46.3-49.5
Ireland 986 42.2 39.0-45.3 17.0 14.1-20.0 40.2 34.3-47.1 1705 46.2 43.8-48.7 24.4 21.9-27.0 52.8 48.3-57.7
England 14510 47.4 46.5-48.2 14.8 14.1-15.5 31.2 29.8-32.70 11932 49.2 48.1-50.3 23.1 22.0-24.2 46.9 45.1-48.9
Northern Ireland 462 46.4 41.6-51.1 16.2 12.3-20.7 35.0 27.5-44.5 534 42.2 37.4-47.0 21.2 16.9-25.8 50.1 41.9-59.9
Scotland 1983 42.9 40.5-45.3 11.3 9.6-13.2 26.4 22.7-30.7 1787 47.6 44.9-50.2 23.4 20.8-26.1 49.2 44.6-54.4
Wales 1303 46.7 43.8-49.6 13.2 10.9-15.8 28.4 23.8-33.8 1499 47.3 44.2-50.4 22.3 19.4-25.4 47.2 41.9-53.1
Central EU 13230 49.2 48.4-50.1 18.2 17.4-19.0 37.0 35.4-38.5 26709 60.9 60.3-61.5 36.0 35.2-36.7 59.1 58.0-60.1
Austria 1297 50.5 47.7-53.3 22.6 19.8-25.5 44.7 39.9-50.1 1895 65.9 63.5-68.1 40.2 37.3-43.1 61.0 57.3-65.0
Belgium 1264 55.9 53.1-58.7 20.5 17.7-23.5 36.7 32.1-41.9 1504 63.0 60.3-65.7 35.6 32.3-38.8 56.4 52.0-61.2

France 1384 50.6 47.9-53.3 14.7 12.6-17.0 29.0 25.3-33.4 2949 58.6 56.6-60.6 32.8 30.6-35.0 56.0 52.9-59.2
Germany 4506 52.7 51.2-54.2 22.3 20.7-23.9 42.3 39.7-45.1 11906 64.4 63.5-65.3 40.1 39.0-41.3 62.3 60.8-63.9
Switzerland 494 52.0 47.4-56.5 - - - - 1145 64.1 61.1-67.0 40.8 37.2-44.3 63.6 59.1-68.4
The Netherlands 4285 42.4 40.9-43.9 13.1 11.9-14.5 31.0 28.3-34.0 7310 53.7 52.5-54.9 28.9 27.5-30.2 53.8 51.6-56.0
Croatia 476 42.43 37.7-47.1 27.0 21.9-32.4 63.7 54.2-74.9 446 56.6 51.6-61.4 37.4 31.4-43.5 66.1 57.6-75.8
Southern EU 5793 48.6 47.2-49.9 20.2 18.9-21.5 41.5 39.2-44.0 24960 60.1 59.4-60.7 36.2 35.5-36.9 60.2 59.2-61.3
Italy 3193 52.2 50.3-54.0 20.9 19.1-22.7 40.0 37.0-43.3 15728 61.3 60.5-62.1 37.1 36.2-38.1 60.6 59.2-61.9
Malta 65 35.9 25.5-46.4 - - - - 107 49.2 38.8-58.7 25.4 16.9-34.8 51.7 38.6-69.3
Portugal 890 45.5 42.0-48.9 20.6 17.6-23.9 45.4 39.7-51.9 4188 59.4 57.8-60.9 36.1 34.4-37.9 60.8 58.4-63.4
Slovenia 473 46.2 41.4-50.8 18.3 14.1-22.9 39.6 31.8-49.3 1424 61.2 58.6-63.8 41.0 37.8-44.2 67.0 62.8-71.5
Spain 696 44.7 40.8-48.5 16.9 13.9-20.2 37.9 32.0-44.8 3067 55.4 53.5-57.2 30.8 28.9-32.7 55.6 52.7-58.5
Eastern EU 5045 36.4 35.1-37.8 13.1 12.0-14.4 36.1 33.2-39.2 20867 45.6 44.9-46.3 23.7 23.0-24.4 52.0 50.6-53.4
Bulgaria 1273 25.3 22.9-27.8 7.6 5.8-9.9 30.2 23.5-38.7 6460 33.8 32.6-35.0 14.2 13.1-15.4 42.0 39.1-45.2
Czech Republic 1596 41.4 38.9-43.9 15.6 13.4-18.0 37.7 32.9-43.2 5927 49.5 48.2-50.9 27.5 26.0-29.0 55.5 53.0-58.1
Estonia 262 41.2 35.0-47.3 18.4 12.9-24.7 44.7 33.6-59.3 1760 50.9 48.4-53.2 29.1 26.3-31.8 57.2 52.7-62.0
Latvia 266 32.8 27.0-38.7 15.9 10.8-21.9 48.4 35.8-65.5 1012 44.1 40.9-47.3 22.8 19.4-26.3 51.7 45.2-59.0
Lithuania 312 42.2 36.3-47.9 15.4 11.2-20.3 36.6 28.0-47.6 2218 54.6 52.4-56.7 31.3 28.8-33.7 57.3 53.5-61.3
Poland 627 41.6 37.7-45.5 12.8 9.6-16.5 30.8 23.9-39.6 398 47.9 42.8-52.9 17.4 12.6-22.9 36.4 27.5-48.1
Slovakia 709 38.9 35.1-42.7 13.6 10.5-17.0 34.8 28.0-43.3 3092 53.9 52.0-55.7 28.7 26.7-30.7 53.2 50.1-56.5

Table 5: Five-year relative survival (RS) and corresponding 95% confidence interval (CI) of small intestine cancer in three periods (1999-
2001, 2002-2004, 2005-2007) by country, European region and European average, with p-values of differences* between periods.
Number of cases
analysed across
all time periods
1999-2001 2002-2004 2005-2007
2005-2007
vs 1999-2001
% RS 95% CI % RS 95% CI % RS 95% CI Abs diff p-value
Europe 18116 40.5 (38.5-42.7) 45.8 (43.9-47.9) 48.7 (46.9-50.5) 8.1 <0.001
Northern EU 4021 49.9 (46.7-53.3) 50.7 (47.7-53.9) 55.8 (53.0-58.8) 6.0 0.004
Denmark 626 37.4 (30.3-46.1) 37.7 (30.4-46.6) 39.6 (33.2-47.1) 2.2 0.341
Finland 678 51.7 (43.7-61.2) 55.4 (48.8-62.9) 62.1 (54.9-70.3) 10.4 0.040
Iceland b
49 - - - - - - - -
Norway 834 52.6 (45.7-60.6) 51.6 (45.4-58.6) 56.6 (50.5-63.3) 3.9 0.216
Sweden 1835 52.0 (47.5-57.0) 53.3 (48.9-58.1) 59.5 (55.3-64.0) 7.5 0.011
Ireland and UK 7178 35.3 (33.1-37.6) 36.1 (34.1-38.3) 37.7 (35.7-39.8) 2.4 0.058
Ireland 376 35.5 (26.2-48.1) 44.7 (36.3-55.2) 42.8 (34.7-52.9) 7.3 0.154
England 5539 34.4 (31.9-37.0) 35.1 (32.8-37.5) 37.7 (35.5-40.2) 3.4 0.027

Northern Ireland 230 37.4 (27.9-50.2) 33.9 (23.0-50.0) 43.5 (30.6-61.9) 6.1 0.263
Scotland 639 39.6 (32.7-48.0) 37.5 (30.1-46.7) 38.4 (31.9-46.1) -1.3 0.405
Wales 401 38.9 (28.6-52.7) 38.2 (29.6-49.3) 33.3 (25.9-42.8) -5.6 0.227
Central EU 3399 44.1 (40.7-47.8) 47.8 (44.5-51.2) 53.0 (50.0-56.3) 9.0 <0.001
Austria 899 43.6 (37.3-50.9) 52.3 (46.0-59.4) 55.7 (50.1-61.9) 12.1 0.004
France 572 45.3 (39.3-52.3) 48.3 (42.2-56.2) - - - -
Germany 323 42.0 (31.6-56.0) 45.6 (34.9-59.6) 50.1 (41.2-61.0) 8.1 0.154
Switzerland 294 54.7 (45.0-66.5) 59.9 (50.4-71.0) 55.4 (45.4-67.5) 0.7 0.467
The Netherlands 1737 44.5 (39.6-50.0) 43.3 (39.0-48.2) 51.5 (47.2-56.3) 7.1 0.022
Southern EU 1570 39.5 (34.7-44.9) 49.0 (44.3-54.2) 49.7 (45.5-54.3) 10.2 0.001
Italy 1338 38.7 (33.5-44.6) 48.7 (43.7-54.4) 51.1 (46.4-56.3) 12.5 <0.001
Malta b 34 - - - - - - - -
Slovenia b 153 - - 48.5 (33.8-69.6) - - - -
Spain 347 46.3 (38.4-56.0) 42.4 (35.9-50.1) - - - -
Eastern EU 1951 34.5 (29.4-40.4) 43.4 (38.9-48.4) 43.5 (39.6-47.8) 9.1 0.005
Bulgaria 248 41.9 (26.0-67.6) 35.8 (25.1-51.0) - - - -

Abs = absolute, Diff = Difference.
a Survival differences between periods have been assessed by the Z-test.
b Standardized Survival rates could not be calculated where one or more age specific rates are absent due to small number of cases.
Note: % difference is the relative difference.
Note: Empty fields of RS in France and Spain in 2007 are due to a limitation of analysis to periods 1999-2001 and 2002-2004 only.
Czech Republic 849 35.8 (28.3-45.4) 46.1 (39.4-54.0) 46.9 (41.0-53.6) 11.0 0.020
Estonia b 95 - - - - - - - -
Lithuania b
186 - - - - 32.9 (22.0-49.4) - -
Poland b 225 - - - - 44.7 (33.7-59.1) - -
Slovakia 368 51.4 (39.4-67.1) 42.0 (32.2-54.7) 46.2 (37.6-56.8) -5.2 0.269

Supplement 1: Age-standardised 5-year RS for oesophageal cancer in a) Northern Europe, b)
UK and Ireland, c) Central Europe, d) Southern Europe, e) Eastern Europe and f) European
average.
a)
Note: Iceland removed as no points are available due to small number of cases
b)

c)
d)
Note: Malta removed as no points are available due to small number of cases

e)
f)

Supplement 2: Age-standardised 5-year RS for stomach cancer in a) Northern Europe, b)
Ireland and UK, c) Central Europe, d) Southern Europe, e) Eastern Europe and f) European
average.
a)
Note: Iceland removed as no points are available due to small number of cases
b)

c)
d)
Note: Malta removed as no points are available due to small number of cases.

e)
Note: Estonia removed as no points are available due to small number of cases.
f)
Ref supplement 2f previously presented de Angelis et al., 2014[3]

Supplement 3: Age-standardised 5-year RS for small intestine cancer in a)Northern Europe,
b) Ireland and UK, c) Central Europe, d) Southern Europe, e) Eastern Europe and f)
European average.
a)
Note: Iceland removed as no points are available due to small number of cases
b)

c)
d)
Note: Malta removed as no points are available due to small number of cases.

e)
Note: Estonia removed as no points are available due to small number of cases
f)
0
10
20
30
40
50
60
1999-2001 2002-2004 2005-2007
CR
S (
Ag
e-a
dj)
Period
Small Intestine cancer in Europe
Europe
Northern EU
Ireland/UK
Central EU
Southern EU
Eastern EU

Oesophagus
Age-standardised 1-year, 5-year relative survival, and 5-year relative survival conditional to
surviving 1 year, with 95% confidence intervals in parentheses
Age-standardised 5-year relative survival (%) European age-specific and age-standardised
observed (obs, %) and relative (rel, %) survival
Age
group
Number
of cases
1-year 3-year 5-year
2,995 obs 51.1 26.8 20.915-44
rel 51.2 27.0 21.1
14,298 obs 46.6 19.4 14.445-54
rel 46.9 19.7 14.8
30,054 obs 45.2 18.6 13.555-64
rel 45.6 19.2 14.3
36,782 obs 39.3 16.1 11.265-74
rel 40.3 17.5 12.9
43,556 obs 27.0 8.3 4.775+
rel 29.2 10.5 7.2
127,685 obs 38.8 15.6 10.9All cases
rel 39.9 16.8 12.4
0 20 40 60 80 100
Northern Europe
Denmark
Finland
Iceland
Norway
Sweden
Ireland and UK
Ireland
UK, England
UK, Northern Ireland
UK, Scotland
UK, Wales
Central Europe
Austria
Belgium
France
Germany
Switzerland
The Netherlands
Southern Europe
Croatia
Italy
Malta
Portugal
Slovenia
Spain
Eastern Europe
Bulgaria
Czech Republic
Estonia
Latvia
Lithuania
Poland
Slovakia
Europe
1-year
Number
of cases 5-year Conditional
35.8 34.8 36.99,654 ( )-Northern Europe 10.6 9.8 11.5( )- 29.6 27.5 31.9( )-
30.0 28.4 31.83,165 ( )-Denmark 8.9 7.7 10.3( )- 29.6 25.8 33.8( )-
38.1 35.6 40.61,798 ( )-Finland 12.0 10.1 14.2( )- 31.4 26.8 36.8( )-
43.1 34.2 54.2120 ( )-Iceland - ( )- - ( )-
38.4 35.7 41.21,442 ( )-Norway 10.0 7.9 12.6( )- 25.9 20.7 32.5( )-
39.2 37.3 41.23,129 ( )-Sweden 11.7 10.2 13.3( )- 29.7 26.3 33.5( )-
39.8 39.4 40.263,179 ( )-Ireland and UK 12.5 12.1 12.8( )- 31.4 30.5 32.2( )-
41.0 39.1 43.02,673 ( )-Ireland 15.6 13.9 17.4( )- 37.9 34.2 42.0( )-
39.7 39.2 40.249,287 ( )-UK, England 12.4 12.0 12.8( )- 31.2 30.3 32.2( )-
39.0 36.3 42.01,283 ( )-UK, Northern Ireland 16.1 13.7 18.9( )- 41.3 35.8 47.6( )-
40.0 38.6 41.36,492 ( )-UK, Scotland 11.0 10.0 12.1( )- 27.5 25.1 30.2( )-
40.4 38.6 42.23,444 ( )-UK, Wales 13.1 11.7 14.8( )- 32.5 29.1 36.3( )-
45.5 44.9 46.132,860 ( )-Central Europe 15.3 14.8 15.9( )- 33.7 32.7 34.7( )-
42.8 40.8 44.92,567 ( )-Austria 16.3 14.5 18.3( )- 38.0 34.3 42.2( )-
51.8 50.2 53.53,936 ( )-Belgium 21.8 20.2 23.5( )- 42.0 39.2 45.0( )-
46.7 45.2 48.34,499 ( )-France 13.9 12.7 15.2( )- 29.7 27.3 32.2( )-
46.1 45.0 47.29,038 ( )-Germany 16.2 15.1 17.3( )- 35.1 33.0 37.3( )-
49.6 46.6 52.71,190 ( )-Switzerland 18.4 15.7 21.7( )- 37.2 32.1 43.2( )-
42.7 41.8 43.711,630 ( )-The Netherlands 13.0 12.2 13.8( )- 30.4 28.7 32.3( )-
35.5 34.6 36.412,222 ( )-Southern Europe 10.1 9.5 10.8( )- 28.5 27.0 30.2( )-
26.4 24.2 28.81,676 ( )-Croatia 10.2 8.3 12.6( )- 38.7 32.0 46.9( )-
40.3 39.0 41.75,488 ( )-Italy 11.7 10.7 12.8( )- 29.0 26.7 31.5( )-
32.3 24.2 43.286 ( )-Malta - ( )- - ( )-
33.5 31.6 35.52,530 ( )-Portugal 10.0 8.7 11.6( )- 29.9 26.1 34.1( )-
29.6 26.3 33.4712 ( )-Slovenia 8.3 6.2 11.2( )- 28.1 21.4 36.8( )-
38.2 35.9 40.71,730 ( )-Spain 9.3 7.8 11.1( )- 24.5 20.8 28.8( )-
27.0 26.0 28.09,770 ( )-Eastern Europe 7.7 7.0 8.6( )- 28.7 26.1 31.5( )-
17.8 15.4 20.41,145 ( )-Bulgaria 6.1 4.3 8.6( )- 34.4 25.0 47.3( )-
31.2 29.5 33.03,283 ( )-Czech Republic 10.6 9.2 12.2( )- 34.1 30.0 38.7( )-
28.1 23.7 33.3426 ( )-Estonia 7.0 4.4 11.2( )- 24.9 16.0 38.7( )-
28.4 24.9 32.4809 ( )-Latvia - ( )- - ( )-
24.0 21.3 27.01,121 ( )-Lithuania 5.7 3.9 8.3( )- 23.7 16.6 33.9( )-
27.2 24.7 30.11,328 ( )-Poland 6.5 4.8 8.7( )- 23.8 18.0 31.5( )-
25.7 23.3 28.41,658 ( )-Slovakia 6.9 5.2 9.2( )- 26.8 20.4 35.2( )-
39.9 39.4 40.4127,685 ( )-Europe 12.4 12.0 12.8( )- 31.0 30.1 31.9( )-
Men (71%)
2,401 obs 49.9 25.7 19.715-44
rel 50.0 25.9 19.9
11,784 obs 46.0 18.6 13.645-54
rel 46.2 18.9 14.0
24,050 obs 44.3 17.9 12.755-64
rel 44.8 18.6 13.6
27,393 obs 39.1 15.5 10.565-74
rel 40.2 16.9 12.3
24,766 obs 27.4 8.1 4.675+
rel 29.9 10.5 7.2
90,394 obs 38.5 15.0 10.3All cases
rel 39.7 16.3 11.9
Women (29%)
594 obs 56.6 32.2 27.615-44
rel 56.7 32.3 27.8
2,514 obs 50.6 24.6 20.845-54
rel 50.7 24.8 21.1
6,004 obs 50.6 23.1 18.855-64
rel 50.9 23.5 19.4
9,389 obs 40.0 19.0 14.165-74
rel 40.6 19.8 15.4
18,789 obs 26.4 8.6 5.075+
rel 28.4 10.6 7.1
37,290 obs 40.9 18.5 14.3All cases
rel 41.8 19.5 15.5

Stomach
Age-standardised 1-year, 5-year relative survival, and 5-year relative survival conditional to
surviving 1 year, with 95% confidence intervals in parentheses
Age-standardised 5-year relative survival (%) European age-specific and age-standardised
observed (obs, %) and relative (rel, %) survival
Age
group
Number
of cases
1-year 3-year 5-year
10,313 obs 60.3 37.4 32.015-44
rel 60.4 37.5 32.3
22,471 obs 59.0 35.6 29.845-54
rel 59.3 36.1 30.5
47,246 obs 55.8 33.6 27.555-64
rel 56.4 34.7 29.1
84,324 obs 48.9 27.6 21.965-74
rel 50.1 29.8 25.1
115,395 obs 34.2 16.6 11.775+
rel 37.3 21.3 18.1
279,749 obs 48.3 27.4 21.9All cases
rel 49.7 29.8 25.1
0 20 40 60 80 100
Northern Europe
Denmark
Finland
Iceland
Norway
Sweden
Ireland and UK
Ireland
UK, England
UK, Northern Ireland
UK, Scotland
UK, Wales
Central Europe
Austria
Belgium
France
Germany
Switzerland
The Netherlands
Southern Europe
Croatia
Italy
Malta
Portugal
Slovenia
Spain
Eastern Europe
Bulgaria
Czech Republic
Estonia
Latvia
Lithuania
Poland
Slovakia
Europe
1-year
Number
of cases 5-year Conditional
46.9 46.2 47.622,186 ( )-Northern Europe 21.9 21.2 22.6( )- 46.6 45.3 47.9( )-
39.4 37.9 41.04,188 ( )-Denmark 16.0 14.7 17.5( )- 40.6 37.6 43.9( )-
49.1 47.8 50.55,616 ( )-Finland 25.3 23.9 26.7( )- 51.4 49.0 54.0( )-
54.5 48.5 61.3275 ( )-Iceland 34.5 28.3 42.1( )- 63.3 53.9 74.2( )-
49.0 47.4 50.74,452 ( )-Norway 22.7 21.1 24.4( )- 46.3 43.4 49.3( )-
48.3 47.1 49.67,655 ( )-Sweden 21.7 20.5 22.9( )- 44.9 42.7 47.2( )-
42.1 41.7 42.570,341 ( )-Ireland and UK 17.2 16.8 17.5( )- 40.8 40.0 41.6( )-
42.3 40.6 44.03,616 ( )-Ireland 20.3 18.7 22.1( )- 48.1 44.7 51.6( )-
42.3 41.8 42.853,998 ( )-UK, England 17.0 16.6 17.4( )- 40.2 39.3 41.2( )-
41.5 39.0 44.01,854 ( )-UK, Northern Ireland 18.1 15.9 20.5( )- 43.6 38.9 48.8( )-
40.4 39.1 41.76,713 ( )-UK, Scotland 16.1 15.0 17.3( )- 39.9 37.3 42.6( )-
42.3 40.6 44.14,160 ( )-UK, Wales 17.8 16.2 19.5( )- 42.0 38.7 45.7( )-
53.3 52.9 53.768,234 ( )-Central Europe 28.1 27.6 28.5( )- 52.7 52.0 53.4( )-
54.8 53.8 55.810,569 ( )-Austria 31.0 29.9 32.2( )- 56.6 54.9 58.5( )-
56.2 54.9 57.56,650 ( )-Belgium 30.5 29.1 32.0( )- 54.4 52.2 56.7( )-
54.8 53.5 56.26,084 ( )-France 26.3 25.0 27.7( )- 47.9 45.8 50.1( )-
56.3 55.7 56.926,662 ( )-Germany 31.3 30.6 32.0( )- 55.6 54.5 56.7( )-
57.7 55.5 59.92,146 ( )-Switzerland 31.6 29.3 34.2( )- 54.9 51.3 58.7( )-
45.2 44.4 46.016,123 ( )-The Netherlands 20.4 19.7 21.3( )- 45.3 43.7 46.8( )-
52.2 51.9 52.668,213 ( )-Southern Europe 29.6 29.2 30.0( )- 56.7 56.0 57.4( )-
38.4 37.3 39.58,397 ( )-Croatia 21.3 20.2 22.5( )- 55.6 53.2 58.1( )-
56.6 56.0 57.235,428 ( )-Italy 32.4 31.7 33.0( )- 57.2 56.2 58.1( )-
41.0 35.7 47.1340 ( )-Malta 18.7 14.5 24.0( )- 45.5 36.9 56.2( )-
53.9 53.0 54.714,127 ( )-Portugal 31.8 30.9 32.7( )- 59.0 57.6 60.5( )-
46.0 44.3 47.73,617 ( )-Slovenia 26.6 24.9 28.5( )- 57.9 54.7 61.2( )-
49.4 48.1 50.76,304 ( )-Spain 25.6 24.3 26.9( )- 51.8 49.7 54.0( )-
38.4 38.0 38.950,775 ( )-Eastern Europe 18.8 18.4 19.2( )- 48.9 48.0 49.9( )-
28.8 27.9 29.611,614 ( )-Bulgaria 11.9 11.2 12.7( )- 41.4 39.1 43.9( )-
41.8 40.9 42.812,354 ( )-Czech Republic 22.0 21.1 23.0( )- 52.7 50.8 54.6( )-
44.4 42.7 46.23,242 ( )-Estonia 22.8 21.0 24.8( )- 51.4 47.9 55.2( )-
38.3 36.9 39.74,842 ( )-Latvia 20.2 18.8 21.7( )- 52.7 49.5 56.1( )-
42.5 41.3 43.76,741 ( )-Lithuania 23.1 21.9 24.4( )- 54.3 51.9 56.9( )-
38.1 36.8 39.46,112 ( )-Poland 15.6 14.4 16.8( )- 40.8 38.2 43.7( )-
43.5 42.2 44.85,870 ( )-Slovakia 20.9 19.6 22.2( )- 48.0 45.5 50.6( )-
49.7 49.4 50.0279,749 ( )-Europe 25.1 24.8 25.4( )- 50.6 50.1 51.1( )-
Men (61%)
5,712 obs 59.1 35.9 30.415-44
rel 59.2 36.1 30.8
14,758 obs 58.0 34.4 28.345-54
rel 58.3 35.0 29.2
32,479 obs 54.6 31.8 25.855-64
rel 55.3 33.0 27.6
55,667 obs 47.9 25.7 19.965-74
rel 49.4 28.2 23.4
61,560 obs 33.7 15.4 10.575+
rel 36.9 20.4 17.0
170,176 obs 47.3 25.9 20.3All cases
rel 48.9 28.4 23.7
Women (39%)
4,601 obs 61.9 39.3 34.115-44
rel 62.0 39.4 34.2
7,713 obs 60.9 37.9 32.645-54
rel 61.1 38.2 33.1
14,767 obs 58.6 37.8 31.555-64
rel 58.9 38.5 32.5
28,657 obs 50.8 31.5 26.265-74
rel 51.5 33.0 28.5
53,835 obs 34.9 18.0 13.175+
rel 37.7 22.4 19.2
109,573 obs 50.0 30.3 24.9All cases
rel 51.1 32.3 27.7

Small intestine
Age-standardised 1-year, 5-year relative survival, and 5-year relative survival conditional to
surviving 1 year, with 95% confidence intervals in parentheses
Age-standardised 5-year relative survival (%) European age-specific and age-standardised
observed (obs, %) and relative (rel, %) survival
Age
group
Number
of cases
1-year 3-year 5-year
1,490 obs 86.2 72.5 67.315-44
rel 86.3 72.8 67.9
2,756 obs 82.5 67.9 59.745-54
rel 82.9 68.9 61.2
5,141 obs 74.6 58.8 51.055-64
rel 75.3 60.6 53.8
6,577 obs 66.5 49.2 41.065-74
rel 68.0 52.8 46.6
7,314 obs 47.7 28.9 23.075+
rel 51.4 36.2 34.2
23,278 obs 66.2 49.4 42.2All cases
rel 67.9 53.1 47.9
0 20 40 60 80 100
Northern Europe
Denmark
Finland
Iceland
Norway
Sweden
Ireland and UK
Ireland
UK, England
UK, Northern Ireland
UK, Scotland
UK, Wales
Central Europe
Austria
Belgium
France
Germany
Switzerland
The Netherlands
Southern Europe
Croatia
Italy
Malta
Portugal
Slovenia
Spain
Eastern Europe
Bulgaria
Czech Republic
Estonia
Latvia
Lithuania
Poland
Slovakia
Europe
1-year
Number
of cases 5-year Conditional
73.5 72.1 75.03,828 ( )-Northern Europe 52.5 50.5 54.6( )- 71.5 69.1 73.9( )-
59.8 56.0 63.7600 ( )-Denmark 36.8 32.4 41.9( )- 61.6 55.1 69.0( )-
76.0 72.7 79.5644 ( )-Finland 56.0 51.2 61.2( )- 73.7 68.2 79.6( )-
77.5 64.7 92.944 ( )-Iceland 45.3 31.2 65.7( )- 58.4 42.2 80.8( )-
75.1 72.1 78.1821 ( )-Norway 55.0 50.8 59.4( )- 73.2 68.4 78.3( )-
76.2 74.2 78.31,719 ( )-Sweden 55.7 52.7 58.9( )- 73.0 69.5 76.7( )-
58.8 57.6 59.96,948 ( )-Ireland and UK 36.9 35.5 38.3( )- 62.8 60.7 64.9( )-
66.1 61.5 71.0383 ( )-Ireland 43.0 37.2 49.8( )- 65.1 57.3 73.9( )-
57.5 56.2 58.95,361 ( )-UK, England 36.4 34.9 38.1( )- 63.3 61.0 65.7( )-
57.1 50.3 64.7187 ( )-UK, Northern Ireland 34.6 26.9 44.5( )- 60.6 48.8 75.3( )-
63.8 60.1 67.8612 ( )-UK, Scotland 38.4 33.6 43.8( )- 60.1 53.4 67.6( )-
61.7 57.1 66.6405 ( )-UK, Wales 37.3 31.7 43.8( )- 60.4 52.4 69.6( )-
74.1 73.1 75.26,754 ( )-Central Europe 53.9 52.4 55.4( )- 72.7 70.9 74.5( )-
74.7 71.8 77.7889 ( )-Austria 54.6 50.6 59.0( )- 73.1 68.4 78.1( )-
75.1 72.2 78.1841 ( )-Belgium 55.8 51.7 60.3( )- 74.3 69.6 79.4( )-
74.4 71.3 77.5802 ( )-France 50.8 47.0 55.0( )- 68.4 63.9 73.1( )-
77.2 75.4 79.12,151 ( )-Germany 57.7 54.9 60.7( )- 74.7 71.5 78.1( )-
78.9 74.7 83.4348 ( )-Switzerland 58.6 52.4 65.4( )- 74.2 67.4 81.6( )-
68.5 66.3 70.81,723 ( )-The Netherlands 48.9 46.0 52.1( )- 71.4 67.7 75.4( )-
66.2 64.7 67.73,677 ( )-Southern Europe 46.8 44.9 48.7( )- 70.6 68.3 73.1( )-
53.3 47.9 59.4286 ( )-Croatia 42.3 35.4 50.6( )- 79.4 68.8 91.5( )-
69.7 67.8 71.62,206 ( )-Italy 49.0 46.7 51.6( )- 70.4 67.5 73.4( )-
68.7 51.2 92.230 ( )-Malta 23.5 13.4 40.9( )- 34.1 21.3 54.7( )-
62.3 58.6 66.2626 ( )-Portugal 42.4 38.0 47.3( )- 68.1 62.1 74.6( )-
64.5 57.6 72.2158 ( )-Slovenia 44.4 36.1 54.8( )- 68.9 57.8 82.2( )-
61.5 56.8 66.6371 ( )-Spain 45.4 40.1 51.3( )- 73.7 67.2 81.0( )-
61.4 59.2 63.62,071 ( )-Eastern Europe 43.0 40.1 46.0( )- 70.0 66.1 74.2( )-
55.5 49.1 62.8262 ( )-Bulgaria 36.6 28.5 46.8( )- 65.9 53.1 81.7( )-
64.6 61.5 67.9890 ( )-Czech Republic 47.4 43.1 52.2( )- 73.4 67.6 79.7( )-
64.4 54.6 76.087 ( )-Estonia 42.2 29.7 60.1( )- 65.5 48.0 89.6( )-
53.7 44.3 65.1101 ( )-Latvia 39.6 28.7 54.6( )- 73.7 56.9 95.3( )-
56.8 49.4 65.2161 ( )-Lithuania 32.5 24.8 42.7( )- 57.3 45.3 72.3( )-
58.3 52.0 65.3229 ( )-Poland 40.0 32.7 49.0( )- 68.7 58.0 81.3( )-
63.2 58.1 68.9341 ( )-Slovakia 46.3 39.8 53.9( )- 73.2 64.5 83.0( )-
67.9 67.0 68.923,278 ( )-Europe 47.9 46.7 49.1( )- 70.5 69.0 72.0( )-
Men (54%)
816 obs 84.4 68.1 63.915-44
rel 84.5 68.5 64.6
1,663 obs 81.3 65.8 58.345-54
rel 81.7 66.9 60.1
2,977 obs 72.5 55.9 46.855-64
rel 73.3 58.1 50.0
3,729 obs 65.4 47.3 39.165-74
rel 67.3 51.7 46.0
3,416 obs 47.7 27.3 22.675+
rel 52.0 35.5 35.9
12,601 obs 65.1 47.1 40.1All cases
rel 67.2 51.5 47.0
Women (46%)
674 obs 89.1 78.4 71.715-44
rel 89.2 78.6 72.1
1,093 obs 84.5 71.3 62.445-54
rel 84.7 71.9 63.3
2,164 obs 77.7 63.6 57.455-64
rel 78.1 64.7 59.3
2,848 obs 67.8 51.7 43.765-74
rel 68.8 54.1 47.6
3,897 obs 47.8 30.1 24.375+
rel 51.0 36.5 33.9
10,676 obs 67.8 52.4 45.4All cases
rel 69.1 55.3 49.9