Embed Size (px)
Citation preview
© NAPA
www.napa.fi
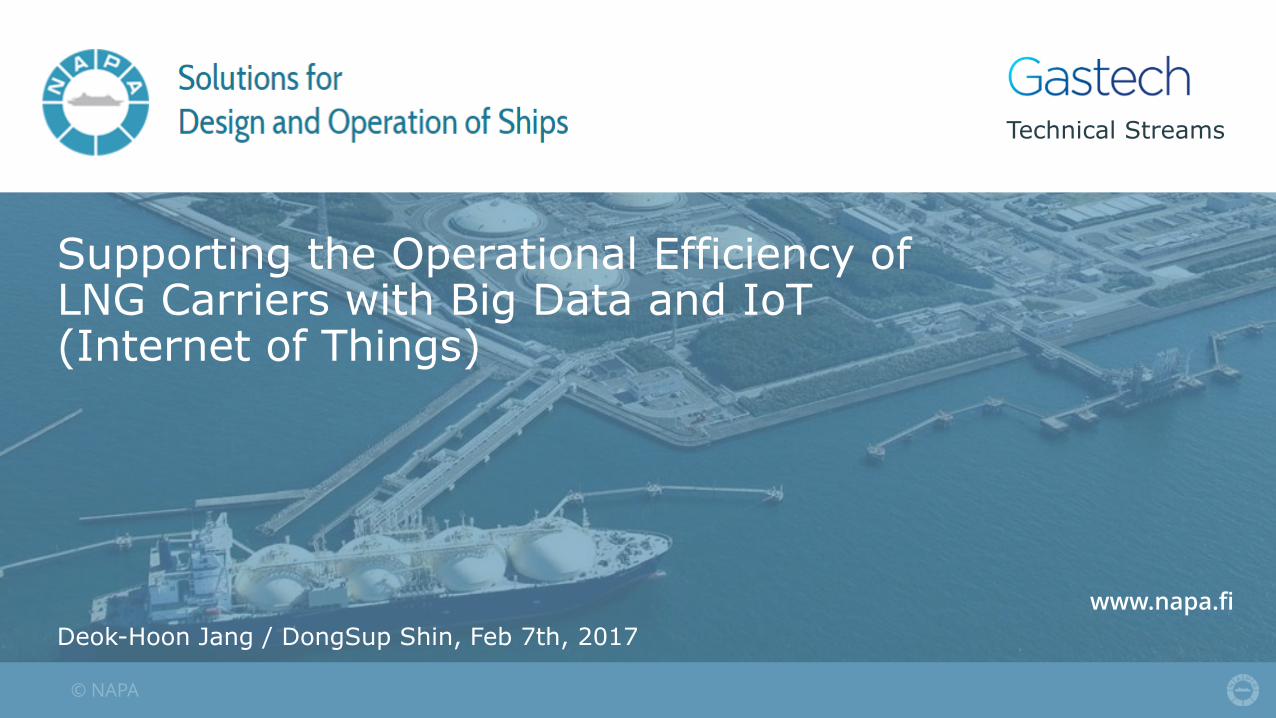
Supporting the Operational Efficiency of LNG Carriers with Big Data and IoT(Internet of Things)
Deok-Hoon Jang / DongSup Shin, Feb 7th, 2017
Technical Streams
© NAPA2
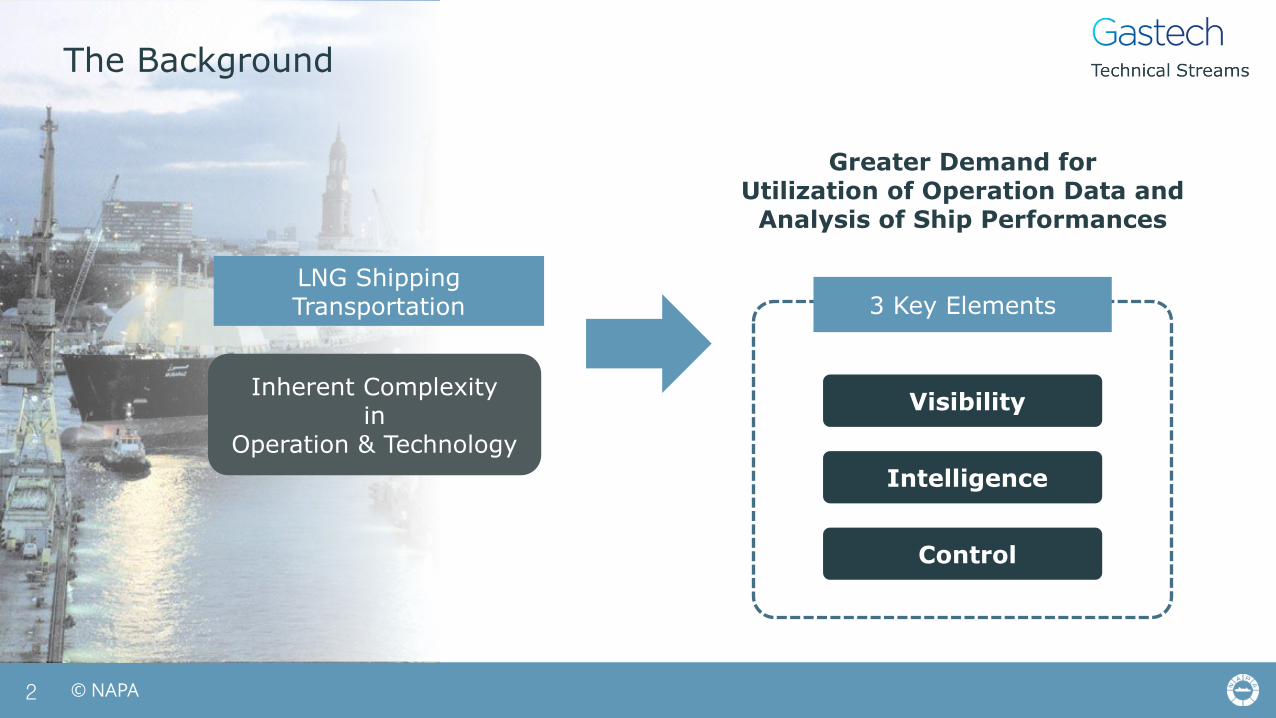
Visibility
Intelligence
Control
Inherent Complexity in
Operation & Technology
LNG Shipping Transportation
The Background
Greater Demand forUtilization of Operation Data and
Analysis of Ship Performances
3 Key Elements
© NAPA
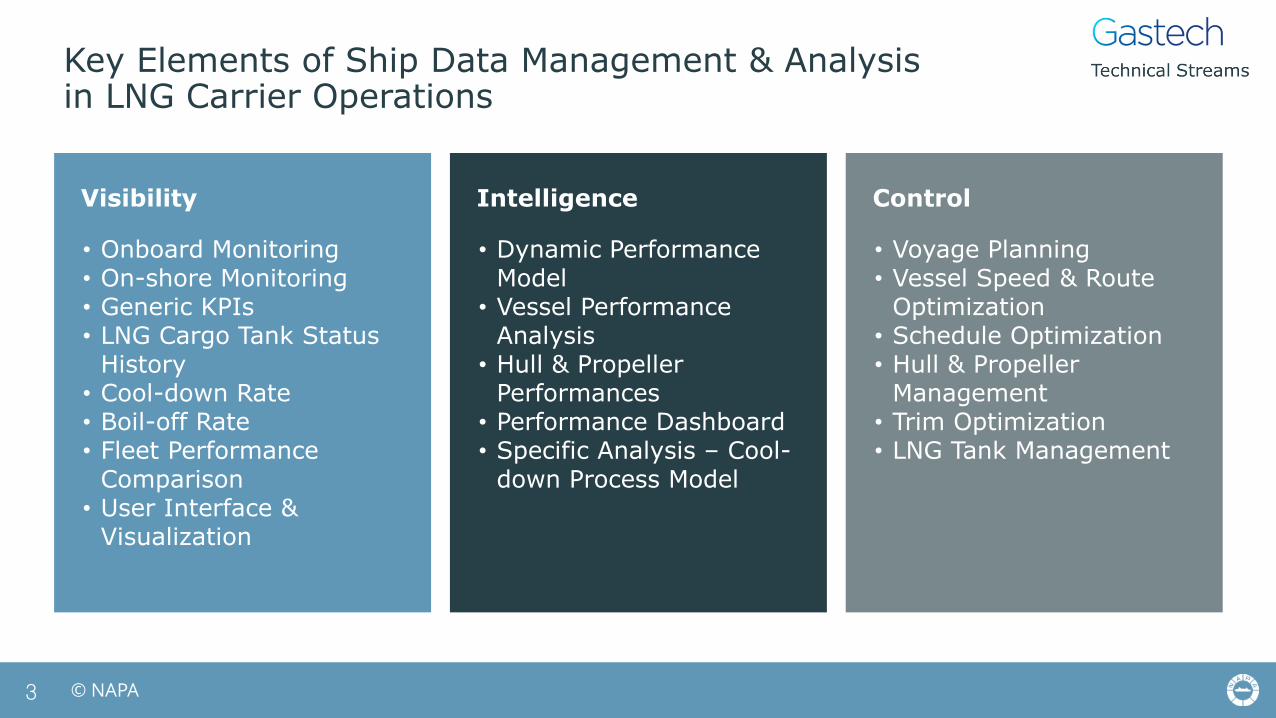
Key Elements of Ship Data Management & Analysisin LNG Carrier Operations
Visibility ControlIntelligence
• Onboard Monitoring• On-shore Monitoring• Generic KPIs• LNG Cargo Tank Status
History• Cool-down Rate• Boil-off Rate• Fleet Performance
Comparison• User Interface &
Visualization
• Dynamic Performance Model
• Vessel Performance Analysis
• Hull & Propeller Performances
• Performance Dashboard• Specific Analysis – Cool-
down Process Model
• Voyage Planning• Vessel Speed & Route
Optimization• Schedule Optimization• Hull & Propeller
Management• Trim Optimization• LNG Tank Management
3
© NAPA
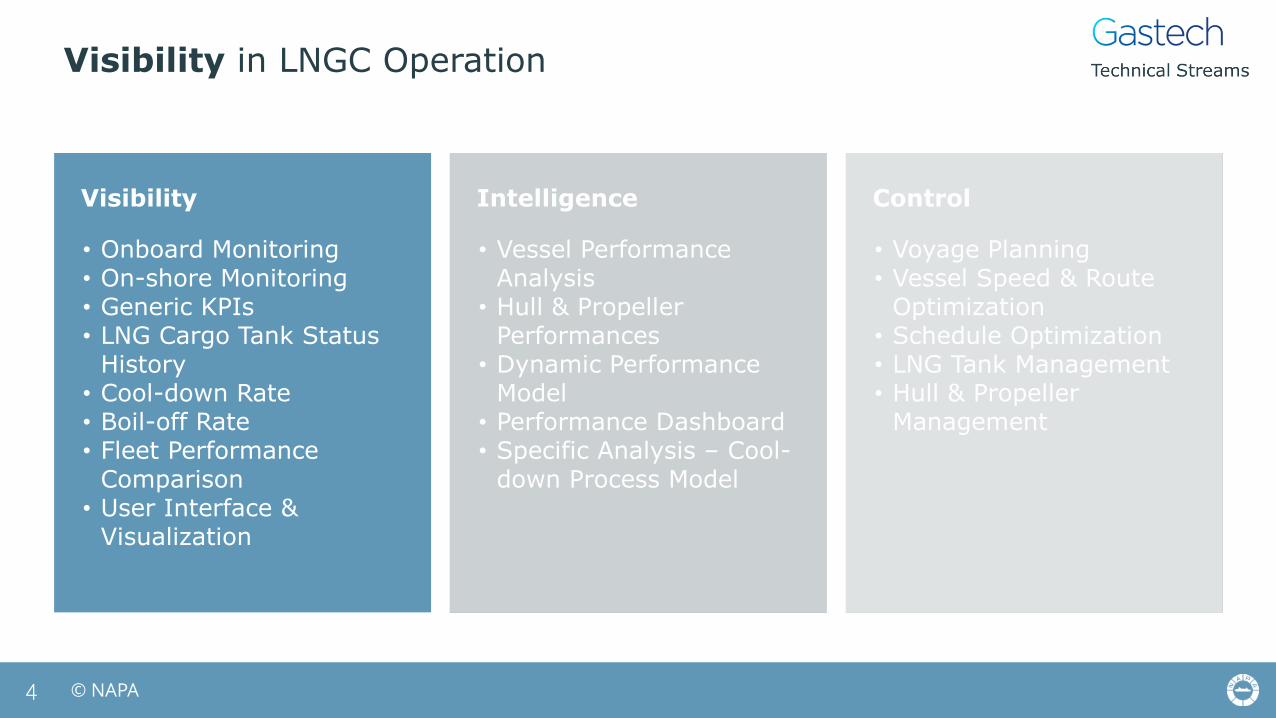
Visibility in LNGC Operation
Visibility ControlIntelligence
• Onboard Monitoring• On-shore Monitoring• Generic KPIs• LNG Cargo Tank Status
History• Cool-down Rate• Boil-off Rate• Fleet Performance
Comparison• User Interface &
Visualization
• Vessel Performance Analysis
• Hull & Propeller Performances
• Dynamic Performance Model
• Performance Dashboard• Specific Analysis – Cool-
down Process Model
• Voyage Planning• Vessel Speed & Route
Optimization• Schedule Optimization• LNG Tank Management• Hull & Propeller
Management
4
© NAPA
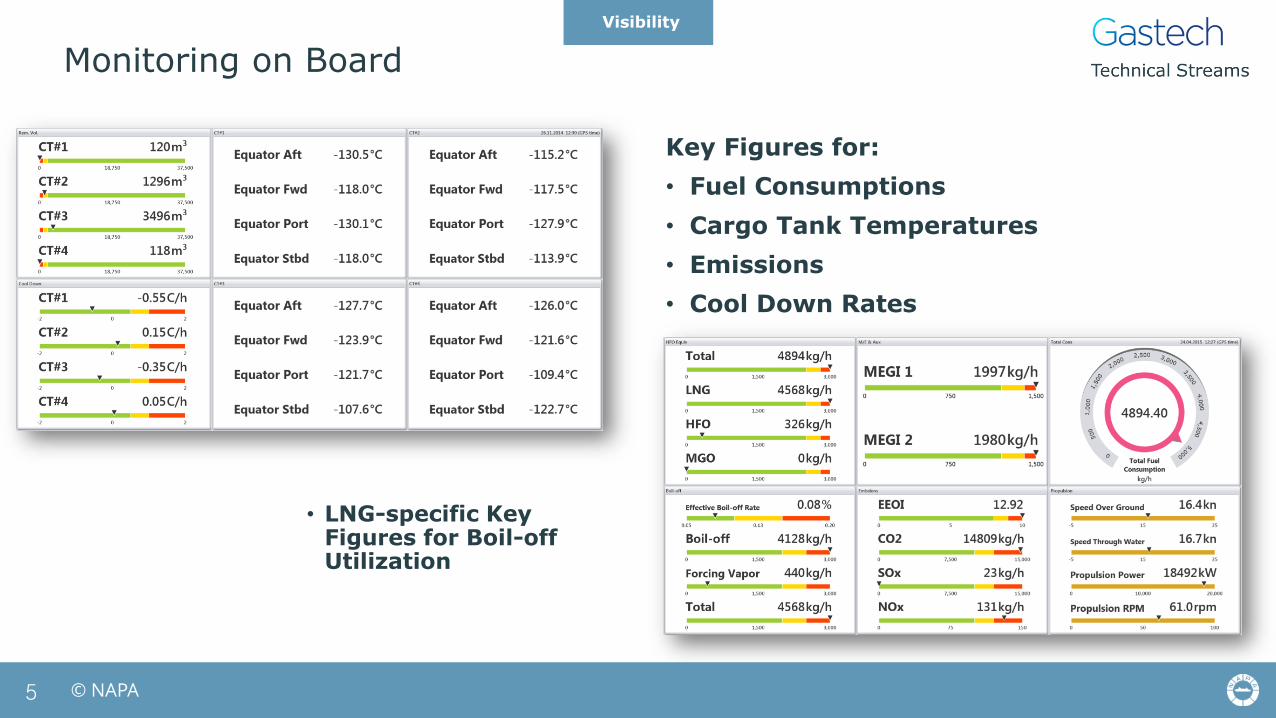
Monitoring on Board
5
Visibility
Key Figures for:
• Fuel Consumptions
• Cargo Tank Temperatures
• Emissions
• Cool Down Rates
• LNG-specific Key Figures for Boil-off Utilization
© NAPA
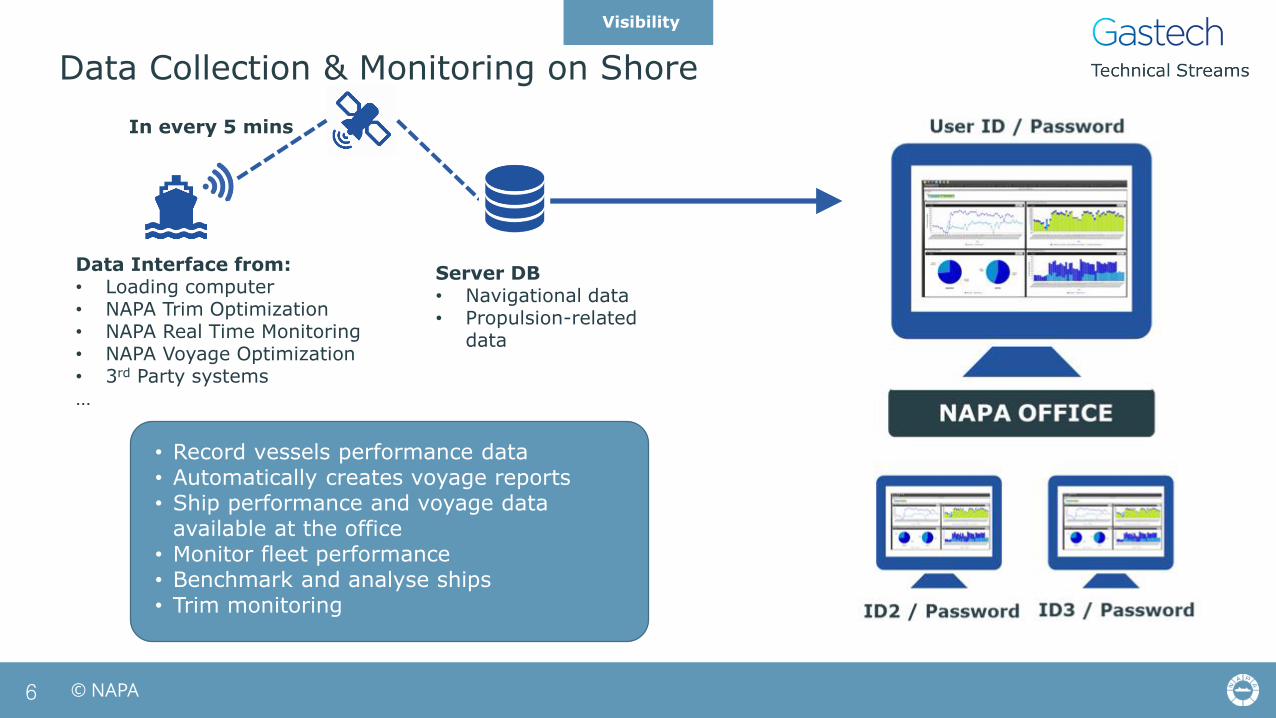
Data Collection & Monitoring on Shore
6
Data Interface from:• Loading computer• NAPA Trim Optimization• NAPA Real Time Monitoring• NAPA Voyage Optimization• 3rd Party systems…
Server DB• Navigational data• Propulsion-related
data
• Record vessels performance data • Automatically creates voyage reports• Ship performance and voyage data
available at the office• Monitor fleet performance • Benchmark and analyse ships• Trim monitoring
In every 5 mins
Visibility
© NAPA
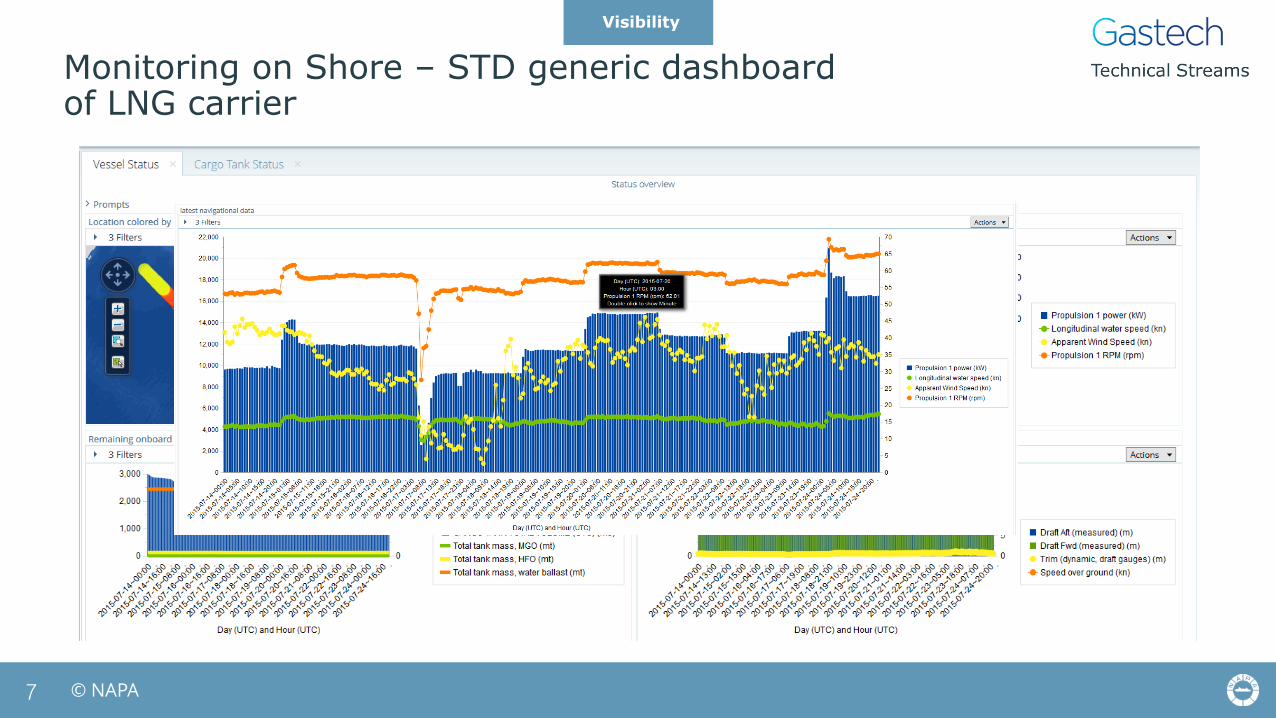
Monitoring on Shore – STD generic dashboard of LNG carrier
7
Visibility
© NAPA
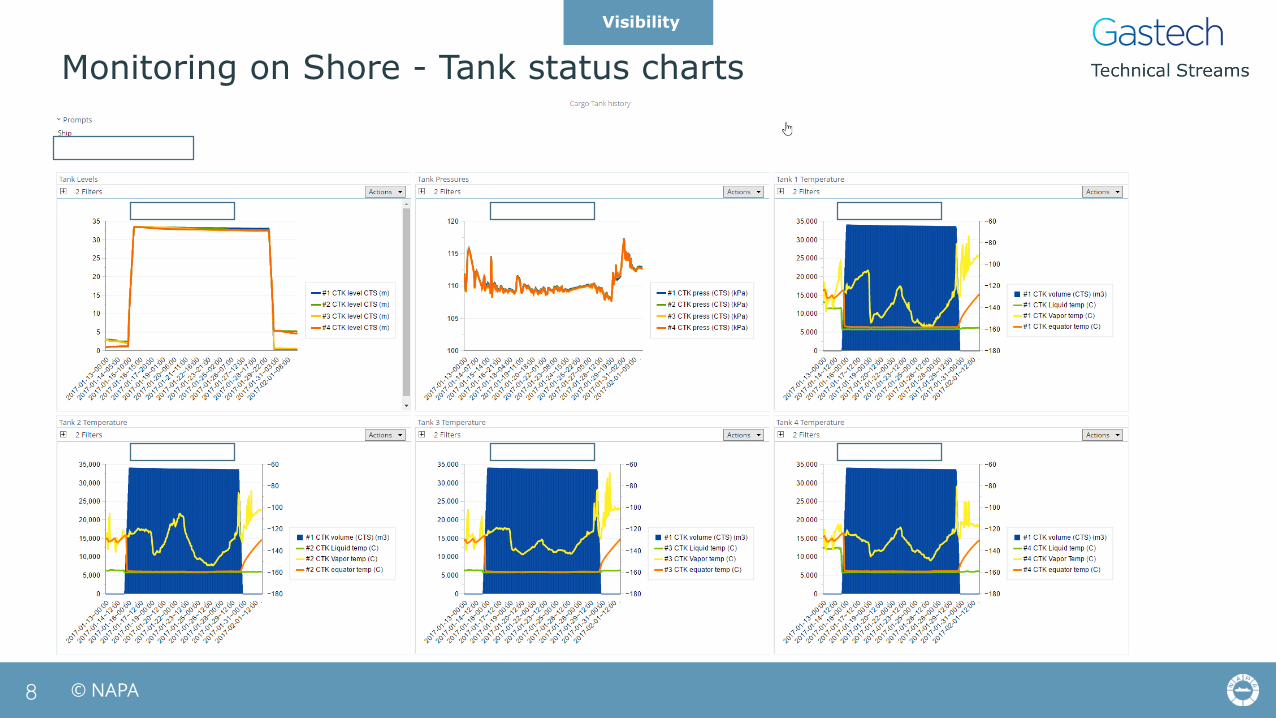
Monitoring on Shore - Tank status charts
8
Visibility
© NAPA
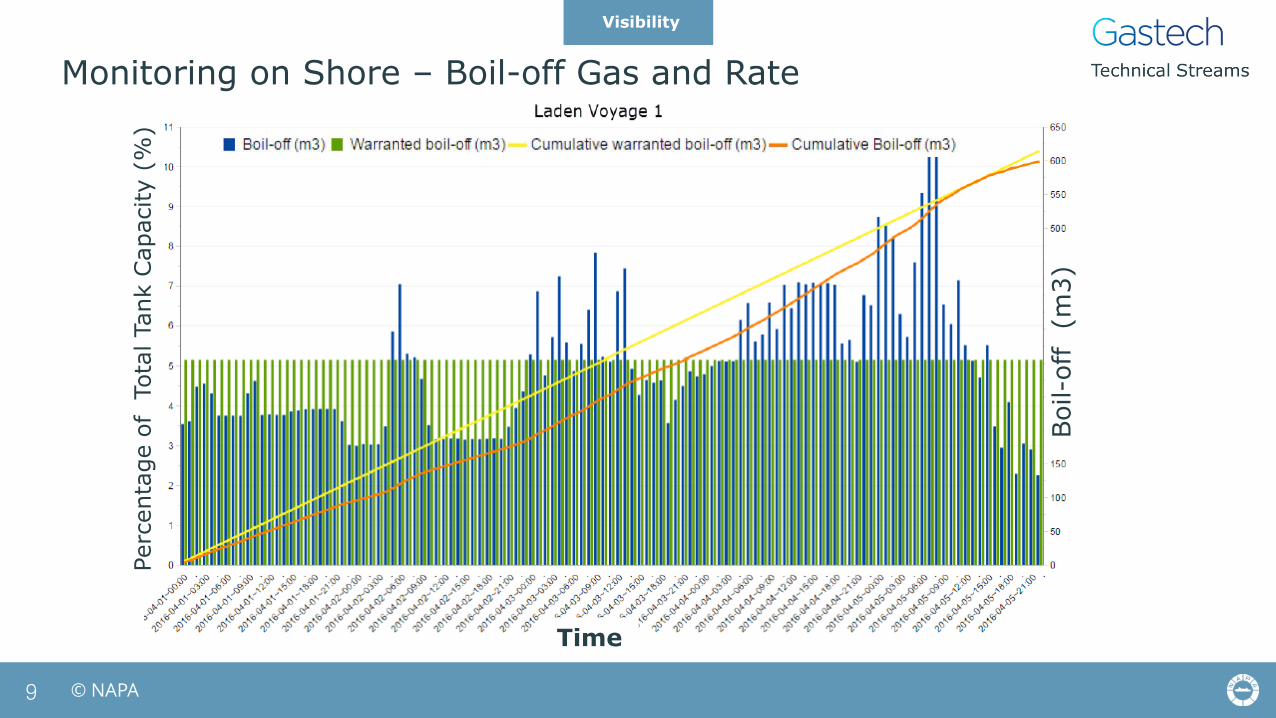
Monitoring on Shore – Boil-off Gas and Rate
9
Visibility
Time
Boil-o
ff (m
3)
Perc
enta
ge o
f T
ota
l Tank C
apacity (
%)
© NAPA
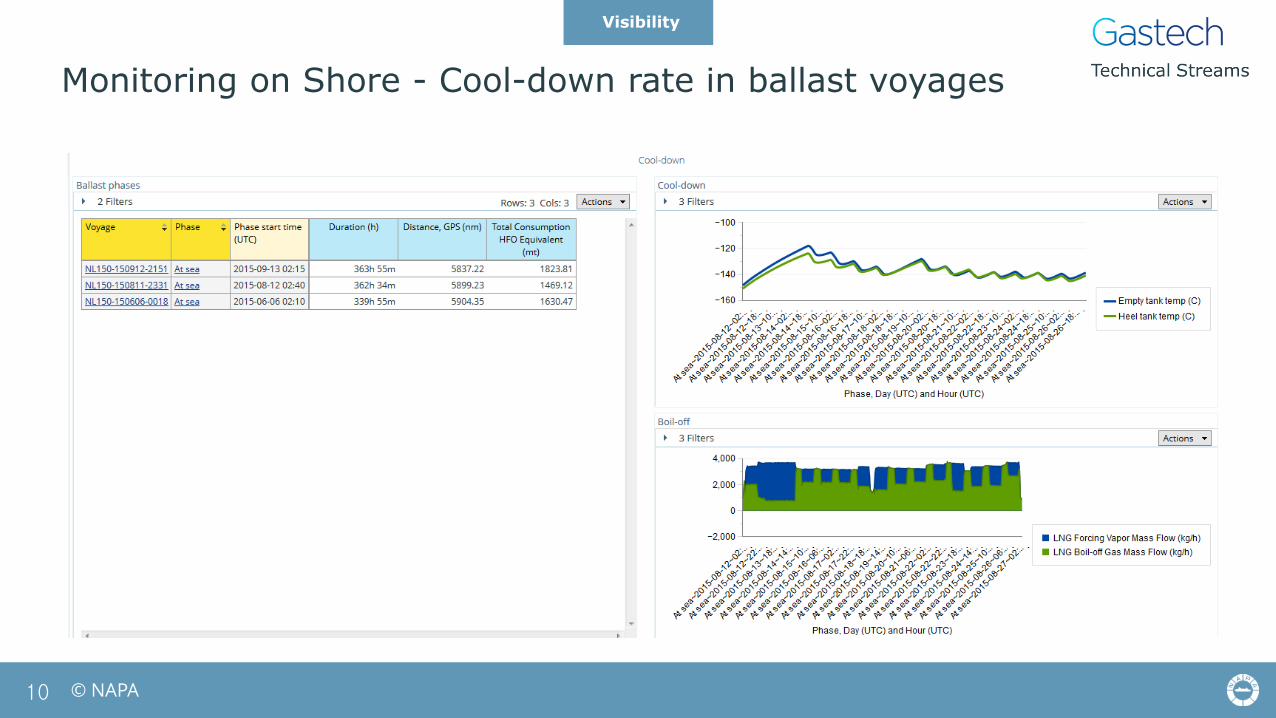
Monitoring on Shore - Cool-down rate in ballast voyages
10
Visibility
© NAPA
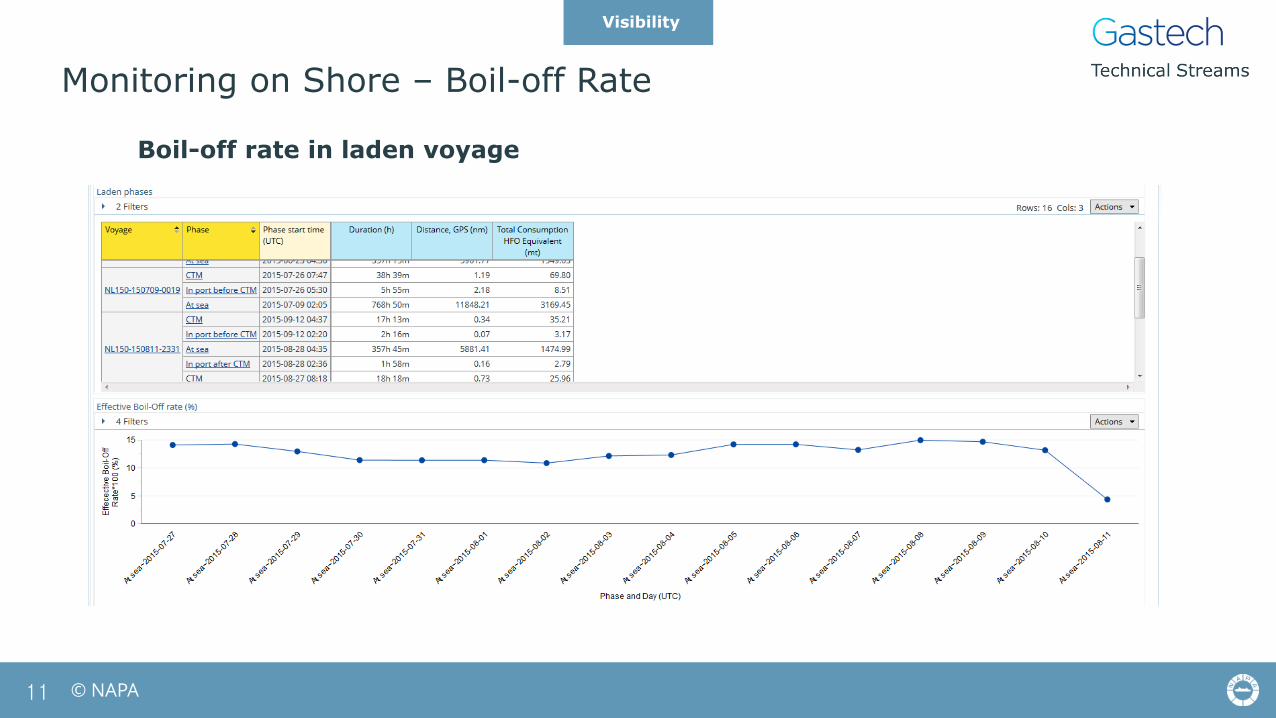
Monitoring on Shore – Boil-off Rate
11
Visibility
Boil-off rate in laden voyage
© NAPA12
Visibility
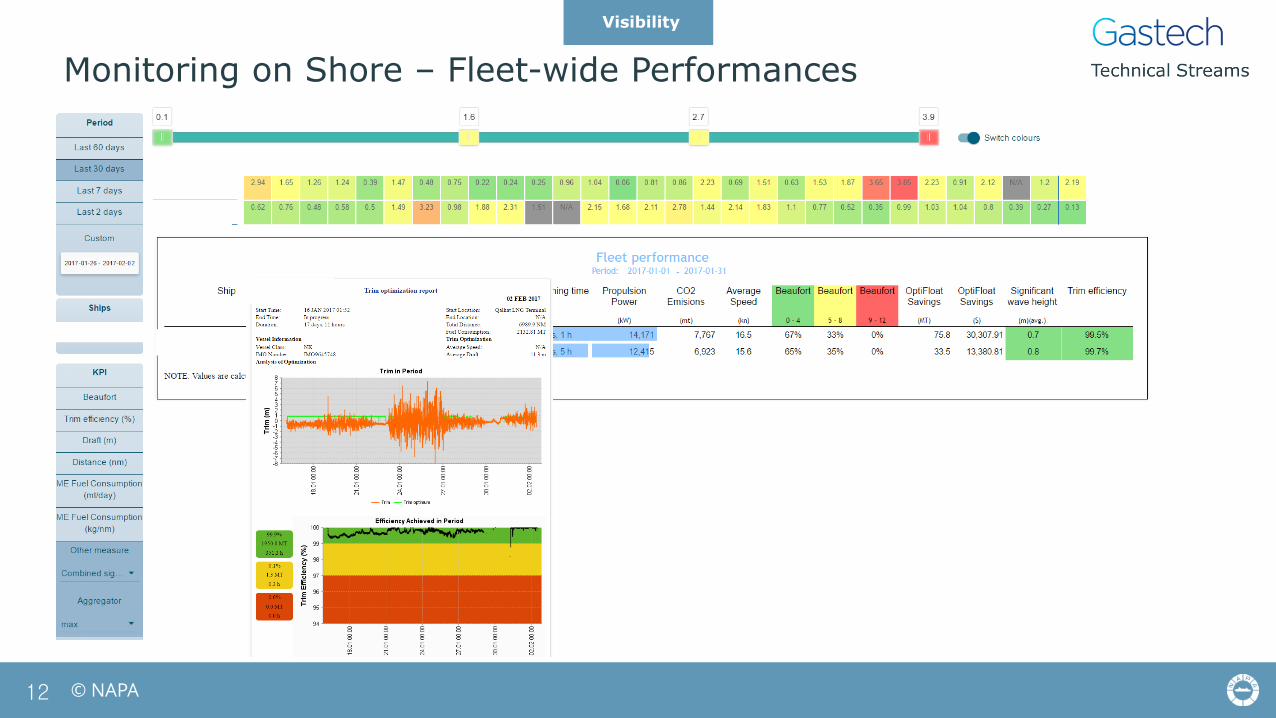
Monitoring on Shore – Fleet-wide Performances
© NAPA
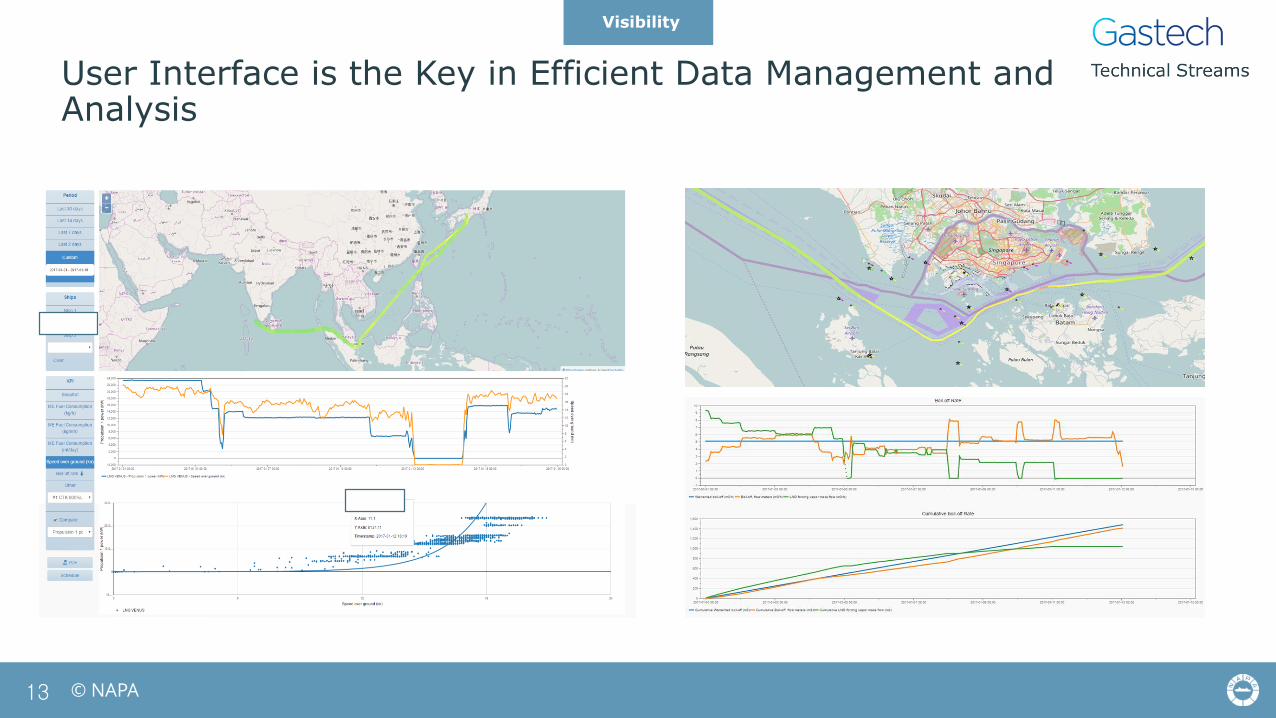
User Interface is the Key in Efficient Data Management and Analysis
13
Visibility
© NAPA
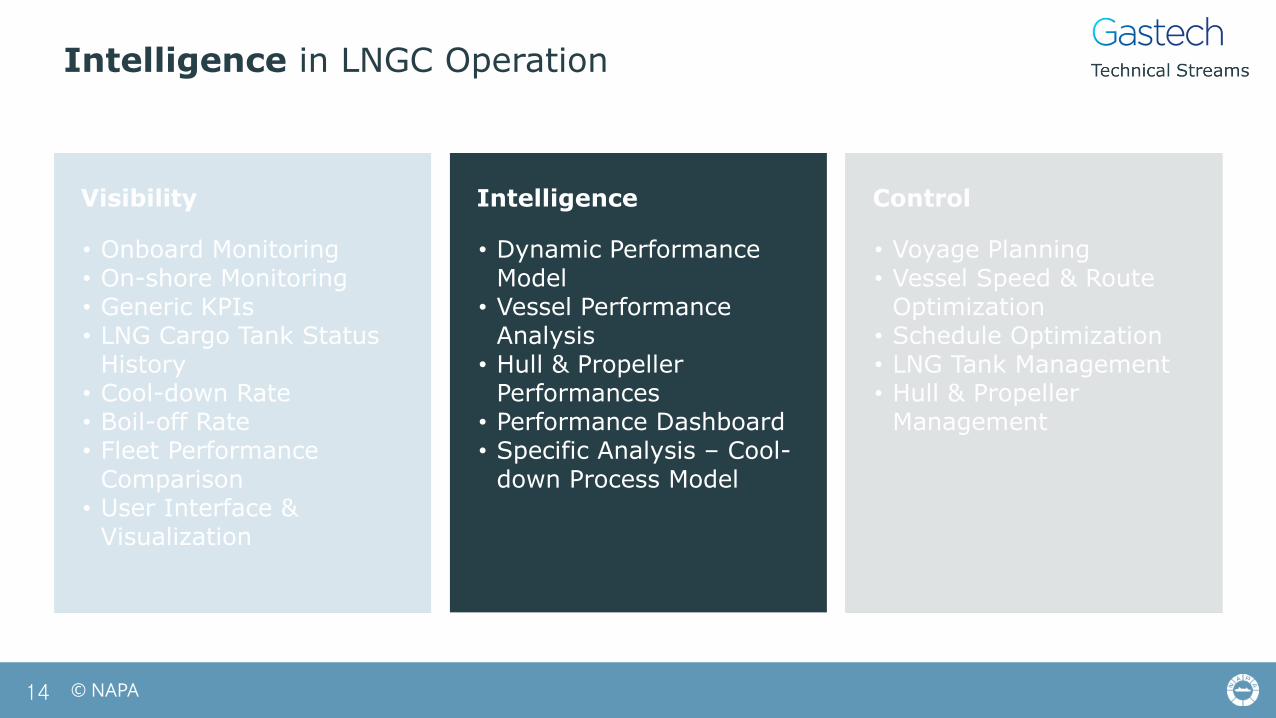
Intelligence in LNGC Operation
Visibility ControlIntelligence
• Onboard Monitoring• On-shore Monitoring• Generic KPIs• LNG Cargo Tank Status
History• Cool-down Rate• Boil-off Rate• Fleet Performance
Comparison• User Interface &
Visualization
• Dynamic Performance Model
• Vessel Performance Analysis
• Hull & Propeller Performances
• Performance Dashboard• Specific Analysis – Cool-
down Process Model
• Voyage Planning• Vessel Speed & Route
Optimization• Schedule Optimization• LNG Tank Management• Hull & Propeller
Management
14
© NAPA
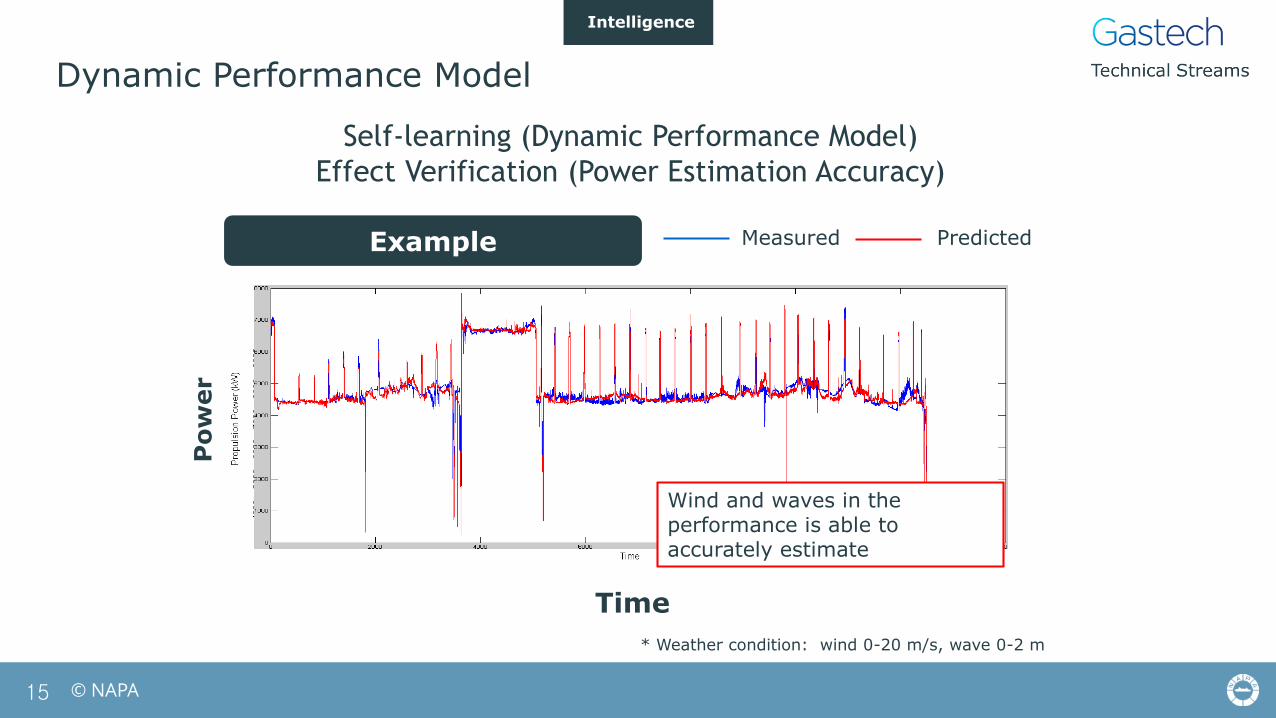
Dynamic Performance Model
15
Measured Predicted
Self-learning (Dynamic Performance Model)
Effect Verification (Power Estimation Accuracy)
Time
Po
wer
Wind and waves in the performance is able to accurately estimate
* Weather condition: wind 0-20 m/s, wave 0-2 m
Example
Intelligence
© NAPA
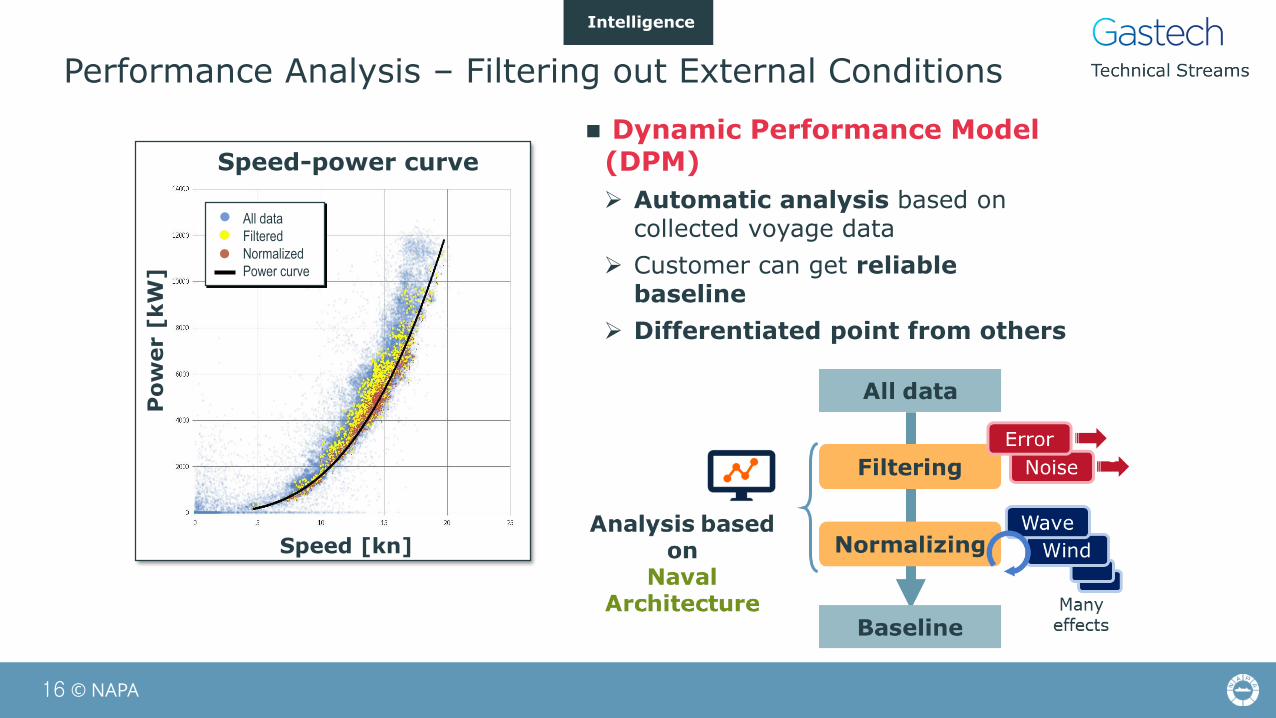
Performance Analysis – Filtering out External Conditions
16
Dynamic Performance Model (DPM)
Automatic analysis based on collected voyage data
Customer can get reliable baseline
Differentiated point from others
Speed [kn]
Po
wer [
kW
]Speed-power curve
All data
Filtered
Normalized
Power curve
Intelligence
© NAPA
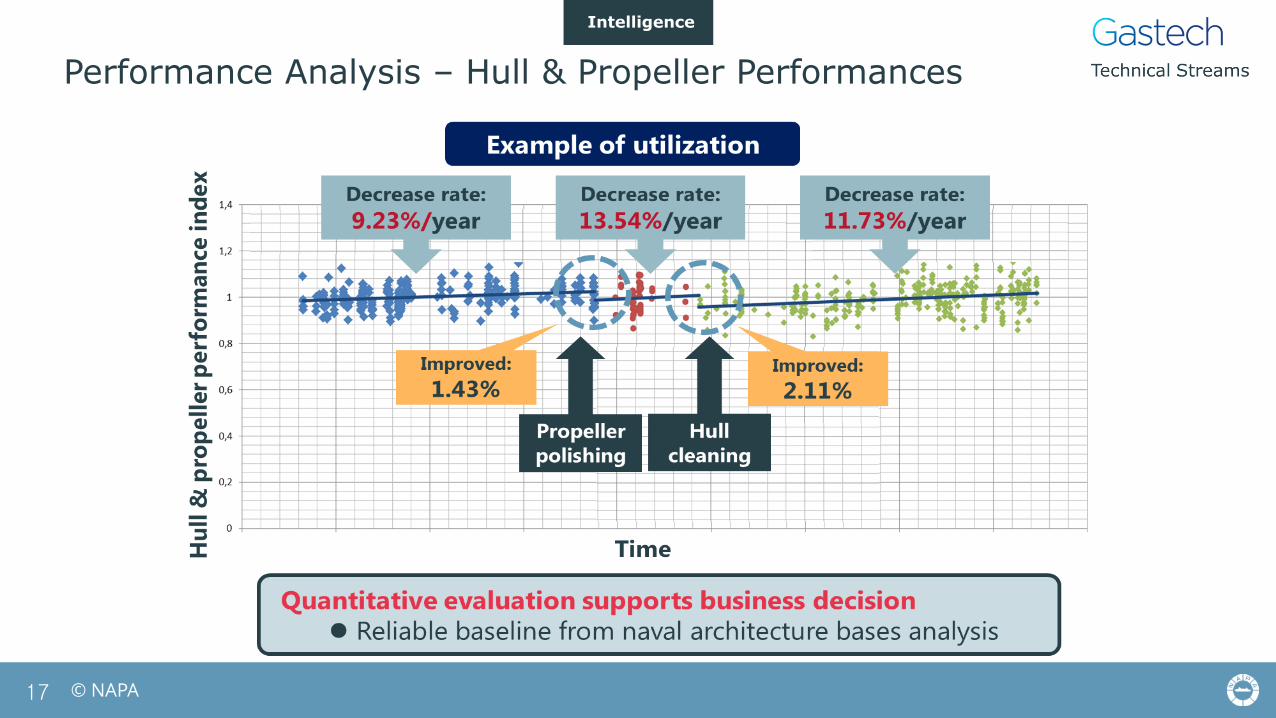
Performance Analysis – Hull & Propeller Performances
17
Intelligence
© NAPA18
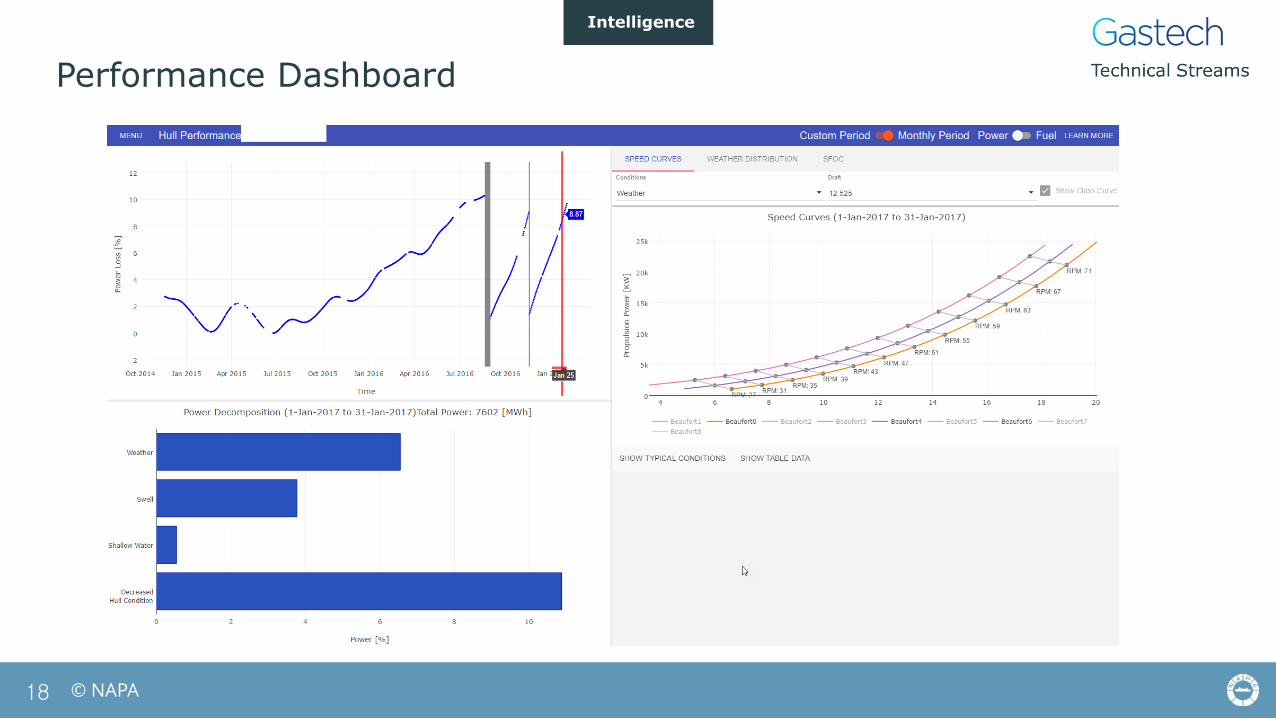
Performance Dashboard
Intelligence
© NAPA19
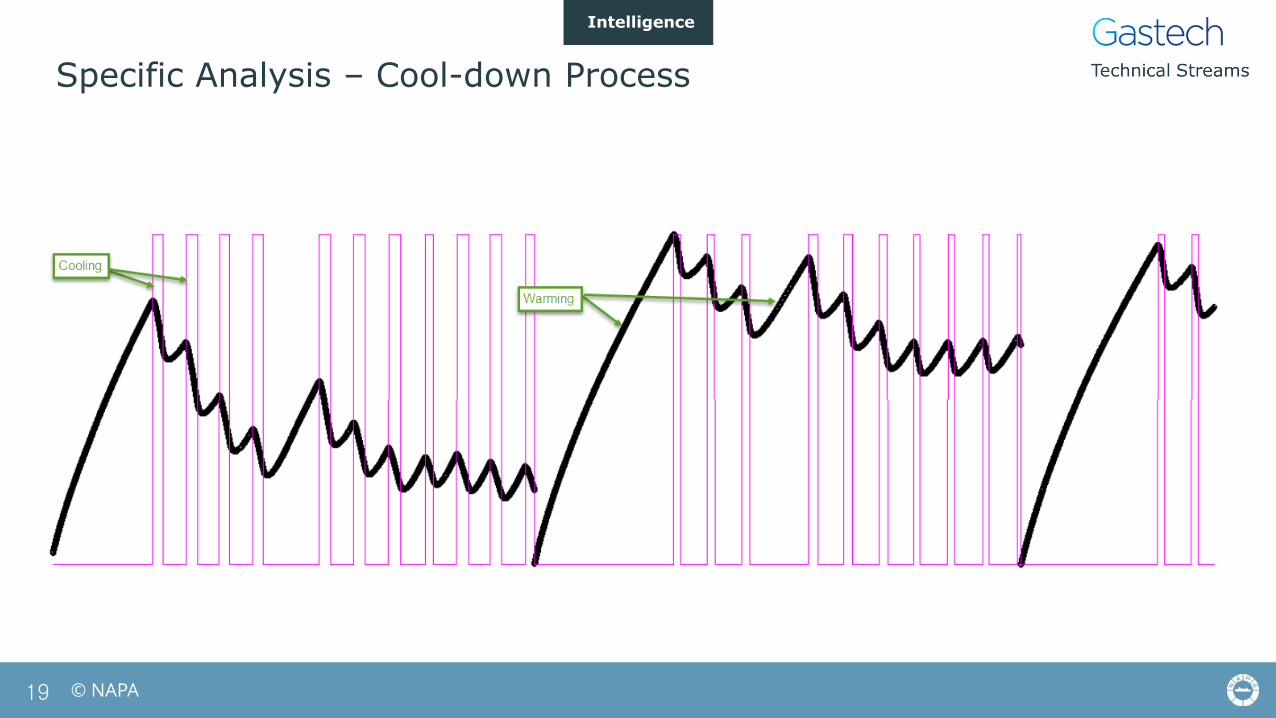
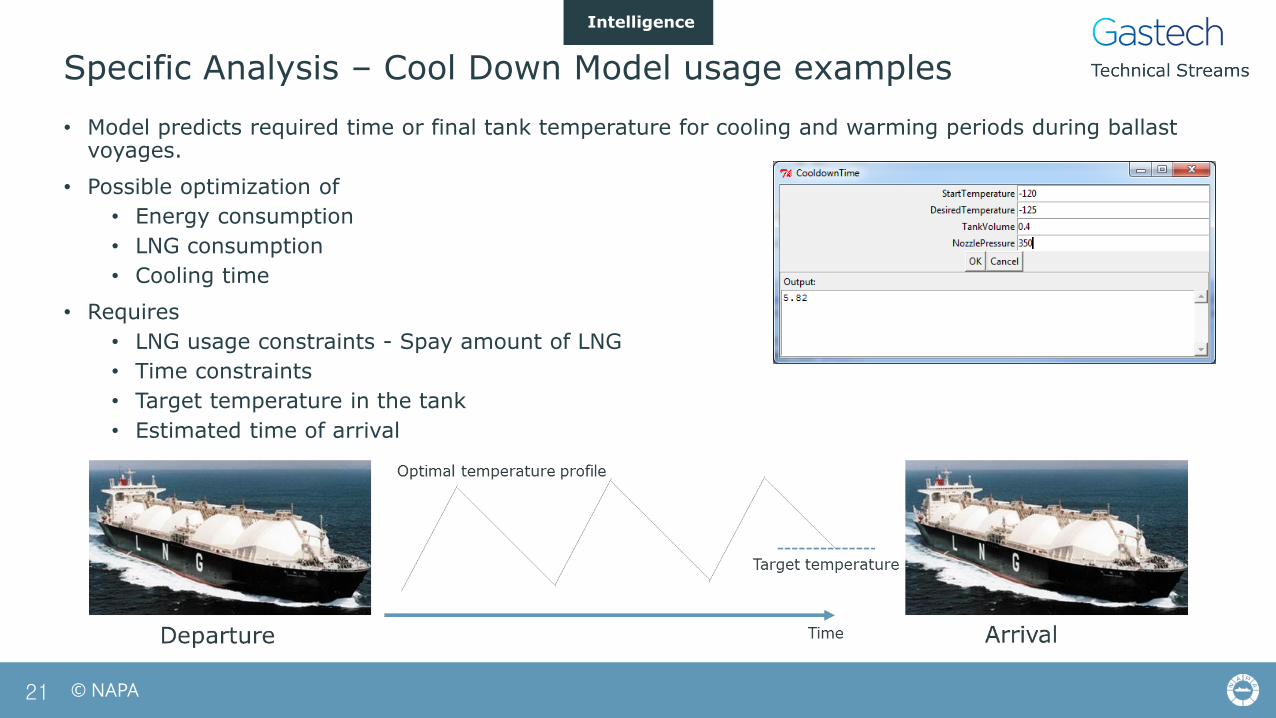
Specific Analysis – Cool-down Process
Intelligence
© NAPA20
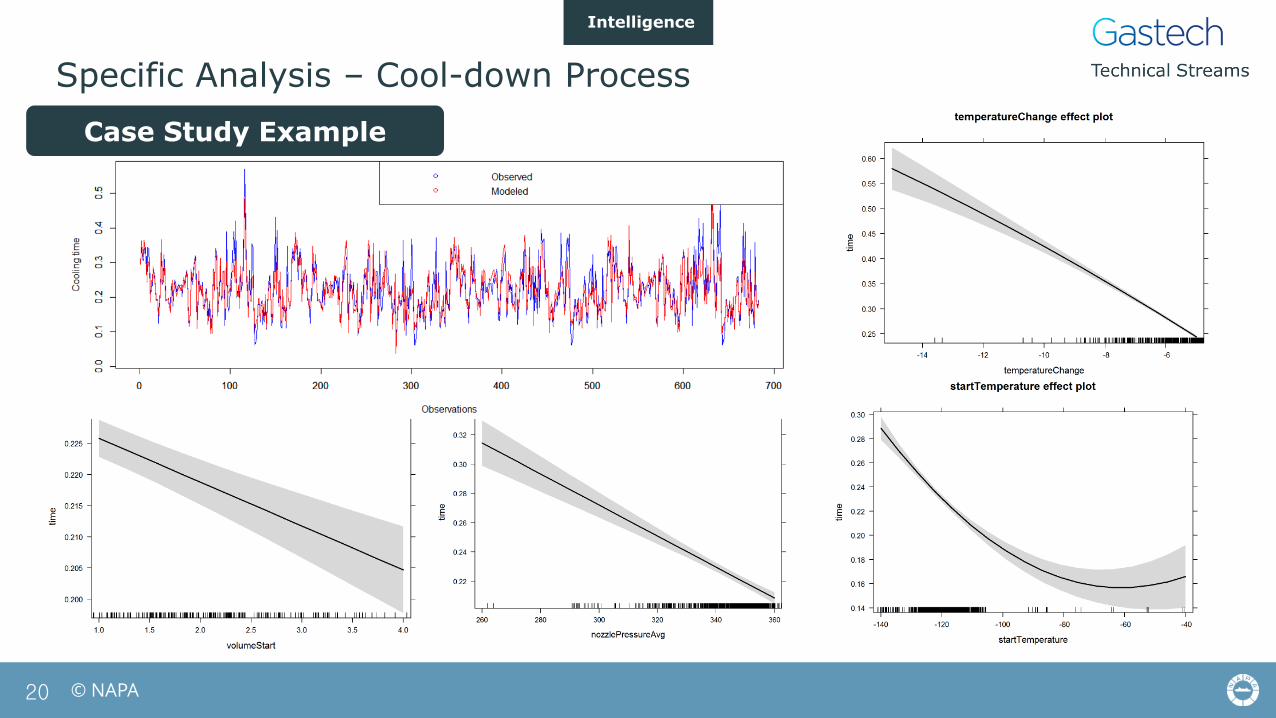
Specific Analysis – Cool-down Process
Intelligence
Case Study Example
© NAPA
• Model predicts required time or final tank temperature for cooling and warming periods during ballast voyages.
• Possible optimization of
• Energy consumption
• LNG consumption
• Cooling time
• Requires
• LNG usage constraints - Spay amount of LNG
• Time constraints
• Target temperature in the tank
• Estimated time of arrival
Specific Analysis – Cool Down Model usage examples
21
Intelligence
© NAPA
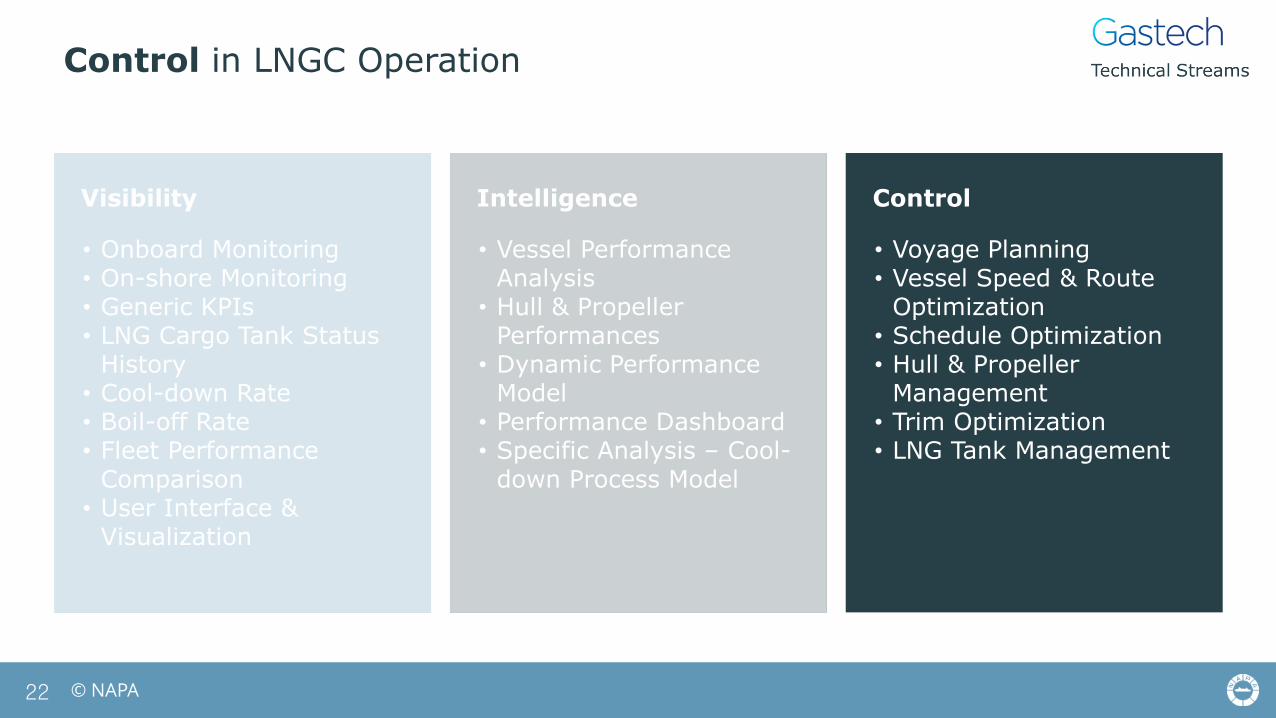
Control in LNGC Operation
Visibility ControlIntelligence
• Onboard Monitoring• On-shore Monitoring• Generic KPIs• LNG Cargo Tank Status
History• Cool-down Rate• Boil-off Rate• Fleet Performance
Comparison• User Interface &
Visualization
• Vessel Performance Analysis
• Hull & Propeller Performances
• Dynamic Performance Model
• Performance Dashboard• Specific Analysis – Cool-
down Process Model
• Voyage Planning• Vessel Speed & Route
Optimization• Schedule Optimization• Hull & Propeller
Management• Trim Optimization• LNG Tank Management
22
© NAPA
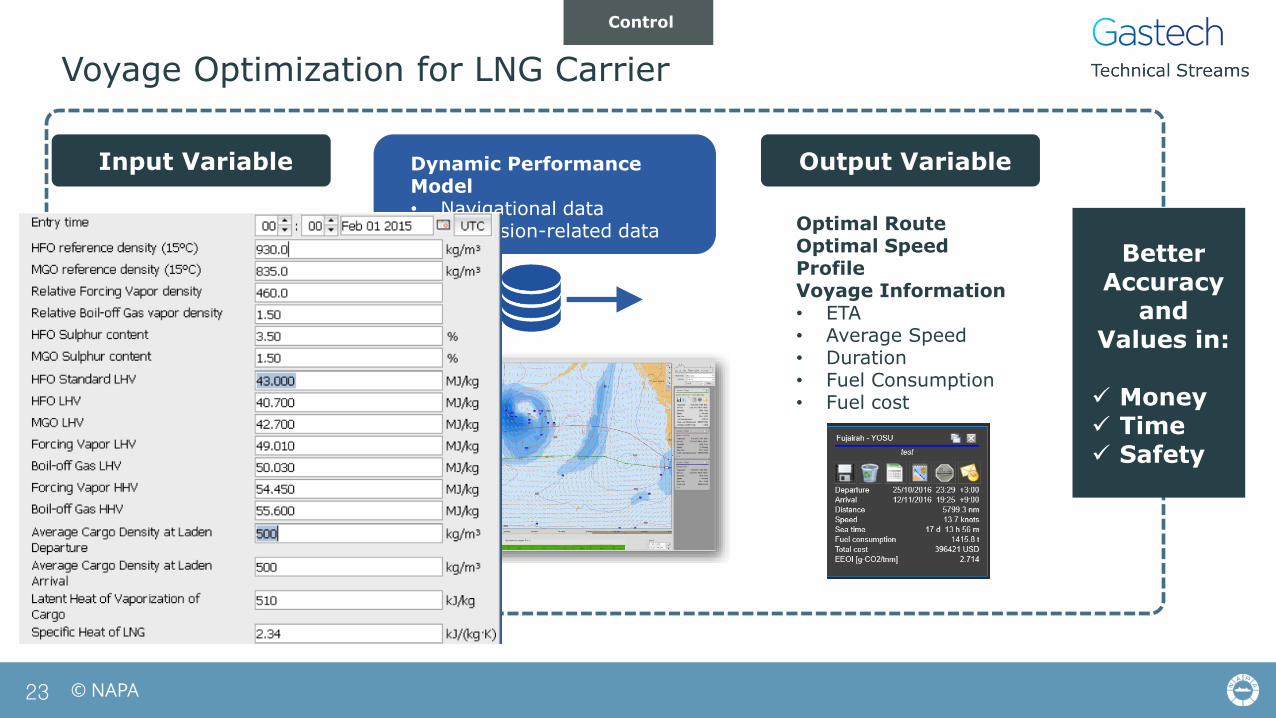
Voyage Optimization for LNG Carrier
23
Input Variable
Manual:• Vessel Information• Route Plan• Schedule (ETD, ETA)
Dynamic Performance Model• Navigational data• Propulsion-related data
Auto:• Weather Information
Output Variable
Optimal RouteOptimal Speed ProfileVoyage Information• ETA• Average Speed• Duration• Fuel Consumption• Fuel cost
Control
Better Accuracy
andValues in:
Money Time Safety
© NAPA
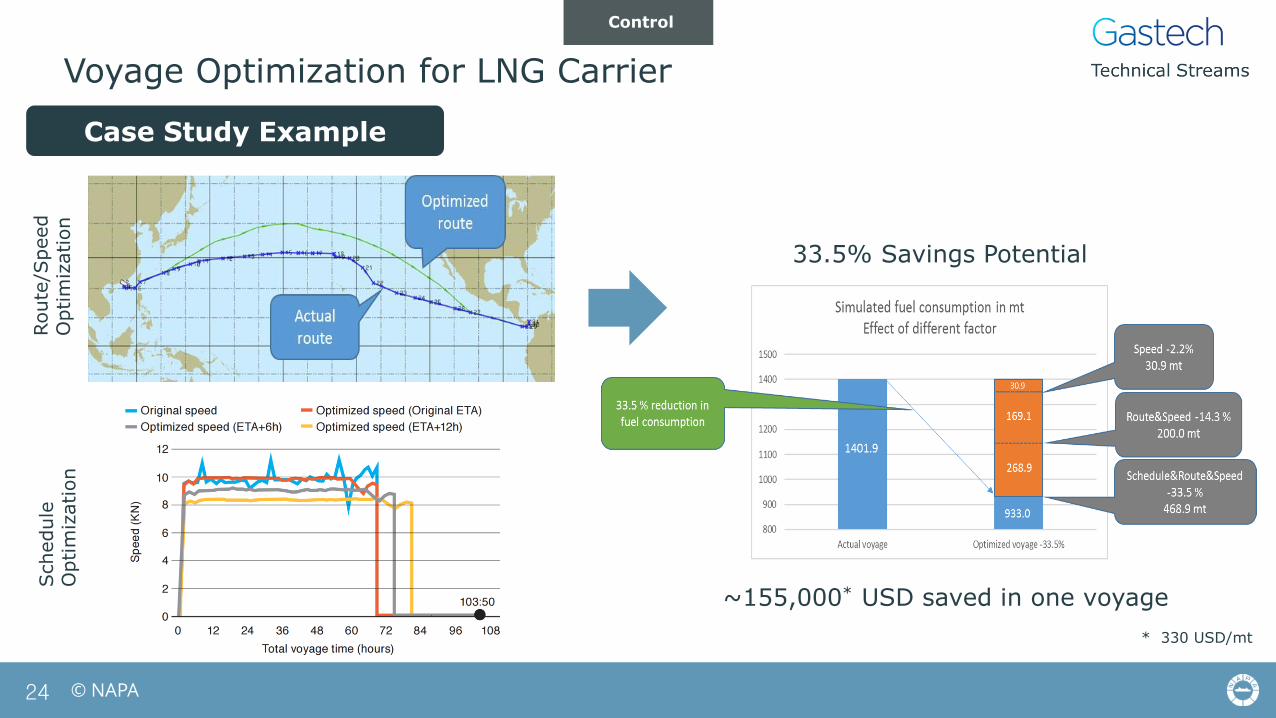
Voyage Optimization for LNG Carrier
24
Case Study Example
Route
/Speed
Optim
ization
Schedule
O
ptim
ization
33.5% Savings Potential
Control
~155,000* USD saved in one voyage
* 330 USD/mt
© NAPA
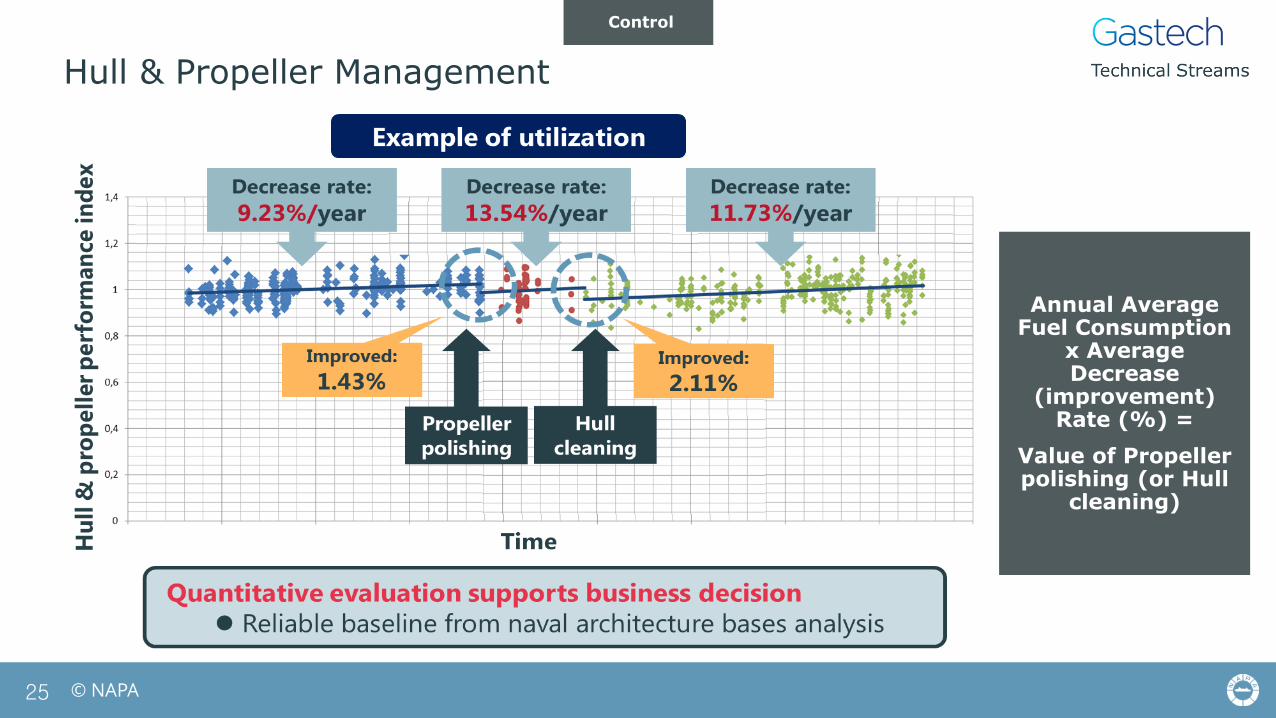
Hull & Propeller Management
25
Control
Annual Average Fuel Consumption
x Average Decrease
(improvement) Rate (%) =
Value of Propeller polishing (or Hull
cleaning)
© NAPA
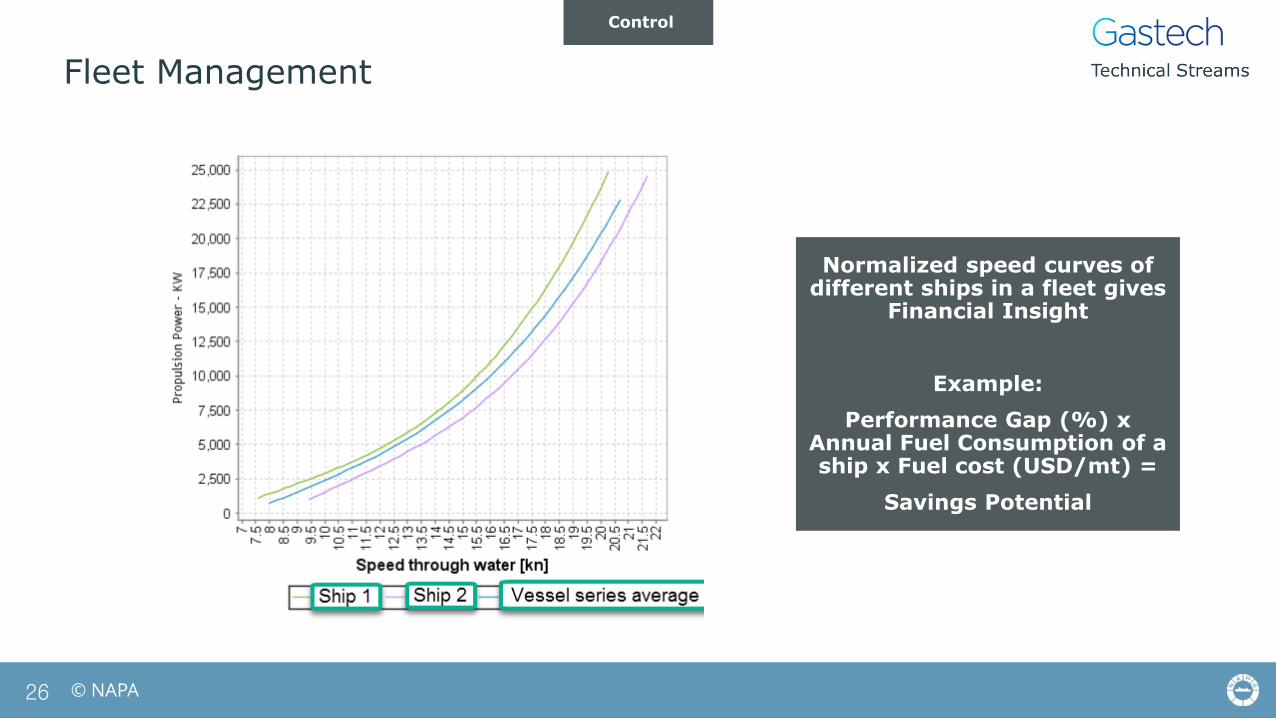
Fleet Management
26
Control
Normalized speed curves of different ships in a fleet gives
Financial Insight
Example:
Performance Gap (%) x Annual Fuel Consumption of a ship x Fuel cost (USD/mt) =
Savings Potential
© NAPA
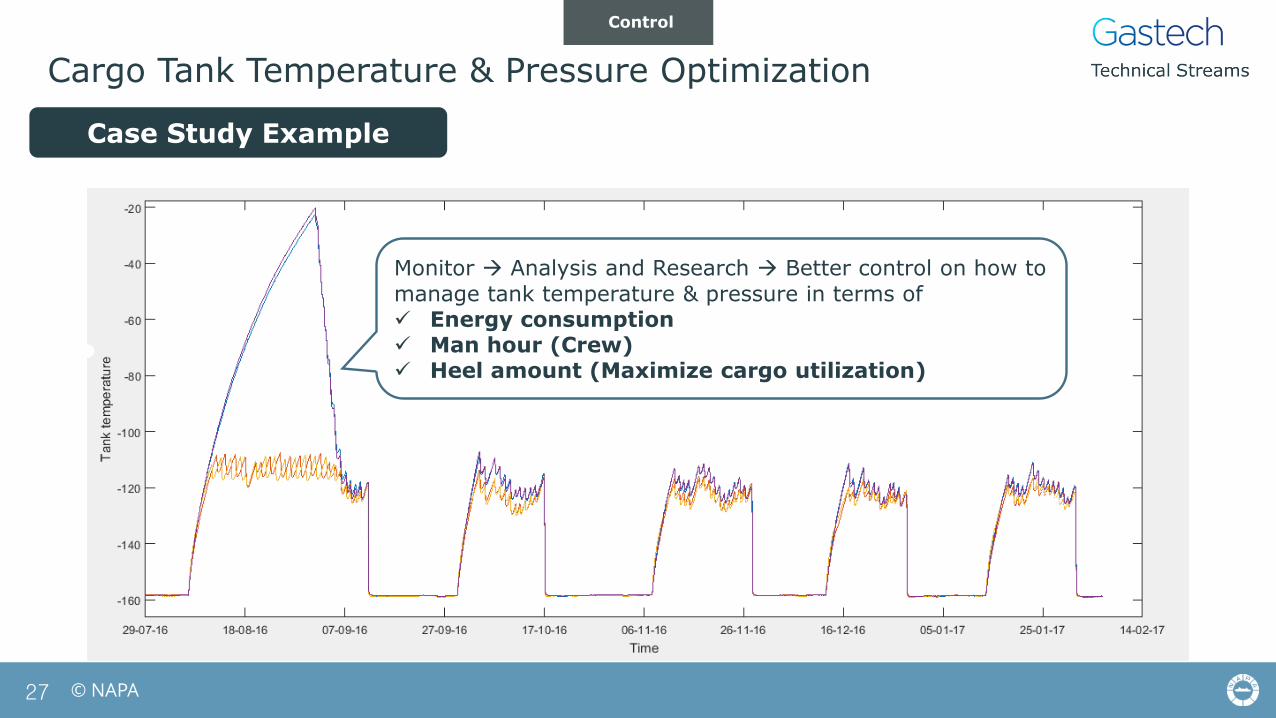
Cargo Tank Temperature & Pressure Optimization
27
Control
Case Study Example
Monitor Analysis and Research Better control on how to
manage tank temperature & pressure in terms of Energy consumption Man hour (Crew) Heel amount (Maximize cargo utilization)
© NAPA
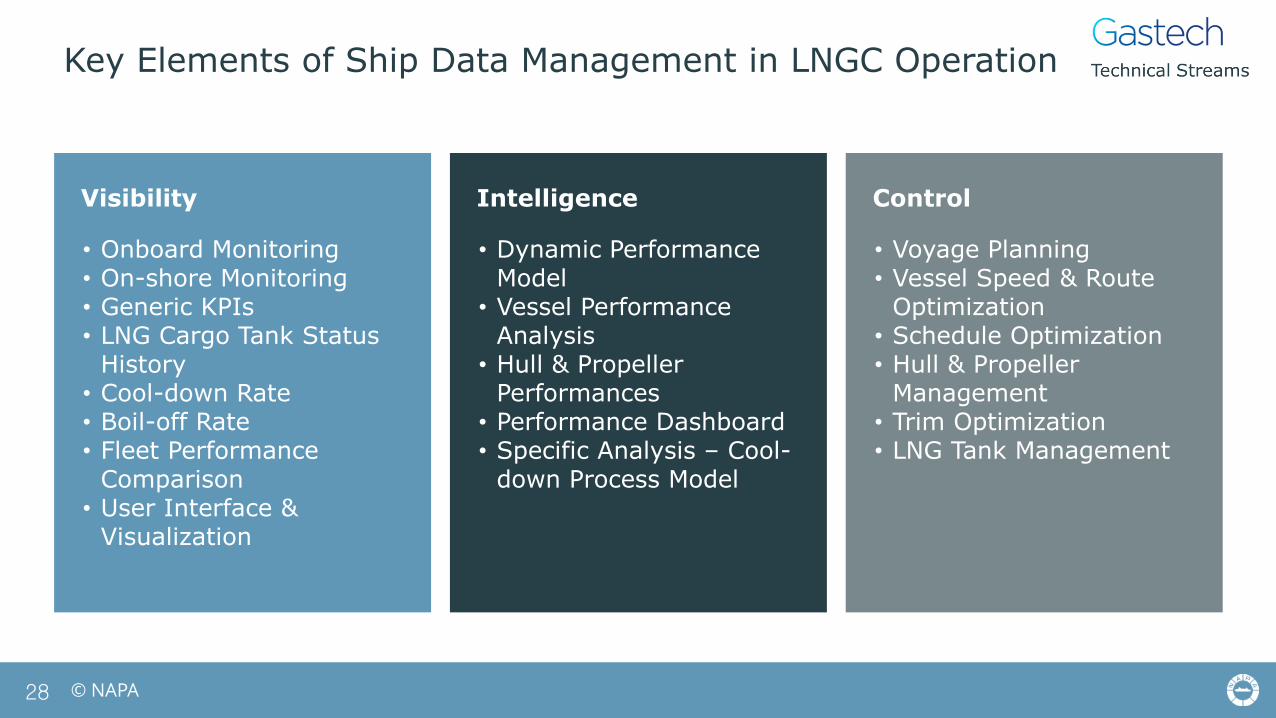
Key Elements of Ship Data Management in LNGC Operation
Visibility ControlIntelligence
• Onboard Monitoring• On-shore Monitoring• Generic KPIs• LNG Cargo Tank Status
History• Cool-down Rate• Boil-off Rate• Fleet Performance
Comparison• User Interface &
Visualization
• Dynamic Performance Model
• Vessel Performance Analysis
• Hull & Propeller Performances
• Performance Dashboard• Specific Analysis – Cool-
down Process Model
• Voyage Planning• Vessel Speed & Route
Optimization• Schedule Optimization• Hull & Propeller
Management• Trim Optimization• LNG Tank Management
28
© NAPA29
Thank you very much!