Embed Size (px)
Citation preview

June 2017 | 1
Marine Money Week The Next Generation of LNG Carriers
June 2017
June 2017 | 2
§ THIS PRESENTATION (THE “PRESENTATION”) HAS BEEN PRODUCED BY FLEX LNG LTD. ("FLEX LNG" OR "THE COMPANY”), SOLELY FOR PRESENTATION PURPOSES AND DOES NOT PURPORTE TO GIVE A COMPLETE DESCRIPTION OF THE COMPANY, ITS BUSINESS OR ANY OTHER MATTER DESCRIBED HEREIN.
§ THE PRESENTATION DOES NOT CONSTITUTE AN OFFER, INVITATION OR SOLICITATION OF AN OFFER TO BUY, SUBSCRIBE OR SELL ANY SECURTIEIS. THIS PRESENTATION IS STRICTLY CONFIDENTIAL AND MAY NOT BE REPRODUCED OR REDISTRIBUTED, IN WHOLE OR IN PART, TO ANY OTHER PERSON.
§ NO REPRESENTATION OR WARRANTY, EXPRESS OR IMPLIED, AS TO THE ACCURACY OR COMPLETENESS OF ANY INFORMATION INCLUDED HEREIN IS GIVEN BY THE COMPANY, AND THAT NOTHING CONTAINED IN THIS PRESENTATION IS OR CAN BE RELIED UPON AS A PROMISE OR REPRESENTATION BY THE COMPANY, WHO DISCLAIM ALL AND ANY LIABILITY, WHETHER ARISING IN TORT OR CONTRACT OR OTHERWISE.
§ THE PRESENTATION SPEAKS AS OF THE DATE SET OUT ON ITS FRONT PAGE. THE COMPANY DOES NOT INTEND TO, OR WILL ASSUME ANY OBLIGATION TO, UPDATE THE PRESENTATION OR ANY OF THE INFORMATION INCLUDED HEREIN.
§ THE CONTENTS OF THE PRESENTATION ARE NOT TO BE CONSTRUED AS FINANCIAL, LEGAL, BUSINESS, INVESTMENT, TAX OR OTHER PROFESSIONAL ADVICE. EACH RECIPIENT SHOULD CONSULT WITH ITS OWN PROFESSIONAL ADVISORS FOR ANY SUCH MATTER AND ADVICE.
§ AN INVESTMENT IN THE COMPANY INVOLVES RISK, AND SEVERAL FACTORS COULD CAUSE THE ACTUAL RESULTS, PERFORMANCE OR ACHIEVEMENTS OF THE COMPANY TO BE MATERIALLY DIFFERENT FROM ANY FUTURE RESULTS, PERFORMANCE OR ACHIEVEMENTS THAT MAY BE EXPRESSED OR IMPLIED BY STATEMENTS AND INFORMATION IN THIS PRESENTATION.
§ THE PRESENTATION CONTAINS CERTAIN FORWARD-LOOKING STATEMENTS RELATING TO THE BUSINESS, FINANCIAL PERFORMANCE AND RESULTS OF THE COMPANY AND/OR THE INDUSTRY IN WHICH IT OPERATES, SOMETIMES IDENTIFIED BY THE WORDS "BELIEVES”, "EXPECTS”, “INTENDS”, “PLANS”, “ESTIMATES” AND SIMILAR EXPRESSIONS. THE FORWARD-LOOKING STATEMENTS CONTAINED IN THIS PRESENTATION, INCLUDING ASSUMPTIONS, OPINIONS AND VIEWS OF THE COMPANY OR CITED FROM THIRD PARTY SOURCES, ARE SOLELY OPINIONS AND FORECASTS WHICH ARE SUBJECT TO RISKS, UNCERTAINTIES AND OTHER FACTORS THAT MAY CAUSE ACTUAL EVENTS TO DIFFER MATERIALLY FROM ANY ANTICIPATED DEVELOPMENT. THE COMPANY DOES NOT PROVIDE ANY ASSURANCE THAT THE ASSUMPTIONS UNDERLYING SUCH FORWARD-LOOKING STATEMENTS ARE FREE FROM ERRORS NOR DOES THE COMPANY ACCEPT ANY RESPONSIBILITY FOR THE FUTURE ACCURACY OF THE OPINIONS EXPRESSED IN THE PRESENTATION OR THE ACTUAL OCCURRENCE OF THE FORECASTED DEVELOPMENTS. NO OBLIGATION IS ASSUMED TO UPDATE ANY FORWARD-LOOKING STATEMENTS OR TO CONFORM THESE FORWARD-LOOKING STATEMENTS TO ACTUAL RESULTS.
§ THIS PRESENTATION IS SUBJECT TO NORWEGIAN LAW, AND ANY DISPUTE ARISING IN RESPECT OF THIS PRESENTATION IS SUBJECT TO THE EXCLUSIVE JURISDICTION OF THE NORWEGIAN COURTS.
Disclaimer
June 2017 | 3
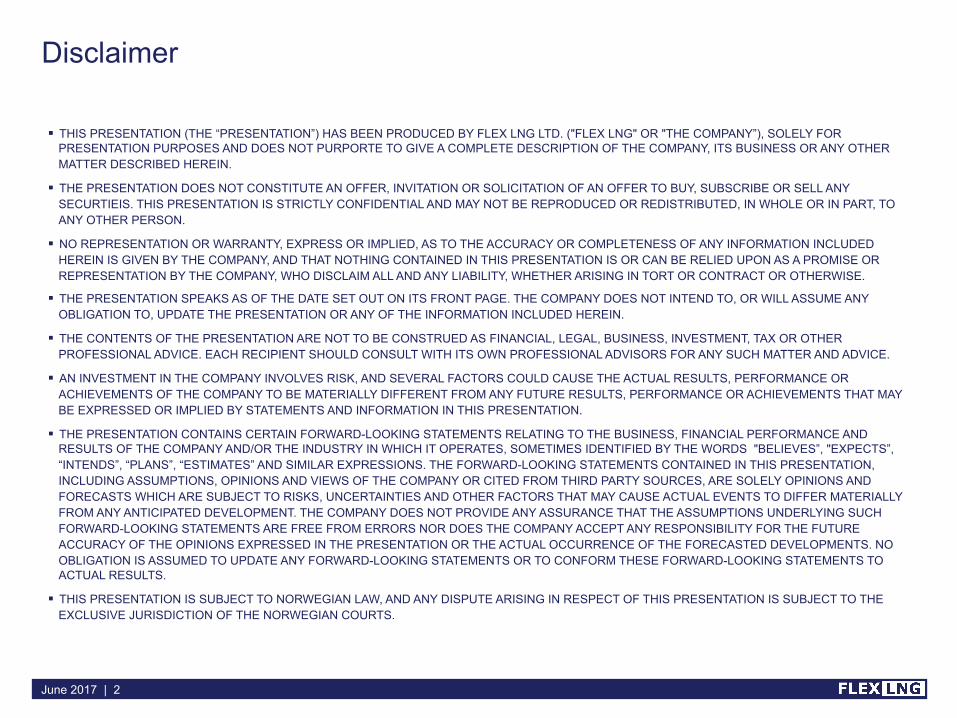
FLEX LNG at a Glance
COMPANY SNAPSHOT
FLEX LNG FLEET
6 173,400
Owned Fleet
173,400
174,000 174,000
Chartered-In Vessels
4 173,400 170,000 160,000 155,000
• 4 chartered-in TFDEs for 6 months firm period (+6 months option) from March 2017
• 155k-174k TFDE vessels • Building market presence and operational experience
• 6 LNG MEGI vessels on order (Owned) • Under contruction at DSME and SHI in Korea • Delivering Q1-Q2 2018, Q2-Q3 2019
1. FLEX LNG is focused on providing safe, reliable, and cost effective solutions in the LNG shipping industry • FLEX LNG aims to become a leading supplier of LNG
Carriers and floating storage & regasification units (“FSRUs”) 2. FLEX LNG is listed on the Oslo Axess Stock Exchange with
a market capitalization of NOK 3.6bn / USD 430m • Majority shareholder Geveran Trading Co Ltd is committed
to building up FLEX LNG into major player in LNG shipping and floating regasification
3. FLEX LNG’s fleet will provide Charterers with highly efficient tonnage to cut fuel consumption and reduced boil off rate (BOR) • MEGI propulsion has ~30% lower fuel consumption than Tri-
Fuel Diesel Electric (TFDE) vessels 4. FLEX LNG is actively pursuing opportunities in the FSRU
market • Opportunities may include FSRU newbuildings for long-term
charters and/or conversions of existing vessels
173,400 173,400
June 2017 | 4
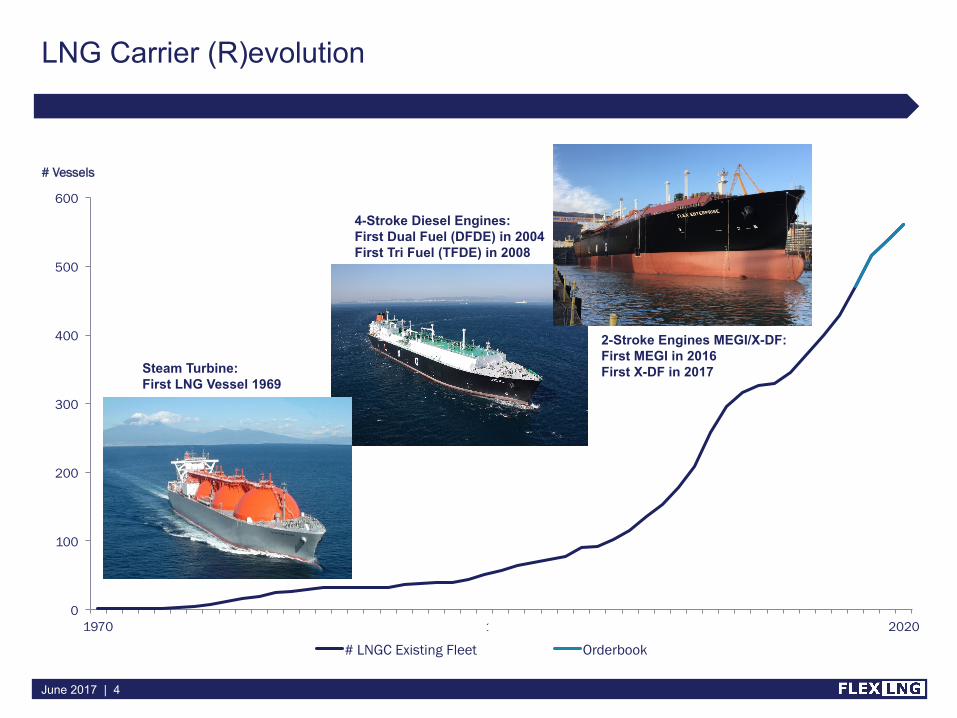
LNG Carrier (R)evolution
0
100
200
300
400
500
600
1970 1995 2020
# LNGC Existing Fleet Orderbook
# Vessels
Steam Turbine: First LNG Vessel 1969
4-Stroke Diesel Engines: First Dual Fuel (DFDE) in 2004 First Tri Fuel (TFDE) in 2008
2-Stroke Engines MEGI/X-DF: First MEGI in 2016 First X-DF in 2017
June 2017 | 5
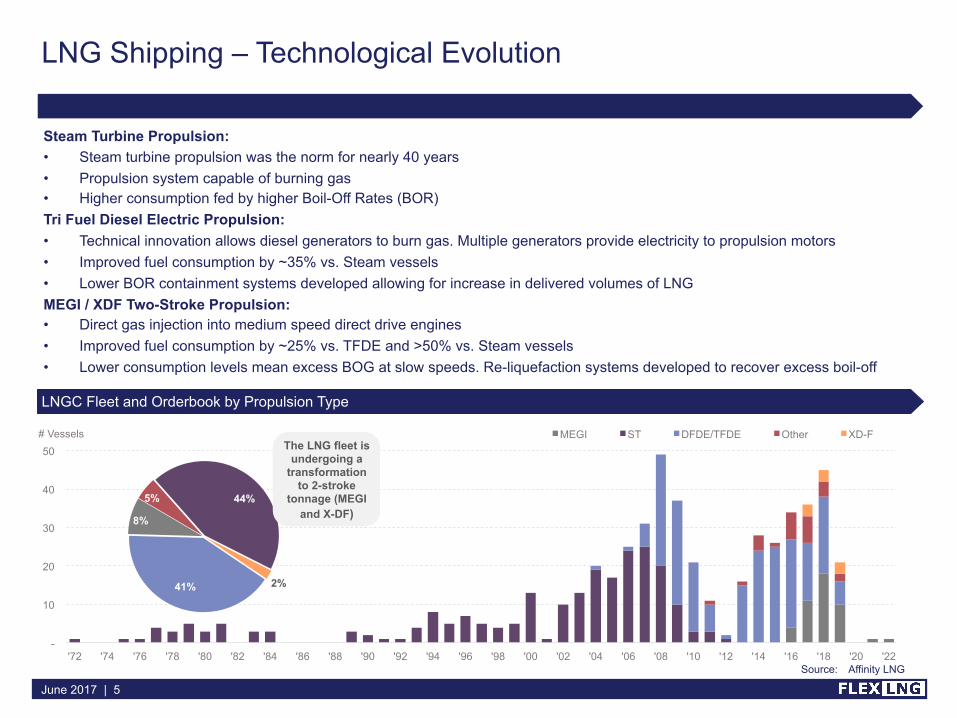
Steam Turbine Propulsion: • Steam turbine propulsion was the norm for nearly 40 years • Propulsion system capable of burning gas • Higher consumption fed by higher Boil-Off Rates (BOR) Tri Fuel Diesel Electric Propulsion: • Technical innovation allows diesel generators to burn gas. Multiple generators provide electricity to propulsion motors • Improved fuel consumption by ~35% vs. Steam vessels • Lower BOR containment systems developed allowing for increase in delivered volumes of LNG MEGI / XDF Two-Stroke Propulsion: • Direct gas injection into medium speed direct drive engines • Improved fuel consumption by ~25% vs. TFDE and >50% vs. Steam vessels • Lower consumption levels mean excess BOG at slow speeds. Re-liquefaction systems developed to recover excess boil-off
LNG Shipping – Technological Evolution
LNGC Fleet and Orderbook by Propulsion Type
-
10
20
30
40
50
'72 '74 '76 '78 '80 '82 '84 '86 '88 '90 '92 '94 '96 '98 '00 '02 '04 '06 '08 '10 '12 '14 '16 '18 '20 '22
# Vessels MEGI ST DFDE/TFDE Other XD-F
41%
8%
5% 44%
2%
The LNG fleet is undergoing a
transformation to 2-stroke
tonnage (MEGI and X-DF)
Source: Affinity LNG
June 2017 | 6
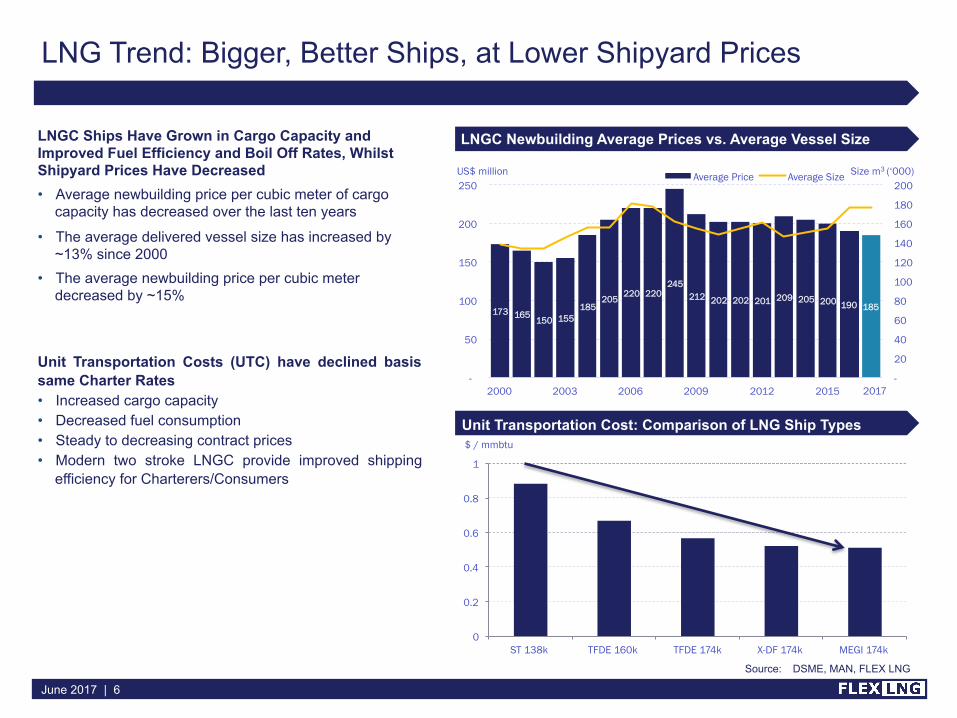
LNG Trend: Bigger, Better Ships, at Lower Shipyard Prices
173 165 150 155 185
205 220 220 245
212 202 202 201 209 205 200 190 185
-
20
40
60
80
100
120
140
160
180
200
-
50
100
150
200
250
2000 2003 2006 2009 2012 2015
Size m3 (‘000)
Thou
sand
s
US$ million Average Price Average Size
LNGC Ships Have Grown in Cargo Capacity and Improved Fuel Efficiency and Boil Off Rates, Whilst Shipyard Prices Have Decreased • Average newbuilding price per cubic meter of cargo
capacity has decreased over the last ten years
• The average delivered vessel size has increased by ~13% since 2000
• The average newbuilding price per cubic meter decreased by ~15%
Unit Transportation Costs (UTC) have declined basis same Charter Rates • Increased cargo capacity • Decreased fuel consumption • Steady to decreasing contract prices
• Modern two stroke LNGC provide improved shipping efficiency for Charterers/Consumers
LNGC Newbuilding Average Prices vs. Average Vessel Size
Unit Transportation Cost: Comparison of LNG Ship Types
0
0.2
0.4
0.6
0.8
1
ST 138k TFDE 160k TFDE 174k X-DF 174k MEGI 174k
$ / mmbtu
2017
Source: DSME, MAN, FLEX LNG
June 2017 | 7
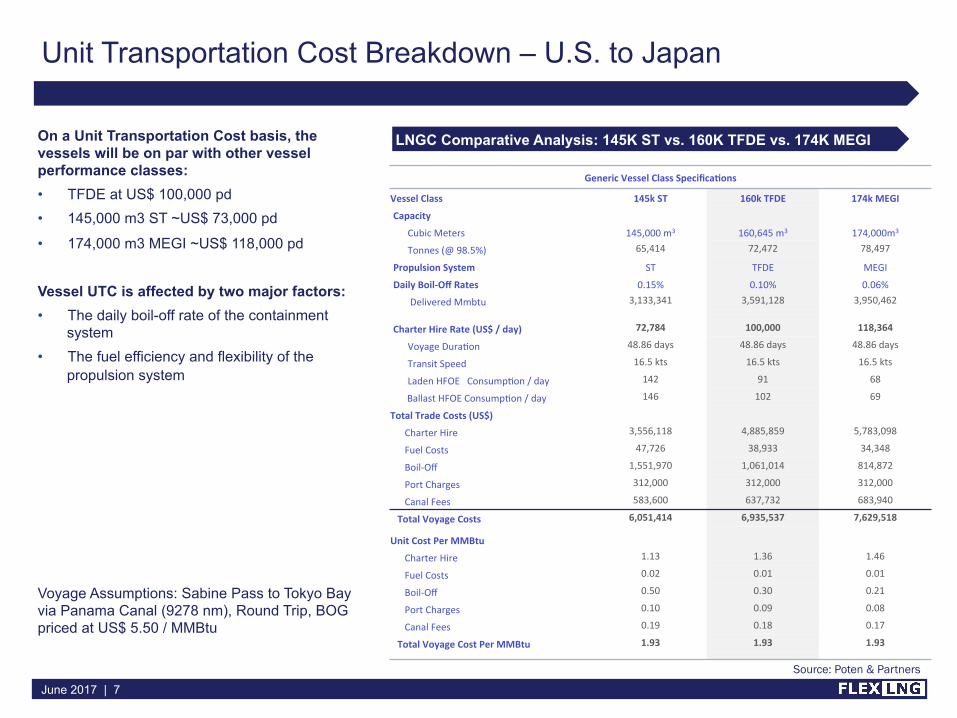
Unit Transportation Cost Breakdown – U.S. to Japan
On a Unit Transportation Cost basis, the vessels will be on par with other vessel performance classes: • TFDE at US$ 100,000 pd • 145,000 m3 ST ~US$ 73,000 pd
• 174,000 m3 MEGI ~US$ 118,000 pd Vessel UTC is affected by two major factors: • The daily boil-off rate of the containment
system • The fuel efficiency and flexibility of the
propulsion system Voyage Assumptions: Sabine Pass to Tokyo Bay via Panama Canal (9278 nm), Round Trip, BOG priced at US$ 5.50 / MMBtu
LNGC Comparative Analysis: 145K ST vs. 160K TFDE vs. 174K MEGI
Generic Vessel Class Specifica0ons
Vessel Class 145k ST 160k TFDE 174k MEGI
Capacity
Cubic Meters 145,000 m3 160,645 m3 174,000m3
Tonnes (@ 98.5%) 65,414 72,472 78,497
Propulsion System ST TFDE MEGI
Daily Boil-‐Off Rates 0.15% 0.10% 0.06%
Delivered Mmbtu 3,133,341 3,591,128 3,950,462
Charter Hire Rate (US$ / day) 72,784 100,000 118,364
Voyage DuraMon 48.86 days 48.86 days 48.86 days
Transit Speed 16.5 kts 16.5 kts 16.5 kts
Laden HFOE ConsumpMon / day 142 91 68
Ballast HFOE ConsumpMon / day 146 102 69
Total Trade Costs (US$)
Charter Hire 3,556,118 4,885,859 5,783,098
Fuel Costs 47,726 38,933 34,348
Boil-‐Off 1,551,970 1,061,014 814,872
Port Charges 312,000 312,000 312,000
Canal Fees 583,600 637,732 683,940
Total Voyage Costs 6,051,414 6,935,537 7,629,518
Unit Cost Per MMBtu
Charter Hire 1.13 1.36 1.46
Fuel Costs 0.02 0.01 0.01
Boil-‐Off 0.50 0.30 0.21
Port Charges 0.10 0.09 0.08
Canal Fees 0.19 0.18 0.17
Total Voyage Cost Per MMBtu 1.93 1.93 1.93
Source: Poten & Partners

June 2017 | 8
Efficiency Commands a Premium in LNG Shipping
Brokers began publishing assessed two-stroke (MEGI and X-DF) spot charter rates in January 2017
Sources: Arctic Shipping Research, Fearnley LNG, Clarksons
-
10,000
20,000
30,000
40,000
50,000
60,000
70,000
80,000
January-17 February-17 March-17 April-17 May-17
ST TFDE MEGI/X-DF Assessment
US$/ day
There are currently ten MEGIs on the water (all under term TC contracts)
0
20,000
40,000
60,000
80,000
100,000
120,000
2014 2015 2016 2017
ST TFDE
US$/ day

June 2017 | 9
Right Ships at the Right Time
Source: FLEX LNG
Only 11 Open LNGCs out of 101 through 2021
28
41
19
2
1
5
5
0
5
10
15
20
25
30
35
40
45
50
2017 2018 2019 2020-2021
Term Charters Uncommitted
# Vessels Most of the vessels in the orderbook are committed to long term charters
• Currently, there are 101 LNGC newbuildings under construction
• 90% of the LNGC newbuildings built by 2021 are committed for long term charters
FLEX LNG owns 6 out of the 11 open LNG newbuildings, four of which delivers in 2018 and two in 2019
• Limited ordering – only 8 LNGC newbuildings contracted over the last 18 months
• Ramp up of LNG global supply is expected to drive strong demand for term charters of modern tonnage
• Incremental LNGC demand 30-50 vessels by 2021
• Most of the recent long term charters has been MEGI or XDF vessels
June 2017 | 10
FLEX LNG Strategic Focus
FLEX LNG has the goal of becoming a leading supplier of LNG Carriers and FSRUs by leveraging on its state of the art LNGCs and extensive experience in the FSRU sector
The LNG market is growing rapidly and 30-50 additional vessels will be required by 2020 • New export projects will add 25-30 mtpa of LNG per year over through 2020
• The current orderbook is insufficient to meet this demand for LNGCs • FLEX LNG is well positioned to provide customers with superior transportation efficiency
• Further newbuildings will be considered as the market evolves
FLEX LNG has chartered in LNG vessels at competitive rates going into an improving market • Four LNGCs chartered-in will allow FLEX LNG to become operational one year before the delivery of the newbuild vessels • FLEX LNG is building strong relationships with Charterers whilst developing our operational capabilities and reputation in market
• Having LNGCs on charter also allows FLEX LNG to offer flexible delivery timing and charter periods in combination with the owned fleet
FLEX LNG is actively pursuing opportunities in the FSRU market to leverage its experience with the development and implementation of FSRU projects • Opportunities may include FSRU newbuildings for long-term chartering contracts and/or conversions of existing vessels
June 2017 | 11 June 2017
Thank You