Embed Size (px)
DESCRIPTION
LREC2010: O3 - Dialogue and Evaluation. Estimation Method of User Satisfaction Using N-gram-based Dialog History Model for Spoken Dialog System. Sunao Hara, Norihide Kitaoka, Kazuya Takeda {naoh, kitaoka, kazuya.takeda}@nagoya-u.jp. - PowerPoint PPT Presentation
Citation preview

Estimation Method of User Satisfaction Using N-gram-based Dialog History Model
for Spoken Dialog System
Sunao Hara, Norihide Kitaoka, Kazuya Takeda
{naoh, kitaoka, kazuya.takeda}@nagoya-u.jp
Graduate School of Information Science,Nagoya University, Japan
LREC2010: O3 - Dialogue and Evaluation

Introduction
• The aim of this study– Construct an estimation model of user satisfaction for
spoken dialog systems (SDSs) based on the real PC environment data
• Experiment– Field experiment using a SDS for the music
retrieval application– Construct and evaluate an estimation model
for user satisfaction using N-gram history model
May 19, 2010LREC2010: Sunao HARA et al., Nagoya Univ., Japan. 2
1. Introduction2. Musicnavi2 database3. N-gram modeling4. Estimation experiment5. Conclusion
1. Introduction2. Musicnavi2 database3. N-gram modeling4. Estimation experiment5. Conclusion

Background (1/2)• Use of speech input applications (e.g. Skype)
by PC users is spreading – More users may use Spoken Dialog Systems (SDSs)
via the Internet
• The acoustic properties of PC environments differ among users– e.g. microphones, noise conditions, etc.
• From a practical application standpoint– Evaluation and prediction of the system performance (User
Satisfaction) are also important issues
May 19, 2010LREC2010: Sunao HARA et al., Nagoya Univ., Japan. 3
Collect the speech under realistic PC environment
Build an estimation model for User Satisfaction

Background (2/2)
• The evaluation using automatically measured metrics– Tune up the system parameters in the designing stage– Use to select the best dialog strategy for SDS applications– PARADISE Framework [Walker, et al. 1997]
• The detection of problematic dialog for call center Interactive Voice Response (IVR) systems– To detect that “the conversation will break down”, as soon
as possible– Problematic dialog predictor using SLU-success feature
[Walker, et al. 2002]– N-gram-based call quality monitoring system [Kim 2007]
May 19, 2010LREC2010: Sunao HARA et al., Nagoya Univ., Japan. 4
Can we estimate the user satisfaction of SDSby modeling the dialog context?
Spoken Language Understanding

MusicNavi2 database• Field experiment using a music
retrieval system with spoken dialog interface1. Download the system through the Internet2. Use it for a certain period3. Fill in questionnaires on the web page
• Music retrieval system - MusicNavi2– “Music retrieval application” + “Spoken dialog interface”– The spoken dialogue interface for retrieving
and playing songs stored in user’s PC– Can collect speech data in corporation with a server
program via the Internet
May 19, 2010LREC2010: Sunao HARA et al., Nagoya Univ., Japan. 5
1. Introduction2. Musicnavi2 database3. N-gram modeling4. Estimation experiment5. Conclusion
1. Introduction2. Musicnavi2 database3. N-gram modeling4. Estimation experiment5. Conclusion

Example of a dialog
6May 19, 2010LREC2010: Sunao HARA et al., Nagoya Univ., Japan.
U = UserS = System
User’s utterances / System’s promptsU Hello ( ko-n-ni-chi-wa)
S Hello
U Da-i-to-ka-i
S Do you want to retrieve the song “Da-i-to-ka-i?”
U Yes ( ha-i )
S Now, playing the song “Da-i-to-ka-i” by “Crystal King.”
U Stop ( te-i-shi )
S Now, stopping.

Data collection by the field test
• Large scaled field test through the Internet– Subjects used MusicNavi2 on their own PC– Participants: 1369 subjects– Total of usage: 488 hours
• User’s task– To listen to at least five songs– To perform at least twenty Q&A dialogs, or to use the
system for over forty minutes• Questionnaire (only by “task complete” users)
– Satisfaction level for SDS from 1 to 5
May 19, 2010LREC2010: Sunao HARA et al., Nagoya Univ., Japan. 7
1: Extremelyunsatisfied 2:Unsatisfied 3:Acceptable 4:Satisfied 5: Extremely
satisfied

Distributions of the experimental subjects and the equipments used by them• Subjects who answered questionnaires
– 449 Subjects (278 males and 171 females)– Total 34296 utterances
May 19, 2010LREC2010: Sunao HARA et al., Nagoya Univ., Japan. 8
16~19 20~29 years old
20~29 years old
30~39 years old
30~39 years old16~19
0 50 100 150 200 250 300
Female
Male
Unknown32%
Headset48%
Pin orDesktop
15%inside of PC
5%
Unknown19%
Inside of PC13%
Loudspeaker
16%
Headphone52%
Microphone Loudspeaker / headphone

0
0.05
0.1
0.15
0.2
0.25
0-10
-20
-30
-40
-50
-60
-70
-80
-90
-
Word Error Rate [%]
Fre
qu
ency
Overview of the MusicNavi2 database
9May 19, 2010LREC2010: Sunao HARA et al., Nagoya Univ., Japan.
# of utterances
0
0.05
0.1
0.15
0.2
0.25
0-25
-50
-75
-10
0-12
5-15
0-17
5-20
0-22
5-
# of utterances
Fre
qu
ency
0
0.05
0.1
0.15
0.2
0.25
2- 3- 4- 5- 6- 7- 8- 9-10
-11
-
Utterances per song playedF
req
uen
cy
Word Error RateUtterances
per song played
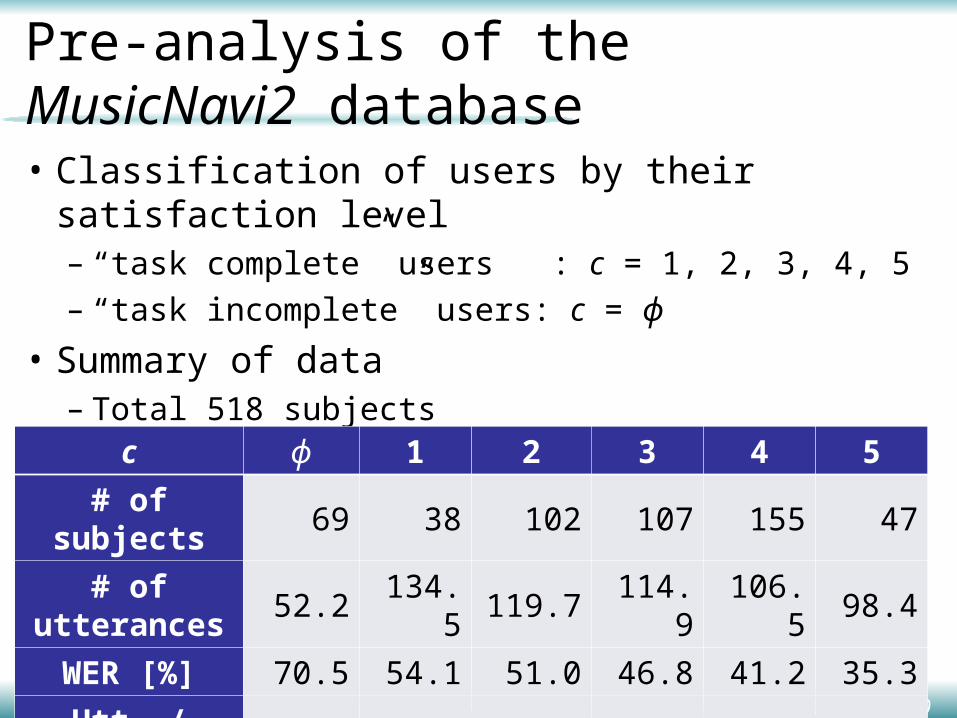
Pre-analysis of the MusicNavi2 database
• Classification of users by their satisfaction level– “task complete” users : c = 1, 2, 3, 4, 5– “task incomplete” users: c = ϕ
• Summary of data– Total 518 subjects
May 19, 2010LREC2010: Sunao HARA et al., Nagoya Univ., Japan. 10
c ϕ 1 2 3 4 5# of subjects 69 38 102 107 155 47
# of utterances 52.2 134.5 119.7 114.9 106.5 98.4WER [%] 70.5 54.1 51.0 46.8 41.2 35.3
Utt. / song 107 7.21 5.34 5.12 4.22 3.43

Modeling method for the dialog context• The dialog management of SDS is
designed by a dialog developer– The management is not always satisfactory for users
• Assume that satisfaction appears in the dialog context
• Statistically learning the naturalness of the dialog– Use N-gram to model the dialog context– Construct models for each class of users– Estimate the unknown user’s satisfaction based on the
likelihood of N-gram model
May 19, 2010LREC2010: Sunao HARA et al., Nagoya Univ., Japan. 11
1. Introduction2. Musicnavi2 database3. N-gram modeling4. Estimation experiment5. Conclusion
1. Introduction2. Musicnavi2 database3. N-gram modeling4. Estimation experiment5. Conclusion

Spoken dialog logs to Dilaog act symbols
• Vocabulary size of the recognition dictionary– That is, the number of the songs– Is different between the users
• Word level information is informative, but it is too sparse to deal with as statistically
• Use dialog act symbols for the users’/system’s acts– Defined 21 system dialog acts and 19 user dialog acts
May 19, 2010LREC2010: Sunao HARA et al., Nagoya Univ., Japan. 12

Example of an encoded dialog
13May 19, 2010LREC2010: Sunao HARA et al., Nagoya Univ., Japan.
User’s utterances / System’s promptsU Hello ( ko-n-ni-chi-wa)
S Hello
U Da-i-to-ka-i
S Do you want to retrieve the song “Da-i-to-ka-i?”
U Yes ( ha-i )
S Now, playing the song “Da-i-to-ka-i” by “Crystal King.”
U Stop ( te-i-shi )
S Now, stopping.
U = UserS = System
Dialog act symbolsx1 = USR_CMD_HELLO
x2 = SYS_INFO_GREETING
x3 = USR_REQUEST_BYMUSIC
x4 = SYS_CONFIRM_KEYWORD
x5 = USR_CMD_YES
x6 = SYS_PLAY_SONG
x7 = USR_CMD_STOP
x8 = SYS_INFO_STOPPED

Modeling the dialog act sequence by N-gram
• A dialog act sequence: – arranged the dialog act symbols in time order t.
• N-gram probability (= likelihood) when given a model for a user class c
May 19, 2010LREC2010: Sunao HARA et al., Nagoya Univ., Japan. 14

Estimation experiment• Detection of the user’s class
using N-gram model
• Experimental conditions– N-gram: 1-gram, 2-gram, …, 8-gram
• Witten-Bell smoothing (using SRILM toolkit)– Input sequence: USR, SYS, SYSUSR– Leave-one-out cross validation
May 19, 2010LREC2010: Sunao HARA et al., Nagoya Univ., Japan. 15
1. Introduction2. Musicnavi2 database3. N-gram modeling4. Estimation
experiment5. Conclusion
1. Introduction2. Musicnavi2 database3. N-gram modeling4. Estimation
experiment5. Conclusion
Exp.1: “task incomplete” users Exp.2: “unsatisfied” users

Estimation experiment
• Detection method– Model selection by thresholding the likelihood ratio
• Evaluation metrics– ROC curve– Area under the ROC curve (AUC)
May 19, 2010LREC2010: Sunao HARA et al., Nagoya Univ., Japan. 16
0 1
1
false detectiontr
ue d
etec
tion

AUC (Area under the ROC curve)
• “task incomplete” users • “unsatisfied” users
17May 19, 2010LREC2010: Sunao HARA et al., Nagoya Univ., Japan.
N SYS USR SYSUSR
1-gram 0.901 0.873 0.9272-gram 0.948 0.929 0.9773-gram 0.989 0.954 0.9934-gram 0.995 0.952 0.9975-gram 0.993 0.954 0.9956-gram 0.989 0.951 0.9957-gram 0.988 0.946 0.9958-gram 0.987 0.936 0.994
SYS USR SYSUSR
0.611 0.638 0.6190.628 0.644 0.7240.591 0.651 0.7040.583 0.681 0.7390.629 0.662 0.7390.632 0.639 0.7610.604 0.633 0.7650.592 0.622 0.756
High detection performance in “task incomplete” users to use the system dialog acts
Suggested the effectivity of using both system and user dialog acts

Detection result of “task incomplete” users
• SYSUSR
May 19, 2010LREC2010: Sunao HARA et al., Nagoya Univ., Japan. 18
N AUC1-gram 0.9272-gram 0.9773-gram 0.9934-gram 0.9975-gram 0.9956-gram 0.9957-gram 0.9958-gram 0.994
4-gram achieved100% true detection ratewith 6% false detection rate

Detection result of “unsatisfied” users
• SYSUSR
May 19, 2010LREC2010: Sunao HARA et al., Nagoya Univ., Japan. 19
N AUC1-gram 0.6192-gram 0.7243-gram 0.7044-gram 0.7395-gram 0.7396-gram 0.7617-gram 0.7658-gram 0.756
The more N of N-gram is,the less false detection rate becomes

Conclusion• Estimation method of user satisfaction
using N-gram-based dialog history model for SDS– Constructed the real PC environmental database– Achieved high performance in the detection of “task incomplete”
users• 100% true detection rate, when 6% false detection rate
– Not sufficient performance in the detection of “unsatisfied” users– N-gram model was effective by comparison of 1-gram– Using both system and user dialog act was effective
• Future works– N-gram model-based estimation of dialog failure (online detection)– Analysis of the dialog context affected user satisfaction– Integrated method of using acoustic features, prosodic features,
dialog features, etc.
May 19, 2010LREC2010: Sunao HARA et al., Nagoya Univ., Japan. 20
1. Introduction2. Musicnavi2 database3. N-gram modeling4. Estimation experiment5. Conclusion
1. Introduction2. Musicnavi2 database3. N-gram modeling4. Estimation experiment5. Conclusion

• Thanks for your kind attention!
May 19, 2010LREC2010: Sunao HARA et al., Nagoya Univ., Japan. 21

May 19, 2010LREC2010: Sunao HARA et al., Nagoya Univ., Japan. 22

Modeling the dialog act sequence by N-gram
• Encoded dialog logs to dialog act symbols automatically
• A dialog act sequence: x– arranged the dialog act symbols in time order t.
• N-gram probability(=Likelihood) when given a model with a satisfaction level s
May 19, 2010LREC2010: Sunao HARA et al., Nagoya Univ., Japan. 23
User’sdialog acts
Using speech recognition resultsThey are defined in recognition dictionary
System’sdialog acts
Using system prompts or responsesThey are the same as system’s internal act

Detection by thresholding
• Model selection by an a posteriori odds classifier,
• Introduce a priori odds 1/α and Bayes factor B
• Finally,
May 19, 2010LREC2010: Sunao HARA et al., Nagoya Univ., Japan. 24
* α =1 means ML classifier
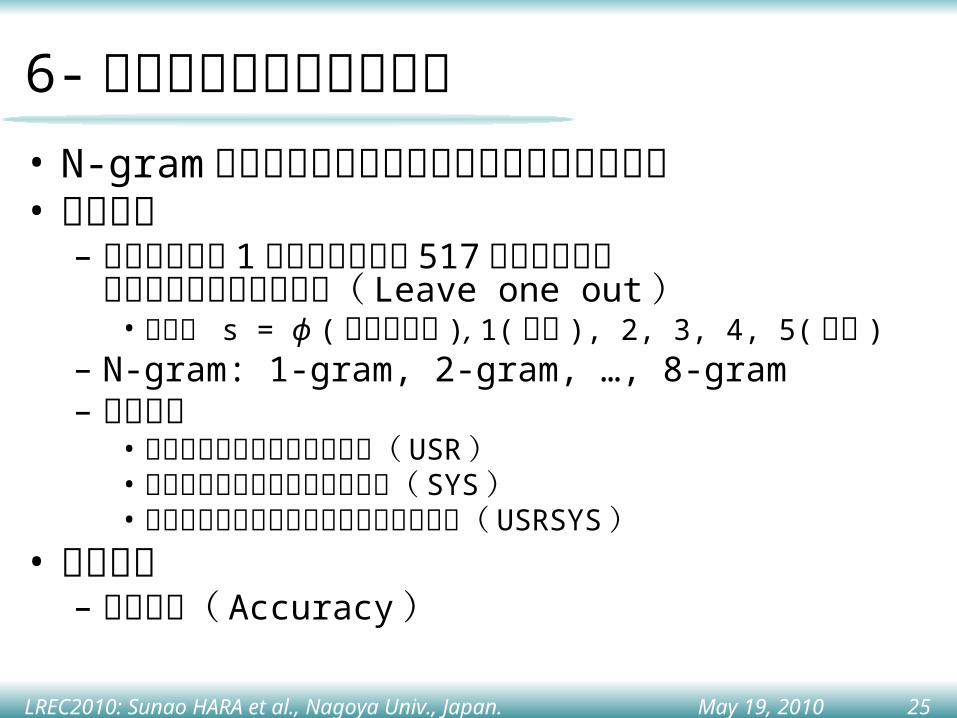
6- クラスの満足度推定実験• N-gram モデルを用いたユーザ満足度クラスの推
定• 実験条件
– 評価用被験者 1 名を除いた残り 517 名を利用して満足度毎のモデルを学習( Leave one out )
• 満足度 s = ϕ ( 課題未達成 ), 1( 不満 ), 2, 3, 4, 5( 満足 )– N-gram: 1-gram, 2-gram, …, 8-gram– 入力系列
• ユーザの対話行動のみを利用( USR )• システムの対話行動のみを利用( SYS )• ユーザ・システム両者の対話行動を利用( USRSYS )
• 評価基準– 識別精度( Accuracy )
May 19, 2010LREC2010: Sunao HARA et al., Nagoya Univ., Japan. 25

満足度( 6- クラス)の推定手法
• 最尤推定による最尤モデルの選択– あるユーザの入力 x に対して
満足度モデルそれぞれの尤度を算出
– 最大尤度のモデルが推定結果
May 19, 2010LREC2010: Sunao HARA et al., Nagoya Univ., Japan. 26
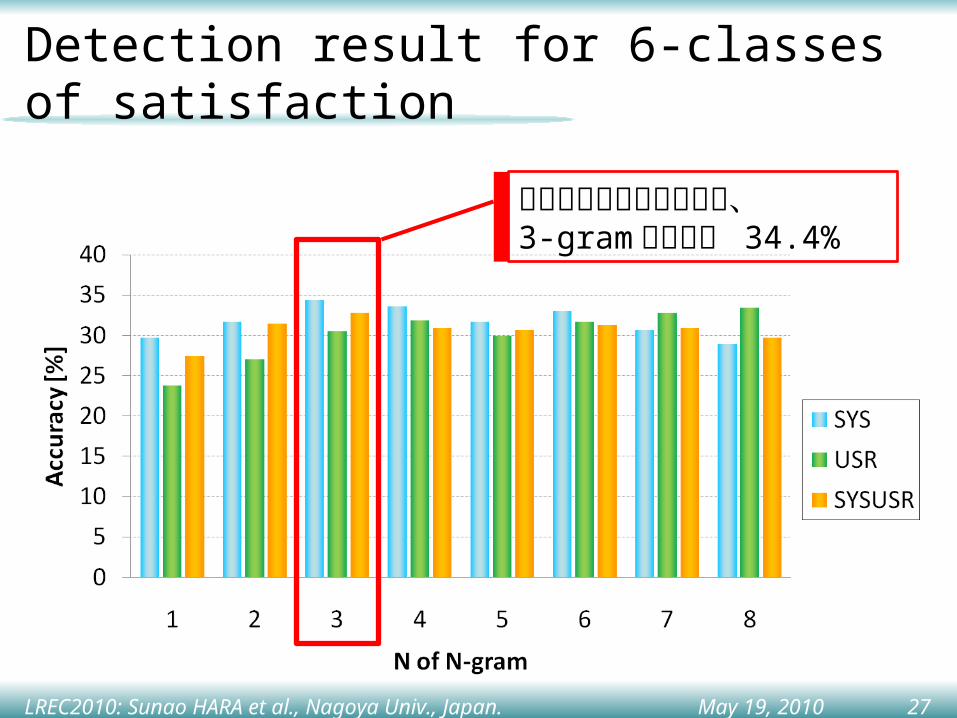
Detection result for 6-classes of satisfaction
May 19, 2010LREC2010: Sunao HARA et al., Nagoya Univ., Japan. 27
システム系列のみを利用、3-gram の場合で 34.4%

Confusion matrix
• 3-gram of SYS sequence
May 19, 2010LREC2010: Sunao HARA et al., Nagoya Univ., Japan. 28
Estimatedϕ 1 2 3 4 5
ϕ 43 5 7 5 6 3
1 0 7 8 9 11 3
2 1 8 31 16 35 11
3 0 9 22 23 45 8
4 0 8 34 29 66 18
5 0 4 5 6 24 8
Actu
al
課題未達成ユーザ( Φ )は誤検出も少なく、比較的高い精度で識別されている
満足しているユーザも推定結果が大きく異なっている例は少ない

対話履歴を考慮したユーザ満足度
• システムとの対話を繰り返すことでユーザの感じる満足度合いが変化– 逐次変化の最後に“満足度”が調査される
May 19, 2010LREC2010: Sunao HARA et al., Nagoya Univ., Japan. 29
不満
←
→
満足
対話ターン数
性能に満足
性能に不満
利用を中断

30May 19, 2010LREC2010: Sunao HARA et al., Nagoya Univ., Japan.

Modeling the N-gram• Encoded to dialog log to dialog act symbols automatically
– User’s dialog acts• Using speech recognition results• They are defined in recognition dictionary
– System’s dialog acts• Using system responses or acts• They are the same as system’s internal act
• A dialog act sequence: x– Arranged the dialog act symbols in time order t.
• 6 クラスの満足度毎に N-gram モデルを作成– Witten-Bell smoothing … SRILM toolkit を利用
May 19, 2010LREC2010: Sunao HARA et al., Nagoya Univ., Japan. 31

Example of a dialog
32May 19, 2010LREC2010: Sunao HARA et al., Nagoya Univ., Japan.
U Hello ( ko-n-ni-chi-wa)
S Hello
U Da-i-to-ka-i
S Do you want to retrieve the song “Da-i-to-ka-i?”
U Yes ( ha-i )
S Now, playing the song “Da-i-to-ka-i” by “Crystal King.”
U Stop ( te-i-shi )
S Now, stopping.
U = UserS = System

33May 19, 2010LREC2010: Sunao HARA et al., Nagoya Univ., Japan.
1. Introduction2. Musicnavi2 database3. N-gram modeling4. Estimation experiment5. Conclusion
1. Introduction2. Musicnavi2 database3. N-gram modeling4. Estimation experiment5. Conclusion