Embed Size (px)
Citation preview

Summarizing cellular responses as biologicalprocess networksLasher et al.
Lasher et al. BMC Systems Biology 2013, 7:68http://www.biomedcentral.com/1752-0509/7/68
Lasher et al. BMC Systems Biology 2013, 7:68http://www.biomedcentral.com/1752-0509/7/68
METHODOLOGY ARTICLE Open Access
Summarizing cellular responses as biologicalprocess networksChristopher D Lasher1, Padmavathy Rajagopalan2,3 and T M Murali3,4*
Abstract
Background: Microarray experiments can simultaneously identify thousands of genes that show significantperturbation in expression between two experimental conditions. Response networks, computed through theintegration of gene interaction networks with expression perturbation data, may themselves contain tens ofthousands of interactions. Gene set enrichment has become standard for summarizing the results of these analyses interms functionally coherent collections of genes such as biological processes. However, even these methods can yieldhundreds of enriched functions that may overlap considerably.
Results: We describe a new technique called Markov chain Monte Carlo Biological Process Networks (MCMC-BPN)capable of reporting a highly non-redundant set of links between processes that describe the molecular interactionsthat are perturbed under a specific biological context. Each link in the BPN represents the perturbed interactions thatserve as the interfaces between the two processes connected by the link.We apply MCMC-BPN to publicly available liver-related datasets to demonstrate that the networks formed by themost probable inter-process links reported by MCMC-BPN show high relevance to each biological condition. Weshow that MCMC-BPN’s ability to discern the few key links from in a very large solution space by comparing resultsfrom two other methods for detecting inter-process links.
Conclusions: MCMC-BPN is successful in using few inter-process links to explain as many of the perturbedgene-gene interactions as possible. Thereby, BPNs summarize the important biological trends within a responsenetwork by reporting a digestible number of inter-process links that can be explored in greater detail.
Keywords: Molecular interaction networks, Gene expression data, Networks of biological processes, Data integration,Markov chain Monte Carlo
BackgroundMotivationThe deluge of publicly available molecular biology data,including genome-wide gene expression measurements[1,2] and gene and protein interaction networks [3,4]has necessitated the development of computational meth-ods that produce comprehensible views of large numbersof biological molecules and their connections. Reportingperturbation in gene expression on the basis of individ-ual genes [5,6] (of which there may be thousands) hasgiven way to more holistic techniques—referred to asfunctional enrichment—that instead report the signifi-cance of the collective perturbation of processes—sets ofbiologically related genes (e.g., [7-11]. Results from these
*Correspondence: [email protected] Center for Systems Biology of Engineered Tissues, Virginia Tech,Blacksburg, VA 24061 USA4Department of Computer Science, Virginia Tech, Blacksburg, VA 24061 USAFull list of author information is available at the end of the article
analyses reveal important trends that large lists of genescan obscure.Recent work in functional enrichment of gene expres-
sion data [9,11] has emphasized finding concise, non-redundant sets of processes that account for much of theoverall perturbation among the genes. Methods by Luet al. [9] and Bauer, Gagneur, and Robinson [11] assumethat a cell or tissue perturbs certain biological processesin response to a change internal or external conditions. Intheir models, perturbed processes cause the perturbationof the expression of individual genes belonging to each ofthose processes. They consider the actual measurementsof perturbation of the individual genes, as assessed byDNA microarrays, for example, as noisy observations ofsignals generated by perturbation of specific processes bycells in response to a stimulus. Both methods use gen-erative models to assess the goodness of fit of a set ofcandidate perturbed processes to the observed gene per-turbations, while differing in their precise formulations.The two methods use standard algorithms (greedy [9] and
© 2013 Lasher et al.; licensee BioMed Central Ltd. This is an Open Access article distributed under the terms of the CreativeCommons Attribution License (http://creativecommons.org/licenses/by/2.0), which permits unrestricted use, distribution, andreproduction in any medium, provided the original work is properly cited.

Lasher et al. BMC Systems Biology 2013, 7:68 Page 2 of 17http://www.biomedcentral.com/1752-0509/7/68
Markov chain Monte Carlo (MCMC) [11]) to find the setof processes with the greatest fit to the observed data.Products of genes do not act independently but rather
in concert with products of other genes through numer-ous interactions. In a similar vein, biological processes,composed of genes, may themselves interact. Accordingly,researchers have begun developing methods to identifyconnections between processes based on the underlyinggene interaction networks. A method by Li et al. [12]computed the “crosstalk” between processes by count-ing the number of interactions that occur among thegenes of each process and assessing the significance ofthis number against empirical distributions. Dotan-Cohenet al. published a more direct method [13] which usesFisher’s Exact Test to determine if one process is linkedto another, i.e., if genes in the first process have signifi-cantly more interactions with genes in the second processthan would be expected by chance. Wang et al. [14] pub-lished a method that calculates what they call “functionalsimilarity” between two processes using the sum of thedistances between all pairs of genes belonging to thoseprocesses.While the previous methods represent advances in find-
ing high-level connections between processes, they donot incorporate information which could lead to discov-ering which connections have relevance under specificbiological contexts. Motivated by this methodological gap,in earlier work [15] we extended the method of Dotan-Cohen et al. [13] by integrating gene expression data withgene-gene interactions to compute what we termed “Con-textual Biological Process Linkage Networks” (CBPLNs).A link in a CBPLN indicates not only that the genes oftwo processes have a significant number of interactionsamong them, but that genes at the interface exhibit a largeamount of perturbation in expression. Thus, it becamepossible to infer the inter-process connections relevantto a cell or tissue’s response to an internal or externalstimulus.The CBPLN method has several aspects that need
improvement. First, because it must build empirical dis-tributions to determine the significance of each link, itbecomes prohibitively computationally expensive as thenumber of links to test grows. Second, the method reportsall significant links, Since it makes no distinction amongtwo or more links that are found to be significant onaccount of nearly identical sets of gene-gene interactions,it may outputmany redundant significant links. This latterdrawback is universal to all methods that compute inter-process links, and also to most techniques for functionalenrichment.Here we present a new method that simultaneously
addresses the shortcomings of earlier methods. Ourmethod takes inspiration from the methods for functionalenrichment reported by Lu et al. [9] and Bauer et al. [11].
We assume that links between biological processesbecome perturbed during the response of a cell or tissue tosome stimulus, and that this perturbation of inter-processlinks propagates via the individual gene-gene interac-tions between genes belonging to the different processes.We can not directly observe perturbation of the linksbetween the processes; instead, our method considersthe perturbation of genes participating in the interfacinginteractions of processes as noisy observations gener-ated from the perturbed inter-process links. Our methodinfers a non-redundant set of processes and their per-turbed links, which we call a Biological Process Network(BPN), from the interactions between the observed per-turbed genes. We compute the likelihood of candidateBPNs in terms of parameters accounting for the noisi-ness in the observed states of the gene-gene interactions.Using Markov chain Monte Carlo (MCMC), we iden-tify BPNs of high likelihood. We label this new method“MCMC Biological Process Networks” (MCMC-BPN).BPNs thus computed summarize the important biologi-cal trends within a response network by reporting to theuser a digestible number of inter-process links that can beexplored in greater detail.
Overview of the methodMCMC-BPN aims to explain as many interactionsbetween genes with perturbed expression by as few inter-process links as possible. By including a link between apair of processes in the BPN, we say that link “explains”the interactions cross-annotated by that pair of terms. Ourobjective is to the reward inclusion of links in the BPNthat explain many interactions between perturbed genesnot already explained by other links in the BPN. Simul-taneously, another objective is to penalize the inclusionof more links in the BPN than necessary, including linkswhich mostly explain unperturbed interactions, and miss-ing a large number of perturbed interactions. To this end,we define a likelihood function as the product of severalBernoulli distributions, controlled by three parametersused to adjust for the amount of “noise” in the observedperturbation of the cross-annotated links.The first of these parameters, the link prior λ, serves to
reduce the number of links in a BPN, for when λ is low,having few links increases the overall likelihood. A lowvalue for the second parameter, the false-positive rate α,encourages BPNs that explain many perturbed interac-tions. Finally, when the parameter β , which representsthe false-negative rate, has a low value, it encouragesBPNs that explain few unperturbed interactions. Notethat modifying the BPN in such a way that increases thecontribution of one parameter to the likelihood may beoffset, or even outweighed, by a decrease in the contri-bution to the likelihood by another parameter. For exam-ple, including every possible link in a BPN will have a

Lasher et al. BMC Systems Biology 2013, 7:68 Page 3 of 17http://www.biomedcentral.com/1752-0509/7/68
favorable likelihood contribution via α, since it necessar-ily explains all perturbed interactions. Such an inclusiveBPN will, however, lead to very poor contributions via λ
(many links are included in the BPN) and β (many unper-turbed interactions will also be included). Thus, such aBPN will have a very low overall likelihood. A desir-able BPN must strike a balance among the tension of allthree parameters—neither including too many links, norexplaining too few perturbed interactions, nor explainingtoo many unperturbed interactions—in order maximizethe overall likelihood.While the likelihood function provides a means of scor-
ing the quality of a given BPN, for any given data set, thereexist 2|L| possible BPNs, where L is the set of all possiblelinks between pairs of processes. To search this potentiallyenormous solution space, we use the Metropolis-Hastingsalgorithm for Markov chain Monte Carlo (MCMC) [16].Each state in the Markov chain represents a particular setof values for the parameters λ, α, and β , as well as a partic-ular configuration of inter-process links. The neighbors ofthe state are those which have one additional or one lesslink, or which have one parameter with a different value.The parameter values and links which contribute to BPNswith high likelihoods will tend to remain consistent fromone visited state to the next. Thus, we report the final BPNas the links that appear most frequently throughout thestates visited during the MCMC.
ApplicationWe applied MCMC-BPN to three treatment-controlexperiments relating to the liver and liver disease. Inthe first application, we compared gene expression ofrat hepatocytes in two common in vitro culture sys-tems [17]: hepatocyte monolayer (HM) and collagensandwich (CS). The remaining two experiments contrastgene expression levels from liver tissue samples fromdozens of human patients diagnosed with hepatitis C virus(HCV)-induced cirrhosis and hepatocellular carcinoma(HCC) with expression levels of samples from healthypatients [18]. Approximately 170 million people world-wide suffer from HCV infection [19]. HCC ranks thirdamong the deadliest cancers worldwide, of which HCV
is among the leading causes of incidence [20]. Below,we present and discuss the BPNs computed to summa-rize the major trends of differential expression of eachof these three data sets. We found the BPNs containedlinks between biological processes that were anticipated,as well as unexpected connections that suggest furtherexploration.
ResultsData sources and contrastsTable 1 summarizes the data sources for the three con-trasts we studied. For the “CS vs. HM” contrast, we usedthe samples for CS day 8 as the treatment and samplesfor HM day 8 as the control. For this contrast, we prunedthe STRING network to include those interactions witha score of 500 or greater. For the “Cirrhosis” contrast, weused samples from patients designated to be in the cir-rhosis category as the treatment; for the “Very AdvancedHCC” contrast, we used samples from patients designatedas being in the “Very Advanced HCC” category as thetreatment; in both contrasts, we used the samples fromuninfected patients as the control.We obtained functional annotations for the genes from
the c2 canonical pathways and c5 GO gene sets of theMolecular Signatures Database (MSigDB) version 3.0 [7],downloaded on February 7, 2011, CORUM complexes[21] downloaded on February 7, 2011, NetPath signaltransduction pathways [22] downloaded June 6, 2009, andNCI Pathway Interaction Database’s curated pathways[23] downloaded February 7, 2011. For the rat data, wenormalized all data into the Ensembl Peptide ID names-pace through a combination of the Synergizer [24] andMadGENE [25] mapping services. For the human data,we used the same services to normalize all the data intoEntrez Gene namespace.Next, we integrated the annotations with the gene inter-
action networks. We say that a pair of processes “cross-annotates” interactions in the underlying gene-geneinteraction network if one of the two genes belongsto one of the processes in the link and the othergene belongs to the other process. (See the sectiontitled “The MCMC-BPN algorithm” for details.) For
Table 1 Data sources for each contrast
Interactions GEO
Contrast Organism Sample database series
CS vs. HM [17] Rattus norvegicus Hepatocyte STRING v8.3 [4] GSE20659
Culture
Cirrhosis [18] Homo sapiens Liver MiMI [3] GSE6764
Biopsy
Very Advanced HCC [18] Homo sapiens Liver MiMI [3] GSE67674
Biopsy

Lasher et al. BMC Systems Biology 2013, 7:68 Page 4 of 17http://www.biomedcentral.com/1752-0509/7/68
each contrast, Table 2 presents the number of pro-cesses, the number of cross-annotating pairs amongthese processes, the number of interactions whichthe process pairs cross-annotate, and the numberof those interactions which we consider “perturbed”(i.e., both interacting genes exhibit perturbed expressionfor that contrast; see the section titled “The MCMC-BPNalgorithm” for details).For each contrast, we performed a total of five runs of
MCMC-BPN. Each run took between 15 and 30 hours ona single core of a 2.8GHz AMD Opteron 4184 proces-sor using our implementation in Python.We first describeresults on the consistency of the BPNs computed bythe different MCMC runs and summarize BPN statis-tics. Second, we show that the BPNs contain very littleredundancy. Third, for each contrast, we display an exam-ple BPN and provide detail on several interesting linksin the reported BPNs. Fourth, we demonstrate that theBPNs produced by MCMC-BPN are more informativewhile also being less redundant than those computed bytwo previous methods: CBPLN [15] and biological pro-cess linkage networks (BPLN) [13]. Finally, we describesome general observations of the behavior of the MCMCand features which affect the performance of our algo-rithm. Two additional files accompany these results. Thesupplementary information (Additional file 1) contains (a)details on how we executed the MCMC-BPN software toobtain and visualize our results and (b) a description ofthe files in the supplementary results, which are avail-able in Additional file 2. This file contains all the fiveBPNs for each of the contrasts studied and the parametersestimated by each run of the software.
Consistency and statistics of BPNs computed byMCMC-BPNWe measured the consistency between the five BPNsfor each contrast in two ways: how many links (i.e., thepairs of processes) each pair of BPNs shared, and howmany explained interactions each pair of BPNs had incommon. The average Jaccard Index (JI) for all ten pair-wise comparisons of the shared links in the CS vs. HMBPNs was 0.91; in these and subsequent results, we reportaverages but not the standard deviations, since they wereone to two orders of magnitude smaller than the averages.Figure 1 presents, for each of the three contrasts, a pair of
heatmaps showing the overlap between each pair of BPNson the basis of their common perturbed and unperturbedexplained interactions. For the CS vs. HM contrast, theaverage Jaccard Index for the common perturbed inter-actions was 0.92, illustrating the high degree of overlapbetween the reported BPNs. The five BPNs for the CSvs. HM contrast consisted of an average of 27.6 processeswith 20.0 inter-process links explaining 1686.0 interac-tions, of which 1070.2 interactions were perturbed. TheBPNs explained 27.7% of all perturbed interactions using0.1% of the possible links.Unlike the CS vs. HM contrast, the BPNs reported for
the Cirrhosis contrast showedmixed consistency. Figure 1(center) clearly illustrates the divergence in the BPNs com-puted for the Cirrhosis contrast in terms of the overlapof their explained interactions. Three of the five BPNs(BPNs 1, 3, and 4) were identical, with 18 processes and 14links between these processes. The two remaining BPNshad only two processes with one link and four processeswith two links, respectively, none of which were presentin the three identical BPNs. We found that β , the false-negative rate, took on a very high value (0.95) for theseruns in comparison to the others (0.6). This value of β
indicated that only 5% of the interactions explained bythese BPNs were perturbed.We discarded these two BPNsfrom further analyses, reasoning that they represented asituation where the MCMC could not escape a local min-imum. We found that the 14 links of the three remainingBPNs explained 947 interactions, 380 of which were per-turbed. Thus the BPNs explained 19.5% of all perturbedinteractions using 0.2% of all possible links.Similar to the Cirrhosis contrast, three of the BPNs com-
puted for the Very Advanced HCC contrast had a highdegree of similarity (BPNs 1, 2, and 4 in Figure 1 (right)).The remaining two BPNs, which had a modest similar-ity to each other, showed very little overlap with the firstthree BPNs. Unlike the Cirrhosis contrast, the two groupsof BPNs had similar numbers of processes and links; thethree similar BPNs had a mean of 44.0 processes with36.7 links between them, and the two remaining BPNshad a mean of 38.5 processes and 41.5 links. They dif-fered remarkably, however, in the number of interactionstheir links explained. The three similar BPNs explained amean of 8114.3 interactions, of which 5670.7 were per-turbed. The remaining two BPNs explained a mean of
Table 2 Statistics on inputs by contrast
Cross-annotating Cross-annotated Perturbed
Contrast Processes process pairs interactions interactions
CS vs. HM 210 14796 11585 3861
Cirrhosis 148 8714 12913 1954
Very Advanced HCC 345 36460 30201 15400

Lasher et al. BMC Systems Biology 2013, 7:68 Page 5 of 17http://www.biomedcentral.com/1752-0509/7/68
PerturbedInteractions
UnperturbedInteractions
CS vs. HM Cirrhosis Very Advanced HCC
Overlap of explained interactions between BPNS
Figure 1 Pairwise overlaps of BPNs for the three contrasts. Heatmaps for each contrast, CS vs. HM, Cirrhosis, and Very Advanced HCC, indicatethe pairwise overlap of perturbed interactions (top), and unperturbed interactions (bottom) explained by the BPNs.
3470.5 interactions, of which 890.5 were perturbed. Asin the Cirrhosis contrast, we found that β assumed highvalues (0.7 and 0.75) in these two runs compared to theothers (0.3). Again reasoning the MCMC may have failedto escape local minima, we excluded the two dissimilarBPNs from the remainder of our analyses.
Lack of redundancy in BPNsWe sought to determine whether there was any redun-dancy within each BPN for each contrast. We used twomeasures for this evaluation: (i) the overlap among links ina BPN in terms of common interactions and (ii) the num-ber of links in each BPN that explained each interaction.We define these measures in more detail in the sectiontitled “ Measuring redundancy within a BPN.”We measured the amount of overlap between every
pair of links within each BPN in terms of the numberof common explained interactions, averaging the resultsover the BPNs computed for each contrast. Figure 2 dis-plays, for each contrast, the distributions of the maxi-mum observed JIs for each link, divided into perturbedexplained interactions and unperturbed explained inter-actions. Among the five CS vs. HM BPNs, when con-sidering perturbed interactions, a mean of 80.0% of linkshad a maximum JI between 0 and 0.2. For unperturbedinteractions, this number was 59.9%. Moreover, 80.7%of perturbed explained interactions and 82.2% of unper-turbed explained interactions in CS vs. HM had only onelink explaining them on average.Links in Cirrhosis BPNs also exhibited little overlap (see
Figure 2 (center)), with all links having a maximum JI
of at most 0.2, both for perturbed and for unperturbedinteractions. At least 85% of the perturbed explainedinteractions and the unperturbed explained interactionswere explained by only one link. Links exhibited littleoverlap in Very Advanced HCC BPNs as well, as shownin Figure 2 (right). Nearly 90% of the links had a maxi-mum JI of at most 0.2 in the case of perturbed explainedinteractions, with the number being nearly 70% for unper-turbed explained interactions. Moreover, about 72% ofboth perturbed and unperturbed explained interactionswere explained by only one link.Overall, the dominance of low JIs for the processes
and links indicated that the BPNs computed by MCMC-BPN demonstrated very little redundancy. The fact thatmost explained interactions had only one explaining linksupported this observation.
Interpretation of the BPNsCS vs. HMFigure 3 presents one of the BPNs computed using theMCMC-BPN method on the data for the CS vs. HMcontrast. The BPN contained up- and down-regulatedprocesses in different components. Most up-regulatedprocesses were related to metabolic functions performedby the liver, including lipid and carbohydrate metabolism,while most down-regulated processes related to cell repli-cation and the cytoskeleton. These reflect the greaterretention of physiological function of hepatocytes in CSculture versus HM culture, and the greater degree of de-differentiation for cells in HM versus CS, respectively, asreported by Kim et al. [17].

Lasher et al. BMC Systems Biology 2013, 7:68 Page 6 of 17http://www.biomedcentral.com/1752-0509/7/68
Overlap between links based on cross-annotated interactions
CS vs. HM Cirrhosis Very Advanced HCC
PerturbedInteractions
UnperturbedInteractions
Figure 2 Redundancy of links within BPNs. In each plot, the x-axis corresponds to the maximum observed JI for a given link, while the y-axiscorresponds to the percentage of links with a maximum observed JI within each corresponding bin on the x-axis. The height of the bar indicates theaverage over the BPNs analyzed for each contrast. Error bars represent one standard deviation from the mean. For each contrast, histograms showthe results when considering perturbed interactions (top) and unperturbed interactions (bottom).
Two main components dominate the BPNs. The firstcomponent contained a mix of processes related tofatty acid metabolism (OXIDOREDUCTASE_ACTIVITY,KEGG_PPAR_SIGNALING_PATHWAY, REACTOME_REGULATION_OF_LIPID_METABOLISM_BY_PERO-XISOME_PROLIFERATOR_ACTIVATED_RECEPTOR_ALPHA, and KEGG_BIOSYNTHESIS_OF_UNSATU-RATED_FATTY_ACIDS) and processes related to aminoacid and carbohydrate metabolism (REACTOME_METABOLISM_OF_CARBOHYDRATES,REACTOME_METABOLISM_OF_AMINO_ACIDS, and KEGG_AR-GININE_AND_PROLINE_METABOLISM), all criticalfunctions carried out by hepatocytes [26]. A link be-tween OXIDOREDUCTASE_ACTIVITY and REAC-TOME_METABOLISM_OF_AMINO_ACIDS bridgesthese two groups of processes. The second compo-nent contained down-regulated processes related to thede-differentiation of the hepatocytes in HMs.Although the names of some of the processes appear
to be very similar, their actual gene content tendedto overlap very little. For example, the sets of genesannotated to CELL_CYCLE_GO_0007049 and toKEGG_CELL_CYCLE had JI of only 0.23. SimilarlyKEGG_PPAR_SIGNALING_PATHWAY and REACTOME_REGULATION_OF_LIPID_METABOLISM_BY_PEROXISO-ME_PROLIFERATOR_ACTIVATED_RECEPTOR_ALPHA,which are directly linked in the BPN, had a genes-based JIof 0.32. Figure 4 shows the dense network of interactionsexplained by this link. While genes belonging to both
processes, such as peroxisome proliferator-activatedreceptor α(PPARA) and cholesterol 7α-hydroxylase(CYP7A1), are involved in some interactions, there aremany interactions that involve genes belonging to onlyone of the two processes.
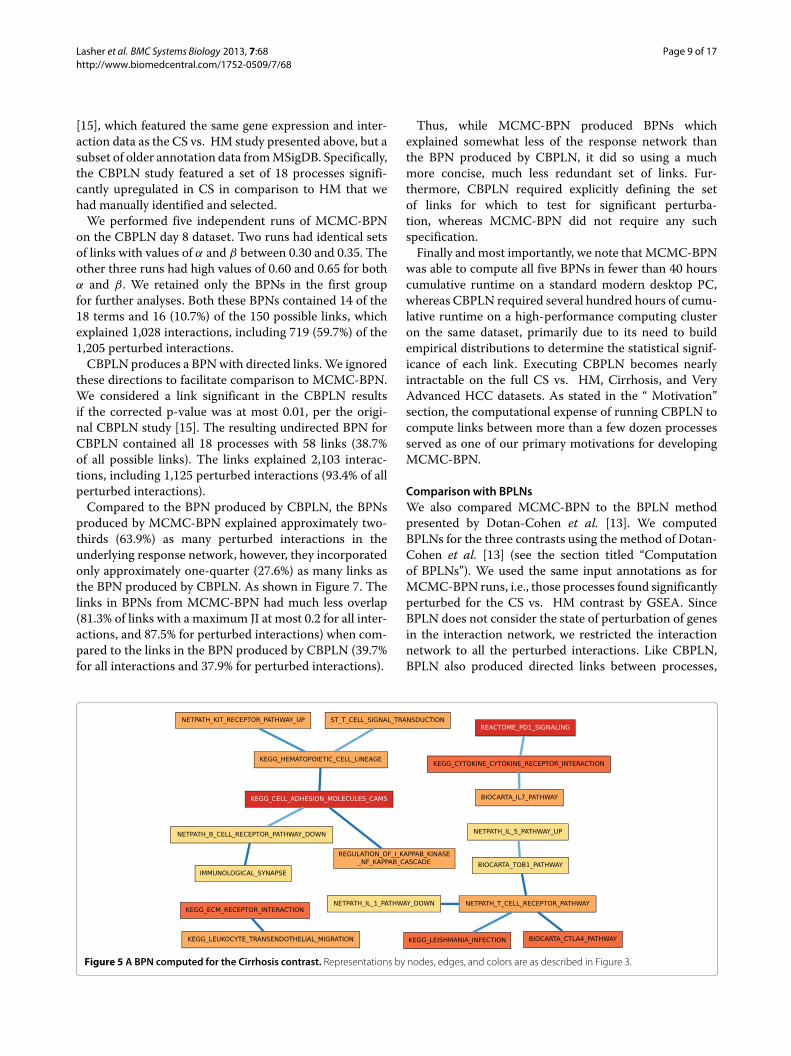
CirrhosisThe three consistent BPNs in the Cirrhosis contrast werecomposed entirely of immune response-related processes,as shown in Figure 5. While we anticipated seeing aresponse in terms of liver-related processes as in thetwo previous analyses, two factors likely played a largerole in the dominance of the immunity processes. First,all cirrhosis patients had sustained infection by HCV.Second, samples in the previous two analyses containedRNA extracted solely from hepatocytes, the cells respon-sible for the bulk of metabolic functions of the liver.The samples in this contrast (as well as Very AdvancedHCC) were from the whole liver. Thus, they contained amixture of cell types, which could dilute the signal frommetabolic processes. Our results corroborate those foundby Wurmbach et al. [18], who categorized the bulk of thedifferentiated genes as participating in immune response.
Very Advanced HCCThe majority of processes in the three similar BPNsof the Very Advanced HCC contrast related to cellreplication, owing to the advanced nature of HCC inthe patients from whom the samples were derived.(See Figure 6.) The largest component of the BPN

Lasher et al. BMC Systems Biology 2013, 7:68 Page 7 of 17http://www.biomedcentral.com/1752-0509/7/68
Figure 3 A BPN computed for the CS vs HM contrast. Rectangular nodes represent biological processes. Node color indicates collectiveperturbation of the process, as assessed by GSEA, where deep reds signify significant collective up-regulation, and deep greens signify collectivedown-regulation. Edges between process nodes represent significant links in the BPN. Dark blue edges indicate highly probable links, while lightblue edges indicate less probable links.
contained 17 processes and 18 links, including bothdown- and up-regulated processes, largely includingprocesses related to cell replication. The BPN containeda few links related to liver-specific functions, however,such as that between KEGG_VALINE_LEUCINE_AND_ISOLEUCINE_DEGRADATION and OXIDOREDUCTASE_ACTIVITY_ACTING_ON_THE_CH_CH_GROUP_OF_DONORS, both down-regulated in comparisonto control patients, indicating the progression of liverdamage in the HCC patients. Interestingly, REACTOME
_INNATE_IMMUNITY_SIGNALING was down-regu-lated in HCC patients compared to controls, suggest-ing a breakdown in immune response. MCMC-BPNreported a significant link between this process andREGULATION_OF_MITOTIC_CELL_CYCLE.
Comparison with CBPLNWe compared performance of MCMC-BPN to theCBPLN method by running MCMC-BPN over the day 8CS vs. HM dataset taken directly from the CBPLN study

Lasher et al. BMC Systems Biology 2013, 7:68 Page 8 of 17http://www.biomedcentral.com/1752-0509/7/68
Figure 4 Interactions explained by the link between two PPAR-related processes. Pentagonal nodes represent genes belonging toKEGG_PPAR_SIGNALING_PATHWAY, rectangular nodes represent genes belonging toREACTOME_REGULATION_OF_LIPID_METABOLISM_BY_PEROXISOME_PROLIFERATOR_ACTIVATED_RECEPTOR_ALPHA, and house-shaped nodesrepresent genes belonging to both processes. Red-colored nodes indicate perturbed genes. Edges between nodes represent gene-geneinteractions, with a bold edge representing a perturbed interaction.
Lasher et al. BMC Systems Biology 2013, 7:68 Page 9 of 17http://www.biomedcentral.com/1752-0509/7/68
[15], which featured the same gene expression and inter-action data as the CS vs. HM study presented above, but asubset of older annotation data fromMSigDB. Specifically,the CBPLN study featured a set of 18 processes signifi-cantly upregulated in CS in comparison to HM that wehad manually identified and selected.We performed five independent runs of MCMC-BPN
on the CBPLN day 8 dataset. Two runs had identical setsof links with values of α and β between 0.30 and 0.35. Theother three runs had high values of 0.60 and 0.65 for bothα and β . We retained only the BPNs in the first groupfor further analyses. Both these BPNs contained 14 of the18 terms and 16 (10.7%) of the 150 possible links, whichexplained 1,028 interactions, including 719 (59.7%) of the1,205 perturbed interactions.CBPLN produces a BPNwith directed links.We ignored
these directions to facilitate comparison to MCMC-BPN.We considered a link significant in the CBPLN resultsif the corrected p-value was at most 0.01, per the origi-nal CBPLN study [15]. The resulting undirected BPN forCBPLN contained all 18 processes with 58 links (38.7%of all possible links). The links explained 2,103 interac-tions, including 1,125 perturbed interactions (93.4% of allperturbed interactions).Compared to the BPN produced by CBPLN, the BPNs
produced by MCMC-BPN explained approximately two-thirds (63.9%) as many perturbed interactions in theunderlying response network, however, they incorporatedonly approximately one-quarter (27.6%) as many links asthe BPN produced by CBPLN. As shown in Figure 7. Thelinks in BPNs from MCMC-BPN had much less overlap(81.3% of links with a maximum JI at most 0.2 for all inter-actions, and 87.5% for perturbed interactions) when com-pared to the links in the BPN produced by CBPLN (39.7%for all interactions and 37.9% for perturbed interactions).
Thus, while MCMC-BPN produced BPNs whichexplained somewhat less of the response network thanthe BPN produced by CBPLN, it did so using a muchmore concise, much less redundant set of links. Fur-thermore, CBPLN required explicitly defining the setof links for which to test for significant perturba-tion, whereas MCMC-BPN did not require any suchspecification.Finally andmost importantly, we note thatMCMC-BPN
was able to compute all five BPNs in fewer than 40 hourscumulative runtime on a standard modern desktop PC,whereas CBPLN required several hundred hours of cumu-lative runtime on a high-performance computing clusteron the same dataset, primarily due to its need to buildempirical distributions to determine the statistical signif-icance of each link. Executing CBPLN becomes nearlyintractable on the full CS vs. HM, Cirrhosis, and VeryAdvanced HCC datasets. As stated in the “ Motivation”section, the computational expense of running CBPLN tocompute links between more than a few dozen processesserved as one of our primary motivations for developingMCMC-BPN.
Comparison with BPLNsWe also compared MCMC-BPN to the BPLN methodpresented by Dotan-Cohen et al. [13]. We computedBPLNs for the three contrasts using the method of Dotan-Cohen et al. [13] (see the section titled “Computationof BPLNs”). We used the same input annotations as forMCMC-BPN runs, i.e., those processes found significantlyperturbed for the CS vs. HM contrast by GSEA. SinceBPLN does not consider the state of perturbation of genesin the interaction network, we restricted the interactionnetwork to all the perturbed interactions. Like CBPLN,BPLN also produced directed links between processes,
Figure 5 A BPN computed for the Cirrhosis contrast. Representations by nodes, edges, and colors are as described in Figure 3.

Lasher et al. BMC Systems Biology 2013, 7:68 Page 10 of 17http://www.biomedcentral.com/1752-0509/7/68
Figure 6 A BPN computed for the Very Advanced HCC contrast. Representations by nodes, edges, and colors are the same as described inFigure 3.
so we considered a significant link in either directionsufficient to indicate a significant undirected link.For each contrast and for each of two stringent signif-
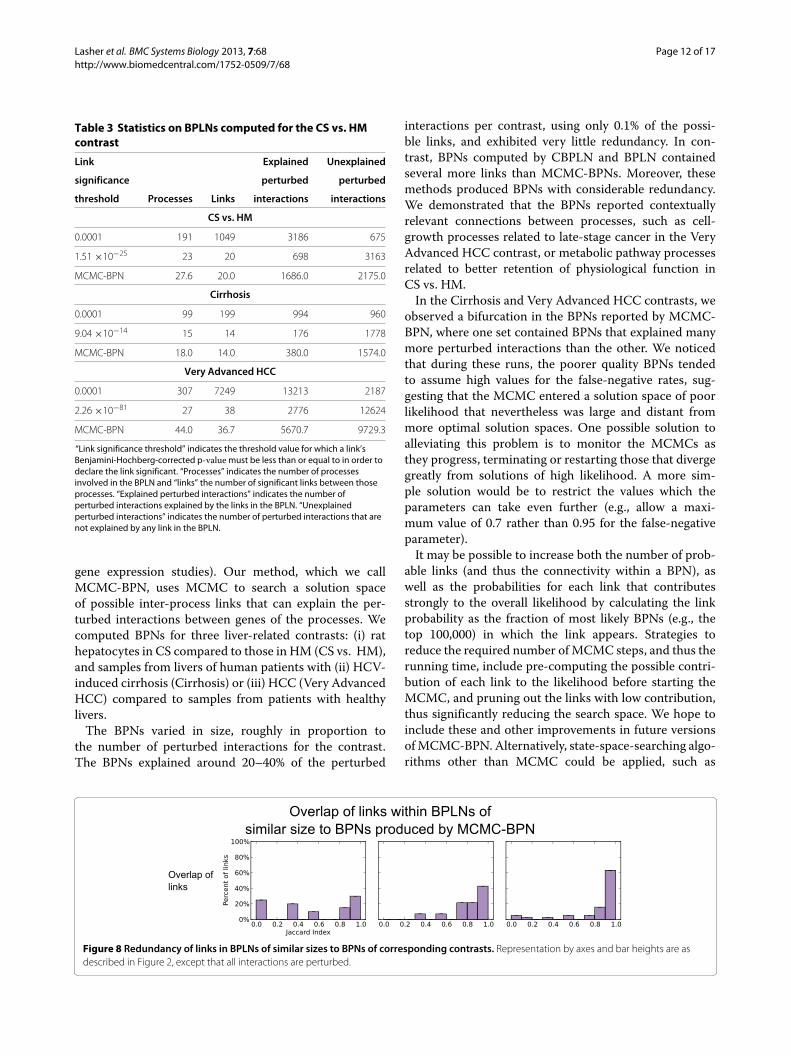
icance thresholds, Table 3 lists the number of significant(undirected) links in the BPLN, the number of processesconnected by these links, and the number of interactionsthat these links explain. The first significance thresholdof 0.0001 is an arbitrary albeit reasonable threshold thatan investigator might select when exploring results fromBPLN. The second threshold produces a BPLN with anumber of links as close to, but no fewer than, the num-ber of average links reported for MCMC-BPN (shown in
the final row for the contrast). We discuss these resultsbelow but only for the second threshold for each contrast,in order to avoid repetitiousness.
CS vs. HMThe BPLN produced at the cutoff of 1.51 ×10⁻²⁵ gavethe same number of significant links as the MCMC-BPNruns (20), but the BPLN links explained only 41% ofthe perturbed interactions explained byMCMC-BPN (seeTable 3). Further, 45% of the links in the BPLN at thiscutoff had a maximum JI between 0.8 and 1 (see Figure 8(left)).

Lasher et al. BMC Systems Biology 2013, 7:68 Page 11 of 17http://www.biomedcentral.com/1752-0509/7/68
CirrhosisA threshold of 9.04 ×10⁻¹⁴ gave a number of significantlinks for BPLN that matched the reported average forMCMC-BPN. At this threshold, the links in the BPLNresults explained fewer than half the number of perturbedgene-gene interactions. Over 65% of links had amaximumJI of 0.8 or greater (see Figure 8 (center)).
Very Advanced HCCAt the threshold of 2.26 ×10−81, the BPLN contained 38significant links, matching as closely as possible to thereported average of 36.7 for MCMC-BPN. These linksexplained less than half the number of perturbed interac-tions as those explained by the links from MCMC-BPN.The links from BPLN involved fewer processes overallcompared to MCMC-BPN. The links from the BPLNat this threshold, however, displayed a large amount ofredundancy, with 88% having a maximum JI of 0.8 orgreater; see Figure 8 (right).Thus, for all contrasts, the links reported by BPLN
proved less informative and more redundant than thosereported by MCMC-BPN.We concluded that BPLN com-puted a much poorer summary of the perturbed geneinteraction network in comparison to MCMC-BPN.
Behavior of the MCMCSince our Markov Chain has the property of irreducibility(the MCMC can reach all states from any given statewith positive probability) and aperiodicity (the MCMCwill not remain trapped in cycles), we expect that, givensufficient number of steps, MCMC will visit each state in
the solution space with a frequency proportional to thelikelihood of the state [27]. To demonstrate that MCMC-BPN follows this behavior, we performed five additionalruns of MCMC-BPN for the CS vs. HM contrast whereinwe recorded the frequency with which the MCMC vis-ited each state. In these runs, we fixed the parameters tothe most probable values as determined by the first fiveruns (λ = 0.01, α = 0.2, β = 0.35), and permitted onlylinks-based transitions.The plot in Figure 9 (left) shows the distribution of the
number of distinct states visited with a given likelihood,for different values of the likelihood. The plot in Figure 9(center) shows the distribution of the likelihoods in termsof the total number of times a state with a given likeli-hood was visited. Together, these plots indicate that theMCMC visited the most abundant states the most fre-quently.Whenwe normalized the total number of visits bythe number of distinct states, however, we observed thatthe MCMC visited the most likely states more frequentlythan those with lower likelihoods, as shown in Figure 9(right). We observed very similar behavior in all five runsfor recording the state frequencies. These results suggestthat the stationary distribution of our Markov Chain isindeed one where the probability of visiting a state isproportional to its likelihood.
ConclusionsWe have presented a method for computing connec-tions between biological processes specific to a biologi-cal context corresponding to comparing gene expressionmeasurements from two conditions (e.g., case-control
Comparison of links overlapbetween CBPLN and MCMC-BPN
CBPLN MCMC-BPN
Perturbedinteractions
Unperturbedinteractions
Figure 7 Comparison of overlap of links between BPNs produced by CBPLN andMCMC-BPN. Representation by axes and bar heights are asdescribed in Figure 2.
Lasher et al. BMC Systems Biology 2013, 7:68 Page 12 of 17http://www.biomedcentral.com/1752-0509/7/68
Table 3 Statistics on BPLNs computed for the CS vs. HMcontrast
Link Explained Unexplained
significance perturbed perturbed
threshold Processes Links interactions interactions
CS vs. HM
0.0001 191 1049 3186 675
1.51 ×10⁻²⁵ 23 20 698 3163
MCMC-BPN 27.6 20.0 1686.0 2175.0
Cirrhosis
0.0001 99 199 994 960
9.04 ×10⁻¹⁴ 15 14 176 1778
MCMC-BPN 18.0 14.0 380.0 1574.0
Very Advanced HCC
0.0001 307 7249 13213 2187
2.26 ×10−81 27 38 2776 12624
MCMC-BPN 44.0 36.7 5670.7 9729.3
“Link significance threshold” indicates the threshold value for which a link’sBenjamini-Hochberg-corrected p-valuemust be less than or equal to in order todeclare the link significant. “Processes” indicates the number of processesinvolved in the BPLN and “links” the number of significant links between thoseprocesses. “Explained perturbed interactions” indicates the number ofperturbed interactions explained by the links in the BPLN. “Unexplainedperturbed interactions” indicates the number of perturbed interactions that arenot explained by any link in the BPLN.
gene expression studies). Our method, which we callMCMC-BPN, uses MCMC to search a solution spaceof possible inter-process links that can explain the per-turbed interactions between genes of the processes. Wecomputed BPNs for three liver-related contrasts: (i) rathepatocytes in CS compared to those in HM (CS vs. HM),and samples from livers of human patients with (ii) HCV-induced cirrhosis (Cirrhosis) or (iii) HCC (Very AdvancedHCC) compared to samples from patients with healthylivers.The BPNs varied in size, roughly in proportion to
the number of perturbed interactions for the contrast.The BPNs explained around 20–40% of the perturbed
interactions per contrast, using only 0.1% of the possi-ble links, and exhibited very little redundancy. In con-trast, BPNs computed by CBPLN and BPLN containedseveral more links than MCMC-BPNs. Moreover, thesemethods produced BPNs with considerable redundancy.We demonstrated that the BPNs reported contextuallyrelevant connections between processes, such as cell-growth processes related to late-stage cancer in the VeryAdvanced HCC contrast, or metabolic pathway processesrelated to better retention of physiological function inCS vs. HM.In the Cirrhosis and Very Advanced HCC contrasts, we
observed a bifurcation in the BPNs reported by MCMC-BPN, where one set contained BPNs that explained manymore perturbed interactions than the other. We noticedthat during these runs, the poorer quality BPNs tendedto assume high values for the false-negative rates, sug-gesting that the MCMC entered a solution space of poorlikelihood that nevertheless was large and distant frommore optimal solution spaces. One possible solution toalleviating this problem is to monitor the MCMCs asthey progress, terminating or restarting those that divergegreatly from solutions of high likelihood. A more sim-ple solution would be to restrict the values which theparameters can take even further (e.g., allow a maxi-mum value of 0.7 rather than 0.95 for the false-negativeparameter).It may be possible to increase both the number of prob-
able links (and thus the connectivity within a BPN), aswell as the probabilities for each link that contributesstrongly to the overall likelihood by calculating the linkprobability as the fraction of most likely BPNs (e.g., thetop 100,000) in which the link appears. Strategies toreduce the required number of MCMC steps, and thus therunning time, include pre-computing the possible contri-bution of each link to the likelihood before starting theMCMC, and pruning out the links with low contribution,thus significantly reducing the search space. We hope toinclude these and other improvements in future versionsofMCMC-BPN. Alternatively, state-space-searching algo-rithms other than MCMC could be applied, such as
Figure 8 Redundancy of links in BPLNs of similar sizes to BPNs of corresponding contrasts. Representation by axes and bar heights are asdescribed in Figure 2, except that all interactions are perturbed.

Lasher et al. BMC Systems Biology 2013, 7:68 Page 13 of 17http://www.biomedcentral.com/1752-0509/7/68
Figure 9 Distributions of states and visitation frequencies. For all plots, the x-axis corresponds to the logarithm of the likelihood of a state. They-axes correspond to (a) the number of states, (b) frequency of visiting states with each log-likelihood value, and (c) frequency of visiting statesdivided by the number of states at that likelihood.
simulated annealing (SA). We believe that MCMC-BPNand future extensions will prove useful in revealing thelarger stories hidden within the ever-increasing amountsof high-throughput life science data.
MethodsComputing gene expression perturbationFor each contrast, we applied Linear Models forMicroarray Data (LIMMA) [6] to the microarray datato compute p-values indicating the significance ofdifferential expression of each gene. We declared all geneswith a LIMMA p-value ≤ 0.05 as perturbed.
Selection of processes for computation of BPNs
The number of candidate BPNs is O(2(
n2)
), where n is
the number of processes. Thus, the space of candidateBPNs grows extremely rapidly in comparison to thenumber of processes considered. For this reason, priorto running MCMC-BPN, we screened the processes toinclude only those that showed significant perturbation asdetermined by GSEA [7]. For each contrast, we retainedany processes with a false discovery rate (q-value) ator below the threshold value of 0.1. We also excludedthose processes with fewer than 10 genes or more than300 genes, to remove overly-specific and overly-generalprocesses, respectively.
The MCMC-BPN algorithmIdentifying perturbed cross-annotated interactionsLet G(V ,E) be an undirected graph where V is the setof genes and E = {(u, v), u, v ∈ V , u �= v, } the set ofinteractions. Let P be the set of all processes annotatingone or more genes in V. We denote the set of processesannotating a specific gene v as Pv ⊆ P. For a pair ofprocesses pi, pj ∈ P, pi �= pj, we define Cij, the setof interactions cross-annotated by pi and pj, to be thoseinteractions where one incident gene is annotated by term
pi, the other gene is annotated by term pj, but both genesare not annotated by both pi and pj. In other words,
Cij ={(u, v) ∈ E | pi ∈ Pu, pj ∈ Pv, {pi, pj} �⊆ Pu∩Pv
}.
For example, in Figure 10, C1,3 = {(v2, v3), (v3, v5)}. Notethat it does not include (v3, v4) because both genes belongto processes p1 and p3. We use C to denote the set of allcross-annotated interactions, i.e. ,
C =⋃
pi,pj∈P, pi �=pj
Cij.
We then define the perturbed cross-annotated interac-tions D ⊆ C as the subset of cross-annotated interac-tions for which both incident genes are perturbed. Lastly,we denote the subset of perturbed interactions cross-annotated by specific terms (pi, pj), where pi �= pj, asDij = Cij ∩ D. For example, in Figure 10, D1,3 = {(v2, v3)}.Calculation of BPN likelihoodLet L be the set of all possible links, comprised of allunordered pairs of processes (pi, pj) ∈ P. We say a link(pi, pj) explains the interactions which its terms cross-annotate, i.e.,Cij. Ourmethod aims to find the smallest setX of links that explains as many perturbed interactions inD as possible, while explaining as few unperturbed inter-actions in C \D as possible. To gauge how well X explainsD, we formulate a likelihood function
Pr(X,D) = Pr(X)Pr(D|X)
composed of the following terms:
• Pr(X): the probability of selecting this subset of linksX from among all possible pairs of terms in P
• Pr(D|X): the probability that the links in X explainthe observed perturbed interactions D

Lasher et al. BMC Systems Biology 2013, 7:68 Page 14 of 17http://www.biomedcentral.com/1752-0509/7/68
Figure 10 An example interaction network and Bayesian network model. A possible BPN (A) to explain the perturbation in the underlyinggene-gene interaction network (B). In the BPN (A), nodes represent processes, while edges between nodes represent hypothesized perturbed linksbetween the incident processes. In the interaction network (B), nodes represent genes, where red coloration indicates perturbation, and sub-labelsenclosed in parentheses represent processes to which each gene belongs. Edges represent interactions between those genes, and bold edgesindicate a perturbed interaction. Abbreviations: TP: true positive; FP: false positive; FN: false negative; TN: true negative.
We explicitly define each of these individual probabili-ties below.We calculate the probability Pr(X) as a Bernoulli
distribution:
Pr(X) = λ|X| (1 − λ)|L−X| ,
where 0 ≤ λ ≤ 1 represents the prior probability ofselecting a given link from the set of all links.We introduce additional terminology to define Pr(D|X),
the second probability in the likelihood function. We cancategorize each interaction within C among four classes,depending on whether or not the interaction is in D (theset of perturbed interactions), and whether or not theinteraction is explained by a link in X. We define four setsof edges Ioh ⊆ C, where o, h ∈ {0, 1}. Here, let o = 1 if andonly if the interaction is perturbed (i.e., in D), and h = 1 ifand only if one or more links in X explains the interaction.We list the four subsets below and list members of eachset in the example given in Figure 10:
(i) I11: perturbed interactions explained by at least onelink in X, i.e., the “true positives”(I11 = {(v1, v3), (v2, v3)} in the example);
(ii) I10: perturbed interactions not explained by any linksin X, i.e., the “false positives” (I10 = {(v1, v2)} in theexample);
(iii) I01: interactions that are not perturbed, but whichare explained by one or more links in X, i.e., the“false negatives” (I01 = {(v3, v5)} in the example);
(iv) I00: interactions that are not perturbed and are notexplained by any links in X, i.e., the “true negatives”(I00 = {(v5, v6)} in the example).
We briefly note here that the example in Figure 10 con-tains one additional interaction, (v3, v4), excluded fromconsideration in these categories as it does not meet thedefinition of a cross-annotated interaction, since both v3and v4 have identical annotations.With this notation, we define the probability Pr(D|X) as
the following combination of Bernoulli distributions:
Pr(D|X) = α|I10|(1 − α)|I00|β |I01|(1 − β)|I11|
where α represents the false-positive rate (i.e., the priorprobability that a perturbed interaction is not explainedby any link in X), and β represents the false-negative rate(i.e., the prior probability an unperturbed interaction isexplained by one or more links in X).Since we do not know a priori which values for the
parameters λ, α, and β will lead to the greatest likelihood,we attempt to learn estimates for these parameters as well.We denote a particular configuration of parameters as�(λ,α,β). We define the likelihood for a configuration ofparameters � and links X as
Pr(�,X,D) = Pr(�)Pr(X|�)Pr(D|�,X)
∝ λ|X| (1 − λ)|L−X| α|I10|(1− α)|I00|β |I01|(1− β)|I11|,
since we assume that all configurations of parameter val-ues are equally likely.

Lasher et al. BMC Systems Biology 2013, 7:68 Page 15 of 17http://www.biomedcentral.com/1752-0509/7/68
Distributions of the parametersWe restrict the values of the parameters to discrete,rather than continuous, distributions. We allow λ, theprior probability of selecting a link, to take valuesin the set {0.05k | 1 ≤ k ≤ 10, k ∈ N} ∪{0.00001, 0.00005, 0.0001, 0.0005, 0.001, 0.005, 0.01}. Thisset spans a wide enough range to cover computing BPNsfrommany possible links, where only a small fraction maybe included, to few links, where a large fraction of the linksmay be included. We restrict the set of values for bothα, the false-positive rate, and β , the false-negative rate, to{0.05k | 1 ≤ k < 20, k ∈ N}.Design of theMarkov chainWe define the set of all possible states in theMarkov chainas M. Each state m(�,X) ∈ M consists of two con-figurations: a configuration of parameters � and a set ofexplanatory linksX. We restrict each statem(�,X) to hav-ing two types of neighboring states m′(�′,X′): neighborswith different parameter configurations, i.e., �′ �= � butX′ = X, and neighbors with different links configurations,i.e., �′ = � but X′ �= X. We restrict the parameters-basedneighbors ofm(�,X) to be those with a different value foronly one parameter. We restrict the links-based neighborsof m(�,X) to be those with a set of links containing oneadditional or one fewer link than X′.
Design of theMarkov chainMonte CarloIn order to transition from the current state m(�,X)
to a neighboring state m′(�′,X′), we propose a links-based neighbor with probability ρ and a parameters-basedneighbor with probability 1 − ρ, where ρ, 0 ≤ ρ ≤ 1. Ifwe propose a links-based neighbor, then we draw neigh-bor m′(�′ = �,X′ �= X) uniformly at random from theset of all links-based neighbors of m(�,X). Otherwise,we draw a neighborm′(�′ �= �,X′ = X) uniformly at ran-dom from the set of all parameters-based neighbors. Inthis study, we set ρ = 0.9, so that approximately 90% ofproposed transitions were links-based.Once we select a neighbor for a proposed transition, we
follow theMetropolis-Hastings algorithm forMCMC, i.e.,we accept the transition from m(�,X) to m′(�′,X′) withprobability
Paccept = min(1,
Pr(�′,X′,D)N(m(�,X))
Pr(�,X,D)N(m′(�′,X′))
),
where N(m(�,X)) is the number of neighbors of statem(�,X) and N(m′(�′,X′)) is the number of neighbor-ing states of state m′(�′,X′). We note that becauseof the design of the Markov chain, N(m(�,X)) andN(m′(�′,X′)) are equal and thus cancel each other out. Ifwe accept the transition, thenm′(�′,X′) becomes the cur-rent state; otherwise, m(�,X) remains the current state.
Note that any time the proposed state has a greater likeli-hood than the current state, we will accept the transition.On the other hand, we still accept transitions to proposedstates with poorer likelihoods with probability propor-tional to the ratio of likelihood of the proposed state tothe likelihood of the current state. By allowing unfavorabletransitions, the MCMCmay escape local minima.At the start of each MCMC run, we begin at a state
which includes no links (i.e., X = ∅) and where eachparameter is set to a value drawn uniformly at randomfrom its respective set of possible values. We then allowthe MCMC to progress for a designated number of steps,as described below.
Reporting the BPNWe run the MCMC for a burn-in period of 107 steps. Fol-lowing the burn-in period, we run the MCMC for 108steps, recording at each step the value of each parameterλ, α, and β , as well as the links in X. Finally, the proba-bility of a parameter (λ, α, or β) being a particular valueis the fraction of recorded steps in which the parameterwas observed at this value. The probability of a link Pr(l)is the fraction of recorded steps in which a given link l ∈ Lwas observed in X. We reported links with probabilitiesmeeting or exceeding a user-defined threshold θ (we usedθ = 0.7) as those comprising the BPN, i.e., the reportedBPN is the set of links {l ∈ L | Pr(l) ≥ θ}.
Computation of BPLNsFor each experiment, using significantly perturbed pro-cesses as determined by GSEA and the subnetworkinduced by the set of perturbed interactions D as theinputs, we computed BPLNs as described by Dotan-Cohen et al. [13]. Briefly, to test whether a link existsfrom one process to another, BPLN counts the number ofgenes belonging to the second process that also neighborgenes in the first process. Using a one-sided Fisher’s ExactTest, it then determines whether this count is greaterthan expected by chance. After applying Benjamini-Hochberg correction for multiple hypothesis testing [28],we declared significant and included all links which had aq-value ≤ 0.05. Since links in BLPN are directed, and linksin BPNs returned by the MCMC method are undirected,we considered two processes pi, pj ∈ P to be linked inthe BPLN if the q-value for either (pi, pj) or (pj, pi) wassignificant.
Measuring redundancy within a BPNRedundancy of linksTo assess the redundancy of links in a BPN, we calculatedthe JI of the sets of interactions cross-annotated by everypair of links in the BPN. We calculated the JI on thebasis of only perturbed interactions and only unperturbedinteractions. For each link, we recorded the maximum

Lasher et al. BMC Systems Biology 2013, 7:68 Page 16 of 17http://www.biomedcentral.com/1752-0509/7/68
JI between that link and all other links. We computedthe mean of each of the JIs for each link over the BPNscomputed for a contrast by independent executions ofMCMC.
Explaining links per interactionFor each interaction explained by one or more links ina BPN, we counted the number of links that explain it.For every positive integer, k, we recorded the fraction ofinteractions which that were explained by k links. Wereported the average fraction over the BPNs computed fora contrast.
Software availabilityOur Python implementations of MCMC-BPN, CBPLN,and BPLN are available under the Open Source Initiative-approved MIT License from the Python Package Index athttp://pypi.python.org/pypi/BiologicalProcessNetworks.
Additional files
Additional file 1: Supplementary information. A PDF file containing (a)details on how we executed the MCMC-BPN software to obtain andvisualize our results and (b) a description of the files in the supplementaryresults.
Additional file 2: Supplementary results. A zipped file containing allthe five BPNs for each of the contrasts studied and the parametersestimated by each run of the software.
Competing interestsThe authors declare that they have no competing interests.
Authors’ contributionsCDL, PR, and TMM designed the experiments. CDL and TMM designed theMCMC-BPN algorithm. CDL implemented the software. CDL, PR, and TMMprovided the biological interpretations. All authors read and approved thefinal manuscript.
AcknowledgementsWe gratefully acknowledge financial support for this work from NationalScience Foundation grant CBET-0933225, Environmental Protection AgencySTAR grant EPA-RD-83499801, the Institute for Critical Technology andApplied Sciences Center for Systems Biology of Engineered Tissues at VirginiaTech, and the Genetics, Bioinformatics, and Computational BiologyInterdisciplinary Ph.D. Program of Virginia Tech.
Author details1Genetics, Bioinformatics, and Computational Biology Ph.D. Program, VirginiaTech, Blacksburg, VA 24061 USA. 2Department of Chemical Engineering,Virginia Tech, Blacksburg, VA 24061 USA. 3ICTAS Center for Systems Biology ofEngineered Tissues, Virginia Tech, Blacksburg, VA 24061 USA. 4Department ofComputer Science, Virginia Tech, Blacksburg, VA 24061 USA.
Received: 5 September 2012 Accepted: 26 June 2013Published: 29 July 2013
References1. Barrett T, Troup DB, Wilhite SE, Ledoux P, Evangelista C, Kim IF,
Tomashevsky M, Marshall KA, Phillippy KH, Sherman PM, Muertter RN,Holko M, Ayanbule O, Yefanov A, Soboleva A: NCBI GEO: archive forfunctional genomics data sets–10 years on. Nucleic Acids Res 2010,39(Database):D1005–D1010.
2. Parkinson H, Kapushesky M, Kolesnikov N, Rustici G, Shojatalab M,Abeygunawardena N, Berube H, Dylag M, Emam I, Farne A, Holloway E,
Lukk M, Malone J, Mani R, Pilicheva E, Rayner TF, Rezwan F, Sharma A,Williams E, Bradley XZ, Adamusiak T, Brandizi M, Burdett T, Coulson R,Krestyaninova M, Kurnosov P, Maguire E, Neogi SG, Rocca-Serra P,Sansone S, et al: ArrayExpress update–from an archive of functionalgenomics experiments to the atlas of gene expression. Nucleic AcidsRes 2009, 37(Database):D868–D872.
3. Tarcea VG, Weymouth T, Ade A, Bookvich A, Gao J, Mahavisno V, Wright Z,Chapman A, Jayapandian M, Ozgur A, Tian Y, Cavalcoli J, Mirel B, Patel J,Radev D, Athey B, States D, Jagadish HV:Michigan molecularinteractions r2: from interacting proteins to pathways. Nucleic AcidsRes 2009, 37(Database):D642–D646.
4. Jensen LJ, Kuhn M, Stark M, Chaffron S, Creevey C, Muller J, Doerks T,Julien P, Roth A, Simonovic M, Bork P, von Mering C: STRING 8–a globalview on proteins and their functional interactions in 630 organisms.Nucleic Acids Res 2009, 37(suppl_1):D412–416.
5. Tusher VG, Tibshirani R, Chu G: Significance analysis of microarraysapplied to the ionizing radiation response. Proc Nat Acad Sci 2001,98(9):5116 –5121.
6. Smyth GK: Limma: linear models for microarray data. In Bioinformaticsand Computational Biology Solutions Using R and Bioconductor. Edited byGentlemen R, Carey V, Dudoit S, Irizarry R, Huber W. New York: Springer;2005:397–420.
7. Subramanian A, Tamayo P, Mootha VK, Mukherjee S, Ebert BL, Gillette MA,Paulovich A, Pomeroy SL, Golub TR, Lander ES, Mesirov JP: Gene setenrichment analysis: A knowledge-based approach for interpretinggenome-wide expression profiles. Proc Nat Acad Sci USA 2005,102(43):15545–15550.
8. Kim S, Volsky D. BMC Bioinformatics 2005, 6:144.9. Lu Y, Rosenfeld R, Simon I, Nau GJ, Bar-Joseph Z: A probabilistic
generative model for GO enrichment analysis. Nucleic Acids Res 2008,36(17):e109.
10. Huang DW, Sherman BT, Lempicki RA: Bioinformatics enrichmenttools: paths toward the comprehensive functional analysis of largegene lists. Nucleic Acids Res 2009, 37:1–13.
11. Bauer S, Gagneur J, Robinson PN: GOing Bayesian: model-based geneset analysis of genome-scale data. Nucleic Acids Res 2010,38(11):3523–3532.
12. Li Y, Agarwal P, Rajagopalan D: A global pathway crosstalk network.Bioinformatics 2008, 24(12):1442–1447.
13. Dotan-Cohen D, Letovsky S, Melkman AA, Kasif S: Biological processlinkage networks. PLoS ONE 2009, 4(4):e5313.
14. Wang Q, Sun J, Zhou M, Yang H, Li Y, Li X, Lv S, Li X, Li Y: A novelnetwork-based method for measuring the functional relationshipbetween gene sets. Bioinformatics 2011, 27(11):1521–1528.
15. Lasher CD, Rajagopalan P, Murali TM. PLoS ONE 2011, 6:e15247.16. Metropolis N, Rosenbluth AW, Rosenbluth MN, Teller AH, Teller E:
Equation of state calculations by fast computing machines. J ChemPhys 1953, 21(6):1087.
17. Kim Y, Lasher CD, Milford LM, Murali T, Rajagopalan P: A comparativestudy of genome-wide transcriptional profiles of primaryhepatocytes in collagen sandwich andmonolayer cultures. TissueEng Part C: Methods 2010, 16(6):1449–1460.
18. Wurmbach E, Chen Y, Khitrov G, Zhang W, Roayaie S, Schwartz M, Fiel I,Thung S, Mazzaferro V, Bruix J, Bottinger E, Friedman S, Waxman S, LlovetJM: Genome-wide molecular profiles of HCV-induced dysplasia andhepatocellular carcinoma. Hepatology 2007, 45(4):938–947.
19. Marcellin P: Hepatitis B and hepatitis C in 2009. Liver Int 2009, 29:1–8.20. Yang JD, Roberts LR: Hepatocellular carcinoma: a global view. Nat Rev
Gastroenterol Hepatol 2010, 7(8):448–458.21. Ruepp A, Waegele B, Lechner M, Brauner B, Dunger-Kaltenbach I, Fobo G,
Frishman G, Montrone C, Mewes H: CORUM: the comprehensiveresource of mammalian protein complexes–2009. Nucleic Acids Res2009, 38(Database):D497–D501.
22. Kandasamy K, Mohan SS, Raju R, Keerthikumar S, Kumar GSS, VenugopalAK, Telikicherla D, Navarro JD, Mathivanan S, Pecquet C, Gollapudi SK,Tattikota SG, Mohan S, Padhukasahasram H, Subbannayya Y, Goel R,Jacob HKC, Zhong J, Sekhar R, Nanjappa V, Balakrishnan L, Subbaiah R,Ramachandra YL, Rahiman BA, Prasad TSK, Lin J, Houtman JCD, DesiderioS, Renauld J, et al: NetPath: a public resource of curated signaltransduction pathways. Genome Biol 2010, 11:R3.

Lasher et al. BMC Systems Biology 2013, 7:68 Page 17 of 17http://www.biomedcentral.com/1752-0509/7/68
23. Schaefer CF, Anthony K, Krupa S, Buchoff J, Day M, Hannay T, Buetow KH:PID: the Pathway Interaction Database. Nucleic Acids Res 2009,37(Database):D674–D679.
24. Berriz GF, Roth FP: The Synergizer service for translating gene, proteinand other biological identifiers. Bioinformatics 2008, 24(19):2272–2273.
25. Baron D, Bihouée A, Teusan R, Dubois E, Savagner F, Steenman M,Houlgatte R, Ramstein G:MADGene: retrieval and processing of geneidentifier lists for the analysis of heterogeneous microarraydatasets. Bioinformatics 2011, 27(5):725–726.
26. Arias IM, Boyer JL, Chisari FV, Fausto M, Schachter D, Shafritz DA: The Liver:Biology and Pathobiology. Philadelphia: Lippincott Williams and Wilkins;2001.
27. Andrieu C, De Freitas N, Doucet A, Jordan MI: An introduction to MCMCfor machine learning.Mach Learn 2003, 50:5–43.
28. Benjamini Y, Hochberg Y: Controlling the false discovery rate: apractical and powerful approach to multiple testing. J R Stat Soc. Ser B(Methodological) 1995, 57:289–300.
doi:10.1186/1752-0509-7-68Cite this article as: Lasher et al.: Summarizing cellular responses as biologi-cal process networks. BMC Systems Biology 2013 7:68.
Submit your next manuscript to BioMed Centraland take full advantage of:
• Convenient online submission
• Thorough peer review
• No space constraints or color figure charges
• Immediate publication on acceptance
• Inclusion in PubMed, CAS, Scopus and Google Scholar
• Research which is freely available for redistribution
Submit your manuscript at www.biomedcentral.com/submit