Embed Size (px)
Citation preview

SUCCESSFUL INVENTORY PLANNING REQUIRES A NEW APPROACH
Presentation at GSKOctober 15, 2002

©2002 SmartOps Corporation 2
Fundamental, persistent forces behind supply chain inefficiency:
Inability to accommodate and actively manage inevitable uncertainty and increasing complexity across multistage supply chains
Local vs. global (“total cost”) optimization and incentives – uncoordinated inventory and logistics decisions within enterprises, across supply chains
Underutilization of current systems and available best practices, e.g., “planner variability”, "too much transactional data"
DESPITE ERP AND APS, THERE IS SIGNIFICANT INVENTORY INEFFICIENCY IN OUR ECONOMY
$1.0 trillion 50+% $500+ billion
U.S. inventoriesEstimated inefficiency
Economic opportunity
What is missing?
What is Missing?
Tactical and Strategic Inventory Planning to accommodate and manage these forces
©2002 SmartOps Corporation 3
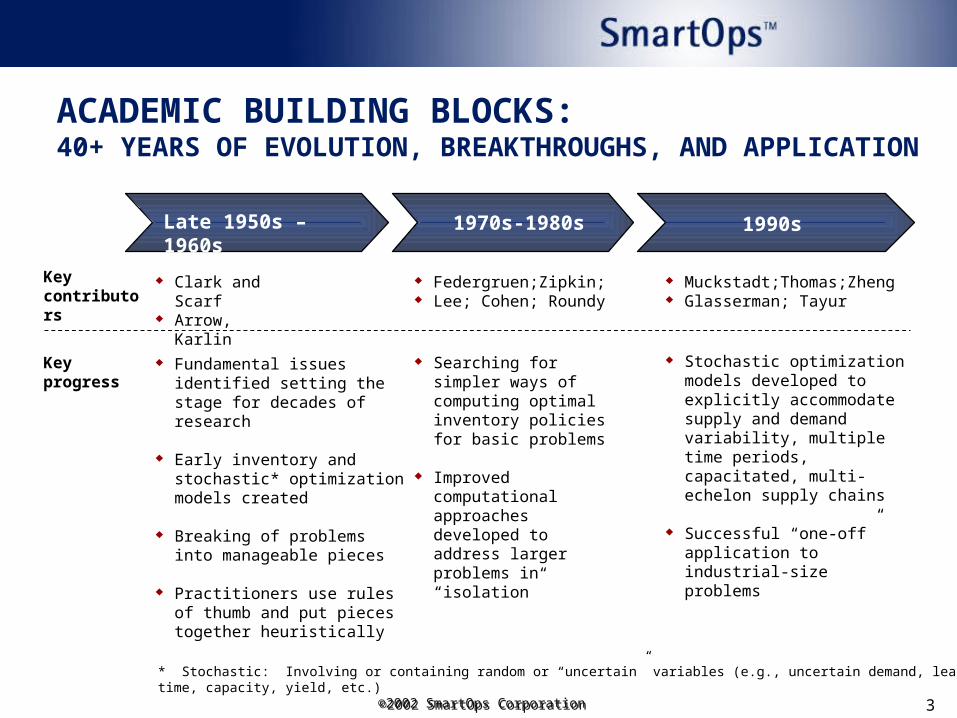
ACADEMIC BUILDING BLOCKS:40+ YEARS OF EVOLUTION, BREAKTHROUGHS, AND APPLICATION
Late 1950s – 1960s
Fundamental issues identified setting the stage for decades of research
Early inventory and stochastic* optimization models created
Breaking of problems into manageable pieces
Practitioners use rules of thumb and put pieces together heuristically
1970s-1980s 1990s
Searching for simpler ways of computing optimal inventory policies for basic problems
Improved computational approaches developed to address larger problems in “isolation”
Stochastic optimization models developed to explicitly accommodate supply and demand variability, multiple time periods, capacitated, multi-echelon supply chains
Successful “one-off” application to industrial-size problems
Clark and Scarf Arrow, Karlin
Federgruen;Zipkin; Lee; Cohen; Roundy
Muckstadt;Thomas;Zheng Glasserman; Tayur
Key progress
Key contributors
©2002 SmartOps Corporation
* Stochastic: Involving or containing random or “uncertain” variables (e.g., uncertain demand, lead time, capacity, yield, etc.)

©2002 SmartOps Corporation 4
DRIVERS OF SUPPLY CHAIN INEFFICIENCYLimited
understanding and visibility into
inventory drivers
Complex multi-stage supply
chain
Uncoordinated inventory
targets across stages
Numerous, disparate planning
systems
Capacity vs. inventory trade-off
not modeled
Inconsistent approach to determining
shipment frequencies and quantities
Plants
Chicago, IL
Gary, IN
Cross-dock facilities/ distribution poolsWindsor, ONT
RTP, NC
Richmond, VA
Oshkosh, WI
Norcross, GA
Knoxville, TN
2,500 Dealers/retailers

©2002 SmartOps Corporation 5
UNDERSTANDING MODELING APPROACHES
Annually/quarterly Weekly/dailyQuarterly/monthly
Low detail/granularity High detail/granularity
N/A
N/A
Planner
Planner & O.R. engineer
O.R. engineer
Business Unit Planning and Operations
Corporate/ Business Unit Strategy
Org
an
iza
tio
n
Da
ta m
an
ag
em
en
t/u
pd
ate
p
roc
es
s
Relation to existing processes
Stand-alone Dynamic
One-off studies Driving execution
Structural changes
Continuous improvement
“Dynamic value chain”
©2002 SmartOps Corporation
ERP/APS detailed, dynamic data inputs
Manual, “meta-level” inputs, click and drag design
SWEET S
POT
The goal is to pick an approach that ensures confidence in the answer, quick hit improvements, and sustained execution
Timed, regular data loading
Data-loader with manual start
Data wizard and interface
Timing/dynamic frequency

©2002 SmartOps Corporation 6
UNDERSTANDING MODELING APPROACHES
Annually/quarterly Weekly/dailyQuarterly/monthly
Low detail/granularity High detail/granularity
Planner
Planner & O.R. engineer
O.R. engineer
Business Unit Planning and Operations
Corporate/ Business Unit Strategy
Org
an
izatio
n
Da
ta m
an
ag
em
en
t/u
pd
ate
pro
ce
ss
Relation to existing processes
Stand-alone Dynamic
One-off studies Driving execution
Structural changes Continuous improvement
“Dynamic value chain”
ERP/APS detailed, dynamic
data inputs
Manual, “meta-level” inputs, click and drag design
N/A
N/A
Timed, regular data loading
Data-loader with manual start
Data wizard and interface
Timing/dynamic frequency
The goal is to pick an approach that ensures confidence in the answer, quick hit improvements, and sustained execution.
SmartOps:GSK
SmartOps:John Deere
SmartOps:Giant Eagle

©2002 SmartOps Corporation 7
A SUPPLY CHAIN MODELING PROCESS
Map the current value chain
Select relevant variables, constraints, and objective function
Initial collection, cleaning, and QA of data
Selection of planning granularity
Select optimization algorithms
Commence data integration process
Full, partial, or no automation of inputs and outputs
Entire network or subset
All nodes or simplification of nodes
Simplifying assumptions to include or exclude variables, constraints, or nodes considering quality of answer vs. speed of answer
Understand underlying data assumptions
Ensure data makes sense in business and supply chain terms
Days, weeks, months
Product hierarchy – sales model vs. MA
# of nodes and time periods
Stationary or non-stationary model (e.g. # of forecast periods)
Single or multi-echelon or hybrid
Capacitated, un-capacitated
Load data and pre-process meta-data
Calculation/ optimization
Scenarios/ what-if
QA outputsPost-process and summarize
Review outputs - send to operational system/ process
Change structure of value chain
Run test cases vs. actual data
Understand processing speed
Design, build, and run logical scenarios
Test boundary conditions
Compare results with expectations based on theory and domain expertise
Aggregation/dis-aggregation
Units/$s/Weeks Rounding
Manual, exception-based, or automatic export of targets to planning systems
Changes to “nodes” and “arcs” vs. changes to echelons and BOMs
Compute meta-data: lead-times, lead time variabilites, forecast disagg. etc.
Refresh inputs
©2002 SmartOps Corporation

©2002 SmartOps Corporation 8
©2002 SmartOps Corporation 9
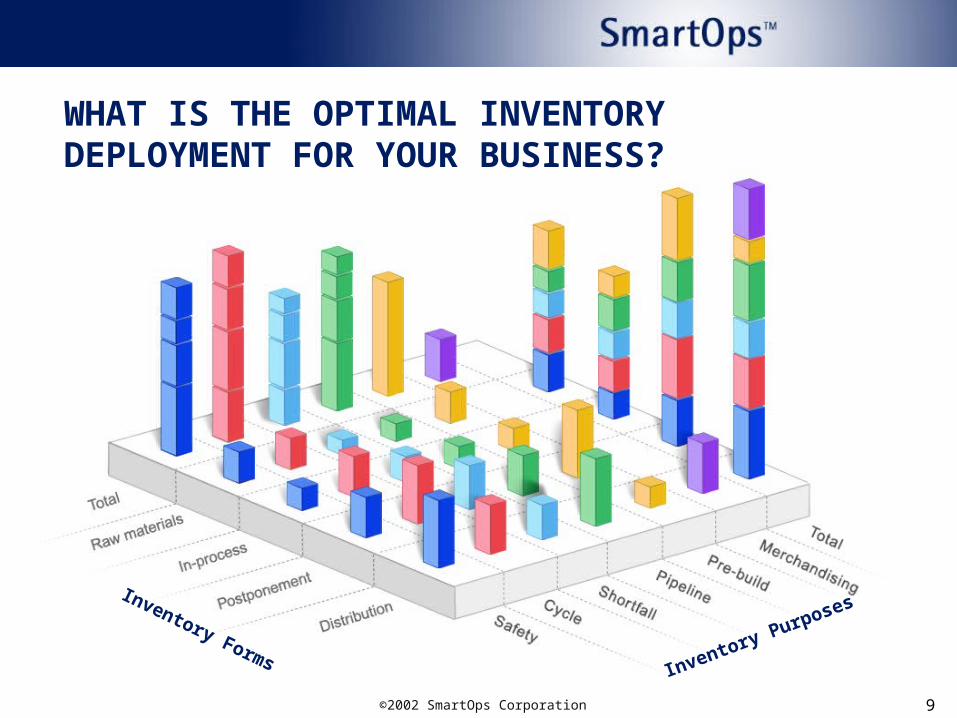
WHAT IS THE OPTIMAL INVENTORY DEPLOYMENT FOR YOUR BUSINESS?
Inventory FormsInventory Purposes

©2002 SmartOps Corporation 10
NOT ALL INVENTORY IS CREATED EQUAL
Buffers against supply and demand uncertainty
Results from economies of production, transport, procurement
In-transit and in-process inventory
Buffers against upstream capacity un-reliability
Covers expected demand, driven by capacity constraints
Display/demo stock
Safety Stock
Cycle Stock
Pipeline Stock
Shortfall Stock
Pre-build Stock
Merchandising

©2002 SmartOps Corporation 11

©2002 SmartOps Corporation 12
A COMPREHENSIVE APPROACH TO SUPPLY CHAIN PLANNING AND OPTIMIZATION
Measuring all inventory driversOutput for each SKU at each inventory stocking location over time
Target inventory positions– Cycle stock– Safety stock– Shortfall stock– Pipeline stock– Merchandising stock– Pre-build stock
Minimum total inventory needed to deliver current service levels
Optimal service levels and inventory required, given product margins
Scenario analysis for comparing different sets of inputs and outputs
Lead times and lead time variability Frequency of shipments, both factory to
warehouse and warehouse to dealer Demand, demand variability, intermittent Forecasts and forecast errors Seasonality, Non-stationary demand Service levels and amount of lost sales Customer wait times (patience levels) Promotions, Vendor Deals, Forward Buys Capacities at upstream production,
transportation, warehouse, retail outlets Transportation alternatives, expediting costs Budget constraints on total inventory dollars Showroom inventory levels Aggregation and disaggregation

©2002 SmartOps Corporation 13
STOCHASTIC OPTIMIZATION IS NECESSARY
Total Cost Optimization
– Cycle stock– Pre-build stock– Pipeline stock
APS challenges– Scheduling a factory– Packing a truck– Routing a truck
Managing uncertainty
Safety stock Shortfall stock
Certain or near-certain
“Deterministic”
Uncertain
“Stochastic”
Linear and Integer
Non-linear Linear, deterministic models are not appropriate for most critical inventory decisions in multistage, multi-product, capacitated, stochastic environments
©2002 SmartOps Corporation 14
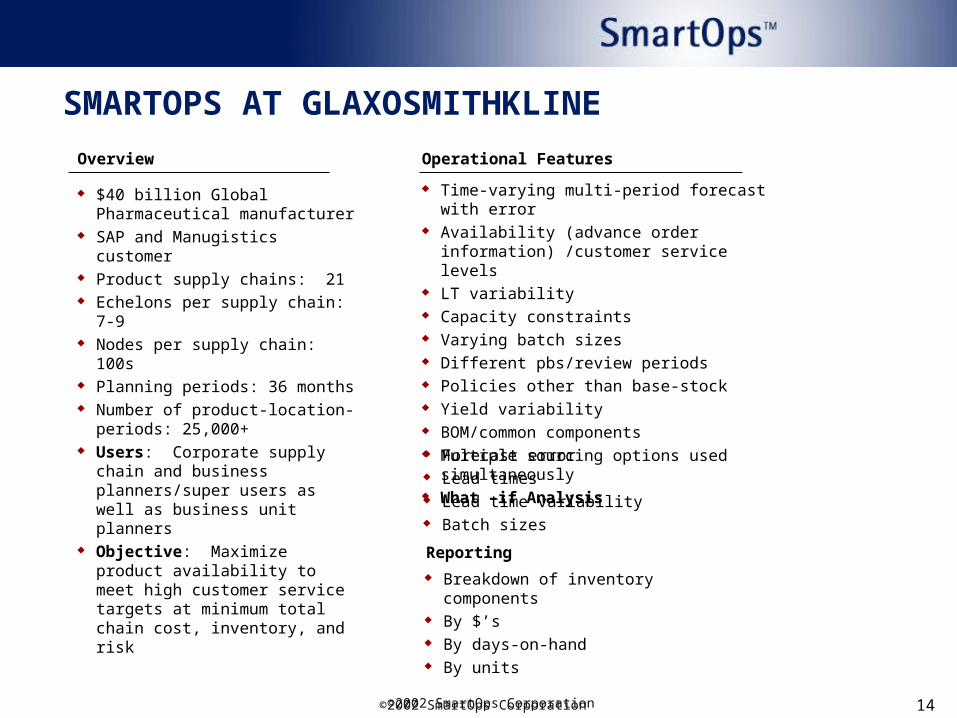
SMARTOPS AT GLAXOSMITHKLINE
Overview Operational Features
$40 billion Global Pharmaceutical manufacturer
SAP and Manugistics customer Product supply chains: 21 Echelons per supply chain: 7-9 Nodes per supply chain: 100s Planning periods: 36 months Number of product-location-periods:
25,000+ Users: Corporate supply chain and
business planners/super users as well as business unit planners
Objective: Maximize product availability to meet high customer service targets at minimum total chain cost, inventory, and risk
Time-varying multi-period forecast with error Availability (advance order information)
/customer service levels LT variability Capacity constraints Varying batch sizes Different pbs/review periods Policies other than base-stock Yield variability BOM/common components Multiple sourcing options used simultaneously What –if Analysis Forecast error Lead times Lead time variability Batch sizes
Reporting
Breakdown of inventory components By $’s By days-on-hand By units
©2002 SmartOps Corporation

©2002 SmartOps Corporation 15
Imigran Detailed Supply Chain
BULK IMIGRAN INJECTION VIAL 12MG/ML X 0.5ML
BULK IMIGRAN SYRINGE 6MG/0.5ML GD SYRINGE X0.5ML
BARNARD CASTLE
BULK IMIGRAN INJECTION VIAL 12MG/ML X 0.5ML
BULK IMIGRAN INJECTION VIAL 12MG/ML X 0.5ML
ZEBULON
MISSISSAUGABULK IMIGRAN SYRINGE 6 MG/0.5MLOM SYRINGE X 0.5ML
ZEBULON
BULK IMIGRAN SYRINGE 6 MG/0.5ML GDSYRINGE X 0.5ML
IMIGRAN SUPPOSITORY 25 MG
BULK IMIGRAN INJECTION AMPOULE 3MG/ML AMPOULE X 1ML
IMIGRAN TABLET 50 MG
IMIGRAN INTRANASAL 10 MG
IMIGRAN INTRANASAL 20 MG
IMIGRAN INTRANASAL 5 MG
BULK IMIGRAN SYRINGE 6 MG/0.5ML GDSYRINGE X 0.5ML
WARE
IMIGRAN TABLET 100 MGIMIGRAN TABLET 100 MG
IMIGRAN TABLET 50 MG
IMIGRAN TABLET 50 MG
IMIGRAN TABLET 100 MG
IMIGRAN TABLET 25 MG
IMIGRAN TABLET 50 MG
IMIGRAN TABLET 100 MG
IMIGRAN TABLET 25 MG
SUMITRIPTAN
EVREUX
IMAICHI
PARMA
ZEBULON
SUMITRIPTAN
SUMITRIPTAN
SUMITRIPTAN
SUMITRIPTAN
SUMITRIPTAN
SUMITRIPTAN
JURONG
SULPHAZINE
BISULPHITEADDUCT
IMIGRAN TABLET 50 MG DFB X 4TAB 1 SPAIN IMIGRAN TABLET 50 MG DFB X 4TAB 1 SPAIN
IMIGRAN TABLET 100 MG DFB X 3TAB 1 GERMANY IMIGRAN TABLET 100 MG DFB X 3TAB 1 GERMANY
IMIGRAN TABLET 100 MG DFB X 6TAB 1 GERMANYIMIGRAN TABLET 100 MG DFB X 6TAB 1 GERMANY
IMIGRAN TABLET 50 MG DFB X 6TAB 1 GERMANY
IMIGRAN SYRINGE 6 MG/0.5ML GD SYRINGE X 0.5ML 2 AUSTRALIA
IMIGRAN SYRINGE 6 MG/0.5ML GD SYRINGE X 0.5ML 2 FRANCE
IMIGRAN SYRINGE 6 MG/0.5ML GD SYRINGE X 0.5ML 2 GERMANY
IMIGRAN SYRINGE 6 MG/0.5ML GD SYRINGE X 0.5ML 2 UK
IMIGRAN SYRINGE 6 MG/0.5ML GD SYRINGE X 0.5ML 6 UKIMIGRAN SYRINGE 6 MG/0.5ML GD SYRINGE X 2DEV 1 UK
IMIGRAN SYRINGE 6 MG/0.5ML OM SYRINGE X 0.5ML 2 GERMANY
IMIGRAN INJECTION VIAL 12 MG/ML VIAL X 0.5ML 5 CANADAIMIGRAN INJECTION VIAL 12 MG/ML VIAL X 0.5ML 5 CANADA
IMIGRAN SYRINGE 6 MG/0.5ML OM SYRINGE X 0.5ML 2 CANADA IMIGRAN SYRINGE 6 MG/0.5ML OM SYRINGE X 0.5ML 2 CANADA
MISSISSAUGA
IMIGRAN INJECTION AMPOULE 3 MG/ML AMPOULE X 1ML 2 JAPANIMIGRAN INJECTION AMPOULE 3 MG/ML AMPOULE X 1ML 2 JAPAN
IMIGRAN INJECTION VIAL 12 MG/ML VIAL X 0.5ML 5 USA IMIGRAN INJECTION VIAL 12 MG/ML VIAL X 0.5ML 5 USA
IMIGRAN INTRANASAL 10 MG BLISTER X 1DEV 1 FRANCE
IMIGRAN INTRANASAL 10 MG BLISTER X 2DEV 1 AUSTRALIA
IMIGRAN INTRANASAL 10 MG BLISTER X 2DEV 1 FRANCE
IMIGRAN INTRANASAL 10 MG BLISTER X 2DEV 1 GERMANY
IMIGRAN INTRANASAL 20 MG BLISTER X 1DEV 1 FRANCE
IMIGRAN INTRANASAL 20 MG BLISTER X 1DEV 1 MEXICO
IMIGRAN INTRANASAL 20 MG BLISTER X 1DEV 1 USAIMIGRAN INTRANASAL 20 MG BLISTER X 2DEV 1 AUSTRALIA
IMIGRAN INTRANASAL 20 MG BLISTER X 2DEV 1 CANADAIMIGRAN INTRANASAL 20 MG BLISTER X 2DEV 1 FRANCEIMIGRAN INTRANASAL 20 MG BLISTER X 2DEV 1 GERMANYIMIGRAN INTRANASAL 20 MG BLISTER X 2DEV 1 ITALYIMIGRAN INTRANASAL 20 MG BLISTER X 2DEV 1 SPAIN
IMIGRAN INTRANASAL 20 MG BLISTER X 2DEV 3 CANADAIMIGRAN INTRANASAL 20 MG BLISTER X 2DEV 3 FRANCEIMIGRAN INTRANASAL 20 MG BLISTER X 2DEV 3 UKIMIGRAN INTRANASAL 20 MG BLISTER X 2DEV 3 USAIMIGRAN INTRANASAL 20 MG BOTTLE X 2DEV 1 JAPAN
IMIGRAN INTRANASAL 20 MG INTRANASAL X 2DEV 1 UKIMIGRAN INTRANASAL 20 MG INTRANASAL X 2DEV 3 GERMANY
IMIGRAN INTRANASAL 5 MG BLISTER X 2DEV 3 CANADA
IMIGRAN INTRANASAL 5 MG BLISTER X 2DEV 3 USA
IMIGRAN INTRANASAL 5 MG BLISTER X 2DEV 3 CANADA
IMIGRAN INTRANASAL 5 MG BLISTER X 2DEV 3 USA
IMIGRAN SUPPOSITORY 25 MG BLISTER MOULD X 6SUP 1 GERMANY
IMIGRAN SUPPOSITORY 25 MG BLISTER MOULD X 2SUP 1 ITALY
IMIGRAN SUPPOSITORY 25 MG BLISTER MOULD X 6SUP 1 GERMANY
IMIGRAN SUPPOSITORY 25 MG BLISTER MOULD X 2SUP 1 ITALY
IMIGRAN SYRINGE 6 MG/0.5ML GD SYRINGE X 0.5ML 2 SPAINIMIGRAN SYRINGE 6 MG/0.5ML GD SYRINGE X 0.5ML 2 SPAIN
IMIGRAN SYRINGE 6 MG/0.5ML GD SYRINGE X 0.5ML 2 USA
IMIGRAN SYRINGE 6 MG/0.5ML GD SYRINGE X 0.5ML 2 USA
IMIGRAN SYRINGE 6 MG/0.5ML OM SYRINGE X 0.5ML 1 MEXICO
XOCHIMILCO - MEXICO CITY
BULK IMIGRAN SYRINGE 6 MG/0.5MLOM SYRINGE X 0.5ML
IMIGRAN SYRINGE 6 MG/0.5ML OM SYRINGE X 0.5ML 1 MEXICO
IMIGRAN TABLET 50 MG DFB X 4TAB 1 ITALY
IMIGRAN TABLET 50 MG DFB X 6TAB 1 UKIMIGRAN TABLET 50 MG DFB X 6TAB 2 UK
IMIGRAN TABLET 50 MG DFB X 4TAB 1 ITALY
IMIGRAN TABLET 50 MG DFB X 6TAB 1 UKIMIGRAN TABLET 50 MG DFB X 6TAB 2 UK
IMIGRAN TABLET 100 MG DFB X 6TAB 1 UK IMIGRAN TABLET 100 MG DFB X 6TAB 1 UK
IMIGRAN TABLET 100 MG BLISTER X 1TAB 1 USAIMIGRAN TABLET 100 MG BLISTER X 3TAB 3 USA
IMIGRAN TABLET 100 MG BLISTER X 1TAB 1 USAIMIGRAN TABLET 100 MG BLISTER X 3TAB 3 USA
IMIGRAN TABLET 25 MG BLISTER X 3TAB 3 USAIMIGRAN TABLET 25 MG BLISTER X 3TAB 3 USA
IMIGRAN TABLET 25 MG BLISTER X 6TAB 4 CANADAIMIGRAN TABLET 25 MG BLISTER X 6TAB 4 CANADA
IMIGRAN SYRINGE 6 MG/0.5ML OM SYRINGE X 0.5ML 2 USA
IMIGRAN SYRINGE 6 MG/0.5ML OM SYRINGE X 0.5ML 2 USA
IMIGRAN TABLET 100 MG DFB X 2TAB 1 AUSTRALIA IMIGRAN TABLET 100 MG DFB X 2TAB 1 AUSTRALIA
IMIGRAN TABLET 100 MG BLISTER X 6TAB 4 CANADA
MISSISSAUGA
IMIGRAN TABLET 100 MG BLISTER X 6TAB 4 CANADA
IMIGRAN TABLET 100 MG DFB X 4TAB 1 ITALY IMIGRAN TABLET 100 MG DFB X 4TAB 1 ITALY
IMIGRAN TABLET 100 MG DFB X 2TAB 1 MEXICO IMIGRAN TABLET 100 MG DFB X 2TAB 1 MEXICOXOCHIMILCO - MEXICO CITY
IMIGRAN TABLET 50 MG BLISTER X 1TAB 1 USAIMIGRAN TABLET 50 MG BLISTER X 3TAB 3 USA
IMIGRAN TABLET 50 MG BLISTER X 1TAB 1 USAIMIGRAN TABLET 50 MG BLISTER X 3TAB 3 USA
IMIGRAN TABLET 50 MG DFB X 2TAB 1 AUSTRALIAIMIGRAN TABLET 50 MG DFB X 2TAB 1 AUSTRALIAIMIGRAN TABLET 50 MG DFB X 4TAB 1 AUSTRALIAIMIGRAN TABLET 50 MG DFB X 4TAB 1 AUSTRALIA
IMIGRAN TABLET 50 MG BLISTER X 2TAB 1 FRANCEIMIGRAN TABLET 50 MG BLISTER X 6TAB 1 FRANCE
IMIGRAN TABLET 50 MG THERMOFORMED BLISTER X 6TAB 10 JAPANIMIGRAN TABLET 50 MG THERMOFORMED BLISTER X 6TAB 2 JAPAN
IMIGRAN TABLET 50 MG THERMOFORMED BLISTER X 6TAB 10 JAPANIMIGRAN TABLET 50 MG THERMOFORMED BLISTER X 6TAB 2 JAPAN
IMIGRAN TABLET 50 MG BLISTER X 6TAB 4 CANADA IMIGRAN TABLET 50 MG BLISTER X 6TAB 4 CANADA
IMIGRAN SYRINGE 6 MG/0.5ML GD SYRINGE X 0.5ML 2 AUSTRALIA
IMIGRAN SYRINGE 6 MG/0.5ML GD SYRINGE X 0.5ML 2 FRANCE
IMIGRAN SYRINGE 6 MG/0.5ML GD SYRINGE X 0.5ML 2 GERMANYIMIGRAN SYRINGE 6 MG/0.5ML GD SYRINGE X 0.5ML 2 UK
IMIGRAN SYRINGE 6 MG/0.5ML GD SYRINGE X 0.5ML 6 UK
IMIGRAN SYRINGE 6 MG/0.5ML GD SYRINGE X 2DEV 1 UK
IMIGRAN SYRINGE 6 MG/0.5ML OM SYRINGE X 0.5ML 2 GERMANY
IMIGRAN TABLET 100 MG
BORONIAIMIGRAN TABLET 100 MG
IMIGRAN TABLET 50 MG
EVREUXIMIGRAN TABLET 50 MG
IMIGRAN TABLET 50 MG
IMIGRAN TABLET 50 MG
IMIGRAN TABLET 100 MG
BAD OLDESLOE
PARMA
BAD OLDESLOEIMIGRAN TABLET 50 MG DFB X 6TAB 1 GERMANY
BORONIA
ARANDA
IMIGRAN TABLET 50 MG BLISTER X 2TAB 1 FRANCEIMIGRAN TABLET 50 MG BLISTER X 6TAB 1 FRANCE
MISSISSAUGA
MISSISSAUGA
IMIGRAN TABLET 50 MG DFB X 2TAB 1 MEXICO
XOCHIMILCO - MEXICO CITYIMIGRAN TABLET 50 MG
IMIGRAN TABLET 50 MG DFB X 2TAB 1 MEXICO
MIGRAN TABLET 50 MG DFB X 4TAB 1 OTHERIMIGRAN TABLET 50 MG MIGRAN TABLET 50 MG DFB X 4TAB 1 OTHER
DUMMY SITE
IMIGRAN SYRINGE 6 MG/0.5ML GD SYRINGE X 0.5ML 2 OTHERDUMMY SITE
BULK IMIGRAN SYRINGE 6 MG/0.5ML GDSYRINGE X 0.5ML
IMIGRAN SYRINGE 6 MG/0.5ML GD SYRINGE X 0.5ML 2 OTHER
IMIGRAN INTRANASAL 20 MG BLISTER X 1DEV 1 OTHERIMIGRAN INTRANASAL 20 MG BLISTER X 1DEV 1 OTHER
DUMMY SITEBULK IMIGRAN INTRANASAL10 MG
BULK IMIGRAN SYRINGE 6MG/0.5ML OM SYRINGE X0.5ML
BULK IMIGRAN SYRINGE 6 MG/0.5ML OMSYRINGE X 0.5ML

©2002 SmartOps Corporation 16
“TOTAL CHAIN” INVENTORY OPTIMIZATION DRIVES KEY BUSINESS DECISIONS
Where should we be now? (Finished Goods and Raw Materials/Components) Based on target manufacturing lead times, target availabilities, and capacities where should we strategically place
inventory? At what target inventory levels?
What are optimal inventory levels by product, component, and location over time?
– Markets as well as factory, warehouse, and pool inventories
What are the key factors that shift the optimal inventory curve?
What happens to the optimal inventory curve in different demand scenarios?
How low can we go? In what stages? By when? How low can we reduce inventory before we begin to impact sales?
What is the sensitivity of inventory to certain key factors?
– Lead time, forecast error, target availability, customer wait time, merchandising requirements, etc.
– What is the cost/benefit of inflexible/flexible capacity?
What is the benefit or business case for attacking certain supply chain parameters – e.g. lead times, availabilities,
flexible capacity?
For a given corporate inventory budget constraint, where should I deploy inventory and what does this mean for
customer service and product availability?
©2002 SmartOps Corporation

©2002 SmartOps Corporation 17
SUPPLY CHAIN PLANNING WORKFLOW
Supply plan
Operational planning synchronizing demand to material
and capacity constraints
Visibility into inventory drivers
What-if analysis
Derived supply data
Pricing Lead times Logistics Capacity
constraints Variability,
uncertainty
Supply
Execution systems
115±Time-phased key operating targets
Multistage inventory positions
Lot sizes Service
levels
Demand
100 125 115
Uncertainty & variability
Product management
Sales channels
Historical demand
Deterministic consensus demand forecast
Derived demand
data
Strategic & Tactical Budgeting Design S&OP
Strategic & Tactical Budgeting Design S&OP

©2002 SmartOps Corporation 18
Strategic(Yearly/quarterly)
Tactical(Quarterly/monthly)
Operational(Weekly/daily)
Inventory Budgeting Designing rapid response
supply networks Sourcing Postponement Strategy
Sales and operations planning Inventory planning Scenario analysis
Inventory management Order execution and fulfillment
Aggregate inventory budgets Inventory policies and
placement Expediting policies
Optimal planning parameters– Form of inventory: raw, WIP,
postponement, finished– Purpose of inventory: safety,
cycle, shortfall, pipeline, pre-build, merchandising
Alerts and exceptions Updated supply and demand
statistics
Activity Planning process Key outputs
INVENTORY PLANNING AND OPTIMIZATION SUPPORTS CRITICAL BUSINESS PROCESSES

©2002 SmartOps Corporation 19
Product Architecture

©2002 SmartOps Corporation 20
DEFINING AND AN ORDER FULFILLMENT STRATEGY
Availability management Key policy choices
Promising and meeting order fulfillment lead times
Set to maintain or gain market share
Capacity management
Stabilizing production rate to maximize efficiency or flexing capacity to meet demand
Demand management
Managing sales/order rate variation Limiting number of allowed “standard”
configurations in build-to-stock environment
Inventory management
Optimal deployment of inventory to maximize availability at minimum cost
Also used to insulate manufacturing from demand variability
Lead time management
Consistent with Lean principles - working to reduce supply and in-process lead-times
Monitoring and managing lead-time variability
Fixed or flexible Segmentation by product or customer
(e.g. sales vs. rentals)
Fixed or flexible capacity Willingness to subject plant to incresed
demand variability
Static or dynamic inventory targets Rules of thumb vs. product/location/time
specific targets Based on total chain or local viewpoint
To achieve maximum availability at minimum cost: A comprehensive
order fulfillment strategy must appropriately define a coordinated set of policies for these interrelated variables
No one variable can be managed in isolation and changing or fixing one variable has implications for the others
Active management of demand variability (e.g. promotions/incentives)
Monitoring and managing forecast error
Active management of lead-times and lead-time variability
Incentives and penalties for performance

©2002 SmartOps Corporation 21
REALIZING THE POTENTIAL VALUE OF ENTERPRISE-WIDE INVENTORY OPTIMIZATION
Cost
(inventory, variable, period cost)
“Cost of availability”
Availability and customer service
x
Quick hits (12-18 months) Focused, prioritized lead time and lead time
variability reductions and ongoing management
Reduction in self-imposed demand variability
Managing to optimal total chain inventory targets
Longer term (24-28 months) Structurally alter supply chain Rationalize number of standard
configurations and decrease forecast error Flex capacity Manage to OF strategy key metricsThrough better strategic,
tactical, and operational planning we are trying to improve, stabilize, and sustain availability at lower total chain cost
Availability focused
Cost focused
©2002 SmartOps Corporation
©2002 SmartOps Corporation 22
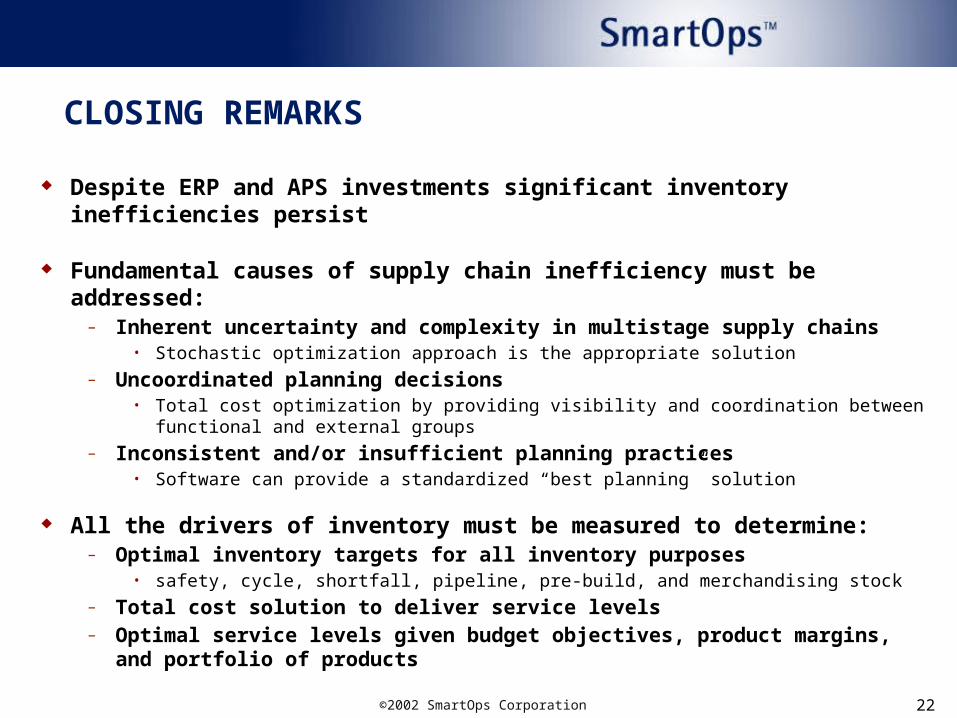
CLOSING REMARKS
Despite ERP and APS investments significant inventory inefficiencies persist
Fundamental causes of supply chain inefficiency must be addressed:– Inherent uncertainty and complexity in multistage supply chains
• Stochastic optimization approach is the appropriate solution
– Uncoordinated planning decisions• Total cost optimization by providing visibility and coordination between functional and
external groups
– Inconsistent and/or insufficient planning practices• Software can provide a standardized “best planning” solution
All the drivers of inventory must be measured to determine:– Optimal inventory targets for all inventory purposes
• safety, cycle, shortfall, pipeline, pre-build, and merchandising stock
– Total cost solution to deliver service levels– Optimal service levels given budget objectives, product margins, and portfolio
of products