Embed Size (px)
Citation preview

SUBSTITUTION LAWS AND INNOVATION IN THE PHARMACEUTICAL INDUSTRY
HENRY G. GRABOWSKI AND JOHN M. VERNON*
I
INTRODUCTION
The pharmaceutical industry has been among the most innovative while
being one of the most highly regulated industries in the United States. Gov-
ernment regulation of pharmaceutical product quality started in 19061 and
has evolved into a stringent system of premarket controls over new drug de-
velopment and introduction. Several recent studies have examined the effects
of these regulatory controls on the costs and development periods for new
drug entities, the quantity of drug innovation, and delays in new drug thera-
pies available to consumers.2
Government laws and regulations indirectly affect the innovation process
through the distribution and marketing of pharmaceuticals. In contrast to
other products, drugs can be dispensed to an individual only with a physi- cian's prescription. This is true unless the Food and Drug Administration
(FDA) has approved the drug for self-medication (i.e., over-the-counter us-
age). Historically, state antisubstitution laws for prescription drugs have pro- hibited pharmacists from dispensing a different brand of a drug than the one
prescribed by the physicians. A major structural change taking place in the pharmaceutical industry to-
day is the repeal of state antisubstitution laws. Over forty states have passed
product selection or drug substitution laws.3 While the state-enacted laws have
significant differences, essentially all enable pharmacists to substitute generic
products (some mandate substitution) unless a physician prevents substitution
* Professors of Economics, Duke University 1. The Pure Food and Drugs Act was passed in 1906 primarily to deal with food abuses. See
W. Wardell & L. Lasagna, Regulation and Drug Development 6 (American Enterprise Institute for Public Policy Research, 1975) [hereinafter cited as W. Wardell & L. Lasagna].
2. See, e.g. W. Wardell & L. Lasagna, supra note 1; H. Grabowski, Drug Regulation and Inno- vation (American Enterprise Institute for Public Policy Research, 1976) [hereinafter cited as H. Grabowski]; D. Schwartzman, Innovation in the Pharmaceutical Industry (1976) [hereinafter cited as D. Schwartzman]; Grabowski, Vernon & Thomas, Estimating the Effects of Regulation on Innovation: An International Comparative Analysis of the Pharmaceutical Industry, 21 J. LAW ECON. 133 (1978) [hereinafter cited as Grabowski, Vernon & Thomas].
3. See Table 1.

LAW AND CONTEMPORARY PROBLEMS
by checking a preprinted box or writing "dispense as written" (DAW) on the
prescription form.
Drug substitution laws give rise to a number of interesting medical, eco-
nomic, and legal questions that are the subject of much discussion and de- bate.4 These include the quality and therapeutic equivalence of various manu- facturers' products, the anticipated behavior of physicians and pharmacists under the new drug substitution laws, the economic savings to consumers
utilizing generic products, and the question of liability in the event of a drug substitution mishap.
This article will focus on the effects of drug substitution laws on innova- tion incentives. New laws alter the terms of competition between the innova- tor's brand and imitative drug products. By lowering the barriers to imitative
products, substitution laws reduce the expected return on drug innovation. The effects of drug substitution laws on innovation incentives must be con-
sidered in light of government patent or regulatory policies. Since substitution laws alter the expected revenues of a new drug only after the patent expires and alternative suppliers enter the market, their impact on innovational re- turns depends on the patent protection. The effective patent life for new
pharmaceuticals is typically much shorter than the legal life of 17 years due to the long gestation period that is required to develop and gain regulatory ap- proval for a new drug entity. Hence, drug substitution, patent and regulatory policies have potentially significant interactive effects on the incentives for
drug innovation investment. From a normative or policy perspective, these public policies are also obvi-
ously interrelated. If changes in drug substitution laws were seen as leading to
suboptimal incentives for drug innovation, policymakers have the option of
adjusting patent life to increase incentives. It would not be necessary to main- tain substitution restrictions on all pharmaceuticals in order to maintain suffi- cient incentives with respect to drug innovation. This latter objective could be
accomplished by changing the patent life on new drugs. This point is devel-
oped later in the article. See the Appendix for a theoretical model of the optimal patent life.
In Section II we consider how substitution laws, along with other govern- ment policies, affect the private returns to drug innovation. Section III re- views the current status of drug substitution laws and the current evidence
concerning their impact on pharmaceutical sales. In Section IV we perform a
sensitivity analysis of the effects of substitution laws on the expected returns to innova- tion using representative data on research and development (R&D) costs, reve- nues, and other parameters. Section V is a brief summary and conclusion.
4. See Bureau of Consumer Protection, Federal Trade Commission, Drug Product Selection 7-9 (1979) [hereinafter cited as Bureau of Consumer Protection].
44 [Vol. 43: No. 1

THE PHARMACEUTICAL INDUSTRY
II THE EFFECT OF GOVERNMENT POLICIES ON THE
PRIVATE RETURNS TO PHARMACEUTICAL INNOVATION
This Section examines how FDA regulatory policy, patent policy, and drug substitution laws affect the private returns to pharmaceutical innovational ac-
tivity. Decisions to develop new drug entities are investment decisions. The de-
cision making environment presumably compares the expected returns from these projects with alternative investment opportunities. Accordingly, we em-
ploy a similar conceptual framework to indicate the joint effects of these gov- ernment policies on innovation decisions. Using this framework we summarize some of the empirical work on the effects of innovation regulation.
A. The R & D Investment Decision
Consider a hypothetical investment project involving the development of a new chemical entity (NCE). Suppose the NCE is expected to be introduced in
year t. It will involve R&D and investment costs over m years and earn posi- tive profits for n years after introduction, p of which are subject to patent protection. Then the rate of return, r, for this particular product introduction is found by solving the standard discounted present-value equation:
m P Rt+j n Rt+j 1. Y Ct_i (I + r)i = +
1=j (1 + r) j = p+ (1 + r)
where
Ct- , C t-2 , C t-m are R&D costs and other investment expendi- tures; Rt ... Rt+p = net income stream before patent expiration; R t+p+1. .. Rt+n = net income stream after patent expiration.
This expected rate of return abstracts from potential differences in risk as- sociated with specific development projects. The expected return from each
project would have to be adjusted for such risk differentials across projects (unless the firm is risk neutral). The firm's decision to invest in a particular development project would depend on whether its adjusted rate of return ex- ceeds or falls below the firm's capital cost, which reflects the opportunity cost of alternative investments for the firm and its shareholders.
B. The Effects of Regulation Let us consider how FDA regulations influence the factors in this return
calculation rate. The most direct effects of regulations are on expected costs. FDA regulations have increased the number of tests and the amount of evi-
45 Page 43: Winter-Spring 1979]

LAW AND CONTEMPORARY PROBLEMS
dence on safety and efficacy that must be accumulated before a drug is mar- keted. In addition, the regulatory approval process on a new drug application is usually quite lengthy and averages about two years for successful appli- cants.5 Regulation tends to increase both development costs (the Ci's) and the
gestation time, m, required to produce a new innovation. Both effects in- crease the present value of costs of an NCE introduction.
In an earlier empirical analysis,6 we analyzed the effects on R&D costs of the more stringent regulatory environment emanating from the 1962 Kefauver-Harris Amendments.7 These Amendments expanded FDA controls to include the clinical development process and required firms to provide evi- dence on drug efficacy as well as safety. Using a comparative international ap- proach, we estimated that increased regulation more than doubled the R&D costs of obtaining NCE during the first decade after the law was passed.
Recently, Ronald Hansen has estimated the value of R&D costs that a firm might expect to have to discover, develop and gain regulatory approval for an NCE introduction.8 Using detailed cost data on over 100 drug entities tested in human beings, he estimated the present value of R&D costs for a
typical NCE introduction to be $54 million (adjusted to reflect 1975 dollar
rates). This high value reflects the long gestation period for new drugs and the high attrition rate on unsuccessful R&D projects. Furthermore, Hansen's estimates on R&D costs are at least an order of magnitude greater than esti- mates available for the immediate pre-1962 amendment period.9
It is also appropriate to consider the effects of FDA regulations on the ex-
pected revenues from a new NCE. There are a number of possible impacts here, some of which have conflicting implications for expected revenues.
First, regulatory controls will reduce the probability of commercialization for many compounds and lower expected revenues. One of the primary bene- fits of regulation is the extent that the regulatory agency screens out and de- ters drug entities that present risks that the majority of consumers would not
knowingly and willingly undertake. Evaluating whether the FDA has been too conservative in its risk/benefit decisions is one of the most difficult and con- troversial areas of regulatory analyses.10
Regulation also affects the effective patent life, p, for a new drug entity.
5. Hansen, The Pharmaceutical Development Process: Estimates Of Development Costs and Times and the Effects of Proposed Regulatory Changes, in ISSUES IN PHARMACEUTICAL ECONOMICS 151, 154 (R. Chien ed. 1979).
6. Grabowski, Vernon & Thomas, supra note 2. 7. Pub. L. No. 87-781, ? 76 Stat. 780 (1962) (codified in scattered sections of 21 U.S.C.). See
generally Kelly, The Drug Amendments of 1962, 18 FOOD DRUG COSM. L. J. 145 (1963). 8. Hansen, supra note 5, at 180. 9. For an analysis of R&D costs in the pre-amendment period see Baily, Research and Develop-
ment Costs and Returns: The U.S. Pharmaceutical Industry, 80 J. POLIT. ECON. 70 (1972). See also Sarett, FDA Regulations and their Influence on Future R & D, 17 INTER. J. RESEARCH MNGMNT. 18, 19 (1974).
10. See W. Wardell and L. Lasagna, supra note 1, at 37-44, 161-65.
46 [Vol. 43: No. 1

THE PHARMACEUTICAL INDUSTRY
Since the average time to develop an NCE and gain regulatory approval now far exceeds the time necessary to obtain a patent,1' regulatory-derived in- creases in development or approval times will operate to lower the effective life of a drug patent. While the length of patent protection has been of sec-
ondary import historically in the drug industry, this situation could change dramatically with the repeal of antisubstitution laws. This question will be con- sidered in detail later.
There are also several ways that regulation can operate to increase the ex-
pected revenues of drugs approved for marketing by the FDA. First, regula- tions serve a certification function. Stringent regulatory processes provide physicians and patients with confidence in a new drug's safety and efficacy, thereby facilitating rapid market diffusion and penetration for new drugs. Second, drugs that are approved in a stringent regulatory regime face less ac- tual and potential competition than in an unregulated market. This is true for two basic reasons. First, many marginal drugs will be undeveloped, given the
greater costs of developing drugs under regulation. Second, the minimum scale at which R&D can be profitably undertaken will tend to increase under
regulation, lowering the number of firms engaged in pharmaceutical innova- tion. This latter phenomenon was investigated by us and our findings indicate that pharmaceutical innovation has become more concentrated.12
How do these effects balance out and what is their net impact on the rate of return to pharmaceutical innovation? While there is no definitive answer to this question, several studies have examined developments in pharmaceutical innovation in the United States and other countries that provide some insights into this question. The facts concerning innovation in the United States indi- cate, first, that as regulation has become more stringent, R&D costs have risen
dramatically, compared to revenues, causing average innovation returns to de- cline over time.13 Second, the annual number of new product introductions has declined significantly.14 Third, total industry R&D for pharmaceuticals has grown little, if at all, in real terms in recent years. Significantly, drug firms have increased their diversification rate across other industrial fields.15 A number of factors other than regulation have been advanced in the litera- ture as possible explanations for these developments in pharmaceutical inno-
11. See D. Schwartzman, supra note 2, at 163, 166. 12. See Grabowski & Vernon, Structural Effects of Regulation on Innovation in the Ethical Drug In-
dustry, in ESSAYS ON INDUSTRIAL ORGANIZATION IN HONOR OF JOE S. BAIN 181, 191-93 (R. Masson and P. Quails eds. 1976). See also Grabowski & Vernon, Consumer Protection Regulation in Ethical Drugs, 67 AM. ECON. REV. 359 (1977).
13. See D. Schwartzman, supra note 2, at 159-160. See also J. Virts & J. Weston, Returns to R&D in the U.S. Pharmaceutical Industry (1978) (unpublished report). See also Clymer, The Eco- nomics of Drug Innovation, in THE DEVELOPMENT AND CONTROL OF NEW DRUG PRODUCTS 109 (M. Pernarowski and M. Darrach eds. 1972).
14. For a discussion of these trends and a related discussion on alternative quality adjusted measures of drug innovation, see H. Grabowski, supra note 2, at 17.
15. See id. at 44. See also J. Virts & J. Weston, supra note 13.
47 Page 43: Winter-Spring 1979]

LAW AND CONTEMPORARY PROBLEMS
vation.16 However, the current evidence, especially from comparative in- ternational studies, suggests that increased regulation has been at least one important factor underlying the adverse trends in pharmaceutical in- novation.17
C. The Effects of Drug Substitution Laws
Changes in drug substitution laws affect the income stream of a new drug innovation in the period after patent expiration (i.e., the second term on the
right in equation 1). It is clear from this formula that the effect of increased substitution on the returns to drug innovation will depend on: (a) the effec- tive patent life, p; and (b) how net revenues, Rj, are shifted in the postpatent period.
With antisubstitution laws in effect, an innovator's product was able to maintain a favored market position by maintaining the "brand loyalty" of phy- sicians. There are many documented cases where the original product re- tained a dominant market share at premium prices.18 How the passage of substitution laws will change this situation remains to be seen. It depends on the behavioral response of physicians, pharmacists, and consumers under these new laws. Initial experiences of various states are discussed in the next Section.
If substitution laws foster increased competition between alternative manu- facturers' products, then the degree of patent protection assumes a critical role in the appropriability of drug returns. A shorter effective patent life shifts the impact of drug substitution forward in time, amplifying the impact of revenue losses on the expected return to innovation, r, in equation 1. We
present data below to show the effective patent life for pharmaceuticals has been declining and is in the range of nine to twelve years.
The prospect of increased substitution rates after patents expire combined with the relatively short, and declining, effective patent periods could have
significant negative implications for innovation returns. This is of course an
empirical question. A principal objective of this article is to perform a sensitivity analysis of
the effect of the new state substitution laws on the expected returns to inno- vation using plausible values for the various parameters in equation 1. To do
16. See Grabowski, Vernon & Thomas, supra note 2, at 137-140 for a discussion of these alternative hypotheses. They include factors such as a depletion of research opportunities, scien- tific advances in the ability to detect toxicology and increased concerns about product liability.
17. See H. Grabowski, supra note 2, at 24-37 for a survey of relevant work as well as the anal- ysis in our more recent paper: Grabowski, Vernon & Thomas, supra note 2, at 140-43.
18. See the discussion on this point by Brownlee, The Economic Consequences of Regulating With- out Regard to Economic Consequences, in ISSUES IN PHARMACEUTICAL ECONOMICS 215, 226-27 (R. Chien ed. 1979). See also D. Schwartzman, supra note 2, at 256-58. See also Bureau of Consumer Protection, supra note 4, at 38-54.
48 [Vol. 43: No. 1

THE PHARMACEUTICAL INDUSTRY
this, we will take some representative R&D costs and revenues data and inves-
tigate how a range of assumptions on patent lives and the degree of drug sub- stitution influence the expected return to pharmaceutical R&D. In the case of the effective patent life parameter, it is fairly easy to develop a range of plau- sible values because we can compute the effective patent life for NCE intro- ductions that have come on the market over the past several years. On the other hand, projecting the long run effects of substitution laws on drug in-
dustry competition is more difficult. The next Section considers several char- acteristics of these new laws and available evidence concerning their impact on
industry sales revenues in several states.
III DRUG SUBSTITUTION LAWS
A. History and Current Status
U.S. antisubstitution laws were enacted in the early fifties. They were ad- vanced as a response to the drug "counterfeiting" problem, the dispensing by pharmacists of drugs similar in size, color, and packaging to popular brand name products but of unknown quality or origin. Antisubstitution laws were
adopted by all fifty states and generally prohibited any form of substitution for the brand denoted on the physician's prescription. At the time of passage, they had the support of the pharmacists' and pharmaceutical manufacturers'
major trade associations.19 The impetus for repeal of these laws was development of government
cost-containment programs for drugs under state Medicaid plans and growth of the consumer movement in the sixties. In 1970 the American Pharmaceuti- cal Association, a trade association, supported the repeal of antisubstitution laws. A few states, including Florida and California, repealed their laws be- tween 1972 and 1975. The number of states passing substitution laws has ac- celerated rapidly since 1976.
By the end of 1978, forty states and the District of Columbia had enacted
drug substitution laws. Table I provides a list of the major provisions of these laws. As demonstrated in the Table, there is considerable variation in substitu- tion laws from state to state.
All states allow physicians to prevent substitution. In several states, there are two-line prescription forms: one line stating substitution is permitted and the other stating that the prescription must be dispensed as written. In the two-line prescription states, excepting New Jersey, the physician consents to substitution by signing the line permitting substitution. States which do not
19. The history and growth of antisubstitution laws is discussed in more detail in Bureau of Consumer Protection, supra note 4, at 141-54.
Page 43: Winter-Spring 1979] 49

TABLE I
MAJOR PROVISIONS OF STATE DRUG SUBSTITUTION LAWS
How Cost M.D. Two-Line Substitution Pharmacy Savings Exemption
Year Formulary Rx Form Can Be Substitution Pass-On from State Enacted Limitations* Requiredt Prevented$ Mandatory Required Liability
ALASKA ARIZONA ARKANSAS CALIFORNIA COLORADO CONNECTICUT DELAWARE D.C. FLORIDA GEORGIA IDAHO ILLINOIS IOWA KANSAS KENTUCKY MAINE MARYLAND MASSACHUSETTS MICHIGAN MINNESOTA MISSOURI MONTANA NEBRASKA NEW HAMPSHIRE NEW JERSEY NEW MEXICO NEW YORK
1976 1978 1975 1975 1976 1976 1976 1976 1976 1977 1978 1977 1976 1978 1972 1975 1977 1976 1974 1974 1978 1977 1977 1973 1977 1976 1977
None Positive Negative Negative None None Negative Positive Negative None None Positive Negative None Positive None Negative Positive None None Negative None Negative Positive Negative Fed. MAC List Positive
0
Yes Yes No No No No Yes No No Yes Yes Yes No No No No No Yes No No Yes No No No Yes Yes Yes
C A B B B B A B B A A A B B B B B A B B1 A B B E B B A
t'"
Z 3>
0 g
IV 0
0 w
No No No No No No No No Yes No No No No No Yes No No Yes No No No No No No Yes No Yes
Yes Yes Yes Yes Yes Yes Yes No Yes No Yes No Yes No No No Yes No Yes Yes No Yes Yes No Yes Yes No
No No No Yes No No No Yes Yes No No Yes No No Yes No No No No No No Yes Yes No No No No
0
0 oo

OHIO
OKLAHOMA OREGON PENNSYLVANIA RHODE ISLAND SOUTH CAROLINA SOUTH DAKOTA TENNESSEE UTAH VERMONT VIRGINIA WASHINGTON WEST VIRGINIA WISCONSIN
1977
1961 1975 1976 1976 1978 1978 1977 1977 1978 1977 1977 1978 1976
Community Phar- No
macy NDA-ANDA None No None No Positive Yes Positive Yes None Yes None Yes Positive Yes
Negative - No Positive No Positive Yes
Negative2 Yes
Negative Yes Positive No
B
D B A A A A A B B A A A B
No
No No Yes Yes No No No No No No No No No
Yes
No No No No No No Yes Yes No Yes Yes Yes Yes
Yes ? CD
No v
No Yes Yes D
No
No -t
Yes D
No -n
No Yes O No No No
1 In cases where the actual manufacturer of the product to be substituted is the same as the manufacturer of the prescribed name brand,
physician may not prevent substitution. 2 Board of Pharmacy is empowered but not required to adopt negative formulary.
* A drug formulary, or listing, may be either positive (listing all substitutable drugs) or negative (listing all nonsubstitutable drugs).
t States having a "yes" in this column require two signature lines on all prescriptions. A signature on one line expressly permits substitu-
tion, while a signature on the other would prevent it. + Legend: A- Physician must give prior approval by signing the appropriate line in the prescription for substitution to occur.
B - Pharmacist is authorized to substitute unless M.D. indicates express disapproval, such as by indicating "DAW."
C - In Alaska, physician must indicate permission to substitute. No permission implies DAW.
D- In Oklahoma, authority to substitute is with the prescriber or purchaser. E- In New Hampshire, physician must write "or its generic equivalent drug listed in N.H. drug formulary" to permit substi-
tution.
SOURCE: H. Grabowski, The Effects of Substitution Laws on Innovation, DRUG THERAPY 91, 94-5 (1978). See also Bureau of Consumer Protec-
tion, supra note 4, at 177-84.
0i
rz
0
tn
0-
VI

LAW AND CONTEMPORARY PROBLEMS
have two-line prescription forms allow physicians to prevent substitution by writing DAW (dispense as written) or a similar notation on the prescription form. In these states, the pharmacist is authorized to substitute if the physi- cian does not take positive action to stop substitution. This type of arrange- ment has been called physician veto as opposed to physician consent for sub- stitution required in two-line prescription forms.
Nine states (Florida, Kentucky, Massachusetts, New York, New Jersey, Rhode Island, Vermont, West Virginia and Pennsylvania) have provisions that make substitution mandatory. These states require pharmacists to substitute lower-cost drugs that they have in stock except where the physician has stipu- lated otherwise on the prescription. These mandatory laws are of recent ori-
gin and some question exists as to their effectiveness and enforceability. This is a question for future research.
Substitution is regulated by drug formularies (listings) in a majority of the states. A positive formulary provides an approved list of drugs for which sub- stitution is permitted, while a negative formulary denotes drugs for which substitution is prohibited.
Other provisions have been included in the substitution laws in various states. Most states, for instance, require that some or all of the cost savings in
dispensing generics be passed on to the consumers, but this provision is not well-defined in many cases. A number of states require that patients approve substitution and Alaska requires that the physician be notified if substitution occurs. Finally, several states specifically exempt physicians from liability in the event of an injury arising from substitution.
One important development is that many states are amending their laws to facilitate or even mandate greater substitution. Four states (Florida, Massachusetts, Kentucky and Rhode Island) have amended their laws to re-
quire substitution (unless the physician has designated otherwise on the pre- scription). New Jersey, New York, and Pennsylvania recently passed their first substitution laws and included mandatory substitution provisions. Thus, there is a trend toward substitution laws which increases the likelihood of substitu- tion by providing for substitution or mandating substitution.
The expected level of substitution in any state will depend on the con- straints and incentives regarding substitution. This issue is considered in the next two Sections.
B. Evidence on the Effects of Repealing Antisubstitution Laws
Since most substitution laws have been in effect for only a few years, there is not a great deal of empirical evidence available on the effects of such laws. The full market responses to them in most cases have yet to take place. How- ever, studies of the initial experience in particular states have begun to
emerge.
52 [Vol. 43: No. 1

THE PHARMACEUTICAL INDUSTRY
An extensive empirical analysis in Michigan of the first year under substi- tution laws was performed by a research group at Wayne State University, headed by Theodore Goldberg.20 A major finding of this study was that sub- stitution in Michigan occurred for only 1.5 percent of the multiple-source prescriptions. This was true despite the fact that physicians prohibited substi- tution (by designating DAW) on only approximately 6 percent of these pre- scriptions. In a follow-up study, Goldberg and his associates found that when substitution did occur, the average consumer saving was approximately 20
percent of the price of the drug prescribed by the physician.2' Professor Joseph Fink studied Delaware's substitution law and obtained
very different findings. In Delaware, a two-line prescription state, physicians signed the DAW line prohibiting substitutions 62 percent of the time.22 At the same time, pharmacists in Fink's sample substituted 56 percent of the time when authorized to do so by physicians and the product was supplied by more than one firm.23
Recently an FTC contracted staff report published findings of a survey of over 700 pharmacists in seven states (Arkansas, California, Delaware, Minnes- ota, Oregon, Pennsylvania, and Wisconsin).24 This survey found a wide variance across states in the behavior of both physicians and pharmacists consistent with the findings of the Michigan and Delaware studies discussed above.
A striking finding of the FTC survey is the large difference in the behav- ior of physicians in states where the preprinted two-line substitution format is used compared to states where physicians must write DAW or a similar
phrase. The FTC study notes:
The study confirmed findings reported elsewhere that physicians rarely (only 1.4% to 5.1% of the time) find it necessary to prohibit substitution by handwriting such indications as "Medically Necessary" or "Dispense as Writ- ten." When physicians have to sign one of two instructions preprinted on the prescription form, however, they sign on the "Dispense as Written" line nearly half (31% to 51%) the time.25
An American Druggist26 survey of pharmacists in seventeen states found
similar results: physicians in states utilizing the two-line prescription format
20. Goldberg, et. al., Impact of Drug Substitution Legislation: A Report of the First Year's Experience, 17 J. AMER. PHARM. Assoc. (n.s.) 216 (1977).
21. Goldberg, et. al., Evaluation of Economic Effects of Drug Product Selection Legislation 9-10 (October 1977) (unpublished paper presented to the American Public Health Association Meetings, study supported by grant number R01 HS 02132 from the National Center for Health Services Research, HRA, Department of HEW).
22. Fink & Myers, Effectiveness of Drug Product Selection Legislation in Delaware, CONTEMP. PHARMACY PRAC. 4 (1978), quoted in Bureau of Consumer Protection, supra note 4, at 187.
23. Id. at 7, quoted in Bureau of Consumer Protection, supra note 4, at 188. 24. Bureau of Consumer Protection, supra note 4, at 188-95. 25. Id. at 190. 26. AM. DRUGGIST 13 (October 1978).
Page 43: Winter-Spring 1979] 53

LAW AND CONTEMPORARY PROBLEMS
barred substitution 58.5 percent compared to 8.04 percent for physicians in
states without this format. The FTC survey also found a high variance in the extent of substitution
by pharmacists in these states. The median percentage of substitution by
pharmacists (where substitution is authorized by physicians and multiple sup-
pliers of a product are available) ranged from 5.2 percent in Arkansas to 45.5
percent in Wisconsin.27 With only seven observations in this sample, it is not
clear what legal provisions are primarily responsible for this variance in phar- macists' behavior. We are collecting data on a larger cross section of states in
order to test some hypotheses in this regard. In any case, this FTC study suggests that substitution has reached signifi-
cant levels in some states. In addition, it would be plausible to expect the amount of substitution to increase in future periods. In the short run the de-
gree of substitution will be restrained by concerns of physicians, pharmacists, and patients. These concerns include: quality differences among products, low economic incentives, possible risks to pharmacists, and unreliable informa-
tion about relative drug prices available to consumers. The long run situation
should change with respect to most, if not all, of these concerns.
C. Factors Tending to Increase Drug Substitution Over Future Periods
1. The FTC Model Law
As noted above, many state legislatures appear predisposed to changing laws to facilitate or increase the level of substitution. In this regard, the FTC
has recently proposed a model substitution law that includes provisions de-
signed to encourage substitution. The FTC model law would: (a) allow phar- macists to substitute unless the physician writes DAW on the prescription; (b)
only permit substitution in accordance with an FDA developed formulary; (c)
require that the substitute product be lower priced than the prescribed brand
name product, but not requiring all savings to be passed on to the consumer;
(d) have an optional feature limiting pharmacists' liability from substitution; and (e) require that the consumer be informed of the substitution.28
Available evidence suggests that adoption of the first provision would help remove the significant level of physician restraints on substitution that exist in
many states (i.e., two-line prescription states). Furthermore, the above FTC
provisions on drug formularies, partial savings passed on to consumers, and
limited liability for pharmacists are designed to increase pharmacists' incen-
tives to substitute compared to the present provisions in many state laws.
27. Bureau of Consumer Protection, supra note 4, at 332. 28. Id. at 9-12.
54 [Vol. 43: No. 1

THE PHARMACEUTICAL INDUSTRY
2. FDA Activity on Drug Equivalence Another factor that has operated to reduce substitution is uncertainty
among pharmacists and patients regarding the technical quality and safety of lower-cost substitute products. This uncertainty has been accentuated recently by considerable publicity about possible bioequivalence problems in drug products.29 The FDA has been heavily involved in investigation of bioequiv- alence problems in light of HEW's emerging Maximum Allowable Cost (MAC)
program.30 The FDA has published in the Federal Register a list of over 100
drugs that have potential bioequivalence problems.31 The FDA's basic substitution position, however, is that except for relatively
few drugs actively under investigation for bioequivalence, any multiple source
drug with an approved NDA or an abbreviated NDA is equivalent therapeuti- cally and safe to substitute. Recently, the FDA endorsed the New York formu-
lary for containing only therapeutically equivalent products with no bio-
equivalence or other quality problems. In this regard, FDA Commissioner
Kennedy has stated:32
... FDA concurrence in the New York list reflects the Agency's view that there is no consistent difference in quality between drug products sold by large and small firms or between drugs sold under a brand name or "generic" name. We have a single standard for drugs in this country. [...] States that permit substitution and want some assurance of therapeutic equivalence can use this New York State publication with knowledge that [the] FDA has approved all the products on the list and the manufacturers listed have FDA approval to make them.
Furthermore, the fact that the FDA has given formal endorsement to the
drugs in the New York formulary, and implicitly to identical drugs appearing on other states' formularies, should minimize the actual and perceived risks of
legal liability for pharmacists. In particular, if a pharmacist were to substitute a chemically equivalent product approved by the FDA that is on the state for-
mulary and this substitution subsequently led to patient harm, it is difficult to see how juries could place liability on the pharmacist instead of the manufac- turer or another party.
Finally, the FDA is working to resolve the issues of bioequivalence for
drugs on the Federal Register list. Accordingly, the number of drugs in this
category is likely to decline in the future.
29. Two drug products containing identical amounts of the identical active drug ingredients in identical dosage forms are "chemically equivalent." "Bioavailability" measures how fast and how much of the drug gets into the body, appears in the blood, or is excreted in the urine. Hence, two
chemically equivalent products of approximately equal bioavailability are said to be bio- equivalent.
30. See Bureau of Consumer Protection, supra note 4, at 134-40, for a description of the MAC
program. 31. 40 Fed. Reg. 26164-69 (1975). 32. HEW News, Press Release No. P78-4 (January 23, 1978).
Page 43: Winter-Spring 1979] 55

LAW AND CONTEMPORARY PROBLEMS
3. Economic Incentivesfor Pharmacists to Substitute
Another reason the literature offers for the low substitution rate is the lack of economic incentives for pharmacists to substitute.33 It is sometimes ar-
gued that pharmacists obtain larger profit margins on higher priced brand name products and that incentives for price competition are dampened by the information imperfections that exist with respect to retail drugs.
Although these conditions may have prevailed in many segments of the re- tail drug market historically, recent structural changes are making this market more competitive. In particular, the legal barriers to price advertising which
operated to increase information imperfection have been largely removed.34
Many discount drugstore chains are promoting drug products on the basis of lower prices. The repeal of antisubstitution laws offers these chains a signifi- cant opportunity to expand market shares through promoting and dispensing low-cost generic substitutes.
The trade literature recently reported cases where the chain drugstores (e.g., Walgreens, Giant Rexall, and Peoples) have begun large-scale promo- tional campaigns stressing the price advantages of generic drugs to consum- ers.35 The advertisements of these chains em ihasize that they dispense only quality generic products meeting high manufacturing standards. The Giant Rexall chain in Washington has advertised that they have a quality control
laboratory staffed by a Ph.D. in pharmacy and two chemists. In summary, there are strong economic incentives for the discount drug-
store chains to promote generic substitutes. As consumers become aware of the potential savings involved in buying such products, it is reasonable to hy- pothesize that an increased amount of substitution will voluntarily occur in the marketplace.
D. Implications for the Sensitivity Analysis In this Section we have reviewed the current situation of drug substitution
and its actual and potential effects on sales revenues. It is clear from this anal-
ysis that substitution laws are in an evolutionary state and their long term im-
pact on drug revenues is uncertain. Nevertheless, significant levels of substitu- tion have been obtained in many states, and there are plausible reasons to
expect the degree of substitution to rise. Therefore, it is conceivable that
drugs now in the R&D phase will encounter higher rates of substitution when their patents expire than is the case for drugs off patent today. Accordingly, we will utilize a broad range of values for this parameter in the sensitivity analysis which follows.
33. See Bureau of Consumer Protection, supra note 4, at 93. 34. See Va. State Bd. of Pharmacy v. Va. Citizens Consumers Council, 425 U.S. 748 (1976). 35. Millman, Battle Lines Harden in Fight Over Generics, ADVERTISING AGE, February 13, 1978, at
76; Curran, Multi-Source Drugs: An Acceleration in the Use of Lower Costing Substitutes?, Reynolds Se- curities Information Report 9-13 (May 1977).
56 [Vol. 43: No. 1

THE PHARMACEUTICAL INDUSTRY
IV SUBSTITUTION LAWS AND THE DECISION TO INVEST
IN RESEARCH AND DEVELOPMENT
This Section examines the decision to invest in R&D and provides a sensi-
tivity analysis of the effect of repealing antisubstitution laws on the expected profits of R&D.
A. Sensitivity Analysis In accordance with our previous discussion, the rate of return on R&D is
derived by equation 1. in Section II, or
m P R. m p Rt+n Rt+j 1. S C ( + +r)i= tj
+ Y 1=1 j = 0 (1 + r) J = p + (1 + r)'
In an analysis of pharmaceutical returns on R&D, David Schwartzman ob- tained data on the sales revenues for NCE introductions from 1966 to 1972.36 He combined this with corresponding data on lagged industry R&D expendi- tures to discover and develop new drug entities. He then used these data to
compute representative time profiles for the costs (C) and net income values (R) in equation 1. above.
As the starting point to our sensitivity analysis, we will utilize the Schwartz- man data on R&D costs and revenues (in his earlier rate of return analysis.) We will investigate how sensitive Schwartzman's estimated returns are to the structural changes occurring in drug substitution.
As a benchmark for our analysis, we employ Schwartzman's data profiles with the assumption that the typical NCE product life is twenty years and the
gross (after-tax) profit margin is 20 percent. The assumptions underlying this case are Schwartzman's upper bound estimates on profit margin and product life.37 However, these upper bound estimates yield a relatively modest rate of return of 7.5 percent on R&D. Schwartzman projected lower median values for these parameters on the basis of historical experience in the pharmaceuti- cal industry.38 However, we think his upper bound estimates on product life- times and profit margins are likely to be representative of what NCE intro- ductions can reasonably expect to achieve given that significantly fewer drugs are being introduced now.39 We are collecting data for a refined analysis of the returns to recent NCE introductions.
However, the purpose of this analysis is not to predict the effect of substi- tution on the return to R&D with exact precision, but to gauge the sensitivity
36. D. Schwartzman, supra note 2, at 139. 37. Id. at 144. 38. Id. 39. See H. Grabowski, supra note 2, at 39-42 for a discussion on this point as well as other
criticisms of Schwartzman's analysis.
57 Page 43: Winter-Spring 1979]

LAW AND CONTEMPORARY PROBLEMS
of this return to alternative assumptions concerning the extent of substitution and the longevity of patents. Schwartzman's estimates on R&D costs and reve- nues are adequate for this purpose.
Table II shows the values of annual costs and net incomes which yield the 7.5 percent return. The key assumptions underlying these values are listed as notes in the Table. In Table II, Schwartzman assumes that the stream of net income is constant over the product life except for an introductory growth period (years 11 and 12) and the final years of sales decline (years 29 and 30). He implicitly assumes that the introduction of competing products after
patent expiration does not reduce the net income stream. In other words, given a patent life of 17 years from the date of marketing, in year 27 see
Table) net income has the same value as in year 26. For this analysis, we will reduce net income in the year the patent expires and succeeding years to re- flect the impact of substitution on the net income stream of the new drug.
TABLE II
ESTIMATED STREAM OF COST OF R&D AND NET INCOME FOR AN AVERAGE
NEW DRUG YIELDING A 7.5 PERCENT RETURN
(MILLIONS OF DOLLARS)
R&D Net Net Year Cost Year Income Year Income
1 -1.22 11 .64 21 1.91 2 -1.22 12 1.27 22 1.91 3 -1.22 13 1.91 23 1.91 4 -1.22 14 1.91 24 1.91 5 -1.22 15 1.91 25 1.91 6 -1.22 16 1.91 26 1.91 7 -1.22 17 1.91 27 1.91 8 -1.22 18 1.91 28 1.91 9 -1.22 19 1.91 29 1.27
10 -1.22 20 1.91 30 .64
Notes: (1) The R&D period is ten years. Costs are in 1972 dollars and reflect the average costs for all new chemical entities introduced in the 1966-72 periods.
(2) Sales revenues are estimated by the average 1972 sales of new chemical entities introduced in the 1962-68 period. Foreign sales are assumed to be 47 percent of U.S. sales.
(3) A 20 percent after-tax profit margin, including R&D expenditures is assumed. Subtracting 2.6 percentage points from this figure to cover working capital and investment in plant for the project yields 17.4 percent which, when applied to sales, produces the net income figures above.
(4) Commercial life of 20 years is assumed. Sales increase to the peak value in the third year and are assumed to be one-third of the peak in the year of intro- duction and two-thirds of the peak in the next year. A similar decline is assumed at the end of commercial life.
SOURCE: D. Schwartzman, The Expected Return From Pharmaceutical Research 25-34
(American Enterprise Institute for Public Policy Research, 1975).
58 [Vol. 43: No. 1
THE PHARMACEUTICAL INDUSTRY
To perform this sensitivity analysis, we must specify representative values for: (a) the effective patent life of an NCE; and (b) the expected percentage reduction in the net income stream due to substitution after patents expire.
As discussed above, the legal patent life is seventeen years, but this does not measure effective patent life in the pharmaceutical industry. Patent life
usually begins while the drug is in the developmental and regulatory approval stage. By the time the drug is cleared for marketing the remaining patent protection period is much less than seventeen years.
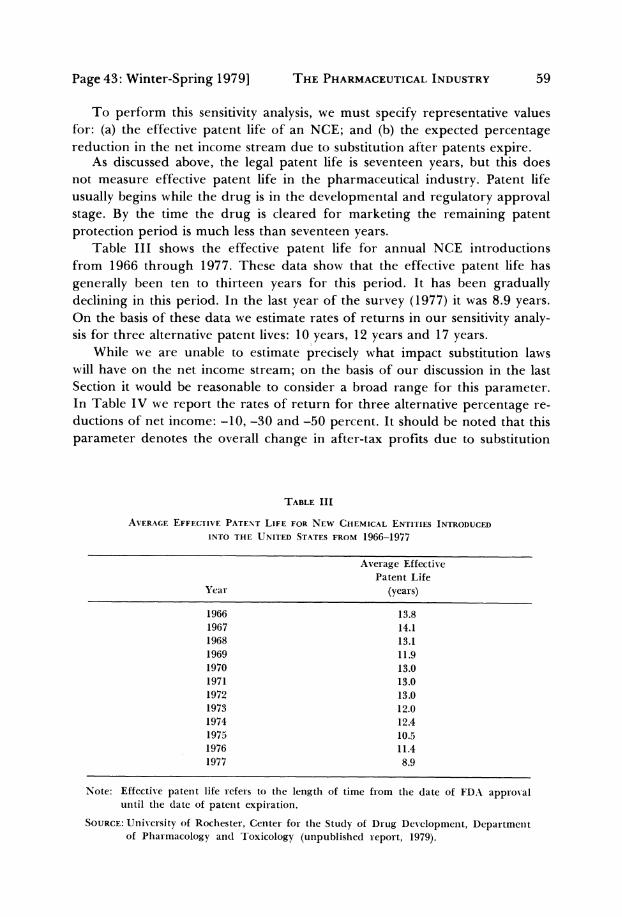
Table III shows the effective patent life for annual NCE introductions from 1966 through 1977. These data show that the effective patent life has
generally been ten to thirteen years for this period. It has been gradually declining in this period. In the last year of the survey (1977) it was 8.9 years. On the basis of these data we estimate rates of returns in our sensitivity analy- sis for three alternative patent lives: 10 years, 12 years and 17 years.
While we are unable to estimate precisely what impact substitution laws will have on the net income stream; on the basis of our discussion in the last Section it would be reasonable to consider a broad range for this parameter. In Table IV we report the rates of return for three alternative percentage re- ductions of net income: -10, -30 and -50 percent. It should be noted that this
parameter denotes the overall change in after-tax profits due to substitution
TABLE III
AVERAGE EFFECTIVE PATENT LIFE FOR NEW CHEMICAL ENTITIES INTRODUCED
INTO THE UNITED STATES FROM 1966-1977
Average Effective Patent Life
Year (years)
1966 13.8 1967 14.1 1968 13.1 1969 11.9 1970 13.0 1971 13.0 1972 13.0 1973 12.0 1974 12.4 1975 10.5 1976 11.4 1977 8.9
Note: Effective patent life refers to the length of time from the date of FDA approval until the date of patent expiration.
SOURCE: University of Rochester, Center for the Study of Drug Development, Department of Pharmacology and Toxicology (unpublished report, 1979).
Page 43: Winter-Spring 1979] 59

LAW AND CONTEMPORARY PROBLEMS
through losses in market shares or through price reductions by the innovating firm resulting from increased competition from generic substitutes.
As expected, the calculated rates of returns in Table IV are lower for shorter patent lives while the percentage reduction due to substitution is
greater. Under the most unfavorable conditions for R&D activity considered here-a 10-year patent life and a 50 percent reduction in net income-the rate of return is reduced to 5.6 percent, or by about 25 percent from the 7.5
percent benchmark. On the other hand, when a 30 percent net income reduc- tion and a 12-year patent life are assumed, the return rate is 6.7 percent, or
roughly a 10 percent reduction due to substitution. These estimated effects are not negligible and, other things constant, may be expected to make some R&D projects no longer attractive to pharmaceutical manufacturers.
The results in Table IV underscore the fact that the effects of substitution on R&D returns are highly sensitive to the length of patent protection. If the
patent life for drugs actually equalled the legal life of seventeen years, the ef- fects of increased substitution on R&D returns would be quite modest. For ex-
ample, with a seventeen year life, a 50 percent reduction in net income from substitution causes R&D returns to decrease from 7.5 to 7.1 percent in the
present example. On the other hand, as patent lives decrease, the effects of
drug substitution are magnified.
TABLE IV
INTERNAL RATES OF RETURN FOR ALTERNATIVE ASSUMPTIONS ABOUT THE IMPACT OF SUBSTITUTION AND THE EFFECTIVE PATENT LIFE
Percentage Reduction Prin Net Income Effective Patent Life in Net Income
upon Patent Expiration 10 Years 12 Years 17 Years
-10 7.1 7.2 7.4
(-5.3) (-4.0) (-1.3) -30 6.4 6.7 7.2
(-14.7) (-10.7) (-4.0) -50 5.6 6.1 7.1
(-25.3) (-18.7) (-5.3)
Notes: The standard against which the above rates should be compared is a 7.5 per- cent return. This is the rate of return for the data given in Table II.
(2) It is assumed that at the end of the patent life substitution will result in the alternative reductions in income given above for the remaining years of the
20-year commercial life.
(3) The percentage reductions were applied to total net income even though for-
eign income should not be affected by substitution. Hence, the implied do- mestic percentages are somewhat larger than those above.
(4) The numbers in parentheses are the percentage reductions for each rate of return from the standard 7.5 percent return.
60 [Vol. 43: No. 1

THE PHARMACEUTICAL INDUSTRY
The results in Table IV are preliminary in character. The analysis is based on aggregative data sources and contains the simplifying assumptions dis- cussed above. We plan to refine and expand the analytical framework and data for investigating this question in future work. Nevertheless, results sug- gest that the effects of substitution laws on innovation incentives are conse-
quential in nature and are highly sensitive to the longevity of patent lives over the ranges considered (i.e., 10 to 17 years).
B. Further Remarks on the Research and Development Investment Decision
The substitution of generic for brand name products already off patent and supplied by multiple sources (about one half of all present prescriptions) shifts cash flow from research intensive firms to nonresearch intensive ones. This reduces the supply of internal funds available to the former firms to un- dertake R&D investment. While most economists would agree that the rate of return expected for new drugs is the key variable in determining R&D invest- ments, several studies have found internal funds to be a significant determi- nant of pharmaceutical R&D expenditure.40 This finding is explained by a number of factors, including the high level of uncertainty that surrounds the
development of new pharmaceuticals. In any event, further research on the relation of pharmaceutical industry
R&D expenditures to expected returns and other factors appears warranted. Most of the research on this question was performed on data from the fifties and sixties. Given the major structural changes in this industry since then, there is a clear need to examine this question using recent data and refined statistical techniques. This is another issue that we hope to address in future research.
V SUMMARY AND IMPLICATIONS FOR PUBLIC POLICY
Our sensitivity analysis suggests that substitution may have nonnegligible effects on the level of R&D investment. The reduced incentive to invest in R&D due to substitution is magnified because the effective patent life in phar- maceuticals has been curtailed by five to seven years as a result of the long development and regulatory approval times for new drugs. This analysis makes it clear that the disincentive effects could be offset almost completely by an increase in the effective patent life to a rate of seventeen years. In es- sence, the substitution laws could serve to make the patent life a more effec- tive policy instrument because entry by generic substitutes will become more
40. See Grabowski, The Determinants of Industrial Research and Development: A Study of the Chem- ical, Drug and Petroleum Industries, 76 J. POLIT. ECON. 292 (1968). See also Kamien & Schwartz, Market Structure and Innovation: A Survey. 13 J. ECON. LIT. 1, 24-6 (1975).
Page 43: Winter-Spring 1979] 61

LAW AND CONTEMPORARY PROBLEMS
important upon patent expiration. The relevant policy issue then is whether the current effective life of 10-12 years is too long or too short. Some govern- ment agencies and officials feel it is too short. Proposed legislative bills have
posed that patent life for drugs begin at the point of FDA approval, restoring patent protection to the full 17 years.41 An Advisory Committee to the Presi- dent's Domestic Policy Review on Industrial Innovation has recommended this policy change for all products subject to premarket regulatory approval42 and former HEW Secretary Califano proposed that Congress consider this
policy measure.43 In the Appendix we present a theoretical model based on Nordhaus'
theory of the optimum patent life,44 which sets forth explicitly what the social benefits and costs of changing patent life are. The benefits of a shorter life are identified as the standard monopoly welfare triangle which becomes available upon patent expiration. Another benefit is the saving in R&D re- sources. The costs of a shorter life are the foregone benefits of the reduced innovation level. Our results here do not provide sufficient information to
pass judgment on this issue. We have established that there is likely to be some reduction in R&D investment and, consequently, in the innovation level. On the other hand, it is unlikely that the full information required to calcu- late the optimum life will be forthcoming. Meanwhile, decisions on the appro- priate patent life must be made. While admittedly a "second best" argument, one point to be considered is whether there is any valid reason that the patent life of pharmaceuticals should be five to seven years less than in most Ameri- can industries. As discussed above, this is a result of the long development and regulatory approval times that have evolved in the past fifteen years rather than the conscious choice of policymakers.
Selection of a specific patent life implies difficult tradeoffs and would be made under considerable uncertainty. The seventeen year patent life in the United States may or may not be viewed as a reasonable policy for balancing the types of errors this policy choice entails (i.e., too little innovation or too much market power). Nevertheless, there would appear to be little basis for a
policy of shorter patent lives for ethical drugs. Given the high risks as well as the potential for significant positive externalities connected with the discovery and development of new drug therapies, one might justify longer patent life for drugs compared with other products. In any case, given the current trend
41. Such a provision was contained, for example, in H.R. 12371 introduced into the Ninety- Fifth Congress by Representative Symms. See Hearings on H.R. 11611 (and all other similar and identical bills) before the Subcommittee on Health and the Environment of the Committee on In- terstate and Foreign Commerce, House of Representatives, 95th Cong., 2d Sess. 2146 (1978) (statement of Hon. Steven D. Symms, a representative in Congress from the State of Idaho).
42. Advisory Subcommittee on Patent and Information Policy, Department of Commerce Ad- visory Committee on Industrial Innovation, Draft Report Proposal VIII (December 20, 1978).
43. Address by Joseph A. Califano, Jr., Secretary of Health, Education, and Welfare, Public Citizen Forum (October 5, 1977), quoted in Bureau of Consumer Protection, supra note 4, at 232.
44. W. Nordhaus, INVENTION, GROWTH AND WELFARE, at 76-86 (1969).
62 [Vol. 43: No. 1

THE PHARMACEUTICAL INDUSTRY
of policy developments in the ethical drug industry further attention by aca- demicians and policymakers to the tradeoffs involved here would seem highly desirable.
APPENDIX
In this Appendix we present a simple theoretical model designed to represent the benefits and costs of passing substitution laws. The model is basically a reinterpretation of Nordhaus' theory of optimal patent life.1
A major problem arises in applying the Nordhaus model to innovation in the drug industry. His model dealt with cost reducing innovations while innovation in the phar- maceutical industry takes the form of new products. If cost reduction innovation takes
place, the demand function for the product is unchanged and consumer surplus can be used to evaluate social benefits. New drugs usually replace older, less effective
drugs, provide treatment for previously untreatable diseases, or provide effective treat- ment with fewer contraindications. These forms of innovation imply shifts in tradi- tional demand functions.
Wu suggests that Lancasterian demand functions can be used to model some new
drug innovation classes.2 Lancaster's theory assumes that satisfaction is derived from the product characteristics rather than from the products themselves.3 For example, pain relief would be a characteristic and a new drug can be viewed as providing pain therapy units more efficiently than an old drug. In what follows we shall postulate the
Price
\, ?A
B D Co
Xo Xi
Figure 1
1. Nordhaus, The Optimum Life of a Patent: Reply, 62 AMER. ECON. REV. 428-31 (1972). 2. S. Wu, Measures for Social Rates of Return from Pharmaceutical Innovations 7 (1978) (un-
published report on file with the authors of this article). 3. K. LANCASTER, CONSUMER DEMAND: A NEW APPROACH (1971).
Page 43: Winter-Spring 1979] 63

LAW AND CONTEMPORARY PROBLEMS
existence of Lancasterian demand functions. Although we recognize the sometimes strained applicability of this approach to new drug innovation, it does serve to illustrate the benefits and costs of passing substitution laws and the important role of
patent life. We begin with a situation in which substitution is not allowed. Pharmacists must
supply the consumer with the brand name drug prescribed by the doctor.
1. Let the demand for pain therapy units be as shown in Figure 1. For simplicity we shall consider only one characteristic here (i.e., pain relief).
2. Prior to innovation, the competitive price-quantity equilibrium is Po, Xo. 3. The innovator chooses its profit-maximizing level of R&D inputs which
results in a new drug that is more efficient in providing pain relief. This greater efficiency is reflected in its lower unit cost, Co. The cost saving PoCo is referred to by Nordhaus as the size of the innovation.
4. The size of the innovation, PoCo, depends positively on the level of R&D
inputs. This is Nordhaus' invention possibility function. 5. The innovating firm is assumed to appropriate all the cost saving benefits of the
new drug, Po ABCo. (More realistically, the initial price of the new drug would be set below Po thereby passing on some of the benefits to consumers.)
Hence, the profit-maximizing level of R&D investment prior to passing substitution laws can be represented mathematically as yielding a net present value of:
0 where: (a) PoABCO is the flow of net revenues to the innovator;
(b) r is the appropriate discount rate; (c) Ro is the dollar value of R&D investment compounded to time t
= 0.
A key assumption is that the innovator appropriates PoABCo indefinitely over the future. The rationale is that entry after patent expiration is taken to be completely in- effective because of brand loyalties built up over the patent period, and the existence of antisubstitution laws. While this is admittedly unrealistic, it greatly simplifies the analysis and there is some empirical support for strong brand loyalty barriers.
If the firm's discount rate equals society's discount rate, and if Ro is equal to total social R&D investment, then Bo also represents the present value of society's net bene- fits. We now show the benefits and costs to society resulting from enactment of substi- tution laws.
In terms of our simple model, passing substitution laws can be conceived of as a re- duction in the period of appropriability by the innovator from the infinite life above to some finite period T, the patent life. We assume that upon patent expiration, substitu- tion will bring about (as a result of entry by generic drug suppliers) a drop in price from Po to Co. This permits consumers to share in the benefits by transferring the cost
savings PoABCo to them plus enabling them to obtain the welfare triangle ABD, as a result of the expansion in output.
While the above benefits characterization is correct in the short run for existing drugs, the appropriate comparison requires a long run view. The reduction in ex- pected profits to innovating firms should result in a reduced level of R&D investment and a consequent reduction in the typical size of innovation.
In Figure 2 we show the long run comparison between the amount of innovation before and after the passage of substitution laws.
64 [Vol. 43: No. 1

THE PHARMACEUTICAL INDUSTRY
Price
Po \A
C, E[ F
Co
XO Xi units of pain therapy
Figure 2
As before the present value of net social benefits before repeal is:
(2) Bo = [PoABCo] e-r dt - R.
o
After repeal, the size of innovation is reduced to PoC,. Upon patent expiration in pe- riod T, price falls to C1 and output expands to X,. We can write the present value of net social benefits as:
(3) X
B, = [PoAECl]e-rt dt + [AFE]e-rt dt - R1.
0 T
The change in net benefits is simply the difference between B1 and Bo. This can be written as:
o= Et + dt + (R - R
AB - -
[CEBCo]e-rt dt + [AFE]e-rt dt+ (R0- R)
O T
or,
(4) B -= CiEBCo + [AFE]e-r (R - R r r
The three above terms represent the costs and benefits of passing substitution laws. In
particular, the first term is negative and represents the reduced innovation. The two
positive terms represent the benefits: one is the gain of the welfare triangle which be- comes available only upon patent expiration in period T and the other is the saving in R&D resources.
65 Page 43: Winter-Spring 1979]

66 LAW AND CONTEMPORARY PROBLEMS [Vol. 43: No. 1
Of course, the model sketched above is abstract and is based upon strong assump- tions. Nordhaus has discussed these assumptions and the effect of relaxing them else- where. We shall not repeat his discussion here.4 However, there are several points pe- culiar to the application of the model here that warrant brief comments.
One interpretation of the comparison above is that the new substitution laws make the patent life an effective policy instrument. If the patent life can be viewed as be-
coming a policy variable as a result of the passage of substitution laws, then the model
suggests that policymakers should not consider the benefits and costs of substitution laws independently of the patent life. In short, if the existing T is such that passage of substitution laws makes AB negative, policymakers can always offset this by an appro- priate choice for a new T. In fact, Nordhaus' model determines the optimum T which maximizes the net present value of benefits. Only by chance would one expect the op- timum T to equal the existing life which is now on the order of ten-to-twelve years in this industry.
We have not distinguished between consumers and producers in eval- uating social benefits. While this is justifiable given our concern with economic effi- ciency, it is also true that the primary political impetus for passing substitution laws de- rives from the large transfer expected from producers to consumers.
Finally, we have ignored the issue of possible quality differences between the inno- vator's new product and the generic drugs that are introduced upon patent life expira- tion. It is a controversial point as to whether the generic drugs are perfect substitutes for the pioneer drug, as we have implicitly assumed here.
4. Nordhaus, supra note 1, at 428.