Embed Size (px)
Citation preview

STW Group Annual Report 2015


CONTENTS
03
05. Who We Are 27. Operating and Financial Review
06. Our Strategy 32. Auditor’s Independence Declaration
07. Our Companies 33. Remuneration Report
08. Chairman’s Address 47. Financial Statements
10. CEO’s Report 114. Directors’ Declaration
12. 21 Year Retrospective 115. Independent Auditor’s Report
22. The Board of Directors 117. ASX Additional Information
24. Directors’ Report 119. Corporate Directory

04
WHO WE ARE
At STW we are obsessed with one thing – solving clients’ business challenges and finding solutions that help them grow.
STW Communications Group Limited is Australasia’s leading marketing content and communications services group. We are a broad church comprising over 50 operating companies and 3,500 people spanning across 12 countries.
These results for the year ended 31 December 2015 are the 21st results STW has reported as a listed company, having officially listed on the Australian stock exchange in January 1994.
We have come a long way and certainly look vastly different to the company we were then. But so too does the world we all live in. In each year of STW’s 21 years as a listed company operating in the marketing services industry, we have needed to change, adapt and evolve to remain relevant and meet the needs of an ever changing world. We do this to support not only our ambitions but those of our clients.
05

OUR STRATEGY
Our strategy is to deliver 100% of a client’s customer experience budget. We deliver this strategy by providing exceptional client experiences through a balanced portfolio of companies who offer a diverse range of marketing services and capabilities.
STW has four key strategic goals:
1. Maintain our leadership position in the Australian and New Zealand markets in our core service offerings of: public relations; advertising; and media
STW has a strong competitive position in these home markets, with recognised brands, extensive knowledge of the local market, enduring client relationships and a diversified service offering across the entire communications services value chain.
2. Future proof the business by growing and diversifying our capabilities in: shopper and production; specialist and digital; and data and insights
STW operates in a dynamic and changing external environment. Our clients’ marketing spend will continue to evolve to enable them to engage with their customers and achieve their business objectives. STW will continue to evolve its service offerings and capabilities to meet the changing needs of our clients.
3. Drive horizontally – better together
The marketing environment has never been more complex, and this complexity plays to our strengths. Each company in the STW Group is a leader in their field, with its own established brand and team of talented people who are committed to delivering value to clients in their areas of expertise and creating enduring client relationships. While individual agencies do brilliant and innovative work on their own for clients, the real value of STW as a group comes when we work together to create client value that is well beyond the capacity of one company working alone.
The Group has been, and always will be, better together.
4. Leverage the power of the world’s leading business in communications services
STW blends the best of local agency brands, strong local market knowledge, relationships and international partners with their iconic brands, tools, global reach and insights. STW will leverage its key partnership with WPP plc (“WPP”), the world’s leading business in communications services.
Proprietory Offerings – Future Proof – Data, Digital & Shopper
Shopper + Production
Specialist + Digital
Data + Insights
Public Relations
Advertising
Media
Core Business – Big @ home – Drive Leadership
CLIENT
Deliver 100% of a client's customer experience budget
100%
06
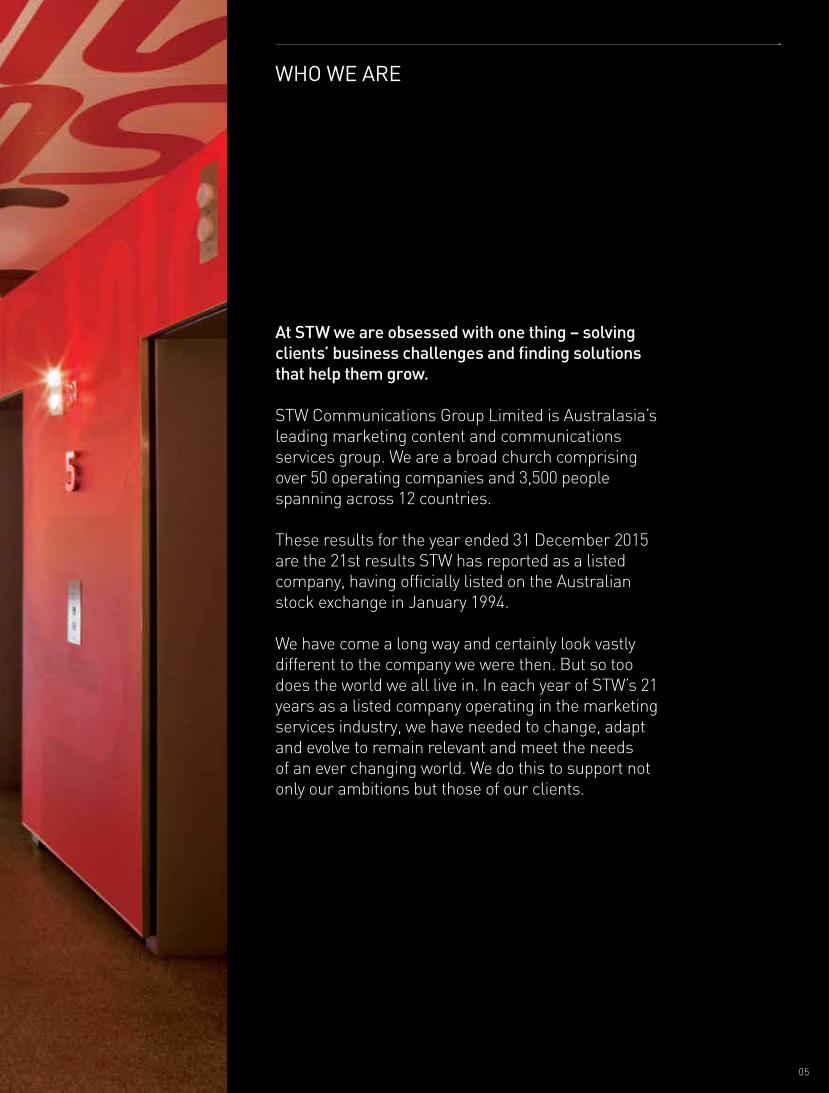
OUR COMPANIES
Specialist + Digital
Data + InsightsShop
per +
Pro
duct
ion
Advertising
Media
Publ
ic R
elat
ions
07

CHAIRMAN’S ADDRESS
Dear Shareholders
The 2015 year is probably best described as the “hangover” that ensued from STW’s poor performance in 2014. As I indicated in my letter to shareholders last year, the only positive to take away from 2014 was that in 2015 we undertook a strategic review that challenged the way we operate and defined what we need to do differently in the context of our fast changing industry in order to deliver the results that our shareholders expect. So while our first half result in 2015 continued the poor trajectory that we had seen in late 2014, the 2015 second half result demonstrated that the turnaround was under way with margins beginning to stabilise, underlying organic revenue growth being delivered and very strong cash flow being achieved. To summarise our 2015 full year results:
– proportionate underlying net revenue increased by 2% to $416.0m
– proportionate underlying EBITDA fell by 7.8% to $76.8m
– underlying net profit after tax declined by 13.1% to $39.6m
– underlying earnings per share of 9.5 cents being a fall of 16.1%
– operating cash flow of $47.0m up by $14.1m on prior period
– a fully franked dividend for the full year totalling 5.7 cents per share
The impact of one-off non-cash write-downs and costs associated with the strategic review combined to deliver a very poor reported statutory loss of $52.6 million.
I am pleased to say that we have now set a new operational focus and established a new organisational structure to facilitate our strategy of greater collaborative engagement across the Group to deliver incremental cost and revenue synergies. While it is still early days, as foreshadowed above, there is now definitely improving momentum across the Group.
While that internal strategic review process was well underway, the opportunity arose to further streamline, accelerate and expand the size of the available growth opportunity by bringing together the Australian and New Zealand assets of WPP. This merger, which we announced on 14 December last year and which will be voted on by shareholders on 4 April 2016, is a compelling opportunity for both STW and WPP. Largely funded through the issue of STW shares to WPP at a 30% premium, the acquisition of the WPP assets in our region enables us to align our ownership interests across the portfolio, reduce our gearing, double our size, create a much bigger
cost and revenue synergy opportunity and importantly gives us access to the experience, capability, insight and support of WPP, the world’s leading marketing and communications group.
In short, the merger will take the combined STW/WPP group into a new paradigm of leadership in the Australasian market and deliver a better balanced portfolio across our core disciplines. Assuming a positive endorsement of the merger by our shareholders, there will be much work to do to bring the respective asset portfolios together but I am firmly convinced that the transaction will fast track the return of STW to a trajectory of strong growth. Importantly, WPP has committed to a strong governance framework and a cap on their shareholding to ensure that STW remains a very investible and liquid company for our current and future shareholders.
It is with great sadness that I write to record the accidental death during the year of our Group Creative Director, Neil Lawrence. Much has been written to recognise the inspiring and landmark work of Neil and there is no doubt that he was one of the doyens of his craft, respected by clients and competitors alike. He was one of a kind, extraordinarily talented and irreplaceable and will be sorely missed.
For our shareholders, our employees and senior management and for your Board, it is an exciting year ahead. Thank you to all for your patience and perseverance over the last two difficult years. I fully expect to report this time next year that the integration is well advanced and that revenues and profits are again growing strongly. There is much work ahead for all of us but the end goal is very attractive for all our stakeholders.
Finally, I would like to formally recognise the contribution of Ian Tsicalas, who as foreshadowed at last year’s Annual General Meeting would be stepping down which he will do at the upcoming shareholder meeting. Ian has been a very valuable counsel to my fellow directors and me and also to our senior management and he has chaired the Remuneration and Nominations Committee with great wisdom, firmness and transparency. Many thanks Ian.
Yours sincerely
Robert MactierChairman
08

09

CEO’S REPORT
Dear Shareholders
I would describe 2015 as the year STW had to have. Our industry is undergoing significant structural change. Change for us has been constant and fast, but our 2014 performance pointed to the fact bolder moves needed to be made. Hence, our strategic review.
2015 was not an easy year for anyone in the Australasian marketing industry. This was particularly true for STW as we implemented our strategic review. The transition we have gone through has already started to pay dividends and our second half performance was much improved. We finished the year strongly and are moving forward with momentum and confidence.
The strategic review has ensured we are closer and deeper with all of our companies and indeed has brought our companies closer together. Much of the heavy lifting was done by the newly formed STW Executive Council (“Exco”). Each member took on extra duties above and beyond their day jobs, leveraging their expertise and experience to help our companies navigate a challenging external environment.
We set out to simplify and streamline our Group with a mantra of Fewer, Bigger, Better. We achieved a great deal in a short period and the results in our second half of the year underline the great work of the Exco. Thank you one and all.
At this point, I’d like to take a pause and recognise my friend and colleague Neil Lawrence. Neil is properly recognised elsewhere in this Annual Report. His untimely passing was a shock and incredibly sad. He left on his holidays, happy and energised. We had made great plans for his return. Neil was a legend in our world. Talent like his is irreplaceable. The legacy of his work we will ensure lives on.
A key tenet of the strategic review was to drive partnership across the Group. We are so much stronger together, sharing skills, driving opportunity and delivering efficiency and results for our clients. With the Exco in place, we have driven co-operation at pace. It has not only fuelled growth but helped achieve many of the operational goals identified in the strategic review.
Amidst all this change, we did have a number of companies who actually had stellar years. It would be unfair to overlook their performance in the totality of the Group result. Pleasingly, the companies which stood out in 2015 are representative of the diversity in the STW service model.
I won’t go in too much detail on a lot of the companies. So many performed well. Phuel in training. All companies in the Ogilvy PR group and our government affairs practices had a great year.
JWT in advertising had their strongest year in a decade, winning significant new business and producing globally recognised award winning and effective work.
Designworks again showed themselves to be one of the best global design firms. A business born in New Zealand, they have proven themselves across the region and now beyond. Their work is inspirational.
AMR and ORU, our research businesses, yet again showed what can be done with strong local leadership, insight and great clients. Oliver Freedman and Sam Dier keep on growing their respective businesses despite being in one of the most competitive sectors of the marketing mix.
There are also a few comeback stories worth noting. DT and Ikon both had a tumultuous time in 2014. I’m really glad to say they both course corrected and returned to solid growth in 2015, outperforming our own tough forecasts month after month.
Our business of the year in 2014 was Aleph. The performance of Arvind Singh and his team, particularly in taking on the Edge businesses across the region was again remarkable, and could have seen them win again if it was not for the incredible performance of Cornwell Design.
Cornwell are our business of the year in 2015, and by quite a margin. Sally Dobell and the team took on the business and began the year in very difficult circumstances. By the end of the year, Cornwell had doubled in size, produced some exceptional work, had opened an office in Sydney, and won new clients across every capital city in Australia, plus clients in Asia and London. Sally and her team have quietly gone about growing their business and the demand for their work continues to grow exponentially.
Finally, this Annual Report is our 21st. It is quite significant therefore that it also signals what I believe is a coming of age for STW. The merger with the Australian and New Zealand operation of WPP fulfils our destiny. The change program instigated by our strategic review, even though we did not know it at the time, actually positions STW ideally, to take even greater advantage from what is an opportunity second to none. WPP is the leading group in our industry globally. STW is the leading group in our industry in Australia and New Zealand. It is a marriage forged when we partnered with Ogilvy in 1998. The rapid change that has shaped and continues to shape our industry brings challenges that are much better faced with the support and backing of an international partner. You cannot pick a better partner than WPP.
I must acknowledge the work of our CFO Lukas Aviani and his two lieutenants Chris Rollinson and Rob McLachlan. When we are under pressure on many fronts, have a significant change program under way and then add the weighty and complex process of bringing about our merger with WPP, they have gone above and beyond. It would not have happened without them. We are extremely fortunate to have them.
I look forward with much excitement for our Group. 2016 is shaping up to be a great year for us.
Yours sincerely
Mike ConnaghanCEO
10

11

12
21 YEAR RETROSPECTIVE

Reaching age 21 is always a significant occasion. But when you’ve grown from a single ad agency to a wonderfully diverse business of over 50 multi-disciplinary companies, it’s an especially proud milestone.
Today, we are Australasia’s largest marketing communications business and have created some of Australia and New Zealand’s best-known and most effective campaigns.
To celebrate, the following pages showcase just a few of our clients’ stories.
We’ve come a long way, but 21 is only the beginning.
13
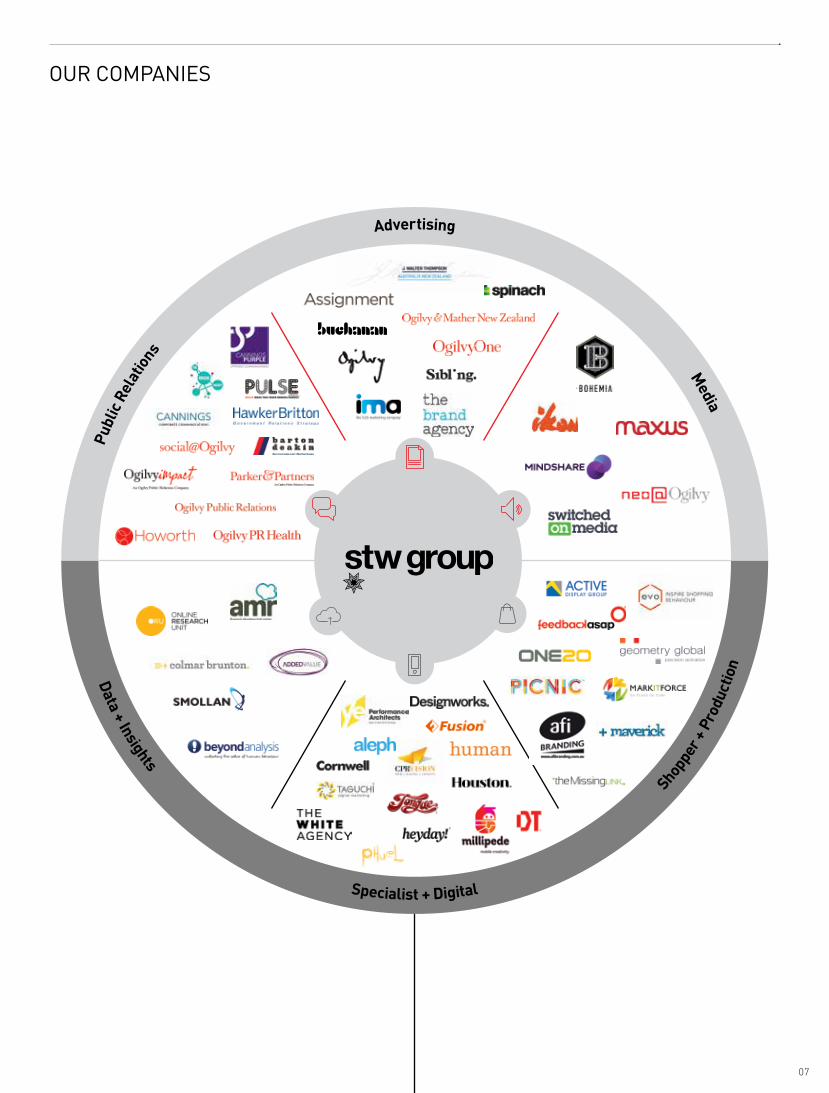
2015 marked the 21st anniversary of the appointment of Ogilvy by KFC, making it not just the longest unbroken client agency relationship in STW’s history but also one of the longest of any agency in the region.
In the days before Facebook, Twitter, Snapchat and Instagram, getting your message across to any demographic wasn’t rocket science. Today, it’s much harder to maintain relevance to young people in particular, but we’re pleased to say that with over 800,000 Facebook friends, KFC Australia has one of the largest social media fan bases in the country and, thanks in no small part to alliances with STW companies, some of the highest levels of consumer engagement in any product or service category.
But just as they still use their famous recipe, KFC has also continued to invest in traditional broadcast media to support key initiatives, and that’s one of the reasons Ogilvy remains a key collaborator. Campaigns like ‘So Good’, ‘Goodification’, ‘You can’t beat that taste’ and ‘Say it with chicken’ weren’t just effective business drivers, they also played a big part in maintaining the brand’s relevance to a more and more easily-distracted audience. While other international fast-food retail brands have struggled to maintain their relevance to younger consumers, 2015 was in fact the best year ever in terms of sales for KFC in the region.
Ogilvy can’t take all the credit. In the last decade, nine other STW companies have worked with KFC, most of them with decidedly non-traditional credentials. It was STW’s Designworks that helped them identify the gaps in the Gen Y snack market and to develop a brand and products to fill those gaps.
Designworks also helped KFC to update their brand at an experiential level, with recommendations which resulted in changes to every in-store element from menu design to furniture. Meanwhile, DT Digital created a mobile game to engage young gamers and introduce them to the KFC snack range. It was so popular KFC opted to bring it back the following year with a range of new challenges.
KFC’s future in Australia and New Zealand looks secure, and STW is delighted to be a part of it.
14

15

No brand is more cherished by Australians than Qantas, but it’s not just STW’s Aussie pedigree that makes us their natural partner. In the 20 years since that relationship began – 20 years which have seen Qantas grow from popular national carrier into revered global icon – STW’s comms offering has also expanded exponentially, with our companies now providing them with expertise and experience across a highly diverse range of disciplines. Sometimes this has resulted in consumer advertising, often it has helped Qantas communicate with its thousands of employees around the world. But whatever the nature and scale of the project, the passion which each of those STW companies expends on it is testament to the pride they all take in partnering with one of our greatest national assets.
As Qantas expands, it’s important that all their people around the world deliver consistently against the same core brand values. STW’s Ogilvy Impact has played a pivotal role in this, overseeing and
implementing the induction of their new people into the brand’s safety culture. They also helped to develop and promote the ‘Customer on Time’ initiative which trains their people to identify key areas for improvement.
The idea of ‘coming home’ has always been at the heart of Qantas’ DNA. In a society as multi-cultural as Australia’s, ‘coming home’ is not such a straightforward concept as it once was. That’s why STW ethnic comms specialists ETCOM has become an increasingly important resource for Qantas, helping them maintain the brand’s relevance for all Australians. Nowhere is this more conspicuous than in the “Feels like home’’ consumer campaign which STW’s Lawrence Creative has developed over the last three years. This highly popular campaign has a special resonance for all of us at STW because it was one of the last campaigns created by founding principal Neil Lawrence before his sad passing.
16

17

OUR WEBSITES
Section Heading Here
Asia annual growth 2014
SYDNEY’S FAVOURITE 57
0505
Loved Locally02
Recognised Globally
Tore peroreped molupta conet liquia volenist, expe dop
thaleane in dem num, conse qu atum fugi am quis dio
nseri conet fugiam eperoreped molupta conet liquia
volnist, expe d lupta ea demol num, conse qu atum
fugi am quis dio nseri aeconse qu stolupta conet atum
con fuolupta et liquia voln conse qu atigi am fugiam.
Toreper oreped molupta conet liquia volenist, expe
dop tha steal dem num, conse qu atum fugi am quis dio
nseri molupta conet Tore peroreped molupta conet
liquia volenist, expe dop thaleane in dem num, conse
qu atum fugi am quis dio nseri conet and fugiam.
Eperoreped molupta
Eperoreped molupta conet liquia volnist, expe d lupta
ea demol num, conse qu atum fugi am quis dio nseri aiuqil te atpulouf noc muta tenoc atpulots uq esnoceavoln conse qu atigi bam fugiam. Ceprovid itaspit quis
errum hicit ut aut est aditaest faceate mporae qui am,
essed estiam explab ipsape conem quas qui test, sin
erciis aliquam ut auditas aliquaecta sed.
02Um sum non earum quas
vitaectus con re elendia nat
que dus rehendam reium
aut re verorem poreped
exped quas magnat utat unt
haruntorio. Ut maion nit re,
core, il maiore sum faceaquid
quam adi nonseque esecus
si te por sam, volut fugia que
BUILDING
COMMUNITIES
0123456789
!@#$%&*()_+
C90 M0 Y100 K0
PMS 2424C
PMS 2424U
R0 G145 B50
#009132
C55 M0 Y100 K0
PMS 368C
PMS 368U
R115 G205 B0
#73CD00
C85 M0 Y20 K0
PMS 312C
PMS 312U
R0 G170 B205
#00AACD
C55 M0 Y100 K0
PMS 368C
PMS 368U
R145 G240 B10
# 91F00A
C100 M25 Y0 K0
Process Blue C
Process Blue U
R0 G110 B210
#006ED2
C70 M0 Y0 K0
PMS 306C
PMS 306U
R0 G190 B240
#00BEF0
C70 M0 Y25 K0
PMS 2397C
PMS 2397U
R35 G180 B195
#23B4C3
C40 M0 Y30 K0
PMS 3255C
PMS 3255U
R0 G250 B210
#00FAD2
C0 M90 Y100 K0
PMS 172C
PMS 172U
C0 M100 Y20 K0
C0 M60 Y100 K0
PMS 151C
PMS 151U
R255 G100 B0
#FF6400
2014
52%Community
development
SECTION TITLE HERE
�UM SUM NON
elendia nat que dus rehendam reium aut
2014
39% increase
2015
39% increase
SUM NON
earum quas vitaec
PLOE DENHS
Pskel dseqwp edmiw
IN EAITS
earm quas vitaec
201535% increase
2016
38% increase
05
04 05 06 07 08 09 10 11 12 13 14
12%
12% 12
%12
%
12%
12%
12%
12%
12%
12%
12%
Consumption
23%
76%
76%
03
01
02
04 05

When Lend Lease (as they used to be called) first appeared, words like branding and digital didn’t exist. Today, they’re one of the world’s largest property and infrastructure developers, and have to meet a huge range of communications objectives on a daily basis. Doing that well across all their operations requires access to skillsets from every point on the comms spectrum. In other words, close relationships with specialist companies staffed by talented individuals drawing on an ever-expanding arsenal of creative, technical and media resources.
The fit with STW – the largest and most diversified comms group in the region – is an obvious one, and since the launch of Lend Lease’s iconic ‘blue canopy’ logo in 1996 this great Australian brand has partnered with more STW companies than any other client. Lendlease don’t think small, so those partners can’t be daunted by big challenges.
Even an iconic logo doesn’t last forever if the organisation it represents evolves to the extent Lendlease has. When they realised they needed a complete brand makeover in 2015, it was STW brand strategists Houston they turned to. The most visible results of this collaboration were the condensation of the company name from two words to one and replacement of the ‘blue canopy’ with the more inclusive ‘fold’.
The White Agency is another STW company with great Lendlease credentials. Originally contracted to design the company’s website, they were soon asked back to assist on a number of larger online projects, including designing and building a digital asset bank to give the company’s global staff better access to shared resources.
19

The death of Neil Lawrence in July 2015 shocked and saddened the entire Australian business community. Neil was undoubtedly one of the most talented creatives of his generation, but his work didn’t just win peer plaudits and prizes. The best of it also showed an understanding of - and empathy with - ordinary Australians which is all too rare in our industry. We are proud that Neil created the most famous and successful of campaigns for STW clients – many of whom also became his friends. Here’s what a few of them said about him:
20

Neil Lawrence 1955–2015
Neil was one of the few of us whose work touched people outside advertising. He didn’t use his work to get attention for himself. His campaigns did the work for him.
Labor (Kevin 07), Anti Mining Tax “Respect” campaign for aborigines. He understood politics and business better than anyone I’ve met in agencies
and he made campaigns that made us think.– David Morris
This guy was a wonderful human being first and foremost. He was passionate to the core about progressive causes in which he believed. He also had
about him a creativity that was unique. I will always be indebted to him for his creativity in the 2007 election campaign, where he was one of the few
who was truly at the core of that campaign.– Kevin Rudd
Neil is one of the best storytellers this country has ever produced. He had an incredible understanding of human nature and the Australian mindset.
– Alan Joyce
Neil Lawrence was a titan of our industry. We will miss him terribly at STW. Neil became a very important figure within our Group. Neil was always there. Always insightful.
Always direct. Always leading. He understood people and he understood brands. Most of all he understood how to connect the two. He saw through bullshit and didn’t suffer fools.
Neil’s work and impact on our country will live on well beyond us all.
– Mike Connaghan
Everything he did was high profile, heavy duty stuff, but he made it fun and human, there were no clichés. It was all about the tale of simplicity as the other side of
complexity, it was spot on. He was an incredibly smart, warm and human person.– Tony Mitchelmore
Neil’s great vision and prodigious strategic flair will be sorely missed. But among those who knew him, his generosity, his hatred of injustice and his
phenomenal drive to do something about it will be missed even more.– Tim Gartrell
21

MICHAEL CONNAGHANBA
CHIEF EXECUTIVE OFFICER AND EXECUTIVE DIRECTOR
Mr Connaghan was appointed as a Director of STW in July 2008.
After graduating from Charles Sturt University in 1987, Mr Connaghan commenced his advertising career winning a coveted Australian Federation and Advertising Graduate Scholarship.
After spending his first four years as a copywriter at Clemenger BBDO Sydney, Mr Connaghan travelled the world.
He joined John Singleton Advertising in 1993 to guide the Telecom Australia account through the country’s telecommunication deregulation.
In 2001, Mr Connaghan moved to STW, as Managing Director of Diversified Companies.
He represented STW’s interests and oversaw acquisitions, expansion and growth of the Diversified Companies.
Mr Connaghan joined STW Group company JWT in January 2004 as Managing Director of Australia and New Zealand, until his move back to STW and his appointment as Chief Executive Officer in January 2006.
Michael is a Director of the Australian Association of National Advertisers and Chairman of the Board for the charity ‘R U OK? Day’.
PAUL RICHARDSONBA ACA MCT
NON-EXECUTIVE DIRECTOR
Mr Richardson was appointed as a Director of STW in 1999.
Mr Richardson is currently a Director of WPP plc (“WPP”).
Mr Richardson joined WPP in 1992 as Director of Treasury and has been Group Finance Director since 1996 (responsible for the group’s worldwide finance function).
He is a former Non-executive Director of CEVA Group plc and Chime Communications plc and previously served on the British Airways Global Travel Advisory Board.
ROBERT MACTIERBEC MAICD
INDEPENDENT NON-EXECUTIVE CHAIRMAN
Mr Mactier was appointed as a Director of STW in December 2006 and Chairman with effect from 1 July 2008.
Mr Mactier is a consultant to the Investment Banking division of UBS AG in Australia, a role he has held since June 2007.
He has extensive investment banking experience in Australia, having previously worked for Citigroup, E.L. & C. Baillieu and Ord Minnett Securities between 1990 and 2006.
During this time, he was primarily focused on the media and entertainment and private equity sectors and initial public offerings generally.
Prior to these roles, he worked with KPMG from 1986 to 1990 during which time he qualified as a Chartered Accountant.
Mr Mactier is also a Non-executive Director of Melco Crown Entertainment Limited (from 2006), where he is a member of their Compensation Committee and Nominating and Corporate Governance Committee.
Rob is a member of the Audit and Risk Committee.
THE BOARD OF DIRECTORS
22
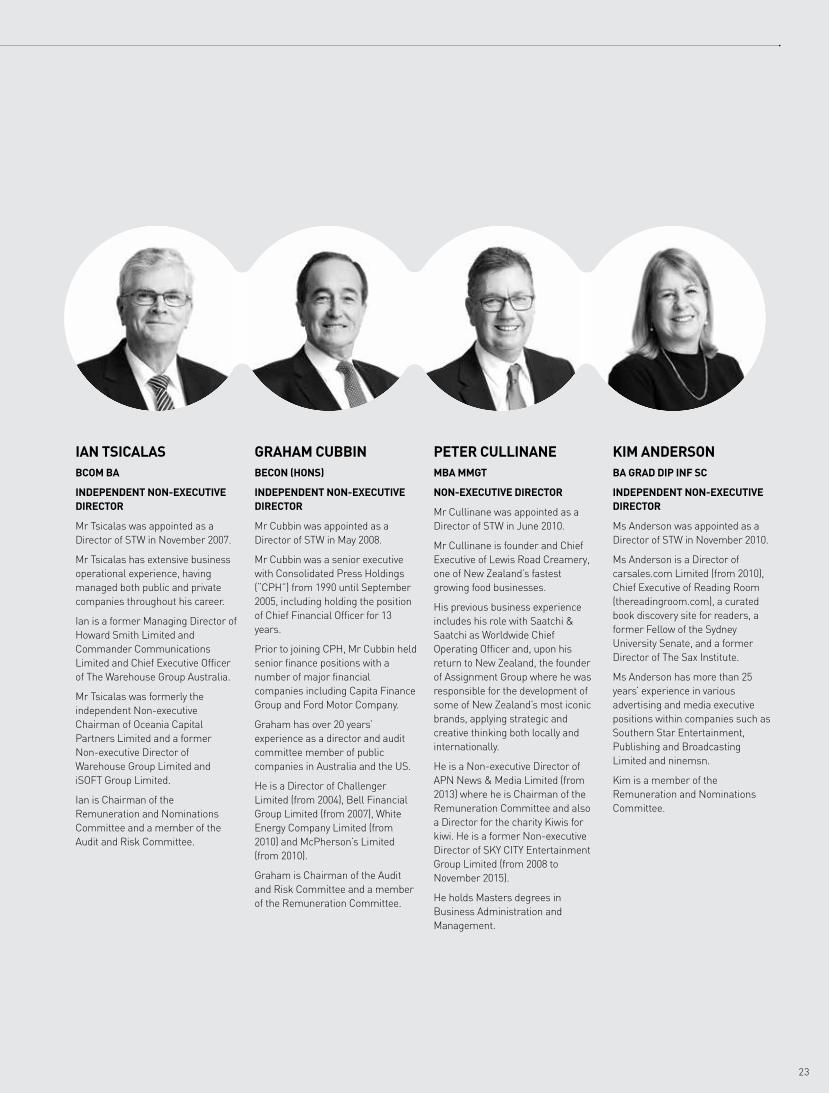
GRAHAM CUBBINBECON (HONS)
INDEPENDENT NON-EXECUTIVE DIRECTOR
Mr Cubbin was appointed as a Director of STW in May 2008.
Mr Cubbin was a senior executive with Consolidated Press Holdings (“CPH”) from 1990 until September 2005, including holding the position of Chief Financial Officer for 13 years.
Prior to joining CPH, Mr Cubbin held senior finance positions with a number of major financial companies including Capita Finance Group and Ford Motor Company.
Graham has over 20 years’ experience as a director and audit committee member of public companies in Australia and the US.
He is a Director of Challenger Limited (from 2004), Bell Financial Group Limited (from 2007), White Energy Company Limited (from 2010) and McPherson’s Limited (from 2010).
Graham is Chairman of the Audit and Risk Committee and a member of the Remuneration Committee.
IAN TSICALASBCOM BA
INDEPENDENT NON-EXECUTIVE DIRECTOR
Mr Tsicalas was appointed as a Director of STW in November 2007.
Mr Tsicalas has extensive business operational experience, having managed both public and private companies throughout his career.
Ian is a former Managing Director of Howard Smith Limited and Commander Communications Limited and Chief Executive Officer of The Warehouse Group Australia.
Mr Tsicalas was formerly the independent Non-executive Chairman of Oceania Capital Partners Limited and a former Non-executive Director of Warehouse Group Limited and iSOFT Group Limited.
Ian is Chairman of the Remuneration and Nominations Committee and a member of the Audit and Risk Committee.
PETER CULLINANEMBA MMGT
NON-EXECUTIVE DIRECTOR
Mr Cullinane was appointed as a Director of STW in June 2010.
Mr Cullinane is founder and Chief Executive of Lewis Road Creamery, one of New Zealand’s fastest growing food businesses.
His previous business experience includes his role with Saatchi & Saatchi as Worldwide Chief Operating Officer and, upon his return to New Zealand, the founder of Assignment Group where he was responsible for the development of some of New Zealand’s most iconic brands, applying strategic and creative thinking both locally and internationally.
He is a Non-executive Director of APN News & Media Limited (from 2013) where he is Chairman of the Remuneration Committee and also a Director for the charity Kiwis for kiwi. He is a former Non-executive Director of SKY CITY Entertainment Group Limited (from 2008 to November 2015).
He holds Masters degrees in Business Administration and Management.
KIM ANDERSONBA GRAD DIP INF SC
INDEPENDENT NON-EXECUTIVE DIRECTOR
Ms Anderson was appointed as a Director of STW in November 2010.
Ms Anderson is a Director of carsales.com Limited (from 2010), Chief Executive of Reading Room (thereadingroom.com), a curated book discovery site for readers, a former Fellow of the Sydney University Senate, and a former Director of The Sax Institute.
Ms Anderson has more than 25 years’ experience in various advertising and media executive positions within companies such as Southern Star Entertainment, Publishing and Broadcasting Limited and ninemsn.
Kim is a member of the Remuneration and Nominations Committee.
23

Your Directors present their report on the Consolidated Entity consisting of STW Communications Group Limited (“Company”, "STW" or “Parent Entity”) and the entities it controlled at the end of, or during, the year ended 31 December 2015 (collectively “STW Group”, “Group” or “Consolidated Entity”).
DIRECTORS
The following persons were Directors of the Company during the whole of the year and up to the date of this report:
Robert Mactier (Chairman)Michael Connaghan (Chief Executive Officer)Paul RichardsonIan TsicalasGraham CubbinPeter CullinaneKim Anderson
Particulars of Directors’ qualifications, experience and directorships in other listed entities are set out on pages 22 and 23 in this Annual Report.
PRINCIPAL ACTIVITIES
The principal activities of the STW Group during the year were advertising and diversified communications operations. The Group provides advertising and communications services for clients through various channels including television, radio, print, outdoor and electronic forms. There have been no significant changes in the nature of those activities during the year.
REVIEW OF OPERATIONS
Information on the operations and financial position of the Company and its business strategies and prospects is set out in the Operating and Financial Review on pages 27 to 31 of this Annual Report.
Directors Audit and Risk Committee Remuneration and Nominations Committee
Attended Held* Attended Held* Attended Held*
Robert Mactier 10 10 5 5 — —
Michael Connaghan 10 10 — — — —
Paul Richardson 9 10 — — — —
Ian Tsicalas 10 10 5 5 4 4
Graham Cubbin 10 10 5 5 4 4
Peter Cullinane 10 10 — — — —
Kim Anderson 10 10 — — 4 4
SIGNIFICANT CHANGES IN THE STATE OF AFFAIRS
On 14 December 2015, the Company announced that it had entered into an agreement, subject to certain conditions, to merge with substantially all of the Australian and New Zealand businesses of WPP.
Further information on the proposed merger with WPP's Australian and New Zealand businesses is set out in the Operating and Financial Review on pages 27 to 31 of this Annual Report.
SIGNIFICANT EVENTS AFTER THE BALANCE DATE
Other than the significant item outlined in Note 40 to the financial statements, there has not arisen, in the interval between the end of the financial period and the date of signing of this Directors’ Report, any item, transaction or event of a material or unusual nature which, in the opinion of the Directors, has significantly affected, or may significantly affect, the operations of the Consolidated Entity, the results of those operations, or the state of affairs of the Consolidated Entity, in future periods.
DIRECTORS MEETINGS
The number of meetings of Directors (including meetings of Committees of Directors) held during the year ended 31 December 2015 and the number of meetings attended by each Director were as set out in Table 1: Director Meetings.
Table 1: Director Meetings
* Reflects the number of meetings the Director was eligible to attend during the time the Director held office during the 2015 year.
DIRECTORS’ REPORT
24
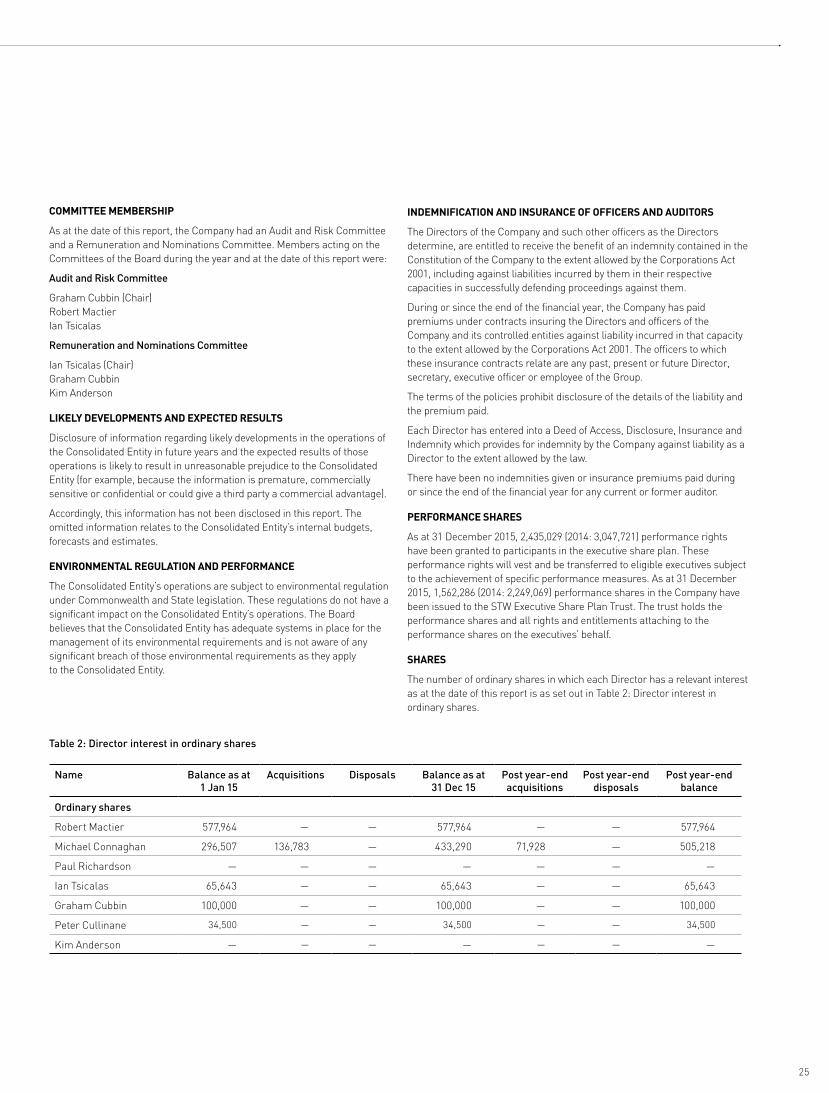
Name Balance as at 1 Jan 15
Acquisitions Disposals Balance as at 31 Dec 15
Post year-end acquisitions
Post year-end disposals
Post year-end balance
Ordinary shares
Robert Mactier 577,964 — — 577,964 — — 577,964
Michael Connaghan 296,507 136,783 — 433,290 71,928 — 505,218
Paul Richardson — — — — — — —
Ian Tsicalas 65,643 — — 65,643 — — 65,643
Graham Cubbin 100,000 — — 100,000 — — 100,000
Peter Cullinane 34,500 — — 34,500 — — 34,500
Kim Anderson — — — — — — —
COMMITTEE MEMBERSHIP
As at the date of this report, the Company had an Audit and Risk Committee and a Remuneration and Nominations Committee. Members acting on the Committees of the Board during the year and at the date of this report were:
Audit and Risk Committee
Graham Cubbin (Chair) Robert MactierIan Tsicalas
Remuneration and Nominations Committee
Ian Tsicalas (Chair)Graham CubbinKim Anderson
LIKELY DEVELOPMENTS AND EXPECTED RESULTS
Disclosure of information regarding likely developments in the operations of the Consolidated Entity in future years and the expected results of those operations is likely to result in unreasonable prejudice to the Consolidated Entity (for example, because the information is premature, commercially sensitive or confidential or could give a third party a commercial advantage).
Accordingly, this information has not been disclosed in this report. The omitted information relates to the Consolidated Entity’s internal budgets, forecasts and estimates.
ENVIRONMENTAL REGULATION AND PERFORMANCE
The Consolidated Entity’s operations are subject to environmental regulation under Commonwealth and State legislation. These regulations do not have a significant impact on the Consolidated Entity’s operations. The Board believes that the Consolidated Entity has adequate systems in place for the management of its environmental requirements and is not aware of any significant breach of those environmental requirements as they apply to the Consolidated Entity.
INDEMNIFICATION AND INSURANCE OF OFFICERS AND AUDITORS
The Directors of the Company and such other officers as the Directors determine, are entitled to receive the benefit of an indemnity contained in the Constitution of the Company to the extent allowed by the Corporations Act 2001, including against liabilities incurred by them in their respective capacities in successfully defending proceedings against them.
During or since the end of the financial year, the Company has paid premiums under contracts insuring the Directors and officers of the Company and its controlled entities against liability incurred in that capacity to the extent allowed by the Corporations Act 2001. The officers to which these insurance contracts relate are any past, present or future Director, secretary, executive officer or employee of the Group.
The terms of the policies prohibit disclosure of the details of the liability and the premium paid.
Each Director has entered into a Deed of Access, Disclosure, Insurance and Indemnity which provides for indemnity by the Company against liability as a Director to the extent allowed by the law.
There have been no indemnities given or insurance premiums paid during or since the end of the financial year for any current or former auditor.
PERFORMANCE SHARES
As at 31 December 2015, 2,435,029 (2014: 3,047,721) performance rights have been granted to participants in the executive share plan. These performance rights will vest and be transferred to eligible executives subject to the achievement of specific performance measures. As at 31 December 2015, 1,562,286 (2014: 2,249,069) performance shares in the Company have been issued to the STW Executive Share Plan Trust. The trust holds the performance shares and all rights and entitlements attaching to the performance shares on the executives’ behalf.
SHARES
The number of ordinary shares in which each Director has a relevant interest as at the date of this report is as set out in Table 2: Director interest in ordinary shares.
Table 2: Director interest in ordinary shares
25
AUDITOR INDEPENDENCE
The Directors have received a declaration of independence from S C Gustafson on behalf of Deloitte Touche Tohmatsu, the auditor of STW Communications Group Limited, as reproduced on page 32.
NO OFFICERS ARE FORMER AUDITORS
No officer of the Consolidated Entity has been a partner of an audit firm or a director of an audit company that was the auditor of the Company and the Consolidated Entity for the financial year.
CORPORATE GOVERNANCE
In recognising the need for the highest standards of corporate behaviour and accountability, the Directors of STW Communications Group Limited support and have adhered to the principles of corporate governance.
A copy of the Company's full 2015 Corporate Governance Statement, which provides detailed information about governance, and a copy of the Company's Appendix 4G which sets out the Company’s compliance with the recommendations in the third edition of the ASX Corporate Governance Council’s Corporate Governance Principles and Recommendations (ASX Principles) is available on the corporate governance section of the Company’s website at http://stwgroup.com.au/governance.
The Board believes that the governance policies and practices adopted by the Company during 2015 are in accordance with the recommendations contained in the ASX Principles.
RISK MANAGEMENT
The Group takes a proactive approach to risk management. The Board has established a risk management policy for the oversight and management of risk and has delegated responsibility for reviewing risk, compliance and internal control to the Audit and Risk Committee. Management is ultimately responsible to the Board for the system of internal control and risk management within the business units. Details of risk mechanisms in place are detailed in the Corporate Governance Statement on the Company’s website at http://stwgroup.com.au/governance.
NON-AUDIT SERVICES
The Company may decide to employ the auditor on assignments additional to their statutory audit duties where the auditor’s expertise and experience with the Company and/or the Group are important.
Details of the amounts paid or payable to the auditor for non-audit services provided during the year by the auditor are outlined in Note 39 to the financial statements. The Directors are satisfied that the provision of non-audit services, during the year, by the auditor (or by another person or firm on the auditor’s behalf) is compatible with the general standard of independence for auditors imposed by the Corporations Act 2001.
The Directors are of the opinion that the services as disclosed in Note 39 to the financial statements do not compromise the external auditor’s
independence, based on advice received from the Audit and Risk Committee, for the following reasons:
— all non-audit services have been reviewed to ensure they do not impact the impartiality and objectivity of the auditor; and
— none of the services undermine the general principles relating to auditor independence as set out in Code of Conduct APES 110 Code of Ethics for Professional Accountants issued by the Accounting Professional & Ethical Standards Board, including reviewing or auditing the auditor’s own work, acting in a management or decision-making capacity for the Company, acting as advocate for the Company or jointly sharing economic risks and rewards.
ROUNDING
The Company is of a kind referred to in Class Order 98/100, issued by the Australian Securities and Investments Commission, relating to the ‘rounding off’ of amounts in the Directors’ Report. Amounts in the Directors’ Report have been rounded off in accordance with that Class Order to the nearest thousand dollars, or in certain cases, to the nearest dollar.
REMUNERATION REPORT
The Remuneration Report accompanies on page 33 and forms part of this Directors’ Report.
Signed in accordance with a resolution of the Directors:
Robert Mactier Michael Connaghan Chairman Chief Executive Officer
Sydney, 19 February 2016
DIRECTORS’ REPORT (CONTINUED)
26

FINANCIAL OVERVIEW
Net revenue (total revenue including share of net profits from joint ventures and associates excluding interest income less cost of goods sold expense) for the year ended 31 December 2015 is $415.0 million, down 2% on the prior period (2014: $425.3 million).
The net loss attributable to members of STW for the year ended 31 December 2015 is $52.6 million compared to a profit in 2014 of $44.6 million. The 2015 results were delivered in the context of the Company undertaking and implementing a strategic and structural review of the business, resulting in a number of one-off costs and leading to the reported loss for the year.
After adjusting for non-recurring significant items, the underlying profit for the year ended 31 December 2015 is $39.6 million, down 13% on the prior period (2014: $45.6 million).
2015 was a challenging year for the Company with a decline in net revenue and underlying earnings. The Company made tough decisions during the course of 2015 to restructure the business and has implemented a number of initiatives designed to drive deeper engagement between each of our businesses, coupled with stronger management oversight and financial discipline. The changes enable STW to deliver efficiencies, take advantage of its scale, and leverage the incredible resources and talent the Group has at its disposal. The Company enters 2016 with a clear strategy and path to return to sustainable growth.
A summary of the Company’s results for the year ended 31 December 2015 are below:
2015$million
2014$million
Total revenue (including share of net profits from joint ventures and associates excluding interest income) 492.5 471.2
Cost of goods sold (77.5) (45.9)
Net revenue 415.0 425.3
Operating expenses (428.4) (331.6)
EBITDA (13.4) 93.7
Depreciation and amortisation (10.9) (10.0)
EBIT (24.3) 83.7
Net finance costs (13.2) (13.5)
(Loss)/profit before tax (37.5) 70.2
Income tax expense (6.8) (12.8)
(Loss)/profit after tax (44.3) 57.4
Non-controlling interests (8.3) (12.8)
Net (loss)/profit attributable to members of STW (52.6) 44.6
A reconciliation of the Group's statutory and underlying profit and an analysis of the significant items (after tax and non-controlling interests) impacting the Group's results are set out below:
2015$million
2014$million
Net (loss)/profit attributable to members of STW (52.6) 44.6
Significant items, net of tax
1. Impairment of non-current assets and other non-cash items 81.8 0.4
2. Strategic review and restructure costs 4.5 —
3. Business close down and other one-off costs 5.9 0.6
Total significant items, net of tax 92.2 1.0
Underlying profit attributable to members of STW 39.6 45.6
Cents Cents
EPS – underlying profit 9.5 11.3
SIGNIFICANT ITEMS
The Company incurred a number of one-off costs in 2015 relating to the impairment of non-current assets and other non-cash items of $81.8 million; strategic review costs of $4.5 million; and business closure and other one-off costs of $5.9 million.
1. Impairment of non-current assets and other non-cash items – relates to impairment charges recognised in the 2015 year impacting the carrying amount of non-current assets, investments accounted for using the equity method and plant and equipment. The impairment charges arose primarily as a result of weaker than forecast trading performance of entities within the mass communications, brand development, and management and specialist communications cash generating units.
2. Strategic review costs – relates to redundancy and staff salary costs incurred in achieving operational restructure and efficiency initiatives within corporate head office and operating businesses. Included within this category is $3.7 million of salary costs relating to exited employees during the year from within business units impacted by the strategic and structural review.
3. Business close down and other one-off costs – relates to costs associated with closing down and merging selected business units.
Further details relating to significant items is included in Note 5. Expenses.
OPERATING AND FINANCIAL REVIEW
27
STRATEGIC REVIEW
During 2015, the Company undertook a strategic and structural review of the business. A number of initiatives were designed to position the Company to meet the challenges faced in the current trading environment and deliver future growth. An overview of the initiatives is set out below:
— Closer, oversight and deeper engagement of companies – the Company established the Executive Council ("EXCO") comprising senior executives from across the Group to provide managerial support and enhance financial discipline;
— Fewer, bigger, better businesses – the Company reviewed its portfolio of companies and took steps to close, merge and divest business units to create scale and strengthen their competitive position. During the year, the Company:
• closed six business units;
• merged the operations of Ikon and Shift to create a full service agency;
• created a global design and creative business with Designworks taking control of the operations of Moon Design;
• restructured its investments in South East Asia with Aleph taking over the management of Edge Group;
• enlisted Ogilvy group to manage the Brisbane-based Junior Advertising, creating a business of scale and giving Ogilvy a platform for growth in a new and growing market; and
• disposed of non-core investments in Jamshop and TCO. The Company will continue to review its portfolio of companies.
— Appointment of STW Chief Talent Officer – the Company appointed a Chief Talent Officer to manage STW's most valuable resources - our people. The role has three key objectives in: talent retention, acquisition and development; development of a platform to drive cost efficiencies in recruitment; and rebooting internal training to create the STW Business School;
— Revenue growth focus – the Company must win new business to sustain and deliver growth in earnings. The corporate head office function has been restructured to focus on driving organic revenue growth through the appointment of a Group Business Director to compliment the role of Chief Strategy Officer; and
— Cost focus – the Company implemented a cost-out program to reshape the cost base for the reality of current market conditions. The program identified $7 million of pre-tax cost savings, focusing on cost reductions in the corporate head office and selected business units, consolidation of the property footprint and co-location of business units into campuses, and consolidation of back office administrative functions.
A summary of the progress to date in relation to the strategic review initiatives are below.
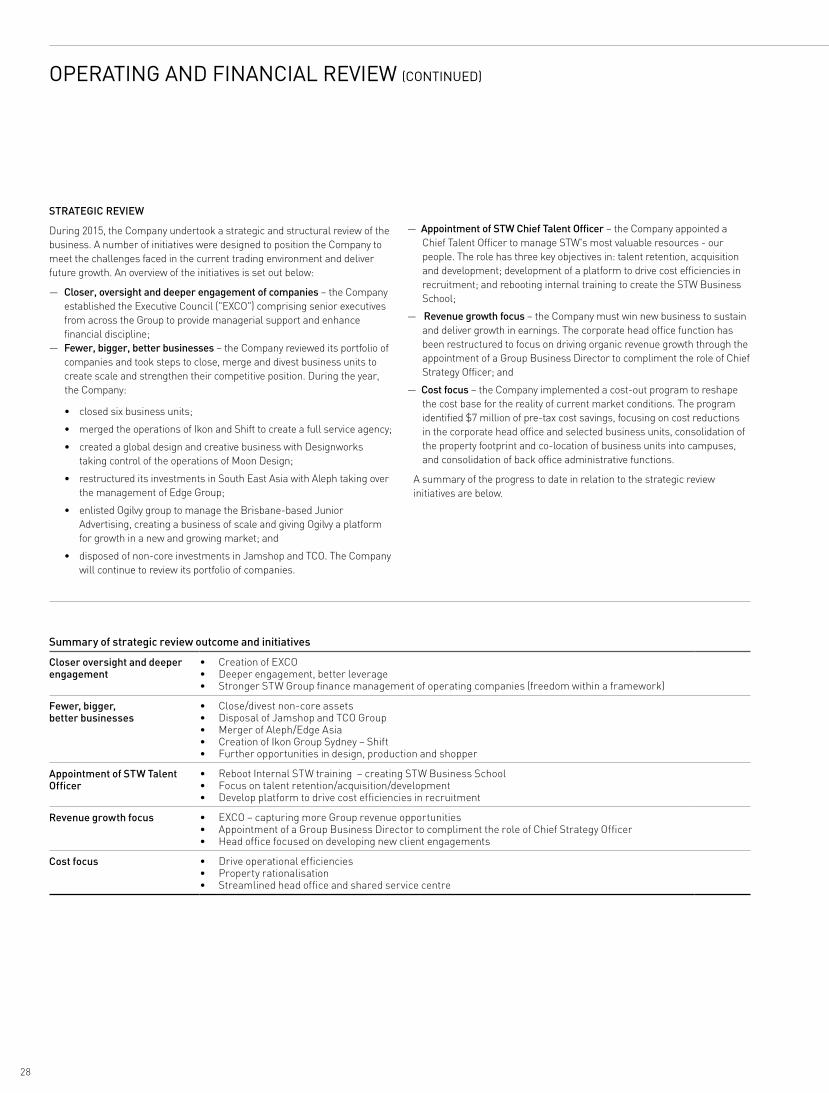
Summary of strategic review outcome and initiatives
Closer oversight and deeper engagement
• CreationofEXCO• Deeperengagement,betterleverage• StrongerSTWGroupfinancemanagementofoperatingcompanies(freedomwithinaframework)
Fewer, bigger, better businesses
• Close/divestnon-coreassets• DisposalofJamshopandTCOGroup• MergerofAleph/EdgeAsia• CreationofIkonGroupSydney–Shift• Furtheropportunitiesindesign,productionandshopper
Appointment of STW Talent Officer
• RebootInternalSTWtraining–creatingSTWBusinessSchool• Focusontalentretention/acquisition/development• Developplatformtodrivecostefficienciesinrecruitment
Revenue growth focus • EXCO–capturingmoreGrouprevenueopportunities• AppointmentofaGroupBusinessDirectortocomplimenttheroleofChiefStrategyOfficer• Headofficefocusedondevelopingnewclientengagements
Cost focus • Driveoperationalefficiencies• Propertyrationalisation• Streamlinedheadofficeandsharedservicecentre
28
OPERATING AND FINANCIAL REVIEW (CONTINUED)
NET INTEREST
CASH, GROSS DEBT, FACILITIES AND EARNOUTS
Cash and interest bearing liabilities
2015$million
2014$million
Cash 26.9 19.9
Bank debt (227.1) (207.1)
Finance lease (4.7) (5.6)
Total interest bearing liabilities (231.8) (212.7)
Net debt (204.9) (192.8)
As at 31 December 2015, the Company’s cash balance was $26.9 million (2014: $19.9 million). The Company’s gross debt and finance lease liabilities were $231.8 million (2014: $212.7 million).
The Company’s net debt position increased to $204.9 million at 31 December 2015 (2014: $192.8 million) driven primarily by the earnout payments for existing investments.
Finance lease
During the year ended 31 December 2014, the Company entered into a sale and leaseback arrangement of plant and equipment. The proceeds from sale were $6.0 million and will be repaid over a period of five years. The balance of the finance lease liability is $4.7 million at 31 December 2015 (2014: $5.6 million).
Australian core debt facilities
During the 2015 year, a number of changes were agreed with the Company’s banking partners in relation to the term of debt facilities and debt covenant calculations to better reflect current market practice.
The Company extended the term of $100 million of debt maturing in 2015 to January 2018. The original maturity dates of the $100 million of debt were January 2015 ($75 million) and July 2015 ($25 million).
As at 31 December 2015, the Company has access to Australian core banking debt facilities of $270 million, with a drawn component of $227 million. The facilities mature in August 2016 ($70 million), July 2017 ($35 million), January 2018 ($100 million), August 2018 ($40 million) and September 2018 ($25 million). The debt facilities weighted average maturity is 20 months.
Australia core debt facilities maturity $million
August 2016 70
July 2017 35
January 2018 100
August 2018 40
September 2018 25
Total Group Facilities 270
Total Group Facilities - Drawn 227
Total Group Facilities - Headroom 43
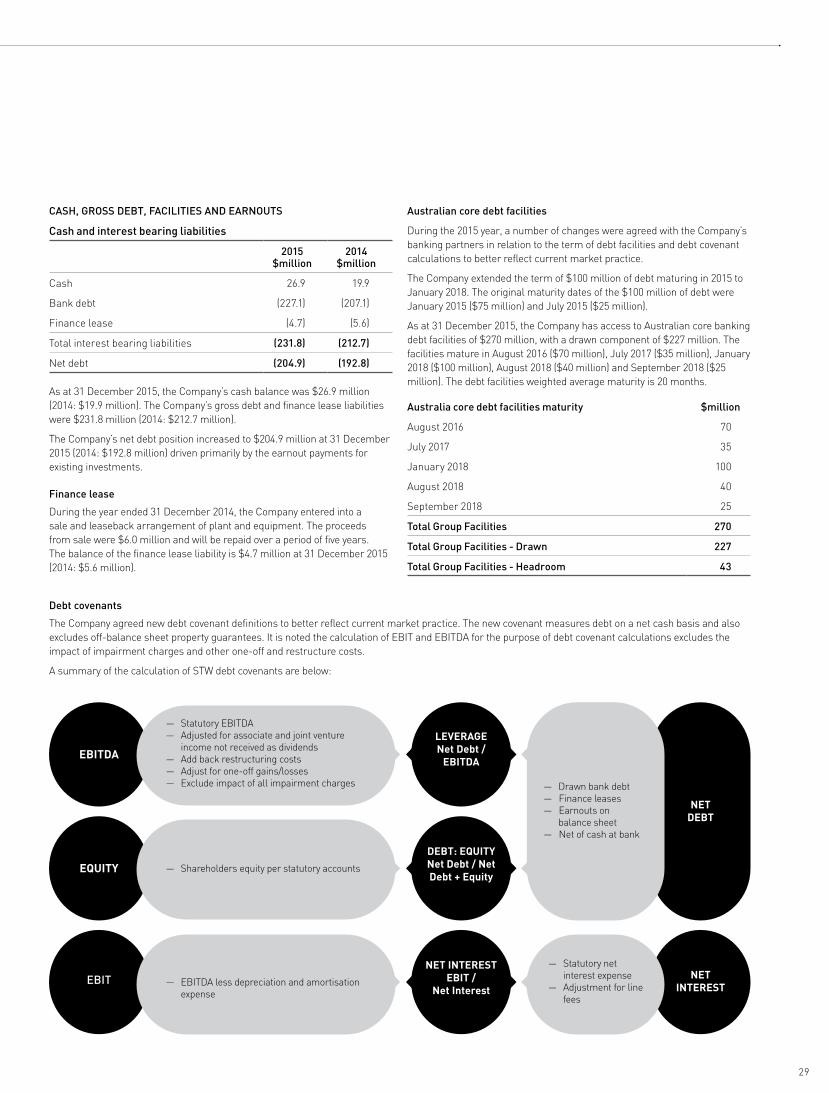
Debt covenants
The Company agreed new debt covenant definitions to better reflect current market practice. The new covenant measures debt on a net cash basis and also excludes off-balance sheet property guarantees. It is noted the calculation of EBIT and EBITDA for the purpose of debt covenant calculations excludes the impact of impairment charges and other one-off and restructure costs.
A summary of the calculation of STW debt covenants are below:
— Statutory EBITDA — Adjusted for associate and joint venture
income not received as dividends — Add back restructuring costs — Adjust for one-off gains/losses — Exclude impact of all impairment charges
EBITDA
EQUITY
EBIT
LEVERAGE Net Debt /
EBITDA
DEBT: EQUITY Net Debt / Net Debt + Equity
NET INTEREST EBIT /
Net Interest
— Drawn bank debt — Finance leases — Earnouts on
balance sheet — Net of cash at bank
— Statutory net interest expense
— Adjustment for line fees
NET DEBT
— Shareholders equity per statutory accounts
— EBITDA less depreciation and amortisation expense
29
Earnouts
The Company structures certain acquisitions by making an up-front payment to the vendor and agreeing to make future earnout payments based on the financial performance of the acquired company. The Company sees this as an effective way to structure acquisitions as it incentivises the vendors to drive the future performance of the acquired company. As at 31 December 2015, the Company’s estimated earnout liability is $15.1 million (2014: $31.7 million).
Earnout Liabilities
$million
31 December 2014 31.7
Payments made in 2015 (25.5)
New 2015 earnouts 0.6
Net revisions to earnout estimates 8.3
31 December 2015 15.1
The movement in earnout liabilities between 2014 and 2015 is driven by the payments to acquired companies. The only new earnout liability in 2015 relates to the acquisition of Union Digital, a New Zealand-based digital services company.
Expected Maturity Profile2015
$million
2016 7.8
2017 5.5
2018+ 1.8
Total 15.1
The peak earnout period for payment of earnout liabilities is 2016, with the estimated payments reducing in future years. This is a reflection of the Company making fewer acquisitions in the last two years and focusing on driving organic growth from existing businesses.
CASH FLOW
STW cash increased by $7.0 million to $26.9 million at 31 December 2015. A breakdown of the cash flows for the year ended 31 December 2015 is below:
2015$ million
2014$ million
Cash flow from operating activities 47.0 33.0
Cash flow from investing activities (33.3) (51.0)
Cash flow from financing activities (6.9) (5.8)
Net cash inflow/(outflow) 6.8 (23.8)
Opening cash 19.9 43.3
Effect of foreign exchange movements 0.2 0.4
Closing balance 26.9 19.9
Operating activities
Cash inflows for the 2015 year derived from operating activities were $47.0 million (2014: $33.0 million). The Company’s cash flows were positively impacted by the timing of media payments and no material change in working capital balances at 31 December 2015. This is a good performance, in line with operating cash flow targets and an improvement on the prior year result. For the 2015 year, 104% of statutory EBITDA, adjusted for the impact of significant non-cash items, was converted to operating cash flows (2014: 67%). The Company targets cash conversion of between 85% and 100% of EBITDA.
Investing activities
Cash outflows for the 2015 year derived from investing activities was $33.3 million, (2014: $51.0 million) reflecting a reduction in acquisitions activity during 2015 with the Company focusing on organic growth. Net cash outflows relating to investments was $25.2 million (2014: $38.3 million) and outflows relating to loans to joint ventures and associates was $2.6 million (2014: $3.5 million). Payment for fixed assets in 2015 was $5.5 million (2014: $9.1 million), in line with the Company’s objective of renewal of fixed assets at below 80% of the depreciation expense.
Financing activities
Cash outflows for the 2015 year derived from financing activities was $6.9 million (2014: $5.8 million). The Company received net proceeds from borrowings of $19.1 million (2014: $27.4 million). These cash inflows were offset by the payment of $14.4 million (2014: $5.5 million) in dividends to minority shareholders in STW Group companies. Net dividends of $11.6 million (2014: $27.7 million) were paid to STW shareholders with the reduction in cash dividend payments positively impacted by the operation of the dividend reinvestment plan for all dividends relating to the 2015 year.
DIVIDEND PAYMENTS
Dividends paid to members of the Company during the year were as follows:
Cents pershare
$million Franking
Final 2014 3.5 14.3 100%
Interim 2015 2.1 8.9 100%
Total 5.6 23.2
In addition to the above dividends, since the end of the financial year, the Directors have declared the payment of a fully franked ordinary dividend of 3.6 cents per fully paid ordinary share, with a record date of 24 March 2016 and payable on 26 April 2016 (2014 final dividend: 3.5 cents per share).
The total dividends relating to the 2015 year are 5.7 cents per share (2014: 6.8 cents per share). The total cash dividend payments relating to the 2015 year are $24.4 million (2014: $27.6 million). This represents a dividend payout ratio of 60% of underlying net profit after tax (2014: 60%), in line with the Company's target payout ratio of between 60% and 70% of underlying profit.
Dividend Reinvestment Plan
A dividend reinvestment plan ("DRP") will not operate in respect of the final 2015 dividend. The Company introduced a DRP in 2014, allowing eligible shareholders to reinvest their dividends in the Company's shares. The DRP applied to all dividends relating to the 2014 year and the interim 2015 dividend. The purpose of the DRP was to balance the cash returns to shareholders in the form of dividends with STW’s overall debt position.
OPERATING AND FINANCIAL REVIEW (CONTINUED)
30
2016 OUTLOOK
Proposed Merger with WPP's Australian and New Zealand businesses
On 14 December 2015, the Company announced that it had entered into an agreement, subject to certain conditions, to merge with substantially all of the Australian and New Zealand businesses of WPP.
The proposed merger accelerates the Company’s strategy of delivering 100% of its clients’ customer experience budgets and is expected to deliver substantial benefits for clients, employees and shareholders. Clients will benefit from a group that combines strong local market knowledge and access to international partners with iconic brands, tools, global reach and insights. Employees will benefit from broader opportunities to further develop their careers. Shareholders will benefit from material earnings per share accretion, with the realisation of merger synergies and a strengthened balance sheet with reduced leverage metrics.
The merger involves the Company acquiring the WPP businesses from WPP Group for an enterprise value of approximately $512 million in return for the issue of 422,961,825 STW shares to WPP, and STW assuming net debt of approximately $125 million.
Following the merger, WPP will become the majority shareholder of the Company, with a shareholding of 61.5% of the issued share capital (from its current shareholding of 23.55%). The Company’s existing shareholders will hold the remaining shares on issue in the combined group.
The Company also intends to change its name as part of the integration process to reflect the alignment of the parties' interests.
The merger is conditional on approval by the Company’s shareholders at an Extraordinary General Meeting to be held in March 2016. If all conditional precedents are satisfied, the merger is expected to be completed in early April 2016.
2016 trading outlook
The Company will not be providing specific 2016 full year guidance given the significant impact the proposed STW and WPP business merger will have on the 2016 result. As a stand-alone business, in 2016, the Company is expected to deliver mid-to-high single digit growth in underlying net profit after tax.
31
The Board of DirectorsSTW Communications Group LimitedOgilvy House72 Christie StreetST LEONARDS NSW 2065
19 February 2016
Dear Directors
Auditor's Independence Declaration to STW Communications Group Limited
In accordance with section 307C of the Corporations Act 2001, I am pleased to provide the following declaration of independence to the directors of STW Communications Group Limited.
As lead audit partner for the audit of the financial statements of STW Communications Group Limited for the financial year ended 31 December 2015, I declare that to the best of my knowledge and belief, there have been no contraventions of:
(i) the auditor independence requirements of the Corporations Act 2001 in relation to the audit; and
(ii) any applicable code of professional conduct in relation to the audit.
Yours sincerely
DELOITTE TOUCHE TOHMATSU
S C GustafsonPartnerChartered AccountantsSydney, 19 February 2016
Liability limited by a scheme approved under Professional Standards Legislation.
Member of Deloitte Touche Tohmatsu Limited
Deloitte Touche Tohmatsu ABN 74 490 121 060
Grosvenor Place 225 George Street Sydney NSW 2000 PO Box N250 Grosvenor Place Sydney NSW 1220 Australia
Tel: +61 (0) 2 9322 7000 Fax: +61 (0) 2 9322 7001 www.deloitte.com.au
AUDITOR’S INDEPENDENCE DECLARATION
32
The Directors of STW Communications Group Limited present this Remuneration Report for the Consolidated Entity for the year ended 31 December 2015. The information provided in the Remuneration Report has been audited as required by section 308(3C) of the Corporations Act 2001 and forms part of the Directors’ Report.
This Remuneration Report outlines STW’s remuneration philosophy and practices together with details of specific remuneration arrangements that apply to key management personnel (“KMP”) in accordance with the requirements of the Corporations Act 2001.
KMP comprise the Directors of the Company and Senior Executives. The term “Senior Executives” refers to the Chief Executive Officer and those executives with authority and responsibility for planning, directing and controlling the activities of the Company and the Group, directly or indirectly.
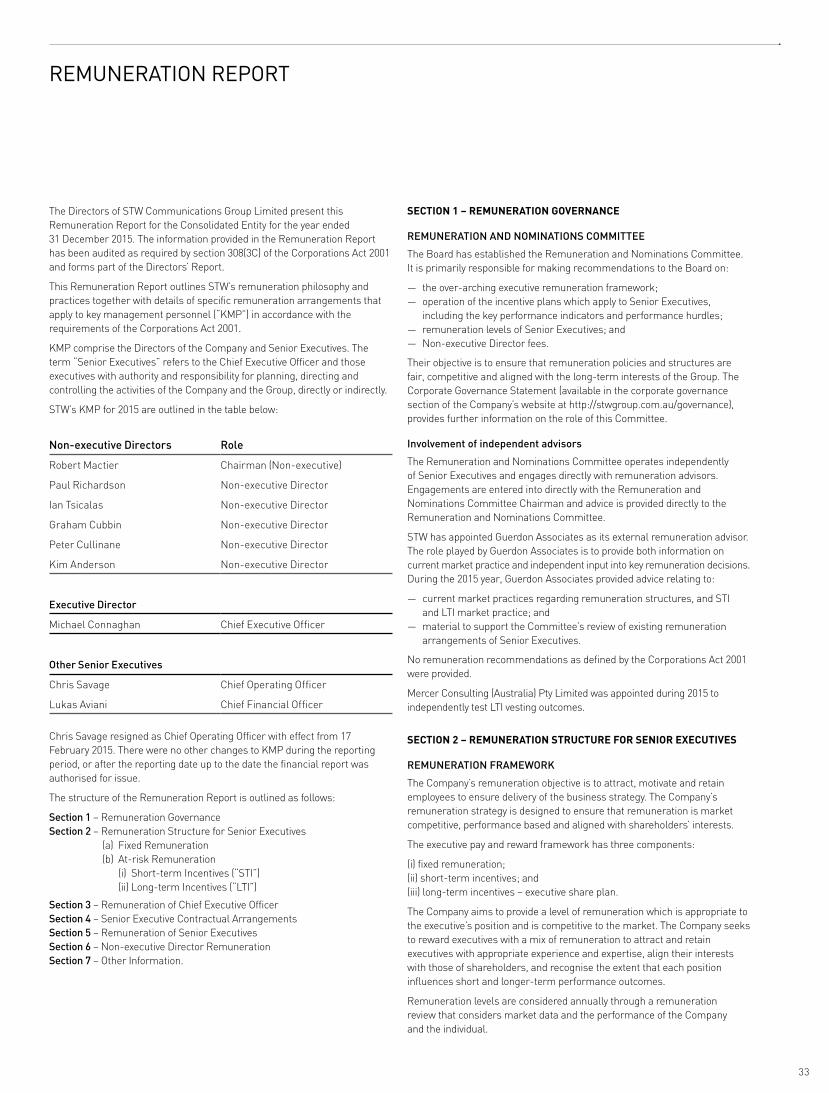
STW’s KMP for 2015 are outlined in the table below:
Non-executive Directors Role
Robert Mactier Chairman (Non-executive)
Paul Richardson Non-executive Director
Ian Tsicalas Non-executive Director
Graham Cubbin Non-executive Director
Peter Cullinane Non-executive Director
Kim Anderson Non-executive Director
Executive Director
Michael Connaghan Chief Executive Officer
Other Senior Executives
Chris Savage Chief Operating Officer
Lukas Aviani Chief Financial Officer
Chris Savage resigned as Chief Operating Officer with effect from 17 February 2015. There were no other changes to KMP during the reporting period, or after the reporting date up to the date the financial report was authorised for issue.
The structure of the Remuneration Report is outlined as follows:
Section 1 – Remuneration GovernanceSection 2 – Remuneration Structure for Senior Executives
(a) Fixed Remuneration (b) At-risk Remuneration (i) Short-term Incentives (“STI”) (ii) Long-term Incentives (“LTI”)
Section 3 – Remuneration of Chief Executive OfficerSection 4 – Senior Executive Contractual ArrangementsSection 5 – Remuneration of Senior Executives Section 6 – Non-executive Director Remuneration Section 7 – Other Information.
SECTION 1 – REMUNERATION GOVERNANCE
REMUNERATION AND NOMINATIONS COMMITTEE
The Board has established the Remuneration and Nominations Committee. It is primarily responsible for making recommendations to the Board on:
— the over-arching executive remuneration framework; — operation of the incentive plans which apply to Senior Executives,
including the key performance indicators and performance hurdles; — remuneration levels of Senior Executives; and — Non-executive Director fees.
Their objective is to ensure that remuneration policies and structures are fair, competitive and aligned with the long-term interests of the Group. The Corporate Governance Statement (available in the corporate governance section of the Company’s website at http://stwgroup.com.au/governance), provides further information on the role of this Committee.
Involvement of independent advisors
The Remuneration and Nominations Committee operates independently of Senior Executives and engages directly with remuneration advisors. Engagements are entered into directly with the Remuneration and Nominations Committee Chairman and advice is provided directly to the Remuneration and Nominations Committee.
STW has appointed Guerdon Associates as its external remuneration advisor. The role played by Guerdon Associates is to provide both information on current market practice and independent input into key remuneration decisions. During the 2015 year, Guerdon Associates provided advice relating to:
— current market practices regarding remuneration structures, and STI and LTI market practice; and
— material to support the Committee’s review of existing remuneration arrangements of Senior Executives.
No remuneration recommendations as defined by the Corporations Act 2001 were provided.
Mercer Consulting (Australia) Pty Limited was appointed during 2015 to independently test LTI vesting outcomes.
SECTION 2 – REMUNERATION STRUCTURE FOR SENIOR EXECUTIVES
REMUNERATION FRAMEWORK
The Company’s remuneration objective is to attract, motivate and retain employees to ensure delivery of the business strategy. The Company’s remuneration strategy is designed to ensure that remuneration is market competitive, performance based and aligned with shareholders’ interests.
The executive pay and reward framework has three components:
(i) fixed remuneration;(ii) short-term incentives; and(iii) long-term incentives – executive share plan.
The Company aims to provide a level of remuneration which is appropriate to the executive’s position and is competitive to the market. The Company seeks to reward executives with a mix of remuneration to attract and retain executives with appropriate experience and expertise, align their interests with those of shareholders, and recognise the extent that each position influences short and longer-term performance outcomes.
Remuneration levels are considered annually through a remuneration review that considers market data and the performance of the Company and the individual.
REMUNERATION REPORT
33

The diagram below shows the mix of fixed and at-risk components of remuneration, as a percentage of total annual remuneration, for the Chief Executive Officer (“CEO”) and other Senior Executives. Remuneration outlined in the diagram is based on the fixed remuneration at 1 January 2015 and the incentive payable if all performance conditions are satisfied and assumes full vesting of the STI plan and LTI plan.
The table below provides a snapshot of STW’s remuneration framework and the way in which each element of remuneration has been structured to support STW’s business objectives and to align with the generation of shareholder wealth.
Remuneration component Strategic purpose
Fixed remuneration Cash — Salary and other benefits (including statutory superannuation).
— Designed to attract and retain employees with required capabilities and experience.
At-risk remuneration Cash STI — STI payable based on Group achieving:
– net profit after tax (“NPAT”) target (75% weighting); and
– individual objectives (25% weighting).
— For Senior Executives, excluding the CEO, the STI outcome is paid in cash following the end of year assessment and approval by the Board.
— For the CEO, 50% of the STI outcome is paid in cash and the remaining 50% is deferred and paid in shares.
— Motivates and rewards performance within a year.
— Provides appropriate reward for superior individual and STW Group performance.
Deferred STI – CEO — For the CEO, 50% of the STI outcome is paid in shares and deferred over a period of two years, subject to ongoing employment conditions.
— Aligns the CEO’s reward to shareholder interests.
— Aligns CEO’s remuneration with longer-term financial performance.
— Retains the CEO's services.
LTI — Two plans: – Base Plan; and – Overperformance Plan.
— Provided as a grant of performance rights.
— Performance measured over a three year performance period.
— Base Plan subject to performance hurdles of earnings per share (“EPS”) (weighting 75%) and total shareholder return (“TSR”) (weighting 25%) being achieved.
— Overperformance Plan subject to EPS performance hurdle being achieved.
— Aligns the interest of Senior Executives with those of shareholders.
— Aligns Senior Executive’s remuneration with longer-term financial performance.
— Assists in attracting and retaining required executive talent.
48%
62%
21%
17%
14%
14%
24%
CEO remuneration mix Other Senior Executives remuneration mix
■ Fixed■ STI■ STI – deferred in shares■ LTI
■ Fixed■ STI■ LTI
SECTION 2 – REMUNERATION STRUCTURE FOR SENIOR EXECUTIVES (CONTINUED)
REMUNERATION REPORT (CONTINUED)
34
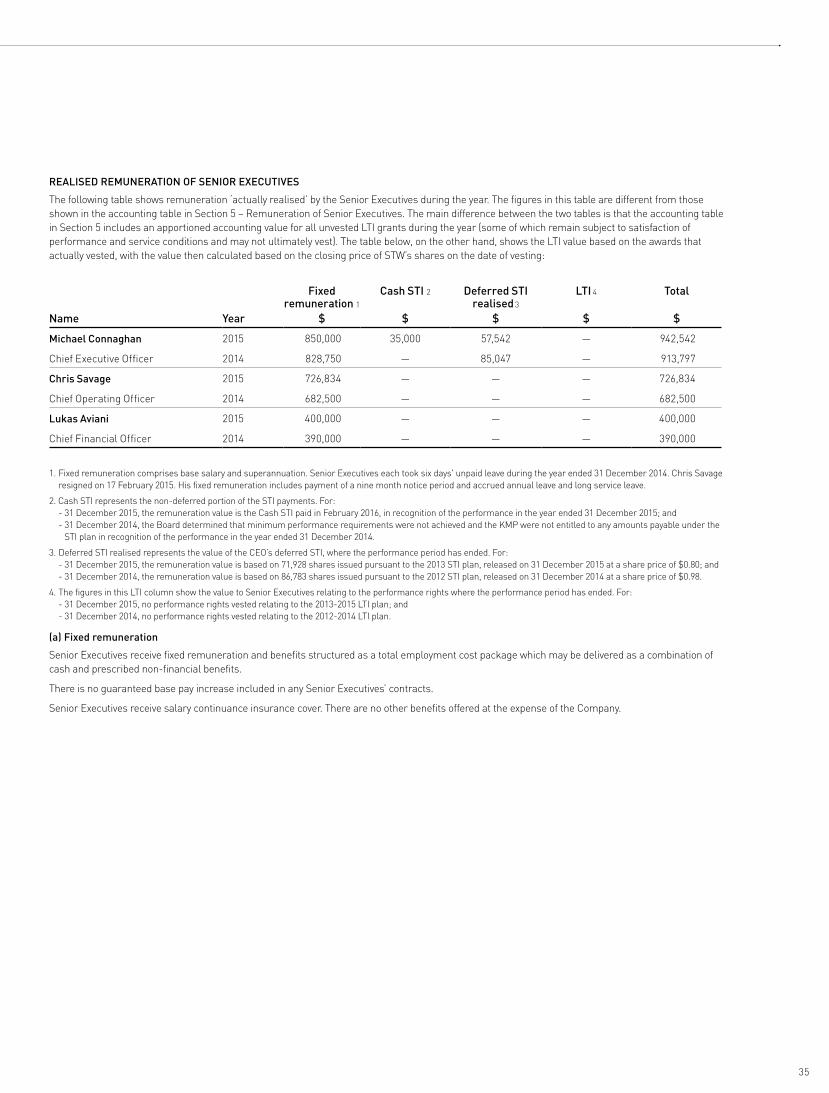
REALISED REMUNERATION OF SENIOR EXECUTIVES
The following table shows remuneration ‘actually realised’ by the Senior Executives during the year. The figures in this table are different from those shown in the accounting table in Section 5 – Remuneration of Senior Executives. The main difference between the two tables is that the accounting table in Section 5 includes an apportioned accounting value for all unvested LTI grants during the year (some of which remain subject to satisfaction of performance and service conditions and may not ultimately vest). The table below, on the other hand, shows the LTI value based on the awards that actually vested, with the value then calculated based on the closing price of STW’s shares on the date of vesting:
Fixed
remuneration 1Cash STI 2 Deferred STI
realised 3
LTI 4 Total
Name Year $ $ $ $ $
Michael Connaghan 2015 850,000 35,000 57,542 — 942,542
Chief Executive Officer 2014 828,750 — 85,047 — 913,797
Chris Savage 2015 726,834 — — — 726,834
Chief Operating Officer 2014 682,500 — — — 682,500
Lukas Aviani 2015 400,000 — — — 400,000
Chief Financial Officer 2014 390,000 — — — 390,000
1. Fixed remuneration comprises base salary and superannuation. Senior Executives each took six days' unpaid leave during the year ended 31 December 2014. Chris Savage resigned on 17 February 2015. His fixed remuneration includes payment of a nine month notice period and accrued annual leave and long service leave.
2. Cash STI represents the non-deferred portion of the STI payments. For: - 31 December 2015, the remuneration value is the Cash STI paid in February 2016, in recognition of the performance in the year ended 31 December 2015; and - 31 December 2014, the Board determined that minimum performance requirements were not achieved and the KMP were not entitled to any amounts payable under the
STI plan in recognition of the performance in the year ended 31 December 2014.
3. Deferred STI realised represents the value of the CEO’s deferred STI, where the performance period has ended. For: - 31 December 2015, the remuneration value is based on 71,928 shares issued pursuant to the 2013 STI plan, released on 31 December 2015 at a share price of $0.80; and - 31 December 2014, the remuneration value is based on 86,783 shares issued pursuant to the 2012 STI plan, released on 31 December 2014 at a share price of $0.98.
4. The figures in this LTI column show the value to Senior Executives relating to the performance rights where the performance period has ended. For: - 31 December 2015, no performance rights vested relating to the 2013-2015 LTI plan; and - 31 December 2014, no performance rights vested relating to the 2012-2014 LTI plan.
(a) Fixed remuneration
Senior Executives receive fixed remuneration and benefits structured as a total employment cost package which may be delivered as a combination of cash and prescribed non-financial benefits.
There is no guaranteed base pay increase included in any Senior Executives’ contracts.
Senior Executives receive salary continuance insurance cover. There are no other benefits offered at the expense of the Company.
35
SECTION 2 – REMUNERATION STRUCTURE FOR SENIOR EXECUTIVES (CONTINUED)
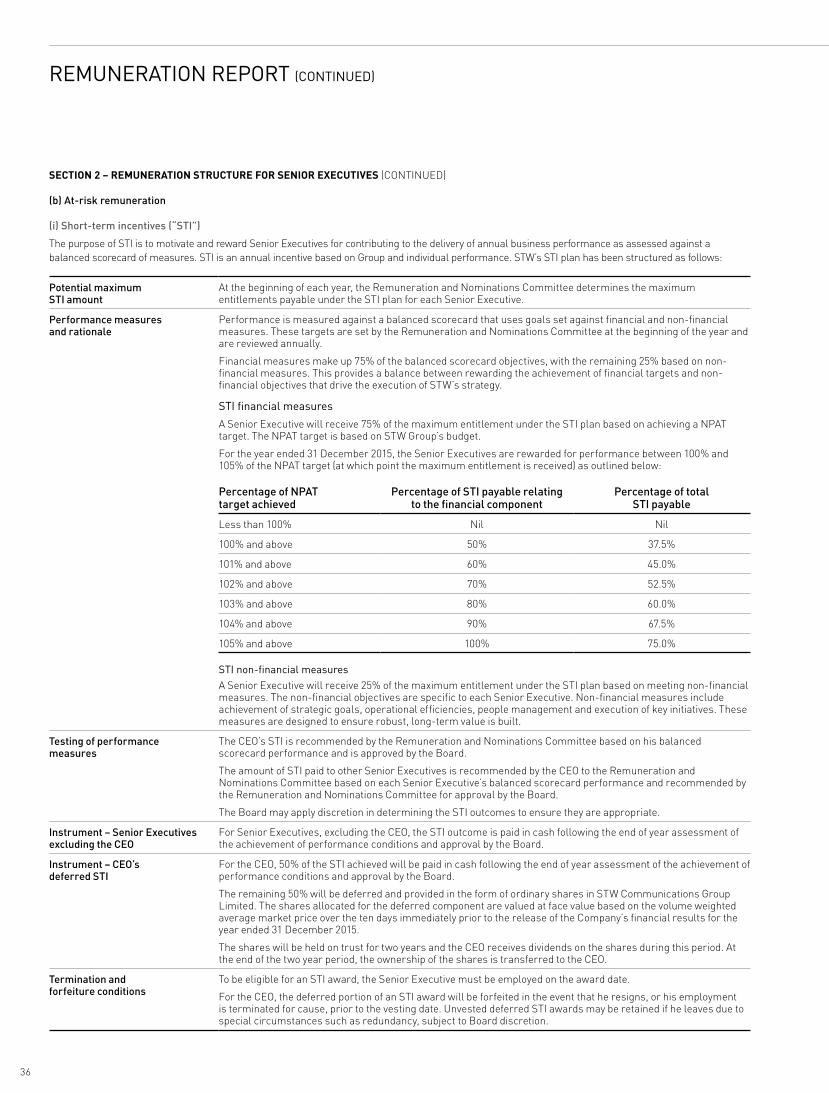
(b) At-risk remuneration
(i) Short-term incentives (“STI”)
The purpose of STI is to motivate and reward Senior Executives for contributing to the delivery of annual business performance as assessed against a balanced scorecard of measures. STI is an annual incentive based on Group and individual performance. STW’s STI plan has been structured as follows:
Potential maximum STI amount
At the beginning of each year, the Remuneration and Nominations Committee determines the maximum entitlements payable under the STI plan for each Senior Executive.
Performance measures and rationale
Performance is measured against a balanced scorecard that uses goals set against financial and non-financial measures. These targets are set by the Remuneration and Nominations Committee at the beginning of the year and are reviewed annually.
Financial measures make up 75% of the balanced scorecard objectives, with the remaining 25% based on non-financial measures. This provides a balance between rewarding the achievement of financial targets and non-financial objectives that drive the execution of STW’s strategy.
STI financial measures
A Senior Executive will receive 75% of the maximum entitlement under the STI plan based on achieving a NPAT target. The NPAT target is based on STW Group’s budget.
For the year ended 31 December 2015, the Senior Executives are rewarded for performance between 100% and 105% of the NPAT target (at which point the maximum entitlement is received) as outlined below:
Percentage of NPAT target achieved
Percentage of STI payable relating to the financial component
Percentage of total STI payable
Less than 100% Nil Nil
100% and above 50% 37.5%
101% and above 60% 45.0%
102% and above 70% 52.5%
103% and above 80% 60.0%
104% and above 90% 67.5%
105% and above 100% 75.0%
STI non-financial measuresA Senior Executive will receive 25% of the maximum entitlement under the STI plan based on meeting non-financial measures. The non-financial objectives are specific to each Senior Executive. Non-financial measures include achievement of strategic goals, operational efficiencies, people management and execution of key initiatives. These measures are designed to ensure robust, long-term value is built.
Testing of performance measures
The CEO’s STI is recommended by the Remuneration and Nominations Committee based on his balanced scorecard performance and is approved by the Board.
The amount of STI paid to other Senior Executives is recommended by the CEO to the Remuneration and Nominations Committee based on each Senior Executive’s balanced scorecard performance and recommended by the Remuneration and Nominations Committee for approval by the Board.
The Board may apply discretion in determining the STI outcomes to ensure they are appropriate.
Instrument – Senior Executives excluding the CEO
For Senior Executives, excluding the CEO, the STI outcome is paid in cash following the end of year assessment of the achievement of performance conditions and approval by the Board.
Instrument – CEO’s deferred STI
For the CEO, 50% of the STI achieved will be paid in cash following the end of year assessment of the achievement of performance conditions and approval by the Board.
The remaining 50% will be deferred and provided in the form of ordinary shares in STW Communications Group Limited. The shares allocated for the deferred component are valued at face value based on the volume weighted average market price over the ten days immediately prior to the release of the Company’s financial results for the year ended 31 December 2015.
The shares will be held on trust for two years and the CEO receives dividends on the shares during this period. At the end of the two year period, the ownership of the shares is transferred to the CEO.
Termination and forfeiture conditions
To be eligible for an STI award, the Senior Executive must be employed on the award date.
For the CEO, the deferred portion of an STI award will be forfeited in the event that he resigns, or his employment is terminated for cause, prior to the vesting date. Unvested deferred STI awards may be retained if he leaves due to special circumstances such as redundancy, subject to Board discretion.
REMUNERATION REPORT (CONTINUED)
36
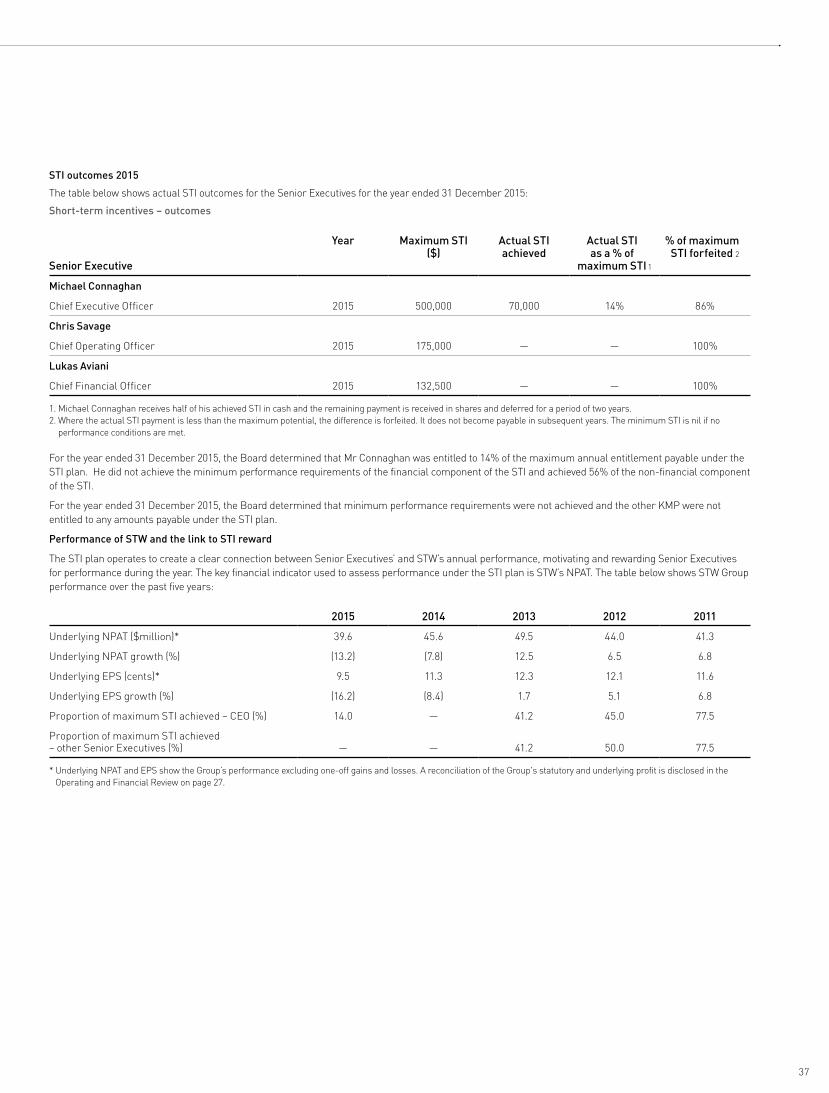
STI outcomes 2015
The table below shows actual STI outcomes for the Senior Executives for the year ended 31 December 2015:
Short-term incentives – outcomes
Senior Executive
Year Maximum STI ($)
Actual STI achieved
Actual STI 1 as a % of 1
maximum STI 1
% of maximum 2 STI forfeited 2
Michael Connaghan
Chief Executive Officer 2015 500,000 70,000 14% 86%
Chris Savage
Chief Operating Officer 2015 175,000 — — 100%
Lukas Aviani
Chief Financial Officer 2015 132,500 — — 100%
1. Michael Connaghan receives half of his achieved STI in cash and the remaining payment is received in shares and deferred for a period of two years.2. Where the actual STI payment is less than the maximum potential, the difference is forfeited. It does not become payable in subsequent years. The minimum STI is nil if no
performance conditions are met.
For the year ended 31 December 2015, the Board determined that Mr Connaghan was entitled to 14% of the maximum annual entitlement payable under the STI plan. He did not achieve the minimum performance requirements of the financial component of the STI and achieved 56% of the non-financial component of the STI.
For the year ended 31 December 2015, the Board determined that minimum performance requirements were not achieved and the other KMP were not entitled to any amounts payable under the STI plan.
Performance of STW and the link to STI reward
The STI plan operates to create a clear connection between Senior Executives’ and STW’s annual performance, motivating and rewarding Senior Executives for performance during the year. The key financial indicator used to assess performance under the STI plan is STW’s NPAT. The table below shows STW Group performance over the past five years:
2015 2014 2013 2012 2011
Underlying NPAT ($million)* 39.6 45.6 49.5 44.0 41.3
Underlying NPAT growth (%) (13.2) (7.8) 12.5 6.5 6.8
Underlying EPS (cents)* 9.5 11.3 12.3 12.1 11.6
Underlying EPS growth (%) (16.2) (8.4) 1.7 5.1 6.8
Proportion of maximum STI achieved – CEO (%) 14.0 — 41.2 45.0 77.5
Proportion of maximum STI achieved – other Senior Executives (%) — — 41.2 50.0 77.5
* Underlying NPAT and EPS show the Group’s performance excluding one-off gains and losses. A reconciliation of the Group's statutory and underlying profit is disclosed in the Operating and Financial Review on page 27.
37

SECTION 2 – REMUNERATION STRUCTURE FOR SENIOR EXECUTIVES (CONTINUED)
(ii) Long-term incentives (“LTI”) – executive share plan
The LTI plan is an at-risk component of Senior Executive remuneration under which an equity reward may be provided to participants based on achievement of specific performance measures over a three year performance period. Key details of the LTI plan are shown below:
Description LTI plan grants are determined annually by the Board.
LTI plan awards are delivered in the form of performance rights.
No dividends or voting rights are attached to performance rights.
If the performance conditions are achieved at the end of the three year performance period, the relevant portion of performance rights automatically vests and Senior Executives receive a share for each vested performance right.
No amount is payable on the vesting of the performance rights or on their conversion into shares.
Eligibility Offers were made to executives nominated by the CEO and approved by the Board.
Performance period The performance period for the LTI plan is three years. The 2015 plan operates from 1 January 2015 to 31 December 2017.
The Board considers that three years is an appropriate performance period as it is sufficiently long term to influence the desired performance outcomes, provides a foreseeable and genuine incentive to participants, and validly reflects the long-term planning and investment horizon of the business.
Performance plans The performance rights under the Base Plan will vest and be transferred to the Senior Executives subject to meeting the performance hurdles, as determined by the Remuneration and Nominations Committee.
Base Plan – performance hurdles
Base PlanThe Base Plan has two performance hurdles that are measured over the performance period:
— 75% of the awards are subject to the achievement of EPS targets; and — 25% of the awards are subject to a relative TSR measure.
(i) Earnings per share performance conditionEPS is calculated by dividing the underlying net result after tax attributable to members of STW for the relevant reporting period (net result after tax adjusted for the after-tax effect of any significant items) by the weighted average number of ordinary shares of the Company.Significant items are revenues and expenses associated with specific events considered appropriate by the Directors to be excluded in order to arrive at underlying earnings including impairment of assets, profits or losses on sale of investments, write-offs, amortisation of unidentifiable and identifiable intangible assets and other non-recurring items. For the Base Plan, EPS performance is measured as the actual cumulative EPS achieved over the three year measurement period.With respect to the 2015 Plan (operating between 1 January 2015 and 31 December 2017), the actual proportion of EPS award vesting is determined by comparing the actual cumulative EPS achieved over the three year measurement period against the thresholds outlined in the table below. The cumulative growth for the 2015 Plan is measured using a base EPS of 11.3 cents per share (the Group's 2014 calendar year underlying EPS).
STW’s cumulative growth from base yearCumulative EPS (cents per share) over
the three year measurement periodProportion of EPS
award vesting
Less than 3% per annum Less than 36.0 Nil
3% per annum or above 36.0 or above 20%
4% per annum or above 36.7 or above 40%
5% per annum or above 37.4 or above 60%
6% per annum or above 38.1 or above 80%
7% per annum or above 38.9 or above 90%
At or above 8% per annum 39.6 or above 100%
The same cumulative EPS performance measure has been used for the 2013 Plan (operating between 1 January 2013 and 31 December 2015) and 2014 Plan (operating between 1 January 2014 and 31 December 2016). The base year EPS for each plan is the Group's EPS for the most recent calendar year prior to the granting of the award.
REMUNERATION REPORT (CONTINUED)
38
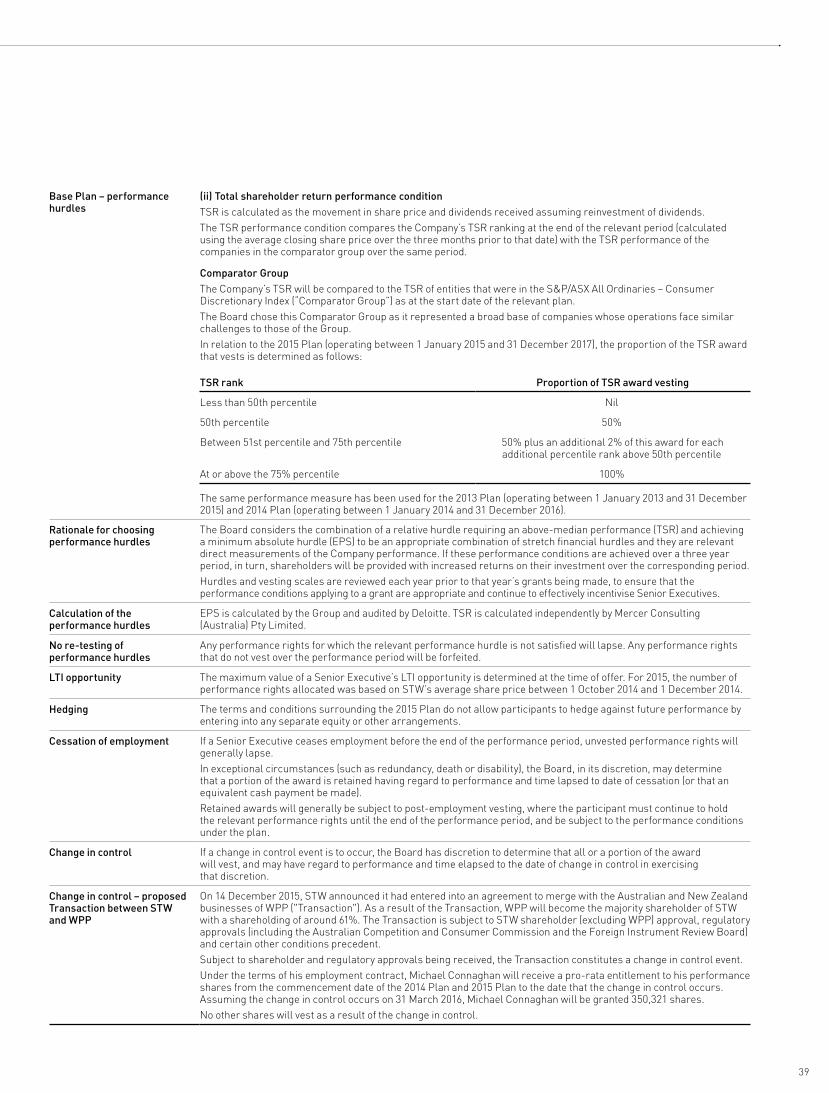
Base Plan – performance hurdles
(ii) Total shareholder return performance conditionTSR is calculated as the movement in share price and dividends received assuming reinvestment of dividends. The TSR performance condition compares the Company’s TSR ranking at the end of the relevant period (calculated using the average closing share price over the three months prior to that date) with the TSR performance of the companies in the comparator group over the same period.
Comparator GroupThe Company’s TSR will be compared to the TSR of entities that were in the S&P/ASX All Ordinaries – Consumer Discretionary Index (“Comparator Group”) as at the start date of the relevant plan.The Board chose this Comparator Group as it represented a broad base of companies whose operations face similar challenges to those of the Group.In relation to the 2015 Plan (operating between 1 January 2015 and 31 December 2017), the proportion of the TSR award that vests is determined as follows:
TSR rank Proportion of TSR award vesting
Less than 50th percentile Nil
50th percentile 50%
Between 51st percentile and 75th percentile 50% plus an additional 2% of this award for each additional percentile rank above 50th percentile
At or above the 75% percentile 100%
The same performance measure has been used for the 2013 Plan (operating between 1 January 2013 and 31 December 2015) and 2014 Plan (operating between 1 January 2014 and 31 December 2016).
Rationale for choosing performance hurdles
The Board considers the combination of a relative hurdle requiring an above-median performance (TSR) and achieving a minimum absolute hurdle (EPS) to be an appropriate combination of stretch financial hurdles and they are relevant direct measurements of the Company performance. If these performance conditions are achieved over a three year period, in turn, shareholders will be provided with increased returns on their investment over the corresponding period. Hurdles and vesting scales are reviewed each year prior to that year’s grants being made, to ensure that the performance conditions applying to a grant are appropriate and continue to effectively incentivise Senior Executives.
Calculation of the performance hurdles
EPS is calculated by the Group and audited by Deloitte. TSR is calculated independently by Mercer Consulting (Australia) Pty Limited.
No re-testing of performance hurdles
Any performance rights for which the relevant performance hurdle is not satisfied will lapse. Any performance rights that do not vest over the performance period will be forfeited.
LTI opportunity The maximum value of a Senior Executive’s LTI opportunity is determined at the time of offer. For 2015, the number of performance rights allocated was based on STW’s average share price between 1 October 2014 and 1 December 2014.
Hedging The terms and conditions surrounding the 2015 Plan do not allow participants to hedge against future performance by entering into any separate equity or other arrangements.
Cessation of employment If a Senior Executive ceases employment before the end of the performance period, unvested performance rights will generally lapse. In exceptional circumstances (such as redundancy, death or disability), the Board, in its discretion, may determine that a portion of the award is retained having regard to performance and time lapsed to date of cessation (or that an equivalent cash payment be made).Retained awards will generally be subject to post-employment vesting, where the participant must continue to hold the relevant performance rights until the end of the performance period, and be subject to the performance conditions under the plan.
Change in control If a change in control event is to occur, the Board has discretion to determine that all or a portion of the award will vest, and may have regard to performance and time elapsed to the date of change in control in exercising that discretion.
Change in control – proposed Transaction between STW and WPP
On 14 December 2015, STW announced it had entered into an agreement to merge with the Australian and New Zealand businesses of WPP ("Transaction"). As a result of the Transaction, WPP will become the majority shareholder of STW with a shareholding of around 61%. The Transaction is subject to STW shareholder (excluding WPP) approval, regulatory approvals (including the Australian Competition and Consumer Commission and the Foreign Instrument Review Board) and certain other conditions precedent.Subject to shareholder and regulatory approvals being received, the Transaction constitutes a change in control event. Under the terms of his employment contract, Michael Connaghan will receive a pro-rata entitlement to his performance shares from the commencement date of the 2014 Plan and 2015 Plan to the date that the change in control occurs. Assuming the change in control occurs on 31 March 2016, Michael Connaghan will be granted 350,321 shares. No other shares will vest as a result of the change in control.
39

LTIs granted – 2015
Details of the performance rights granted to KMP under the 2015 LTI Plan (operating between 1 January 2015 and 31 December 2017) are set out in the table below:
Plan
Performance measure
Number of performance
rights granted
Vesting date Fair value of 1 performance 1
rights 1
Minimum value of grant
$
Maximum value of grant
$
Michael Connaghan Base Plan EPS 270,641 Feb 18 $0.567 153,454
TSR 90,214 Feb 18 $0.149 13,442
Total 360,855 166,896
Lukas Aviani Base Plan EPS 72,259 Feb 18 $0.567 40,971
TSR 24,086 Feb 18 $0.149 3,589
Total 96,345 44,560
1. The maximum value of the grant has been estimated based on the fair value as calculated at the time of the grant. Further information on the calculation of fair value is outlined in Note 31. Share based payments.
LTIs vested – 2015
At 31 December 2015, the performance hurdles were tested for the 2013 Plan (operating between 1 January 2013 and 31 December 2015). STW did not achieve the minimum requirements required by the EPS and TSR performance hurdles. No performance rights vested and they were forfeited.
Granted in 2013 Vested in 2015 Forfeited in 2015
Number Value $
Number % of total grant
Value $
Number % of total grant
Value $
Michael Connaghan 412,000 329,166 — — — 412,000 100% 329,166
Chris Savage 235,000 187,753 — — — 235,000 100% 187,753
Lukas Aviani 110,000 87,884 — — — 110,000 100% 87,884
Performance of STW and the link to LTI reward
The following table details the link between STW’s performance and the rewards granted to Senior Executives under the LTI plan:
2015 2014 2013 2012 2011
Underlying NPAT ($million)* 39.6 45.6 49.5 44.0 41.3
Underlying EPS (cents)* 9.5 11.3 12.3 12.1 11.6
Underlying EPS growth (%) (16.2) (8.4) 1.7 5.1 6.8
Dividends per share (cents) 5.7 6.8 8.6 8.3 8.0
Share price (year end) $0.80 $0.98 $1.50 $1.11 $0.84
TSR (% per annum)** (12.6) (30.1) 42.9 42.0 (13.2)
* Underlying NPAT and underlying EPS show the Group’s performance excluding one-off gains and losses. A reconciliation of the Group's statutory and underlying profit is disclosed in the Operating and Financial Review on page 27.
** TSR is calculated as the movement in share price and dividends received assuming reinvestment of dividends.
SECTION 2 – REMUNERATION STRUCTURE FOR SENIOR EXECUTIVES (CONTINUED)
(ii) Long-term incentives (“LTI”) – executive share plan (continued)
REMUNERATION REPORT (CONTINUED)
40
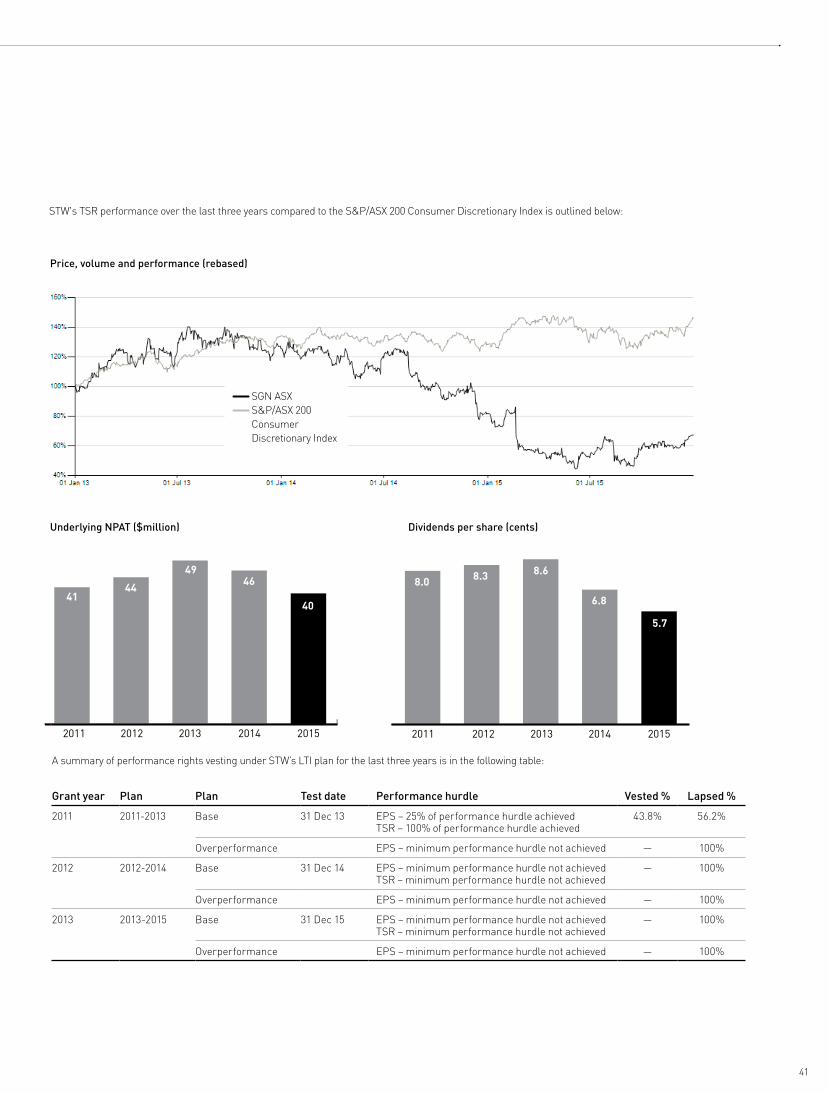
2011 2012 2014 2015
49
4441
39
2011 2012 2014 2015
2013
2013
8.6
46
8.3
6.8
8.0
40
5.7
2011 2012 2014 2015
49
4441
39
2011 2012 2014 2015
2013
2013
8.6
46
8.3
6.8
8.0
40
5.7
Underlying NPAT ($million) Dividends per share (cents)
Price, volume and performance (rebased)
SGN ASX S&P/ASX 200 Consumer Discretionary Index
A summary of performance rights vesting under STW’s LTI plan for the last three years is in the following table:
Grant year Plan Plan Test date Performance hurdle Vested % Lapsed %
2011 2011-2013 Base 31 Dec 13 EPS – 25% of performance hurdle achievedTSR – 100% of performance hurdle achieved
43.8% 56.2%
Overperformance EPS – minimum performance hurdle not achieved — 100%
2012 2012-2014 Base 31 Dec 14 EPS – minimum performance hurdle not achievedTSR – minimum performance hurdle not achieved
— 100%
Overperformance EPS – minimum performance hurdle not achieved — 100%
2013 2013-2015 Base 31 Dec 15 EPS – minimum performance hurdle not achievedTSR – minimum performance hurdle not achieved
— 100%
Overperformance EPS – minimum performance hurdle not achieved — 100%
STW's TSR performance over the last three years compared to the S&P/ASX 200 Consumer Discretionary Index is outlined below:
41
SECTION 3 – REMUNERATION OF CHIEF EXECUTIVE OFFICER
The Company’s CEO is Michael Connaghan.
The remuneration level and remuneration structure have been set by the Remuneration and Nominations Committee. In setting Mr Connaghan’s remuneration, the Committee receives independent advice benchmarking the CEO’s salary against that for companies of comparable market capitalisation, revenue size and industry. The final remuneration is determined by the Remuneration and Nominations Committee using the independent benchmarking data and taking into account the performance of the CEO.
Remuneration for the year ended 31 December 2015
Mr Connaghan’s remuneration structure for the year ended 31 December 2015 is outlined below. There were no changes to Mr Connaghan’s fixed remuneration and STI plan during the year.
(i) Fixed remuneration and benefits
Mr Connaghan’s fixed remuneration for the year ended 31 December 2015 was $850,000 per annum (2014: $850,000).
(ii) Short-term incentives
For the year ended 31 December 2015, Mr Connaghan had the opportunity to earn a maximum STI of $500,000 (2014: $500,000), subject to the achievement of performance targets.
Subject to the satisfaction of the performance conditions, 50% of the entitlement under the STI plan will be paid in cash after the release of the Group’s full year results and 50% will be deferred and paid in shares in STW Communications Group Limited. The shares will be held on trust for two years and Mr Connaghan receives dividends on the shares during this period. At the end of the two year period, the ownership of the shares is transferred to Mr Connaghan. If Mr Connaghan resigns or his employment is terminated for cause prior to the end of the two year period, he will forfeit the shares.
75% of the maximum annual entitlement payable under the STI plan is based on achieving a NPAT target. The remaining 25% of the maximum annual entitlement payable under the STI plan is based on meeting non-financial objectives. The non-financial measures include achievement of strategic goals, operational efficiencies, people management and execution of key initiatives.
For the year ended 31 December 2015, the Board determined that Mr Connaghan was entitled to 14% of the maximum annual entitlement payable under the STI plan. He did not achieve the minimum performance requirements of the financial component of the STI and achieved 56% of the non-financial component of the STI.
(iii) Long-term incentives – executive share plan
Shareholders approved the grant to Mr Connaghan of 360,855 performance rights in the Company’s executive share plan operating between 1 January 2015 and 31 December 2017, and these will vest subject to the achievement of performance conditions.
This grant was issued on the terms of the LTI plan outlined in Section 2(b)(ii) – Long-term incentives.
SECTION 4 – SENIOR EXECUTIVE CONTRACTUAL ARRANGEMENTS
The remuneration and other terms of employment for Senior Executives are set out in written agreements.
These service agreements are unlimited in term but may be terminated by written notice by either party or by the Company making payment in lieu of notice. They may also be terminated with cause, as set out below. Each agreement sets out the fixed remuneration and termination rights.
The Company may terminate the employment of the Senior Executive without notice and without payment in lieu of notice in some circumstances. Generally, this includes the event of any act which detrimentally affects the Company such as dishonesty, fraud or serious or wilful misconduct.
Termination of employment with notice and with payment in lieu of notice
The Company may terminate the employment of the Senior Executive at any time by giving them notice of termination or payment in lieu of such notice. The amount of notice required from the Company in these circumstances is set out in the table on page 43.
REMUNERATION REPORT (CONTINUED)
42

Summary of Senior Executive service agreements
Remuneration details are set out in Section 5 – Remuneration of Senior Executives.
Key provisions of the agreements relating to executive remuneration are set out below:
Name Michael Connaghan Lukas Aviani
Role Chief Executive Officer Chief Financial Officer
Contract expiry date Ongoing Ongoing
Base salary 2015 – $850,0002014 – $850,000
2015 – $400,0002014 – $400,000
Short-term incentive plan (maximum entitlement) 2015 – $500,0002014 – $500,000
2015 – $132,5002014 – $132,500
Termination benefit (Company initiated) 12 months’ notice 12 months’ notice
Termination benefit (employee initiated) 6 months’ notice 3 months’ notice
Non-solicitation of personnel and clients 12 months 12 months
Non-compete 12 months 12 months
SECTION 5 – REMUNERATION OF SENIOR EXECUTIVES
(i) Statutory remuneration of Senior Executives
The following table shows the total remuneration for Senior Executives for the year ended 31 December 2015, as well as comparative figures for the year ended 31 December 2014.
The information in the table below has been calculated in accordance with Accounting Standards and, accordingly, it differs from the information in the table in Section 2 – Realised remuneration of Senior Executives, where the LTI value is based on the awards that actually vested and delivered value to Senior Executives. In the table below, the LTI value is calculated in accordance with Accounting Standards and includes an amortised accounting value for all unvested LTI grants during the year (some of which remain subject to satisfaction of performance and service conditions and may not ultimately vest).
Short-term employee benefits
Post employment
Share based payments Other long-term benefits 3
Year
Base salary 1
STI 2 Super-annuation
contributions
Deferred STI
LTI Long service leave
Total remun-eration 4
Total at risk
Total in LTI
$ $ $ $ $ $ $ % %
Executive Director
Michael Connaghan 2015 830,954 35,000 19,046 35,000 30,377 46,840 997,217 10% 3%
2014 810,471 — 18,279 — 53,278 26,340 908,368 6% 6%
Other Senior Executives
Chris Savage 2015 601,241 5 — 21,375 — (29,010) 1,597 595,203 (5%) (5%)
2014 657,141 — 25,359 — 31,466 18,398 732,364 4% 4%
Lukas Aviani 2015 380,954 — 19,046 — 8,110 12,956 421,066 2% 2%
2014 371,253 — 18,747 — 15,360 18,781 424,141 4% 4%
Total 2015 1,813,149 35,000 59,467 35,000 9,477 61,393 2,013,486 4% 0.5%
2014 1,838,865 — 62,385 — 100,104 63,519 2,064,873 5% 5%
1. Base salary includes accrued annual leave paid out as part of salary and salary-sacrifice amounts where applicable. Senior Executives each took six days’ unpaid leave during the year ended 31 December 2014.
2. For the year ended 31 December 2015, this amount represents the STI performance award for 2015 which will be paid in February 2016. No STI was awarded relating to the 2014 year.3. Other long-term benefits represent the movement in the Senior Executive’s long service leave entitlements measured as the present value of the estimated future cash outflows
to be made in respect of the executive’s service between the respective reporting dates.4. Total remuneration does not include any amounts relating to termination benefits for the years ended 31 December 2015 and 31 December 2014.5. Chris Savage resigned on 17 February 2015. His fixed remuneration includes payment for a nine month notice period of $525,000.
43
SECTION 6 – NON-EXECUTIVE DIRECTOR REMUNERATION
Non-executive Directors receive fees to recognise their contribution to the work of the Board and the associated Committees that they serve. Non-executive Directors do not receive any performance-related remuneration.
Director fee framework
The Board periodically reviews the Directors' fee framework. Under the current fee framework, Non-executive Directors are remunerated by way of a base fee, with additional fees paid to the Chairmen and members of Committees.
The following table outlines the Non-executive Directors’ annual fees for the Board and Committees as at 31 December 2015. Fees are inclusive of superannuation contributions required by Superannuation Guarantee legislation.
Board/Committee Role Annual remuneration
Board Chairman $190,000
Member $90,000
Audit and Risk Committee Chairman $15,000
Member $5,000
Remuneration and Nominations Committee Chairman $15,000
Member $5,000
WPP aligned Director
It is noted that WPP aligned Director, Paul Richardson, is not remunerated as a Board member of the Company and does not receive any other financial or non-financial benefit as a member of the Company’s Board. The Board is pleased to have access to the specialist skills and knowledge of Mr Richardson.
It is the Board’s view that the non-payment to Mr Richardson does not detract or diminish from the discharging of his responsibilities and obligations to all the shareholders of the Company.
Directors' fee pool
The maximum annual aggregate remuneration of Non-executive Directors shall be determined from time to time by a general meeting. The latest determination was at the Annual General Meeting in May 2010 when shareholders approved aggregate remuneration of $750,000 per year.
Termination payments
No termination payments were made during the period. The Non-executive Directors did not receive retirement benefits or termination payments.
Equity-based remuneration
Non-executive Directors do not receive shares, options or share rights as part of their remuneration and do not participate in any equity-based incentive plans.
Total remuneration for Non-executive Directors Short-term employee benefits Post-employment
Base salary Superannuation contributions
Total
Year $ $ $
Non-executive Directors
Robert Mactier 2015 170,266 24,734 195,000
2014 169,595 25,405 195,000
Paul Richardson 2015 — — —
2014 — — —
Ian Tsicalas 2015 100,918 9,082 110,000
2014 100,584 9,416 110,000
Graham Cubbin 2015 100,918 9,082 110,000
2014 100,539 9,461 110,000
Peter Cullinane* 2015 82,569 7,431 90,000
2014 82,259 7,741 90,000
Kim Anderson 2015 87,156 7,844 95,000
2014 86,829 8,171 95,000
Total 2015 541,827 58,173 600,000
2014 539,806 60,194 600,000
* Peter Cullinane resigned as a Non-executive Chairman of Assignment Group New Zealand Limited, a 100% owned subsidiary of the Group on 30 June 2015. For the year ended 31 December 2015, he received a base salary of NZD175,000 per annum (2014: NZD350,000).
REMUNERATION REPORT (CONTINUED)
44
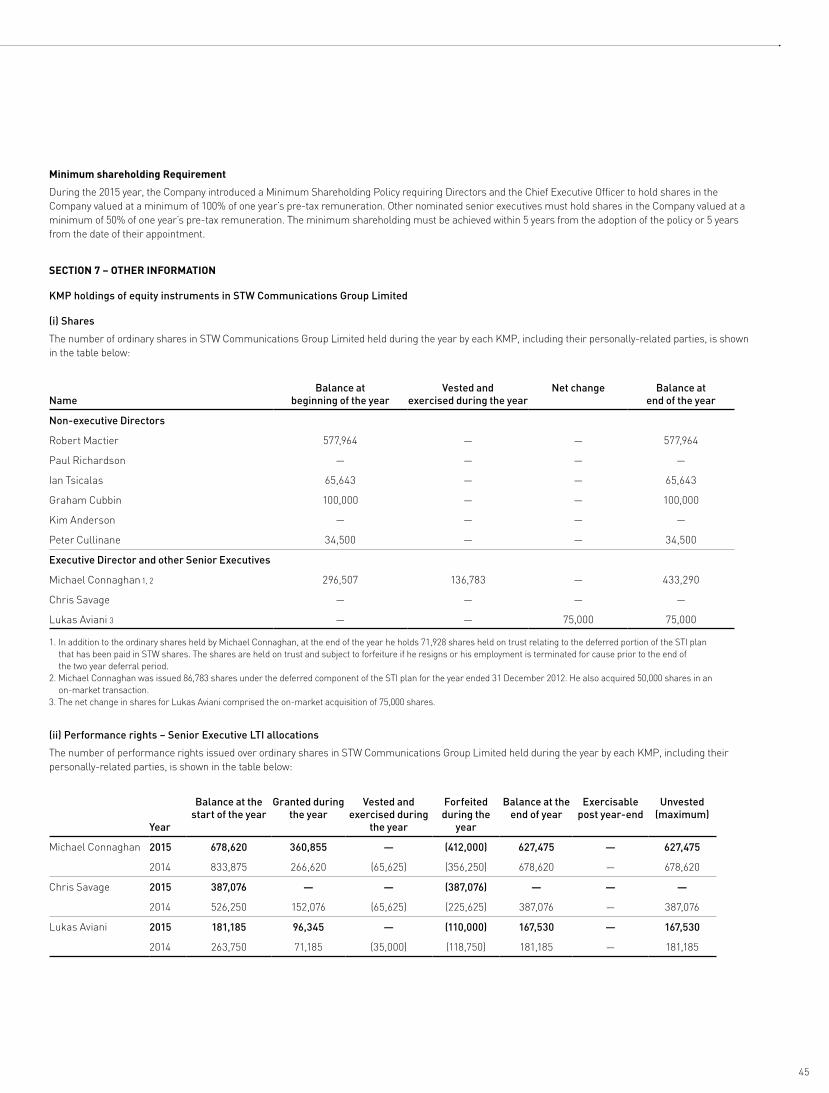
Minimum shareholding Requirement
During the 2015 year, the Company introduced a Minimum Shareholding Policy requiring Directors and the Chief Executive Officer to hold shares in the Company valued at a minimum of 100% of one year’s pre-tax remuneration. Other nominated senior executives must hold shares in the Company valued at a minimum of 50% of one year’s pre-tax remuneration. The minimum shareholding must be achieved within 5 years from the adoption of the policy or 5 years from the date of their appointment.
SECTION 7 – OTHER INFORMATION
KMP holdings of equity instruments in STW Communications Group Limited
(i) Shares
The number of ordinary shares in STW Communications Group Limited held during the year by each KMP, including their personally-related parties, is shown in the table below:
NameBalance at
beginning of the yearVested and
exercised during the year Net change Balance at
end of the year
Non-executive Directors
Robert Mactier 577,964 — — 577,964
Paul Richardson — — — —
Ian Tsicalas 65,643 — — 65,643
Graham Cubbin 100,000 — — 100,000
Kim Anderson — — — —
Peter Cullinane 34,500 — — 34,500
Executive Director and other Senior Executives
Michael Connaghan 1, 2 296,507 136,783 — 433,290
Chris Savage — — — —
Lukas Aviani 3 — — 75,000 75,000
1. In addition to the ordinary shares held by Michael Connaghan, at the end of the year he holds 71,928 shares held on trust relating to the deferred portion of the STI plan that has been paid in STW shares. The shares are held on trust and subject to forfeiture if he resigns or his employment is terminated for cause prior to the end of the two year deferral period.
2. Michael Connaghan was issued 86,783 shares under the deferred component of the STI plan for the year ended 31 December 2012. He also acquired 50,000 shares in an on-market transaction.3. The net change in shares for Lukas Aviani comprised the on-market acquisition of 75,000 shares.
(ii) Performance rights – Senior Executive LTI allocations
The number of performance rights issued over ordinary shares in STW Communications Group Limited held during the year by each KMP, including their personally-related parties, is shown in the table below:
Year
Balance at the start of the year
Granted during the year
Vested and exercised during
the year
Forfeited during the
year
Balance at the end of year
Exercisable post year-end
Unvested (maximum)
Michael Connaghan 2015 678,620 360,855 — (412,000) 627,475 — 627,475
2014 833,875 266,620 (65,625) (356,250) 678,620 — 678,620
Chris Savage 2015 387,076 — — (387,076) — — —
2014 526,250 152,076 (65,625) (225,625) 387,076 — 387,076
Lukas Aviani 2015 181,185 96,345 — (110,000) 167,530 — 167,530
2014 263,750 71,185 (35,000) (118,750) 181,185 — 181,185
45

(iii) Performance rights outstanding
The table below shows details of the number and value of performance rights granted, vested and lapsed for KMP under the LTI plan:
Vested Forfeited
Name
Plan Grant date Maximum number granted
Maximum
value at grant date $ 1
Vesting date
Number Value$
Number Value$
Unvested number
(maximum)
Michael Connaghan 2013-2015 May 13 412,000 329,166 Feb 16 — — 412,000 329,166 —
2014-2016 May 14 266,620 291,457 Feb 17 — — — — 266,620
2015-2017 May 15 360,855 166,895 Feb 18 — — — — 360,855
Total 1,039,475 787,518 — — 412,000 329,166 627,475
Chris Savage 2013-2015 May 13 235,000 187,753 Feb 16 — — 235,000 187,753 —
2014-2016 May 14 152,076 166,244 Feb 17 — — 152,076 166,244 —
Total 387,076 353,997 — — 387,076 353,997 —
Lukas Aviani 2013-2015 May 13 110,000 87,884 Feb 16 — — 110,000 87,884 —
2014-2016 May 14 71,185 77,816 Feb 17 — — — — 71,185
2015-2017 May 15 96,345 44,560 Feb 18 — — — — 96,345
Total 277,530 210,260 — — 110,000 87,884 167,530
1. Maximum value at grant date represents the fair value of the LTI grant determined in accordance with AASB 2 Share-based Payment. Details of the assumptions underlying the valuations are set out in Note 31 to the financial statements. The minimum total value of the grant, if the applicable vesting conditions are not met, is nil in all cases.
SECTION 7 – OTHER INFORMATION (CONTINUED)
REMUNERATION REPORT (CONTINUED)
46
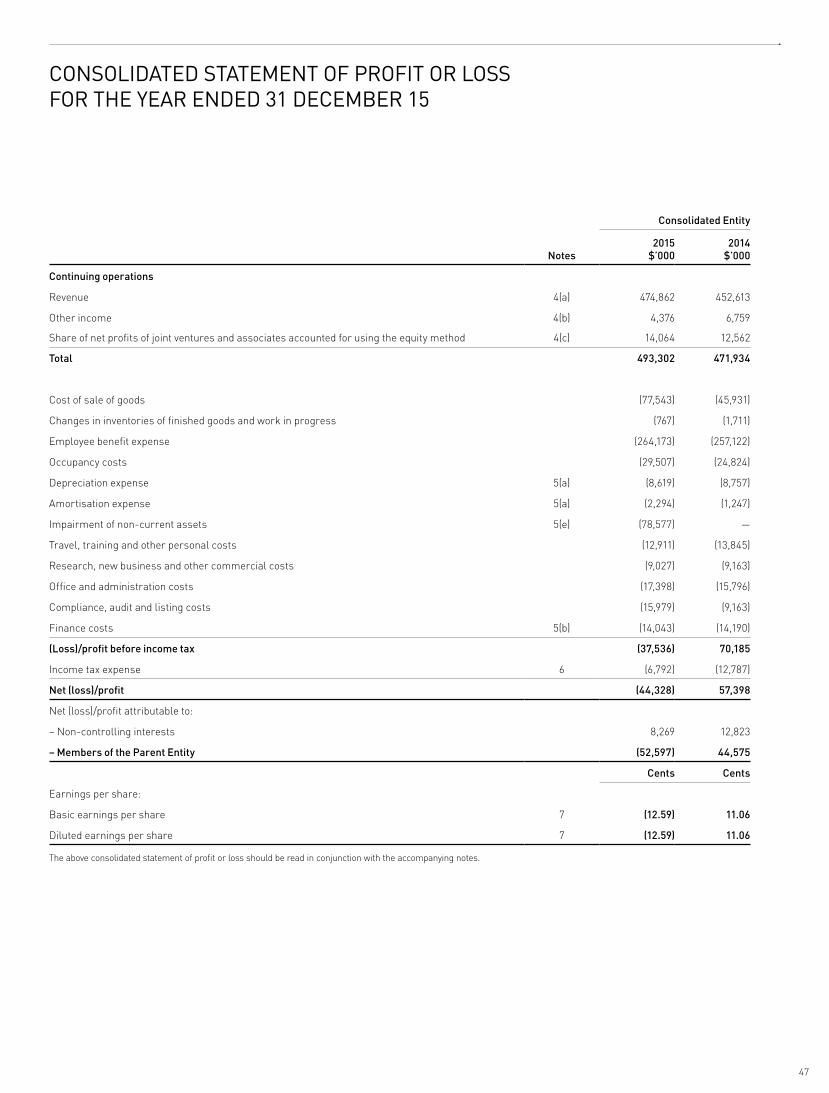
Consolidated Entity
Notes2015
$’0002014
$’000
Continuing operations
Revenue 4(a) 474,862 452,613
Other income 4(b) 4,376 6,759
Share of net profits of joint ventures and associates accounted for using the equity method 4(c) 14,064 12,562
Total 493,302 471,934
Cost of sale of goods (77,543) (45,931)
Changes in inventories of finished goods and work in progress (767) (1,711)
Employee benefit expense (264,173) (257,122)
Occupancy costs (29,507) (24,824)
Depreciation expense 5(a) (8,619) (8,757)
Amortisation expense 5(a) (2,294) (1,247)
Impairment of non-current assets 5(e) (78,577) —
Travel, training and other personal costs (12,911) (13,845)
Research, new business and other commercial costs (9,027) (9,163)
Office and administration costs (17,398) (15,796)
Compliance, audit and listing costs (15,979) (9,163)
Finance costs 5(b) (14,043) (14,190)
(Loss)/profit before income tax (37,536) 70,185
Income tax expense 6 (6,792) (12,787)
Net (loss)/profit (44,328) 57,398
Net (loss)/profit attributable to:
– Non-controlling interests 8,269 12,823
– Members of the Parent Entity (52,597) 44,575
Cents Cents
Earnings per share:
Basic earnings per share 7 (12.59) 11.06
Diluted earnings per share 7 (12.59) 11.06
The above consolidated statement of profit or loss should be read in conjunction with the accompanying notes.
CONSOLIDATED STATEMENT OF PROFIT OR LOSSFOR THE YEAR ENDED 31 DECEMBER 15
47
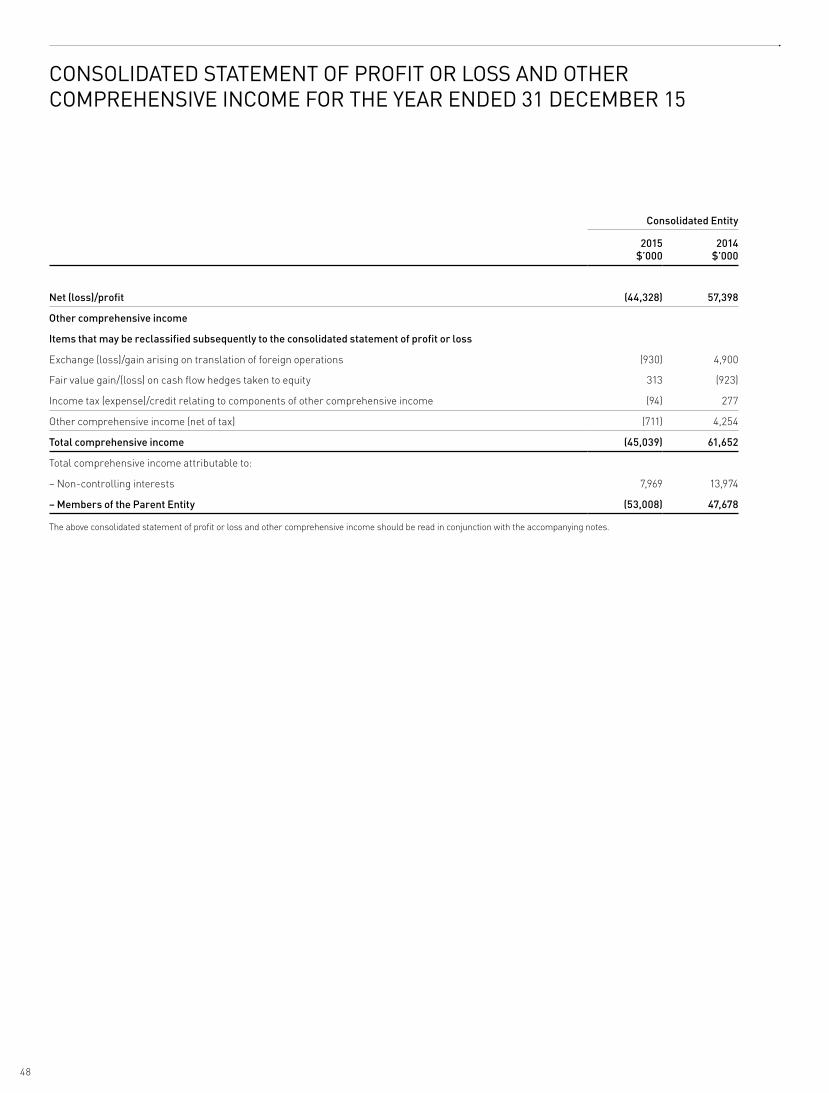
Consolidated Entity
2015 $’000
2014 $’000
Net (loss)/profit (44,328) 57,398
Other comprehensive income
Items that may be reclassified subsequently to the consolidated statement of profit or loss
Exchange (loss)/gain arising on translation of foreign operations (930) 4,900
Fair value gain/(loss) on cash flow hedges taken to equity 313 (923)
Income tax (expense)/credit relating to components of other comprehensive income (94) 277
Other comprehensive income (net of tax) (711) 4,254
Total comprehensive income (45,039) 61,652
Total comprehensive income attributable to:
– Non-controlling interests 7,969 13,974
– Members of the Parent Entity (53,008) 47,678
The above consolidated statement of profit or loss and other comprehensive income should be read in conjunction with the accompanying notes.
CONSOLIDATED STATEMENT OF PROFIT OR LOSS AND OTHERCOMPREHENSIVE INCOME FOR THE YEAR ENDED 31 DECEMBER 15
48

Consolidated Entity
Notes2015
$’0002014
$’000
Current assets
Cash and cash equivalents 9 26,888 19,926
Trade and other receivables 10 166,007 171,282
Inventories 11 5,635 4,877
Current tax assets 6(b) 2,313 —
Other current assets 12 7,064 7,134
Total current assets 207,907 203,219
Non-current assets
Other receivables 13 11,980 13,103
Investments accounted for using the equity method 14 90,131 121,577
Other financial assets 15 557 706
Plant and equipment 16 31,772 40,801
Deferred tax assets 17 15,661 14,388
Intangible assets 18 522,697 555,641
Other non-current assets 19 2,384 2,208
Total non-current assets 675,182 748,424
Total assets 883,089 951,643
Current liabilities
Trade and other payables 20 158,280 162,884
Borrowings 21 70,908 100,820
Current tax liabilities 6(b) — 4,172
Provisions 22 7,687 11,124
Total current liabilities 236,875 279,000
Non-current liabilities
Other payables 23 20,471 27,973
Borrowings 24 160,865 111,864
Deferred tax liabilities 25 4,538 3,994
Provisions 26 5,631 3,111
Total non-current liabilities 191,505 146,942
Total liabilities 428,380 425,942
Net assets 454,709 525,701
Equity
Issued capital 27 334,516 322,471
Reserves 28 29,304 31,361
Retained earnings 29 40,978 116,798
Equity attributable to members of the Parent Entity 404,798 470,630
Non-controlling interests 49,911 55,071
Total equity 454,709 525,701
The above consolidated statement of financial position should be read in conjunction with the accompanying notes.
CONSOLIDATED STATEMENT OF FINANCIAL POSITION AS AT 31 DECEMBER 15
49
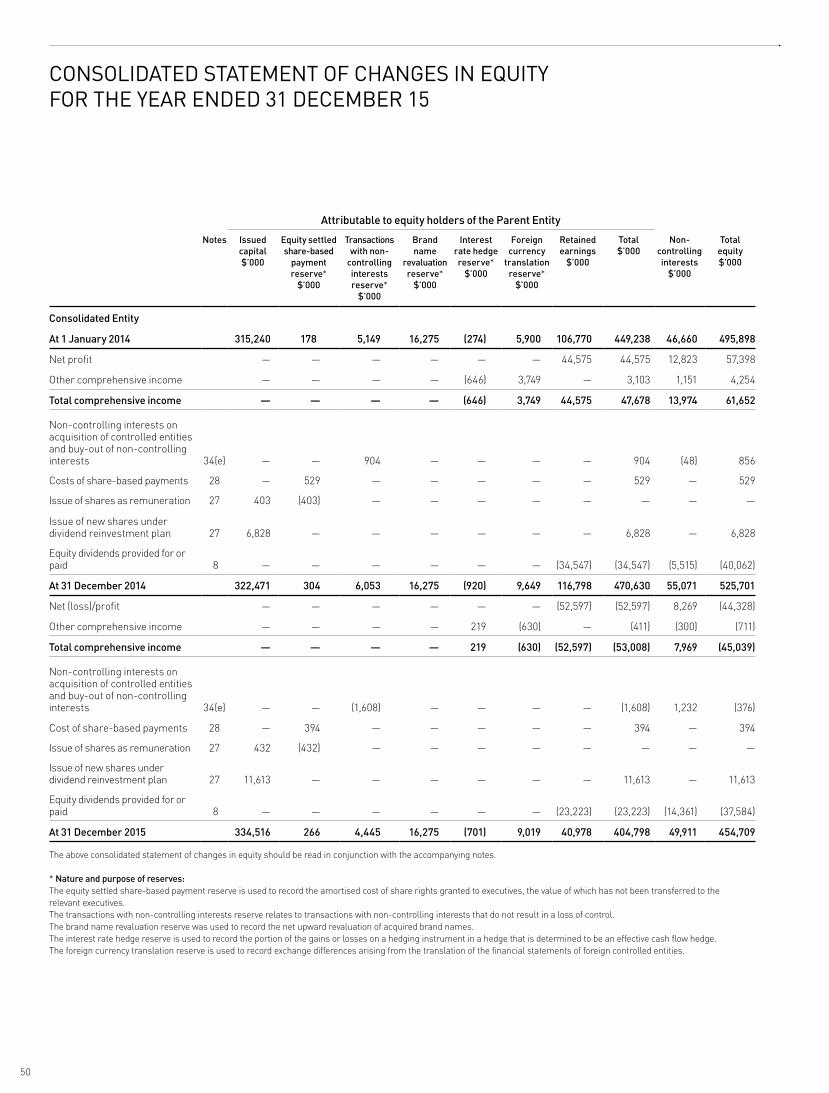
Attributable to equity holders of the Parent Entity
Notes Issued capital $’000
Equity settled share-based
payment reserve*
$’000
Transactions with non-
controlling interests reserve*
$’000
Brand name
revaluation reserve*
$’000
Interest rate hedge reserve*
$’000
Foreign currency
translation reserve*
$’000
Retained earnings
$’000
Total $’000
Non- controlling interests
$’000
Total equity $’000
Consolidated Entity
At 1 January 2014 315,240 178 5,149 16,275 (274) 5,900 106,770 449,238 46,660 495,898
Net profit — — — — — — 44,575 44,575 12,823 57,398
Other comprehensive income — — — — (646) 3,749 — 3,103 1,151 4,254
Total comprehensive income — — — — (646) 3,749 44,575 47,678 13,974 61,652
Non-controlling interests on acquisition of controlled entities and buy-out of non-controlling interests 34(e) — — 904 — — — — 904 (48) 856
Costs of share-based payments 28 — 529 — — — — — 529 — 529
Issue of shares as remuneration 27 403 (403) — — — — — — — —
Issue of new shares under dividend reinvestment plan 27 6,828 — — — — — — 6,828 — 6,828
Equity dividends provided for or paid 8 — — — — — — (34,547) (34,547) (5,515) (40,062)
At 31 December 2014 322,471 304 6,053 16,275 (920) 9,649 116,798 470,630 55,071 525,701
Net (loss)/profit — — — — — — (52,597) (52,597) 8,269 (44,328)
Other comprehensive income — — — — 219 (630) — (411) (300) (711)
Total comprehensive income — — — — 219 (630) (52,597) (53,008) 7,969 (45,039)
Non-controlling interests on acquisition of controlled entities and buy-out of non-controlling interests 34(e) — — (1,608) — — — — (1,608) 1,232 (376)
Cost of share-based payments 28 — 394 — — — — — 394 — 394
Issue of shares as remuneration 27 432 (432) — — — — — — — —
Issue of new shares under dividend reinvestment plan 27 11,613 — — — — — — 11,613 — 11,613
Equity dividends provided for or paid 8 — — — — — — (23,223) (23,223) (14,361) (37,584)
At 31 December 2015 334,516 266 4,445 16,275 (701) 9,019 40,978 404,798 49,911 454,709
The above consolidated statement of changes in equity should be read in conjunction with the accompanying notes.
* Nature and purpose of reserves: The equity settled share-based payment reserve is used to record the amortised cost of share rights granted to executives, the value of which has not been transferred to the relevant executives. The transactions with non-controlling interests reserve relates to transactions with non-controlling interests that do not result in a loss of control.The brand name revaluation reserve was used to record the net upward revaluation of acquired brand names. The interest rate hedge reserve is used to record the portion of the gains or losses on a hedging instrument in a hedge that is determined to be an effective cash flow hedge. The foreign currency translation reserve is used to record exchange differences arising from the translation of the financial statements of foreign controlled entities.
CONSOLIDATED STATEMENT OF CHANGES IN EQUITYFOR THE YEAR ENDED 31 DECEMBER 15
50
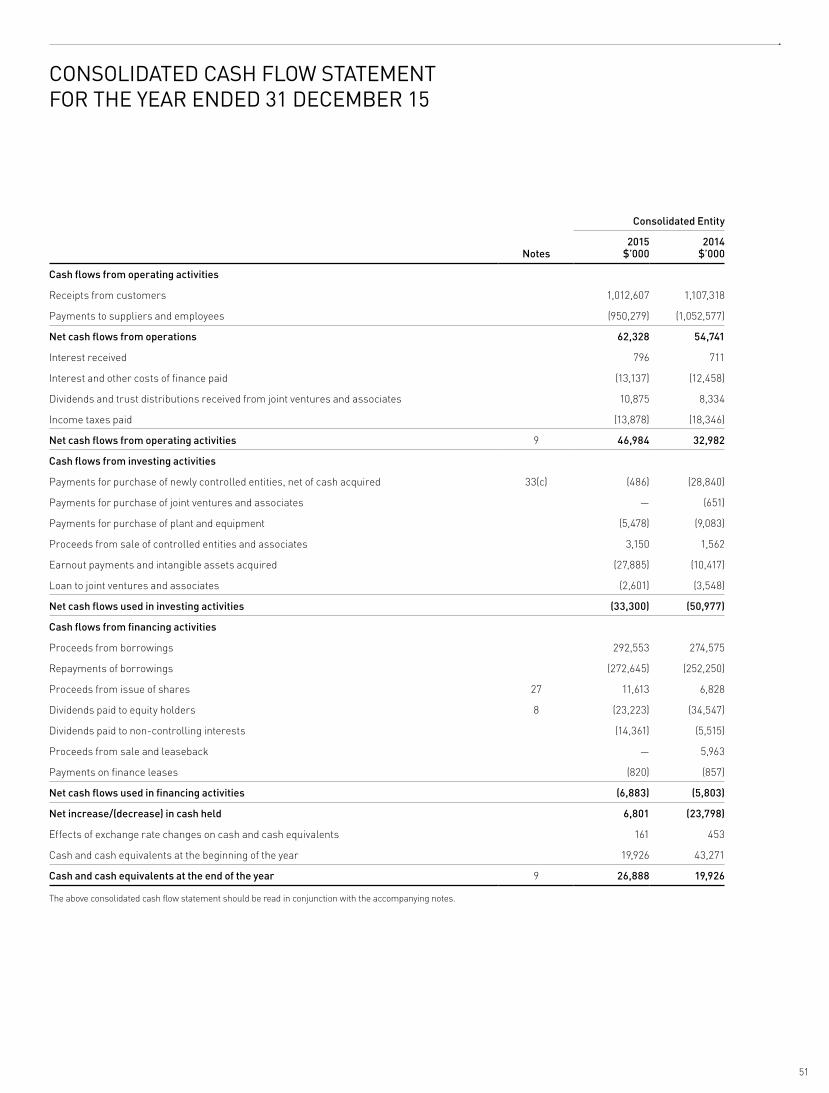
Consolidated Entity
Notes2015
$’0002014
$’000
Cash flows from operating activities
Receipts from customers 1,012,607 1,107,318
Payments to suppliers and employees (950,279) (1,052,577)
Net cash flows from operations 62,328 54,741
Interest received 796 711
Interest and other costs of finance paid (13,137) (12,458)
Dividends and trust distributions received from joint ventures and associates 10,875 8,334
Income taxes paid (13,878) (18,346)
Net cash flows from operating activities 9 46,984 32,982
Cash flows from investing activities
Payments for purchase of newly controlled entities, net of cash acquired 33(c) (486) (28,840)
Payments for purchase of joint ventures and associates — (651)
Payments for purchase of plant and equipment (5,478) (9,083)
Proceeds from sale of controlled entities and associates 3,150 1,562
Earnout payments and intangible assets acquired (27,885) (10,417)
Loan to joint ventures and associates (2,601) (3,548)
Net cash flows used in investing activities (33,300) (50,977)
Cash flows from financing activities
Proceeds from borrowings 292,553 274,575
Repayments of borrowings (272,645) (252,250)
Proceeds from issue of shares 27 11,613 6,828
Dividends paid to equity holders 8 (23,223) (34,547)
Dividends paid to non-controlling interests (14,361) (5,515)
Proceeds from sale and leaseback — 5,963
Payments on finance leases (820) (857)
Net cash flows used in financing activities (6,883) (5,803)
Net increase/(decrease) in cash held 6,801 (23,798)
Effects of exchange rate changes on cash and cash equivalents 161 453
Cash and cash equivalents at the beginning of the year 19,926 43,271
Cash and cash equivalents at the end of the year 9 26,888 19,926
The above consolidated cash flow statement should be read in conjunction with the accompanying notes.
CONSOLIDATED CASH FLOW STATEMENTFOR THE YEAR ENDED 31 DECEMBER 15
51
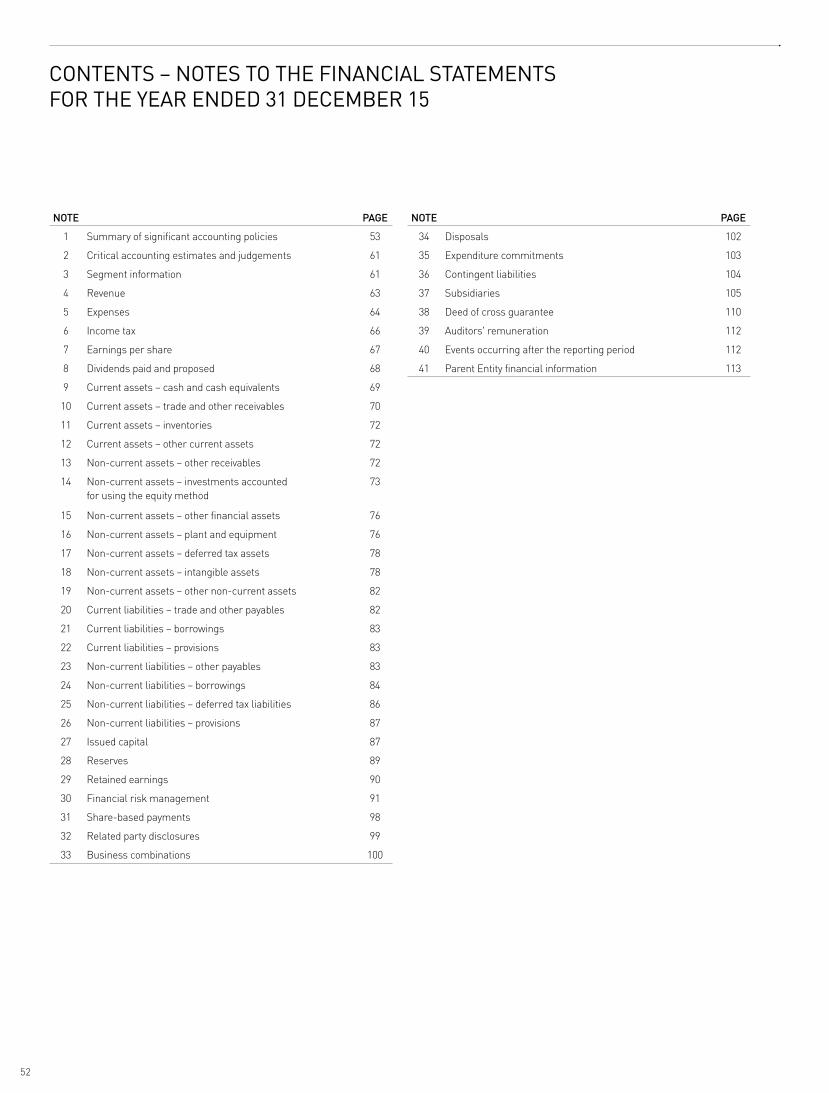
NOTE PAGE NOTE PAGE
1 Summary of significant accounting policies 53 34 Disposals 102
2 Critical accounting estimates and judgements 61 35 Expenditure commitments 103
3 Segment information 61 36 Contingent liabilities 104
4 Revenue 63 37 Subsidiaries 105
5 Expenses 64 38 Deed of cross guarantee 110
6 Income tax 66 39 Auditors' remuneration 112
7 Earnings per share 67 40 Events occurring after the reporting period 112
8 Dividends paid and proposed 68 41 Parent Entity financial information 113
9 Current assets – cash and cash equivalents 69
10 Current assets – trade and other receivables 70
11 Current assets – inventories 72
12 Current assets – other current assets 72
13 Non-current assets – other receivables 72
14 Non-current assets – investments accounted for using the equity method
73
15 Non-current assets – other financial assets 76
16 Non-current assets – plant and equipment 76
17 Non-current assets – deferred tax assets 78
18 Non-current assets – intangible assets 78
19 Non-current assets – other non-current assets 82
20 Current liabilities – trade and other payables 82
21 Current liabilities – borrowings 83
22 Current liabilities – provisions 83
23 Non-current liabilities – other payables 83
24 Non-current liabilities – borrowings 84
25 Non-current liabilities – deferred tax liabilities 86
26 Non-current liabilities – provisions 87
27 Issued capital 87
28 Reserves 89
29 Retained earnings 90
30 Financial risk management 91
31 Share-based payments 98
32 Related party disclosures 99
33 Business combinations 100
CONTENTS – NOTES TO THE FINANCIAL STATEMENTSFOR THE YEAR ENDED 31 DECEMBER 15
52
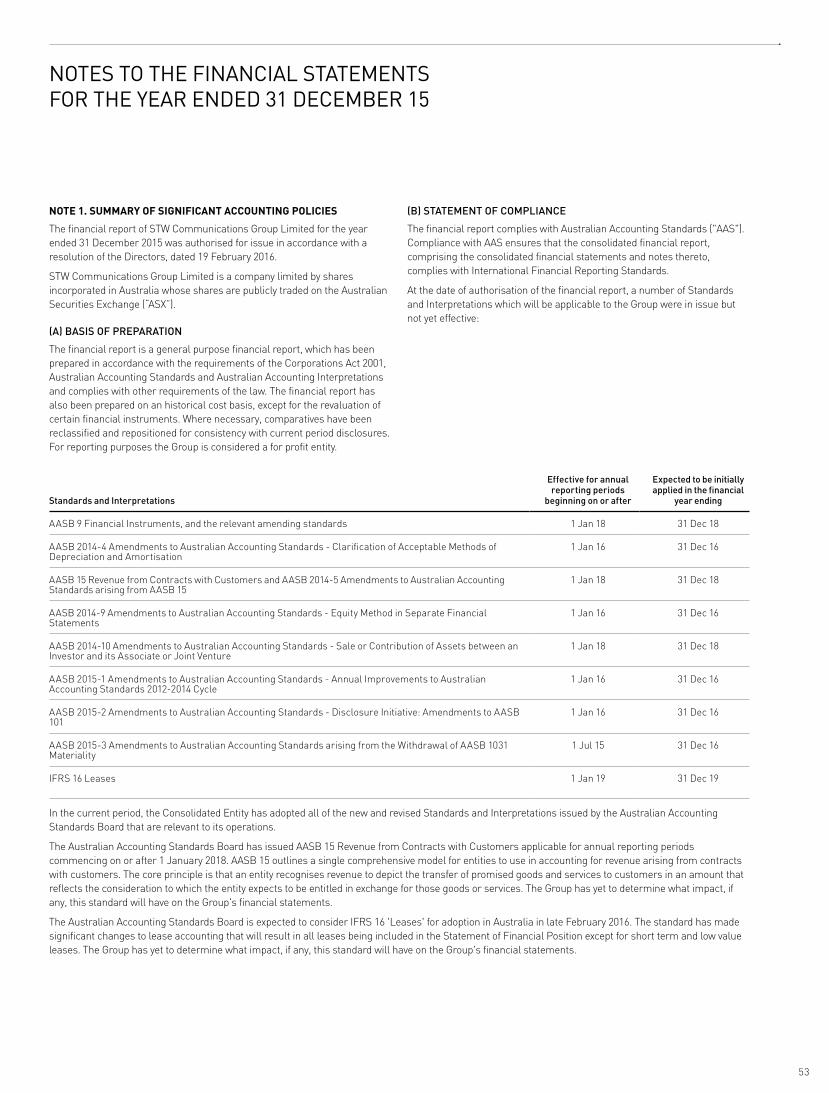
NOTE 1. SUMMARY OF SIGNIFICANT ACCOUNTING POLICIES
The financial report of STW Communications Group Limited for the year ended 31 December 2015 was authorised for issue in accordance with a resolution of the Directors, dated 19 February 2016.
STW Communications Group Limited is a company limited by shares incorporated in Australia whose shares are publicly traded on the Australian Securities Exchange (“ASX”).
(A) BASIS OF PREPARATION
The financial report is a general purpose financial report, which has been prepared in accordance with the requirements of the Corporations Act 2001, Australian Accounting Standards and Australian Accounting Interpretations and complies with other requirements of the law. The financial report has also been prepared on an historical cost basis, except for the revaluation of certain financial instruments. Where necessary, comparatives have been reclassified and repositioned for consistency with current period disclosures. For reporting purposes the Group is considered a for profit entity.
(B) STATEMENT OF COMPLIANCE
The financial report complies with Australian Accounting Standards ("AAS"). Compliance with AAS ensures that the consolidated financial report, comprising the consolidated financial statements and notes thereto, complies with International Financial Reporting Standards.
At the date of authorisation of the financial report, a number of Standards and Interpretations which will be applicable to the Group were in issue but not yet effective:
Standards and Interpretations
Effective for annual reporting periods
beginning on or after
Expected to be initially applied in the financial
year ending
AASB 9 Financial Instruments, and the relevant amending standards 1 Jan 18 31 Dec 18
AASB 2014-4 Amendments to Australian Accounting Standards - Clarification of Acceptable Methods of Depreciation and Amortisation
1 Jan 16 31 Dec 16
AASB 15 Revenue from Contracts with Customers and AASB 2014-5 Amendments to Australian Accounting Standards arising from AASB 15
1 Jan 18 31 Dec 18
AASB 2014-9 Amendments to Australian Accounting Standards - Equity Method in Separate Financial Statements
1 Jan 16 31 Dec 16
AASB 2014-10 Amendments to Australian Accounting Standards - Sale or Contribution of Assets between an Investor and its Associate or Joint Venture
1 Jan 18 31 Dec 18
AASB 2015-1 Amendments to Australian Accounting Standards - Annual Improvements to Australian Accounting Standards 2012-2014 Cycle
1 Jan 16 31 Dec 16
AASB 2015-2 Amendments to Australian Accounting Standards - Disclosure Initiative: Amendments to AASB 101
1 Jan 16 31 Dec 16
AASB 2015-3 Amendments to Australian Accounting Standards arising from the Withdrawal of AASB 1031 Materiality
1 Jul 15 31 Dec 16
IFRS 16 Leases 1 Jan 19 31 Dec 19
In the current period, the Consolidated Entity has adopted all of the new and revised Standards and Interpretations issued by the Australian Accounting Standards Board that are relevant to its operations.
The Australian Accounting Standards Board has issued AASB 15 Revenue from Contracts with Customers applicable for annual reporting periods commencing on or after 1 January 2018. AASB 15 outlines a single comprehensive model for entities to use in accounting for revenue arising from contracts with customers. The core principle is that an entity recognises revenue to depict the transfer of promised goods and services to customers in an amount that reflects the consideration to which the entity expects to be entitled in exchange for those goods or services. The Group has yet to determine what impact, if any, this standard will have on the Group's financial statements.
The Australian Accounting Standards Board is expected to consider IFRS 16 'Leases' for adoption in Australia in late February 2016. The standard has made significant changes to lease accounting that will result in all leases being included in the Statement of Financial Position except for short term and low value leases. The Group has yet to determine what impact, if any, this standard will have on the Group's financial statements.
NOTES TO THE FINANCIAL STATEMENTSFOR THE YEAR ENDED 31 DECEMBER 15
53
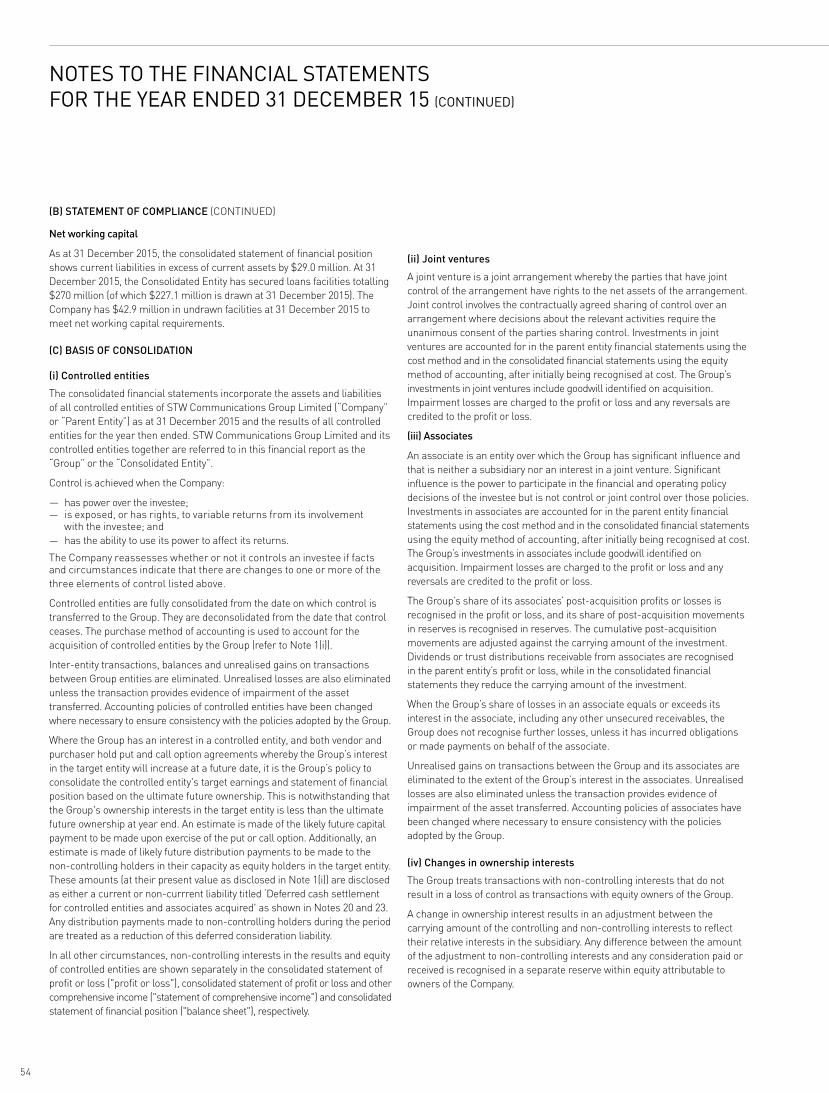
Net working capital
As at 31 December 2015, the consolidated statement of financial position shows current liabilities in excess of current assets by $29.0 million. At 31 December 2015, the Consolidated Entity has secured loans facilities totalling $270 million (of which $227.1 million is drawn at 31 December 2015). The Company has $42.9 million in undrawn facilities at 31 December 2015 to meet net working capital requirements.
(C) BASIS OF CONSOLIDATION
(i) Controlled entities
The consolidated financial statements incorporate the assets and liabilities of all controlled entities of STW Communications Group Limited (“Company” or “Parent Entity”) as at 31 December 2015 and the results of all controlled entities for the year then ended. STW Communications Group Limited and its controlled entities together are referred to in this financial report as the “Group” or the “Consolidated Entity”.
Control is achieved when the Company:
— has power over the investee; — is exposed, or has rights, to variable returns from its involvement
with the investee; and — has the ability to use its power to affect its returns.
The Company reassesses whether or not it controls an investee if facts and circumstances indicate that there are changes to one or more of the three elements of control listed above.
Controlled entities are fully consolidated from the date on which control is transferred to the Group. They are deconsolidated from the date that control ceases. The purchase method of accounting is used to account for the acquisition of controlled entities by the Group (refer to Note 1(i)).
Inter-entity transactions, balances and unrealised gains on transactions between Group entities are eliminated. Unrealised losses are also eliminated unless the transaction provides evidence of impairment of the asset transferred. Accounting policies of controlled entities have been changed where necessary to ensure consistency with the policies adopted by the Group.
Where the Group has an interest in a controlled entity, and both vendor and purchaser hold put and call option agreements whereby the Group’s interest in the target entity will increase at a future date, it is the Group’s policy to consolidate the controlled entity's target earnings and statement of financial position based on the ultimate future ownership. This is notwithstanding that the Group's ownership interests in the target entity is less than the ultimate future ownership at year end. An estimate is made of the likely future capital payment to be made upon exercise of the put or call option. Additionally, an estimate is made of likely future distribution payments to be made to the non-controlling holders in their capacity as equity holders in the target entity. These amounts (at their present value as disclosed in Note 1(i)) are disclosed as either a current or non-currrent liability titled ‘Deferred cash settlement for controlled entities and associates acquired' as shown in Notes 20 and 23. Any distribution payments made to non-controlling holders during the period are treated as a reduction of this deferred consideration liability.
In all other circumstances, non-controlling interests in the results and equity of controlled entities are shown separately in the consolidated statement of profit or loss ("profit or loss"), consolidated statement of profit or loss and other comprehensive income ("statement of comprehensive income") and consolidated statement of financial position ("balance sheet"), respectively.
(ii) Joint ventures
A joint venture is a joint arrangement whereby the parties that have joint control of the arrangement have rights to the net assets of the arrangement. Joint control involves the contractually agreed sharing of control over an arrangement where decisions about the relevant activities require the unanimous consent of the parties sharing control. Investments in joint ventures are accounted for in the parent entity financial statements using the cost method and in the consolidated financial statements using the equity method of accounting, after initially being recognised at cost. The Group’s investments in joint ventures include goodwill identified on acquisition. Impairment losses are charged to the profit or loss and any reversals are credited to the profit or loss.
(iii) Associates
An associate is an entity over which the Group has significant influence and that is neither a subsidiary nor an interest in a joint venture. Significant influence is the power to participate in the financial and operating policy decisions of the investee but is not control or joint control over those policies. Investments in associates are accounted for in the parent entity financial statements using the cost method and in the consolidated financial statements using the equity method of accounting, after initially being recognised at cost. The Group’s investments in associates include goodwill identified on acquisition. Impairment losses are charged to the profit or loss and any reversals are credited to the profit or loss.
The Group’s share of its associates’ post-acquisition profits or losses is recognised in the profit or loss, and its share of post-acquisition movements in reserves is recognised in reserves. The cumulative post-acquisition movements are adjusted against the carrying amount of the investment. Dividends or trust distributions receivable from associates are recognised in the parent entity’s profit or loss, while in the consolidated financial statements they reduce the carrying amount of the investment.
When the Group’s share of losses in an associate equals or exceeds its interest in the associate, including any other unsecured receivables, the Group does not recognise further losses, unless it has incurred obligations or made payments on behalf of the associate.
Unrealised gains on transactions between the Group and its associates are eliminated to the extent of the Group’s interest in the associates. Unrealised losses are also eliminated unless the transaction provides evidence of impairment of the asset transferred. Accounting policies of associates have been changed where necessary to ensure consistency with the policies adopted by the Group.
(iv) Changes in ownership interests
The Group treats transactions with non-controlling interests that do not result in a loss of control as transactions with equity owners of the Group.
A change in ownership interest results in an adjustment between the carrying amount of the controlling and non-controlling interests to reflect their relative interests in the subsidiary. Any difference between the amount of the adjustment to non-controlling interests and any consideration paid or received is recognised in a separate reserve within equity attributable to owners of the Company.
(B) STATEMENT OF COMPLIANCE (CONTINUED)
NOTES TO THE FINANCIAL STATEMENTSFOR THE YEAR ENDED 31 DECEMBER 15 (CONTINUED)
54
(D) ROUNDING OF AMOUNTS TO THE NEAREST THOUSAND DOLLARS
The Company is an entity to which Class Order (CO 98/100) issued by the Australian Securities and Investments Commission applies and, accordingly, amounts in the financial statements have been rounded off to the nearest thousand dollars in accordance with this Class Order.
(E) FOREIGN CURRENCY TRANSLATION
(i) Functional and presentation currency
Items included in the financial statements of each of the Group’s entities are measured using the currency of the primary economic environment in which the entity operates (“functional currency”). The consolidated financial statements are presented in Australian Dollars, which is STW Communications Group Limited’s functional and presentation currency.
(ii) Transactions and balances
Foreign currency transactions are translated into the functional currency using the exchange rates prevailing at the dates of the transactions. Foreign exchange gains and losses resulting from the settlement of such transactions and from the translation at the year end exchange rates of monetary assets and liabilities denominated in foreign currencies are recognised in the profit or loss and statement of comprehensive income.
(iii) Group entities
The results and statement of financial position of all the Group entities (none of which has the currency of a hyperinflationary economy) that have a functional currency different from the presentation currency are translated into the presentation currency as follows:
— income and expenses for each statement of profit or loss are translated at average exchange rates (unless this is not a reasonable approximation of the cumulative effect of the rates prevailing on the transaction dates, in which case income and expenses are translated at the dates of the transactions);
— assets and liabilities for each statement of financial position are translated at the closing rate at the date of that statement of financial position; and
— all resulting exchange differences are recognised in the foreign currency translation reserve, as a separate component of equity.
On consolidation, exchange differences arising from the translation of any net investment in foreign entities and of borrowings, are taken to equity. When a foreign operation is sold or borrowings repaid, a proportionate share of such exchange differences is recognised in the profit or loss and statement of comprehensive income as part of the gain or loss on sale.
Goodwill and fair value adjustments arising on the acquisition of a foreign entity are treated as assets and liabilities of the foreign entity and translated at the closing rate.
(F) REVENUE RECOGNITION
Revenue is measured at the fair value of the consideration received or receivable. Amounts disclosed as revenue are net of any refunds, trade allowances and duties and taxes paid.
Revenue is recognised to the extent that it is probable that the economic benefits will flow to the Group and the revenue can be reliably measured. The following specific recognition criteria must also be met before revenue is recognised.
(i) Advertising revenue
Advertising billings, which are not recognised in the profit or loss, comprise the total value of advertising placed by clients on which controlled entities earn commission and fees, and billings on fees earned for advertising not directly placed for clients. The value of advertising billings is included in ‘Receipts from customers’ in the consolidated cash flow statement.
Advertising fee revenue from a contract to provide services is recognised by reference to the stage of completion of the advertising contract. The stage of completion of the advertising contract considers agreed contractual labour rates, direct expenses incurred and percentage of the contract completed.
(ii) Media revenue
Media commission and service fees are brought to account on a monthly basis, once advertisements have been run in the media and billed to clients. The value of media billings is included in ‘Receipts from customers’ in the consolidated cash flow statement.
(iii) Production revenue
Production commission and service fees are brought to account when the costs incurred for production costs are earnt.
(iv) Retainer fees
Retainer-based fees arising from a contract to provide services are recognised on a straight-line basis over the period of the contract.
(v) Collateral revenue
Collateral revenue is brought to account when the related costs are earnt.
(vi) Interest
Interest revenue is recognised on a time proportional basis taking into account the effective interest rates applicable to the financial assets.
(vii) Dividends and trust distributions
Dividend and trust distribution revenue is recognised when the right to receive a dividend and/or trust distribution has been established. For the Consolidated Entity, dividends and trust distributions received from joint ventures and associates are accounted for in accordance with the equity method of accounting.
(viii) Sale of goods
Revenue from the sale of goods is recognised when the significant risks and rewards of ownership of the goods have passed to the buyer and the costs incurred or to be incurred in respect of the transaction can be measured reliably. Risks and rewards of ownership are considered passed to the buyer at the time of delivery of the goods to the customer.
55
(G) TAXES
(i) Income tax
The income tax expense or revenue for the period is the tax payable or tax refund on the current period’s taxable income based on the income tax rate for each jurisdiction, adjusted by changes in deferred tax assets and liabilities attributable to temporary differences between the tax bases of assets and liabilities and their carrying amounts in the financial statements and to unused tax losses.
Deferred tax assets and liabilities are recognised for temporary differences at the tax rates expected to apply when the assets are recovered or liabilities are settled, based on those tax rates which are enacted or substantively enacted for each jurisdiction. The relevant tax rates are applied to the cumulative amounts of deductible and taxable temporary differences to measure the deferred tax asset or liability. An exception is made for certain temporary differences arising from the initial recognition of an asset or a liability. No deferred tax asset or liability is recognised in relation to these temporary differences if they arose in a transaction, other than a business combination, that at the time of the transaction did not affect either accounting profit or taxable profit or loss.
Deferred tax assets are recognised for deductible temporary differences and unused tax losses only if it is probable that future taxable amounts will be available to utilise those temporary differences and losses.
Deferred tax liabilities and assets are not recognised for temporary differences between the carrying amount and tax bases of investments in controlled entities where the Parent Entity is able to control the timing of the reversal of the temporary differences and it is probable that the differences will not reverse in the foreseeable future.
Current and deferred tax balances attributable to amounts recognised directly in equity are also recognised directly in equity.
(ii) Goods and services tax (“GST”)
Revenues, expenses and assets are recognised net of the amount of GST except:
— where the GST incurred on a purchase of goods and services is not recoverable from the taxation authority, in which case the GST is recognised as part of the cost of the acquisition of the asset or as part of the expense item as applicable; and
— trade and other receivables and trade and other payables are stated with the amount of GST included.
The net amount of GST recoverable from, or payable to, the taxation authority is included as part of receivables or payables in the balance sheet.
Cash flows are included in the consolidated cash flow statement on a gross basis and the GST component of cash flows arising from investing and financing activities, which is recoverable from or payable to the taxation authority, is classified as operating cash flows.
Commitments and contingencies are disclosed net of the amount of GST recoverable from, or payable to, the taxation authority.
(iii) Tax consolidation
The Company and all its wholly-owned Australian resident entities are part of a tax-consolidated group under Australian taxation law. STW Communications Group Limited is the head entity in the tax-consolidated group. Tax expense/income, deferred tax liabilities and deferred tax assets arising from temporary differences of the members of the tax-consolidated group are recognised in the separate financial statements of the members of the tax-consolidated group using the ‘separate taxpayer within group’ approach by reference to the carrying amounts in the separate financial statements of each entity and the tax values applying under tax consolidation. Current tax liabilities and assets and deferred tax assets arising from unused tax losses and relevant tax credits of members of the tax-consolidated group are recognised by the Company (as head entity in the tax-consolidated group).
Due to the existence of a tax funding arrangement between the entities in the tax-consolidated group, amounts are recognised as payable to or receivable by the Company and each other member of the group in relation to the tax contribution amounts paid or payable between the Parent Entity and the other members of the tax-consolidated group in accordance with the arrangement.
(H) LEASES
Leases of plant and equipment where the Group has substantially all the risks and rewards of ownership are classified as finance leases. Finance leases are capitalised at the lease’s inception at the lower of the fair value of the leased property and the present value of the minimum lease payments. The corresponding rental obligations, net of finance charges, are included in current and non-current borrowings. Each lease payment is allocated between the liability and the finance charges so as to achieve a constant rate on the finance balance outstanding. The interest element of the finance cost is charged to the profit or loss over the lease period so as to produce a constant periodic rate of interest on the remaining balance of the liability for each period. The plant and equipment acquired under finance leases are depreciated over the estimated useful life of the leased assets.
Leases in which a significant portion of the risks and rewards of ownership are retained by the lessor are classified as operating leases. Payments made under operating leases (net of any incentives received from the lessor) are charged to the profit or loss on a straight-line basis over the period of the lease.
NOTES TO THE FINANCIAL STATEMENTSFOR THE YEAR ENDED 31 DECEMBER 15 (CONTINUED)
56
(I) BUSINESS COMBINATIONS
The acquisition method of accounting is used to account for all business combinations, regardless of whether equity instruments or other assets are acquired. The consideration transferred for the acquisition of a subsidiary comprises the fair values of the assets transferred, the liabilities incurred and the equity interests issued by the Group. The consideration transferred also includes the fair value of any asset or liability resulting from a contingent consideration arrangement and the fair value of any pre-existing equity interest in the subsidiary. Acquisition-related costs are expensed as incurred.
Identifiable assets acquired and liabilities and contingent liabilities assumed in a business combination are, with limited exceptions, measured initially at their fair values at the acquisition date. On an acquisition-by-acquisition basis, the Group recognises any non-controlling interest in the acquiree either at fair value or at the non-controlling interest’s proportionate share of the acquiree’s net identifiable assets.
The excess of the consideration transferred, the amount of any non-controlling interest in the acquiree and the acquisition-date fair value of any previous equity interest in the acquiree over the fair value of the Group’s share of the net identifiable assets acquired is recorded as goodwill. If those amounts are less than the fair value of the net identifiable assets of the subsidiary acquired and the measurement of all amounts has been reviewed, the difference is recognised directly in the profit or loss as a bargain purchase.
Where settlement of any part of cash consideration is deferred, the amounts payable in the future are discounted to their present value as at the date of exchange. The discount rate used is the entity’s incremental borrowing rate, being the rate at which a similar borrowing could be obtained from an independent financier under comparable terms and conditions.
Contingent consideration is classified either as equity or a financial liability. Amounts classified as a financial liability are subsequently remeasured to fair value with changes in fair value recognised in the profit or loss.
Business combinations that took place prior to 1 July 2009 were accounted for in accordance with the previous version of AASB 3 Business Combinations.
Prior to control being obtained, the investment is accounted for under AASB 128 Investments in Associates and Joint Ventures, AASB 11 Joint Arrangements and AASB 139 Financial Instruments: Recognition and Measurement. On the date that control is obtained, the fair values of the acquired entity’s assets and liabilities, including goodwill, are measured. Any resulting adjustments to previously recognised assets and liabilities are recognised in the profit or loss. Thus, attaining control triggers remeasurement.
(J) IMPAIRMENT OF ASSETS
Goodwill and other intangible assets that have an indefinite useful life are not subject to amortisation and are tested annually for impairment. Assets that are subject to amortisation are reviewed for impairment whenever events or changes in circumstances indicate that the carrying amount may not be recoverable. An impairment loss is recognised for the amount by which the asset’s carrying amount exceeds its recoverable amount. The recoverable amount is the higher of an asset’s fair value less costs to sell, and its value in use. Value in use is based on future cash flows attributable to the asset or assets, and these cash flows are discounted using a weighted average cost of capital. For the purpose of assessing impairment, assets are grouped at the lowest levels for which there are separately identifiable cash flows (cash generating units (“CGUs”)).
For assets other than goodwill, where an impairment loss subsequently reverses, the carrying value of the asset is increased to the revised estimate of its recoverable amount to the extent that the increased carrying amount does not exceed the amount that would have been determined had no impairment loss been recognised.
(K) CASH AND CASH EQUIVALENTS
Cash and cash equivalents include cash on hand, deposits at call with financial institutions, and other short-term, highly liquid investments with original maturities of three months or less, that are readily convertible to known amounts of cash, and that are subject to an insignificant risk of changes in value.
(L) TRADE AND OTHER RECEIVABLES
Trade and other receivables are recognised initially at fair value and subsequently measured at amortised cost, less any provision for impairment. Trade receivables are due for settlement no more than 30 days from the date of recognition.
Collectibility of trade and other receivables is reviewed on an ongoing basis. Debts which are known to be uncollectible are written off by reducing the carrying amount directly. An allowance account (provision for impairment of trade receivables) is raised when some doubt as to collection by the Group of all amounts due according to the original terms of receivables exists. The amount of the impairment allowance is the difference between the asset’s carrying amount and the present value of estimated future cash flows, discounted at the effective interest rate.
The amount of the impairment allowance is recognised in the profit or loss.
(M) INVENTORIES
Raw materials and stores, work in progress and finished goods are stated at the lower of cost and net realisable value. Cost comprises direct materials, direct labour and an appropriate proportion of variable and fixed overhead expenditure, the latter being allocated on the basis of normal operating capacity. Costs are assigned to individual items of inventory on the basis of weighted average costs. Costs of purchased inventory are determined after deducting rebates and discounts. Net realisable value is the estimated selling price in the ordinary course of business less the estimated costs of completion and the estimated costs necessary to make the sale.
(N) INVESTMENTS AND OTHER FINANCIAL ASSETS
The Group classifies its investments in the following categories: loans and receivables, and available-for-sale financial assets. The classification depends on the purpose for which the investments were acquired. Management determines the classification of the investments at initial recognition and re-evaluates this designation at each reporting date.
(i) Effective interest method
The effective interest method is a method of calculating the amortised cost of a financial asset and of allocating interest income over the relevant period. The effective interest rate is the rate that exactly discounts estimated future cash receipts (including all fees on points paid or received that form an integral part of the effective interest rate, transaction costs and other premiums or discounts) through the expected life of the financial asset, or, where appropriate, a shorter period.
Income is recognised on an effective interest basis for debt instruments.
57
(ii) Loans and receivables
Loans and receivables are non-derivative financial assets with fixed or determinable payments that are not quoted in an active market. They arise when the Group provides money, goods or services directly to a debtor with no intention of selling the receivable. They are included in current assets, except for those with maturities greater than 12 months after the balance sheet date which are classified as non-current assets. Loans and receivables are included in trade and other receivables in the balance sheet.
(iii) Available-for-sale financial assets
Available-for-sale financial assets are non-derivatives that are either designated in this category or not classified in any other categories. They are included in non-current assets unless management intends to dispose of the investment within 12 months of the balance sheet date.
Purchases and sales of investments are recognised on trade date, being the date on which the Group commits to purchase or sell the asset. Investments are initially recognised at fair value plus transaction costs for all financial assets not carried at fair value through the profit or loss. Financial assets are derecognised when the rights to receive cash flows from the financial assets have expired or have been transferred and the Group has transferred substantially all the risks and rewards of ownership.
Available-for-sale financial assets are subsequently carried at fair value. Loans and receivables are carried at amortised cost using the effective interest method, less impairment. Unrealised gains and losses arising from changes in the fair value of securities classified as available-for-sale are recognised in equity as an available-for-sale investments revaluation reserve. When securities classified as available-for-sale are sold or impaired, the accumulated fair value adjustments are included in the profit or loss as gains and losses from investment securities.
The fair values of quoted investments are based on current bid prices. If the market for a financial asset is not active (and for unlisted securities), the Group establishes fair value by using valuation techniques. These include reference to the fair values of recent arm’s length transactions, involving the same instruments or other instruments that are substantially the same, discounted cash flow analysis, and option pricing models refined to reflect the issuer’s specific circumstances.
Financial assets are assessed for indicators of impairment at each balance date. Financial assets are impaired where there is objective evidence that as a result of one or more events that occurred after the initial recognition of the financial asset, the estimated future cash flows of the investment have been impacted.
For financial assets carried at amortised cost, the amount of the impairment is the difference between the asset’s carrying amount and the present value of estimated future cash flows, discounted at the original effective interest rate.
The carrying amount of financial assets including uncollectible trade receivables is reduced by the impairment loss through the use of an allowance account. Subsequent recoveries of amounts previously written off are credited against the allowance account. Changes in the carrying amount of the allowance account are recognised in the profit or loss.
With the exception of available-for-sale equity instruments, if, in a subsequent period, the amount of the impairment loss decreases and the decrease can be related objectively to an event occurring after the impairment was recognised, the previously recognised impairment loss is reversed through the profit or loss to the extent the carrying amount of the investment at the date the impairment is reversed does not exceed what the amortised cost would have been had the impairment not been recognised.
In respect of available-for-sale equity instruments, any subsequent increase in the fair value after an impairment loss is recognised directly in equity.
On derecognition of a financial asset in its entirety, the difference between the asset’s carrying amount and the sum of the consideration received and receivable and the cumulative gain or loss that had been recognised in other comprehensive income and accumulated in equity is recognised in the profit or loss.
(O) FAIR VALUE ESTIMATION
The fair value of financial assets and financial liabilities must be estimated for recognition and measurement or for disclosure purposes. The fair value of financial instruments that are not traded in an active market is determined using valuation techniques. The Group uses a variety of methods and makes assumptions that are based on market conditions existing at each balance date. Quoted market prices or dealer quotes for similar instruments are used for long-term debt instruments held. Other techniques, such as estimated discounted cash flows, are used to determine fair value for the remaining financial instruments.
The nominal value less estimated credit adjustments of receivables and payables are assumed to approximate their fair values. The fair value of financial liabilities for disclosure purposes is estimated by discounting the future contractual cash flows at the current market interest rate that is available to the Group for similar financial instruments.
(P) PLANT AND EQUIPMENT
Plant and equipment are stated at historical cost less accumulated depreciation and impairment. Historical cost includes expenditure that is directly attributable to the acquisition of the items.
Subsequent costs are included in the asset’s carrying amount or recognised as a separate asset, as appropriate, only when it is probable that future economic benefits associated with the item will flow to the Group and the cost of the item can be measured reliably. All other repairs and maintenance are charged to the profit or loss during the financial period in which they are incurred.
Except for plant and equipment acquired as part of the Active Display Group acquisition, depreciation on plant and equipment is calculated using a straight-line method to allocate their cost, net of their residual values, over their estimated useful lives to the Consolidated Entity as follows – plant and equipment: 12%-40% per annum.
For plant and equipment acquired as part of the Active Display Group acquisition, depreciation is calculated using diminishing value method at a rate of 13%-50% per annum.
Where items of plant and equipment have separately identifiable components which are subject to regular replacement, those components are assigned useful lives distinct from the item of plant and equipment to which they relate.
The assets’ residual values and useful lives are reviewed, and adjusted if appropriate, at each balance sheet date. An asset’s carrying amount is written down immediately to its recoverable amount if the asset’s carrying amount is greater than its estimated recoverable amount (refer to Note 1(j)).
Gains and losses on disposals are determined by comparing proceeds with carrying amount. These are included in the profit or loss. When revalued assets are sold, the amounts included in other reserves in respect of those assets are transferred to retained earnings.
(N) INVESTMENTS AND OTHER FINANCIAL ASSETS (CONTINUED)
NOTES TO THE FINANCIAL STATEMENTSFOR THE YEAR ENDED 31 DECEMBER 15 (CONTINUED)
58

(Q) INTANGIBLE ASSETS
(i) Goodwill
Goodwill represents the excess of the cost of an acquisition over the fair value of the Group’s share of the net identifiable assets of the acquired controlled entity or associate at the date of acquisition. Goodwill on acquisitions of controlled entities is included in intangible assets. Goodwill on acquisitions of associates is included in investments in associates. Goodwill acquired in business combinations is not amortised. Instead, goodwill is tested for impairment annually, or more frequently if events or changes in circumstances indicate that it might be impaired, and is carried at cost less accumulated impairment losses.
For the purpose of impairment testing, goodwill is allocated to each of the Group's CGUs that is expected to benefit from the synergies of the combination.
An impairment loss recognised for goodwill is recognised immediately in the profit or loss and is not reversed in a subsequent period.
On disposal of the relevant CGU, the attributable amount of goodwill is included in the determination of the profit or loss on disposal.
(ii) Brand names
With each business combination, the Group assesses whether an acquisition of a brand name has taken place. Brand names are identifiable intangible assets with indefinite useful lives. They are not subject to amortisation; rather, they are subject to impairment testing in accordance with Note 1(j).
The value of brand names is determined using the ‘relief from royalty’ method. This entails an estimate of the comparable royalty payments that would need to be made by the Group to license the use of the brand name. The valuation is the present value of these future payments discounted at the weighted average cost of capital.
(iii) Intellectual property
Intellectual property has a finite useful life and is carried at cost less accumulated amortisation and impairment losses. Amortisation is calculated using the straight-line method to allocate the cost of intellectual property over its estimated useful life, which is five years.
(iv) Research and development
Expenditure on research activities, undertaken with the prospect of obtaining new technical knowledge and understanding, is recognised in the profit or loss as an expense when it is incurred.
Expenditure on development activities, being the application of research findings or other knowledge to a plan or design for the production of new or substantially improved products or services before the start of commercial production or use, is capitalised if the product or service is technically and commercially feasible and adequate resources are available to complete development. The expenditure capitalised comprises all directly attributable costs, including costs of materials, services and direct labour. Other development expenditure is recognised in the profit or loss as an expense as incurred.
Capitalised development expenditure is stated at cost less accumulated amortisation. Amortisation is calculated using the straight-line method to allocate the cost over the period of the expected benefit, which varies from three to five years.
(v) Customer relationships
Customer relationships are acquired as part of business combinations and recognised separately from goodwill. Customer relationships have a finite useful life and are carried at fair value less accumulated amortisation and impairment losses. Amortisation is calculated using the straight-line method with estimated useful life of ten years.
(R) TRADE AND OTHER PAYABLES
Trade and other payables are recognised initially at their fair value, which is the amount expected to be paid, and subsequently at amortised cost. These amounts represent liabilities for goods and services provided to the Group prior to the end of financial year which are unpaid. The amounts are unsecured and are usually paid within 60 days of recognition.
(S) BORROWINGS
Borrowings are initially recognised at fair value, net of transaction costs incurred. Any difference between the proceeds (net of transaction costs) and the redemption amount is recognised in the profit or loss over the period of the borrowings using the effective interest method. Borrowings are subsequently measured at amortised cost. Borrowings are classified as current liabilities unless the Group has an unconditional right to defer settlement of the liability for at least 12 months after the balance sheet date.
(T) FINANCE COSTS
Finance costs are recognised as an expense in the period in which they are incurred. Finance costs include interest, amortisation of discounts or premiums, amortisation of ancillary costs incurred in connection with borrowings, and finance lease charges.
(U) PROVISIONS Provisions are recognised when: the Group has a present obligation as a result of past events; it is more likely than not that an outflow of resources will be required to settle the obligation; and the amount has been reliably estimated. Provisions are not recognised for future operating losses.
Where there are a number of similar obligations, the likelihood that an outflow will be required in settlement is determined by considering the class of obligations as a whole. A provision is recognised even if the likelihood of an outflow with respect to any one item included in the same class of obligations may be small.
Present obligations arising under onerous contracts are recognised and measured as a provision. An onerous contract is considered to exist where the Group has a contract under which the unavoidable costs of meeting the obligations under the contract exceed the economic benefits expected to be received under it.
(V) EMPLOYEE BENEFITS
(i) Short-term obligations
Liabilities for wages and salaries, including non-monetary benefits and accumulating sick leave, expected to be settled within 12 months after the end of the period in which the employees render the related services are recognised in respect of employees' services up to the end of the reporting period and are measured at the amounts expected to be paid when the liabilities are settled. All other short-term employee benefit obligations are presented as payables.
59
60
(ii) Long-term employee benefit obligations
The liability for long service leave and long-term annual leave which is not expected to be settled within 12 months after the end of the period in which the employees render the related service is recognised in the provision for employee benefits and measured as the present value of expected future payments to be made in respect of services provided by employees up to the reporting date using the projected unit credit method. Consideration is given to expected future wage and salary levels, experience of employee departures and periods of service. Expected future payments are discounted using market yields at the end of the reporting period on national government bonds with terms to maturity and currency that match, as closely as possible, the estimated future cash outflows.
The obligations are presented as current liabilities in the balance sheet if the entity does not have an unconditional right to defer settlement for at least 12 months after the reporting date, regardless of when the actual settlement is expected to occur.
(iii) Share-based payments
Share-based compensation benefits are provided to employees via the executive share plan (“ESP”), as detailed in the Remuneration Report on pages 33 to 46.
The fair value of shares granted under the ESP is recognised as an employee benefit expense with a corresponding increase in equity. The fair value is measured at grant date and recognised over the period during which the executives become unconditionally entitled to the shares.
The fair value at grant date is independently determined using a Black-Scholes option pricing model that takes into account the exercise price, the term of the option or performance right, the vesting and performance criteria, the impact of dilution, the non-tradeable nature of the performance right, the share price at grant date and expected price volatility of the underlying share, the expected dividend yield and the risk-free interest rate for the term of the performance right.
The fair value of the shares granted excludes the impact of any non-market vesting conditions. Non-market vesting conditions are included in assumptions about the number of shares that are expected to vest. At each balance sheet date, the entity revises its estimate of the number of shares that are expected to vest. The employee benefit expense recognised each period takes into account the most recent estimate.
(iv) Profit-sharing and bonus plans
The Group recognises a liability and an expense for profit sharing and bonuses based on a formula that takes into consideration the profit attributable to the Company’s shareholders after certain adjustments. The Group recognises a provision where contractually obliged or where there is a past practice that has created a constructive obligation.
(W) ISSUED CAPITAL
Ordinary shares are classified as equity.
Incremental costs directly attributable to the issue of new shares are shown in equity as a deduction, net of tax, from the proceeds. Incremental costs directly attributable to the issue of new shares or options for the acquisition of a business, are not included in the cost of the acquisition as part of the purchase consideration, but are shown in equity as a deduction, net of tax, from the gross proceeds.
(X) DIVIDENDS
Provision is made for the amount of any dividend declared before or at the end of the year but not distributed at balance date.
(Y) EARNINGS PER SHARE
(i) Basic earnings per share
Basic earnings per share is calculated by dividing net (loss)/profit after income tax attributable to equity holders of the Company, excluding any costs of servicing equity other than ordinary shares, by the weighted average number of ordinary shares outstanding during the year, adjusted for bonus elements in ordinary shares, if any, issued during the year.
(ii) Diluted earnings per share
Diluted earnings per share adjusts the figures used in the determination of basic earnings per share to take into account the after-income tax effect of interest and other financing costs associated with dilutive potential ordinary shares and the weighted average number of shares assumed to have been issued for no consideration in relation to dilutive potential ordinary shares.
(Z) DERIVATIVE FINANCIAL INSTRUMENTS
The Group enters into a variety of derivative financial instruments to manage its exposure to interest rate risk, including interest rate swaps and caps. Further details of derivative financial instruments are disclosed in Note 30. Derivatives are initially recognised at fair value at the date a derivative contract is entered into and subsequently remeasured to their fair value at each reporting date.
The resulting gain or loss is recognised in the profit or loss immediately unless the derivative is designated and effective as a hedging instrument, in which event the timing of the recognition in the profit or loss depends on the nature of the hedge relationship.
The Group designates certain derivatives as hedges of highly probable forecast transactions (“cash flow hedges”).
The fair value of a hedging derivative is presented as a non-current asset or a non-current liability if the remaining maturity of the instrument is more than 12 months and the instrument is not expected to be realised or settled within 12 months. Other derivatives are presented as current assets or current liabilities.
The effective portion of changes in the fair value of derivatives that are designated and qualify as cash flow hedges are deferred in equity. The gain or loss relating to the ineffective portion is recognised immediately in the profit or loss as part of other expenses or other income.
Amounts deferred in equity are recycled in the profit or loss in the periods when the hedged item is recognised in the profit or loss in the same line of the profit or loss as the recognised hedged item. However, when the forecast transaction that is hedged results in the recognition of a non-financial asset or a non-financial liability, the gains and losses previously deferred in equity are transferred from equity and included in the initial measurement of the cost of the asset or liability.
Hedge accounting is discontinued when the Group revokes the hedging relationship, or the hedging instrument expires or is sold, terminated, or exercised, or no longer qualifies for hedge accounting. Any cumulative gain or loss deferred in equity at that time remains in equity and is recognised when the forecast transaction is ultimately recognised in the profit or loss. When a forecast transaction is no longer expected to occur, the cumulative gain or loss that was deferred in equity is recognised immediately in the profit or loss.
(V) EMPLOYEE BENEFITS (CONTINUED)
NOTES TO THE FINANCIAL STATEMENTSFOR THE YEAR ENDED 31 DECEMBER 15 (CONTINUED)
61
NOTE 2. CRITICAL ACCOUNTING ESTIMATES AND JUDGEMENTS
The carrying amounts of certain assets and liabilities are often determined based on estimates and assumptions of future events. The key estimates and assumptions that have a significant risk of causing a material adjustment to the carrying amounts of certain assets and liabilities within the next annual reporting period are:
(i) Impairment of goodwill, other intangible assets and investments
The Group determines on at least an annual basis (and at such other times when indicators of impairment arise) whether goodwill, other intangible assets with indefinite useful lives and investments are impaired. The assumptions used in this estimation of recoverable amount and the carrying amount of goodwill are discussed in Notes 1(q) and 18.
(ii) Deferred costs of acquisition
The Group measures the cost of investments with reference to forecast results of the acquired entity. These forecast results are reassessed at least annually with reference to management accounts and projections. The treatment of deferred costs of investment acquisition liabilities is detailed further in Notes 1(i), 20 and 23.
(iii) Share-based payment transactions
The Group measures the cost of equity settled transactions with employees by reference to the fair value of the equity instruments at the date at which they are granted. The employee benefit expense is then determined with reference to a binomial probability model which includes estimates of the probability factors of an employee meeting employment duration targets and the Group achieving certain performance targets as set annually by the Remuneration and Nominations Committee as detailed in the Remuneration Report on pages 33 to 46.
NOTE 3. SEGMENT INFORMATION
IDENTIFICATION OF REPORTABLE SEGMENTS
The Company has identified its operating segments based on the internal reports that are reviewed and used by the Board (the chief operating decision-maker) in assessing performance and in determining the allocation of resources. The operating segments are identified by the Board based on reporting lines and the nature of services provided. Discrete financial information about each of these operating segments is reported to the Board on a monthly basis. The Company operates predominately in Australia.
The reportable segments are based on aggregated operating segments determined by the similarity of the services provided and other factors.
SEGMENTS
The Company has identified two reportable segments:
— Advertising, Production and Media; and — Diversified Communications.
Advertising, Production and Media – the Advertising, Production and Media segment provides advertising services, television and print production services and media investments for Australia, New Zealand and other countries.
Diversified Communications – the Diversified Communications segment covers the full gamut of marketing communications services. The Diversified Communications segment was established in order to offer clients a total solution to their marketing needs, well beyond their traditional advertising, production and media requirements.
A detailed list of all products and services provided by the Company is not disclosed due to the cost of extracting the information.
HOLDING COMPANY
Holding company costs are those costs which are managed on a Group basis and not allocated to business segments. They include revenues from one-off projects undertaken by the head office for external clients and costs associated with strategic planning decisions, compliance costs and treasury related activities.
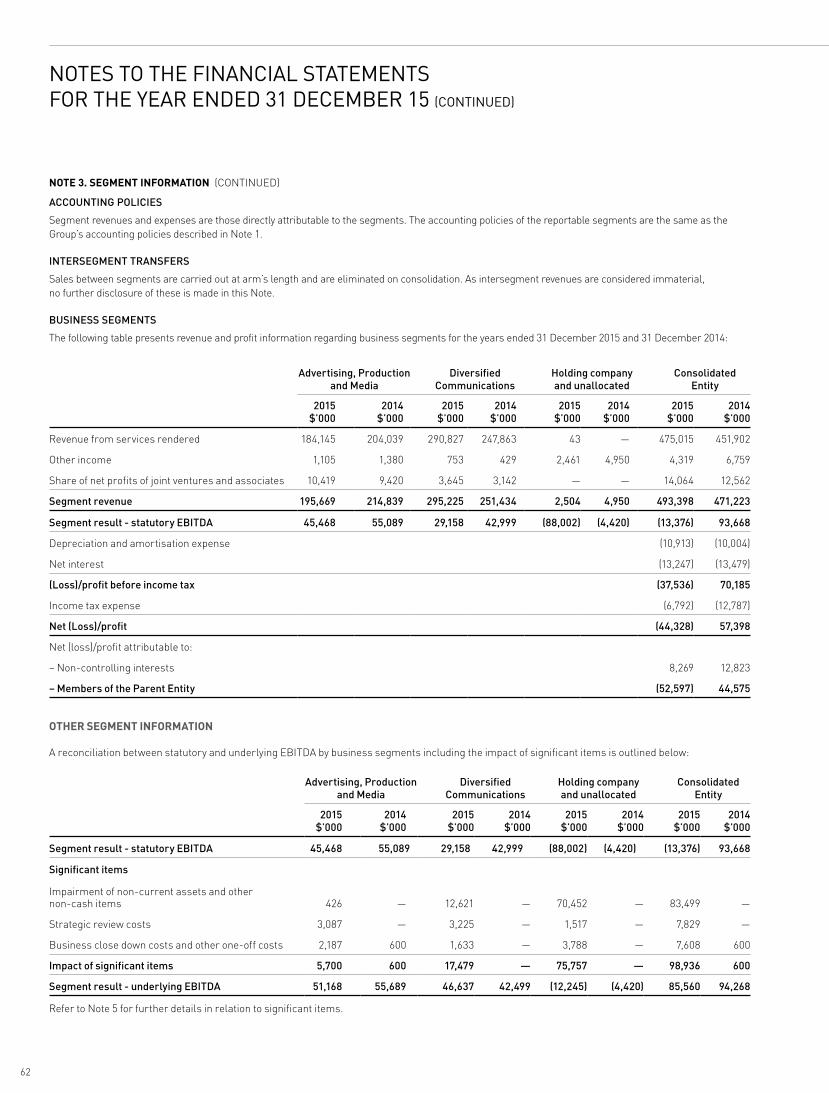
62
ACCOUNTING POLICIES
Segment revenues and expenses are those directly attributable to the segments. The accounting policies of the reportable segments are the same as the Group’s accounting policies described in Note 1.
INTERSEGMENT TRANSFERS
Sales between segments are carried out at arm’s length and are eliminated on consolidation. As intersegment revenues are considered immaterial, no further disclosure of these is made in this Note.
BUSINESS SEGMENTS
The following table presents revenue and profit information regarding business segments for the years ended 31 December 2015 and 31 December 2014:
Advertising, Production and Media
Diversified Communications
Holding company and unallocated
Consolidated Entity
2015$’000
2014$’000
2015$’000
2014$’000
2015$’000
2014$’000
2015$’000
2014$’000
Revenue from services rendered 184,145 204,039 290,827 247,863 43 — 475,015 451,902
Other income 1,105 1,380 753 429 2,461 4,950 4,319 6,759
Share of net profits of joint ventures and associates 10,419 9,420 3,645 3,142 — — 14,064 12,562
Segment revenue 195,669 214,839 295,225 251,434 2,504 4,950 493,398 471,223
Segment result - statutory EBITDA 45,468 55,089 29,158 42,999 (88,002) (4,420) (13,376) 93,668
Depreciation and amortisation expense (10,913) (10,004)
Net interest (13,247) (13,479)
(Loss)/profit before income tax (37,536) 70,185
Income tax expense (6,792) (12,787)
Net (Loss)/profit (44,328) 57,398
Net (loss)/profit attributable to:
– Non-controlling interests 8,269 12,823
– Members of the Parent Entity (52,597) 44,575
OTHER SEGMENT INFORMATION
A reconciliation between statutory and underlying EBITDA by business segments including the impact of significant items is outlined below:
Advertising, Production and Media
Diversified Communications
Holding company and unallocated
Consolidated Entity
2015$’000
2014$’000
2015$’000
2014$’000
2015$’000
2014$’000
2015$’000
2014$’000
Segment result - statutory EBITDA 45,468 55,089 29,158 42,999 (88,002) (4,420) (13,376) 93,668
Significant items
Impairment of non-current assets and other non-cash items 426 — 12,621 — 70,452 — 83,499 —
Strategic review costs 3,087 — 3,225 — 1,517 — 7,829 —
Business close down costs and other one-off costs 2,187 600 1,633 — 3,788 — 7,608 600
Impact of significant items 5,700 600 17,479 — 75,757 — 98,936 600
Segment result - underlying EBITDA 51,168 55,689 46,637 42,499 (12,245) (4,420) 85,560 94,268
Refer to Note 5 for further details in relation to significant items.
NOTE 3. SEGMENT INFORMATION (CONTINUED)
NOTES TO THE FINANCIAL STATEMENTSFOR THE YEAR ENDED 31 DECEMBER 15 (CONTINUED)
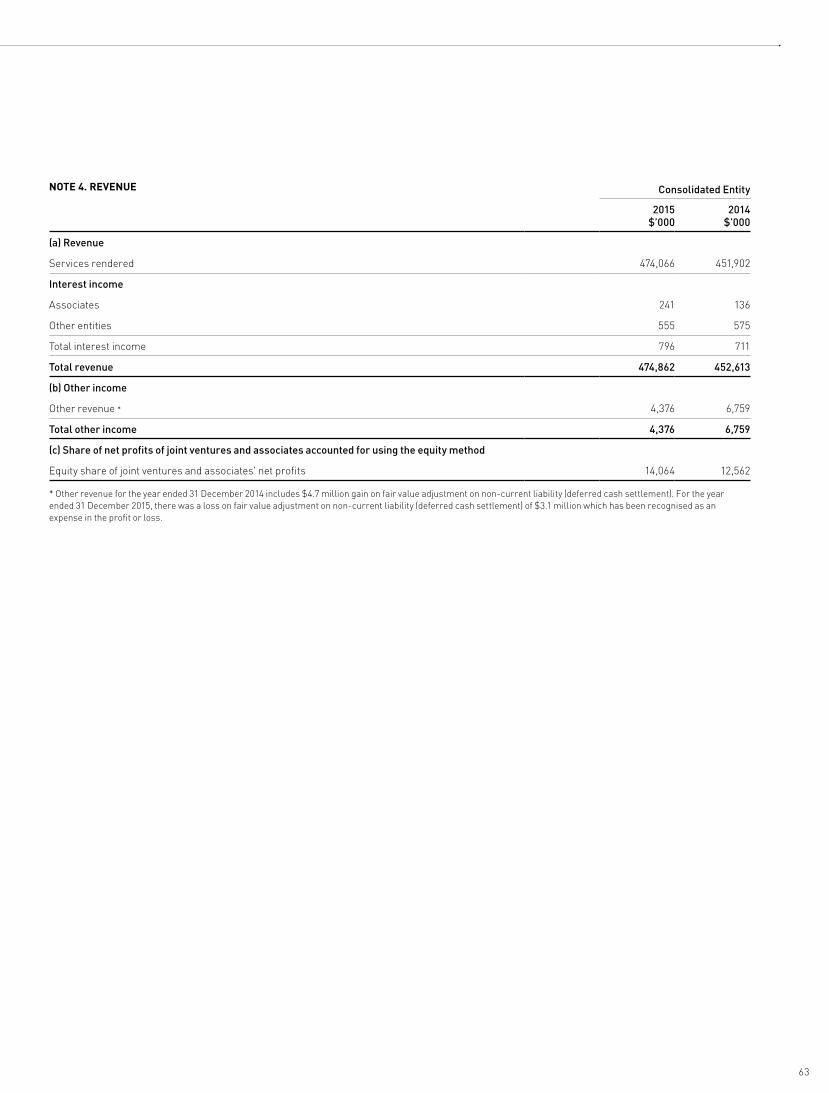
63
NOTE 4. REVENUE Consolidated Entity
2015 $’000
2014 $’000
(a) Revenue
Services rendered 474,066 451,902
Interest income
Associates 241 136
Other entities 555 575
Total interest income 796 711
Total revenue 474,862 452,613
(b) Other income
Other revenue * 4,376 6,759
Total other income 4,376 6,759
(c) Share of net profits of joint ventures and associates accounted for using the equity method
Equity share of joint ventures and associates' net profits 14,064 12,562
* Other revenue for the year ended 31 December 2014 includes $4.7 million gain on fair value adjustment on non-current liability (deferred cash settlement). For the year ended 31 December 2015, there was a loss on fair value adjustment on non-current liability (deferred cash settlement) of $3.1 million which has been recognised as an expense in the profit or loss.
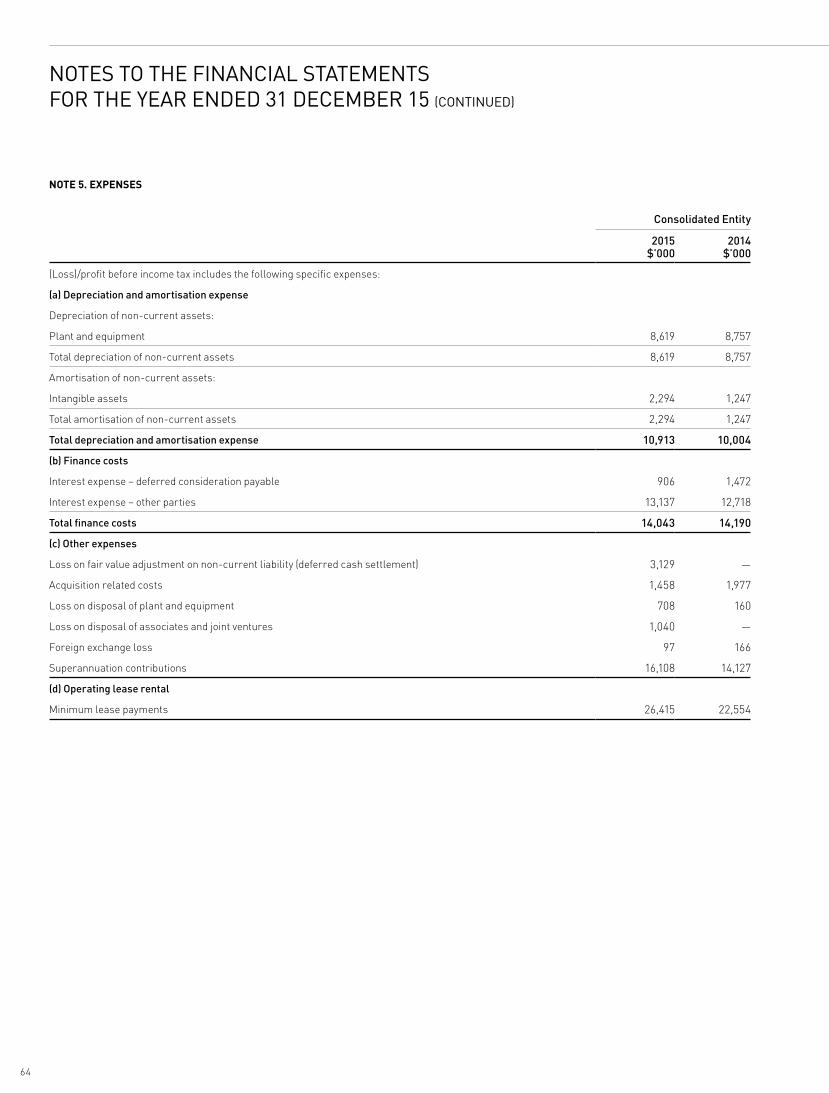
64
NOTE 5. EXPENSES
Consolidated Entity
2015 $’000
2014 $’000
(Loss)/profit before income tax includes the following specific expenses:
(a) Depreciation and amortisation expense
Depreciation of non-current assets:
Plant and equipment 8,619 8,757
Total depreciation of non-current assets 8,619 8,757
Amortisation of non-current assets:
Intangible assets 2,294 1,247
Total amortisation of non-current assets 2,294 1,247
Total depreciation and amortisation expense 10,913 10,004
(b) Finance costs
Interest expense – deferred consideration payable 906 1,472
Interest expense – other parties 13,137 12,718
Total finance costs 14,043 14,190
(c) Other expenses
Loss on fair value adjustment on non-current liability (deferred cash settlement) 3,129 —
Acquisition related costs 1,458 1,977
Loss on disposal of plant and equipment 708 160
Loss on disposal of associates and joint ventures 1,040 —
Foreign exchange loss 97 166
Superannuation contributions 16,108 14,127
(d) Operating lease rental
Minimum lease payments 26,415 22,554
NOTES TO THE FINANCIAL STATEMENTSFOR THE YEAR ENDED 31 DECEMBER 15 (CONTINUED)
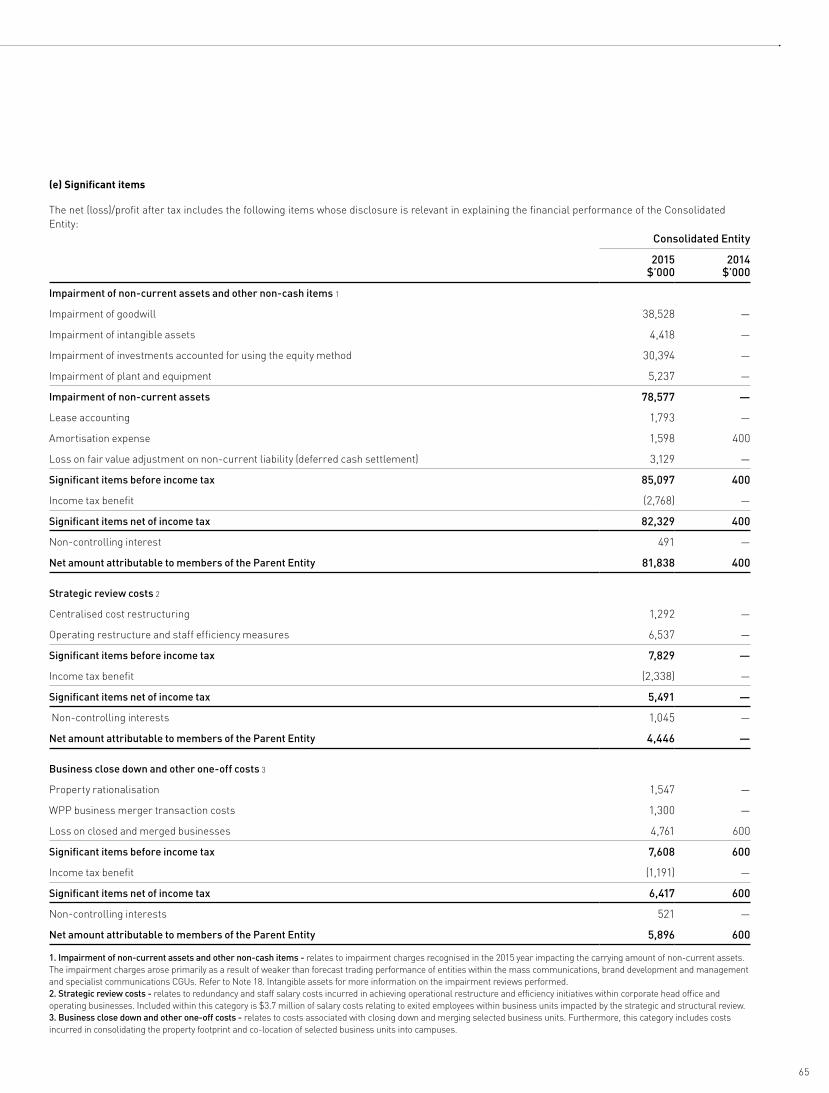
65
(e) Significant items
The net (loss)/profit after tax includes the following items whose disclosure is relevant in explaining the financial performance of the Consolidated Entity:
Consolidated Entity
2015 $’000
2014 $’000
Impairment of non-current assets and other non-cash items 1
Impairment of goodwill 38,528 —
Impairment of intangible assets 4,418 —
Impairment of investments accounted for using the equity method 30,394 —
Impairment of plant and equipment 5,237 —
Impairment of non-current assets 78,577 —
Lease accounting 1,793 —
Amortisation expense 1,598 400
Loss on fair value adjustment on non-current liability (deferred cash settlement) 3,129 —
Significant items before income tax 85,097 400
Income tax benefit (2,768) —
Significant items net of income tax 82,329 400
Non-controlling interest 491 —
Net amount attributable to members of the Parent Entity 81,838 400
Strategic review costs 2
Centralised cost restructuring 1,292 —
Operating restructure and staff efficiency measures 6,537 —
Significant items before income tax 7,829 —
Income tax benefit (2,338) —
Significant items net of income tax 5,491 —
Non-controlling interests 1,045 —
Net amount attributable to members of the Parent Entity 4,446 —
Business close down and other one-off costs 3
Property rationalisation 1,547 —
WPP business merger transaction costs 1,300 —
Loss on closed and merged businesses 4,761 600
Significant items before income tax 7,608 600
Income tax benefit (1,191) —
Significant items net of income tax 6,417 600
Non-controlling interests 521 —
Net amount attributable to members of the Parent Entity 5,896 600
1. Impairment of non-current assets and other non-cash items - relates to impairment charges recognised in the 2015 year impacting the carrying amount of non-current assets. The impairment charges arose primarily as a result of weaker than forecast trading performance of entities within the mass communications, brand development and management and specialist communications CGUs. Refer to Note 18. Intangible assets for more information on the impairment reviews performed.2. Strategic review costs - relates to redundancy and staff salary costs incurred in achieving operational restructure and efficiency initiatives within corporate head office and operating businesses. Included within this category is $3.7 million of salary costs relating to exited employees within business units impacted by the strategic and structural review.3. Business close down and other one-off costs - relates to costs associated with closing down and merging selected business units. Furthermore, this category includes costs incurred in consolidating the property footprint and co-location of selected business units into campuses.
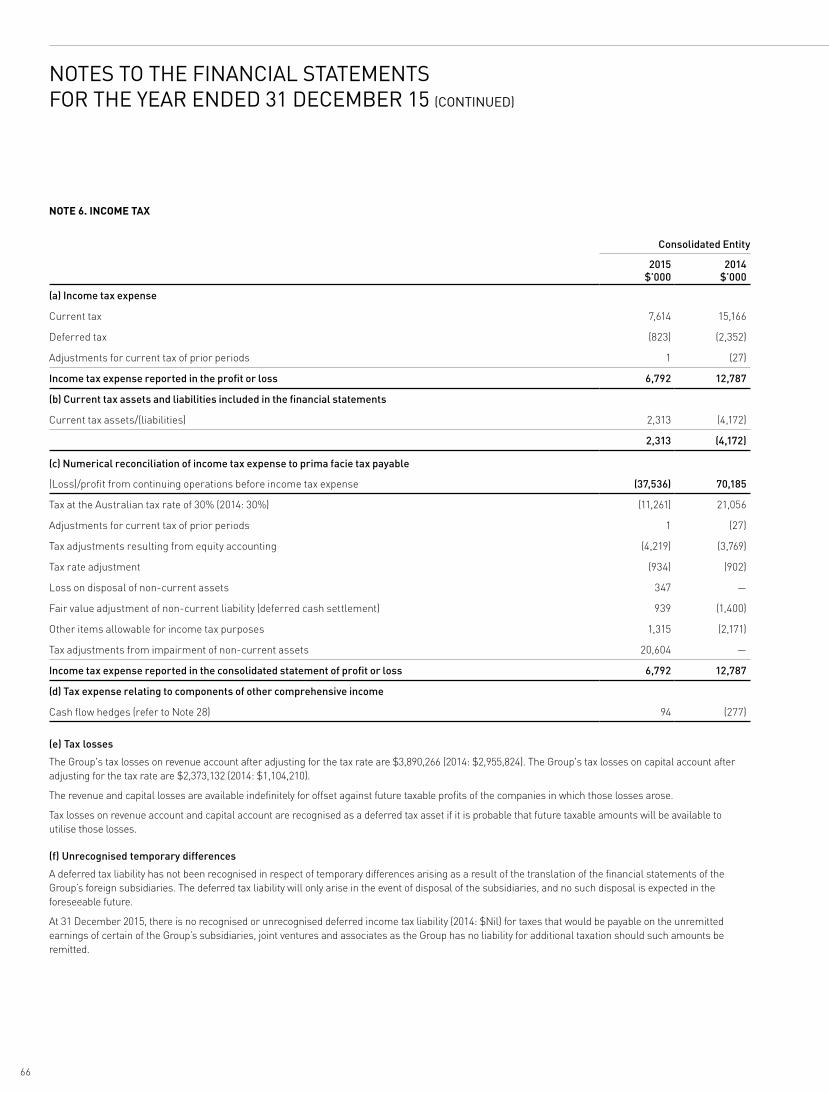
66
NOTE 6. INCOME TAX
Consolidated Entity
2015 $’000
2014 $’000
(a) Income tax expense
Current tax 7,614 15,166
Deferred tax (823) (2,352)
Adjustments for current tax of prior periods 1 (27)
Income tax expense reported in the profit or loss 6,792 12,787
(b) Current tax assets and liabilities included in the financial statements
Current tax assets/(liabilities) 2,313 (4,172)
2,313 (4,172)
(c) Numerical reconciliation of income tax expense to prima facie tax payable
(Loss)/profit from continuing operations before income tax expense (37,536) 70,185
Tax at the Australian tax rate of 30% (2014: 30%) (11,261) 21,056
Adjustments for current tax of prior periods 1 (27)
Tax adjustments resulting from equity accounting (4,219) (3,769)
Tax rate adjustment (934) (902)
Loss on disposal of non-current assets 347 —
Fair value adjustment of non-current liability (deferred cash settlement) 939 (1,400)
Other items allowable for income tax purposes 1,315 (2,171)
Tax adjustments from impairment of non-current assets 20,604 —
Income tax expense reported in the consolidated statement of profit or loss 6,792 12,787
(d) Tax expense relating to components of other comprehensive income
Cash flow hedges (refer to Note 28) 94 (277)
(e) Tax losses
The Group's tax losses on revenue account after adjusting for the tax rate are $3,890,266 (2014: $2,955,824). The Group's tax losses on capital account after adjusting for the tax rate are $2,373,132 (2014: $1,104,210).
The revenue and capital losses are available indefinitely for offset against future taxable profits of the companies in which those losses arose.
Tax losses on revenue account and capital account are recognised as a deferred tax asset if it is probable that future taxable amounts will be available to utilise those losses.
(f) Unrecognised temporary differences
A deferred tax liability has not been recognised in respect of temporary differences arising as a result of the translation of the financial statements of the Group’s foreign subsidiaries. The deferred tax liability will only arise in the event of disposal of the subsidiaries, and no such disposal is expected in the foreseeable future.
At 31 December 2015, there is no recognised or unrecognised deferred income tax liability (2014: $Nil) for taxes that would be payable on the unremitted earnings of certain of the Group’s subsidiaries, joint ventures and associates as the Group has no liability for additional taxation should such amounts be remitted.
NOTES TO THE FINANCIAL STATEMENTSFOR THE YEAR ENDED 31 DECEMBER 15 (CONTINUED)

67
(g) Tax consolidation legislation
STW Communications Group Limited and its wholly-owned subsidiaries are a tax-consolidated group. The accounting policy in relation to this legislation is set out in Note 1(g).
On adoption of the tax consolidation legislation, the entities in the tax-consolidated group entered into a tax sharing agreement, which, in the opinion of the Directors, limits the joint and several liability of the wholly-owned entities in the case of a default by the head entity, STW Communications Group Limited.
The entities have also entered into a tax funding agreement under which the wholly-owned entities fully compensate STW Communications Group Limited for any current tax payable assumed and are compensated by STW Communications Group Limited for any current tax receivable and deferred tax assets relating to unused tax losses or unused tax credits that are transferred to STW Communications Group Limited under the tax consolidation legislation. The funding amounts are determined by reference to the amounts recognised in the wholly-owned entities’ financial statements.
The amounts receivable/payable under the tax funding agreement are due upon receipt of the funding advice from the head entity, which is issued as soon as practicable after the end of each financial year. The head entity may also require payment of interim funding amounts to assist with its obligations to pay tax instalments. The funding amounts are recognised as current intercompany receivables or payables.
NOTE 7. EARNINGS PER SHARE
The calculation of basic and diluted earnings per share has been described in Notes 1(y)(i) and 1(y)(ii), respectively.
The following reflects the income and share data used in the total operations’ basic and diluted earnings per share computations:
Consolidated Entity
2015 $’000
2014 $’000
Net (loss)/profit attributable to ordinary equity holders of the Company from continuing operations for basic earnings per share (52,597) 44,575
Effect of dilution:
Dilutive adjustments to net (loss)/profit — —
Net (loss)/profit attributable to ordinary equity holders of the Company for diluted earnings per share (52,597) 44,575
Number Number
Weighted average number of ordinary shares for basic earnings per share 417,798,601 403,070,229
Impact of ESP shares where earnings per share growth performance targets have been met 71,928 86,783
Weighted average number of ordinary shares for diluted earnings per share 417,870,529 403,157,012
Cents Cents
Earnings per share for (loss)/profit from continuing operations attributable to ordinary equity holders of the Company
Basic earnings per share (12.59) 11.06
Diluted earnings per share (12.59) 11.06
Earnings per share is calculated by dividing net (loss)/profit for the year attributable to ordinary equity holders of the Company by the weighted average number of ordinary shares outstanding during the year. The weighted average number of shares makes allowances for shares reserved for employee share plans.
Performance rights of 2,435,029 (2014: 3,047,721) are considered to be contingently issuable and have not been allowed for in the diluted earnings per share calculation.
There have been no transactions involving ordinary shares between the reporting date and the date of completion of this financial report.
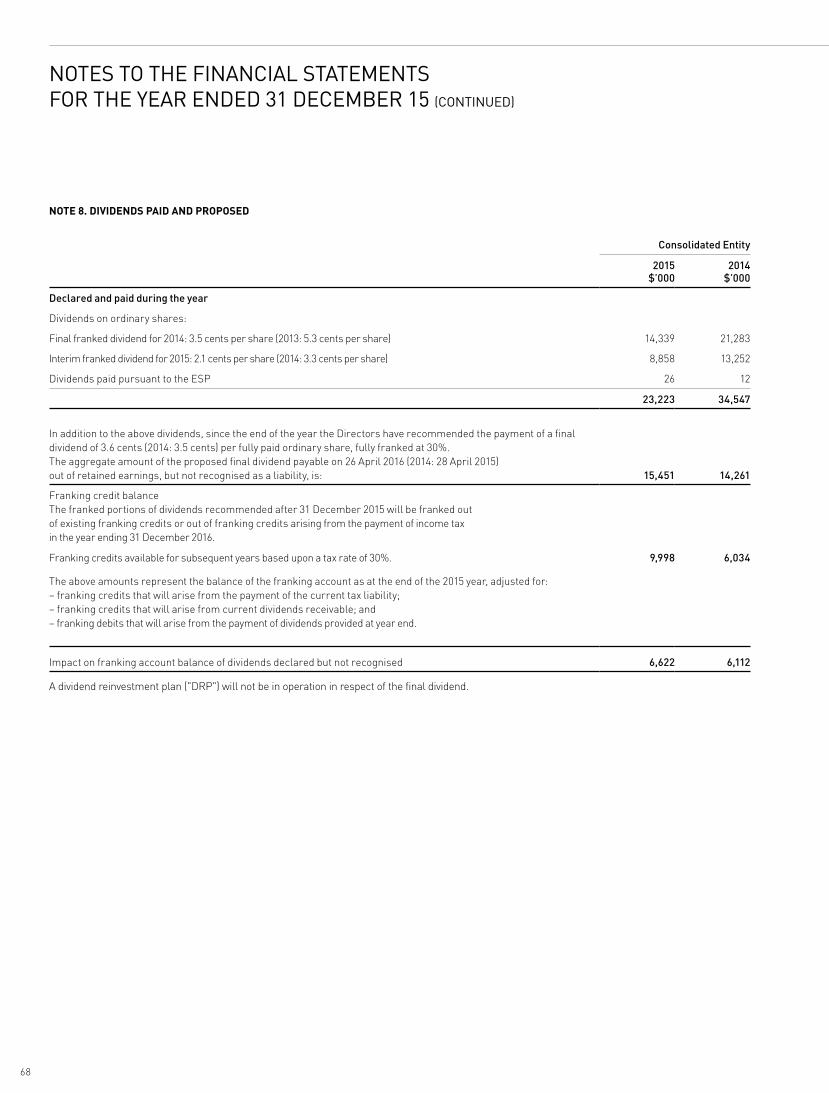
68
NOTE 8. DIVIDENDS PAID AND PROPOSED
Consolidated Entity
2015 $’000
2014 $’000
Declared and paid during the year
Dividends on ordinary shares:
Final franked dividend for 2014: 3.5 cents per share (2013: 5.3 cents per share) 14,339 21,283
Interim franked dividend for 2015: 2.1 cents per share (2014: 3.3 cents per share) 8,858 13,252
Dividends paid pursuant to the ESP 26 12
23,223 34,547
In addition to the above dividends, since the end of the year the Directors have recommended the payment of a final dividend of 3.6 cents (2014: 3.5 cents) per fully paid ordinary share, fully franked at 30%. The aggregate amount of the proposed final dividend payable on 26 April 2016 (2014: 28 April 2015) out of retained earnings, but not recognised as a liability, is: 15,451 14,261
Franking credit balanceThe franked portions of dividends recommended after 31 December 2015 will be franked out of existing franking credits or out of franking credits arising from the payment of income tax in the year ending 31 December 2016.
Franking credits available for subsequent years based upon a tax rate of 30%. 9,998 6,034
The above amounts represent the balance of the franking account as at the end of the 2015 year, adjusted for:– franking credits that will arise from the payment of the current tax liability;– franking credits that will arise from current dividends receivable; and – franking debits that will arise from the payment of dividends provided at year end.
Impact on franking account balance of dividends declared but not recognised 6,622 6,112
A dividend reinvestment plan ("DRP") will not be in operation in respect of the final dividend.
NOTES TO THE FINANCIAL STATEMENTSFOR THE YEAR ENDED 31 DECEMBER 15 (CONTINUED)
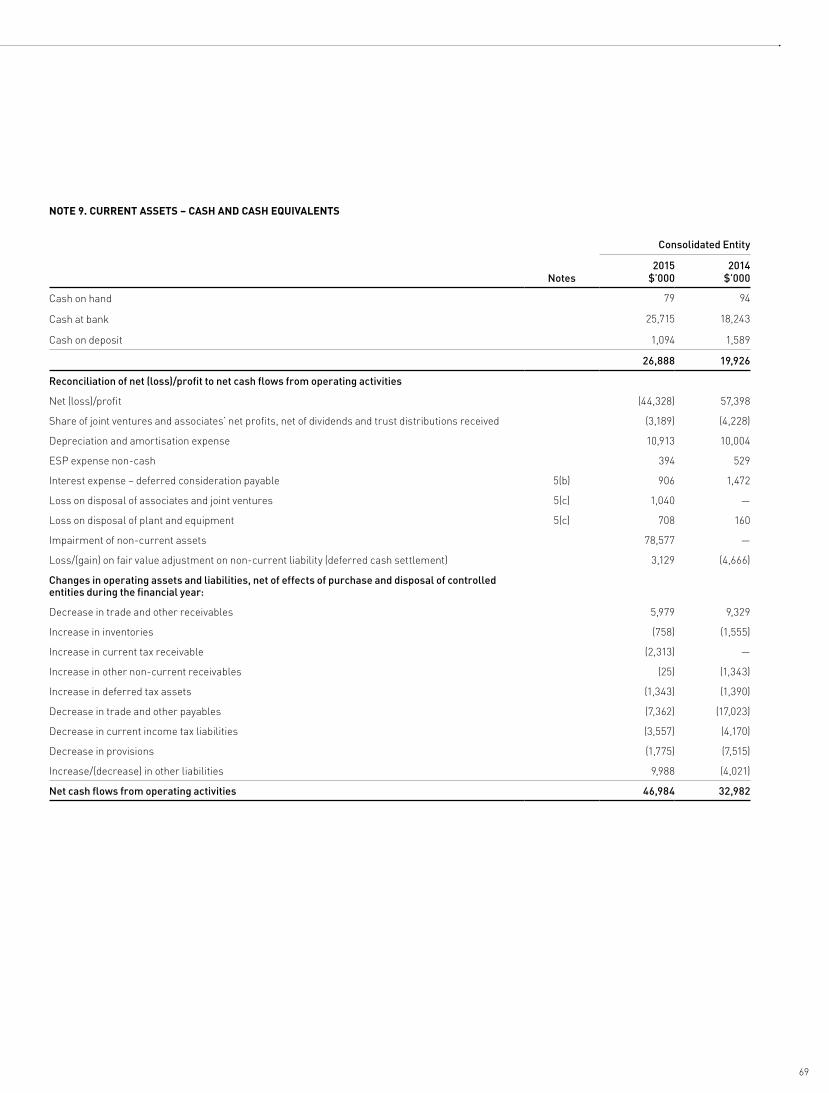
69
NOTE 9. CURRENT ASSETS – CASH AND CASH EQUIVALENTS
Consolidated Entity
Notes2015
$’0002014
$’000
Cash on hand 79 94
Cash at bank 25,715 18,243
Cash on deposit 1,094 1,589
26,888 19,926
Reconciliation of net (loss)/profit to net cash flows from operating activities
Net (loss)/profit (44,328) 57,398
Share of joint ventures and associates’ net profits, net of dividends and trust distributions received (3,189) (4,228)
Depreciation and amortisation expense 10,913 10,004
ESP expense non-cash 394 529
Interest expense – deferred consideration payable 5(b) 906 1,472
Loss on disposal of associates and joint ventures 5(c) 1,040 —
Loss on disposal of plant and equipment 5(c) 708 160
Impairment of non-current assets 78,577 —
Loss/(gain) on fair value adjustment on non-current liability (deferred cash settlement) 3,129 (4,666)
Changes in operating assets and liabilities, net of effects of purchase and disposal of controlled entities during the financial year:
Decrease in trade and other receivables 5,979 9,329
Increase in inventories (758) (1,555)
Increase in current tax receivable (2,313) —
Increase in other non-current receivables (25) (1,343)
Increase in deferred tax assets (1,343) (1,390)
Decrease in trade and other payables (7,362) (17,023)
Decrease in current income tax liabilities (3,557) (4,170)
Decrease in provisions (1,775) (7,515)
Increase/(decrease) in other liabilities 9,988 (4,021)
Net cash flows from operating activities 46,984 32,982
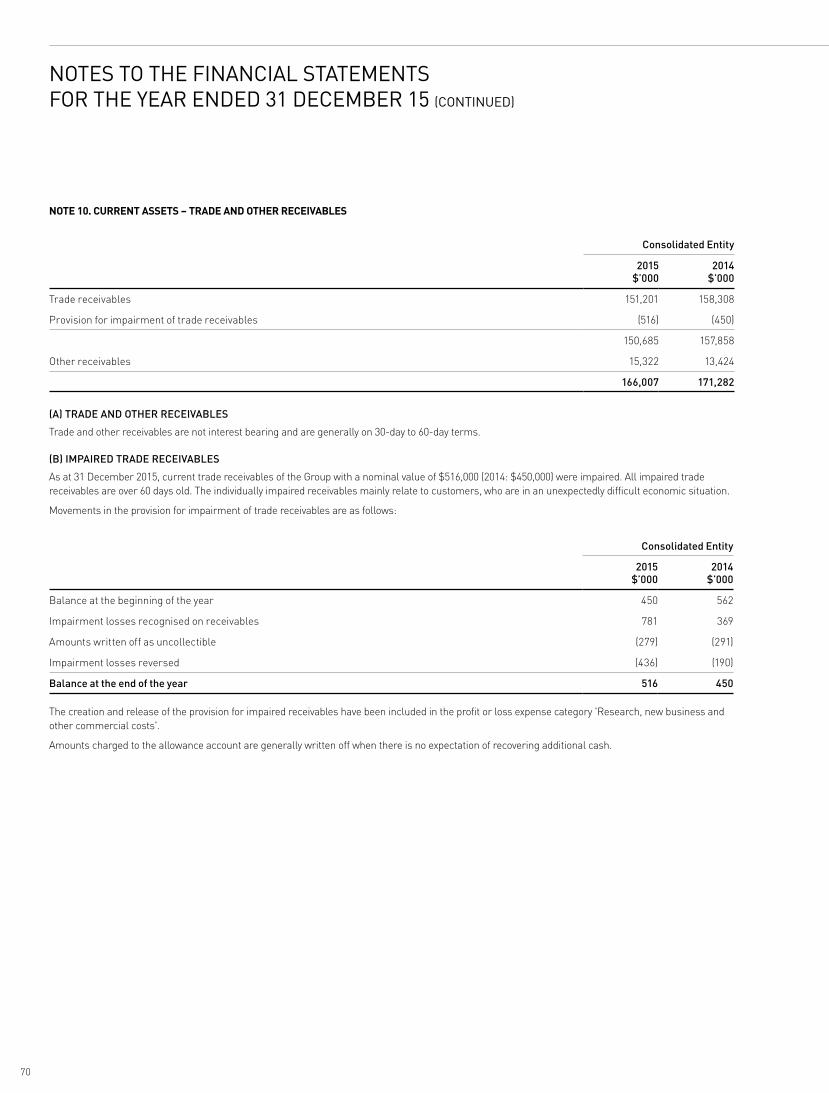
70
NOTE 10. CURRENT ASSETS – TRADE AND OTHER RECEIVABLES
Consolidated Entity
2015 $’000
2014 $’000
Trade receivables 151,201 158,308
Provision for impairment of trade receivables (516) (450)
150,685 157,858
Other receivables 15,322 13,424
166,007 171,282
(A) TRADE AND OTHER RECEIVABLES
Trade and other receivables are not interest bearing and are generally on 30-day to 60-day terms.
(B) IMPAIRED TRADE RECEIVABLES
As at 31 December 2015, current trade receivables of the Group with a nominal value of $516,000 (2014: $450,000) were impaired. All impaired trade receivables are over 60 days old. The individually impaired receivables mainly relate to customers, who are in an unexpectedly difficult economic situation.
Movements in the provision for impairment of trade receivables are as follows:
Consolidated Entity
2015 $’000
2014 $’000
Balance at the beginning of the year 450 562
Impairment losses recognised on receivables 781 369
Amounts written off as uncollectible (279) (291)
Impairment losses reversed (436) (190)
Balance at the end of the year 516 450
The creation and release of the provision for impaired receivables have been included in the profit or loss expense category 'Research, new business and other commercial costs'.
Amounts charged to the allowance account are generally written off when there is no expectation of recovering additional cash.
NOTES TO THE FINANCIAL STATEMENTSFOR THE YEAR ENDED 31 DECEMBER 15 (CONTINUED)

71
(C) PAST DUE BUT NOT IMPAIRED
As at 31 December 2015, trade receivables greater than 60 days of $12,751,000 (2014: $10,322,000) were past due but not impaired. These relate to a number of independent customers for whom there is no recent history of default. The ageing analysis of trade receivables is as follows:
Consolidated Entity
2015 $’000
2014 $’000
1-30 days 126,117 132,886
31-60 days 11,817 14,650
Greater than 60 days 12,751 10,322
150,685 157,858
There are no trade receivables that have had renegotiated terms that would otherwise, without that renegotiation, have been past due or impaired.
Based on the credit history of trade receivables not past due or past due and not impaired, the Group believes that these amounts will be received.
The other classes within trade and other receivables do not contain impaired assets and the Group believes that these amounts will be fully recovered.
(D) FOREIGN EXCHANGE AND INTEREST RATE RISK
Information about the Group’s exposure to foreign exchange risk and interest rate risk in relation to trade and other receivables is provided in Note 30.
(E) FAIR VALUE AND CREDIT RISK
Due to the short-term nature of trade receivables, their carrying amount is assumed to approximate their fair value.
The maximum exposure to credit risk at the reporting date is the carrying amount of each class of receivables mentioned above.
The Group does not hold any collateral as security. Refer to Note 30 for more information on the risk management policy of the Group and the credit quality of the Consolidated Entity’s trade receivables.
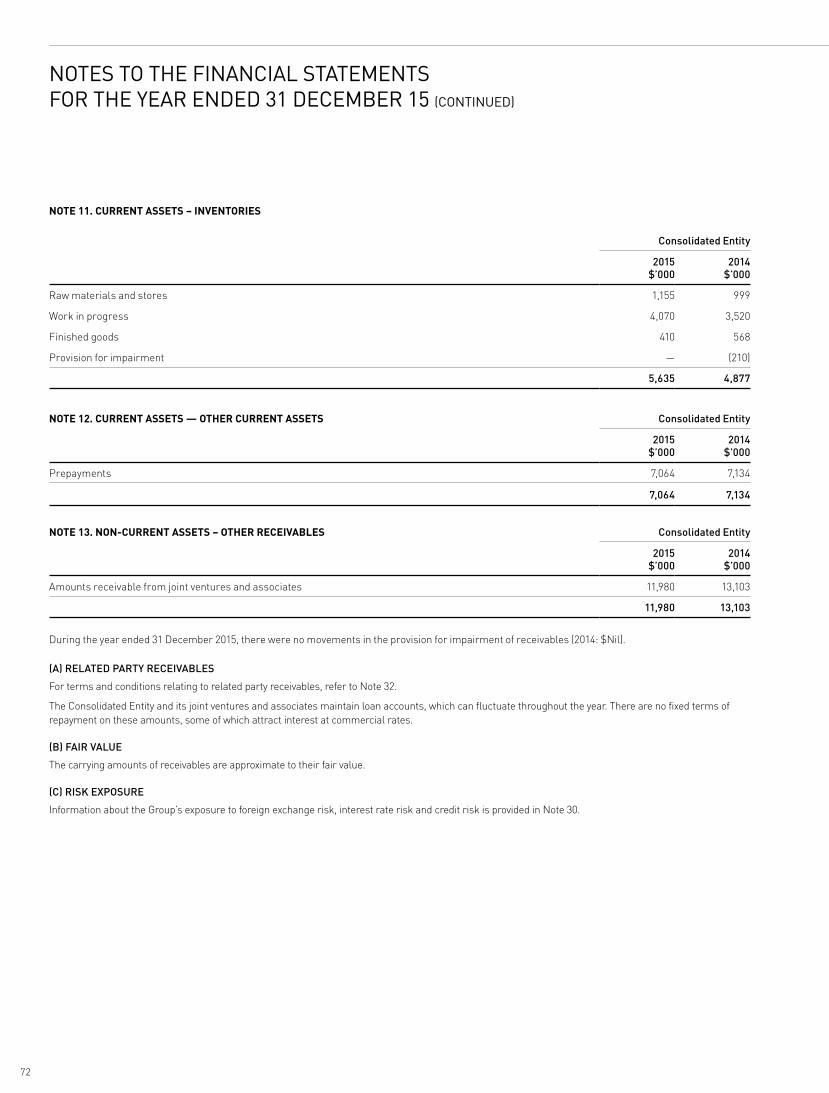
72
NOTE 11. CURRENT ASSETS – INVENTORIES
Consolidated Entity
2015 $’000
2014 $’000
Raw materials and stores 1,155 999
Work in progress 4,070 3,520
Finished goods 410 568
Provision for impairment — (210)
5,635 4,877
NOTE 12. CURRENT ASSETS — OTHER CURRENT ASSETS Consolidated Entity
2015 $’000
2014 $’000
Prepayments 7,064 7,134
7,064 7,134
NOTE 13. NON-CURRENT ASSETS – OTHER RECEIVABLES Consolidated Entity
2015 $’000
2014 $’000
Amounts receivable from joint ventures and associates 11,980 13,103
11,980 13,103
During the year ended 31 December 2015, there were no movements in the provision for impairment of receivables (2014: $Nil).
(A) RELATED PARTY RECEIVABLES
For terms and conditions relating to related party receivables, refer to Note 32.
The Consolidated Entity and its joint ventures and associates maintain loan accounts, which can fluctuate throughout the year. There are no fixed terms of repayment on these amounts, some of which attract interest at commercial rates.
(B) FAIR VALUE
The carrying amounts of receivables are approximate to their fair value.
(C) RISK EXPOSURE
Information about the Group’s exposure to foreign exchange risk, interest rate risk and credit risk is provided in Note 30.
NOTES TO THE FINANCIAL STATEMENTSFOR THE YEAR ENDED 31 DECEMBER 15 (CONTINUED)

73
NOTE 14. NON-CURRENT ASSETS – INVESTMENTS ACCOUNTED FOR USING THE EQUITY METHOD
Consolidated Entity
2015 $’000
2014 $’000
Investments in joint ventures and associates 90,131 121,577
Name Principal activityOwnership interest Country of
incorporation2015 2014
AFI Branding Solutions Pty Limited Promotional signage printing 50% 50% Australia
AFI Fabrications Pty Limited Promotional signage printing 45% 45% Australia
Amblique Pty Limited (i) Digital marketing — 40% Australia
Beyond Analysis Australia Pty Limited Data analytics 49% 49% Australia
Bohemia Communications Pty Limited Media planning 24% 24% Australia
Campaigns and Communications Group Pty Limited Campaign management 20% 20% Australia
CPR Vision Pte Limited Digital marketing 40% 40% Singapore
Ewa Heidelberg Pty Limited (formerly i2i Communications Pty Limited)
Dormant 49% 49% Australia
Feedback ASAP Pty Limited Mystery shopping 20.4% 20.4% Australia
Fusion Enterprises Pty Limited Digital marketing 49% 49% Australia
Houston Group Pty Limited Branding and design 40% 40% Australia
Ikon Perth Pty Limited Media planning 45% 45% Australia
J. Walter Thompson International Limited (New Zealand) Advertising 49% 49% New Zealand
Jamshop Pty Limited (i) Advertising — 40% Australia
Lakewood Holdings Pty Limited Dormant 50% 50% Australia
M Media Group Pty Limited and its subsidiaries Media buying 47.5% 47.5% Australia
Marketing Communications Holdings Australia Pty Limited and its subsidiaries
Advertising and communications 49% 49% Australia
Ogilvy Public Relations Worldwide Pty Limited and its subsidiaries
Public relations 49% 49% Australia
Paragon Design Group Pty Limited Advertising 49% 49% Australia
Purple Communications Australia Pty Limited Public relations 49% 44% Australia
Spinach Advertising Pty Limited Advertising 20% 20% Australia
TaguchiMarketing Pty Limited E-mail marketing 20% 20% Australia
TCO Pty Limited (i) Branded content production — 40% Australia
The Origin Agency Pty Limited Public relations 49% 49% Australia
(i) The Company disposed of all of its shares in the entity during the year. The loss on disposal was immaterial.
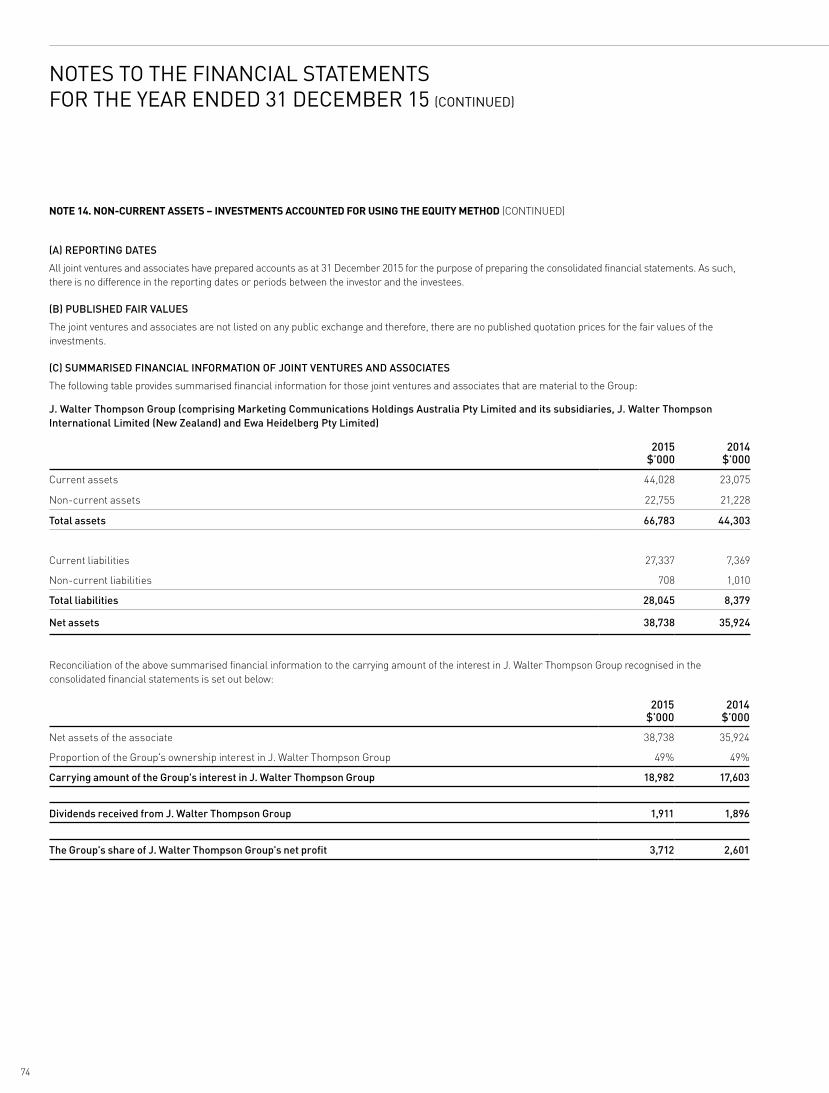
74
(A) REPORTING DATES
All joint ventures and associates have prepared accounts as at 31 December 2015 for the purpose of preparing the consolidated financial statements. As such, there is no difference in the reporting dates or periods between the investor and the investees.
(B) PUBLISHED FAIR VALUES
The joint ventures and associates are not listed on any public exchange and therefore, there are no published quotation prices for the fair values of the investments.
(C) SUMMARISED FINANCIAL INFORMATION OF JOINT VENTURES AND ASSOCIATES
The following table provides summarised financial information for those joint ventures and associates that are material to the Group:
J. Walter Thompson Group (comprising Marketing Communications Holdings Australia Pty Limited and its subsidiaries, J. Walter Thompson International Limited (New Zealand) and Ewa Heidelberg Pty Limited)
2015 $’000
2014 $’000
Current assets 44,028 23,075
Non-current assets 22,755 21,228
Total assets 66,783 44,303
Current liabilities 27,337 7,369
Non-current liabilities 708 1,010
Total liabilities 28,045 8,379
Net assets 38,738 35,924
Reconciliation of the above summarised financial information to the carrying amount of the interest in J. Walter Thompson Group recognised in the consolidated financial statements is set out below:
2015 $’000
2014 $’000
Net assets of the associate 38,738 35,924
Proportion of the Group's ownership interest in J. Walter Thompson Group 49% 49%
Carrying amount of the Group's interest in J. Walter Thompson Group 18,982 17,603
Dividends received from J. Walter Thompson Group 1,911 1,896
The Group's share of J. Walter Thompson Group's net profit 3,712 2,601
NOTE 14. NON-CURRENT ASSETS – INVESTMENTS ACCOUNTED FOR USING THE EQUITY METHOD (CONTINUED)
NOTES TO THE FINANCIAL STATEMENTSFOR THE YEAR ENDED 31 DECEMBER 15 (CONTINUED)

75
M Media Group (comprising M Media Group Pty Limited and its subsidiaries)
2015 $’000
2014 $’000
Current assets 172,175 160,285
Non-current assets 4,196 5,135
Total assets 176,371 165,420
Current liabilities 141,360 134,362
Non-current liabilities 1,123 403
Total liabilities 142,483 134,765
Net assets 33,888 30,655
Reconciliation of the above summarised financial information to the carrying amount of the interest in M Media Group recognised in the consolidated financial statements is set out below:
2015 $’000
2014 $’000
Net assets of the associate 33,888 30,655
Proportion of the Group's ownership interest in M Media Group 47.5% 47.5%
Carrying amount of the Group's interest in M Media Group 16,097 14,561
Dividends received from M Media Group 5,295 3,325
The Group's share of M Media Group's net profit 5,689 5,224
In addition to the material interests in associates disclosed above, the Group also has interests in a number of individually immaterial joint ventures and associates that are accounted for using the equity method.
Consolidated Entity
2015 $’000
2014 $’000
Aggregate carrying amount of individually immaterial joint ventures and associates 14,369 14,843
Aggregate amounts of the Group's share of:
Profit from continuing operations 4,663 4,737Other comprehensive income — —Total comprehensive income 4,663 4,737
(D) DIVIDENDS AND TRUST DISTRIBUTIONS RECEIVED
During the year, the Consolidated Entity received dividends and trust distributions of $10,874,759 (2014: $8,334,018) from its joint ventures and associates.
(E) COMMITMENTS
The Consolidated Entity’s share of the joint ventures and associates’ commitments is disclosed in Note 35.
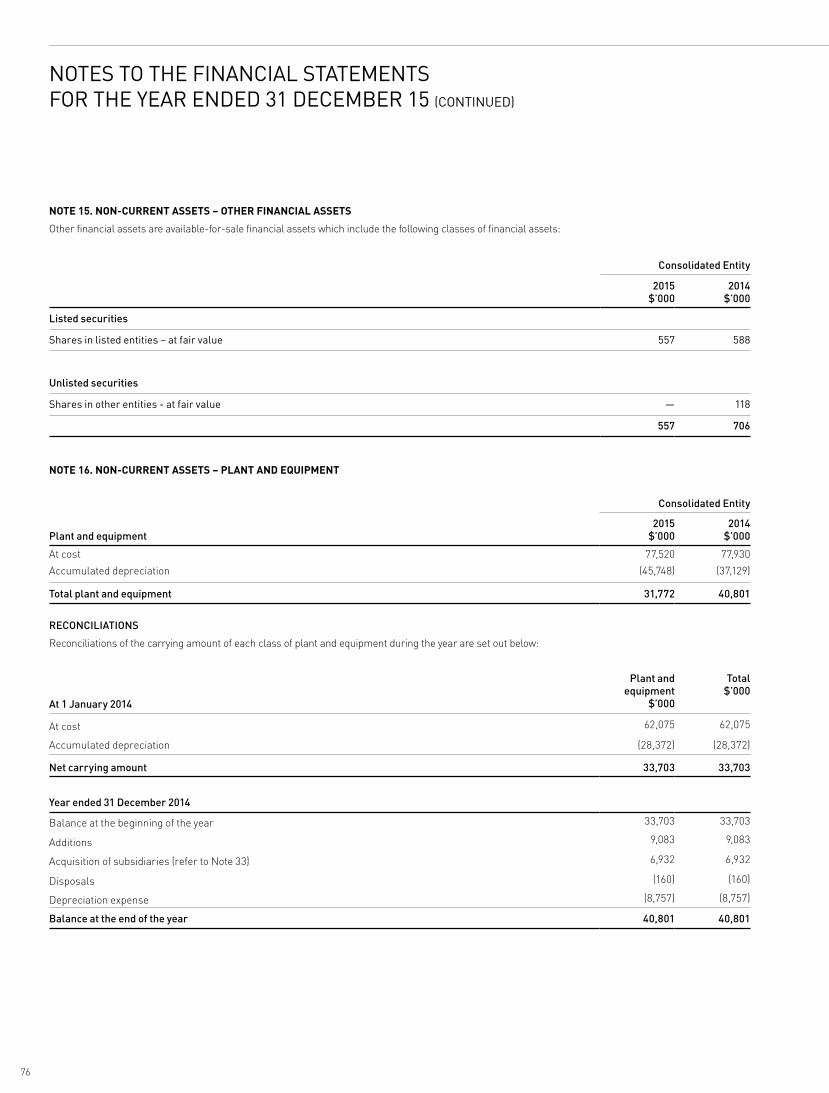
76
NOTE 15. NON-CURRENT ASSETS – OTHER FINANCIAL ASSETS
Other financial assets are available-for-sale financial assets which include the following classes of financial assets:
Consolidated Entity
2015 $’000
2014 $’000
Listed securities
Shares in listed entities – at fair value 557 588
Unlisted securities
Shares in other entities - at fair value — 118
557 706
NOTE 16. NON-CURRENT ASSETS – PLANT AND EQUIPMENT
Consolidated Entity
Plant and equipment2015
$’0002014
$’000
At cost 77,520 77,930
Accumulated depreciation (45,748) (37,129)
Total plant and equipment 31,772 40,801
RECONCILIATIONS
Reconciliations of the carrying amount of each class of plant and equipment during the year are set out below:
Plant and equipment
$’000
Total $’000
At 1 January 2014
At cost 62,075 62,075
Accumulated depreciation (28,372) (28,372)
Net carrying amount 33,703 33,703
Year ended 31 December 2014
Balance at the beginning of the year 33,703 33,703
Additions 9,083 9,083
Acquisition of subsidiaries (refer to Note 33) 6,932 6,932
Disposals (160) (160)
Depreciation expense (8,757) (8,757)
Balance at the end of the year 40,801 40,801
NOTES TO THE FINANCIAL STATEMENTSFOR THE YEAR ENDED 31 DECEMBER 15 (CONTINUED)
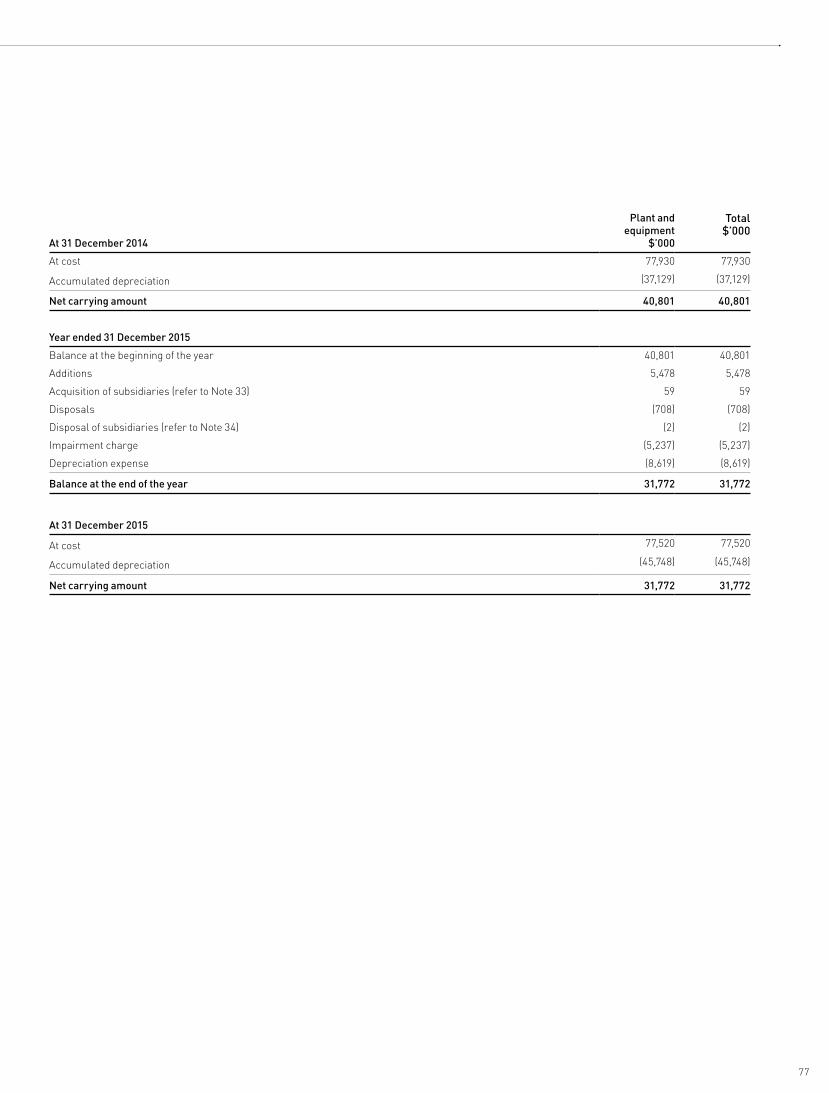
77
Plant and equipment
$’000
Total$’000
At 31 December 2014
At cost 77,930 77,930
Accumulated depreciation (37,129) (37,129)
Net carrying amount 40,801 40,801
Year ended 31 December 2015
Balance at the beginning of the year 40,801 40,801
Additions 5,478 5,478
Acquisition of subsidiaries (refer to Note 33) 59 59
Disposals (708) (708)
Disposal of subsidiaries (refer to Note 34) (2) (2)
Impairment charge (5,237) (5,237)
Depreciation expense (8,619) (8,619)
Balance at the end of the year 31,772 31,772
At 31 December 2015
At cost 77,520 77,520
Accumulated depreciation (45,748) (45,748)
Net carrying amount 31,772 31,772
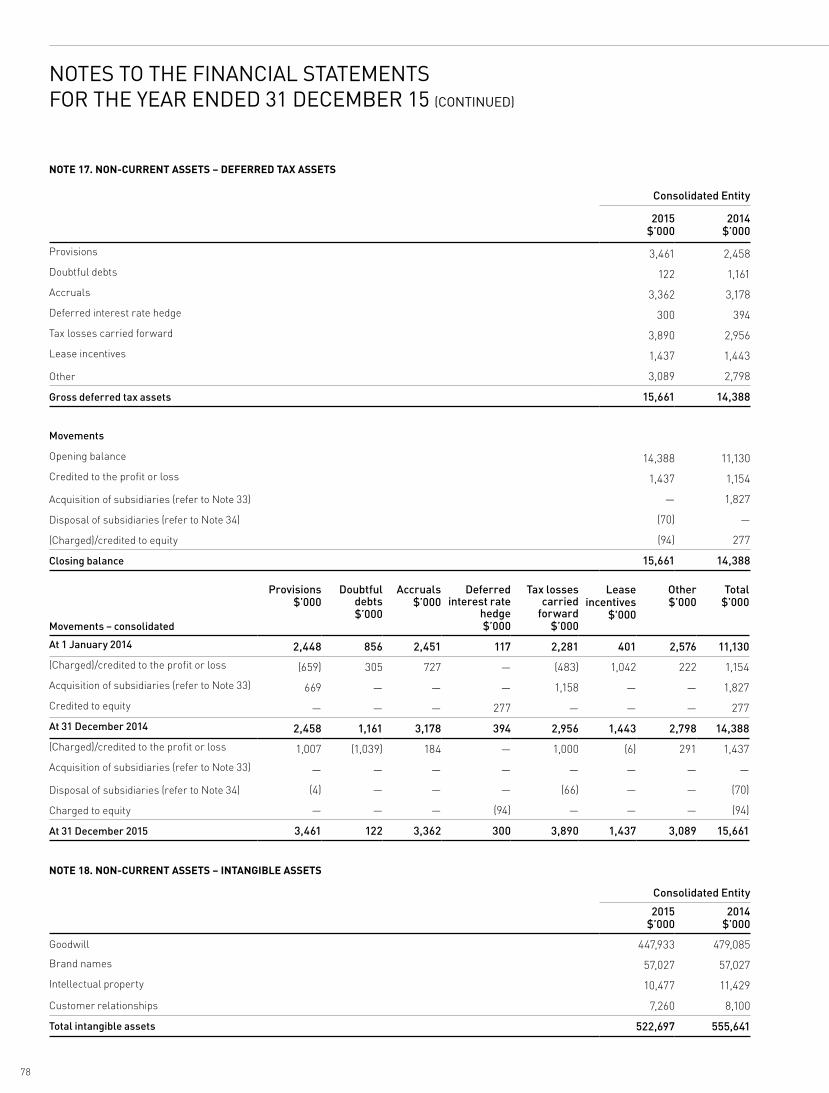
78
NOTE 17. NON-CURRENT ASSETS – DEFERRED TAX ASSETS
Consolidated Entity
2015 $’000
2014 $’000
Provisions 3,461 2,458
Doubtful debts 122 1,161
Accruals 3,362 3,178
Deferred interest rate hedge 300 394
Tax losses carried forward 3,890 2,956
Lease incentives 1,437 1,443
Other 3,089 2,798
Gross deferred tax assets 15,661 14,388
Movements
Opening balance 14,388 11,130
Credited to the profit or loss 1,437 1,154
Acquisition of subsidiaries (refer to Note 33) — 1,827
Disposal of subsidiaries (refer to Note 34) (70) —
(Charged)/credited to equity (94) 277
Closing balance 15,661 14,388
Movements – consolidated
Provisions$’000
Doubtful debts$’000
Accruals$’000
Deferred interest rate
hedge$’000
Tax losses carried
forward$’000
Lease incentives
$'000
Other$’000
Total$’000
At 1 January 2014 2,448 856 2,451 117 2,281 401 2,576 11,130
(Charged)/credited to the profit or loss (659) 305 727 — (483) 1,042 222 1,154
Acquisition of subsidiaries (refer to Note 33) 669 — — — 1,158 — — 1,827
Credited to equity — — — 277 — — — 277
At 31 December 2014 2,458 1,161 3,178 394 2,956 1,443 2,798 14,388
(Charged)/credited to the profit or loss 1,007 (1,039) 184 — 1,000 (6) 291 1,437
Acquisition of subsidiaries (refer to Note 33) — — — — — — — —
Disposal of subsidiaries (refer to Note 34) (4) — — — (66) — — (70)
Charged to equity — — — (94) — — — (94)
At 31 December 2015 3,461 122 3,362 300 3,890 1,437 3,089 15,661
NOTE 18. NON-CURRENT ASSETS – INTANGIBLE ASSETS
Consolidated Entity
2015 $’000
2014 $’000
Goodwill 447,933 479,085
Brand names 57,027 57,027
Intellectual property 10,477 11,429
Customer relationships 7,260 8,100
Total intangible assets 522,697 555,641
NOTES TO THE FINANCIAL STATEMENTSFOR THE YEAR ENDED 31 DECEMBER 15 (CONTINUED)
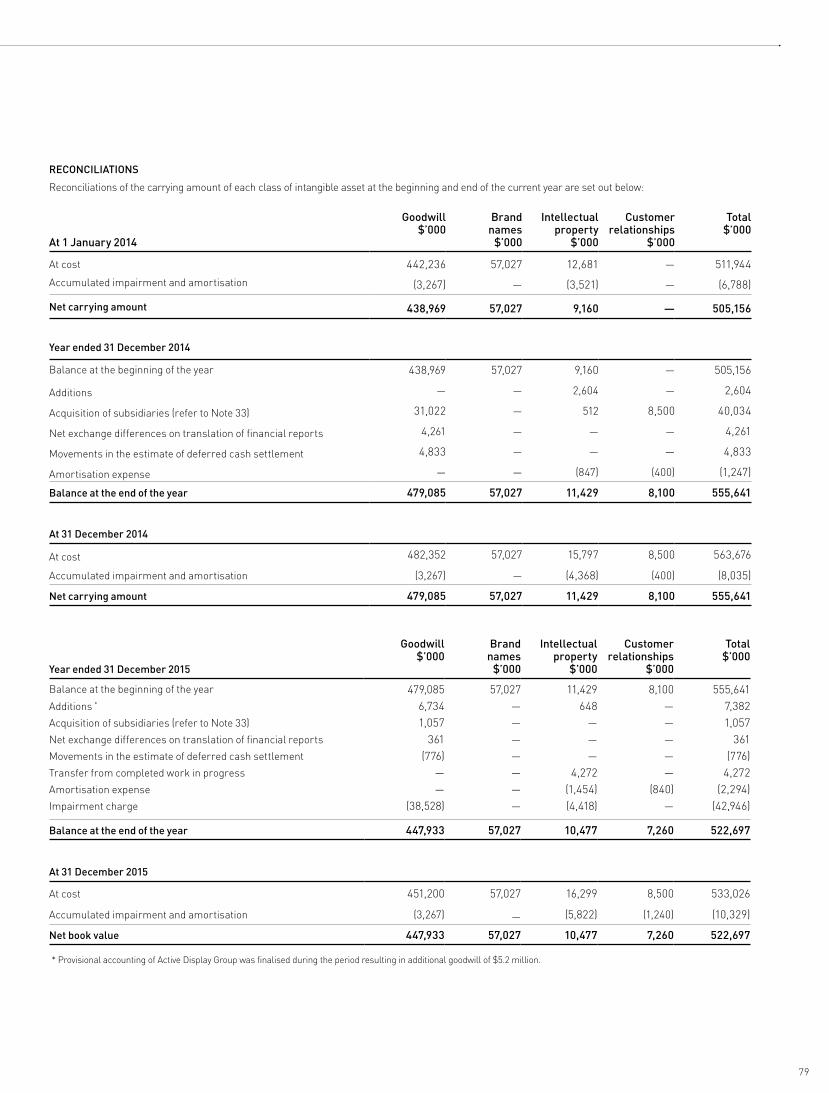
79
RECONCILIATIONS
Reconciliations of the carrying amount of each class of intangible asset at the beginning and end of the current year are set out below:
At 1 January 2014
Goodwill $’000
Brand names
$’000
Intellectual property
$’000
Customer relationships
$’000
Total $’000
At cost 442,236 57,027 12,681 — 511,944
Accumulated impairment and amortisation (3,267) — (3,521) — (6,788)
Net carrying amount 438,969 57,027 9,160 — 505,156
Year ended 31 December 2014
Balance at the beginning of the year 438,969 57,027 9,160 — 505,156
Additions — — 2,604 — 2,604
Acquisition of subsidiaries (refer to Note 33) 31,022 — 512 8,500 40,034
Net exchange differences on translation of financial reports 4,261 — — — 4,261
Movements in the estimate of deferred cash settlement 4,833 — — — 4,833
Amortisation expense — — (847) (400) (1,247)
Balance at the end of the year 479,085 57,027 11,429 8,100 555,641
At 31 December 2014
At cost 482,352 57,027 15,797 8,500 563,676
Accumulated impairment and amortisation (3,267) — (4,368) (400) (8,035)
Net carrying amount 479,085 57,027 11,429 8,100 555,641
Year ended 31 December 2015
Goodwill $’000
Brand names
$’000
Intellectual property
$’000
Customer relationships
$’000
Total $’000
Balance at the beginning of the year 479,085 57,027 11,429 8,100 555,641Additions * 6,734 — 648 — 7,382Acquisition of subsidiaries (refer to Note 33) 1,057 — — — 1,057Net exchange differences on translation of financial reports 361 — — — 361Movements in the estimate of deferred cash settlement (776) — — — (776)Transfer from completed work in progress — — 4,272 — 4,272Amortisation expense — — (1,454) (840) (2,294)Impairment charge (38,528) — (4,418) — (42,946)
Balance at the end of the year 447,933 57,027 10,477 7,260 522,697
At 31 December 2015
At cost 451,200 57,027 16,299 8,500 533,026
Accumulated impairment and amortisation (3,267) — (5,822) (1,240) (10,329)
Net book value 447,933 57,027 10,477 7,260 522,697
* Provisional accounting of Active Display Group was finalised during the period resulting in additional goodwill of $5.2 million.
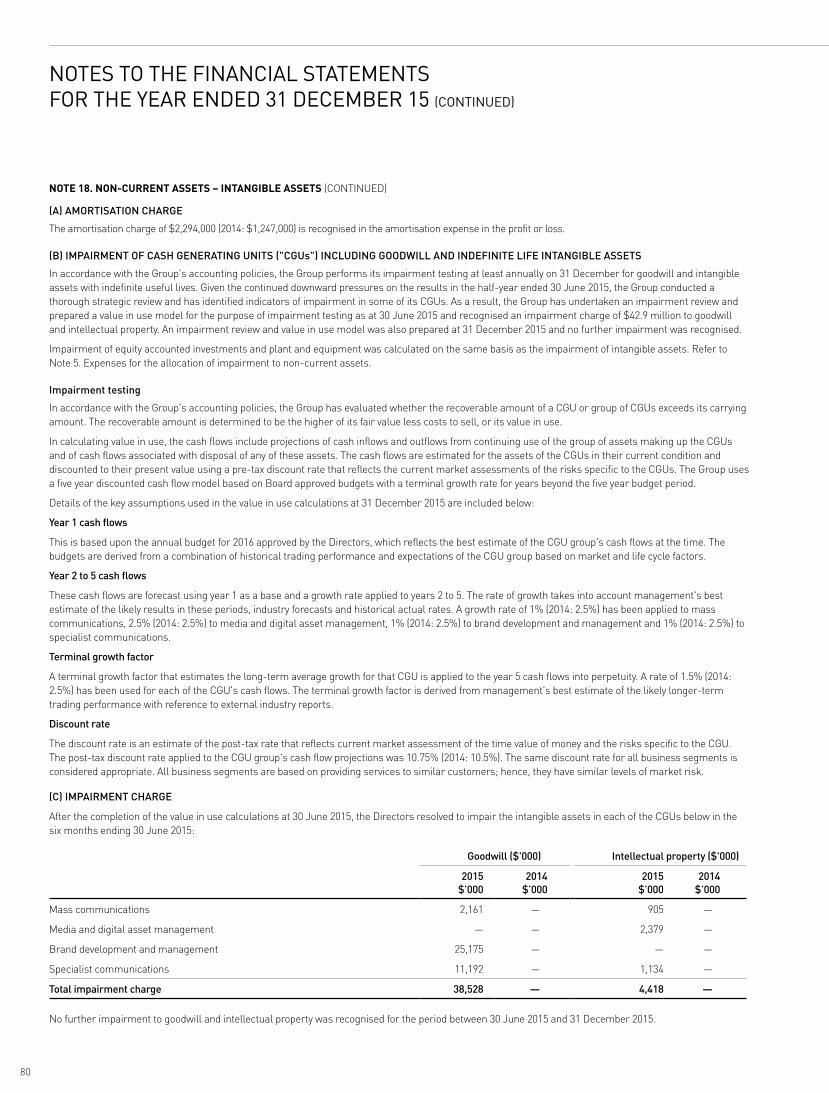
80
(A) AMORTISATION CHARGE
The amortisation charge of $2,294,000 (2014: $1,247,000) is recognised in the amortisation expense in the profit or loss.
(B) IMPAIRMENT OF CASH GENERATING UNITS ("CGUs") INCLUDING GOODWILL AND INDEFINITE LIFE INTANGIBLE ASSETS
In accordance with the Group's accounting policies, the Group performs its impairment testing at least annually on 31 December for goodwill and intangible assets with indefinite useful lives. Given the continued downward pressures on the results in the half-year ended 30 June 2015, the Group conducted a thorough strategic review and has identified indicators of impairment in some of its CGUs. As a result, the Group has undertaken an impairment review and prepared a value in use model for the purpose of impairment testing as at 30 June 2015 and recognised an impairment charge of $42.9 million to goodwill and intellectual property. An impairment review and value in use model was also prepared at 31 December 2015 and no further impairment was recognised.
Impairment of equity accounted investments and plant and equipment was calculated on the same basis as the impairment of intangible assets. Refer to Note 5. Expenses for the allocation of impairment to non-current assets.
Impairment testing
In accordance with the Group's accounting policies, the Group has evaluated whether the recoverable amount of a CGU or group of CGUs exceeds its carrying amount. The recoverable amount is determined to be the higher of its fair value less costs to sell, or its value in use.
In calculating value in use, the cash flows include projections of cash inflows and outflows from continuing use of the group of assets making up the CGUs and of cash flows associated with disposal of any of these assets. The cash flows are estimated for the assets of the CGUs in their current condition and discounted to their present value using a pre-tax discount rate that reflects the current market assessments of the risks specific to the CGUs. The Group uses a five year discounted cash flow model based on Board approved budgets with a terminal growth rate for years beyond the five year budget period.
Details of the key assumptions used in the value in use calculations at 31 December 2015 are included below:
Year 1 cash flows
This is based upon the annual budget for 2016 approved by the Directors, which reflects the best estimate of the CGU group's cash flows at the time. The budgets are derived from a combination of historical trading performance and expectations of the CGU group based on market and life cycle factors.
Year 2 to 5 cash flows
These cash flows are forecast using year 1 as a base and a growth rate applied to years 2 to 5. The rate of growth takes into account management's best estimate of the likely results in these periods, industry forecasts and historical actual rates. A growth rate of 1% (2014: 2.5%) has been applied to mass communications, 2.5% (2014: 2.5%) to media and digital asset management, 1% (2014: 2.5%) to brand development and management and 1% (2014: 2.5%) to specialist communications.
Terminal growth factor
A terminal growth factor that estimates the long-term average growth for that CGU is applied to the year 5 cash flows into perpetuity. A rate of 1.5% (2014: 2.5%) has been used for each of the CGU's cash flows. The terminal growth factor is derived from management's best estimate of the likely longer-term trading performance with reference to external industry reports.
Discount rate
The discount rate is an estimate of the post-tax rate that reflects current market assessment of the time value of money and the risks specific to the CGU. The post-tax discount rate applied to the CGU group's cash flow projections was 10.75% (2014: 10.5%). The same discount rate for all business segments is considered appropriate. All business segments are based on providing services to similar customers; hence, they have similar levels of market risk.
(C) IMPAIRMENT CHARGE
After the completion of the value in use calculations at 30 June 2015, the Directors resolved to impair the intangible assets in each of the CGUs below in the six months ending 30 June 2015:
Goodwill ($'000) Intellectual property ($'000)
2015 $’000
2014 $’000
2015 $’000
2014 $’000
Mass communications 2,161 — 905 —
Media and digital asset management — — 2,379 —
Brand development and management 25,175 — — —
Specialist communications 11,192 — 1,134 —
Total impairment charge 38,528 — 4,418 —
No further impairment to goodwill and intellectual property was recognised for the period between 30 June 2015 and 31 December 2015.
NOTE 18. NON-CURRENT ASSETS – INTANGIBLE ASSETS (CONTINUED)
NOTES TO THE FINANCIAL STATEMENTSFOR THE YEAR ENDED 31 DECEMBER 15 (CONTINUED)
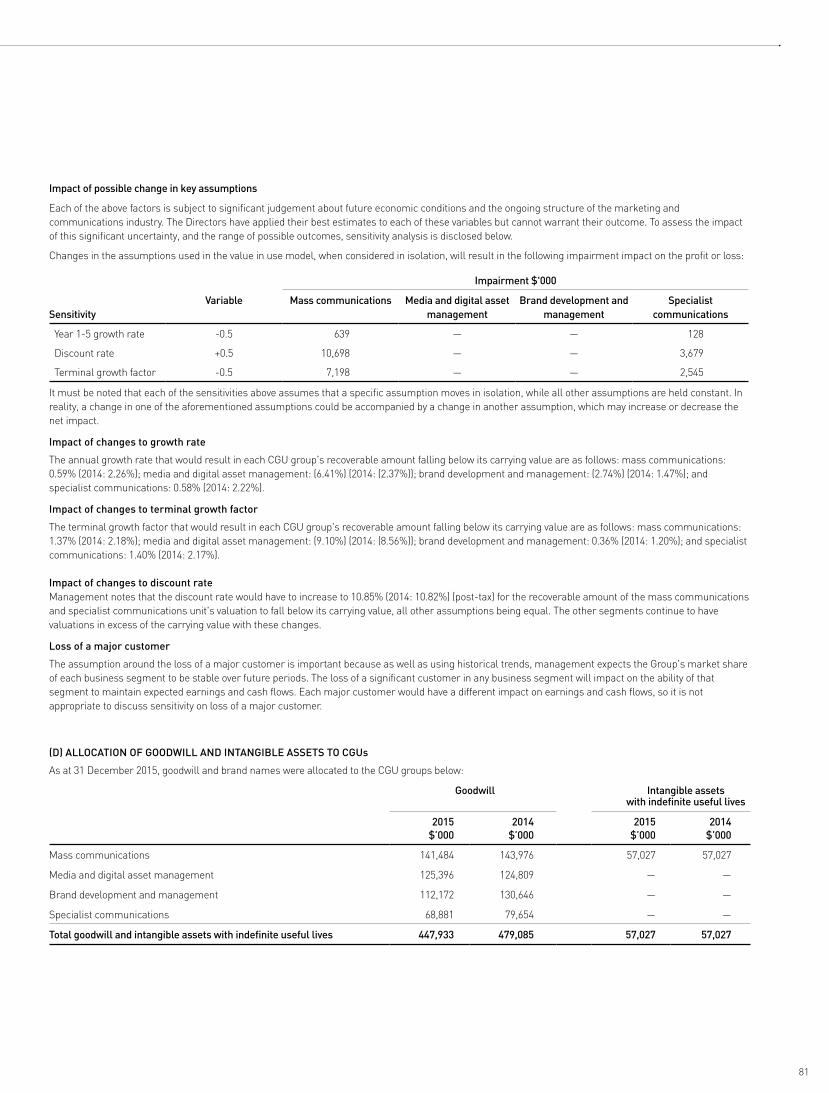
81
Impact of possible change in key assumptions
Each of the above factors is subject to significant judgement about future economic conditions and the ongoing structure of the marketing and communications industry. The Directors have applied their best estimates to each of these variables but cannot warrant their outcome. To assess the impact of this significant uncertainty, and the range of possible outcomes, sensitivity analysis is disclosed below.
Changes in the assumptions used in the value in use model, when considered in isolation, will result in the following impairment impact on the profit or loss:
Impairment $'000
SensitivityVariable Mass communications Media and digital asset
management Brand development and
management Specialist
communications
Year 1-5 growth rate -0.5 639 — — 128
Discount rate +0.5 10,698 — — 3,679
Terminal growth factor -0.5 7,198 — — 2,545
It must be noted that each of the sensitivities above assumes that a specific assumption moves in isolation, while all other assumptions are held constant. In reality, a change in one of the aforementioned assumptions could be accompanied by a change in another assumption, which may increase or decrease the net impact.
Impact of changes to growth rate
The annual growth rate that would result in each CGU group's recoverable amount falling below its carrying value are as follows: mass communications: 0.59% (2014: 2.26%); media and digital asset management: (6.41%) (2014: (2.37%)); brand development and management: (2.74%) (2014: 1.47%); and specialist communications: 0.58% (2014: 2.22%).
Impact of changes to terminal growth factor
The terminal growth factor that would result in each CGU group's recoverable amount falling below its carrying value are as follows: mass communications: 1.37% (2014: 2.18%); media and digital asset management: (9.10%) (2014: (8.56%)); brand development and management: 0.36% (2014: 1.20%); and specialist communications: 1.40% (2014: 2.17%).
Impact of changes to discount rate Management notes that the discount rate would have to increase to 10.85% (2014: 10.82%) (post-tax) for the recoverable amount of the mass communications and specialist communications unit's valuation to fall below its carrying value, all other assumptions being equal. The other segments continue to have valuations in excess of the carrying value with these changes.
Loss of a major customer
The assumption around the loss of a major customer is important because as well as using historical trends, management expects the Group's market share of each business segment to be stable over future periods. The loss of a significant customer in any business segment will impact on the ability of that segment to maintain expected earnings and cash flows. Each major customer would have a different impact on earnings and cash flows, so it is not appropriate to discuss sensitivity on loss of a major customer.
(D) ALLOCATION OF GOODWILL AND INTANGIBLE ASSETS TO CGUs
As at 31 December 2015, goodwill and brand names were allocated to the CGU groups below:
Goodwill Intangible assets with indefinite useful lives
2015 $’000
2014 $’000
2015 $’000
2014 $’000
Mass communications 141,484 143,976 57,027 57,027
Media and digital asset management 125,396 124,809 — —
Brand development and management 112,172 130,646 — —
Specialist communications 68,881 79,654 — —
Total goodwill and intangible assets with indefinite useful lives 447,933 479,085 57,027 57,027

82
NOTE 19. NON-CURRENT ASSETS – OTHER NON-CURRENT ASSETS
Consolidated Entity
2015 $’000
2014 $’000
Prepayments 2,384 2,208
2,384 2,208
NOTE 20. CURRENT LIABILITIES – TRADE AND OTHER PAYABLES
Consolidated Entity
2015 $’000
2014 $’000
Trade payables 100,916 109,619
Interest rate hedge liabilities (refer to Note 20(d)) 1,001 1,314
Sundry and other payables 36,323 32,376
Amounts payable to other related parties 226 453
Deferred cash settlement for controlled entities and associates acquired 8,023 16,871
Deferred income 11,791 2,251
158,280 162,884
(A) RELATED PARTY PAYABLESFor terms and conditions relating to related party payables, refer to Note 32.
(B) TRADE, SUNDRY AND OTHER PAYABLES
Trade payables are not interest bearing and are normally settled on 60-day terms. Sundry and other payables are also not interest bearing and have an average term of two months.
(C) NET GST PAYABLES
The GST payables and receivables are netted. Net GST payables are remitted to the appropriate taxation authority as required.
(D) INTEREST RATE HEDGE LIABILITIES
The fair value of the interest rate hedge derivatives held at 31 December 2015 was as follows:
Consolidated Entity
2015 $’000
2014 $’000
Total mark to market liability 1,001 1,314
Further details relating to the Group's derivative financial instruments are outlined in Note 30.
(E) INSTRUMENTS USED BY THE GROUP
The Group is party to derivative financial instruments in the normal course of business in order to hedge exposure to fluctuations in interest rates in accordance with the Group’s financial risk management policies (refer to Note 30).
Interest rate swap contracts – cash flow hedges
Bank loans of the Group currently bear an average variable interest rate of 2.39% (2014: 2.94%) per annum. It is policy to protect part of the loans from exposure to increasing interest rates. Accordingly, the Group has entered into interest rate swap contracts under which it is obliged to receive interest at variable rates and to pay interest at fixed rates.
The fixed interest rates range between 2.10% and 3.11% (2014: 2.59% and 3.11%) per annum.
NOTES TO THE FINANCIAL STATEMENTSFOR THE YEAR ENDED 31 DECEMBER 15 (CONTINUED)
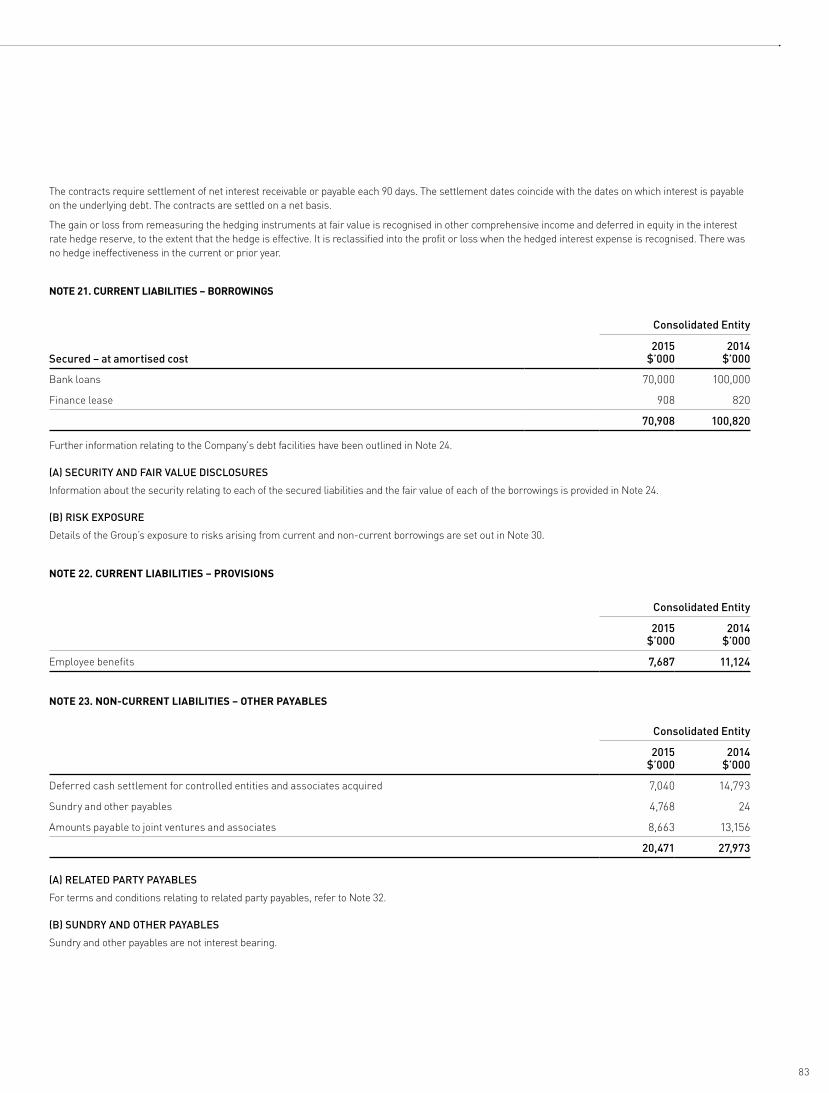
83
The contracts require settlement of net interest receivable or payable each 90 days. The settlement dates coincide with the dates on which interest is payable on the underlying debt. The contracts are settled on a net basis.
The gain or loss from remeasuring the hedging instruments at fair value is recognised in other comprehensive income and deferred in equity in the interest rate hedge reserve, to the extent that the hedge is effective. It is reclassified into the profit or loss when the hedged interest expense is recognised. There was no hedge ineffectiveness in the current or prior year.
NOTE 21. CURRENT LIABILITIES – BORROWINGS
Consolidated Entity
Secured – at amortised cost2015
$’0002014
$’000
Bank loans 70,000 100,000
Finance lease 908 820
70,908 100,820
Further information relating to the Company's debt facilities have been outlined in Note 24.
(A) SECURITY AND FAIR VALUE DISCLOSURES
Information about the security relating to each of the secured liabilities and the fair value of each of the borrowings is provided in Note 24.
(B) RISK EXPOSURE
Details of the Group’s exposure to risks arising from current and non‑current borrowings are set out in Note 30.
NOTE 22. CURRENT LIABILITIES – PROVISIONS
Consolidated Entity
2015 $’000
2014 $’000
Employee benefits 7,687 11,124
NOTE 23. NON-CURRENT LIABILITIES – OTHER PAYABLES
Consolidated Entity
2015 $’000
2014 $’000
Deferred cash settlement for controlled entities and associates acquired 7,040 14,793
Sundry and other payables 4,768 24
Amounts payable to joint ventures and associates 8,663 13,156
20,471 27,973
(A) RELATED PARTY PAYABLES
For terms and conditions relating to related party payables, refer to Note 32.
(B) SUNDRY AND OTHER PAYABLES
Sundry and other payables are not interest bearing.
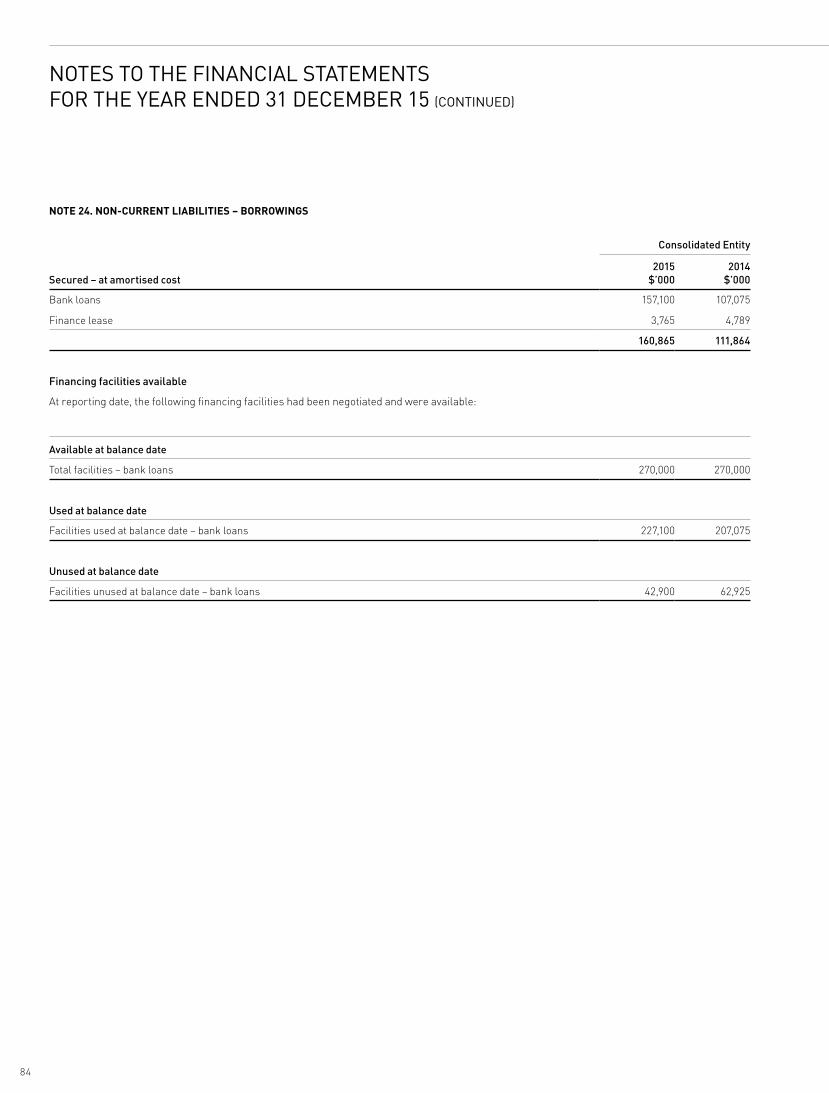
84
NOTE 24. NON-CURRENT LIABILITIES – BORROWINGS
Consolidated Entity
Secured – at amortised cost2015
$’0002014
$’000
Bank loans 157,100 107,075
Finance lease 3,765 4,789
160,865 111,864
Financing facilities available
At reporting date, the following financing facilities had been negotiated and were available:
Available at balance date
Total facilities – bank loans 270,000 270,000
Used at balance date
Facilities used at balance date – bank loans 227,100 207,075
Unused at balance date
Facilities unused at balance date – bank loans 42,900 62,925
NOTES TO THE FINANCIAL STATEMENTSFOR THE YEAR ENDED 31 DECEMBER 15 (CONTINUED)
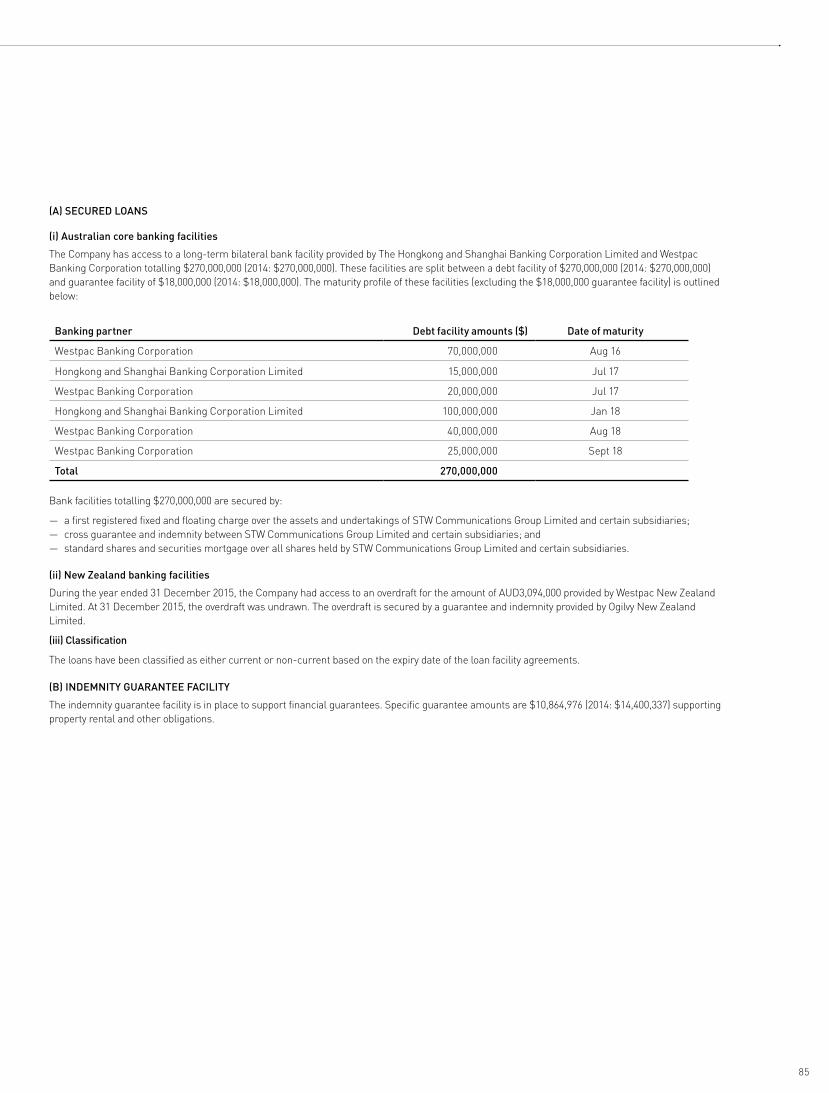
85
(A) SECURED LOANS
(i) Australian core banking facilities
The Company has access to a long-term bilateral bank facility provided by The Hongkong and Shanghai Banking Corporation Limited and Westpac Banking Corporation totalling $270,000,000 (2014: $270,000,000). These facilities are split between a debt facility of $270,000,000 (2014: $270,000,000) and guarantee facility of $18,000,000 (2014: $18,000,000). The maturity profile of these facilities (excluding the $18,000,000 guarantee facility) is outlined below:
Banking partner Debt facility amounts ($) Date of maturity
Westpac Banking Corporation 70,000,000 Aug 16
Hongkong and Shanghai Banking Corporation Limited 15,000,000 Jul 17
Westpac Banking Corporation 20,000,000 Jul 17
Hongkong and Shanghai Banking Corporation Limited 100,000,000 Jan 18
Westpac Banking Corporation 40,000,000 Aug 18
Westpac Banking Corporation 25,000,000 Sept 18
Total 270,000,000
Bank facilities totalling $270,000,000 are secured by:
— a first registered fixed and floating charge over the assets and undertakings of STW Communications Group Limited and certain subsidiaries; — cross guarantee and indemnity between STW Communications Group Limited and certain subsidiaries; and — standard shares and securities mortgage over all shares held by STW Communications Group Limited and certain subsidiaries.
(ii) New Zealand banking facilities
During the year ended 31 December 2015, the Company had access to an overdraft for the amount of AUD3,094,000 provided by Westpac New Zealand Limited. At 31 December 2015, the overdraft was undrawn. The overdraft is secured by a guarantee and indemnity provided by Ogilvy New Zealand Limited.
(iii) Classification
The loans have been classified as either current or non-current based on the expiry date of the loan facility agreements.
(B) INDEMNITY GUARANTEE FACILITY
The indemnity guarantee facility is in place to support financial guarantees. Specific guarantee amounts are $10,864,976 (2014: $14,400,337) supporting property rental and other obligations.
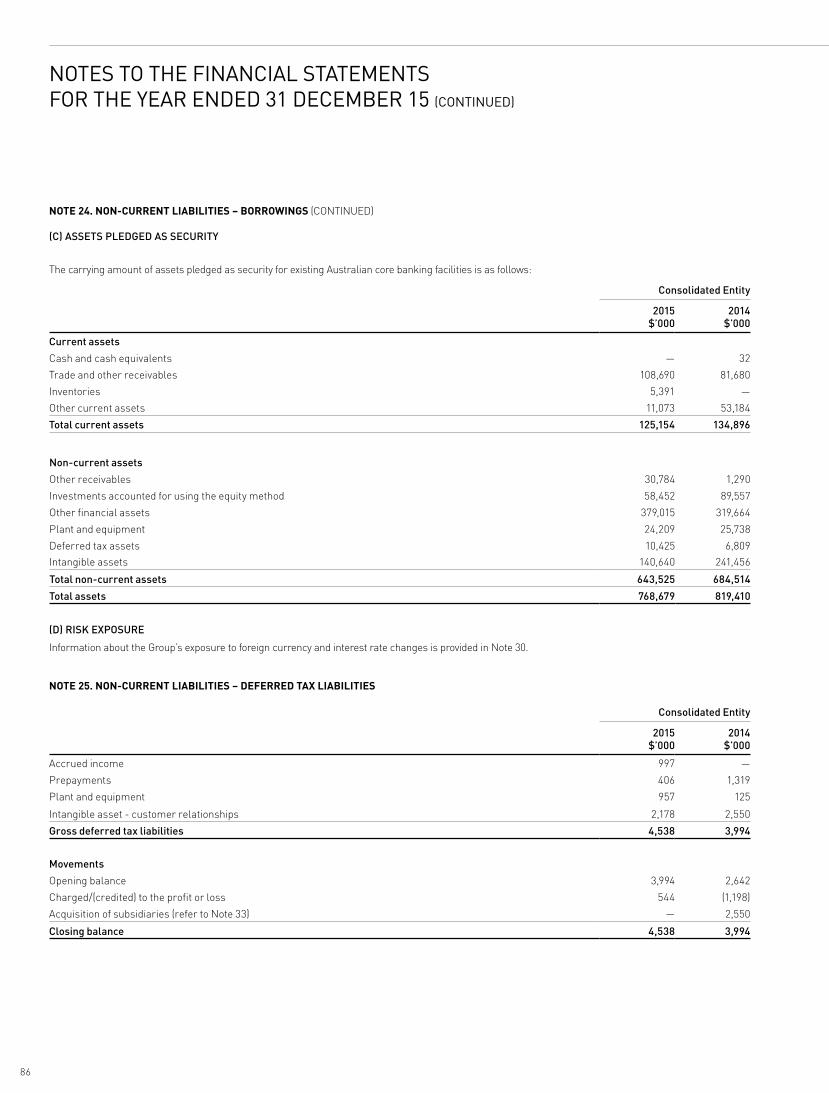
86
(C) ASSETS PLEDGED AS SECURITY
The carrying amount of assets pledged as security for existing Australian core banking facilities is as follows:
Consolidated Entity
2015 $’000
2014 $’000
Current assets
Cash and cash equivalents — 32
Trade and other receivables 108,690 81,680
Inventories 5,391 —
Other current assets 11,073 53,184
Total current assets 125,154 134,896
Non-current assets
Other receivables 30,784 1,290
Investments accounted for using the equity method 58,452 89,557
Other financial assets 379,015 319,664
Plant and equipment 24,209 25,738
Deferred tax assets 10,425 6,809
Intangible assets 140,640 241,456
Total non-current assets 643,525 684,514
Total assets 768,679 819,410
(D) RISK EXPOSURE
Information about the Group’s exposure to foreign currency and interest rate changes is provided in Note 30.
NOTE 25. NON-CURRENT LIABILITIES – DEFERRED TAX LIABILITIES
Consolidated Entity
2015 $’000
2014 $’000
Accrued income 997 —
Prepayments 406 1,319
Plant and equipment 957 125
Intangible asset - customer relationships 2,178 2,550
Gross deferred tax liabilities 4,538 3,994
Movements
Opening balance 3,994 2,642
Charged/(credited) to the profit or loss 544 (1,198)
Acquisition of subsidiaries (refer to Note 33) — 2,550
Closing balance 4,538 3,994
NOTE 24. NON-CURRENT LIABILITIES – BORROWINGS (CONTINUED)
NOTES TO THE FINANCIAL STATEMENTSFOR THE YEAR ENDED 31 DECEMBER 15 (CONTINUED)

87
Movements – consolidated
Accrued income$’000
Pre-payments
$’000
Plant and equipment
$’000
Executive Share Plan
$'000
Intangible asset - customer
relationships $'000
Total$’000
At 1 January 2014 103 89 — 2,450 — 2,642
Charged/(credited) to profit or loss (103) 1,230 125 (2,450) — (1,198)
Acquisition of subsidiaries (refer to Note 33) — — — — 2,550 2,550
At 31 December 2014 — 1,319 125 — 2,550 3,994
Charged/(credited) to profit or loss 997 (913) 832 — (372) 544
Acquisition of subsidiaries (refer to Note 33) — — — — — —
At 31 December 2015 997 406 957 — 2,178 4,538
NOTE 26. NON-CURRENT LIABILITIES – PROVISIONS
Consolidated Entity
2015 $’000
2014 $’000
Employee benefits 5,631 3,111
NOTE 27. ISSUED CAPITAL
2015 2014 2015 2014
Number of shares
Number of shares
$'000 $'000
Total issued capital* 427,627,759 407,449,931 334,516 322,471
* The total issued capital is net of treasury shares held by the executive share plan of 1,562,286 (2014: 2,249,069). The total shares on issue is 429,190,045 (2014: 409,699,000).
(A) MOVEMENTS IN TOTAL ISSUED CAPITAL
2015 2015 2014 2014
Number of shares
$'000 Number of shares
$'000
At 1 January 407,449,931 322,471 400,943,304 315,240
Shares under executive share plan 600,000 371 413,438 209
Issue of shares as remuneration 86,783 61 222,701 194
Issue of new shares under the dividend reinvestment plan 19,491,045 11,613 5,870,488 6,828
At 31 December 427,627,759 334,516 407,449,931 322,471
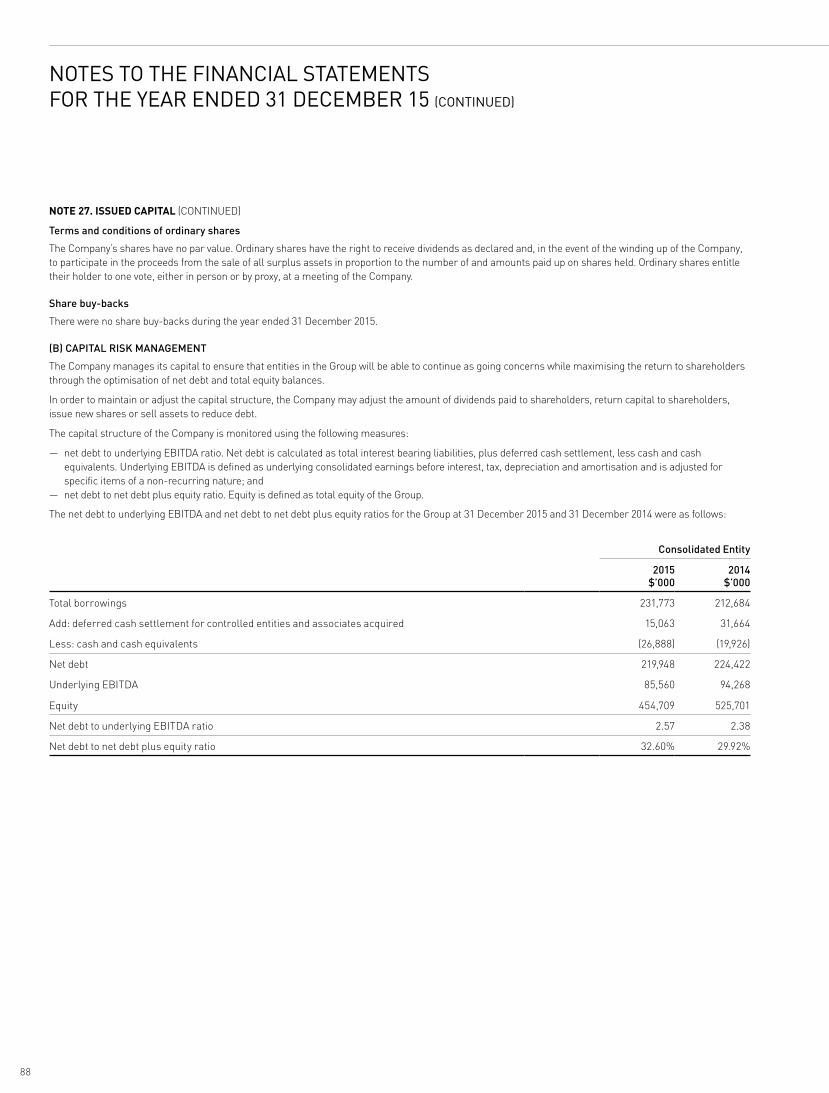
88
Terms and conditions of ordinary shares
The Company’s shares have no par value. Ordinary shares have the right to receive dividends as declared and, in the event of the winding up of the Company, to participate in the proceeds from the sale of all surplus assets in proportion to the number of and amounts paid up on shares held. Ordinary shares entitle their holder to one vote, either in person or by proxy, at a meeting of the Company.
Share buy-backs
There were no share buy-backs during the year ended 31 December 2015.
(B) CAPITAL RISK MANAGEMENT
The Company manages its capital to ensure that entities in the Group will be able to continue as going concerns while maximising the return to shareholders through the optimisation of net debt and total equity balances.
In order to maintain or adjust the capital structure, the Company may adjust the amount of dividends paid to shareholders, return capital to shareholders, issue new shares or sell assets to reduce debt.
The capital structure of the Company is monitored using the following measures:
— net debt to underlying EBITDA ratio. Net debt is calculated as total interest bearing liabilities, plus deferred cash settlement, less cash and cash equivalents. Underlying EBITDA is defined as underlying consolidated earnings before interest, tax, depreciation and amortisation and is adjusted for specific items of a non-recurring nature; and
— net debt to net debt plus equity ratio. Equity is defined as total equity of the Group.
The net debt to underlying EBITDA and net debt to net debt plus equity ratios for the Group at 31 December 2015 and 31 December 2014 were as follows:
Consolidated Entity
2015 $’000
2014 $’000
Total borrowings 231,773 212,684
Add: deferred cash settlement for controlled entities and associates acquired 15,063 31,664
Less: cash and cash equivalents (26,888) (19,926)
Net debt 219,948 224,422
Underlying EBITDA 85,560 94,268
Equity 454,709 525,701
Net debt to underlying EBITDA ratio 2.57 2.38
Net debt to net debt plus equity ratio 32.60% 29.92%
NOTE 27. ISSUED CAPITAL (CONTINUED)
NOTES TO THE FINANCIAL STATEMENTSFOR THE YEAR ENDED 31 DECEMBER 15 (CONTINUED)
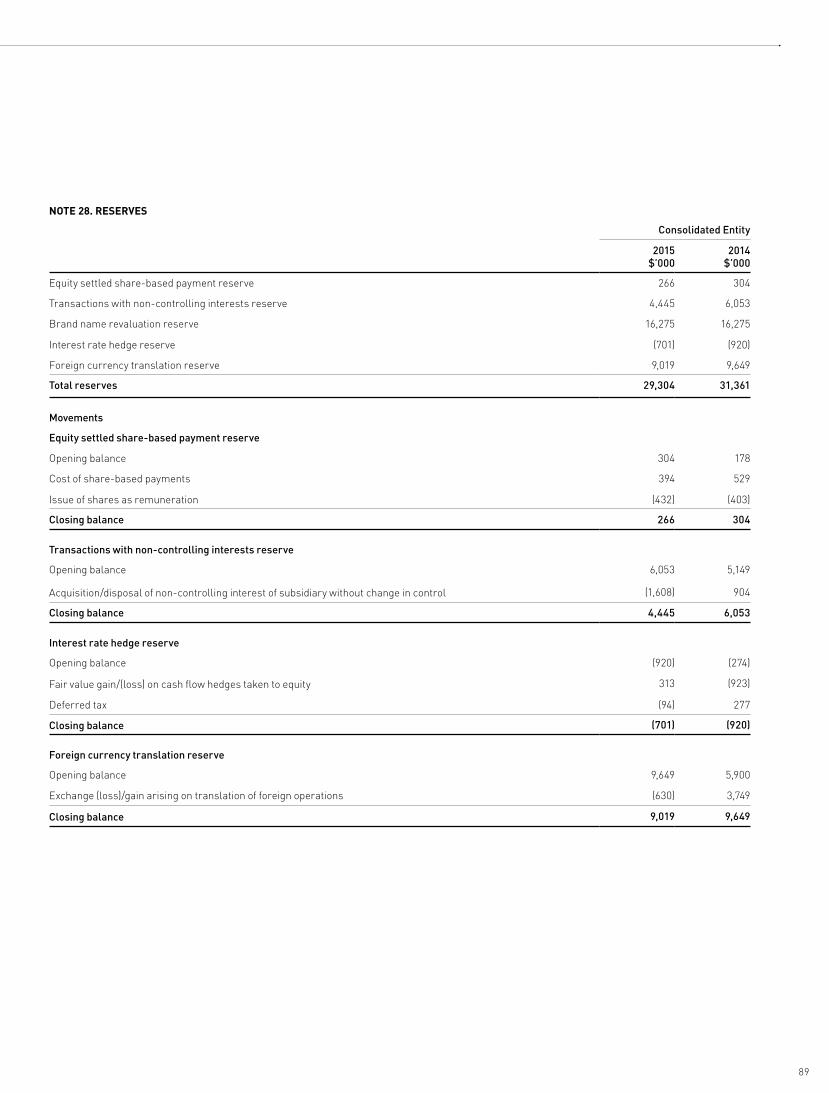
89
NOTE 28. RESERVES
Consolidated Entity
2015 $’000
2014 $’000
Equity settled share-based payment reserve 266 304
Transactions with non-controlling interests reserve 4,445 6,053
Brand name revaluation reserve 16,275 16,275
Interest rate hedge reserve (701) (920)
Foreign currency translation reserve 9,019 9,649
Total reserves 29,304 31,361
Movements
Equity settled share-based payment reserve
Opening balance 304 178
Cost of share-based payments 394 529
Issue of shares as remuneration (432) (403)
Closing balance 266 304
Transactions with non-controlling interests reserve
Opening balance 6,053 5,149
Acquisition/disposal of non-controlling interest of subsidiary without change in control (1,608) 904
Closing balance 4,445 6,053
Interest rate hedge reserve
Opening balance (920) (274)
Fair value gain/(loss) on cash flow hedges taken to equity 313 (923)
Deferred tax (94) 277
Closing balance (701) (920)
Foreign currency translation reserve
Opening balance 9,649 5,900
Exchange (loss)/gain arising on translation of foreign operations (630) 3,749
Closing balance 9,019 9,649
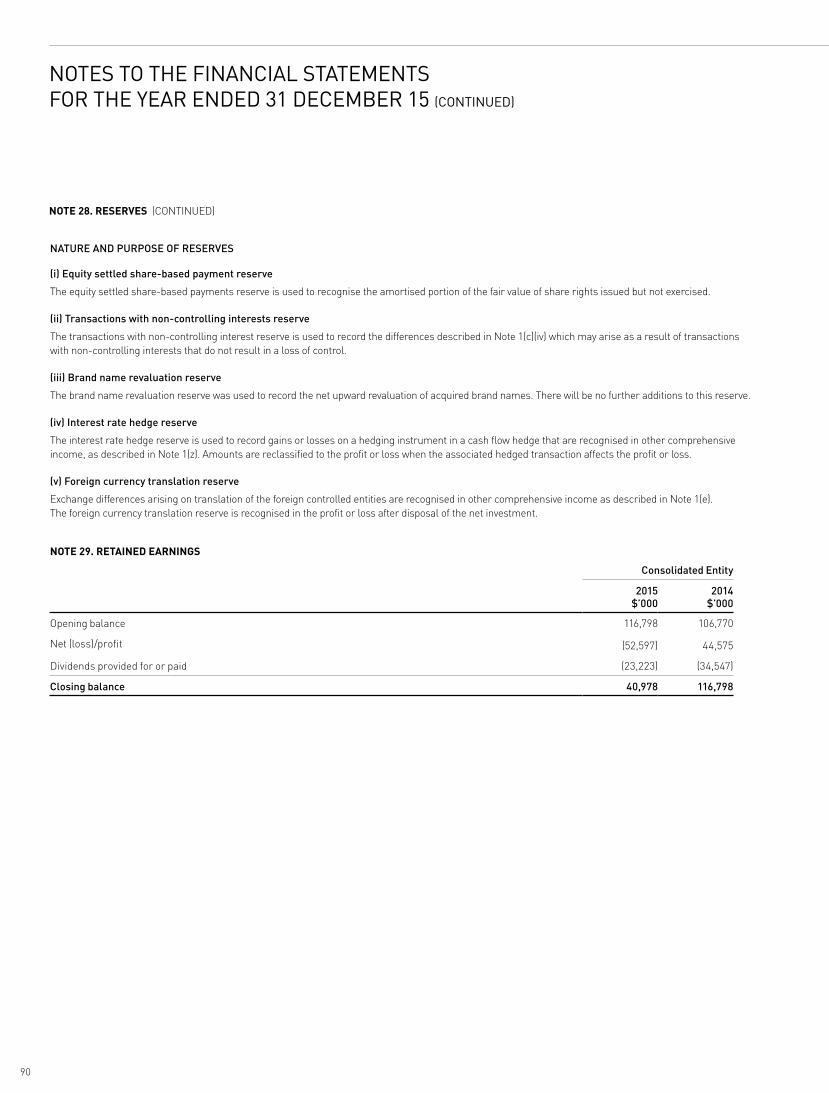
90
NATURE AND PURPOSE OF RESERVES
(i) Equity settled share-based payment reserve
The equity settled share-based payments reserve is used to recognise the amortised portion of the fair value of share rights issued but not exercised.
(ii) Transactions with non-controlling interests reserve
The transactions with non-controlling interest reserve is used to record the differences described in Note 1(c)(iv) which may arise as a result of transactions with non-controlling interests that do not result in a loss of control.
(iii) Brand name revaluation reserve
The brand name revaluation reserve was used to record the net upward revaluation of acquired brand names. There will be no further additions to this reserve.
(iv) Interest rate hedge reserve
The interest rate hedge reserve is used to record gains or losses on a hedging instrument in a cash flow hedge that are recognised in other comprehensive income, as described in Note 1(z). Amounts are reclassified to the profit or loss when the associated hedged transaction affects the profit or loss.
(v) Foreign currency translation reserve
Exchange differences arising on translation of the foreign controlled entities are recognised in other comprehensive income as described in Note 1(e). The foreign currency translation reserve is recognised in the profit or loss after disposal of the net investment.
NOTE 29. RETAINED EARNINGS
Consolidated Entity
2015 $’000
2014 $’000
Opening balance 116,798 106,770
Net (loss)/profit (52,597) 44,575
Dividends provided for or paid (23,223) (34,547)
Closing balance 40,978 116,798
NOTE 28. RESERVES (CONTINUED)
NOTES TO THE FINANCIAL STATEMENTSFOR THE YEAR ENDED 31 DECEMBER 15 (CONTINUED)

91
NOTE 30. FINANCIAL RISK MANAGEMENT
A financial instrument is any contract that gives rise to both a financial asset of one entity and a financial liability or equity instrument of another entity. The Group’s activities expose it to a variety of financial risks: market risk (including foreign exchange risk and interest rate risk), credit risk and liquidity risk. There has been no significant change in the Group’s risk profile from that of the prior year. The Group manages these risks using various financial instruments, governed by a set of policies approved by the Board. Derivative financial instruments are exclusively used for hedging purposes and not for speculative trading purpose.
The Group uses different methods to measure different types of risk to which it is exposed. These methods include sensitivity analysis in the case of foreign exchange and interest rate risks; and ageing analysis for credit risk. Risk management is carried out in accordance with ageing policies approved by the Board.
(A) MARKET RISK
Market risk is the risk that the fair value and/or future cash flows from a financial instrument will fluctuate as a result of changes in market factors. The Group has exposure to market risk in the following areas: foreign exchange risk (due to fluctuations in foreign exchange rates) and interest rate risk (due to fluctuations in interest rates).
(i) Foreign exchange risk
Foreign exchange risk refers to the risk that the value or the cash flows arising from a financial commitment, or recognised asset or liability will fluctuate due to changes in foreign currency rates. The Group's foreign exchange risk arises primarily from:
— sales and purchases denominated in foreign currency; — borrowings denominated in foreign currency; and — firm commitments and/or highly probable forecast transactions for receipts and payments settled in foreign currencies and prices dependent on foreign
currencies, respectively.
The Group is exposed to foreign exchange risk from various currency exposures primarily with respect to:
— Canadian Dollar (CAD); — Chinese Yen (CNY); — Euro (EUR); — Great British Pound (GBP); — Indian Rupee (IND); — Malaysian Ringgit (MYR); — New Zealand Dollar (NZD); — Saudi Riyal (SAR); — Singapore Dollar (SGD); — US Dollar (USD); and — South African Rand (ZAR)
All borrowings are in the functional currency of the borrowing entity.
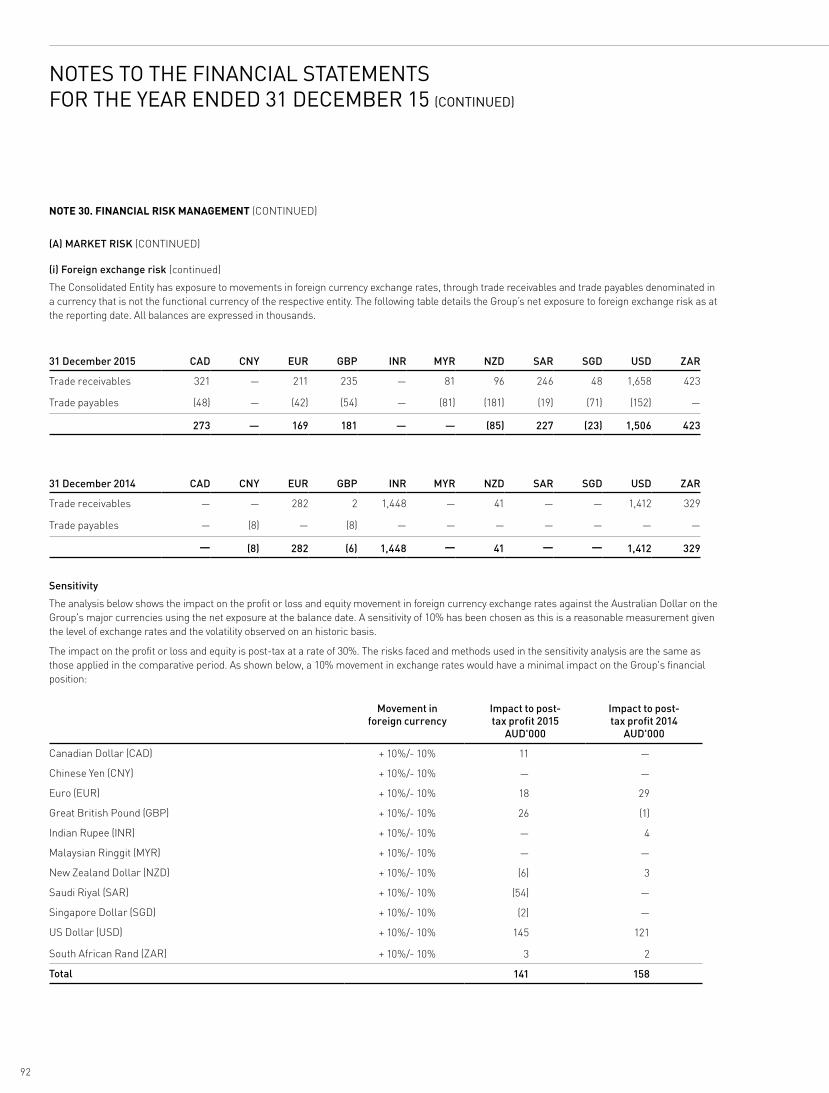
92
(i) Foreign exchange risk (continued)
The Consolidated Entity has exposure to movements in foreign currency exchange rates, through trade receivables and trade payables denominated in a currency that is not the functional currency of the respective entity. The following table details the Group’s net exposure to foreign exchange risk as at the reporting date. All balances are expressed in thousands.
31 December 2015 CAD CNY EUR GBP
INR MYR NZD SAR SGD USD
ZAR
Trade receivables 321 — 211 235 — 81 96 246 48 1,658 423
Trade payables (48) — (42) (54) — (81) (181) (19) (71) (152) —
273 — 169 181 — — (85) 227 (23) 1,506 423
31 December 2014 CAD CNY EUR GBP
INR MYR NZD SAR SGD USD
ZAR
Trade receivables — — 282 2 1,448 — 41 — — 1,412 329
Trade payables — (8) — (8) — — — — — — —
— (8) 282 (6) 1,448 — 41 — — 1,412 329
Sensitivity
The analysis below shows the impact on the profit or loss and equity movement in foreign currency exchange rates against the Australian Dollar on the Group's major currencies using the net exposure at the balance date. A sensitivity of 10% has been chosen as this is a reasonable measurement given the level of exchange rates and the volatility observed on an historic basis.
The impact on the profit or loss and equity is post-tax at a rate of 30%. The risks faced and methods used in the sensitivity analysis are the same as those applied in the comparative period. As shown below, a 10% movement in exchange rates would have a minimal impact on the Group's financial position:
Movement in foreign currency
Impact to post- tax profit 2015
AUD'000
Impact to post- tax profit 2014
AUD'000
Canadian Dollar (CAD) + 10%/- 10% 11 —
Chinese Yen (CNY) + 10%/- 10% — —
Euro (EUR) + 10%/- 10% 18 29
Great British Pound (GBP) + 10%/- 10% 26 (1)
Indian Rupee (INR) + 10%/- 10% — 4
Malaysian Ringgit (MYR) + 10%/- 10% — —
New Zealand Dollar (NZD) + 10%/- 10% (6) 3
Saudi Riyal (SAR) + 10%/- 10% (54) —
Singapore Dollar (SGD) + 10%/- 10% (2) —
US Dollar (USD) + 10%/- 10% 145 121
South African Rand (ZAR) + 10%/- 10% 3 2
Total 141 158
NOTE 30. FINANCIAL RISK MANAGEMENT (CONTINUED)
(A) MARKET RISK (CONTINUED)
NOTES TO THE FINANCIAL STATEMENTSFOR THE YEAR ENDED 31 DECEMBER 15 (CONTINUED)

93
(ii) Interest rate risk
Interest rate risk refers to the risk that the fair value or future cash flows of a financial instrument will fluctuate because of changes in market interest rates. The Group is exposed to movements in interest rates arising from its portfolio of interest rate sensitive assets and liabilities in a number of currencies, predominately AUD and NZD. These principally include corporate debt and cash.
The Group manages interest rate risk by using a floating versus fixed debt framework. The relative mix of fixed and floating interest rate funding is managed by using floating-to-fixed interest rate swaps. Such interest rate swaps have the economic effect of converting borrowings from floating rates to fixed rates.
These interest rate hedges are repriced on a quarterly basis in advance and settled on a quarterly basis in arrears. The floating rate on the interest rate derivatives is based on the Australian BBSY and BBSW. The Group settles the difference between the fixed and floating interest rate on a net basis. At 31 December 2015, the interest rate hedges were marked to market and gave rise to a mark to market liability at that date of $1,000,892 (2014: $1,314,000) (refer to Note 20(d)).
All interest rate hedges are designated as cash flow hedges in order to reduce the Group’s exposure resulting from variable interest rates on borrowings. The amount deferred in equity as a result of revaluation of the interest rate hedges is recognised in the profit or loss over the period of the hedge contracts.
As at the reporting date, the Group had the following variable rate borrowings and interest rate swaps outstanding:
Consolidated Entity
2015Weighted average
interest rate % p.a.
2015Balance
$’000
2014Weighted average
interest rate % p.a.
2014Balance
$’000
Secured bank loans 2.39% 227,100 2.94% 207,075
Interest rate swaps (notional principal amount) 2.53% (150,000) 2.91% (150,000)
Net exposure to cash flow interest rate risk 77,100 57,075
On 26 February 2013, the Company entered into an interest rate swap of $40 million at a fixed rate of 3.11% per annum that matures on 1 March 2016.
On 20 June 2013, the Company entered into an interest rate swap of $50 million at a fixed rate of 3.00% per annum that matures on 20 June 2016.
On 11 August 2014, the Company entered into an interest rate swap of $30 million at a fixed rate of 2.85% per annum that matures on 11 August 2017.
On 22 December 2014, the Company entered into an interest rate swap of $30 million at a fixed rate of 2.59% per annum that matures on 20 December 2017.
Sensitivity
At 31 December 2015, if interest rates had changed by +/-100 basis points from the year-end rates with all other variables held constant, post-tax loss for the year would have been $540,000 lower/higher (2014: change of 100 basis points: $400,000 lower/higher) mainly as a result of higher/lower interest expense on borrowings. Equity would have been $540,000 lower/higher (2014: $400,000 lower/higher). This is attributable to the Group's exposure to interest rates on its variable rate borrowings.
The analysis is prepared assuming the amount of the liability outstanding at the end of the reporting period was outstanding for the whole year. A 100 basis point increase or decrease represents management's assessment of the reasonably possible change in interest rates.
The Group's sensitivity to interest rates has increased during the current year due to the increase in the unhedged portion of the bank loans.
(B) CREDIT RISK
Credit risk refers to the risk that a counterparty will default on its contractual obligations, resulting in a financial loss to the Group. Credit risk arises from cash and cash equivalents, receivables due from customers and derivative financial instruments.
The Group has adopted a policy of only dealing with creditworthy counterparties and obtaining sufficient collateral where appropriate, as a means of mitigating the risk of financial loss from defaults. Customers that do not meet minimum credit criteria are required to pay upfront. Customers who fail to meet their account terms are reviewed for continuing creditworthiness.
Trade receivables consist of a large number of clients, spread across diverse industries and geographical areas. Ongoing credit evaluation is performed on the financial condition of trade receivables and other receivables balances are monitored on an ongoing basis, with the result that the Group’s exposure to bad debts is not significant. A relatively small number of clients contribute to a significant percentage of the Group’s consolidated revenue. For certain customers, the Group purchases credit insurance to protect itself against collection risks.
Credit risk on derivative contracts is minimised by principally dealing with large banks with an appropriate credit rating.

94
The maximum exposure to credit risk at the reporting date is the carrying amount of the financial assets as summarised in Note 10. For trade and other receivables, the Group does not hold any credit derivatives or collateral to offset its credit exposure. Due to the short-term nature of these receivables, their carrying amount is assumed to approximate their fair value.
The Group does not consider that there is any significant concentration of credit risk.
(C) LIQUIDITY RISK
Liquidity risk is the risk that an entity will encounter difficulty in meeting obligations associated with financial liabilities. The Group manages liquidity risk by targeting a minimum liquidity level, ensuring long-term commitments are managed with respect to forecast available cash inflows, maintaining access to a variety of funding sources including loan facilities and managing maturity profiles.
MATURITIES OF FINANCIAL LIABILITIES
The table below provides management’s expectation of the maturity analysis of financial liabilities for the Consolidated Entity. The maturity presented for the secured bank loans is on the basis of the term of the committed bank facility notwithstanding that the outstanding amount is subject to period roll overs of one month. The amounts disclosed in the table are the contractual undiscounted cash flows.
Maturity
Contractual maturities of financial liabilitiesAs at 31 December 2015
≤6 months $’000
6-12 months $’000
1-2 years $’000
2-5 years $’000
Over 5 years $’000
Total contractual cash flows
$’000
Carrying amount $’000
Non-derivatives
Trade and other payables (excluding deferred cash settlement and derivatives below)
149,256 — 13,431 — — 162,687 162,687
Deferred cash settlement 5,760 2,143 5,864 1,917 — 15,684 15,063
Finance lease liabilities 584 596 1,207 2,916 — 5,303 4,673
Secured bank loans — 68,928 37,320 137,698 — 243,946 227,100
Total non-derivatives 155,600 71,667 57,822 142,531 — 427,620 409,523
Derivatives
Net settled (interest rate swaps) 1,001 — — — — 1,001 1,001
Maturity
Contractual maturities of financial liabilitiesAs at 31 December 2014
≤6 months $’000
6-12 months $’000
1-2 years $’000
2-5 years $’000
Over 5 years $’000
Total contractual cash flows
$’000
Carrying amount $’000
Non-derivatives
Trade and other payables (excluding deferred cash settlement and derivatives below)
144,699 — 13,180 — — 157,879 157,879
Deferred cash settlement 17,695 — 7,587 8,652 — 33,934 31,664
Finance lease liabilities 582 582 2,304 3,114 — 6,582 5,609
Secured bank loans 79,041 26,385 — 117,210 — 222,636 207,075
Total non-derivatives 242,017 26,967 23,071 128,976 — 421,031 402,227
Derivatives
Net settled (interest rate swaps) 1,314 — — — — 1,314 1,314
NOTE 30. FINANCIAL RISK MANAGEMENT (CONTINUED)
(B) CREDIT RISK (CONTINUED)
NOTES TO THE FINANCIAL STATEMENTSFOR THE YEAR ENDED 31 DECEMBER 15 (CONTINUED)

95
(D) FAIR VALUE MEASUREMENTS
The fair value of financial assets and financial liabilities must be estimated for recognition and measurement and for disclosure purposes.
The fair value of cash, cash equivalents, and non-interest-bearing financial assets and liabilities approximates their carrying value due to their short maturity.
The fair value of trade receivables less impairment provision and trade payables are assumed to approximate the carrying value due to their short-term nature.
The fair value of assets and liabilities traded in active markets (such as publicly traded shares) is based on quoted market prices at the reporting date. The quoted market price used for financial assets held by the Group is the current bid price.
The fair value of financial assets and liabilities that are not traded in an active market is determined by valuing them at the present value of future contracted cash flows. Cash flows are discounted using standard valuation techniques at the applicable market yield, having regard to timing of cash flows.
The fair value of interest rate swaps is determined as the present value of future contracted cash flows.
The Group holds the following financial instruments:
Consolidated Entity Consolidated Entity
Carrying amount Fair value
2015 $’000
2014 $’000
2015 $’000
2014 $’000
Financial assets
Cash and cash equivalents 26,888 19,926 26,888 19,926Trade and other receivables 177,987 184,385 177,987 184,385Other financial assets 557 706 557 706
205,432 205,017 205,432 205,017
Financial liabilities
Trade and other payables (excluding deferred cash settlement and derivatives) 162,687 157,879 162,687 157,879Deferred cash settlement 15,063 31,664 15,063 31,664Finance lease 4,673 5,609 4,673 5,609Secured bank loans 227,100 207,075 227,100 207,075Derivative financial instruments 1,001 1,314 1,001 1,314
410,524 403,541 410,524 403,541
(i) Fair value hierarchy and valuation techniques
The Group’s financial assets and liabilities measured and recognised at fair value at 31 December 2015 were based on the following fair value measurement hierarchy:
(a) Level 1 – shares in listed entities
Shares in listed entities are held at fair value with reference to the market price on the New Zealand stock exchange as at 31 December 2015;
(b) Level 2 – interest rate hedge reserve
The fair value of interest rate swaps is calculated as the present value of the estimated future cash flows based on observable yield curves; and
(c) Level 3 – deferred cash settlement and shares in other entities
The fair value of the deferred cash settlement is calculated as the present value of estimated future payments based on a discount rate which approximates the Group’s cost of borrowing. Expected cash inflows are estimated on the terms of the sale contract and the entity’s knowledge of the business and how the current economic environment is likely to impact it. The shares in other entities have been disclosed at historical cost which approximates the fair value.

96
Recognised fair value measurements
The following table presents the Group’s assets and liabilities measured and recognised at fair value at 31 December 2015 and 31 December 2014:
As at 31 December 2015Level 1 $’000
Level 2$’000
Level 3$’000
Total $’000
Consolidated Entity
Assets
Shares in listed entities 557 — — 557
Shares in other entities — — — —
Total assets 557 — — 557
Liabilities
Derivatives used for hedging — (1,001) — (1,001)
Deferred cash settlement — — (15,063) (15,063)
Total liabilities — (1,001) (15,063) (16,064)
As at 31 December 2014Level 1 $’000
Level 2$’000
Level 3$’000
Total $’000
Consolidated Entity
Assets
Shares in listed entities 588 — — 588
Shares in other entities — — 118 118
Total assets 588 — 118 706
Liabilities
Derivatives used for hedging — (1,314) — (1,314)
Deferred cash settlement — — (31,664) (31,664)
Total liabilities — (1,314) (31,664) (32,978)
There were no transfers between levels 1, 2 or 3 for fair value measurements during the year.
The Group’s policy is to recognise transfers into and transfers out of fair value hierarchy levels as at the end of the reporting period.
The Group did not measure any financial assets or financial liabilities at fair value on a non-recurring basis as at 31 December 2015.
NOTE 30. FINANCIAL RISK MANAGEMENT (CONTINUED)
(D) FAIR VALUE MEASUREMENTS (CONTINUED)
(i) Fair value hierarchy and valuation techniques (continued)
NOTES TO THE FINANCIAL STATEMENTSFOR THE YEAR ENDED 31 DECEMBER 15 (CONTINUED)
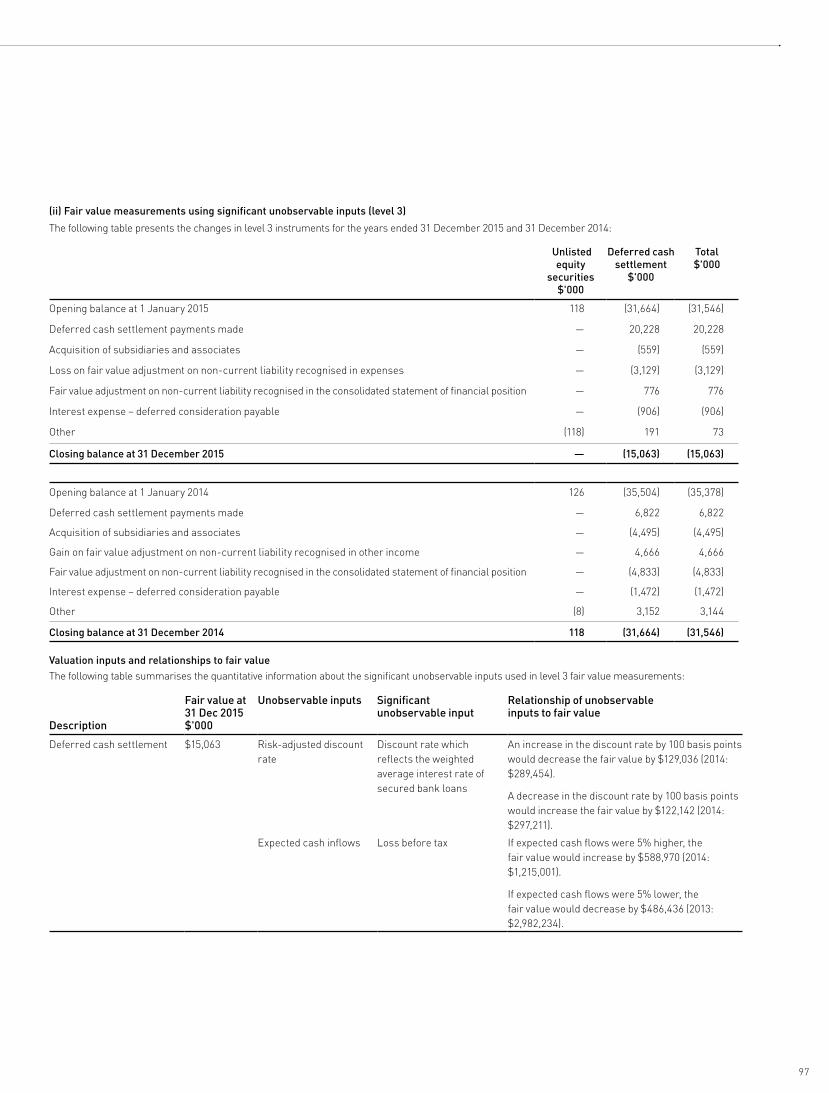
97
(ii) Fair value measurements using significant unobservable inputs (level 3)
The following table presents the changes in level 3 instruments for the years ended 31 December 2015 and 31 December 2014:
Unlisted equity
securities $'000
Deferred cash settlement
$'000
Total$'000
Opening balance at 1 January 2015 118 (31,664) (31,546)
Deferred cash settlement payments made — 20,228 20,228
Acquisition of subsidiaries and associates — (559) (559)
Loss on fair value adjustment on non-current liability recognised in expenses — (3,129) (3,129)
Fair value adjustment on non-current liability recognised in the consolidated statement of financial position — 776 776
Interest expense – deferred consideration payable — (906) (906)
Other (118) 191 73
Closing balance at 31 December 2015 — (15,063) (15,063)
Opening balance at 1 January 2014 126 (35,504) (35,378)
Deferred cash settlement payments made — 6,822 6,822
Acquisition of subsidiaries and associates — (4,495) (4,495)
Gain on fair value adjustment on non-current liability recognised in other income — 4,666 4,666
Fair value adjustment on non-current liability recognised in the consolidated statement of financial position — (4,833) (4,833)
Interest expense – deferred consideration payable — (1,472) (1,472)
Other (8) 3,152 3,144
Closing balance at 31 December 2014 118 (31,664) (31,546)
Valuation inputs and relationships to fair valueThe following table summarises the quantitative information about the significant unobservable inputs used in level 3 fair value measurements:
Description
Fair value at 31 Dec 2015$'000
Unobservable inputs Significant unobservable input
Relationship of unobservable inputs to fair value
Deferred cash settlement $15,063 Risk-adjusted discount rate
Discount rate whichreflects the weighted average interest rate of secured bank loans
An increase in the discount rate by 100 basis points would decrease the fair value by $129,036 (2014: $289,454).
A decrease in the discount rate by 100 basis points would increase the fair value by $122,142 (2014: $297,211).
Expected cash inflows Loss before tax If expected cash flows were 5% higher, the fair value would increase by $588,970 (2014: $1,215,001).
If expected cash flows were 5% lower, the fair value would decrease by $486,436 (2013: $2,982,234).

98
(E) CAPITAL RISK
The Group’s objectives when managing capital are to safeguard the Group’s ability to continue as a going concern in order to provide returns for shareholders and benefits for other stakeholders and to maintain an optimal capital structure to reduce the cost of capital. This is achieved by maintaining a flexible financing structure to be able to fund capital expenditure, new acquisitions and additional amounts payable in respect of past acquisitions and to pay dividends. This policy is balanced against the desire to ensure efficiency in the debt/equity structure of the balance sheet in the longer term through proactive capital management programs.
Borrowing facilities are maintained with the Group’s bankers that are sufficient to meet contractual cash obligations arising in the ordinary course of business, details of which are set out in Notes 21 and 24 and this Note 30. The existing borrowing facilities are subject to various debt covenants.
NOTE 31. SHARE-BASED PAYMENTS
On 25 May 2004, the Company’s shareholders approved the creation of the ESP. The ESP allows the Directors to allocate up to 5% of the ordinary issued shares in the Company to executives (“performance shares”).
The ESP structure has been in operation since 31 December 2004.
As at 31 December 2015, 1,562,286 (2014: 2,249,069) performance shares in the Company have been issued to the STW Executive Share Plan Trust. The trust holds the performance shares and all rights and entitlements attaching to the performance shares on the executives' behalf.
The table on page 99 represents the total number of performance shares allocated to executives that will vest subject to the achievement of performance conditions, as determined by the Remuneration and Nominations Committee. The performance conditions are tested over a three year period, based on average compounded annual growth in EPS and the Company’s TSR performance compared to the TSR performance of the companies in the S&P/ASX All Ordinaries - ASX Consumer Discretionary index. Any performance shares for which the relevant performance condition is not satisfied will lapse.
Any performance shares that do not vest over the performance period will be forfeited. The number of performance shares allocated under the individual plans are as at the date of this report and the number of shares allocated may vary subject to executives forfeiting their rights to the performance shares.
Fair value of performance shares granted
The assessed value at grant date of performance shares granted during the year ended 31 December 2015 was $0.46 (2014: $1.08) per share.
The fair value of performance shares at grant date is determined using the Black-Scholes option pricing model that takes into account the exercise price, the term of the performance shares, the impact of dilution, the share price at grant date and expected price volatility of the underlying share, the expected dividend yield and the risk-free rate for the term of the performance share.
The model inputs for performance shares granted during the year ended 31 December 2015 included:
— performance rights are granted for no consideration; — exercise price: $0; — grant date: March 2015 (2014: January 2014); — expiry date: March 2018 (2014: March 2017); — share price at grant date: 2015: $0.675 (2014: $1.46); — expected price volatility of the Company shares: 2015: 35% (2014: 33%); — expected dividend yield per annum: 2015: 5.9% (2014: 6.4%); and — risk-free interest rate per annum: 2015: 1.76% (2014: 2.9%).
The expected price volatility is based on historical volatility adjusted for any expected changes to future volatility due to publicly available information.
NOTE 30. FINANCIAL RISK MANAGEMENT (CONTINUED)
NOTES TO THE FINANCIAL STATEMENTSFOR THE YEAR ENDED 31 DECEMBER 15 (CONTINUED)

99
EXECUTIVE SHARE PLAN
Grant dateDate exercisable Plan
Performancetesting range
Fair value price
Balance at the start of
the year
Granted during the
year
Forfeited during
the year
Vested and exercised
during the year
Balance at the end of the year
Exercisable post-
year end
Number Number Number Number Number Number
Consolidated – 2015
Jan 13 1 Mar 16 Base Plan 2013-2015 $0.79 1,496,074 — 1,496,074 — — —
Jan 13 1 Mar 16 Overperformance Plan
2013-2015 $0.86 280,514 — 280,514 — — —
Jan 14* 1 Mar 17 Base Plan 2014-2016 $1.08 1,070,428 — 257,814 — 812,614 —
Jan 14* 1 Mar 17 Overperformance Plan
2014-2016 $1.19 200,705 — 48,340 — 152,365 —
Mar 15* 1 Mar 18 Base Plan 2015-2017 $0.46 — 1,470,050 — — 1,470,050 —
Total 3,047,721 1,470,050 2,082,742 — 2,435,029 —
* Change in control
On 14 December 2015, the Company announced it had entered into an agreement to merge with the Australian and New Zealand business of WPP ("Transaction"). As a result of the Transaction, WPP will become the majority shareholder of STW with a shareholding of around 61%. The Transaction is subject to Company shareholder (excluding WPP) approval, regulatory approvals (including Australian Competition and Consumer Commission and Foreign Investment Review Board) and certain other conditions precedent. Subject to shareholder and regulatory approvals being received, the proposed transaction constitutes a change in control event.
Under the terms of his employment contract, Michael Connaghan will receive a pro-rata entitlement to his performance shares from the commencement date of the 2014 Plan and 2015 Plan to the date that the change in control occurs. Assuming the change in control occurs on 31 March 2016, Michael Connaghan will be granted 350,321 shares.
No other shares will vest as a result of the change in control.
All grants of performance shares to the Chief Executive Officer has been approved by shareholders.
During the year ended 31 December 2015, the Company granted 600,000 shares to an executive who is not a KMP as final settlement of a short term incentive plan.
Total expense from the share-based payment transactions recognised during the year as part of the employee benefit expense was $394,000 (2014: $529,000).
NOTE 32. RELATED PARTY DISCLOSURES
(A) ULTIMATE PARENT ENTITY
The ultimate parent entity within the Group is STW Communications Group Limited.
(B) SUBSIDIARIES
The consolidated financial statements include the financial statements of the Company and the controlled entities as listed in Note 37. The Company is the parent entity of the Consolidated Entity.
Transactions between the Company and other entities in the wholly-owned group during the years ended 31 December 2015 and 31 December 2014 consisted of:
— loans advanced by/repaid to the Company; — loans advanced to/repaid by the Company; — the payment of interest on the above loans; — the payment of dividends and trust distributions to the Company; and — the provision of accounting and administrative assistance.
With the exception of interest-free loans provided by the Company, all other transactions were on commercial terms and conditions.
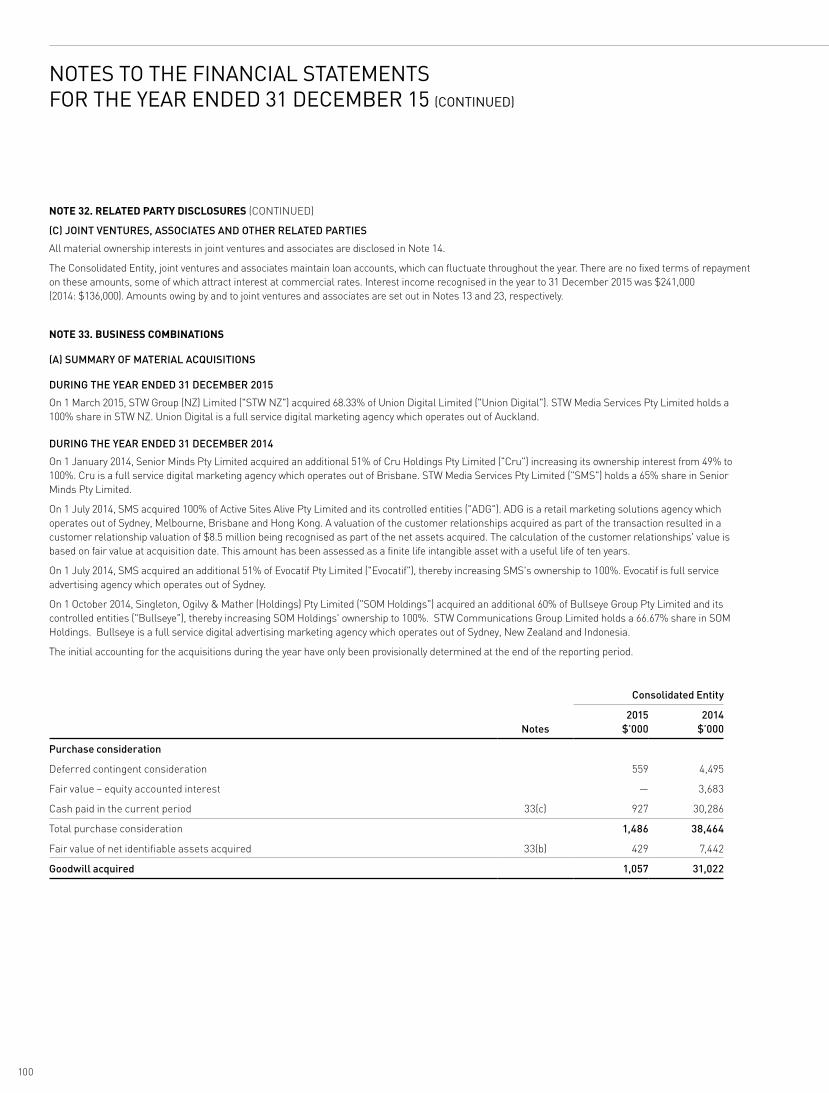
100
(C) JOINT VENTURES, ASSOCIATES AND OTHER RELATED PARTIES
All material ownership interests in joint ventures and associates are disclosed in Note 14.
The Consolidated Entity, joint ventures and associates maintain loan accounts, which can fluctuate throughout the year. There are no fixed terms of repayment on these amounts, some of which attract interest at commercial rates. Interest income recognised in the year to 31 December 2015 was $241,000 (2014: $136,000). Amounts owing by and to joint ventures and associates are set out in Notes 13 and 23, respectively.
NOTE 33. BUSINESS COMBINATIONS
(A) SUMMARY OF MATERIAL ACQUISITIONS
DURING THE YEAR ENDED 31 DECEMBER 2015
On 1 March 2015, STW Group (NZ) Limited ("STW NZ") acquired 68.33% of Union Digital Limited ("Union Digital"). STW Media Services Pty Limited holds a 100% share in STW NZ. Union Digital is a full service digital marketing agency which operates out of Auckland.
DURING THE YEAR ENDED 31 DECEMBER 2014
On 1 January 2014, Senior Minds Pty Limited acquired an additional 51% of Cru Holdings Pty Limited ("Cru") increasing its ownership interest from 49% to 100%. Cru is a full service digital marketing agency which operates out of Brisbane. STW Media Services Pty Limited ("SMS") holds a 65% share in Senior Minds Pty Limited.
On 1 July 2014, SMS acquired 100% of Active Sites Alive Pty Limited and its controlled entities ("ADG"). ADG is a retail marketing solutions agency which operates out of Sydney, Melbourne, Brisbane and Hong Kong. A valuation of the customer relationships acquired as part of the transaction resulted in a customer relationship valuation of $8.5 million being recognised as part of the net assets acquired. The calculation of the customer relationships' value is based on fair value at acquisition date. This amount has been assessed as a finite life intangible asset with a useful life of ten years.
On 1 July 2014, SMS acquired an additional 51% of Evocatif Pty Limited ("Evocatif"), thereby increasing SMS's ownership to 100%. Evocatif is full service advertising agency which operates out of Sydney.
On 1 October 2014, Singleton, Ogilvy & Mather (Holdings) Pty Limited ("SOM Holdings") acquired an additional 60% of Bullseye Group Pty Limited and its controlled entities ("Bullseye"), thereby increasing SOM Holdings' ownership to 100%. STW Communications Group Limited holds a 66.67% share in SOM Holdings. Bullseye is a full service digital advertising marketing agency which operates out of Sydney, New Zealand and Indonesia.
The initial accounting for the acquisitions during the year have only been provisionally determined at the end of the reporting period.
Consolidated Entity
Notes2015
$’0002014
$’000
Purchase consideration
Deferred contingent consideration 559 4,495
Fair value – equity accounted interest — 3,683
Cash paid in the current period 33(c) 927 30,286
Total purchase consideration 1,486 38,464
Fair value of net identifiable assets acquired 33(b) 429 7,442
Goodwill acquired 1,057 31,022
NOTE 32. RELATED PARTY DISCLOSURES (CONTINUED)
NOTES TO THE FINANCIAL STATEMENTSFOR THE YEAR ENDED 31 DECEMBER 15 (CONTINUED)

101
The acquired business contributed revenues of $3,006,611 and net profit of $182,583 to the Group for the period between 1 March 2015 to 31 December 2015. If the acquisition had occurred on 1 January 2015, consolidated revenue for the year ended 31 December 2015 would have been higher by $412,306 and the loss for the year ended 31 December 2015 would be lower by $1,599.
The goodwill acquired is attributable to the high profitability of the acquired business and synergies expected to arise after the Company’s acquisition of the new controlled entity. The methods used in determining the fair value of assets and liabilities acquired are summarised in Notes 1(i) and 1(o).
(B) ASSETS AND LIABILITIES ACQUIRED
The assets and liabilities arising from the acquisitions were as follows:
Consolidated Entity
Fair value of net assets acquired2015
$’0002014
$’000
Current assets
Cash and cash equivalents 441 1,446
Trade and other receivables 405 11,686
Prepayments 20 972
Current tax assets — 40
Inventories — 3,322
Other current assets 7 389
Non-current assets
Investments in joint ventures — 3,357
Plant and equipment 59 6,932
Deferred tax assets — 1,827
Intangible assets - intellectual property — 512
Intangible assets - customer relationships — 8,500
Other non-current assets — 29
Current liabilities
Trade and other payables (30) (6,534)
Current tax liabilities — (1,090)
Provisions (22) (3,154)
Other current liabilities (252) (4,004)
Non-current liabilities
Borrowings — (12,640)
Deferred tax liabilities — (2,550)
Other non-current liabilities — (1,228)
Net assets 628 7,812
Non-controlling interests in net assets acquired (199) (370)
Net identifiable assets acquired 429 7,442
(C) PURCHASE CONSIDERATION
Consolidated Entity
Outflow of cash to acquire controlled entities, net of cash acquired Notes2015
$’0002014
$’000
Cash consideration paid 33(a) 927 30,286
Cash balances acquired 33(b) (441) (1,446)
Outflow of cash 486 28,840

102
NOTES TO THE FINANCIAL STATEMENTSFOR THE YEAR ENDED 31 DECEMBER 15 (CONTINUED)
NOTE 34. DISPOSALS
During the year ended 31 December 2015, the Company disposed of its interest in Data@Ogilvy Pty Limited. The effective date of the transaction was 30 April 2015.
Consolidated Entity
2015 $’000
2014 $’000
(a) Consideration received
Consideration received in cash and cash equivalents — —
Total consideration — —
(b) Analysis of assets and liabilities over which control was lost
Current assets
Cash and cash equivalents 116 —
Other receivables 5 —
Non-current assets
Plant and equipment 2 —
Deferred tax assets 70 —
Current liabilities
Trade payables and other payables (28) —
Current tax liabilities (94) —
Provision (16) —
Disposal of net assets 55 —
(c) Loss on disposal of subsidiary
Disposal of net assets (55) —
Loss on disposal (55) —
(d) Net cash outflow on disposal of subsidiary
Cash and cash equivalent balances disposed of (116) —
Net cash outflow on disposal (116) —
There were no disposals during the year ended 31 December 2014.
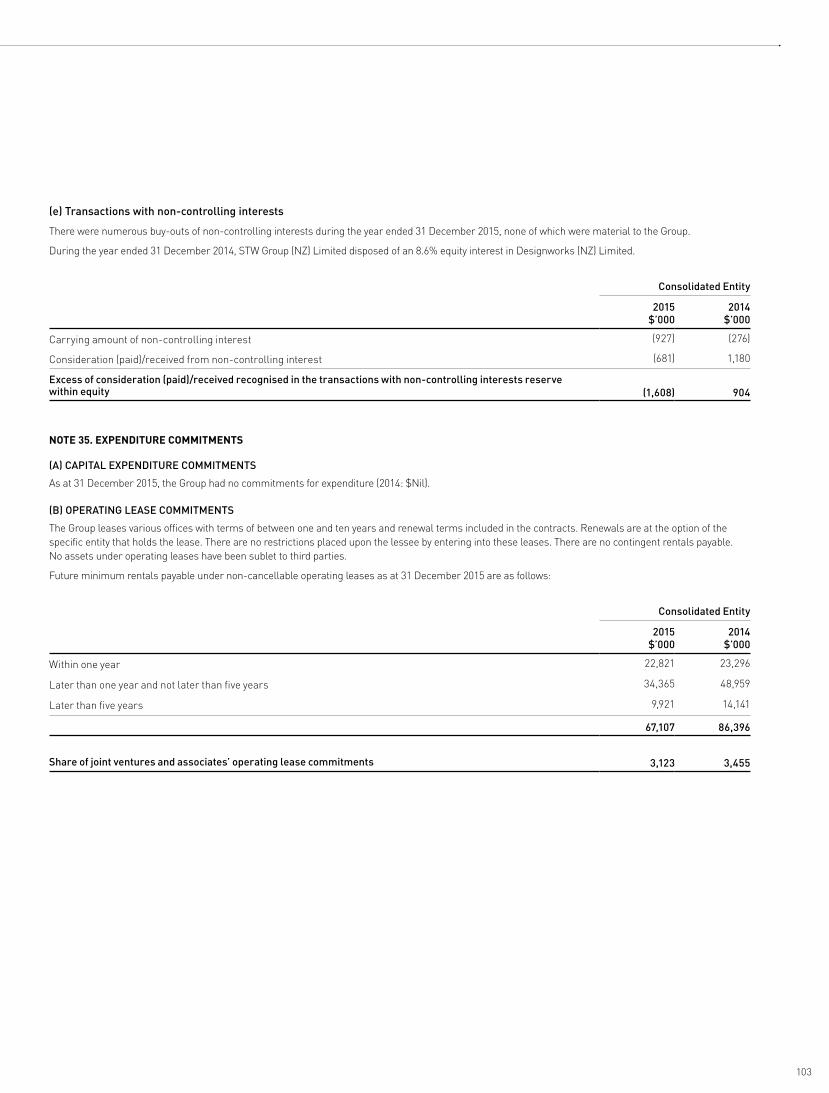
103
(e) Transactions with non-controlling interests
There were numerous buy-outs of non-controlling interests during the year ended 31 December 2015, none of which were material to the Group.
During the year ended 31 December 2014, STW Group (NZ) Limited disposed of an 8.6% equity interest in Designworks (NZ) Limited.
Consolidated Entity
2015 $’000
2014 $’000
Carrying amount of non-controlling interest (927) (276)
Consideration (paid)/received from non-controlling interest (681) 1,180
Excess of consideration (paid)/received recognised in the transactions with non-controlling interests reserve within equity (1,608) 904
NOTE 35. EXPENDITURE COMMITMENTS
(A) CAPITAL EXPENDITURE COMMITMENTS
As at 31 December 2015, the Group had no commitments for expenditure (2014: $Nil).
(B) OPERATING LEASE COMMITMENTS
The Group leases various offices with terms of between one and ten years and renewal terms included in the contracts. Renewals are at the option of the specific entity that holds the lease. There are no restrictions placed upon the lessee by entering into these leases. There are no contingent rentals payable. No assets under operating leases have been sublet to third parties.
Future minimum rentals payable under non-cancellable operating leases as at 31 December 2015 are as follows:
Consolidated Entity
2015 $’000
2014 $’000
Within one year 22,821 23,296
Later than one year and not later than five years 34,365 48,959
Later than five years 9,921 14,141
67,107 86,396
Share of joint ventures and associates’ operating lease commitments 3,123 3,455
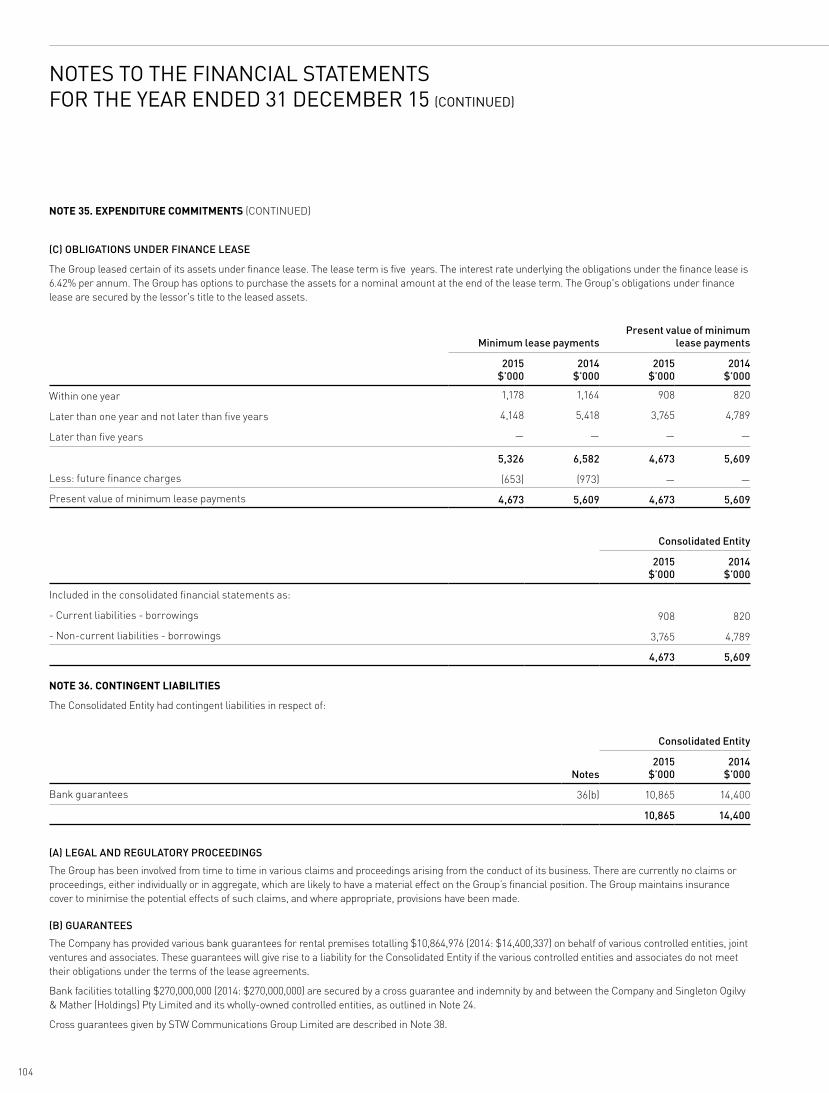
104
NOTES TO THE FINANCIAL STATEMENTSFOR THE YEAR ENDED 31 DECEMBER 15 (CONTINUED)
(C) OBLIGATIONS UNDER FINANCE LEASE
The Group leased certain of its assets under finance lease. The lease term is five years. The interest rate underlying the obligations under the finance lease is 6.42% per annum. The Group has options to purchase the assets for a nominal amount at the end of the lease term. The Group's obligations under finance lease are secured by the lessor's title to the leased assets.
Minimum lease paymentsPresent value of minimum
lease payments
2015 $’000
2014 $’000
2015 $’000
2014 $’000
Within one year 1,178 1,164 908 820
Later than one year and not later than five years 4,148 5,418 3,765 4,789
Later than five years — — — —
5,326 6,582 4,673 5,609
Less: future finance charges (653) (973) — —
Present value of minimum lease payments 4,673 5,609 4,673 5,609
Consolidated Entity
2015 $’000
2014 $’000
Included in the consolidated financial statements as:
- Current liabilities - borrowings 908 820
- Non-current liabilities - borrowings 3,765 4,789
4,673 5,609
NOTE 36. CONTINGENT LIABILITIES
The Consolidated Entity had contingent liabilities in respect of:
Consolidated Entity
Notes2015
$’0002014
$’000
Bank guarantees 36(b) 10,865 14,400
10,865 14,400
(A) LEGAL AND REGULATORY PROCEEDINGS
The Group has been involved from time to time in various claims and proceedings arising from the conduct of its business. There are currently no claims or proceedings, either individually or in aggregate, which are likely to have a material effect on the Group’s financial position. The Group maintains insurance cover to minimise the potential effects of such claims, and where appropriate, provisions have been made.
(B) GUARANTEES
The Company has provided various bank guarantees for rental premises totalling $10,864,976 (2014: $14,400,337) on behalf of various controlled entities, joint ventures and associates. These guarantees will give rise to a liability for the Consolidated Entity if the various controlled entities and associates do not meet their obligations under the terms of the lease agreements.
Bank facilities totalling $270,000,000 (2014: $270,000,000) are secured by a cross guarantee and indemnity by and between the Company and Singleton Ogilvy & Mather (Holdings) Pty Limited and its wholly-owned controlled entities, as outlined in Note 24.
Cross guarantees given by STW Communications Group Limited are described in Note 38.
NOTE 35. EXPENDITURE COMMITMENTS (CONTINUED)

105
NOTE 37. SUBSIDIARIES
(A) LIST OF SUBSIDIARIES
The consolidated financial statements include the financial statements of STW Communications Group Limited and its controlled entities listed in the following table:
Type of share/unit
Ownership interest Country of incorporation/
formation2015 2014
Belshaw Pty Limited* Ordinary 100% 100% Australia
Hoed Holdings Pty Limited* Ordinary 100% 100% Australia
Ogilvy Interactive Pty Limited* Ordinary 100% 100% Australia
Singleton Direct Pty Limited* Ordinary 100% 100% Australia
Singleton Holdings Pty Limited and its controlled entities* Ordinary 100% 100% Australia
– Singleton Ogilvy & Mather (Holdings) Pty Limited and its controlled entities Ordinary 66.67% 66.67% Australia
– Barton Deakin Pty Limited (i) Ordinary 100% 100% Australia
– Bento Productions Pty Limited Ordinary 53% 53% Australia
– Bullseye Group Pty Limited and its controlled entitites Ordinary 100% 100% Australia
• PT Bullseye Ordinary 100% 100% Indonesia
• Bullseye (Asia Pacific) Pty Limited Ordinary 100% 100% Australia
• Bullseye Digital (New Zealand) Limited Ordinary 100% 100% New Zealand
– Hawker Britton Group Pty Limited Ordinary 100% 100% Australia
– Neo@Ogilvy Pty Limited Ordinary 100% 100% Australia
– Octopus Holdings No. 1 Pty Limited Ordinary 100% 100% Australia
– Ogilvy & Mather (Sydney) Pty Limited and its controlled entitites Ordinary 100% 100% Australia
• Ethnic Communications Pty Limited Ordinary 100% 100% Australia
• The Ogilvy Group Superannuation Pty Limited Ordinary 100% 100% Australia
• Singleton OgilvyOne Pty Limited Ordinary 100% 100% Australia
• Singleton Ogilvy & Mather (Melbourne) Pty Limited Ordinary 100% 100% Australia
– Ogilvy Action 2012 Pty Limited Ordinary 51% 51% Australia
– Ogilvy Red Consulting Pty Limited Ordinary 100% 100% Australia
– Ogilvy Action Pty Limited Ordinary 100% 100% Australia
– One20 Pty Limited (formally Red Arrow Strategy Pty Limited - IGN) Ordinary 100% 100% Australia
– Red Card Communications Pty Limited (formally Singleton Ogilvy Interactive Pty Limited)
Ordinary 100% 100% Australia
– Red Tape Commercials Pty Limited Ordinary 100% 100% Australia
– Singleton OgilvyInteractive Pty Limited Ordinary 100% 100% Australia
– Singleton Ogilvy & Mather (NZ) Pty Limited and its controlled entities Ordinary 100% 100% New Zealand
• Ogilvy New Zealand Limited Ordinary 85% 85% New Zealand
STW Investments Pty Limited Ordinary 100% 100% Australia
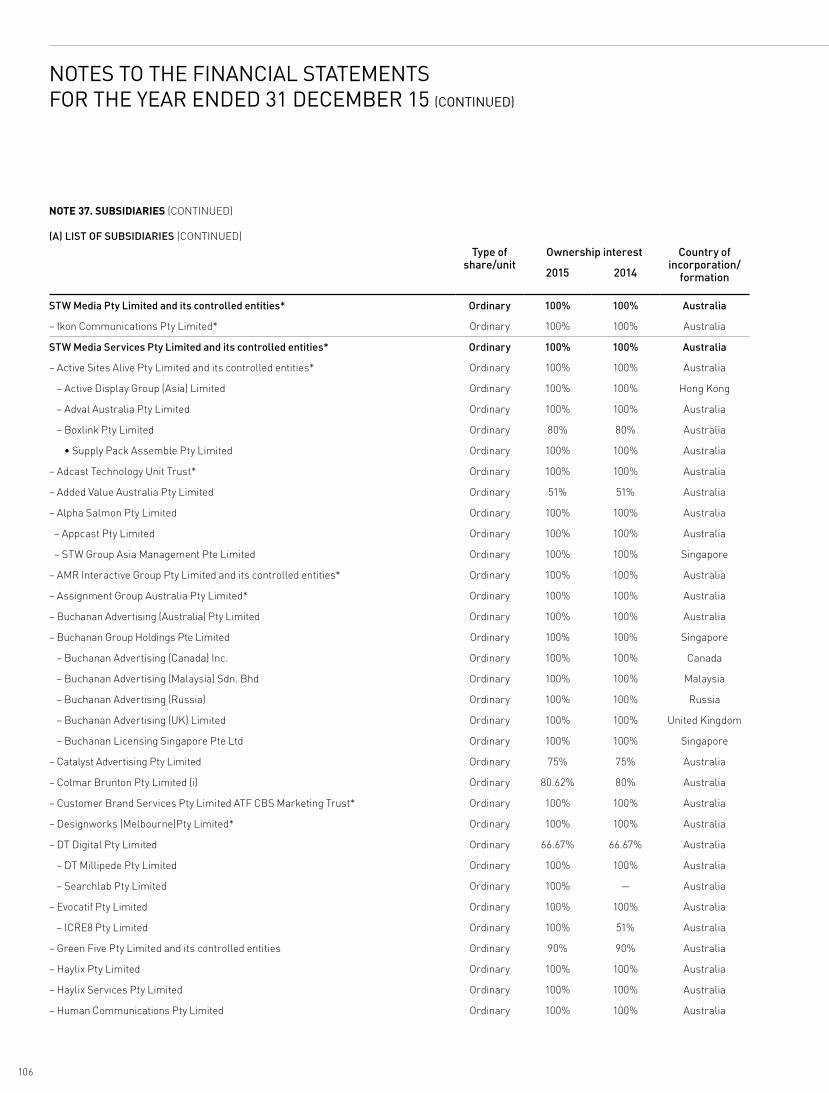
106
NOTES TO THE FINANCIAL STATEMENTSFOR THE YEAR ENDED 31 DECEMBER 15 (CONTINUED)
Type of share/unit
Ownership interest Country of incorporation/
formation2015 2014
STW Media Pty Limited and its controlled entities* Ordinary 100% 100% Australia
– Ikon Communications Pty Limited* Ordinary 100% 100% Australia
STW Media Services Pty Limited and its controlled entities* Ordinary 100% 100% Australia
– Active Sites Alive Pty Limited and its controlled entities* Ordinary 100% 100% Australia
– Active Display Group (Asia) Limited Ordinary 100% 100% Hong Kong
– Adval Australia Pty Limited Ordinary 100% 100% Australia
– Boxlink Pty Limited Ordinary 80% 80% Australia
• Supply Pack Assemble Pty Limited Ordinary 100% 100% Australia
– Adcast Technology Unit Trust* Ordinary 100% 100% Australia
– Added Value Australia Pty Limited Ordinary 51% 51% Australia
– Alpha Salmon Pty Limited Ordinary 100% 100% Australia
– Appcast Pty Limited Ordinary 100% 100% Australia
– STW Group Asia Management Pte Limited Ordinary 100% 100% Singapore
– AMR Interactive Group Pty Limited and its controlled entities* Ordinary 100% 100% Australia
– Assignment Group Australia Pty Limited* Ordinary 100% 100% Australia
– Buchanan Advertising (Australia) Pty Limited Ordinary 100% 100% Australia
– Buchanan Group Holdings Pte Limited Ordinary 100% 100% Singapore
– Buchanan Advertising (Canada) Inc. Ordinary 100% 100% Canada
– Buchanan Advertising (Malaysia) Sdn. Bhd Ordinary 100% 100% Malaysia
– Buchanan Advertising (Russia) Ordinary 100% 100% Russia
– Buchanan Advertising (UK) Limited Ordinary 100% 100% United Kingdom
– Buchanan Licensing Singapore Pte Ltd Ordinary 100% 100% Singapore
– Catalyst Advertising Pty Limited Ordinary 75% 75% Australia
– Colmar Brunton Pty Limited (i) Ordinary 80.62% 80% Australia
– Customer Brand Services Pty Limited ATF CBS Marketing Trust* Ordinary 100% 100% Australia
– Designworks (Melbourne)Pty Limited* Ordinary 100% 100% Australia
– DT Digital Pty Limited Ordinary 66.67% 66.67% Australia
– DT Millipede Pty Limited Ordinary 100% 100% Australia
– Searchlab Pty Limited Ordinary 100% — Australia
– Evocatif Pty Limited Ordinary 100% 100% Australia
– ICRE8 Pty Limited Ordinary 100% 51% Australia
– Green Five Pty Limited and its controlled entities Ordinary 90% 90% Australia
– Haylix Pty Limited Ordinary 100% 100% Australia
– Haylix Services Pty Limited Ordinary 100% 100% Australia
– Human Communications Pty Limited Ordinary 100% 100% Australia
NOTE 37. SUBSIDIARIES (CONTINUED)
(A) LIST OF SUBSIDIARIES (CONTINUED)

107
Type of share/unit
Ownership interest Country of incorporation/
formation2015 2014
STW Media Services Pty Limited and its controlled entities* (continued) Ordinary 100% 100% Australia
– I.M Advertising Pty Limited Ordinary 70% 70% Australia
– I.M Promos Pty Limited Ordinary 70% 70% Australia
– Ikon Communications (Melbourne) Pty Limted Ordinary 100% 100% Australia
– Issues & Images (Holdings) Pty Limited and its controlled entities* Ordinary 100% 100% Australia
– Issues & Images Group Pty Limited* Ordinary 100% 100% Australia
• Badjar Ogilvy Pty Limited Ordinary 66.67% 66.67% Australia
– Allsorts Pty Limited AFT Allsorts Unit Trust Ordinary 100% 100% Australia
– Badjar Advertising Pty Limited Ordinary 100% 100% Australia
› Swat Marketing Pty Limited Ordinary 100% 100% Australia
• Cannings Advisory Services Pty Limited Ordinary 80% 80% Australia
– Cannings Corporate Communication Pty Limited ATF Cannings Unit Trust Ordinary 100% 100% Australia
– Savage & Partners Pty Limited Ordinary 100% 100% Australia
• Cornwell Design Pty Limited Ordinary 100% 100% Australia
• Designworks (Sydney) Pty Limited* Ordinary 100% 100% Australia
• Stacke Services Pty Limited Ordinary 100% 100% Australia
– Lawrence Creative Strategy Pty Limted* Ordinary 100% 100% Australia
– Markitforce Group Pty Limited ATF Markitforce Group Unit Trust and its controlled entities (i)
Ordinary 100% 100% Australia
– Maverick Marketing and Communications Pty Limited Ordinary 80% 80% Australia
– McMann & Tate Agency Pty Ltd (trading as Mighty)* Ordinary 100% 100% Australia
– Moon Communications Pty Limited and its controlled entities* Ordinary 100% 100% Australia
– Newgency Pty Limited* Ordinary 100% 100% Australia
– Oxygen Learning Pty Limited (trading as Phuel) Ordinary 90% 90% Australia
– Peach Advertising Pty Limited* Ordinary 100% 100% Australia
– Picnic Software Pty Limited Ordinary 70% 70% Australia
– Senior Minds Pty Limited Ordinary 100% 65% Australia
– CRU Holdings Pty Limited Ordinary 100% 100% Australia
– Straterjee Pty Limited* Ordinary 100% 100% Australia
– STW Geometry Holdings Pty Limited Ordinary 51% — Australia
– Geometry (Sydney)Pty Limited Ordinary 66.67% — Australia
– STW Group (NZ) Limited and its controlled entities Ordinary 100% 100% New Zealand
– Assignment Group New Zealand Limited Ordinary 100% 100% New Zealand
– Designworks (NZ) Limited (i) Ordinary 91 .4% 91.4% New Zealand
– Ikon Communications (NZ) Limited Ordinary 100% 100% New Zealand
– Union Digital Limited Ordinary 68.33% — New Zealand
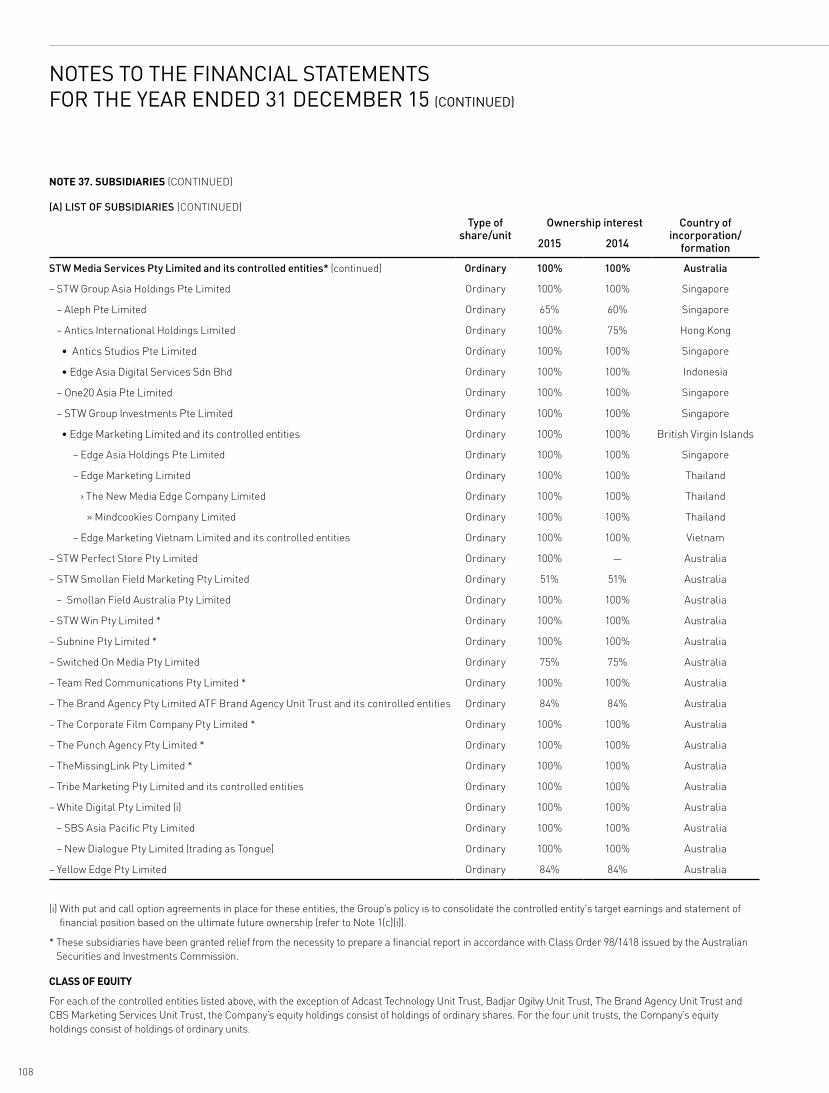
108
NOTES TO THE FINANCIAL STATEMENTSFOR THE YEAR ENDED 31 DECEMBER 15 (CONTINUED)
Type of share/unit
Ownership interest Country of incorporation/
formation2015 2014
STW Media Services Pty Limited and its controlled entities* (continued) Ordinary 100% 100% Australia
– STW Group Asia Holdings Pte Limited Ordinary 100% 100% Singapore
– Aleph Pte Limited Ordinary 65% 60% Singapore
– Antics International Holdings Limited Ordinary 100% 75% Hong Kong
• Antics Studios Pte Limited Ordinary 100% 100% Singapore
• Edge Asia Digital Services Sdn Bhd Ordinary 100% 100% Indonesia
– One20 Asia Pte Limited Ordinary 100% 100% Singapore
– STW Group Investments Pte Limited Ordinary 100% 100% Singapore
• Edge Marketing Limited and its controlled entities Ordinary 100% 100% British Virgin Islands
– Edge Asia Holdings Pte Limited Ordinary 100% 100% Singapore
– Edge Marketing Limited Ordinary 100% 100% Thailand
› The New Media Edge Company Limited Ordinary 100% 100% Thailand
» Mindcookies Company Limited Ordinary 100% 100% Thailand
– Edge Marketing Vietnam Limited and its controlled entities Ordinary 100% 100% Vietnam
– STW Perfect Store Pty Limited Ordinary 100% — Australia
– STW Smollan Field Marketing Pty Limited Ordinary 51% 51% Australia
– Smollan Field Australia Pty Limited Ordinary 100% 100% Australia
– STW Win Pty Limited * Ordinary 100% 100% Australia
– Subnine Pty Limited * Ordinary 100% 100% Australia
– Switched On Media Pty Limited Ordinary 75% 75% Australia
– Team Red Communications Pty Limited * Ordinary 100% 100% Australia
– The Brand Agency Pty Limited ATF Brand Agency Unit Trust and its controlled entities Ordinary 84% 84% Australia
– The Corporate Film Company Pty Limited * Ordinary 100% 100% Australia
– The Punch Agency Pty Limited * Ordinary 100% 100% Australia
– TheMissingLink Pty Limited * Ordinary 100% 100% Australia
– Tribe Marketing Pty Limited and its controlled entities Ordinary 100% 100% Australia
– White Digital Pty Limited (i) Ordinary 100% 100% Australia
– SBS Asia Pacific Pty Limited Ordinary 100% 100% Australia
– New Dialogue Pty Limited (trading as Tongue) Ordinary 100% 100% Australia
– Yellow Edge Pty Limited Ordinary 84% 84% Australia
(i) With put and call option agreements in place for these entities, the Group’s policy is to consolidate the controlled entity's target earnings and statement of financial position based on the ultimate future ownership (refer to Note 1(c)(i)).
* These subsidiaries have been granted relief from the necessity to prepare a financial report in accordance with Class Order 98/1418 issued by the Australian Securities and Investments Commission.
CLASS OF EQUITY
For each of the controlled entities listed above, with the exception of Adcast Technology Unit Trust, Badjar Ogilvy Unit Trust, The Brand Agency Unit Trust and CBS Marketing Services Unit Trust, the Company’s equity holdings consist of holdings of ordinary shares. For the four unit trusts, the Company’s equity holdings consist of holdings of ordinary units.
NOTE 37. SUBSIDIARIES (CONTINUED)
(A) LIST OF SUBSIDIARIES (CONTINUED)
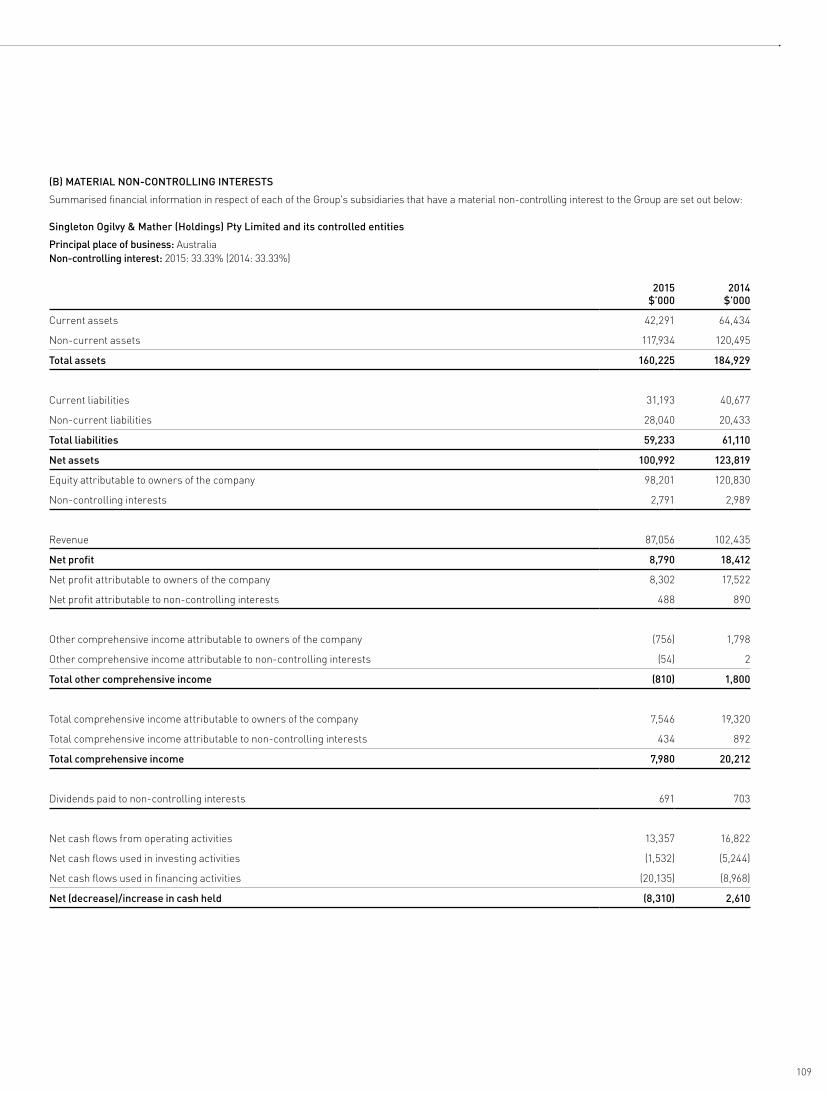
109
(B) MATERIAL NON-CONTROLLING INTERESTS
Summarised financial information in respect of each of the Group's subsidiaries that have a material non-controlling interest to the Group are set out below:
Singleton Ogilvy & Mather (Holdings) Pty Limited and its controlled entities
Principal place of business: Australia Non-controlling interest: 2015: 33.33% (2014: 33.33%)
2015 $’000
2014 $’000
Current assets 42,291 64,434
Non-current assets 117,934 120,495
Total assets 160,225 184,929
Current liabilities 31,193 40,677
Non-current liabilities 28,040 20,433
Total liabilities 59,233 61,110
Net assets 100,992 123,819
Equity attributable to owners of the company 98,201 120,830
Non-controlling interests 2,791 2,989
Revenue 87,056 102,435
Net profit 8,790 18,412
Net profit attributable to owners of the company 8,302 17,522
Net profit attributable to non-controlling interests 488 890
Other comprehensive income attributable to owners of the company (756) 1,798
Other comprehensive income attributable to non-controlling interests (54) 2
Total other comprehensive income (810) 1,800
Total comprehensive income attributable to owners of the company 7,546 19,320
Total comprehensive income attributable to non-controlling interests 434 892
Total comprehensive income 7,980 20,212
Dividends paid to non-controlling interests 691 703
Net cash flows from operating activities 13,357 16,822
Net cash flows used in investing activities (1,532) (5,244)
Net cash flows used in financing activities (20,135) (8,968)
Net (decrease)/increase in cash held (8,310) 2,610
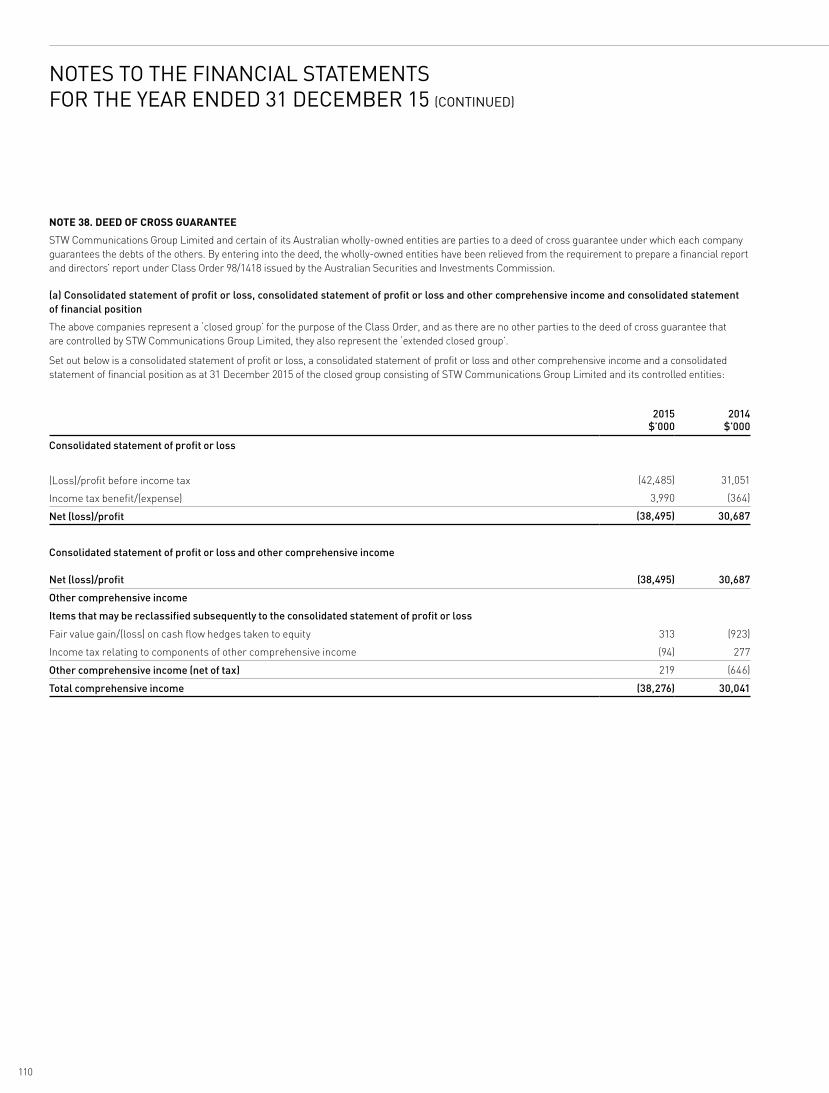
110
NOTES TO THE FINANCIAL STATEMENTSFOR THE YEAR ENDED 31 DECEMBER 15 (CONTINUED)
NOTE 38. DEED OF CROSS GUARANTEE
STW Communications Group Limited and certain of its Australian wholly-owned entities are parties to a deed of cross guarantee under which each company guarantees the debts of the others. By entering into the deed, the wholly-owned entities have been relieved from the requirement to prepare a financial report and directors’ report under Class Order 98/1418 issued by the Australian Securities and Investments Commission.
(a) Consolidated statement of profit or loss, consolidated statement of profit or loss and other comprehensive income and consolidated statement of financial position
The above companies represent a ‘closed group’ for the purpose of the Class Order, and as there are no other parties to the deed of cross guarantee that are controlled by STW Communications Group Limited, they also represent the ‘extended closed group’.
Set out below is a consolidated statement of profit or loss, a consolidated statement of profit or loss and other comprehensive income and a consolidated statement of financial position as at 31 December 2015 of the closed group consisting of STW Communications Group Limited and its controlled entities:
2015 $’000
2014 $’000
Consolidated statement of profit or loss
(Loss)/profit before income tax (42,485) 31,051
Income tax benefit/(expense) 3,990 (364)
Net (loss)/profit (38,495) 30,687
Consolidated statement of profit or loss and other comprehensive income
Net (loss)/profit (38,495) 30,687
Other comprehensive income
Items that may be reclassified subsequently to the consolidated statement of profit or loss
Fair value gain/(loss) on cash flow hedges taken to equity 313 (923)
Income tax relating to components of other comprehensive income (94) 277
Other comprehensive income (net of tax) 219 (646)
Total comprehensive income (38,276) 30,041
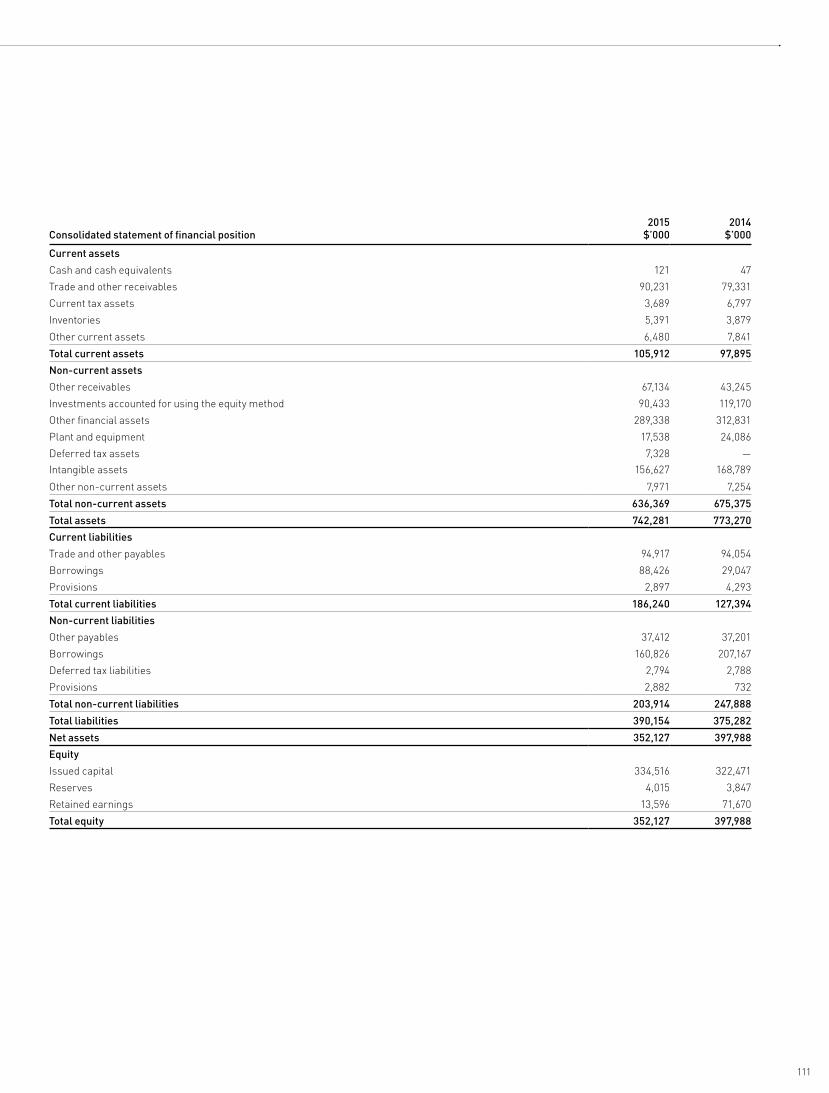
111
Consolidated statement of financial position2015
$’0002014
$’000
Current assets
Cash and cash equivalents 121 47
Trade and other receivables 90,231 79,331
Current tax assets 3,689 6,797
Inventories 5,391 3,879
Other current assets 6,480 7,841
Total current assets 105,912 97,895
Non-current assets
Other receivables 67,134 43,245
Investments accounted for using the equity method 90,433 119,170
Other financial assets 289,338 312,831
Plant and equipment 17,538 24,086
Deferred tax assets 7,328 —
Intangible assets 156,627 168,789
Other non-current assets 7,971 7,254
Total non-current assets 636,369 675,375
Total assets 742,281 773,270
Current liabilities
Trade and other payables 94,917 94,054
Borrowings 88,426 29,047
Provisions 2,897 4,293
Total current liabilities 186,240 127,394
Non-current liabilities
Other payables 37,412 37,201
Borrowings 160,826 207,167
Deferred tax liabilities 2,794 2,788
Provisions 2,882 732
Total non-current liabilities 203,914 247,888
Total liabilities 390,154 375,282
Net assets 352,127 397,988
Equity
Issued capital 334,516 322,471
Reserves 4,015 3,847
Retained earnings 13,596 71,670
Total equity 352,127 397,988
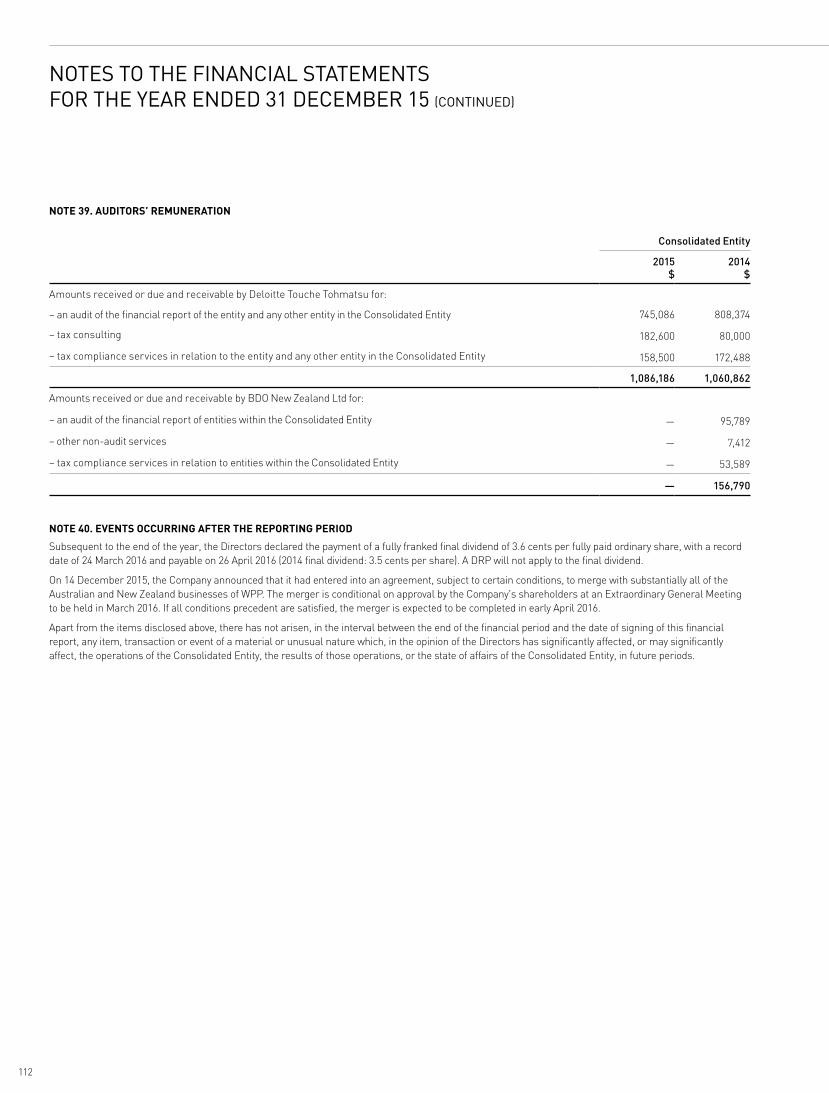
112
NOTES TO THE FINANCIAL STATEMENTSFOR THE YEAR ENDED 31 DECEMBER 15 (CONTINUED)
NOTE 39. AUDITORS’ REMUNERATION
Consolidated Entity
2015 $
2014 $
Amounts received or due and receivable by Deloitte Touche Tohmatsu for:
– an audit of the financial report of the entity and any other entity in the Consolidated Entity 745,086 808,374
– tax consulting 182,600 80,000
– tax compliance services in relation to the entity and any other entity in the Consolidated Entity 158,500 172,488
1,086,186 1,060,862
Amounts received or due and receivable by BDO New Zealand Ltd for:
– an audit of the financial report of entities within the Consolidated Entity — 95,789
– other non-audit services — 7,412
– tax compliance services in relation to entities within the Consolidated Entity — 53,589
— 156,790
NOTE 40. EVENTS OCCURRING AFTER THE REPORTING PERIOD
Subsequent to the end of the year, the Directors declared the payment of a fully franked final dividend of 3.6 cents per fully paid ordinary share, with a record date of 24 March 2016 and payable on 26 April 2016 (2014 final dividend: 3.5 cents per share). A DRP will not apply to the final dividend.
On 14 December 2015, the Company announced that it had entered into an agreement, subject to certain conditions, to merge with substantially all of the Australian and New Zealand businesses of WPP. The merger is conditional on approval by the Company's shareholders at an Extraordinary General Meeting to be held in March 2016. If all conditions precedent are satisfied, the merger is expected to be completed in early April 2016.
Apart from the items disclosed above, there has not arisen, in the interval between the end of the financial period and the date of signing of this financial report, any item, transaction or event of a material or unusual nature which, in the opinion of the Directors has significantly affected, or may significantly affect, the operations of the Consolidated Entity, the results of those operations, or the state of affairs of the Consolidated Entity, in future periods.
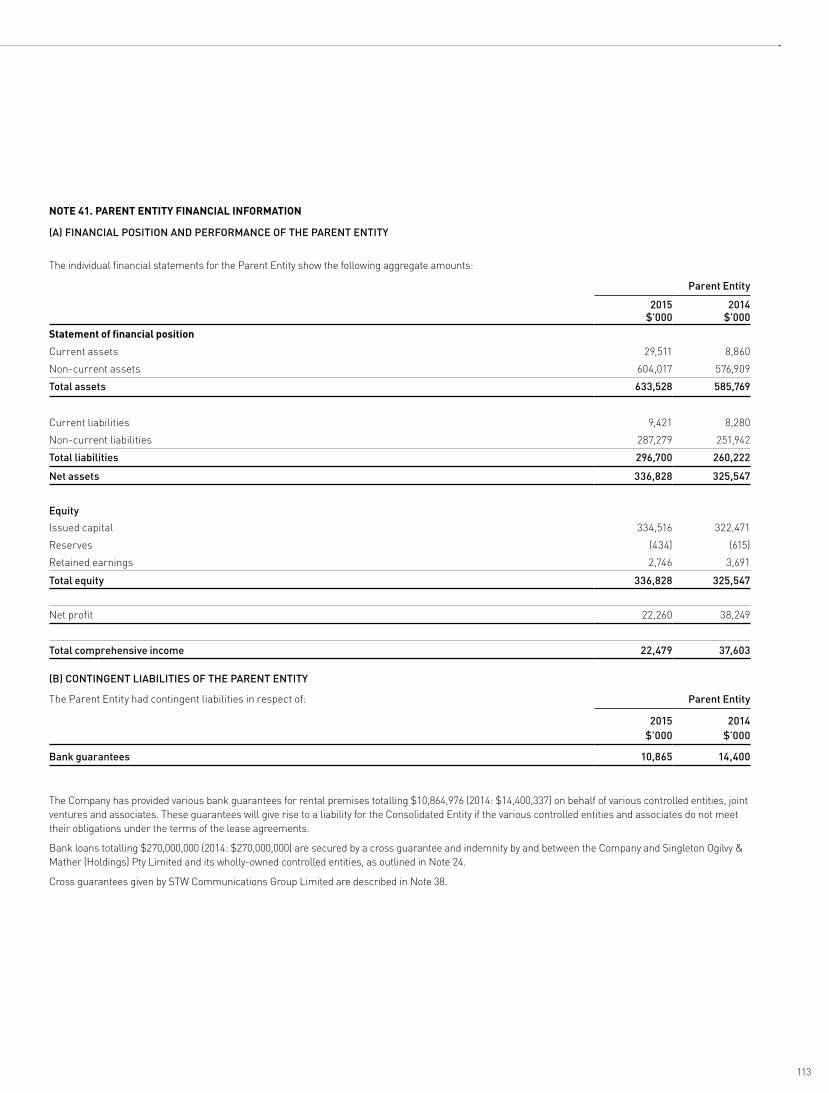
113
NOTE 41. PARENT ENTITY FINANCIAL INFORMATION
(A) FINANCIAL POSITION AND PERFORMANCE OF THE PARENT ENTITY
The individual financial statements for the Parent Entity show the following aggregate amounts:
Parent Entity
2015 $’000
2014 $’000
Statement of financial position
Current assets 29,511 8,860
Non-current assets 604,017 576,909
Total assets 633,528 585,769
Current liabilities 9,421 8,280
Non-current liabilities 287,279 251,942
Total liabilities 296,700 260,222
Net assets 336,828 325,547
Equity
Issued capital 334,516 322,471
Reserves (434) (615)
Retained earnings 2,746 3,691
Total equity 336,828 325,547
Net profit 22,260 38,249
Total comprehensive income 22,479 37,603
(B) CONTINGENT LIABILITIES OF THE PARENT ENTITY
The Parent Entity had contingent liabilities in respect of: Parent Entity
2015$’000
2014$’000
Bank guarantees 10,865 14,400
The Company has provided various bank guarantees for rental premises totalling $10,864,976 (2014: $14,400,337) on behalf of various controlled entities, joint ventures and associates. These guarantees will give rise to a liability for the Consolidated Entity if the various controlled entities and associates do not meet their obligations under the terms of the lease agreements.
Bank loans totalling $270,000,000 (2014: $270,000,000) are secured by a cross guarantee and indemnity by and between the Company and Singleton Ogilvy & Mather (Holdings) Pty Limited and its wholly-owned controlled entities, as outlined in Note 24.
Cross guarantees given by STW Communications Group Limited are described in Note 38.
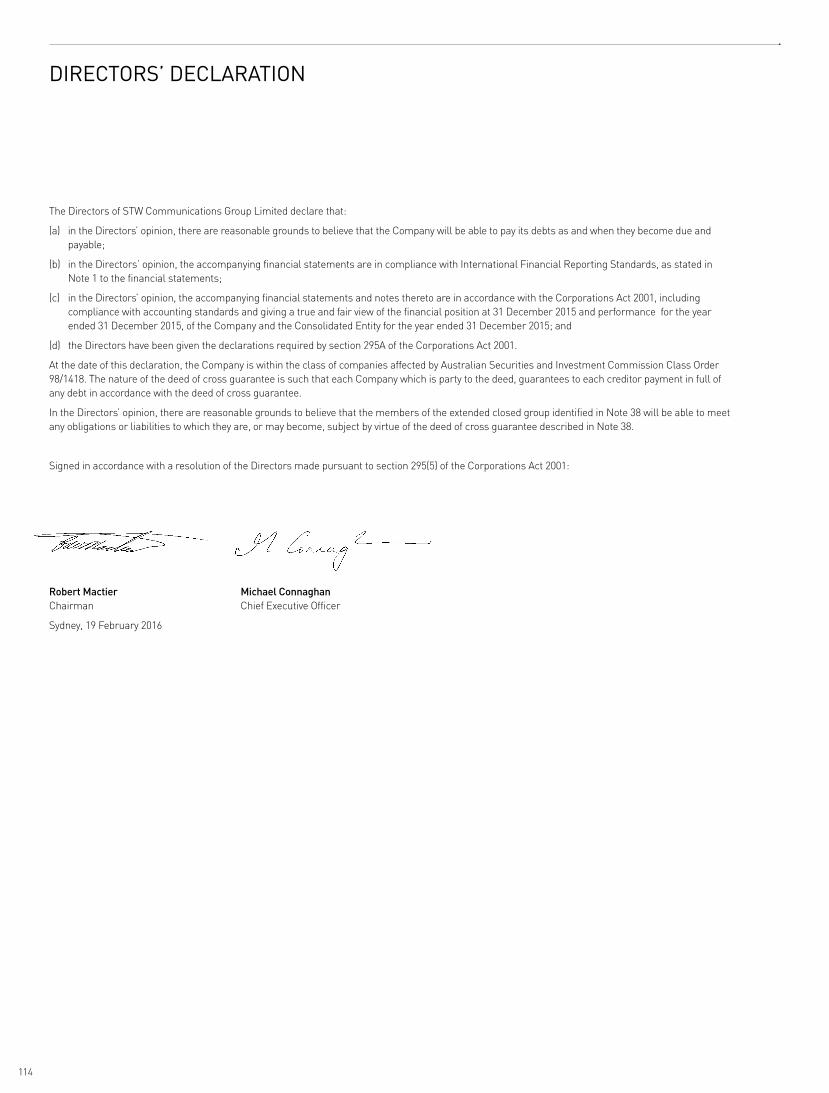
114
The Directors of STW Communications Group Limited declare that:
(a) in the Directors’ opinion, there are reasonable grounds to believe that the Company will be able to pay its debts as and when they become due and payable;
(b) in the Directors’ opinion, the accompanying financial statements are in compliance with International Financial Reporting Standards, as stated in Note 1 to the financial statements;
(c) in the Directors’ opinion, the accompanying financial statements and notes thereto are in accordance with the Corporations Act 2001, including compliance with accounting standards and giving a true and fair view of the financial position at 31 December 2015 and performance for the year ended 31 December 2015, of the Company and the Consolidated Entity for the year ended 31 December 2015; and
(d) the Directors have been given the declarations required by section 295A of the Corporations Act 2001.
At the date of this declaration, the Company is within the class of companies affected by Australian Securities and Investment Commission Class Order 98/1418. The nature of the deed of cross guarantee is such that each Company which is party to the deed, guarantees to each creditor payment in full of any debt in accordance with the deed of cross guarantee.
In the Directors’ opinion, there are reasonable grounds to believe that the members of the extended closed group identified in Note 38 will be able to meet any obligations or liabilities to which they are, or may become, subject by virtue of the deed of cross guarantee described in Note 38.
Signed in accordance with a resolution of the Directors made pursuant to section 295(5) of the Corporations Act 2001:
Robert Mactier Michael Connaghan Chairman Chief Executive Officer
Sydney, 19 February 2016
DIRECTORS’ DECLARATION
115
Independent Auditor’s Report to the Members of STW Communications Group Limited
Report on the Financial Report
We have audited the accompanying financial report of STW Communications Group Limited, which comprises the consolidated statement of financial position as at 31 December 2015, the consolidated statement of profit or loss, the consolidated statement of profit or loss and other comprehensive income, the consolidated cash flow statement and the consolidated statement of changes in equity for the year ended on that date, notes comprising a summary of significant accounting policies and other explanatory information, and the directors’ declaration of the Consolidated Entity comprising the company and the entities it controlled at the year’s end or from time to time during the financial year as set out on pages 47 to 114.
Directors’ Responsibility for the Financial Report
The directors of the company are responsible for the preparation of the financial report that gives a true and fair view in accordance with Australian Accounting Standards and the Corporations Act 2001 and for such internal control as the directors determine is necessary to enable the preparation of the financial report that gives a true and fair view and is free from material misstatement, whether due to fraud or error. In Note 1, the directors also state, in accordance with Accounting Standard AASB 101 Presentation of Financial Statements, that the consolidated financial statements comply with International Financial Reporting Standards.
Auditor’s Responsibility
Our responsibility is to express an opinion on the financial report based on our audit. We conducted our audit in accordance with Australian Auditing Standards. Those standards require that we comply with relevant ethical requirements relating to audit engagements and plan and perform the audit to obtain reasonable assurance whether the financial report is free from material misstatement.
An audit involves performing procedures to obtain audit evidence about the amounts and disclosures in the financial report. The procedures selected depend on the auditor’s judgement, including the assessment of the risks of material misstatement of the financial report, whether due to fraud or error. In making those risk assessments, the auditor considers internal control, relevant to the entity’s preparation of the financial report that gives a true and fair view, in order to design audit procedures that are appropriate in the circumstances, but not for the purpose of expressing an opinion on the effectiveness of the entity’s internal control. An audit also includes evaluating the appropriateness of accounting policies used and the reasonableness of accounting estimates made by the directors, as well as evaluating the overall presentation of the financial report.
Liability limited by a scheme approved under Professional Standards Legislation.Member of Deloitte Touche Tohmatsu
Deloitte Touche Tohmatsu ABN 74 490 121 060
Grosvenor Place 225 George Street Sydney NSW 2000 PO Box N250 Grosvenor Place Sydney NSW 1220 Australia
Tel: +61 (0) 2 9322 7000 Fax: +61 (0) 2 9322 7001 www.deloitte.com.au
INDEPENDENT AUDITOR’S REPORT
116
We believe that the audit evidence we have obtained is sufficient and appropriate to provide a basis for our audit opinion.
Auditor’s Independence Declaration
In conducting our audit, we have complied with the independence requirements of the Corporations Act 2001. We confirm that the independence declaration required by the Corporations Act 2001, which has been given to the directors of STW Communications Group Limited, would be in the same terms if given to the directors as at the time of this auditor’s report.
Auditor’s Opinion
In our opinion:
(a) the financial report of STW Communications Group Limited is in accordance with the Corporations Act 2001, including:
(i) giving a true and fair view of the Consolidated Entity’s financial position as at 31 December 2015 and of its performance for the year ended on that date; and
(ii) complying with Australian Accounting Standards and the Corporations Regulations 2001; and
(b) the consolidated financial statements also comply with International Financial Reporting Standards as disclosed in Note 1.
Report on the Remuneration Report
We have audited the Remuneration Report included in pages 33 to 46 of the directors’ report for the year ended 31 December 2015. The directors of the company are responsible for the preparation and presentation of the Remuneration Report in accordance with section 300A of the Corporations Act 2001. Our responsibility is to express an opinion on the Remuneration Report, based on our audit conducted in accordance with Australian Auditing Standards.
Auditor’s Opinion
In our opinion, the Remuneration Report of STW Communications Group Limited for the year ended 31 December 2015, complies with section 300A of the Corporations Act 2001.
DELOITTE TOUCHE TOHMATSU
S C Gustafson Partner Chartered Accountants Sydney, 19 February 2016
Liability limited by a scheme approved under Professional Standards Legislation. Member of Deloitte Touche Tohmatsu
INDEPENDENT AUDITOR’S REPORT (CONTINUED)

117
ASX ADDITIONAL INFORMATION AS AT 16 MARCH 16
Additional information required by the Australian Securities Exchange (“ASX”) and not shown elsewhere in this report is as follows. The information is current as at 16 March 2016 unless otherwise stated.
(A) DISTRIBUTION OF EQUITY SECURITIES
The number of shareholders, by size of holding, in each class of shares is:
Ordinary shares
Number of holders
Number of shares
1-1,000 1,649 660,669
1,001-5,000 1,832 5,334,633
5,001-10,000 1,130 8,959,964
10,001-100,000 1,796 52,027,588
100,001 and over 135 362,207,191
6,542 429,190,045
(B) MARKETABLE PARCEL
The number of shareholders holding less than a marketable parcel of shares (ie $500 worth of shares), is 1,028. In accordance with ASX Business Rules, the last sale price of the Company’s shares on the ASX on 16 March 2016 was used to determine the number of shares in a marketable parcel.
(C) TWENTY LARGEST SHAREHOLDERS
The names of the 20 largest holders of quoted shares are:
Quoted Ordinary Shares
Number of Shares
Percentage of Shares
Cavendish Square Holdings BV 101,080,298 23.55
HSBC Custody Nominees (Australia) Limited 89,104,465 20.76
JP Morgan Nominees Australia Limited 52,535,357 12.24
National Nominees Limited 30,199,555 7.04
Citicorp Nominees Pty Limited 26,049,875 6.07
BNP Paribas Noms Pty Ltd (DRP) 6,964,953 1.62
HSBC Custody Nominees (Australia) Limited - GSCO ECA 6,047,721 1.41
RBC Investor Services Australia Pty Limited (VFA A/C) 3,864,706 0.90
Citicorp Nominees Pty Limited (Colonial First State INV A/C) 3,697,159 0.86
RBC Investor Services Australia Nominees Pty Limited (BKCUST A/C) 3,445,142 0.80
RBC Investor Services Australia Nominees Pty Limited (PISELECT) 3,325,875 0.77
Buttonwood Nominees Pty Ltd 2,138,491 0.50
Aust Executor Trustees Ltd (Flannery Foundation) 1,666,893 0.39
CPU Share Plans Pty Ltd 1,562,286 0.36
Warbont Nominees Pty Ltd (Unpaid Entrepot A/C) 1,061,960 0.25
Ecapital Nominees Pty Limited (Accumulation A/C) 1,046,474 0.24
Aust Executor Trustees Ltd (Henroth Pty Limited) 1,000,000 0.23
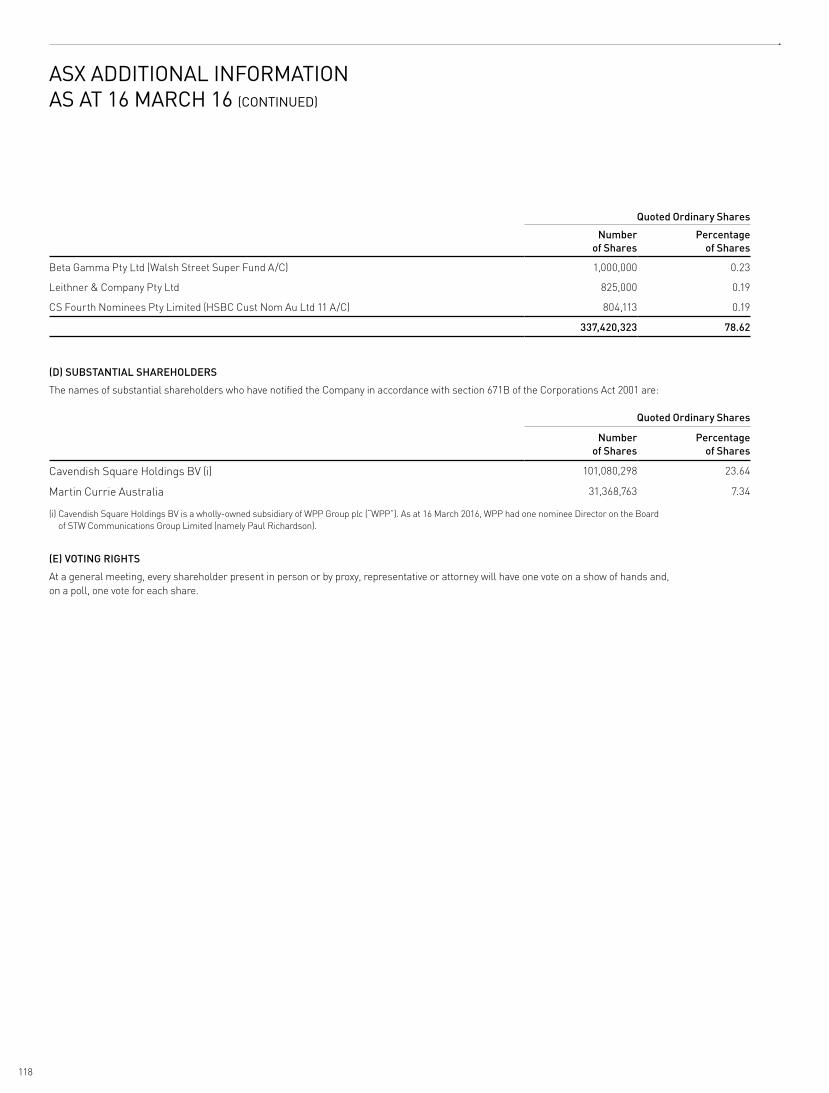
118
Quoted Ordinary Shares
Number of Shares
Percentage of Shares
Beta Gamma Pty Ltd (Walsh Street Super Fund A/C) 1,000,000 0.23
Leithner & Company Pty Ltd 825,000 0.19
CS Fourth Nominees Pty Limited (HSBC Cust Nom Au Ltd 11 A/C) 804,113 0.19
337,420,323 78.62
(D) SUBSTANTIAL SHAREHOLDERS
The names of substantial shareholders who have notified the Company in accordance with section 671B of the Corporations Act 2001 are:
Quoted Ordinary Shares
Number of Shares
Percentage of Shares
Cavendish Square Holdings BV (i) 101,080,298 23.64
Martin Currie Australia 31,368,763 7.34
(i) Cavendish Square Holdings BV is a wholly-owned subsidiary of WPP Group plc (“WPP”). As at 16 March 2016, WPP had one nominee Director on the Board of STW Communications Group Limited (namely Paul Richardson).
(E) VOTING RIGHTS
At a general meeting, every shareholder present in person or by proxy, representative or attorney will have one vote on a show of hands and, on a poll, one vote for each share.
ASX ADDITIONAL INFORMATION AS AT 16 MARCH 16 (CONTINUED)
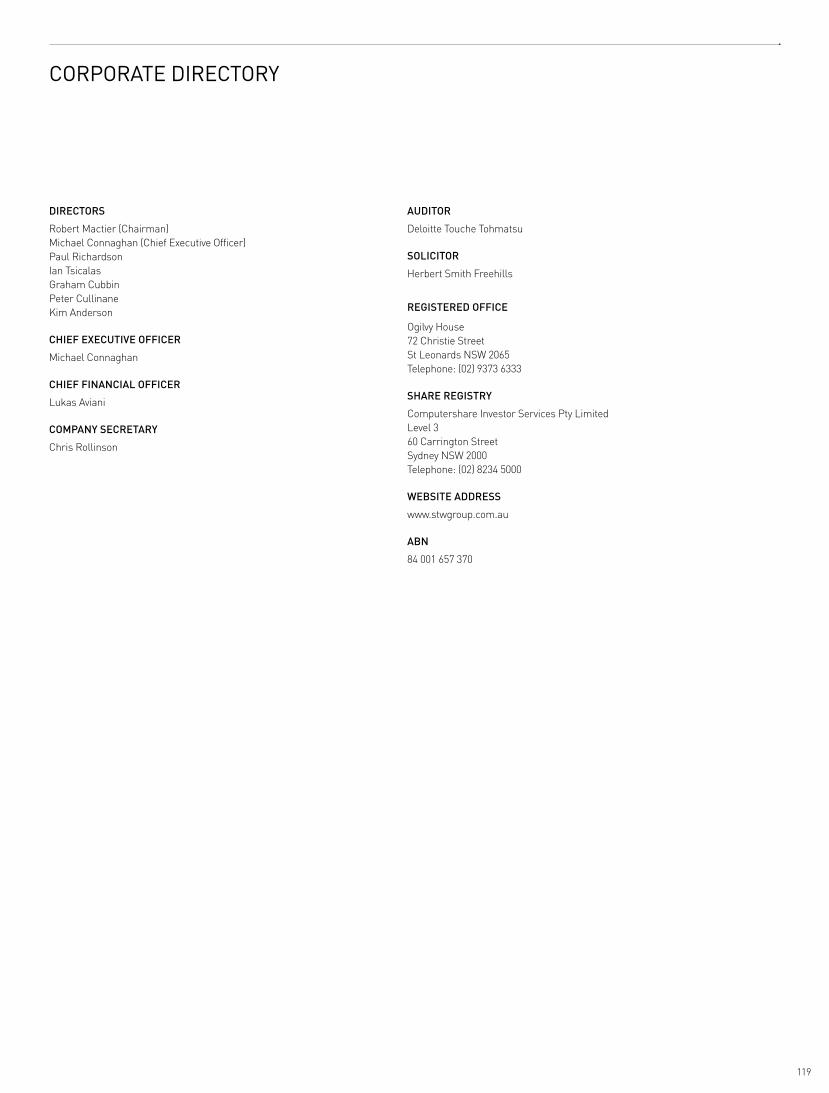
119
CORPORATE DIRECTORY
DIRECTORS
Robert Mactier (Chairman)Michael Connaghan (Chief Executive Officer) Paul RichardsonIan TsicalasGraham CubbinPeter CullinaneKim Anderson
CHIEF EXECUTIVE OFFICER
Michael Connaghan
CHIEF FINANCIAL OFFICER
Lukas Aviani
COMPANY SECRETARY
Chris Rollinson
AUDITOR
Deloitte Touche Tohmatsu
SOLICITOR
Herbert Smith Freehills
REGISTERED OFFICE
Ogilvy House72 Christie StreetSt Leonards NSW 2065Telephone: (02) 9373 6333
SHARE REGISTRY
Computershare Investor Services Pty LimitedLevel 360 Carrington StreetSydney NSW 2000Telephone: (02) 8234 5000
WEBSITE ADDRESS
www.stwgroup.com.au
ABN
84 001 657 370

Ogilvy House72 Christie StreetSt Leonards NSW 2065Telephone: (02) 9373 6333
www.stwgroup.com.au


![EDM09 stw [Kompatibilitätsmodus]](https://img.dokumen.tips/doc/110x75/62a1d7570526fc06fc447bd3/edm09-stw-kompatibilittsmodus.jpg)


![Obsessed [November 2013]](https://img.dokumen.tips/doc/110x75/568c49df1a28ab491695e5d9/obsessed-november-2013.jpg)