Embed Size (px)
Citation preview
JAPAN INTERNATIONAL COOPERATION AGENCY (JICA)
MINISTRY OF FINANCE THE REPUBLIC OF INDONESIA
STUDY ON FISCAL AND NON-FISCAL INCENTIVES TO ACCELERATE
PRIVATE SECTOR GEOTHERMAL ENERGY DEVELOPMENT
IN THE REPUBLIC OF INDONESIA
FINAL REPORT
(SUMMARY)
JULY 2009
West Japan Engineering Consultants, Inc.

Study on Fiscal and Non-fiscal Incentives to Accelerate Private Sector Geothermal Energy Development in the Republic of Indonesia Final Report (Summary)
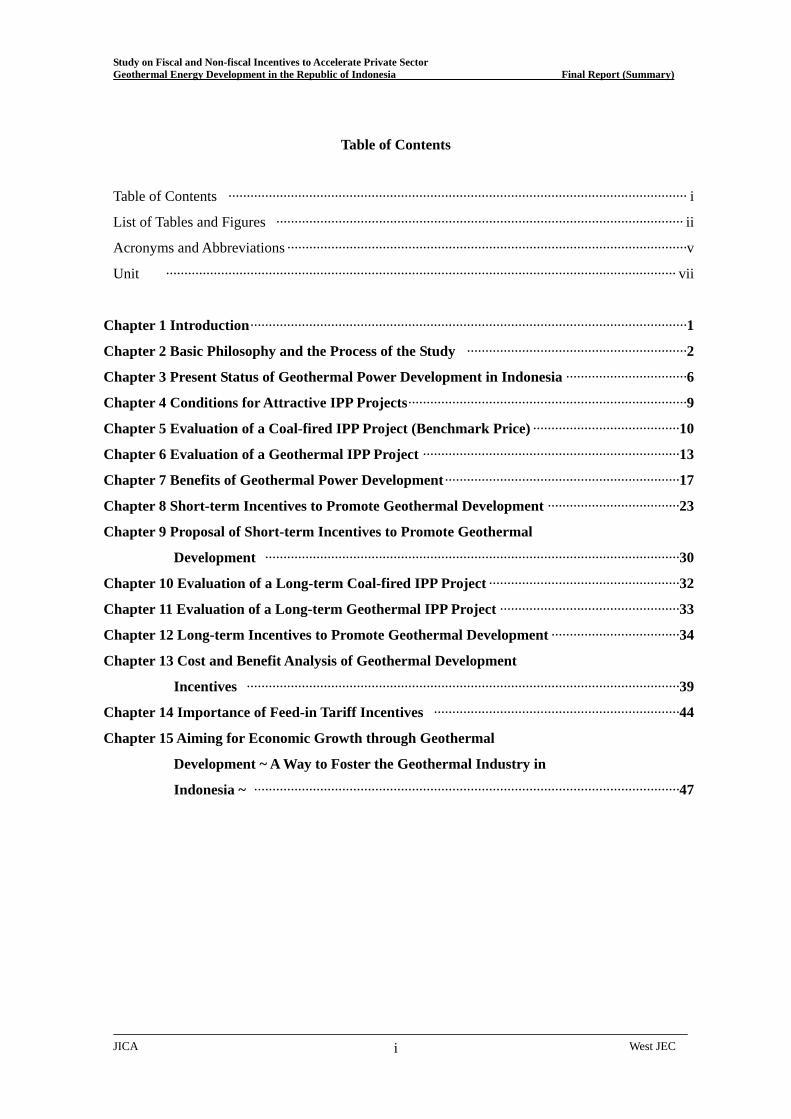
Table of Contents
Table of Contents ····························································································································· i
List of Tables and Figures ··············································································································· ii
Acronyms and Abbreviations ·············································································································v
Unit ··········································································································································· vii
Chapter 1 Introduction·······················································································································1
Chapter 2 Basic Philosophy and the Process of the Study ····························································2
Chapter 3 Present Status of Geothermal Power Development in Indonesia ·································6
Chapter 4 Conditions for Attractive IPP Projects············································································9
Chapter 5 Evaluation of a Coal-fired IPP Project (Benchmark Price) ········································10
Chapter 6 Evaluation of a Geothermal IPP Project ······································································13
Chapter 7 Benefits of Geothermal Power Development································································17
Chapter 8 Short-term Incentives to Promote Geothermal Development ····································23
Chapter 9 Proposal of Short-term Incentives to Promote Geothermal
Development ·················································································································30
Chapter 10 Evaluation of a Long-term Coal-fired IPP Project ····················································32
Chapter 11 Evaluation of a Long-term Geothermal IPP Project ·················································33
Chapter 12 Long-term Incentives to Promote Geothermal Development ···································34
Chapter 13 Cost and Benefit Analysis of Geothermal Development
Incentives ······················································································································39
Chapter 14 Importance of Feed-in Tariff Incentives ···································································44
Chapter 15 Aiming for Economic Growth through Geothermal
Development ~ A Way to Foster the Geothermal Industry in
Indonesia ~ ····················································································································47
JICA West JEC i

Study on Fiscal and Non-fiscal Incentives to Accelerate Private Sector Geothermal Energy Development in the Republic of Indonesia Final Report (Summary)
List of Tables and Figures
<List of Figures>
Chapter 2
Fig. 2.1-1 CO2 emissions from energy use ···············································································2
Fig. 2.1-2 World CO2 emitters ··································································································2
Fig. 2.2-5 Diffusion of renewable energy and government support ·········································3
Fig. 2.7-1 The role of government in promoting geothermal energy
development ·············································································································4
Chapter 3
Fig. 3.4-1 Selling prices and geothermal activities···································································7
Chapter 4
Fig. 4-1 IPP project and its stakeholders················································································9
Chapter 5
Fig. 5.3-1 Selling Price for coal-fired IPP project (Benchmark Price) ·································12
Chapter 6
Fig. 6.1-1 Geothermal development process for 60 MW plant ············································14
Chapter 7
Fig. 7.2-5 Fuel reduction premium of geothermal power (2007 -2016) ·······························18
Fig. 7.3-1 Export value of fuel saved through use of geothermal power (2007 –
2016) ····················································································································19
Fig. 7.4-1 Selling price composition comparison of geothermal and coal-fired
Power ~ For Benchmark oil price at 100 USD/barrel ~·········································20
Fig. 7.6-1 Total value of benefits of geothermal power generation (2007 –
2016) ····················································································································21
Fig. 7.6-2 Total value of benefits of geothermal power and its beneficiaries ·························21
Fig. 7.7-1 Ripple effect of 60 MW geothermal power plant construction······························22
Chapter 8
Fig. 8.1-3 Estimated selling prices of power by fuel sources ·················································23
Fig. 8.1-4 Estimated selling prices of power taking into account for opportunity
costs························································································································24
Fig. 8.1-5 Estimated selling price of power accounting for environment impact
costs························································································································24
Fig. 8.5-5 Effect of tax Incentives ··························································································28
JICA West JEC ii
Study on Fiscal and Non-fiscal Incentives to Accelerate Private Sector Geothermal Energy Development in the Republic of Indonesia Final Report (Summary)
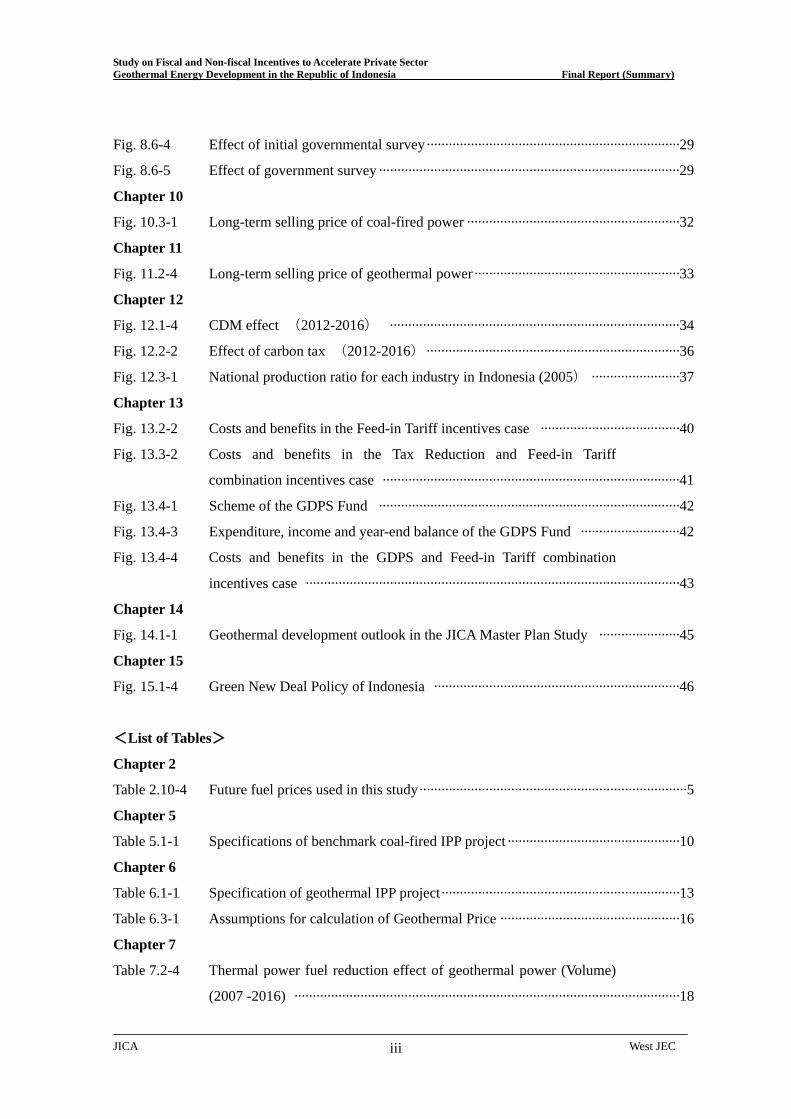
Fig. 8.6-4 Effect of initial governmental survey·····································································29
Fig. 8.6-5 Effect of government survey ··················································································29
Chapter 10
Fig. 10.3-1 Long-term selling price of coal-fired power ··························································32
Chapter 11
Fig. 11.2-4 Long-term selling price of geothermal power························································33
Chapter 12
Fig. 12.1-4 CDM effect (2012-2016) ···············································································34
Fig. 12.2-2 Effect of carbon tax (2012-2016)·····································································36
Fig. 12.3-1 National production ratio for each industry in Indonesia (2005) ························37
Chapter 13
Fig. 13.2-2 Costs and benefits in the Feed-in Tariff incentives case ······································40
Fig. 13.3-2 Costs and benefits in the Tax Reduction and Feed-in Tariff
combination incentives case ·················································································41
Fig. 13.4-1 Scheme of the GDPS Fund ··················································································42
Fig. 13.4-3 Expenditure, income and year-end balance of the GDPS Fund ···························42
Fig. 13.4-4 Costs and benefits in the GDPS and Feed-in Tariff combination
incentives case ······································································································43
Chapter 14
Fig. 14.1-1 Geothermal development outlook in the JICA Master Plan Study ······················45
Chapter 15
Fig. 15.1-4 Green New Deal Policy of Indonesia ···································································46
<List of Tables>
Chapter 2
Table 2.10-4 Future fuel prices used in this study·········································································5
Chapter 5
Table 5.1-1 Specifications of benchmark coal-fired IPP project···············································10
Chapter 6
Table 6.1-1 Specification of geothermal IPP project·································································13
Table 6.3-1 Assumptions for calculation of Geothermal Price ·················································16
Chapter 7
Table 7.2-4 Thermal power fuel reduction effect of geothermal power (Volume)
(2007 -2016) ·········································································································18
JICA West JEC iii
Study on Fiscal and Non-fiscal Incentives to Accelerate Private Sector Geothermal Energy Development in the Republic of Indonesia Final Report (Summary)
Chapter 8
Table 8.2-1 Classification of Renewable Energy Promotion Policies·······································26
Table 8.3-6 Proposal of FIT prices ····························································································27
Table 8.3-10 Proposal of FIT prices (20 MW or less capacity case) ········································27
Chapter 10
Table 10.2-4 Forecast of unit construction cost of coal-fired plant in 2007 and
2025························································································································32
Chapter 11
Table 11.1-4 Forecast of unit construction cost of geothermal plant in 2007 and
2025························································································································33
Chapter 13
Table 13.2-1 Benefits and beneficiaries in geothermal development ········································39
Table 13.4-1 Implementation plan of GDPS ·············································································41
Chapter 14
Table 14.1-1 Comparison between the First and Second Crash Programs ····································44
JICA West JEC iv

Study on Fiscal and Non-fiscal Incentives to Accelerate Private Sector Geothermal Energy Development in the Republic of Indonesia Final Report (Summary)
Acronyms and Abbreviations
BAU Business as Usual
CAPM Capital Asset Price Model
CDM Clean Development Mechanism
CERs Certified Emission Reductions
CGPI Corporate Goods Price Index
CKD Complete Knock-Down
CO2 Carbon Dioxides
CPI Consumer Price Index
CRIEPIR Central Research Institute of Electric Power Industry Review
DGEEU Directorate General of Electricity and Energy Utilization
DGGMR Directorate General of Geology and Mineral Resources
DGMCG Directorate General of Mineral, Coal and Geothermal
DNA Designated National Authority
DOE Designated Operational Entity
EB Executive Board
EPC Engineering, Procurement and Construction
EqIRR Equity Internal Rate of Return
EqIRRc Equity Internal Rate of Return Criteria
FIRR Financial Internal Rate of Return
FIT Feed-in Tariff
FOM Fixed O&M Fee
GDP Gross Domestic Production
IEA International Energy Agency
IPP Independent Power Producer
IUP Geothermal Energy Business Permit
JBIC Japan Bank for International Cooperation
JICA Japan International Cooperation Agency
JOC Joint Operation Contract
LNG Liquefied Natural Gas
MEMR Minister of Energy and Mineral Resources
MOF Minister of Finance
JICA West JEC v
Study on Fiscal and Non-fiscal Incentives to Accelerate Private Sector Geothermal Energy Development in the Republic of Indonesia Final Report (Summary)
MOU Minutes of Understanding
NOx Nitrogen Oxides
NPV Net Present Value
O&M Operation and Maintenance
OECD Organization for Economic Cooperation and Development
PGE Pertamina Geothermal Energy
PPA Power Purchase Agreement
PPP Purchase Power Parity / Public Private Partnership
PQ Prequalification
PrIRR Project Internal Rate of Return
PrIRRc Project Internal Rate of Return Criteria
PT PLN PT Perusahaan Listrik Negara (National Electric Company)
RMc Commercial Risk Margin
RMr Resource Risk Margin
RMt Technical Risk Margin
RPS Renewable Energy Portfolio Standard
RUPTL Power Development Program of PT PLN
SOP Share of Proceeds
SOx Sulfur Dioxides
UNFCCC United Nations Framework Convention on Climate Change
VAT Value Added Tax
VOM Variable O&M Fee
WACC Weighted Average of Capital Cost
WASP Wien Automatic System Planning
JICA West JEC vi
Study on Fiscal and Non-fiscal Incentives to Accelerate Private Sector Geothermal Energy Development in the Republic of Indonesia Final Report (Summary)
Unit Prefixes
k : kilo- =103
M : mega- =106
G : giga- =109
T : tera- =1012
Units of Length km : kilometer
Units of Area km2 : square kilometer ha : hectare
Units of Volume m3 : cubic meter l : liter kl : kiloliter barrel : barrel (1 barrel = 0.159 kl) SCF : standard cubic feet (1 SCF = 0.0283 kl)
Units of Mass kg : kilogram t : ton (metric)
Units of Energy kWh : kilowatt-hour MWh : megawatt-hour GWh : gigawatt-hour MMBTU : million British thermal unit (1 MMBTU = 0.252*106 kcal) TOE : ton of oil equivalent (1*107 kcal) KTOE : kilo ton of oil equivalent (1*1010 kcal)
Units of Temperature ℃ : degree Celsius
Units of Electricity kW : kilowatt MW : megawatt kV : kilovolt kVA : kilovolt-ampere
Units of Currency IDR (Rp) : Indonesian Rupiah USD ($) : US Dollar JPY (¥) : Japanese Yen
JICA West JEC vii
Study on Fiscal and Non-fiscal Incentives to Accelerate Private Sector Geothermal Energy Development in the Republic of Indonesia Final Report (Summary)
EXECTIVE SUMMARY
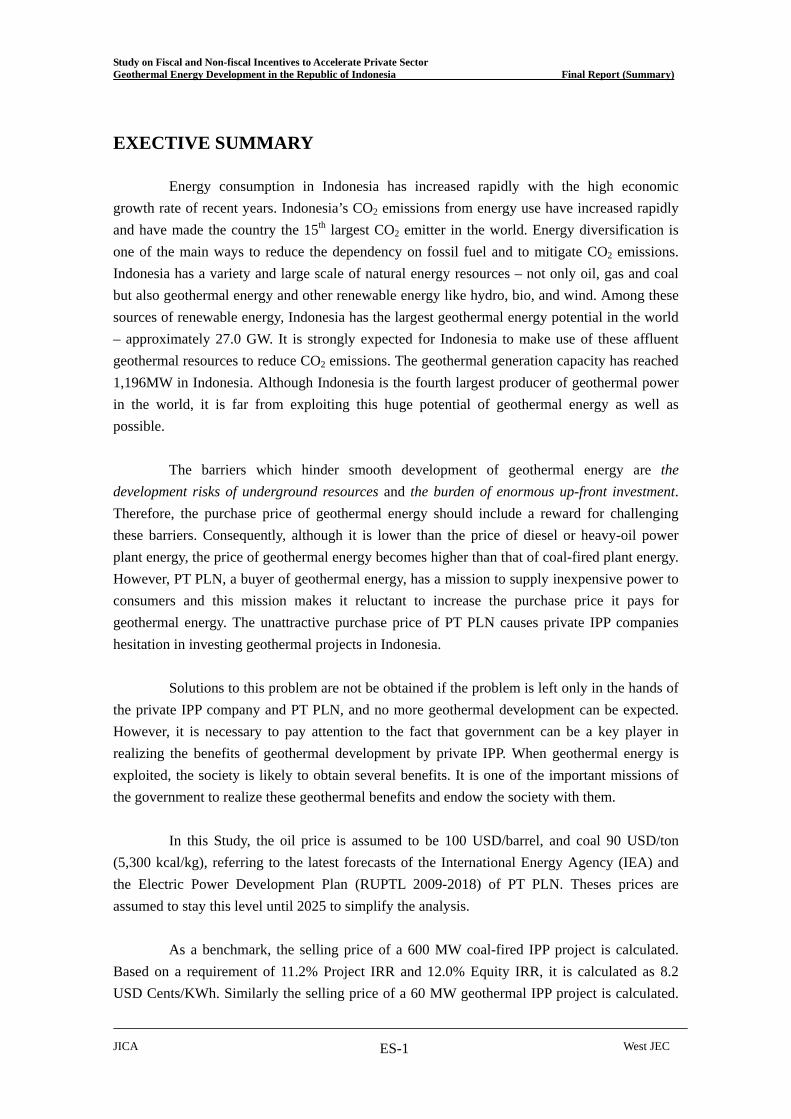
Energy consumption in Indonesia has increased rapidly with the high economic growth rate of recent years. Indonesia’s CO2 emissions from energy use have increased rapidly and have made the country the 15th largest CO2 emitter in the world. Energy diversification is one of the main ways to reduce the dependency on fossil fuel and to mitigate CO2 emissions. Indonesia has a variety and large scale of natural energy resources – not only oil, gas and coal but also geothermal energy and other renewable energy like hydro, bio, and wind. Among these sources of renewable energy, Indonesia has the largest geothermal energy potential in the world – approximately 27.0 GW. It is strongly expected for Indonesia to make use of these affluent geothermal resources to reduce CO2 emissions. The geothermal generation capacity has reached 1,196MW in Indonesia. Although Indonesia is the fourth largest producer of geothermal power in the world, it is far from exploiting this huge potential of geothermal energy as well as possible.
The barriers which hinder smooth development of geothermal energy are the
development risks of underground resources and the burden of enormous up-front investment. Therefore, the purchase price of geothermal energy should include a reward for challenging these barriers. Consequently, although it is lower than the price of diesel or heavy-oil power plant energy, the price of geothermal energy becomes higher than that of coal-fired plant energy. However, PT PLN, a buyer of geothermal energy, has a mission to supply inexpensive power to consumers and this mission makes it reluctant to increase the purchase price it pays for geothermal energy. The unattractive purchase price of PT PLN causes private IPP companies hesitation in investing geothermal projects in Indonesia.
Solutions to this problem are not be obtained if the problem is left only in the hands of
the private IPP company and PT PLN, and no more geothermal development can be expected. However, it is necessary to pay attention to the fact that government can be a key player in realizing the benefits of geothermal development by private IPP. When geothermal energy is exploited, the society is likely to obtain several benefits. It is one of the important missions of the government to realize these geothermal benefits and endow the society with them.
In this Study, the oil price is assumed to be 100 USD/barrel, and coal 90 USD/ton
(5,300 kcal/kg), referring to the latest forecasts of the International Energy Agency (IEA) and the Electric Power Development Plan (RUPTL 2009-2018) of PT PLN. Theses prices are assumed to stay this level until 2025 to simplify the analysis.
As a benchmark, the selling price of a 600 MW coal-fired IPP project is calculated.
Based on a requirement of 11.2% Project IRR and 12.0% Equity IRR, it is calculated as 8.2 USD Cents/KWh. Similarly the selling price of a 60 MW geothermal IPP project is calculated.
JICA West JEC ES-1
Study on Fiscal and Non-fiscal Incentives to Accelerate Private Sector Geothermal Energy Development in the Republic of Indonesia Final Report (Summary)
Based on a requirement of 17.1% Project IRR and 17.0% Equity IRR, it is calculated as 11.9 USD Cents/KWh. There is a 3.7 USD Cents/kWh difference between this price and the price for the benchmark coal-fired IPP project. The objective of the policy is to bridge this price gap by fiscal and non-fiscal incentives.
Geothermal energy has several values. These values are calculated as follows: (i)
energy value (a benchmark price) at 8.2 USD Cents/kWh, (ii) fuel cost reduction value at 0.3 USD Cents/kWh, (iii) saved fuel export value at 5.7 USD Cents/kWh, (iv) increased tax revenue value at 1.6 USD Cents/kWh and (v) carbon dioxide reduction value at 1.9 USD Cents/kWh. The total value is 17.7 USD Cents/kWh. These values can be divided by beneficiaries. PT PLN receives 8.2 USD Cents/kWh as (i) energy value. The government receives 3.8 USD Cents/kWh of which the breakdown is: (ii) fuel cost reduction value as subsidy reduction to PT PLN, (iii) 32.5% (tax rate) of saved fuel export value, and (iv) increased tax revenue value. The society receives 5.8 USD Cents/kWh as the remaining of (iii) saved fuel export value and (v) carbon dioxide reduction value. These benefits show that geothermal energy can bring remarkable benefits to PT PLN, the government and the society, if it is well exploited. In addition to these values in operation stage, geothermal energy brings about other benefits in construction stage. Geothermal power plant construction relies heavily on the procurement of work and services from the vicinity of the construction site. That stimulates the domestic economy. These ripple effects are calculated that a 60 MW geothermal plant construction will have a significant job-creating effect as large as 10,060 opportunities.
Based on these discussions, the following incentives are considered appropriate for Indonesia:
(A) Incentives for Green Field development (a-1) Feed-in Tariff incentives of 11.9 USD Cents/kWh, or
(a-2) Tax Reduction of 5% corporate income tax rate for 15 years and Feed-in Tariff of 10.9 USD Cents/kWh.
(B) Measures to change Green Field to Brown Field (b) Geothermal Development Promotion Survey (GDPS) in initial stage carried out by the
government (C) Measures for risk free participation (c) Public-Private Partnership (PPP) development
The cost and benefit analysis of these incentives indicates that all these incentives
bring significant benefits both to the government and the society.
Currently the Indonesia government is planning to start the Second Crash Program. The program aims at a 4,616 MW geothermal development during 2010-2014. This is an ambitious target and the government needs to make utmost efforts to attain the target. For the implementation of the
JICA West JEC ES-2
Study on Fiscal and Non-fiscal Incentives to Accelerate Private Sector Geothermal Energy Development in the Republic of Indonesia Final Report (Summary)
Second Crash Program, the most important and urgent policies are the pricing incentives. The Feed-in Tariff incentives can be said to be the easiest, the most important and the most urgent incentives to adopt under the current situation.
Indonesia, with 150 volcanoes and more than 27,000 MW of geothermal resource
potential, is the world’s richest country in geothermal resources. This is a good time for Indonesia to adopt a Green New Deal strategy focused on the development of geothermal energy, when many countries are beginning to identify the type of renewable energy development in which they can achieve a comparative advantage. When the geothermal industry is well developed and serves a large domestic market, the localization of technology will start, triggering the next round of cost reductions and leading to the further expansion of the domestic market. Investment in geothermal projects has a far larger effect in stimulating the national economy and creating more new employment than coal-fired projects. Therefore, the encouragement of investment in geothermal energy raises the likelihood of economic growth and employment expansion. This can be called the Green New Deal policy of Indonesia. For this purpose, the first step should be to implement the incentives to accelerate geothermal energy development proposed in this Study, and to continue the incentives for a certain period to convince everyone inside and outside of Indonesia of the golden future that lies ahead for Indonesia geothermal development.
JICA West JEC ES-3
Study on Fiscal and Non-fiscal Incentives to Accelerate Private Sector Geothermal Energy Development in the Republic of Indonesia Final Report (Summary)
CHAPTER 1 INTRODUCTION 1.1 Background of the Study
Indonesia is said to have the largest geothermal potential in the world. According to the Indonesian Ministry of Energy and Mineral Resources, there are more than 250 prospective geothermal fields in Indonesia, and potential power generation is estimated to be 27,000 MW or more. However, the development of geothermal resources lags behind other energy resource development, and the current geothermal power generation capacity is around 1,000MW only. The Indonesian government is keenly interested in promoting geothermal energy in order to address climate change issues and to diversify energy sources to reduce over-dependency on oil-based energy. This Study is initiated to promote geothermal energy through cooperation between the Indonesian Ministry of Finance and the Japanese side.
1.2 Objective of the Study
The objective of this Study is to clarify the mid- and long-term fiscal and non-fiscal incentives promoting private sector-led geothermal energy development through cooperation between the Indonesian Ministry of Finance and the Japanese side. 1.3 Contents of the Study
This Study is to consider necessary fiscal incentives from the perspective of potential investors. Investors are reluctant to invest in geothermal energy projects today, because the selling price which they can obtain a certain return from their investments is higher than the current purchase prices of PT PLN which is based on the selling prices of coal-fired thermal plants. So it would be useful to consider fiscal measures which fill the gap of selling prices of geothermal energy and coal-fired thermal plants. By carefully examining power generation costs and possible selling prices of each power source, this Study aims to materialize practical policy options to promote geothermal energy investments. This Study with the following items:
(1) Current situation of geothermal energy development (2) Conditions of the power generation business (3) Economic evaluation of coal-fired power generation business (benchmark) (4) Economic evaluation of geothermal power generation business (5) Benefits of geothermal power generation (6) Short-term incentives to promote geothermal energy development (7) Proposals for short-term incentives (8) Long-term incentives to promote geothermal energy development (9) Cost and benefit analysis of incentives
JICA West JEC 1
Study on Fiscal and Non-fiscal Incentives to Accelerate Private Sector Geothermal Energy Development in the Republic of Indonesia Final Report (Summary)
JICA West JEC 2
CHAPTER 2 BASIC PHILOSOPHY AND THE PROCESS OF THE STUDY
2.1 Current Status of Energy Use and CO2 Emission in Indonesia
Energy consumption in Indonesia has increased rapidly with the high economic
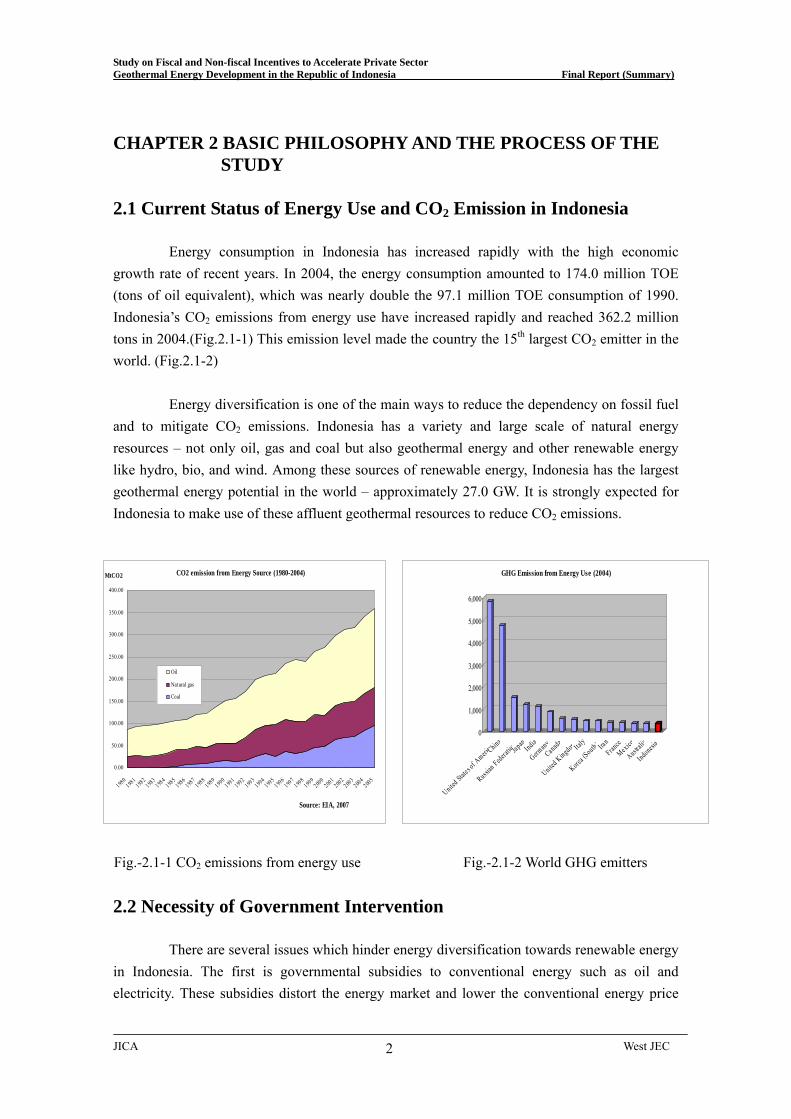
growth rate of recent years. In 2004, the energy consumption amounted to 174.0 million TOE (tons of oil equivalent), which was nearly double the 97.1 million TOE consumption of 1990. Indonesia’s CO2 emissions from energy use have increased rapidly and reached 362.2 million tons in 2004.(Fig.2.1-1) This emission level made the country the 15th largest CO2 emitter in the world. (Fig.2.1-2)
Energy diversification is one of the main ways to reduce the dependency on fossil fuel
and to mitigate CO2 emissions. Indonesia has a variety and large scale of natural energy resources – not only oil, gas and coal but also geothermal energy and other renewable energy like hydro, bio, and wind. Among these sources of renewable energy, Indonesia has the largest geothermal energy potential in the world – approximately 27.0 GW. It is strongly expected for Indonesia to make use of these affluent geothermal resources to reduce CO2 emissions.
0
1,000
2,000
3,000
4,000
5,000
6,000
United State
s of AmericC
hina
Russian Federa
tionJapanIndia
Germany
Canada
United Kingdom Ital
y
Korea (S
outh) IranFran
ceMexico
Australia
Indonesia
GHG Emission from Energy Use (2004)
0.0
98
0
0
1 0
1 0
2 0
2 0
3 0
3 0
4 0
01981
19821983
19841985
19861987
19881989
19901991
19921993
19941995
19961997
19981999
20002001
20022003
20042005
50.0
00.0
50.0
00.0
50.0
00.0
50.0
00.0
1
Oil
Natural gas
Coal
CO2 emission from Energy Source (1980-2004)
Source: EIA, 2007
Mt 2CO
Fig.-2.1-1 CO2 emissions from energy use Fig.-2.1-2 World GHG emitters 2.2 Necessity of Government Intervention
There are several issues which hinder energy diversification towards renewable energy
in Indonesia. The first is governmental subsidies to conventional energy such as oil and electricity. These subsidies distort the energy market and lower the conventional energy price

Study on Fiscal and Non-fiscal Incentives to Accelerate Private Sector Geothermal Energy Development in the Republic of Indonesia Final Report (Summary)
level, increasing energy consumption. The second issue is that many sources of renewable energy are still in the introductory stage, the learning effect and economies of mass production have yet to bring down supply prices. Therefore, the prices of renewable energy are higher than those of conventional energy, and a certain governmental support is necessary to make them competitive with conventional energy in the market.
Many sources of renewable energy remain in the initial stage of exploitation, where neither the learning curve nor the mass production effect has yet had a chance to reduce their supply price. However, these effects gradually contribute to a reduction in the supply price, if the introduction of renewable energy proceeds with the support of the government. As a result, if the supply price is decreased enough, the emergence of a situation in which renewable energy prices are lower than conventional energy supply prices can be expected. Once this is the situation, the diffusion of renewable energy will proceed automatically even without governmental support for it. It is expected that the government support to renewable energy will continue until such a situation arises.
(Source) Lund (2007), “Effectiveness of policy measures
in transforming the energy system”, Energy Policy
Fig.2.2-5 Diffusion of renewable energy and government support
2.3 Significance of Geothermal Energy and Barriers to its Development Geothermal energy has the following advantages:
- Value as energy of high supply reliability - Value as domestically produced energy - Value as stable energy - Value as environmentally friendly energy - Value as energy which can contribute to the local society.
Although geothermal energy has the above-described virtues, it is true that geothermal
development is progressing more slowly than expected even in Indonesia, which is blessed with a lot of geothermal resources. There are two big barriers which hinder smooth development of geothermal energy: the “development risks of underground resources” and the “burden of enormous up-front investment.”
The development risks of underground resources mean that the project developers can
JICA West JEC 3

Study on Fiscal and Non-fiscal Incentives to Accelerate Private Sector Geothermal Energy Development in the Republic of Indonesia Final Report (Summary)
JICA West JEC 4
not exactly know the characteristics of resources, i.e. the depth, the capacity, the quality, etc., in the planning stage and can know them after they completed the development. In this sense, uncertainty in a geothermal development project is remarkably large. This uncertainty inhibits private companies from entering geothermal development projects. The burden of enormous up-front investment means that geothermal projects need a long gestation period from the star of exploration to the actual plant operation and the developers should bear the large cost burden during this period. 2.4 Importance of the Role of Government
Geothermal development faces the two big barriers of development risks and huge up-front investment, which make private IPPs hesitate to participate in the geothermal power generation business. One possible measure to overcome these barriers is for PT PLN to purchase power from geothermal IPP companies at a sufficiently attractive price. However, PT PLN also has a mission to supply inexpensive power, which makes it reluctant to increase the price it pays for power.
Solutions to this problem are not be obtained if the problem is left only in the hands of the private IPP company and PT PLN, and no more geothermal development can be expected. However, it is necessary to pay attention to the fact that government can be a key player in realizing the benefits of geothermal development by private IPP. When a geothermal power plant starts operation, the society is likely to obtain several benefits (Fig.2.7-1). It is one of the important missions of the government to realize these geothermal benefits and endow the society with them.
IPP (GEO)
PLN (Buyer) Geo Buying Price (P)
PLN (IPP) (BAU) Coal Buying Price (Q)
GovernmentIncentive (IC)
Tax (T)
Tax (T')
Econ
omic
Ben
efit
(E)
Buyi
ngPr
ice
(P)
SubsidyReduction
Export Benefitof Saved Fuel
CO2 ReductionBenefit
Geo Development Effect
ConstructionBenefit
Fig.2.7-1 The role of government in promoting geothermal energy development
Study on Fiscal and Non-fiscal Incentives to Accelerate Private Sector Geothermal Energy Development in the Republic of Indonesia Final Report (Summary)
Government disposes of various policy tools to promote renewable energy. One of them is a so-called “compulsory type policy” which unilaterally imposes the cost of the promotion of renewable energy on power companies. Another is a so-called “incentive type policy” in which the government bears this cost. Typical compulsory type policies are the “fixed buying price system” and the “renewable energy quota system”. In an incentive type policy, there are three types of incentives; tax incentives, fiscal incentives, and financial incentives. By considering the effects and the costs of each policy, this Study considers the most effective incentives to promote the private geothermal IPP business in Indonesia. 2.5 Methodology of the Study In this Study, “short-term” is defined as the period up to 2016. This time range is set in consideration of the fact that geothermal development requires a long lead time in exploration, development and construction. According to the JICA Master Plan Study, the amount of power developable by 2016 is presumed to be approximately 3,300 MW under the shortest lead time scenario. As for the study method, the Study Team uses a profitability simulation program to calculate a benchmark coal–fired power project and a geothermal power project (that is, the calculation of the profit and loss statement and the cash flow statement are carried out.). Through these profitability simulations, the Study Team tries to determine the incentives which are necessary to attract private companies to participate in geothermal projects in the short–term range. In this study “mid-term” and “long-term” are defined as 2017-2025. The goal is to achieve 9,500 MW of geothermal power generation. Considering the long-term trends of generation costs in geothermal and coal-fired, the cost and benefit analysis of various incentive policies are studied. 2.6 Assumptions of the Study
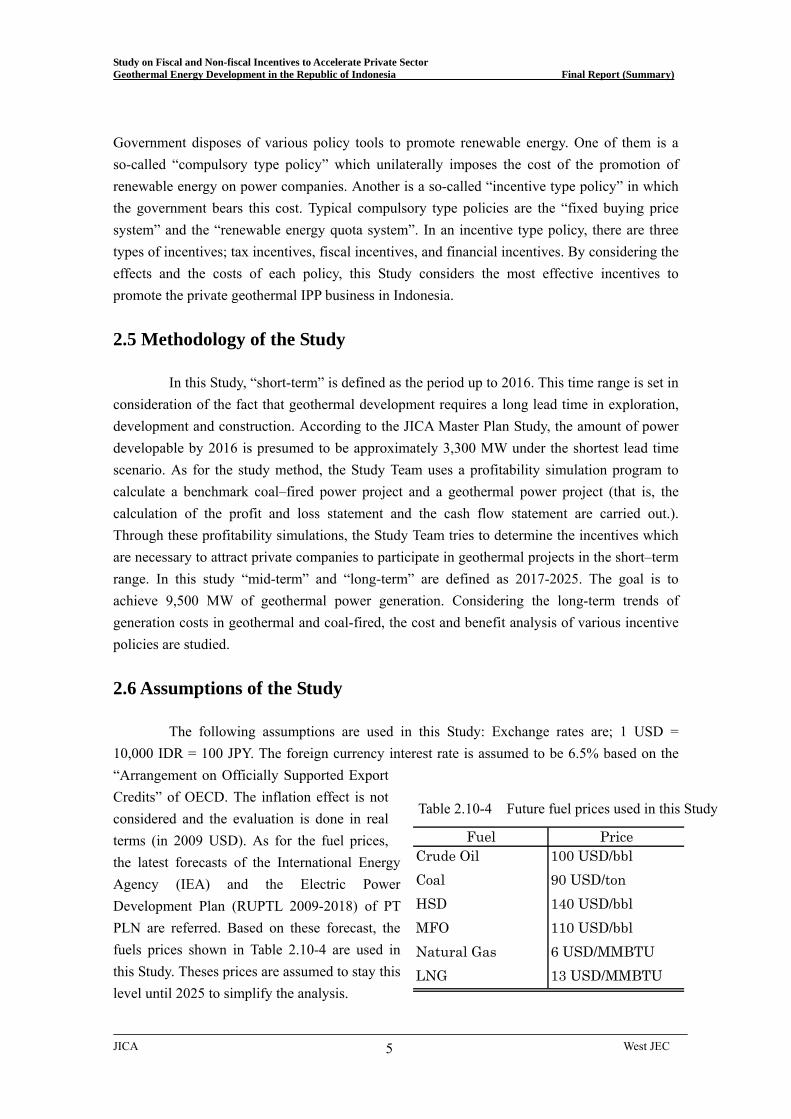
The following assumptions are used in this Study: Exchange rates are; 1 USD =
10,000 IDR = 100 JPY. The foreign currency interest rate is assumed to be 6.5% based on the “Arrangement on Officially Supported Export Credits” of OECD. The inflation effect is not considered and the evaluation is done in real terms (in 2009 USD). As for the fuel prices, the latest forecasts of the International Energy Agency (IEA) and the Electric Power Development Plan (RUPTL 2009-2018) of PT PLN are referred. Based on these forecast, the fuels prices shown in Table 2.10-4 are used in this Study. Theses prices are assumed to stay this level until 2025 to simplify the analysis.
Table 2.10-4 Future fuel prices used in this Study
Fuel PriceCrude Oil 100 USD/bblCoal 90 USD/tonHSD 140 USD/bblMFO 110 USD/bblNatural Gas 6 USD/MMBTULNG 13 USD/MMBTU
JICA West JEC 5
Study on Fiscal and Non-fiscal Incentives to Accelerate Private Sector Geothermal Energy Development in the Republic of Indonesia Final Report (Summary)
CHAPTER 3 PRESENT STATUS OF GEOTHERMAL POWER DEVELOPMENT IN INDONESIA
3.1 Geothermal Power Potential in Indonesia
Indonesia may have the largest geothermal resource capacity in the world, with the about forty (40) percent (equivalent to approximately 27,000 MW) of the world’s geothermal resources concentrated in Indonesia. Geothermal power generation has been conducted in seven (7) fields, namely Kamojang, Darajat, Wayang-Windu, Salak in western Java, Dieng in central Java, Sibayak in north Sumatra, and Lahendong in north Sulawesi. The generation capacity has reached 1,196MW. Although Indonesia is the fourth largest producer of geothermal power in the world, it is far from exploiting this huge potential of geothermal energy as well as possible. The Ministry of Energy and Mineral Resources (MEMR) formulated a Geothermal Development Road Map to develop 9,500 MW in total by 2025.
3.2 Recent Investment Environment for Geothermal Projects
Under the Indonesian constitutional framework, Indonesia's geothermal resources are
controlled by the state. A new Geothermal Law was enacted on October 22, 2003 in order to provide a stronger legal basis for upstream geothermal energy developments, including private investment in the sector. The new Geothermal Law is also intended to accommodate expanded regional autonomy in Indonesia. Within their respective jurisdictions, provincial and local governments are given the authority to regulate, supervise and license geothermal energy developments. In the period until the Asian Economic Crisis in 1997, PT PLN had bought geothermal energy at the price between 6.90 USD Cents/kWh and 8.46 USD Cents/kWh. However, to cope with the crisis, PT PLN reviewed the purchase prices and decided to set forth the ceiling of 5 USD Cents/kWh from 1999 to 2003. As a result, the purchase prices of geothermal were remarkably reduced and, it was 4.85 USD Cents/kWh in 2005 in the Darajat II project case for example. This reduction obviously discouraged the private geothermal development activities (Fig. 3.4-1). In addition no IUP pursuant to the new geothermal law has been issued since new law’s promulgation in 2003. The following factors explain Indonesia’s lagging development of its geothermal resource for generating electricity: ① Commercial development of geothermal energy requires electrical power plant
development onsite, and this requirement may limit the resource to a small local market or one not well connected to a larger load center.
② Development entails high initial capital costs, including initial exploration, and requires a commitment to purchase a large portion of generated energy at the stage of start-up of development wells. Long-term operating costs, however, are quite low. Thus, geothermal
JICA West JEC 6

Study on Fiscal and Non-fiscal Incentives to Accelerate Private Sector Geothermal Energy Development in the Republic of Indonesia Final Report (Summary)
contracts require base load status and long term price security in order to justify development.
③ Several significant benefits of geothermal development are not effectively represented in the valuation of the electricity. These benefits include the long-term low cost operation, contributions to preserving the environment, and the resultant diversification of supply with an indigenous, distributed resource.
( Source ) Schlumberger Business Consulting, Improving the economics of geothermal development through an oil and gas industry approach
Fig.3.4-1 Selling prices and geothermal activities 3.3 Evaluation of Recent Geothermal Incentives
< Geothermal Work Area Bidding System > From 2008, the Ministry of Energy and Mineral Resources (MEMR) started bidding
for geothermal working areas. First, the government made bids for the geothermal fields of Cisoroku-Cisukarame, Tangkuban Parahu and Gunung Tampomas, all in West Java. By this bidding, however, some working areas development went to corporations who are not considered to be well experienced. It is pointed out that the strict Pre-Qualification (P/Q) process is needed and that the system of bidding a possible electric selling price should be reformed.
< Bench-mark Purchase Price of Geothermal Electricity> To promote geothermal power development in the country, the MEMR set the
benchmark electric purchase price from the geothermal power in January 2006. The benchmark prices were revised annually through DGEEU under the MEMR. The benchmark prices was calculated as a percentage of the present average generating costs of PT PLN at each of 21 subsystems of 14 power systems. Geothermal power development was divided into two categories: 10 MW to 55 MW and more than 55 MW. For the 10 MW to 55 MW class, 85% of the present generating cost was specified as the benchmark price, and this fell to 80% for 55 MW class geothermal plants. The benchmark prices were at slightly less than 5 USD Cents/kWh in West Sumatra where large-scale geothermal plants are expected. There were several complaints from geothermal investors about these benchmark prices. The complaints were that the price would fluctuate every year, that the procedure of price calculation was not disclosed
JICA West JEC 7
Study on Fiscal and Non-fiscal Incentives to Accelerate Private Sector Geothermal Energy Development in the Republic of Indonesia Final Report (Summary)
and not clear, that the prices did not take into account geothermal resource potentials in the areas, that the prices were too low to attract geothermal investment, and so on. A new price guideline has been definitely required to accelerate geothermal power development.
<Guidelines for Electric Power Purchase Price by PT PLN (MEMR Regulation No. 5/2009)>
In the backdrops of these complaints, Ministry of Energy and Mineral Resources announced the Ministerial Regulation on Guidelines for Electric Power Purchase price by PT PLN (MEMR regulation No.5/2009) in March, 2009. This regulation abolished the provisions of the benchmark purchase price of geothermal energy designated by MEMR, and instead newly stipulates that PT PLN can set forth the self-estimation price for renewable energy and can purchase renewable energy at the price when it is approved by MEMR. At the same time, the government obliged PT PLN to purchase renewable energy up to 10 MW capacity. As for this new regulation, however, there is an opinion that this regulation is incomplete as an energy policy.
JICA West JEC 8
Study on Fiscal and Non-fiscal Incentives to Accelerate Private Sector Geothermal Energy Development in the Republic of Indonesia Final Report (Summary)
JICA West JEC 9
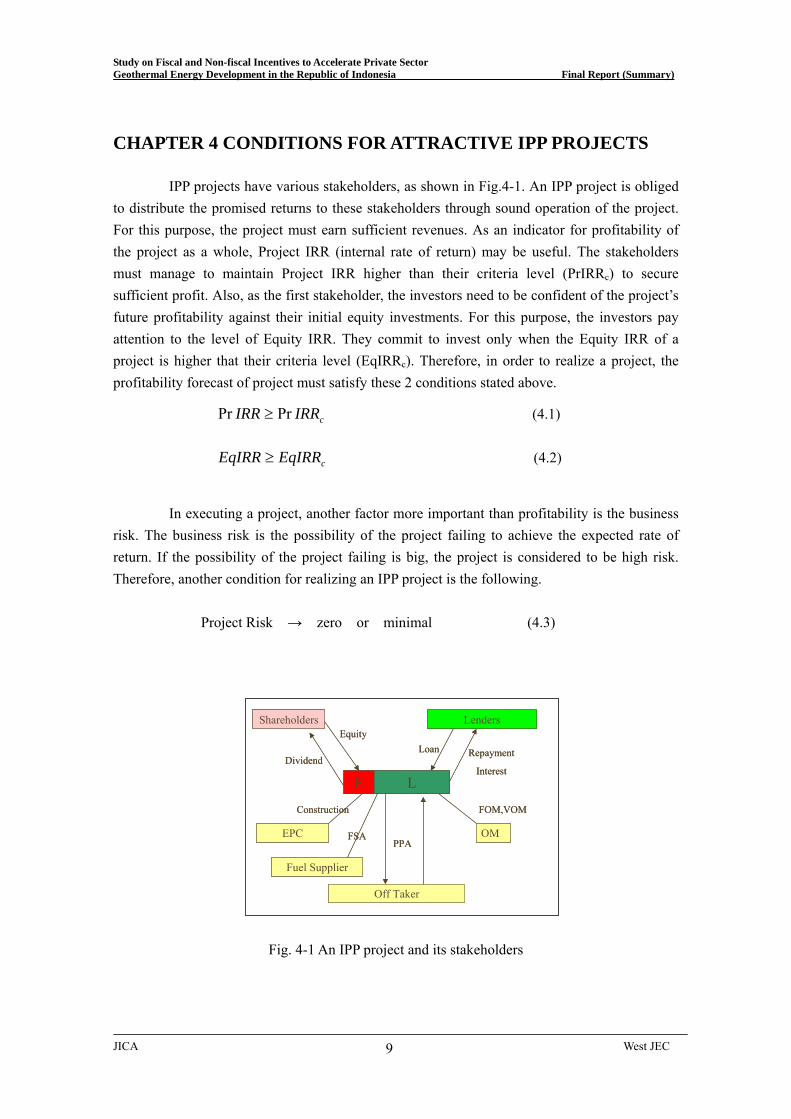
CHAPTER 4 CONDITIONS FOR ATTRACTIVE IPP PROJECTS IPP projects have various stakeholders, as shown in Fig.4-1. An IPP project is obliged
to distribute the promised returns to these stakeholders through sound operation of the project. For this purpose, the project must earn sufficient revenues. As an indicator for profitability of the project as a whole, Project IRR (internal rate of return) may be useful. The stakeholders must manage to maintain Project IRR higher than their criteria level (PrIRR )c to secure sufficient profit. Also, as the first stakeholder, the investors need to be confident of the project’s future profitability against their initial equity investments. For this purpose, the investors pay attention to the level of Equity IRR. They commit to invest only when the Equity IRR of a project is higher that their criteria level (EqIRRc). Therefore, in order to realize a project, the profitability forecast of project must satisfy these 2 conditions stated above.
Pr (4.1) cIRRIRR Pr≥
(4.2) cEqIRREqIRR ≥
In executing a project, another factor more important than profitability is the business
risk. The business risk is the possibility of the project failing to achieve the expected rate of return. If the possibility of the project failing is big, the project is considered to be high risk. Therefore, another condition for realizing an IPP project is the following.
Project Risk → zero or minimal (4.3)
E L
Shareholders Lenders
EPC OM
Off Taker
Equity
DividendLoan Repayment
Interest
PPA
Construction FOM,VOM
Fuel Supplier
FSA
E L
Shareholders Lenders
EPC OM
Off Taker
Equity
DividendLoan Repayment
Interest
PPA
Construction FOM,VOM
Fuel Supplier
FSA
Fig. 4-1 An IPP project and its stakeholders
Study on Fiscal and Non-fiscal Incentives to Accelerate Private Sector Geothermal Energy Development in the Republic of Indonesia Final Report (Summary)
CHAPTER 5 EVALUATION OF A COAL-FIRED IPP PROJECT (BENCHMARK PRICE)
5.1 Assumptions
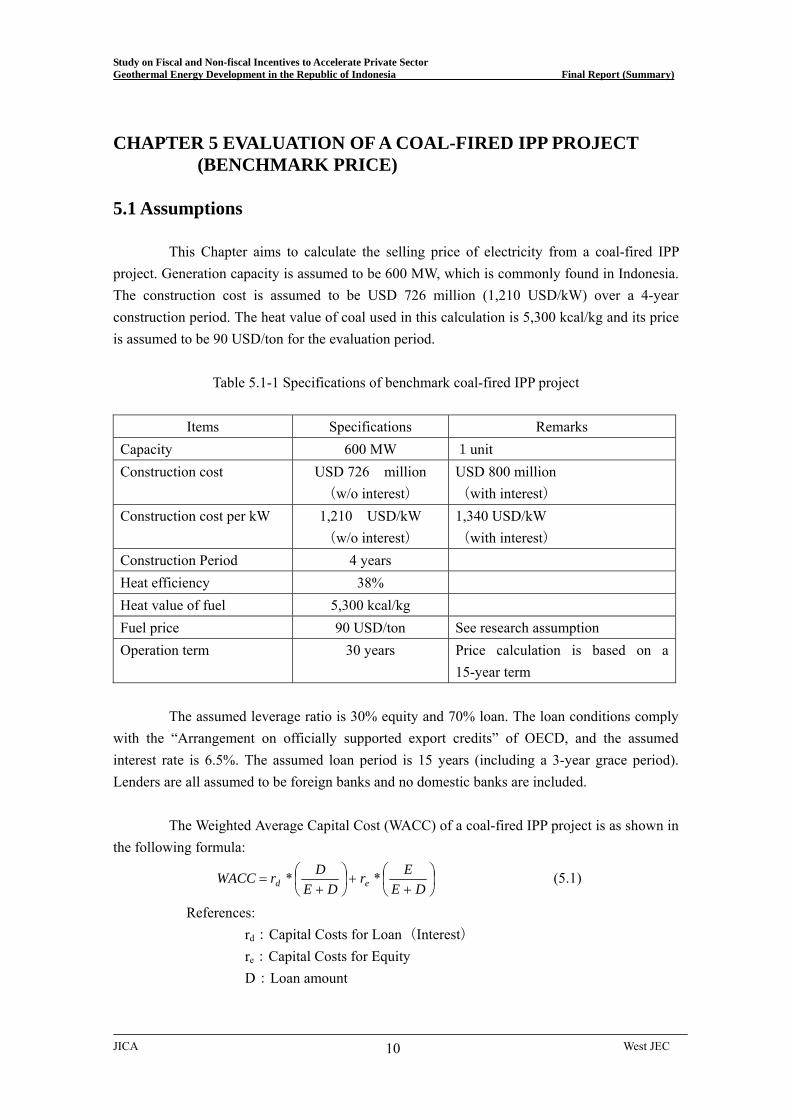
This Chapter aims to calculate the selling price of electricity from a coal-fired IPP
project. Generation capacity is assumed to be 600 MW, which is commonly found in Indonesia. The construction cost is assumed to be USD 726 million (1,210 USD/kW) over a 4-year construction period. The heat value of coal used in this calculation is 5,300 kcal/kg and its price is assumed to be 90 USD/ton for the evaluation period.
Table 5.1-1 Specifications of benchmark coal-fired IPP project
Items Specifications Remarks
Capacity 600 MW 1unit Construction cost USD 726 million
(w/o interest) USD 800 million (with interest)
Construction cost per kW 1,210 USD/kW (w/o interest)
1,340 USD/kW (with interest)
Construction Period 4 years Heat efficiency 38% Heat value of fuel 5,300 kcal/kg Fuel price 90 USD/ton See research assumption Operation term 30 years Price calculation is based on a
15-year term
The assumed leverage ratio is 30% equity and 70% loan. The loan conditions comply with the “Arrangement on officially supported export credits” of OECD, and the assumed interest rate is 6.5%. The assumed loan period is 15 years (including a 3-year grace period). Lenders are all assumed to be foreign banks and no domestic banks are included.
The Weighted Average Capital Cost (WACC) of a coal-fired IPP project is as shown in
the following formula:
⎟⎠⎞
⎜⎝⎛
++⎟
⎠⎞
⎜⎝⎛
+=
DEEr
DEDrWACC ed ** (5.1)
References: rd:Capital Costs for Loan(Interest)
re:Capital Costs for Equity D:Loan amount
JICA West JEC 10
Study on Fiscal and Non-fiscal Incentives to Accelerate Private Sector Geothermal Energy Development in the Republic of Indonesia Final Report (Summary)
E;Equity amount
The Capital Costs for Equity can be calculated by CAPM(Capital Asset Price Model)theory, which makes the Capital Costs for Equity as follows:
(5.2) )(* fmfe rrrr −+= β
rf:Rate of Return of risk-free business rm:Average Rate of Return in the market β:coefficient β of investor
In this Study, participating investors are assumed to be from any country, not limited
to Indonesia or Japan alone. Therefore, the 10-year maturity US Treasury Bond, which has yielded an average of 5% during the last 15 years, is taken as the risk-free business reference. Also, the Average Rate of Return in the market is assumed to be 10% for the 15 years of record. Considering the fact that the major participants of IPP projects are power companies, β=1 is applied, assuming the same risk as in the market. Based on these assumptions:
%10%)5%10(*1%5 =−+=er (5.2’)
After factoring in the 2% country risk, we have: re=12% (5.2”)
This yields the following WACC: %15.8%30*%12%70*%5.6 =+=WACC (5.1’) 5.2 Risk Analysis
Typical examples of possible commercial risks for coal-fired IPP projects are interest rate fluctuation during construction, construction cost increases, inflation after commencement of commercial operation, exchange rate fluctuations after commercial operation begins, and so on. These risk factors are evaluated by using Monte Carlo method. As a result, the Study Team adopts a Commercial Risk Margin (RMc) of 3% in order to account for a case where each factor takes an unfavorable value. RMc = 3% (5.4)
As for the technical risks, unlike the geothermal IPP business, the coal-fired IPP business does not have significant technical risks. Thus, the Study Team assumes a Technical Risk Margin (RMt) of 0%.
RMt = 0% (5.5) The above conditions give a Project IRR requirement of 11.2%.
JICA West JEC 11
Study on Fiscal and Non-fiscal Incentives to Accelerate Private Sector Geothermal Energy Development in the Republic of Indonesia Final Report (Summary)
%2.11%3%15.8Pr =+=++= RMtRMcWACCIRR (5.6) Also, the Equity IRR requirement is 12%. EqIRR=12% (5.7) 5.3 Benchmark Price
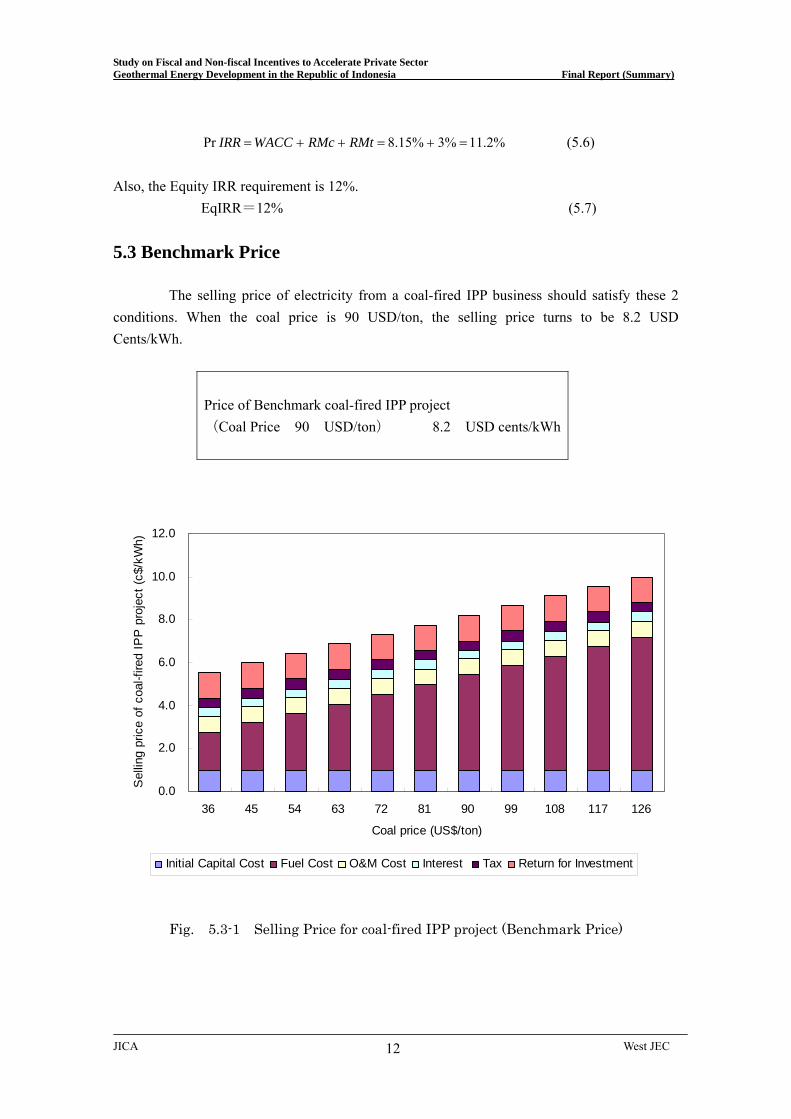
The selling price of electricity from a coal-fired IPP business should satisfy these 2 conditions. When the coal price is 90 USD/ton, the selling price turns to be 8.2 USD Cents/kWh.
Price of Benchmark coal-fired IPP project (Coal Price 90 USD/ton) 8.2 USD cents/kWh
0.0
2.0
4.0
6.0
8.0
10.0
12.0
36 45 54 63 72 81 90 99 108 117 126
Coal price (US$/ton)
Sel
ling
pric
e of
coa
l-fire
d IP
P p
roje
ct (c
$/kW
h)
Initial Capital Cost Fuel Cost O&M Cost Interest Tax Return for Investment
Fig. 5.3-1 Selling Price for coal-fired IPP project (Benchmark Price)
JICA West JEC 12
Study on Fiscal and Non-fiscal Incentives to Accelerate Private Sector Geothermal Energy Development in the Republic of Indonesia Final Report (Summary)
CHAPTER 6 EVALUATION OF A GEOTHERMAL IPP PROJECT 6.1 Assumptions
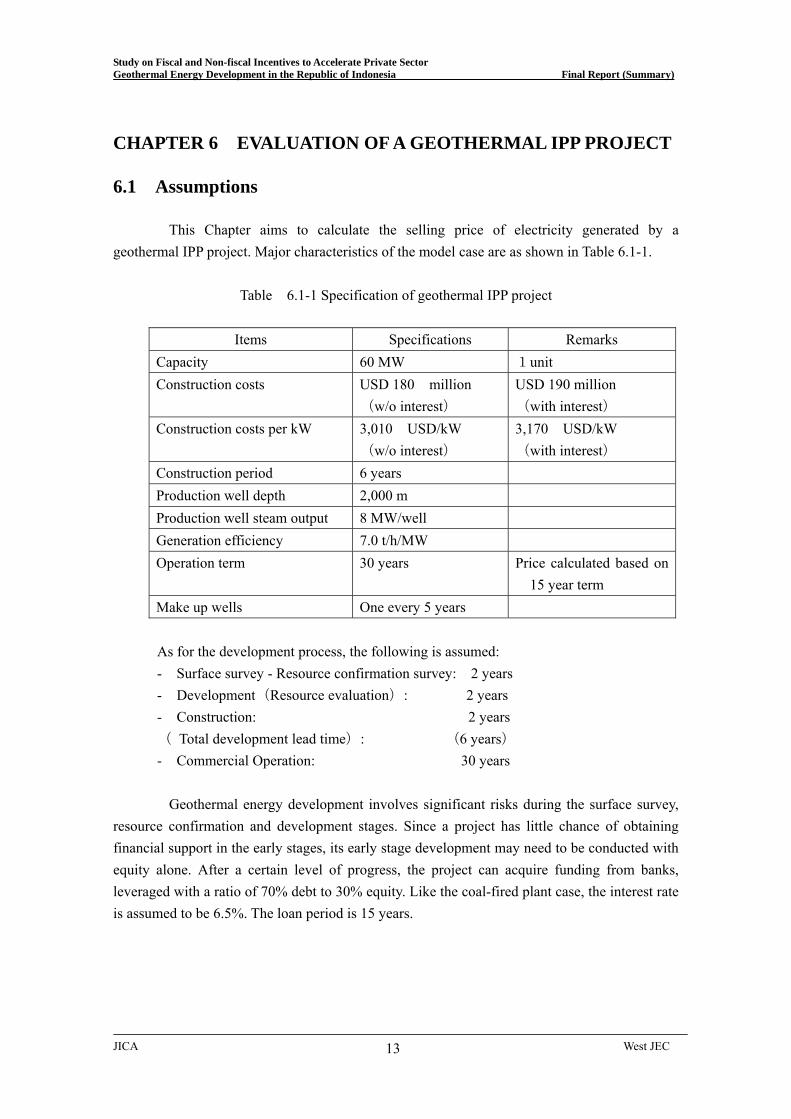
This Chapter aims to calculate the selling price of electricity generated by a
geothermal IPP project. Major characteristics of the model case are as shown in Table 6.1-1.
Table 6.1-1 Specification of geothermal IPP project
Items Specifications Remarks Capacity 60 MW 1unit Construction costs USD 180 million
(w/o interest) USD 190 million (with interest)
Construction costs per kW 3,010 USD/kW (w/o interest)
3,170 USD/kW (with interest)
Construction period 6 years Production well depth 2,000 m Production well steam output 8 MW/well Generation efficiency 7.0 t/h/MW Operation term 30 years Price calculated based on
15 year term Make up wells One every 5 years
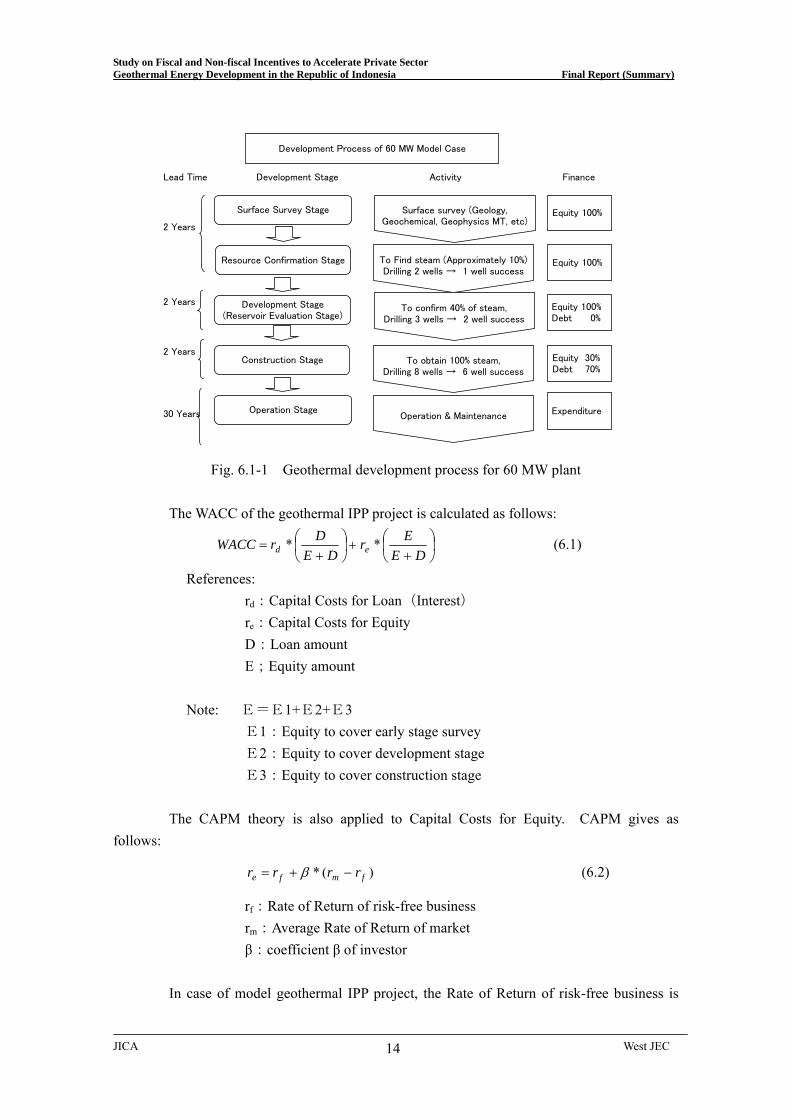
As for the development process, the following is assumed: - Surface survey - Resource confirmation survey: 2 years - Development(Resource evaluation): 2 years - Construction: 2 years ( Total development lead time): (6 years) - Commercial Operation: 30 years
Geothermal energy development involves significant risks during the surface survey,
resource confirmation and development stages. Since a project has little chance of obtaining financial support in the early stages, its early stage development may need to be conducted with equity alone. After a certain level of progress, the project can acquire funding from banks, leveraged with a ratio of 70% debt to 30% equity. Like the coal-fired plant case, the interest rate is assumed to be 6.5%. The loan period is 15 years.
JICA West JEC 13
Study on Fiscal and Non-fiscal Incentives to Accelerate Private Sector Geothermal Energy Development in the Republic of Indonesia Final Report (Summary)
Lead Time Development Stage Activity Finance
2 Years
2 Years
2 Years
30 Years
Surface Survey Stage
Resource Confirmation Stage
Construction Stage
Development Stage(Reservoir Evaluation Stage)
Operation Stage
Development Process of 60 MW Model Case
Surface survey (Geology,Geochemical, Geophysics MT, etc)
To Find steam (Approximately 10%)Drilling 2 wells → 1 well success
To confirm 40% of steam,Drilling 3 wells → 2 well success
To obtain 100% steam,Drilling 8 wells → 6 well success
Equity 100%
Equity 30% Debt 70%
Equity 100% Debt 0%
Equity 100%
Operation & Maintenance Expenditure
Fig. 6.1-1 Geothermal development process for 60 MW plant
The WACC of the geothermal IPP project is calculated as follows:
⎟⎠⎞
⎜⎝⎛
++⎟
⎠⎞
⎜⎝⎛
+=
DEEr
DEDrWACC ed ** (6.1)
References: rd:Capital Costs for Loan(Interest)
re:Capital Costs for Equity D:Loan amount E;Equity amount
Note: E=E1+E2+E3
E1:Equity to cover early stage survey E2:Equity to cover development stage E3:Equity to cover construction stage
The CAPM theory is also applied to Capital Costs for Equity. CAPM gives as follows:
r (6.2) )(* fmfe rrr −+= β
rf:Rate of Return of risk-free business rm:Average Rate of Return of market β:coefficient β of investor
In case of model geothermal IPP project, the Rate of Return of risk-free business is
JICA West JEC 14
Study on Fiscal and Non-fiscal Incentives to Accelerate Private Sector Geothermal Energy Development in the Republic of Indonesia Final Report (Summary)
assumed to be 5%, which equals the yield of the 15-year average return on 10-year maturity US treasury bonds. The Average Rate of Return of the market is assumed to be 10%, based on the record of a 15-year average of returns on foreign investment in the US. β is assumed to be 2, in consideration of the higher risk-higher return nature of geothermal IPP projects compared to coal-fired ones.
%15%)5%10(*2%5 =−+=er (6.2’)
Incorporating the 2% country risk, as in the case of interest yields: re=17% (6.2”)
This result yields the WACC shown as follow, (6.1’) %1.11=WACC 6.2 Risk Analysis
Regarding the Commercial Risk Margin, it should be the same as for the coal-fired IPP project: RMc = 3% (6.4)
Regarding the Resource Development Risks, the four typical factors are taken as examples. They are production well depth, steam production of wells, steam/water ratio and construction costs. The changes in these factors are evaluated by Monte Carlo method and the Resource Development Risk Margin (RMr) of 3% is taken as a result. RMr = 3% (6.5)
The Project IRR required for a geothermal IPP project is 17.1%, as shown in the formula below: %1.17%3%3%1.11Pr =++=++= RMrRMcWACCIRR (6.6) On the other hand, Equity IRR is required to be greater than 17%. EqIRR = 17% (6.7) 6.3 Selling Price of Electricity from Geothermal IPP Project
The selling price of electricity from a geothermal IPP project is calculated from both of these conditions. The Table 6.3-1 shows the assumptions to calculate the selling price of electricity from a geothermal IPP project.
JICA West JEC 15
Study on Fiscal and Non-fiscal Incentives to Accelerate Private Sector Geothermal Energy Development in the Republic of Indonesia Final Report (Summary)
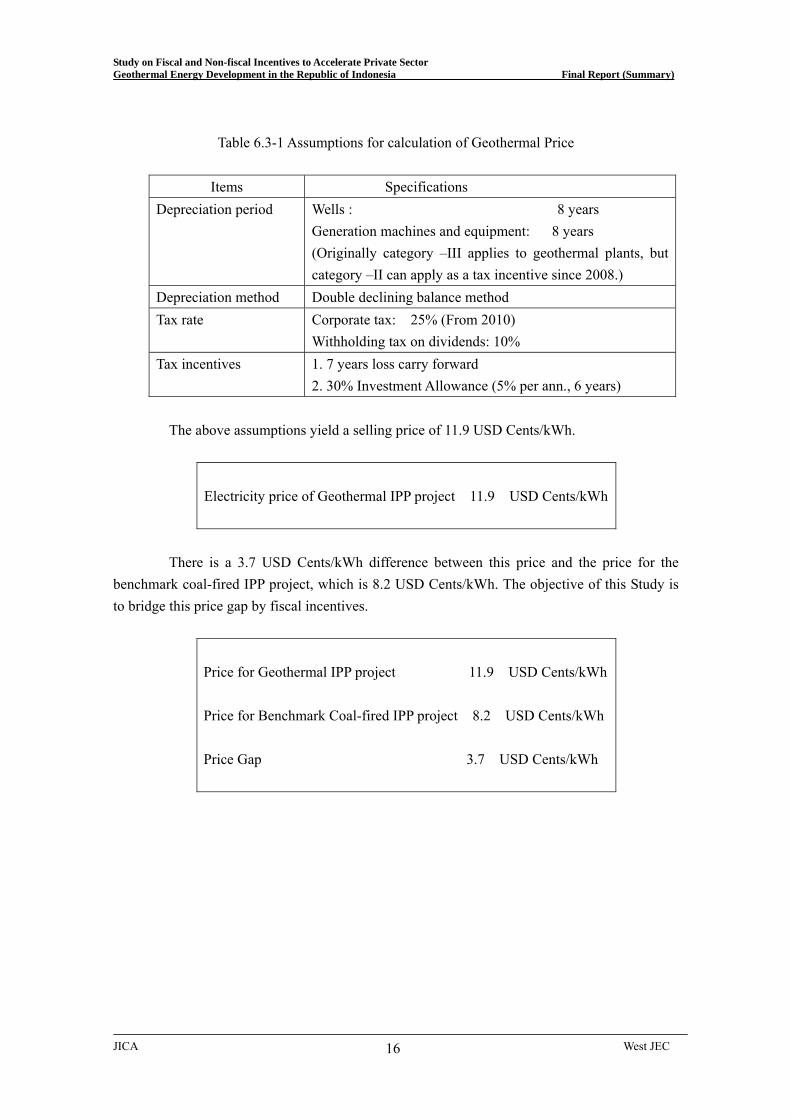
Table 6.3-1 Assumptions for calculation of Geothermal Price
Items Specifications Depreciation period Wells : 8 years
Generation machines and equipment: 8 years (Originally category –III applies to geothermal plants, but category –II can apply as a tax incentive since 2008.)
Depreciation method Double declining balance method Tax rate Corporate tax: 25% (From 2010)
Withholding tax on dividends: 10% Tax incentives 1. 7 years loss carry forward
2. 30% Investment Allowance (5% per ann., 6 years)
The above assumptions yield a selling price of 11.9 USD Cents/kWh.
Electricity price of Geothermal IPP project 11.9 USD Cents/kWh
There is a 3.7 USD Cents/kWh difference between this price and the price for the
benchmark coal-fired IPP project, which is 8.2 USD Cents/kWh. The objective of this Study is to bridge this price gap by fiscal incentives.
Price for Geothermal IPP project 11.9 USD Cents/kWh Price for Benchmark Coal-fired IPP project 8.2 USD Cents/kWh Price Gap 3.7 USD Cents/kWh
JICA West JEC 16
Study on Fiscal and Non-fiscal Incentives to Accelerate Private Sector Geothermal Energy Development in the Republic of Indonesia Final Report (Summary)
CHAPTER 7 BENEFITS OF GEOTHERMAL POWER DEVELOPMENT
7.1 Power Demand and Supply Simulation
Prior to consider incentives, the benefits of geothermal power development are discussed in Chapter 7. In order to calculate the geothermal energy benefits, two cases of power demand and supply scenario are simulated, i.e. the business as usual case and the geothermal promotion case. The benefits of geothermal energy are derived from comparing fuel consumptions in two cases. The simulation period is from 2007 to 2016. While 23,400 MW new power plants are needed by 2016 in both cases, all of them are coal-fired plants in the business as usual case. On the other hand, in the geothermal promotion case, 2,400 MW of them are geothermal power plants and the rest are coal-fired power plants. 7.2 Fuel Saving Benefit (Reduction of PT PLN Generation Costs) Table 7.2-3 shows the differences between two cases in the fuel types of generated energy. The simulations reveal that when an additional 2,400 MW of geothermal power is developed by the year 2016, the generated geothermal energy would be 59,151 GWh and would substitute for a sum of 54,396 GWh (92.0%) of coal-fired power, 2,527 GWh (4.3%) of gas-turbine and diesel power, 1,577 GWh (2.7%) of natural gas-fired power and 535 GWh (0.9%) of oil-fired power. Considering installed capacities, 2,400 MW of geothermal power would substitute for the same capacity of coal-fired power, but considering the generated energy, geothermal would substitute not only for coal-fired but also for gas-turbine and diesel power, natural gas-fired power and oil-fired power, though the substituted energy for this oil-related power is considerably smaller than that for coal-fired power. This difference of energy generation can be translated into the difference of the volumes and values of fuels saved by geothermal energy. This translation reveals that the introduction of geothermal power would save a remarkable amount of fossil fuel consumption over the 5 years from 2012 to 2016: 26,894,000 tons of coal, 728,000 kl of diesel oil (HSD), 14,542 million SCF of natural gas and 149,000 kl of heavy oil (MFO). When oil price is at 100 USD/barrel, these volume savings turn to be the monetary savings of USD 5,034 million over the 5 years. As mentioned above, 59,151 GWh of geothermal power will be generated over this period. Thus, the fossil fuel saving value of geothermal power is 8.5 USD Cents/kWh. By the way, the selling price of electricity from coal-fired power plants, or the benchmark price, is 8.2 USD Cents/kWh where the coal unit price is 90 USD/ton, corresponding to the benchmark oil price of 100 USD/barrel. Thus, 0.3 USD Cents/kWh, the
JICA West JEC 17
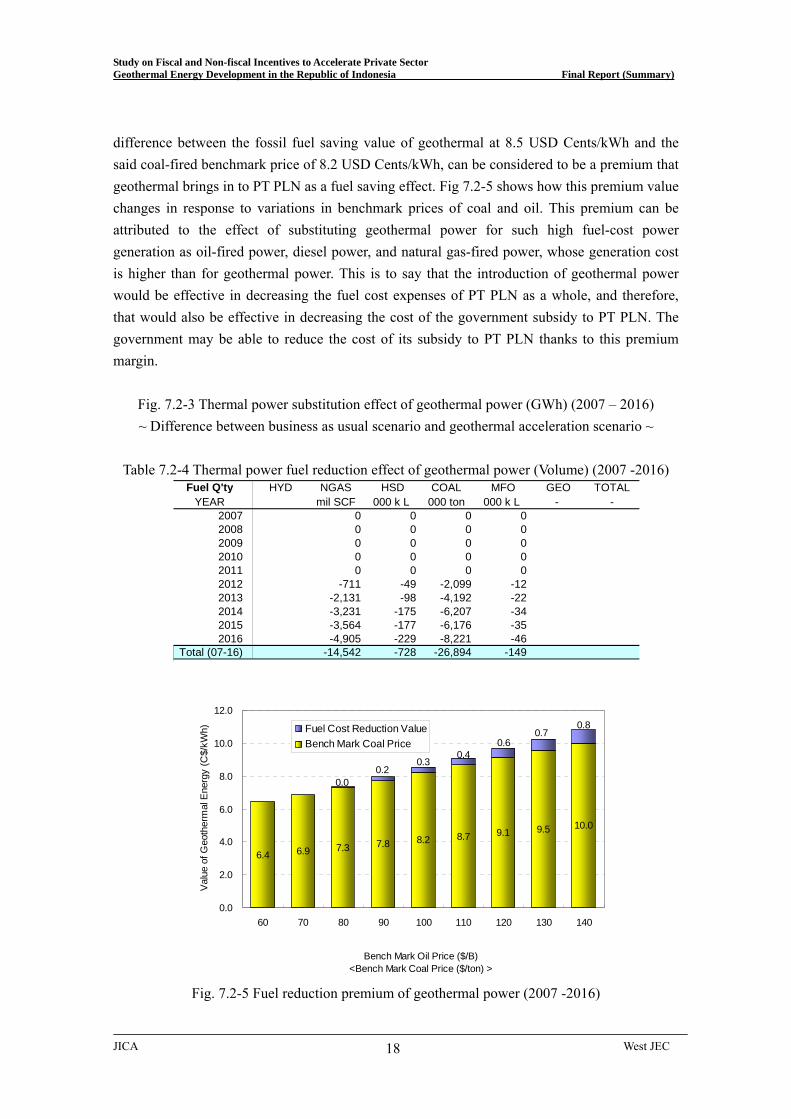
Study on Fiscal and Non-fiscal Incentives to Accelerate Private Sector Geothermal Energy Development in the Republic of Indonesia Final Report (Summary)
JICA West JEC 18
difference between the fossil fuel saving value of geothermal at 8.5 USD Cents/kWh and the said coal-fired benchmark price of 8.2 USD Cents/kWh, can be considered to be a premium that geothermal brings in to PT PLN as a fuel saving effect. Fig 7.2-5 shows how this premium value changes in response to variations in benchmark prices of coal and oil. This premium can be attributed to the effect of substituting geothermal power for such high fuel-cost power generation as oil-fired power, diesel power, and natural gas-fired power, whose generation cost is higher than for geothermal power. This is to say that the introduction of geothermal power would be effective in decreasing the fuel cost expenses of PT PLN as a whole, and therefore, that would also be effective in decreasing the cost of the government subsidy to PT PLN. The government may be able to reduce the cost of its subsidy to PT PLN thanks to this premium margin.
Fig. 7.2-3 Thermal power substitution effect of geothermal power (GWh) (2007 – 2016) ~ Difference between business as usual scenario and geothermal acceleration scenario ~
Table 7.2-4 Thermal power fuel reduction effect of geothermal power (Volume) (2007 -2016)
Fuel Q'ty HYD NGAS HSD COAL MFO GEO TOTALYEAR mil SCF 000 k L 000 ton 000 k L - -
2007 0 0 0 02008 0 0 0 02009 0 0 0 02010 0 0 0 02011 0 0 0 02012 -711 -49 -2,099 -122013 -2,131 -98 -4,192 -222014 -3,231 -175 -6,207 -342015 -3,564 -177 -6,176 -352016 -4,905 -229 -8,221 -46
Total (07-16) -14,542 -728 -26,894 -149
6.4 6.9 7.3 7.8 8.2 8.7 9.1 9.5 10.0
0.80.7
0.60.4
0.30.2
0.0
0.0
2.0
4.0
6.0
8.0
10.0
12.0
60 70 80 90 100 110 120 130 140
Bench Mark Oil Price ($/B)<Bench Mark Coal Price ($/ton) >
Val
ue o
f Geo
ther
mal
Ene
rgy
(C$/
kWh) Fuel Cost Reduction Value
Bench Mark Coal Price
Fig. 7.2-5 Fuel reduction premium of geothermal power (2007 -2016)
Study on Fiscal and Non-fiscal Incentives to Accelerate Private Sector Geothermal Energy Development in the Republic of Indonesia Final Report (Summary)
JICA West JEC 19
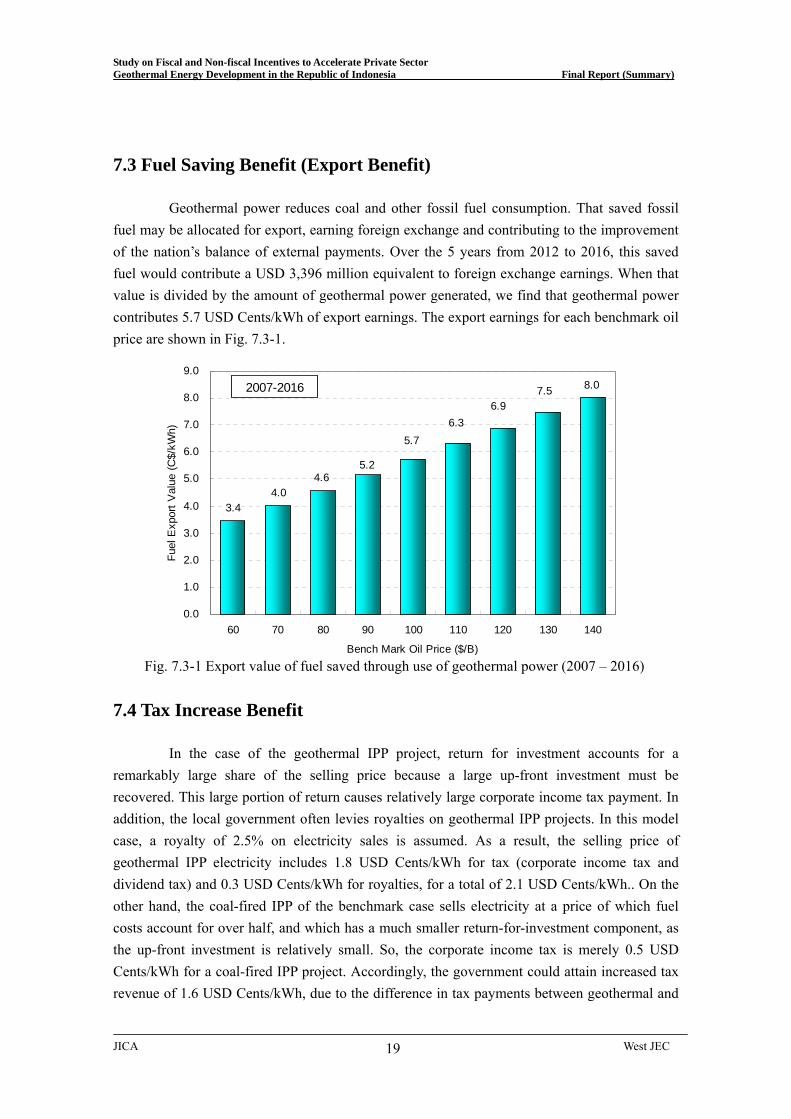
7.3 Fuel Saving Benefit (Export Benefit) Geothermal power reduces coal and other fossil fuel consumption. That saved fossil fuel may be allocated for export, earning foreign exchange and contributing to the improvement of the nation’s balance of external payments. Over the 5 years from 2012 to 2016, this saved fuel would contribute a USD 3,396 million equivalent to foreign exchange earnings. When that value is divided by the amount of geothermal power generated, we find that geothermal power contributes 5.7 USD Cents/kWh of export earnings. The export earnings for each benchmark oil price are shown in Fig. 7.3-1.
8.0
3.44.0
4.65.2
5.76.3
6.97.5
0.0
1.0
2.0
3.0
4.0
5.0
6.0
7.0
8.0
9.0
60 70 80 90 100 110 120 130 140
Bench Mark Oil Price ($/B)
Fuel
Exp
ort V
alue
(C$/
kWh)
2007-2016
Fig. 7.3-1 Export value of fuel saved through use of geothermal power (2007 – 2016)
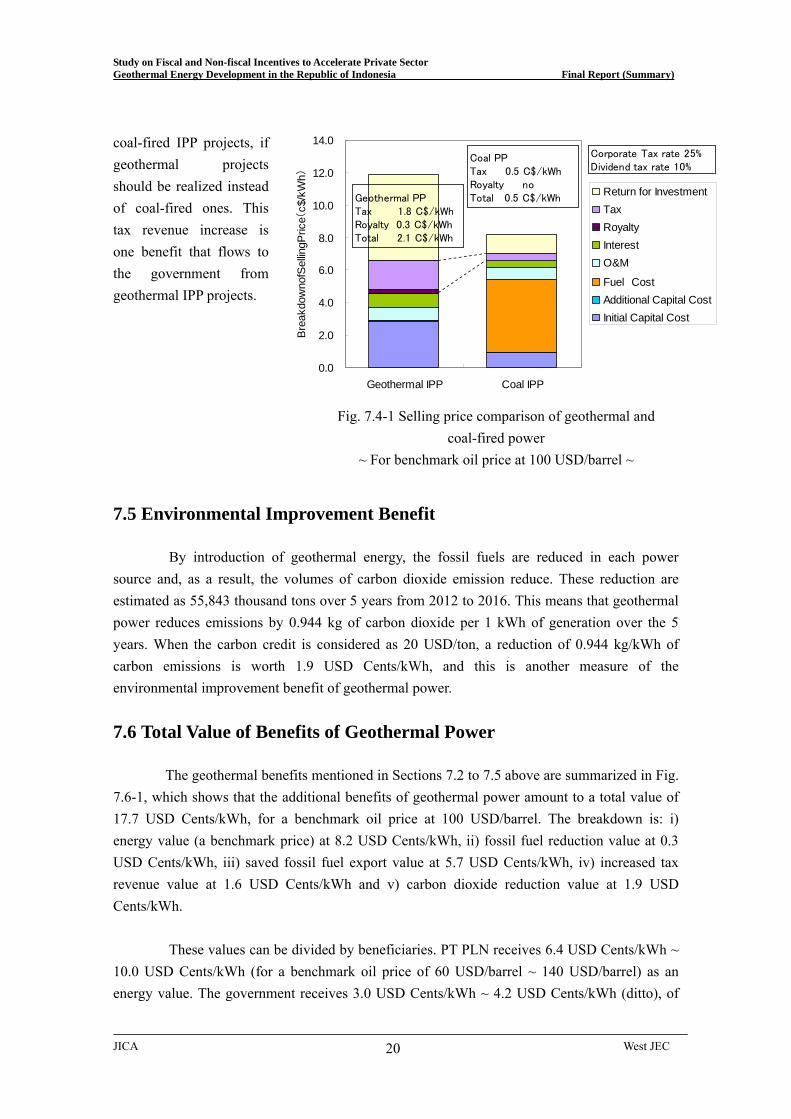
7.4 Tax Increase Benefit In the case of the geothermal IPP project, return for investment accounts for a remarkably large share of the selling price because a large up-front investment must be recovered. This large portion of return causes relatively large corporate income tax payment. In addition, the local government often levies royalties on geothermal IPP projects. In this model case, a royalty of 2.5% on electricity sales is assumed. As a result, the selling price of geothermal IPP electricity includes 1.8 USD Cents/kWh for tax (corporate income tax and dividend tax) and 0.3 USD Cents/kWh for royalties, for a total of 2.1 USD Cents/kWh.. On the other hand, the coal-fired IPP of the benchmark case sells electricity at a price of which fuel costs account for over half, and which has a much smaller return-for-investment component, as the up-front investment is relatively small. So, the corporate income tax is merely 0.5 USD Cents/kWh for a coal-fired IPP project. Accordingly, the government could attain increased tax revenue of 1.6 USD Cents/kWh, due to the difference in tax payments between geothermal and
Study on Fiscal and Non-fiscal Incentives to Accelerate Private Sector Geothermal Energy Development in the Republic of Indonesia Final Report (Summary)
0.0
2.0
4.0
6.0
8.0
10.0
12.) 0
14.0
Geothermal IPP Coal IPP
Bre
akdo
wno
fSel
lingP
rice(
c$/k
Wh
Return for Investment TaxRoyaltyInterestO&M
Fuel CostAdditional Capital Cost Initial Capital Cost
Geothermal PPTax 1.8 C$/kWhRoyalty 0.3 C$/kWhTotal 2.1 C$/kWh
Coal PPTax 0.5 C$/kWhRoyalty noTotal 0.5 C$/kWh
Corporate Tax rate 25%Dividend tax rate 10%
coal-fired IPP projects, if geothermal projects should be realized instead of coal-fired ones. This tax revenue increase is one benefit that flows to the government from geothermal IPP projects.
Fig. 7.4-1 Selling price comparison of geothermal and coal-fired power
~ For benchmark oil price at 100 USD/barrel ~
7.5 Environmental Improvement Benefit By introduction of geothermal energy, the fossil fuels are reduced in each power source and, as a result, the volumes of carbon dioxide emission reduce. These reduction are estimated as 55,843 thousand tons over 5 years from 2012 to 2016. This means that geothermal power reduces emissions by 0.944 kg of carbon dioxide per 1 kWh of generation over the 5 years. When the carbon credit is considered as 20 USD/ton, a reduction of 0.944 kg/kWh of carbon emissions is worth 1.9 USD Cents/kWh, and this is another measure of the environmental improvement benefit of geothermal power.
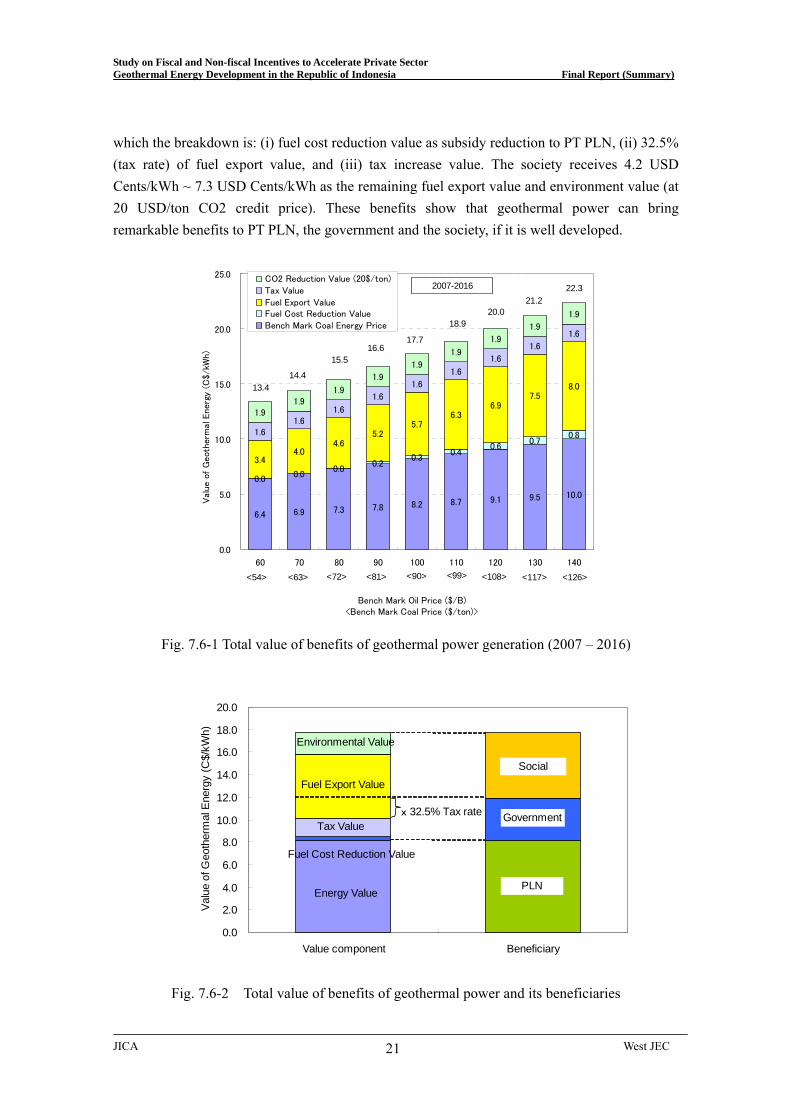
7.6 Total Value of Benefits of Geothermal Power The geothermal benefits mentioned in Sections 7.2 to 7.5 above are summarized in Fig. 7.6-1, which shows that the additional benefits of geothermal power amount to a total value of 17.7 USD Cents/kWh, for a benchmark oil price at 100 USD/barrel. The breakdown is: i) energy value (a benchmark price) at 8.2 USD Cents/kWh, ii) fossil fuel reduction value at 0.3 USD Cents/kWh, iii) saved fossil fuel export value at 5.7 USD Cents/kWh, iv) increased tax revenue value at 1.6 USD Cents/kWh and v) carbon dioxide reduction value at 1.9 USD Cents/kWh.
These values can be divided by beneficiaries. PT PLN receives 6.4 USD Cents/kWh ~ 10.0 USD Cents/kWh (for a benchmark oil price of 60 USD/barrel ~ 140 USD/barrel) as an energy value. The government receives 3.0 USD Cents/kWh ~ 4.2 USD Cents/kWh (ditto), of
JICA West JEC 20
Study on Fiscal and Non-fiscal Incentives to Accelerate Private Sector Geothermal Energy Development in the Republic of Indonesia Final Report (Summary)
JICA West JEC 21
6.4 6.9 7.3 7.8 8.2 8.7 9.1 9.5 10.0
0.00.0
0.00.2
0.30.4
0.60.7
0.8
3.44.0
4.65.2
5.76.3
6.97.5
8.0
1.61.6
1.6
1.6
1.6
1.6
1.6
1.6
1.6
1.91.9
1.9
1.9
1.9
1.9
1.9
1.9
1.9
0.0
5.0
10.0
15.0
20.0
25.0
60 70 80 90 100 110 120 130 140
Bench Mark Oil Price ($/B)<Bench Mark Coal Price ($/ton)>
Valu
e o
f G
eot
herm
al E
nerg
y (
C$/k
Wh)
CO2 Reduction Value (20$/ton)
Tax Value
Fuel Export ValueFuel Cost Reduction Value
Bench Mark Coal Energy Price
2007-2016
14.4
22.321.2
20.018.9
17.716.6
15.5
13.4
<54> <63> <72> <81> <90> <99> <108> <117> <126>
which the breakdown is: (i) fuel cost reduction value as subsidy reduction to PT PLN, (ii) 32.5% (tax rate) of fuel export value, and (iii) tax increase value. The society receives 4.2 USD Cents/kWh ~ 7.3 USD Cents/kWh as the remaining fuel export value and environment value (at 20 USD/ton CO2 credit price). These benefits show that geothermal power can bring remarkable benefits to PT PLN, the government and the society, if it is well developed.
0.0
2.0
4.0
6.0
8.0
10.0
12.0
14.0
16.0
18.0
20.0
Value component Beneficiary
Valu
e of
Geo
ther
mal
Ene
rgy
(C$/
kWh)
Environmental Value
Energy ValuePLN
Social
GovernmentTax Value
Fuel Export Value
Fuel Cost Reduction Value
x 32.5% Tax rate
Fig. 7.6-1 Total value of benefits of geothermal power generation (2007 – 2016)
Fig. 7.6-2 Total value of benefits of geothermal power and its beneficiaries
Study on Fiscal and Non-fiscal Incentives to Accelerate Private Sector Geothermal Energy Development in the Republic of Indonesia Final Report (Summary)
Ripple effect of cons uction investment of 60 MW class geothermal power plant in Indonesian trbRP: billion Rupia
Purchase in domesticmarket
Production increase(primary)
Demand increase in each industry
Wage increaseEmployment increase
(primary)
Employment increase(secondary)
Production increase(secondary)
Consumption increase
Prim
ary
effect
Seconda
ry e
ffect
1,043 bRp
2,596 psn
7,464 psn
83 bRp
150 bRp
136 bRp
1,526 bRp
Employment increase(primary + secondary)
Production increase(primary + secondary)
Tota
l eff
ect
1,662 bRp(multiplier effect 1.59 times)
10,060 psn
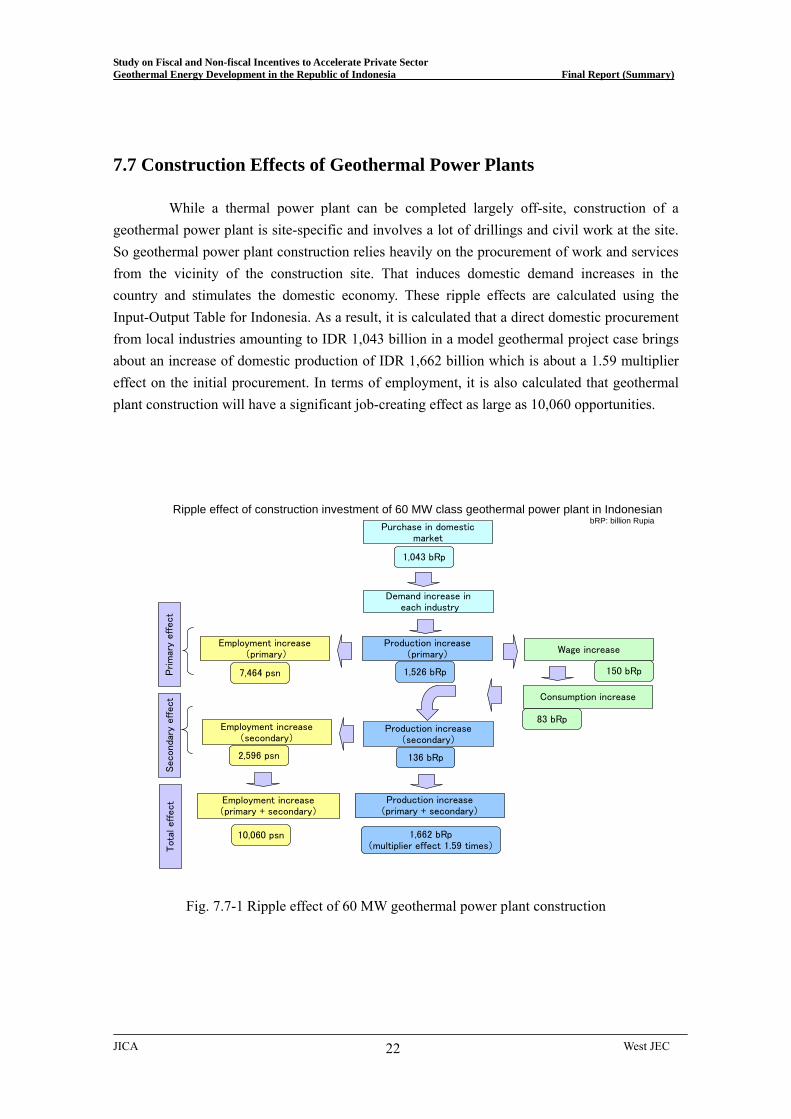
7.7 Construction Effects of Geothermal Power Plants
While a thermal power plant can be completed largely off-site, construction of a
Fig. 7.7-1 Ripple effect of 60 MW geothermal power plant construction
geothermal power plant is site-specific and involves a lot of drillings and civil work at the site. So geothermal power plant construction relies heavily on the procurement of work and services from the vicinity of the construction site. That induces domestic demand increases in the country and stimulates the domestic economy. These ripple effects are calculated using the Input-Output Table for Indonesia. As a result, it is calculated that a direct domestic procurement from local industries amounting to IDR 1,043 billion in a model geothermal project case brings about an increase of domestic production of IDR 1,662 billion which is about a 1.59 multiplier effect on the initial procurement. In terms of employment, it is also calculated that geothermal plant construction will have a significant job-creating effect as large as 10,060 opportunities.
JICA West JEC 22

Study on Fiscal and Non-fiscal Incentives to Accelerate Private Sector Geothermal Energy Development in the Republic of Indonesia Final Report (Summary)
JICA West JEC 23
CHAPTER 8 SHORT-TERM INCENTIVES TO PROMOTE GEOTHERMAL DEVELOPMMENT
8.1 Market Failure and Necessity of Government Intervention
The selling price calculation method in Chapter 5 and Chapter 6 is applied to other energy sources. Based on the current energy price status quo Fig. 8.1-3 indicates that the cheapest generation source is gas-fired combined-cycle power generation (GCC) followed by coal-fired power generation. Since domestic gas production is decreasing and some gas-fired power plants may need to switch from gas to oil, PT PLN and IPPs see coal as the main source of power generation. This is a natural reaction for entities that seek competitive prices following market principles.
0 10 20 30 40 50
Diesel
Steam (MFO)
Gas CC
Steam (Coal)
Geothermal
Selling Price (C$/kWh)
Capital Cost Fuel Cost
Fuel Price
Oil 100 US$/B
Coal 90 US$/ton
N' Gas 6.0 US$/MMBTU (Domestic price) 13.0 US$/MMBTU (International price)
MFO 110 US$/B HSD 140 US$/B
Capital CostGeothermal 3,010 US$/kW
Coal 1,210 US$/kW
Gas CC 800 US$/kW
Steam 1,000 US$/kW
Diesel 1,150 US$/kW
Fig. 8.1-3 Estimated selling prices of power by fuel sources
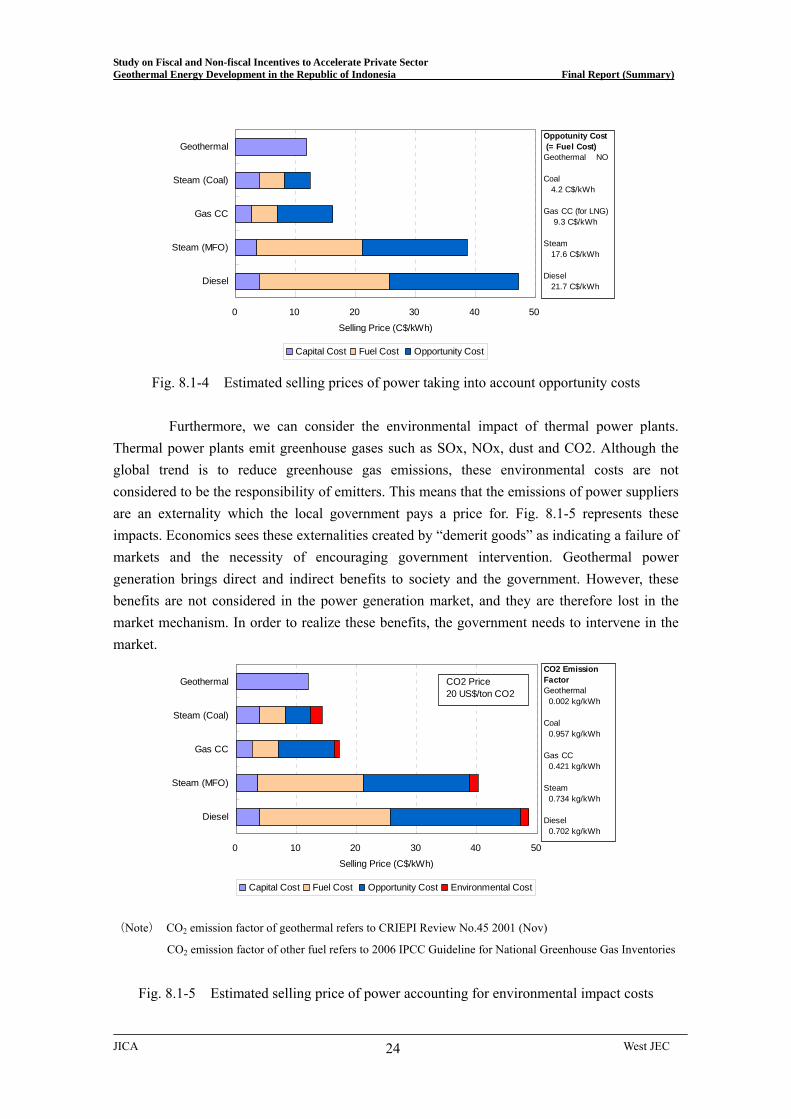
One must not forget that the natural gas and the coal consumed in the power plants are precious natural resources that can be exported. Merely consuming them as fuel for power generation should be seen as a loss of economic opportunity. In accounting for the economy of each power plant from the broader point of view of the overall national economic interest, these opportunity losses must be taken into consideration. Fig. 8.1-4 shows the impact of these losses. It indicates that geothermal power generation could be the most cost-competitive form of generation. However, this “cost of lost opportunity” is negligible for players acting only in compliance with market principles. Therefore, they tend to choose coal-fired power generation, instead of geothermal power generation. As a result, the various benefits of geothermal power generation are lost. This constitutes a failure of market, and clearly some form of government intervention is required to enable an optimal mix of energy sources.
Study on Fiscal and Non-fiscal Incentives to Accelerate Private Sector Geothermal Energy Development in the Republic of Indonesia Final Report (Summary)
JICA West JEC 24
0 10 20 30 40 50
Diesel
Steam (MFO)
Gas CC
Steam (Coal)
Geothermal
Selling Price (C$/kWh)
Capital Cost Fuel Cost Opportunity Cost
Oppotunity Cost (= Fuel Cost)Geothermal NO Coal 4.2 C$/kWh Gas CC (for LNG) 9.3 C$/kWh
Steam 17.6 C$/kWh
Diesel 21.7 C$/kWh
Fig. 8.1-4 Estimated selling prices of power taking into account opportunity costs
Furthermore, we can consider the environmental impact of thermal power plants. Thermal power plants emit greenhouse gases such as SOx, NOx, dust and CO2. Although the global trend is to reduce greenhouse gas emissions, these environmental costs are not considered to be the responsibility of emitters. This means that the emissions of power suppliers are an externality which the local government pays a price for. Fig. 8.1-5 represents these impacts. Economics sees these externalities created by “demerit goods” as indicating a failure of markets and the necessity of encouraging government intervention. Geothermal power generation brings direct and indirect benefits to society and the government. However, these benefits are not considered in the power generation market, and they are therefore lost in the market mechanism. In order to realize these benefits, the government needs to intervene in the market.
0 10 20 30 40 50
Diesel
Steam (MFO)
Gas CC
Steam (Coal)
Geothermal
Selling Price (C$/kWh)
Capital Cost Fuel Cost Opportunity Cost Environmental Cost
CO2 Price 20 US$/ton CO2
CO2 EmissionFactorGeothermal 0.002 kg/kWh Coal 0.957 kg/kWh Gas CC 0.421 kg/kWh
Steam 0.734 kg/kWh
Diesel 0.702 kg/kWh
(Note) CO2 emission factor of geothermal refers to CRIEPI Review No.45 2001 (Nov)
CO2 emission factor of other fuel refers to 2006 IPCC Guideline for National Greenhouse Gas Inventories
Fig. 8.1-5 Estimated selling price of power accounting for environmental impact costs
Study on Fiscal and Non-fiscal Incentives to Accelerate Private Sector Geothermal Energy Development in the Republic of Indonesia Final Report (Summary)
JICA West JEC 25
8.2 Geothermal Energy Promotion Policy
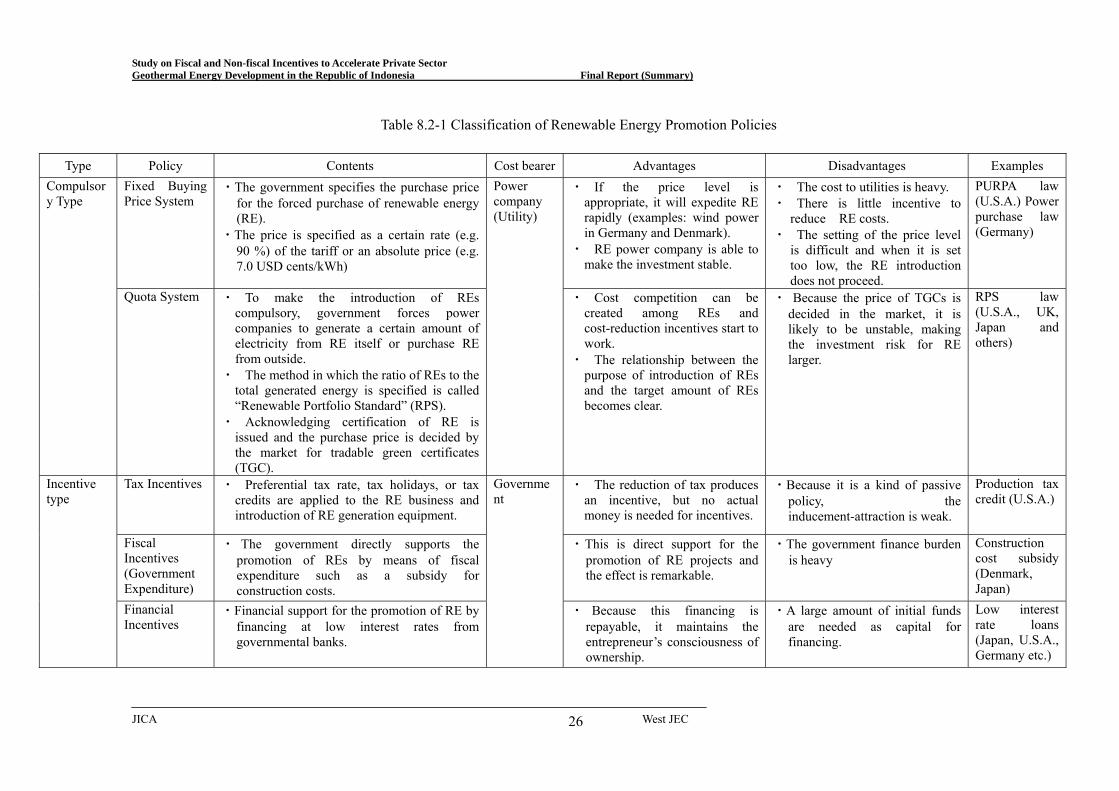
Geothermal energy promotion policy can be divided into compulsory-type policy, which obliges power companies (or end-users) to bear the costs, and incentive-type policy, in which the government bears the costs. Compulsory-type policy includes a fixed price buying system and a renewable energy quota system. On the other hand, incentive-type policy includes tax incentives, fiscal incentives and financial incentives. Table 8.2-1 shows the characteristics of these policies.
Geothermal power generation brings about various benefits for the society and the government. However, because of its higher price compared with benchmark coal-fired power generation, the market alone does not promote geothermal power generation automatically. Therefore, government interventions are required to realize the benefits of geothermal power generation.
Study on Fiscal and Non-fiscal Incentives to Accelerate Private Sector Geothermal Energy Development in the Republic of Indonesia Final Report (Summary)
JICA West JEC 26
Table 8.2-1 Classification of Renewable Energy Promotion Policies
Type Policy Contents Cost bearer Advantages Disadvantages Examples Fixed Buying Price System
・The government specifies the purchase price for the forced purchase of renewable energy (RE).
・The price is specified as a certain rate (e.g. 90 %) of the tariff or an absolute price (e.g. 7.0 USD cents/kWh)
・ If the price level is appropriate, it will expedite RE rapidly (examples: wind power in Germany and Denmark).
・ RE power company is able to make the investment stable.
・ The cost to utilities is heavy. ・ There is little incentive to
reduce RE costs. ・ The setting of the price level
is difficult and when it is set too low, the RE introduction does not proceed.
PURPA law (U.S.A.) Power purchase law (Germany)
Compulsory Type
Quota System ・ To make the introduction of REs compulsory, government forces power companies to generate a certain amount of electricity from RE itself or purchase RE from outside.
・ The method in which the ratio of REs to the total generated energy is specified is called “Renewable Portfolio Standard” (RPS).
・ Acknowledging certification of RE is issued and the purchase price is decided by the market for tradable green certificates (TGC).
Power company (Utility)
・ Cost competition can be created among REs and cost-reduction incentives start to work.
・ The relationship between the purpose of introduction of REs and the target amount of REs becomes clear.
・ Because the price of TGCs is decided in the market, it is likely to be unstable, making the investment risk for RE larger.
RPS law (U.S.A., UK, Japan and others)
Tax Incentives ・ Preferential tax rate, tax holidays, or tax credits are applied to the RE business and introduction of RE generation equipment.
・ The reduction of tax produces an incentive, but no actual money is needed for incentives.
・Because it is a kind of passive policy, thinducement-attraction is weak.
e Production tax credit (U.S.A.)
Fiscal Incentives (Government Expenditure)
・ The government directly supports the promotion of REs by means of fiscal expenditure such as a subsidy for construction costs.
・This is direct support for the promotion of RE projects and the effect is remarkable.
・The government finance burden is heavy
Construction cost subsidy (Denmark, Japan)
Incentive type
Financial Incentives
・Financial support for the promotion of RE by financing at low interest rates from governmental banks.
Government
・ Because this financing is repayable, it maintains the entrepreneur’s consciousness of ownership.
・A large amount of initial funds are needed as capital for financing.
Low interest rate loans (Japan, U.S.A., Germany etc.)
Study on Fiscal and Non-fiscal Incentives to Accelerate Private Sector Geothermal Energy Development in the Republic of Indonesia Final Report (Summary)
8.3 The Feed-in Tariff (FIT) Scheme
Many countries oblige power companies to purchase power from renewable energy sources at fixed prices to promote renewable energy. The fixed purchase price can be specified as a certain ratio (e.g. 90%) of the retail tariff or as a definite price (e.g. 15 Euro cents/kWh) for each renewable energy source. Nowadays, the Feed-in Tariff scheme seen in Germany and the EU, typical example of the latter, is becoming popular.
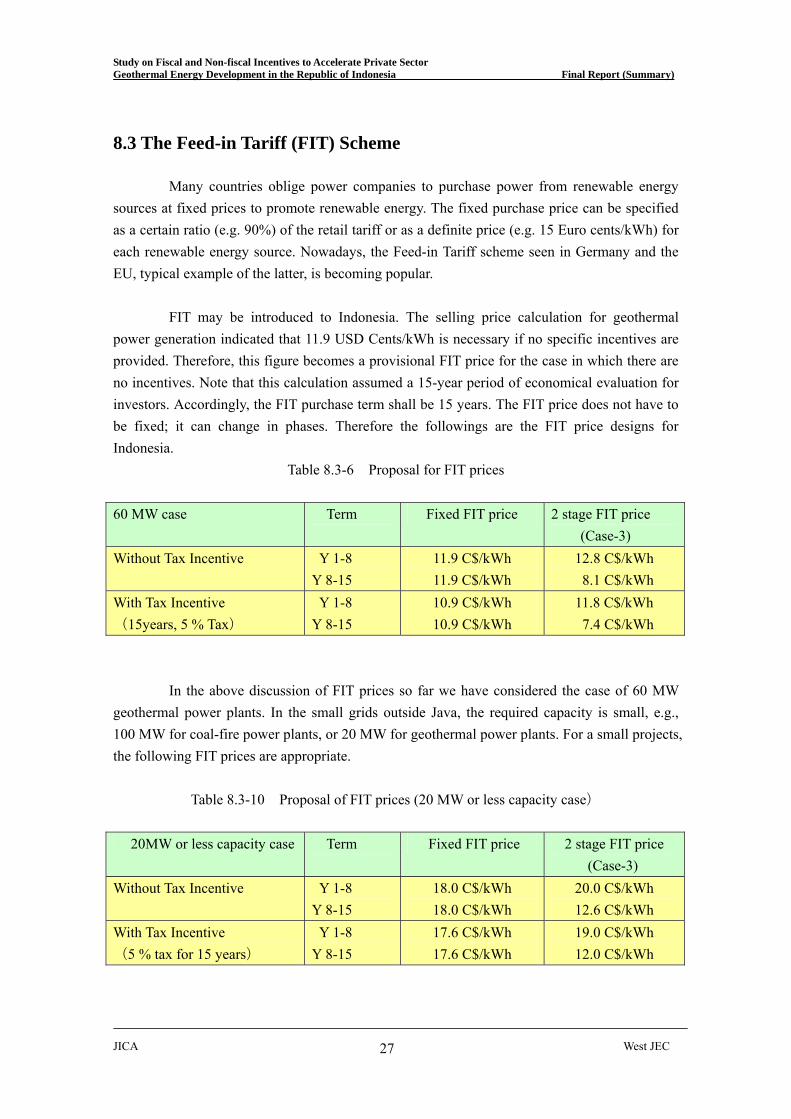
FIT may be introduced to Indonesia. The selling price calculation for geothermal power generation indicated that 11.9 USD Cents/kWh is necessary if no specific incentives are provided. Therefore, this figure becomes a provisional FIT price for the case in which there are no incentives. Note that this calculation assumed a 15-year period of economical evaluation for investors. Accordingly, the FIT purchase term shall be 15 years. The FIT price does not have to be fixed; it can change in phases. Therefore the followings are the FIT price designs for Indonesia.
Table 8.3-6 Proposal for FIT prices
60 MW case Term
Fixed FIT price 2 stage FIT price (Case-3)
Without Tax Incentive Y 1-8 Y 8-15
11.9 C$/kWh 11.9 C$/kWh
12.8 C$/kWh 8.1 C$/kWh
With Tax Incentive (15years, 5 % Tax)
Y 1-8 Y 8-15
10.9 C$/kWh 10.9 C$/kWh
11.8 C$/kWh 7.4 C$/kWh
In the above discussion of FIT prices so far we have considered the case of 60 MW geothermal power plants. In the small grids outside Java, the required capacity is small, e.g., 100 MW for coal-fire power plants, or 20 MW for geothermal power plants. For a small projects, the following FIT prices are appropriate.
Table 8.3-10 Proposal of FIT prices (20 MW or less capacity case)
20MW or less capacity case Term
Fixed FIT price 2 stage FIT price (Case-3)
Without Tax Incentive Y 1-8 Y 8-15
18.0 C$/kWh 18.0 C$/kWh
20.0 C$/kWh 12.6 C$/kWh
With Tax Incentive (5 % tax for 15 years)
Y 1-8 Y 8-15
17.6 C$/kWh 17.6 C$/kWh
19.0 C$/kWh 12.0 C$/kWh
JICA West JEC 27
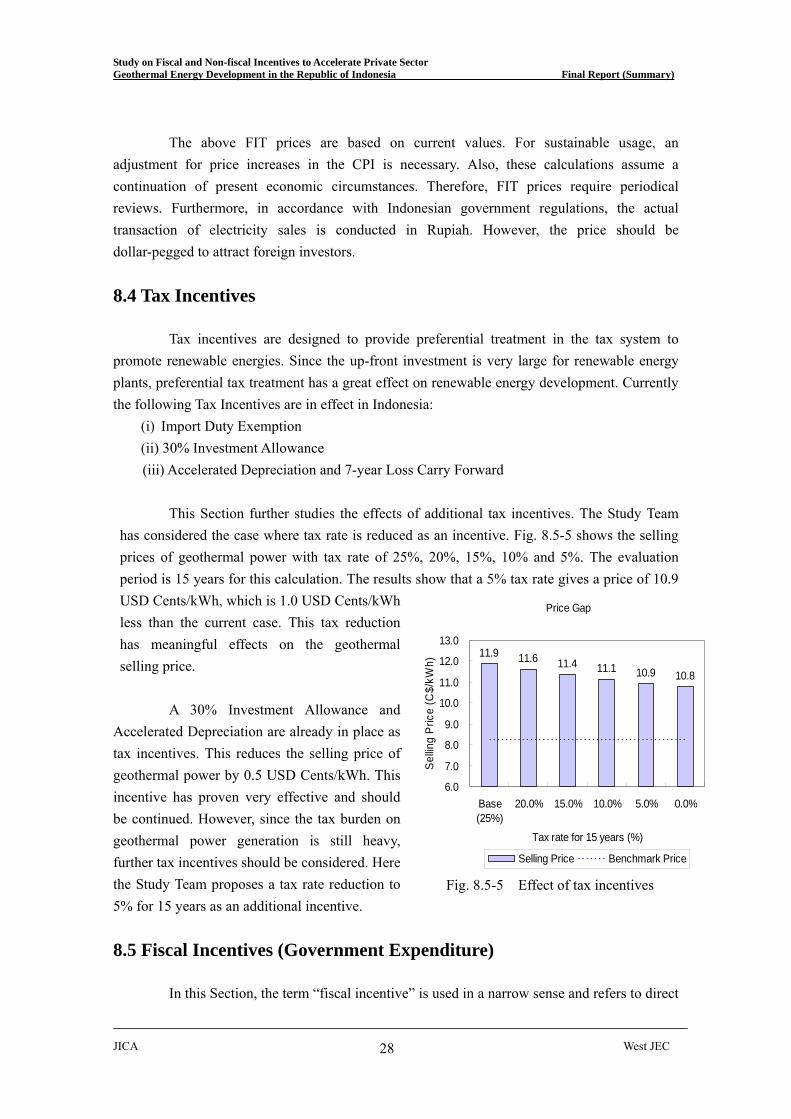
Study on Fiscal and Non-fiscal Incentives to Accelerate Private Sector Geothermal Energy Development in the Republic of Indonesia Final Report (Summary)
JICA West JEC 28
The above FIT prices are based on current values. For sustainable usage, an adjustment for price increases in the CPI is necessary. Also, these calculations assume a continuation of present economic circumstances. Therefore, FIT prices require periodical reviews. Furthermore, in accordance with Indonesian government regulations, the actual transaction of electricity sales is conducted in Rupiah. However, the price should be dollar-pegged to attract foreign investors. 8.4 Tax Incentives
Tax incentives are designed to provide preferential treatment in the tax system to
promote renewable energies. Since the up-front investment is very large for renewable energy plants, preferential tax treatment has a great effect on renewable energy development. Currently the following Tax Incentives are in effect in Indonesia:
(i) Import Duty Exemption (ii) 30% Investment Allowance
(iii) Accelerated Depreciation and 7-year Loss Carry Forward
Price Gap
11.9 11.6 11.4 11.1 10.9 10.8
6.0
7.0
8.0
9.0
10.0
11.0
12.0
13.0
Base(25%)
20.0% 15.0% 10.0% 5.0% 0.0%
Tax rate for 15 years (%)
Sellin
g Pr
ice
(C$/
kWh)
Selling Price Benchmark Price
This Section further studies the effects of additional tax incentives. The Study Team has considered the case where tax rate is reduced as an incentive. Fig. 8.5-5 shows the selling prices of geothermal power with tax rate of 25%, 20%, 15%, 10% and 5%. The evaluation period is 15 years for this calculation. The results show that a 5% tax rate gives a price of 10.9 USD Cents/kWh, which is 1.0 USD Cents/kWh less than the current case. This tax reduction has meaningful effects on the geothermal selling price.
A 30% Investment Allowance and
Accelerated Depreciation are already in place as tax incentives. This reduces the selling price of geothermal power by 0.5 USD Cents/kWh. This incentive has proven very effective and should be continued. However, since the tax burden on geothermal power generation is still heavy, further tax incentives should be considered. Here the Study Team proposes a tax rate reduction to 5% for 15 years as an additional incentive.
Fig. 8.5-5 Effect of tax incentives
8.5 Fiscal Incentives (Government Expenditure)
In this Section, the term “fiscal incentive” is used in a narrow sense and refers to direct
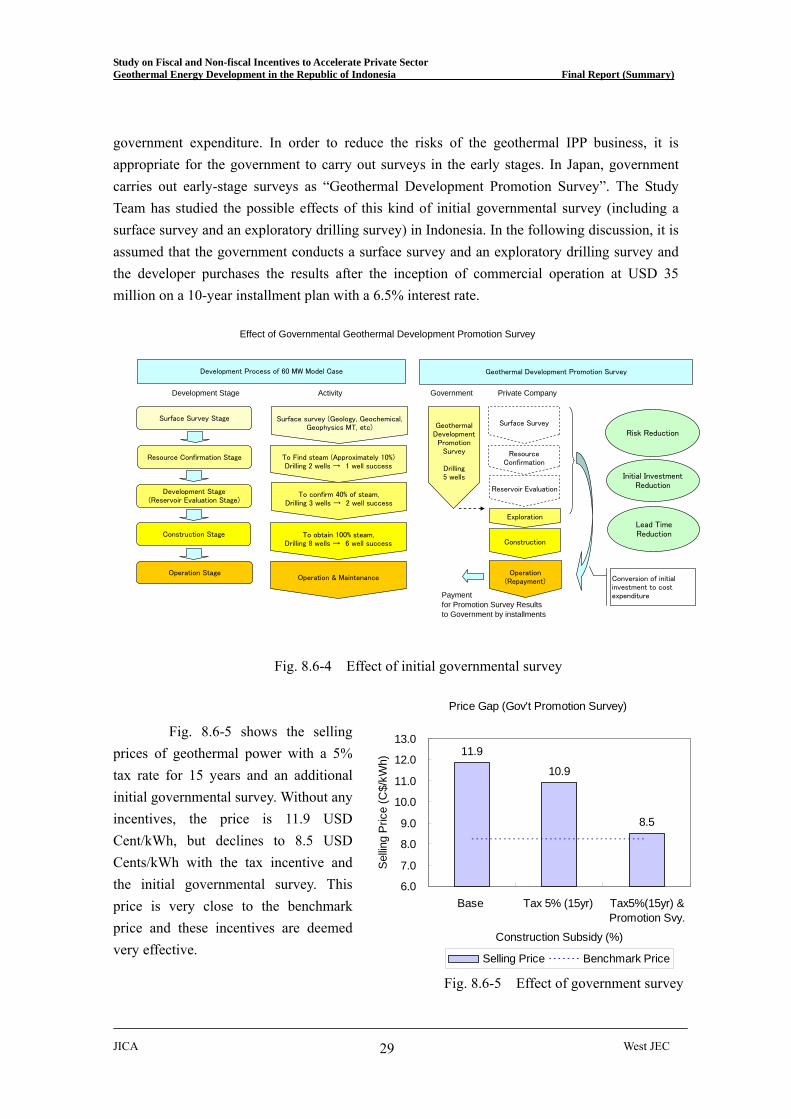
Study on Fiscal and Non-fiscal Incentives to Accelerate Private Sector Geothermal Energy Development in the Republic of Indonesia Final Report (Summary)
government expenditure. In order to reduce the risks of the geothermal IPP business, it is appropriate for the government to carry out surveys in the early stages. In Japan, government carries out early-stage surveys as “Geothermal Development Promotion Survey”. The Study Team has studied the possible effects of this kind of initial governmental survey (including a surface survey and an exploratory drilling survey) in Indonesia. In the following discussion, it is assumed that the government conducts a surface survey and an exploratory drilling survey and the developer purchases the results after the inception of commercial operation at USD 35 million on a 10-year installment plan with a 6.5% interest rate. Effect of Governmental Geothermal Development Promotion Survey
Development Stage Activity Government Private Company
Paymentfor Promotion Survey Resultsto Government by installments
Surface Survey Stage
Resource Confirmation Stage
Construction Stage
Development Stage(Reservoir Evaluation Stage)
Operation Stage
Development Process of 60 MW Model Case
Surface survey (Geology, Geochemical,Geophysics MT, etc)
To Find steam (Approximately 10%)Drilling 2 wells → 1 well success
To confirm 40% of steam,Drilling 3 wells → 2 well success
To obtain 100% steam,Drilling 8 wells → 6 well success
Operation & Maintenance
Geothermal Development Promotion Survey
Construction
Operation(Repayment)
Surface Survey
Reservoir Evaluation
ResourceConfirmation
Risk Reduction
Initial InvestmentReduction
Lead TimeReduction
Conversion of initialinvestment to costexpenditure
GeothermalDevelopmentPromotion
Survey
Drilling5 wells
Exploration
Fig. 8.6-4 Effect of initial governmental survey
Price Gap (Gov't Promotion Survey)
11.9
10.9
8.5
6.0
7.0
8.0
9.0
10.0
11.0
12.0
13.0
Base Tax 5% (15yr) Tax5%(15yr) &Promotion Svy.
Construction Subsidy (%)
Sel
ling
Pric
e (C
$/kW
h)
Selling Price Benchmark Price
Fig. 8.6-5 shows the selling
prices of geothermal power with a 5% tax rate for 15 years and an additional initial governmental survey. Without any incentives, the price is 11.9 USD Cent/kWh, but declines to 8.5 USD Cents/kWh with the tax incentive and the initial governmental survey. This price is very close to the benchmark price and these incentives are deemed very effective.
Fig. 8.6-5 Effect of government survey
JICA West JEC 29
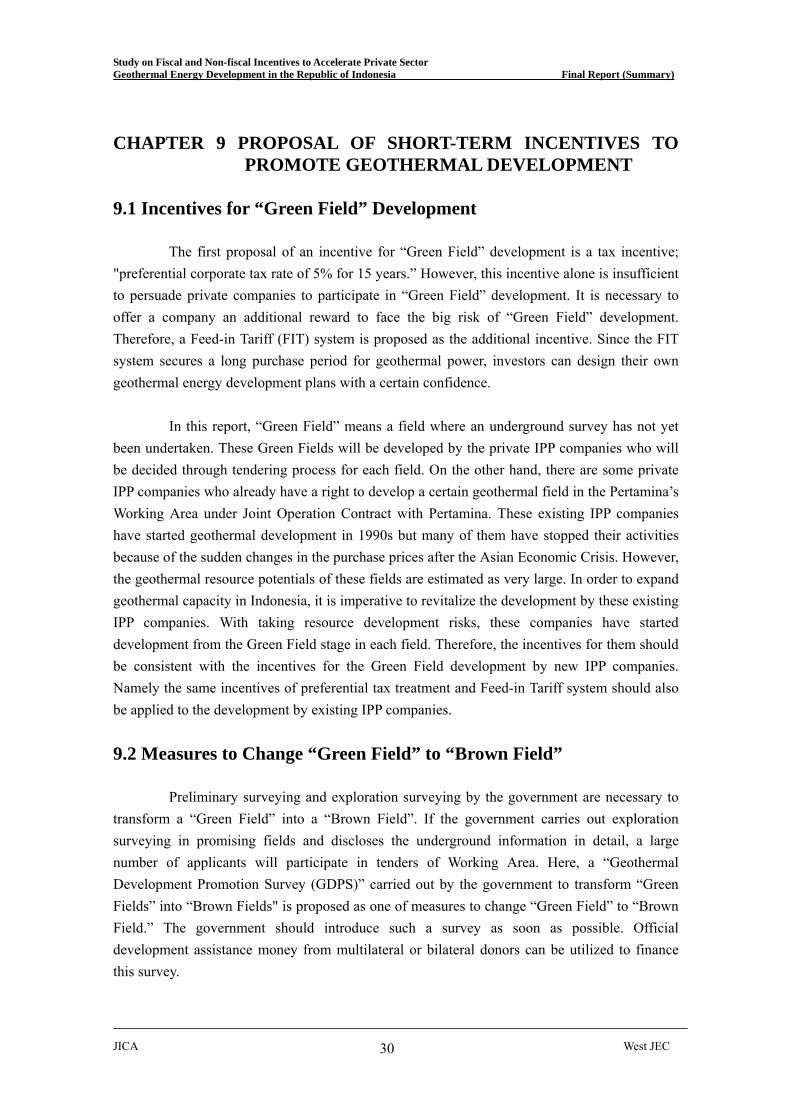
Study on Fiscal and Non-fiscal Incentives to Accelerate Private Sector Geothermal Energy Development in the Republic of Indonesia Final Report (Summary)
CHAPTER 9 PROPOSAL OF SHORT-TERM INCENTIVES TO PROMOTE GEOTHERMAL DEVELOPMENT
9.1 Incentives for “Green Field” Development
The first proposal of an incentive for “Green Field” development is a tax incentive; "preferential corporate tax rate of 5% for 15 years.” However, this incentive alone is insufficient to persuade private companies to participate in “Green Field” development. It is necessary to offer a company an additional reward to face the big risk of “Green Field” development. Therefore, a Feed-in Tariff (FIT) system is proposed as the additional incentive. Since the FIT system secures a long purchase period for geothermal power, investors can design their own geothermal energy development plans with a certain confidence.
In this report, “Green Field” means a field where an underground survey has not yet been undertaken. These Green Fields will be developed by the private IPP companies who will be decided through tendering process for each field. On the other hand, there are some private IPP companies who already have a right to develop a certain geothermal field in the Pertamina’s Working Area under Joint Operation Contract with Pertamina. These existing IPP companies have started geothermal development in 1990s but many of them have stopped their activities because of the sudden changes in the purchase prices after the Asian Economic Crisis. However, the geothermal resource potentials of these fields are estimated as very large. In order to expand geothermal capacity in Indonesia, it is imperative to revitalize the development by these existing IPP companies. With taking resource development risks, these companies have started development from the Green Field stage in each field. Therefore, the incentives for them should be consistent with the incentives for the Green Field development by new IPP companies. Namely the same incentives of preferential tax treatment and Feed-in Tariff system should also be applied to the development by existing IPP companies.
9.2 Measures to Change “Green Field” to “Brown Field”
Preliminary surveying and exploration surveying by the government are necessary to transform a “Green Field” into a “Brown Field”. If the government carries out exploration surveying in promising fields and discloses the underground information in detail, a large number of applicants will participate in tenders of Working Area. Here, a “Geothermal Development Promotion Survey (GDPS)” carried out by the government to transform “Green Fields” into “Brown Fields" is proposed as one of measures to change “Green Field” to “Brown Field.” The government should introduce such a survey as soon as possible. Official development assistance money from multilateral or bilateral donors can be utilized to finance this survey.
JICA West JEC 30
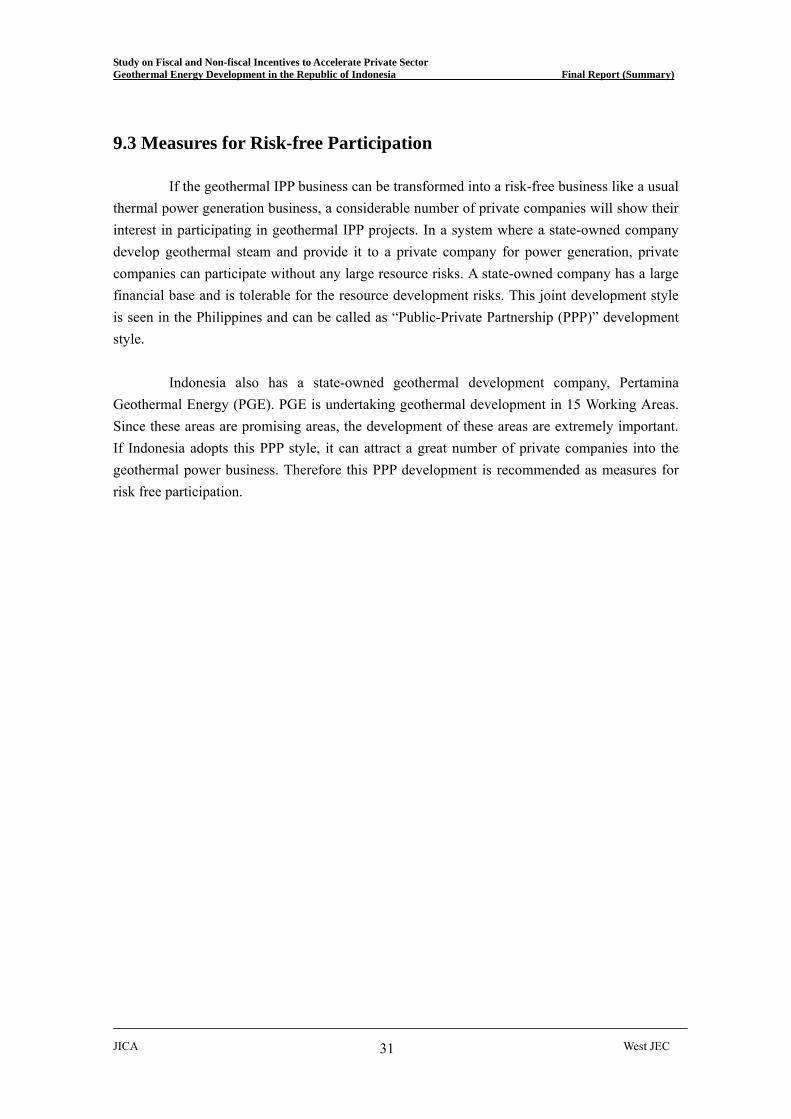
Study on Fiscal and Non-fiscal Incentives to Accelerate Private Sector Geothermal Energy Development in the Republic of Indonesia Final Report (Summary)
9.3 Measures for Risk-free Participation
If the geothermal IPP business can be transformed into a risk-free business like a usual thermal power generation business, a considerable number of private companies will show their interest in participating in geothermal IPP projects. In a system where a state-owned company develop geothermal steam and provide it to a private company for power generation, private companies can participate without any large resource risks. A state-owned company has a large financial base and is tolerable for the resource development risks. This joint development style is seen in the Philippines and can be called as “Public-Private Partnership (PPP)” development style.
Indonesia also has a state-owned geothermal development company, Pertamina
Geothermal Energy (PGE). PGE is undertaking geothermal development in 15 Working Areas. Since these areas are promising areas, the development of these areas are extremely important. If Indonesia adopts this PPP style, it can attract a great number of private companies into the geothermal power business. Therefore this PPP development is recommended as measures for risk free participation.
JICA West JEC 31
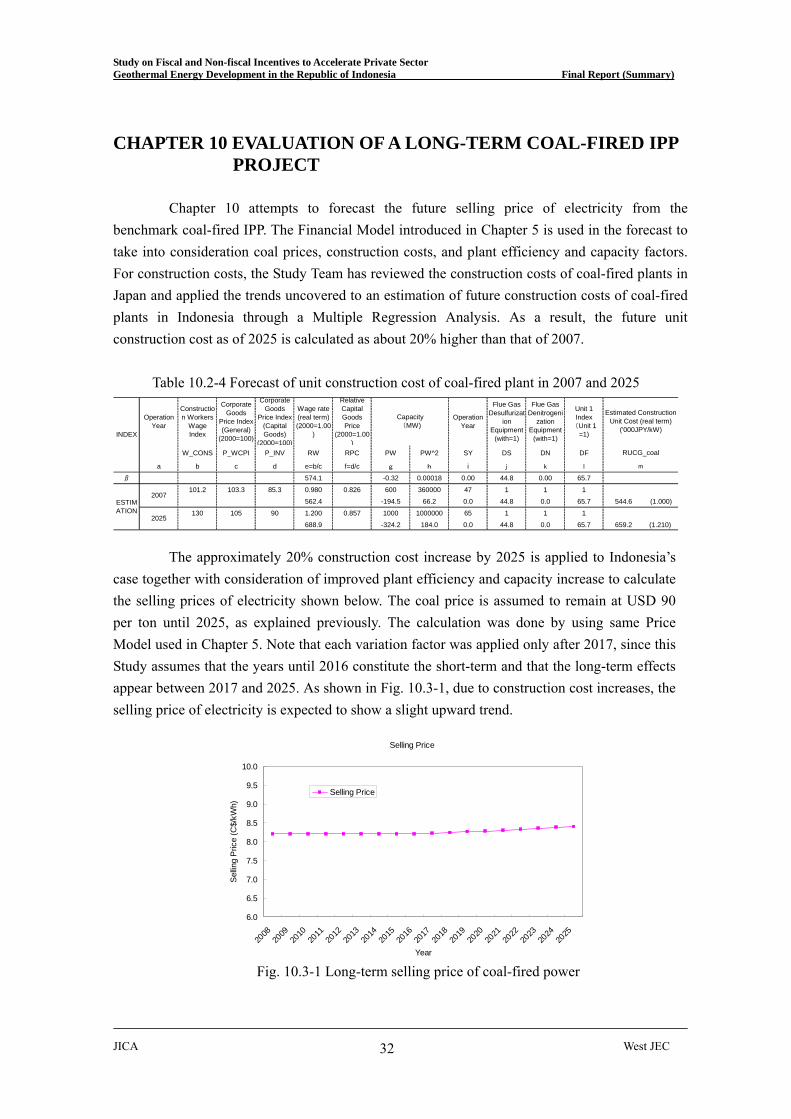
Study on Fiscal and Non-fiscal Incentives to Accelerate Private Sector Geothermal Energy Development in the Republic of Indonesia Final Report (Summary)
CHAPTER 10 EVALUATION OF A LONG-TERM COAL-FIRED IPP PROJECT
Chapter 10 attempts to forecast the future selling price of electricity from the
benchmark coal-fired IPP. The Financial Model introduced in Chapter 5 is used in the forecast to take into consideration coal prices, construction costs, and plant efficiency and capacity factors. For construction costs, the Study Team has reviewed the construction costs of coal-fired plants in Japan and applied the trends uncovered to an estimation of future construction costs of coal-fired plants in Indonesia through a Multiple Regression Analysis. As a result, the future unit construction cost as of 2025 is calculated as about 20% higher than that of 2007.
Table 10.2-4 Forecast of unit construction cost of coal-fired plant in 2007 and 2025
OperationYear
Construction Workers
WageIndex
CorporateGoods
Price Index(General)
(2000=100)
CorporateGoods
Price Index(CapitalGoods)
(2000=100)
Wage rate(real term)(2000=1.00
)
RelativeCapitalGoodsPrice
(2000=1.00)
OperationYear
Flue GasDesulfurizat
ionEquipment
(with=1)
Flue GasDenitrogeni
zationEquipment
(with=1)
Unit 1Index
(Unit 1=1)
W_CONS P_WCPI P_INV RW RPC PW PW^2 SY DS DN DF
a b c d e=b/c f=d/c g h i j k l
β 574.1 -0.32 0.00018 0.00 44.8 0.00 65.7
101.2 103.3 85.3 0.980 0.826 600 360000 47 1 1 1
562.4 -194.5 66.2 0.0 44.8 0.0 65.7 544.6 (1.000)
130 105 90 1.200 0.857 1000 1000000 65 1 1 1
688.9 -324.2 184.0 0.0 44.8 0.0 65.7 659.2 (1.210)
ESTIM
Selling Price
6.0
6.5
7.0
7.5
8.0
8.5
9.0
9.5
10.0
2008
2009
2010
2011
2012
2013
2014
2015
2016
2017
2018
2019
2020
2021
2022
2023
2024
2025
Year
Sel
ling
Pric
e (C
$/kW
h)
Selling Price
ATION
2007
2025
DEX
Estimated ConstructionUnit Cost (real term)
('000JPY/kW)
RUCG_coal
m
Capacity(MW)
IN
The approximately 20% construction cost increase by 2025 is applied to Indonesia’s
case together with consideration of improved plant efficiency and capacity increase to calculate the selling prices of electricity shown below. The coal price is assumed to remain at USD 90 per ton until 2025, as explained previously. The calculation was done by using same Price Model used in Chapter 5. Note that each variation factor was applied only after 2017, since this Study assumes that the years until 2016 constitute the short-term and that the long-term effects appear between 2017 and 2025. As shown in Fig. 10.3-1, due to construction cost increases, the selling price of electricity is expected to show a slight upward trend.
Fig. 10.3-1 Long-term selling price of coal-fired power
JICA West JEC 32
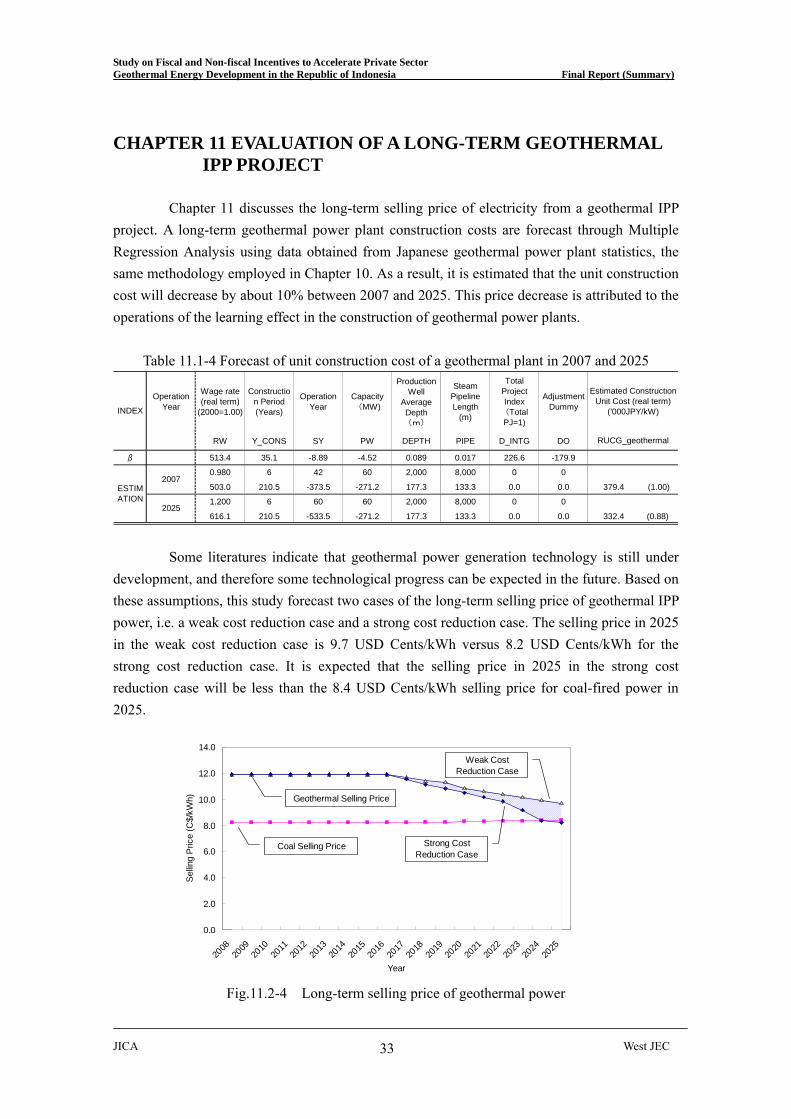
Study on Fiscal and Non-fiscal Incentives to Accelerate Private Sector Geothermal Energy Development in the Republic of Indonesia Final Report (Summary)
JICA West JEC 33
CHAPTER 11 EVALUATION OF A LONG-TERM GEOTHERMAL IPP PROJECT
Chapter 11 discusses the long-term selling price of electricity from a geothermal IPP
project. A long-term geothermal power plant construction costs are forecast through Multiple Regression Analysis using data obtained from Japanese geothermal power plant statistics, the same methodology employed in Chapter 10. As a result, it is estimated that the unit construction cost will decrease by about 10% between 2007 and 2025. This price decrease is attributed to the operations of the learning effect in the construction of geothermal power plants.
Table 11.1-4 Forecast of unit construction cost of a geothermal plant in 2007 and 2025
0.0
2.0
4.0
6.0
8.0
10.0
12.0
14.0
2008
2009
2010
2011
2012
2013
2014
2015
2016
2017
2018
2019
2020
2021
2022
2023
2024
2025
Ye
Sel
ling
Pric
e (C
$/kW
h)
ar
Coal Selling Price
Geothermal Selling Price
Strong CostReduction Case
Weak CostReduction Case
roductionWell
AverageDepth(m)
SteamPipelineLength
(m)
TotalProjectIndex(TotalPJ=1)
AdjustmentDummy
RW Y_CONS SY PW DEPTH PIPE D_INTG DO
β 513.4 35.1 -8.89 -4.52 0.089 0.017 226.6 -179.9
0.980 6 42 60 2,000 8,000 0 0
503.0 210.5 -373.5 -271.2 177.3 133.3 0.0 0.0 379.4 (1.00)
1.200 6 60 60 2,000 8,000 0 0
616.1 210.5 -533.5 -271.2 177.3 133.3 0.0 0.0 332.4 (0.88)
DEX
2007
2025
Estimated ConstructionUnit Cost (real term)
('000JPY/kW)
RUCG_geothermal
STIMION
P
OperationYear
Wage rate(real term)
(2000=1.00)
Construction Period(Years)
OperationYear
Capacity(MW)IN
EAT
Some literatures indicate that geothermal power generation technology is still under
development, and therefore some technological progress can be expected in the future. Based on these assumptions, this study forecast two cases of the long-term selling price of geothermal IPP power, i.e. a weak cost reduction case and a strong cost reduction case. The selling price in 2025 in the weak cost reduction case is 9.7 USD Cents/kWh versus 8.2 USD Cents/kWh for the strong cost reduction case. It is expected that the selling price in 2025 in the strong cost reduction case will be less than the 8.4 USD Cents/kWh selling price for coal-fired power in 2025.
Fig.11.2-4 Long-term selling price of geothermal power
Study on Fiscal and Non-fiscal Incentives to Accelerate Private Sector Geothermal Energy Development in the Republic of Indonesia Final Report (Summary)
CHAPTER 12 LONG-TERM INCENTIVES TO PROMOTE GEOTHERMAL DEVELOPMENT
Chapter 12 discusses long-term incentives to promote geothermal development
without substantial governmental cost-sharing. Three typical incentives, (i) the Clean Development Mechanism (CDM), (ii) Carbon Tax, and (iii) Localization of geothermal technology, are discussed.
12.1 Clean Development Mechanism (CDM)
The Clean Development Mechanism (CDM) is one of the schemes adopted in the Kyoto Protocol (one of three so-called Kyoto Mechanisms), and is designed to reduce greenhouse gas (GHG) emissions through cooperation between developed and developing countries. The CDM allows project-based GHG reductions in developing countries (Non-Annex 1 countries) to be transformed into Certified Emission Reductions (CERs), which, in turn, are available to industrialized countries (Annex 1 countries) for use as credits against their own Kyoto emission control commitments.
Since its establishment in July 2005, the Indonesian DNA has approved a total of 90 projects (as of February 2009). Twenty three (23) of the 90 projects have been registered by the CDM Executive Board (EB) as approved. In addition, there are 10 projects at the validation stage, consisting of one project pending approval, 5 projects to be recommended for approval and 4 projects undergoing evaluation. Included in the list of 23 projects that have been registered by the CDM EB as approved is the development of the Darajat III geothermal power plant.
8.99.7
10.411.1
11.9
8.2
0.0
2.0
4.0
6.0
8.0
10.0
12.0
14.0
WithoutCDM
10 $/ton 20 $/ton 30 $/ton 40 $/ton
CO2 Price
Sel
ling
Pric
e (c
$/kW
h)
Coal Power Plant Selling Price (Bench Mark)
Geothermal Power Plant Selling Price
Fig.12.1-4 CDM effect (2012-2016)
When a geothermal power plant
substitutes for a coal-fired power plant of the same capacity, emissions will be reduced by 0.944 kg of CO2 per each 1 kWh generated (refer to Section 7.5). Accordingly, if the geothermal plant project is approved as a CDM project, the value of the CO2 reduction achieved by the geothermal plant amounts to 0.944 USD Cents/kWh, if the price of CERs is 10 USD per 1 ton of CO2. This Study calculates the effect of CDM on the selling
JICA West JEC 34

Study on Fiscal and Non-fiscal Incentives to Accelerate Private Sector Geothermal Energy Development in the Republic of Indonesia Final Report (Summary)
price of geothermal power based on the assumptions that (i) the CERs are effective for 10 years and (ii) 5% is deducted from the total sales for SOP-Admin and SOP-Adaptation. The selling price of geothermal energy is 11.9 USD Cents/KWh when it is not a CDM project, but it falls to 11.1 USD Cents/kWh for a CDM project when the CERs are worth 10 USD/ton. If the CER price increases to 20 USD/ton, 30 USD/ton or 40 USD/ton, the selling price decreases accordingly to 10.4 USD Cents/kWh, 9.7 USD Cents/kWh and 8.9 USD Cents/kWh (Fig. 12.1-4). This shows that there is a selling price reduction effect of approximately 0.8 USD Cents/kWh per 10 USD/ton of CER price. Over the long-term, the price gap between geothermal and coal-fired power will disappear sometime in the 2020s, if the geothermal project is carried out as a CDM project. There are some challenges in utilizing the CDM scheme and the largest one is that no political consensus has been reached on the framework of CDM after 2012. If the basic framework of the Kyoto Protocol should change drastically, the value of CERs might vanish after 2012. For this reason, the future value of CERs is quite uncertain, creating serious risk for CDM project developers (Post-2012 Risk).
Consequently the CDM scheme can be summarized as follows: CDM provides an
extremely strong incentive for geothermal projects. Although utilization of CDM requires its costs, the benefits of CDM greatly surpass the costs because geothermal projects can create a large volume of CERs. However, it is not appropriate to depend on this scheme alone, since both the future of this scheme and of CER prices is not clear at this moment.
12.2 Carbon Tax
The carbon tax is one of the measures developed to address the global warming issue
and is a tax imposed on fossil fuels based on their carbon content. The tax works as an economic disincentive by raising fossil fuel prices so that carbon dioxide emissions from their combustion are reduced. At the same time, it works as a generator of funds for the government chest to address the global warming issue. The carbon tax is reported to have various functions, such as its price disincentive function, its function in generating revenue and its function in communicating the government’s seriousness in dealing with climate change. The price disincentive function operates by increasing fuel prices and discouraging their use. This function will improve energy efficiency and reduce carbon dioxide emissions. The revenue generating function increases tax revenue for the government that can be earmarked to address the global warming issue. Finally, the communication function operates to encourage citizens to recognize the importance of the global warming issue and to begin to address their role it.
In this Study, a carbon tax scheme is designed as an example: the taxation objective is to reduce CO2 emissions, the taxable fuels are coal, oil and natural gas, and the taxation point is
JICA West JEC 35

Study on Fiscal and Non-fiscal Incentives to Accelerate Private Sector Geothermal Energy Development in the Republic of Indonesia Final Report (Summary)
JICA West JEC 36
at the outlet of factories/warehouses. The carbon tax is imposed on coal, oil and natural gas.
11.9
11.011.5
10.4
8.28.8 9.3
9.9
0.0
2.0
4.0
6.0
8.0
10.0
12.0
14.0
NoCarbon
Tax
5 $/ton 10 $/ton 15 $/ton 20 $/ton 25 $/ton 30 $/ton
Carbon Tax
Sellin
g Pr
ice
(c$/
kWh)
Coal Power Plant Selling Price (Bench Mark)
Geothermal Power Plant Selling PriceWhen the above-mentioned carbon
tax is introduced, the coal price will increase and this increase leads to the increase of the selling price of coal-fired electricity. Fig. 12.2-2 shows the simulation results of the effect of various rates of carbon tax on the selling price of coal-fired electricity. When the carbon tax rate is USD 10 per 1 ton of CO2, the selling price of coal-fired plant rises to 9.3 USD Cents/kWh, which is 1.1 USD Cents/kWh higher than the no-tax case. This shows that each 10 USD of carbon tax on 1 ton of CO2 has the effect of adding 1.1 USD Cents/kWh to the selling price of coal-fired energy. From the standpoint of geothermal energy promotion, a carbon tax of 30 USD/ton-CO2 is preferable, since it largely eliminates the price gap between geothermal and coal-fired power. When this strong a carbon tax is imposed, the price gap will disappear and geothermal energy development will be activated automatically.
Fig. 12.2-2 Effect of carbon tax (2012-2016)
This Study also discusses the influence of above-mentioned carbon tax on the
Indonesian national economy once it is introduced. It is easily understood that the carbon tax will cause an increase in fuel prices and that these price increases will spread to all commodity prices through inter-industry relationships. This price hike infection is analyzed by using the Input-Output Table of 2005. As a result, it is calculated that the producer price index will rise by 5.2% and the consumer price index will rise by 1.7%.
It is forecast that the carbon tax will have a serious impact on the national economy.
This study’s conclusion concerning the carbon tax scheme can be summarized as follows: it is an extremely strong incentive for geothermal projects, but it has serious effect on the national economy and therefore should be considered carefully.
12.3 Localization of Geothermal Technology
This section discusses the localization of geothermal technology as a third method to
promote long-term geothermal development in addition to the CDM and the carbon tax scheme. The economic structure of Indonesia is reported to be steadily industrializing, in spite of the economic crisis of the late 1990s. However, the national production ratio of each industry
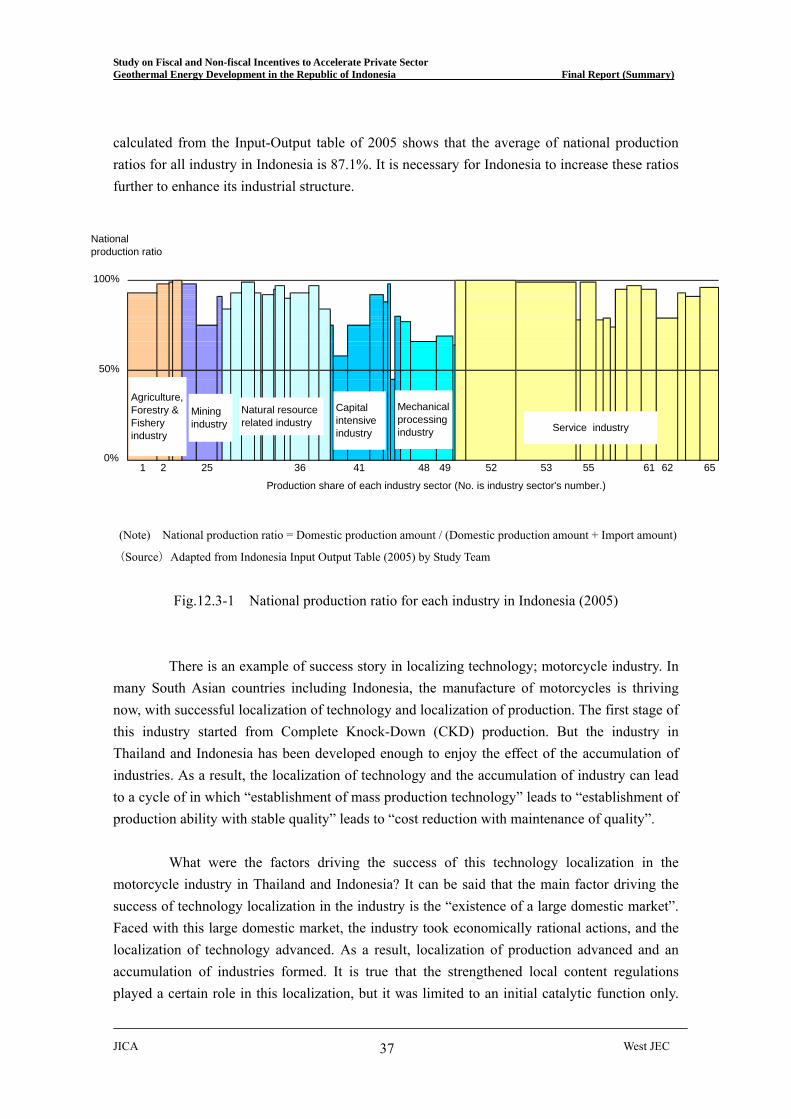
Study on Fiscal and Non-fiscal Incentives to Accelerate Private Sector Geothermal Energy Development in the Republic of Indonesia Final Report (Summary)
JICA West JEC 37
calculated from the Input-Output table of 2005 shows that the average of national production ratios for all industry in Indonesia is 87.1%. It is necessary for Indonesia to increase these ratios further to enhance its industrial structure.
1 2 25 36 41 48 49 52 53 55 61 62 65
Agriculture,Forestry &Fisheryindustry
National
production ratio
100
50
0
%
% Mechanical
processingindustry
Capitalintensiveindustry
Natural resourcerelated industry
Miningindustry Service industry
Production share of each industry sector (No. is industry sector's number.)
% (Note) National production ratio = Domestic production amount / (Domestic production amount + Import amount)
(Source)Adapted from Indonesia Input Output Table (2005) by Study Team
Fig.12.3-1 National production ratio for each industry in Indonesia (2005)
There is an example of success story in localizing technology; motorcycle industry. In many South Asian countries including Indonesia, the manufacture of motorcycles is thriving now, with successful localization of technology and localization of production. The first stage of this industry started from Complete Knock-Down (CKD) production. But the industry in Thailand and Indonesia has been developed enough to enjoy the effect of the accumulation of industries. As a result, the localization of technology and the accumulation of industry can lead to a cycle of in which “establishment of mass production technology” leads to “establishment of production ability with stable quality” leads to “cost reduction with maintenance of quality”.
What were the factors driving the success of this technology localization in the
motorcycle industry in Thailand and Indonesia? It can be said that the main factor driving the success of technology localization in the industry is the “existence of a large domestic market”. Faced with this large domestic market, the industry took economically rational actions, and the localization of technology advanced. As a result, localization of production advanced and an accumulation of industries formed. It is true that the strengthened local content regulations played a certain role in this localization, but it was limited to an initial catalytic function only.

Study on Fiscal and Non-fiscal Incentives to Accelerate Private Sector Geothermal Energy Development in the Republic of Indonesia Final Report (Summary)
The effective governmental role was that it maintained a favorable investment environment for the industry and was able to convince many people in the industry that the domestic market was large enough to tap.
The Study Team hopes that the localization of geothermal technology can proceed in a manner similar to the localization of the motorcycle industry in Indonesia. Localization of technology leads to the localization of production and the accumulation of related industries. It is true that geothermal technology is plant technology and is not a perfect analogy with motorcycle technology which is based on mass production and mass consumption. However, the Study Team believes that there is a possibility of a similar process occurring, in which confidence in the large domestic market attracts investment in the market and eventually forms a strong industry cluster. Through this process, it is hoped that cost reductions in geothermal energy production will be achieved, and that further geothermal fields will be developed. However, our hope is not confined to this. The Study Team further hopes that the geothermal industry will grow to be one of the major industries creating economic value for the country. In the future, it is hoped that the competitiveness of the industry will allow it to advance into overseas markets. As mentioned in Chapter 7, geothermal projects procure more goods and services from the local market and therefore contribute to local economic growth more than conventional fossil fuel power plant projects. Fortunately, the domestic geothermal market is believed to be sufficiently large. By tapping into this huge domestic market, the localization of technology is expected to be realized. Once the geothermal industry has accumulated in Indonesia, a reduction in the costs of geothermal energy can be expected. Once the competitiveness of geothermal has been widely recognized, the spontaneous growth of geothermal development can be expected to proceed at an explosive pace.
JICA West JEC 38
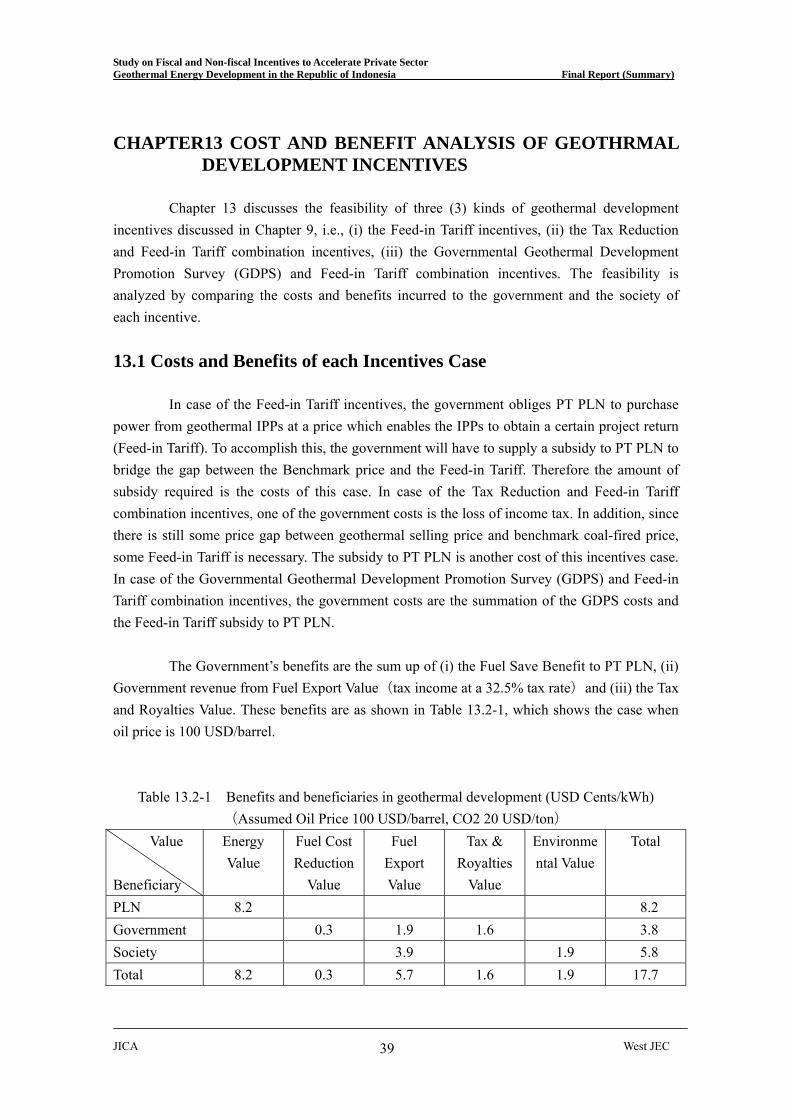
Study on Fiscal and Non-fiscal Incentives to Accelerate Private Sector Geothermal Energy Development in the Republic of Indonesia Final Report (Summary)
CHAPTER13 COST AND BENEFIT ANALYSIS OF GEOTHRMAL DEVELOPMENT INCENTIVES
Chapter 13 discusses the feasibility of three (3) kinds of geothermal development
incentives discussed in Chapter 9, i.e., (i) the Feed-in Tariff incentives, (ii) the Tax Reduction and Feed-in Tariff combination incentives, (iii) the Governmental Geothermal Development Promotion Survey (GDPS) and Feed-in Tariff combination incentives. The feasibility is analyzed by comparing the costs and benefits incurred to the government and the society of each incentive. 13.1 Costs and Benefits of each Incentives Case
In case of the Feed-in Tariff incentives, the government obliges PT PLN to purchase
power from geothermal IPPs at a price which enables the IPPs to obtain a certain project return (Feed-in Tariff). To accomplish this, the government will have to supply a subsidy to PT PLN to bridge the gap between the Benchmark price and the Feed-in Tariff. Therefore the amount of subsidy required is the costs of this case. In case of the Tax Reduction and Feed-in Tariff combination incentives, one of the government costs is the loss of income tax. In addition, since there is still some price gap between geothermal selling price and benchmark coal-fired price, some Feed-in Tariff is necessary. The subsidy to PT PLN is another cost of this incentives case. In case of the Governmental Geothermal Development Promotion Survey (GDPS) and Feed-in Tariff combination incentives, the government costs are the summation of the GDPS costs and the Feed-in Tariff subsidy to PT PLN.
The Government’s benefits are the sum up of (i) the Fuel Save Benefit to PT PLN, (ii)
Government revenue from Fuel Export Value(tax income at a 32.5% tax rate)and (iii) the Tax and Royalties Value. These benefits are as shown in Table 13.2-1, which shows the case when oil price is 100 USD/barrel.
Table 13.2-1 Benefits and beneficiaries in geothermal development (USD Cents/kWh) (Assumed Oil Price 100 USD/barrel, CO2 20 USD/ton)
Value Beneficiary
Energy Value
Fuel Cost Reduction
Value
Fuel Export Value
Tax & Royalties
Value
Environmental Value
Total
PLN 8.2 8.2 Government 0.3 1.9 1.6 3.8 Society 3.9 1.9 5.8 Total 8.2 0.3 5.7 1.6 1.9 17.7
JICA West JEC 39
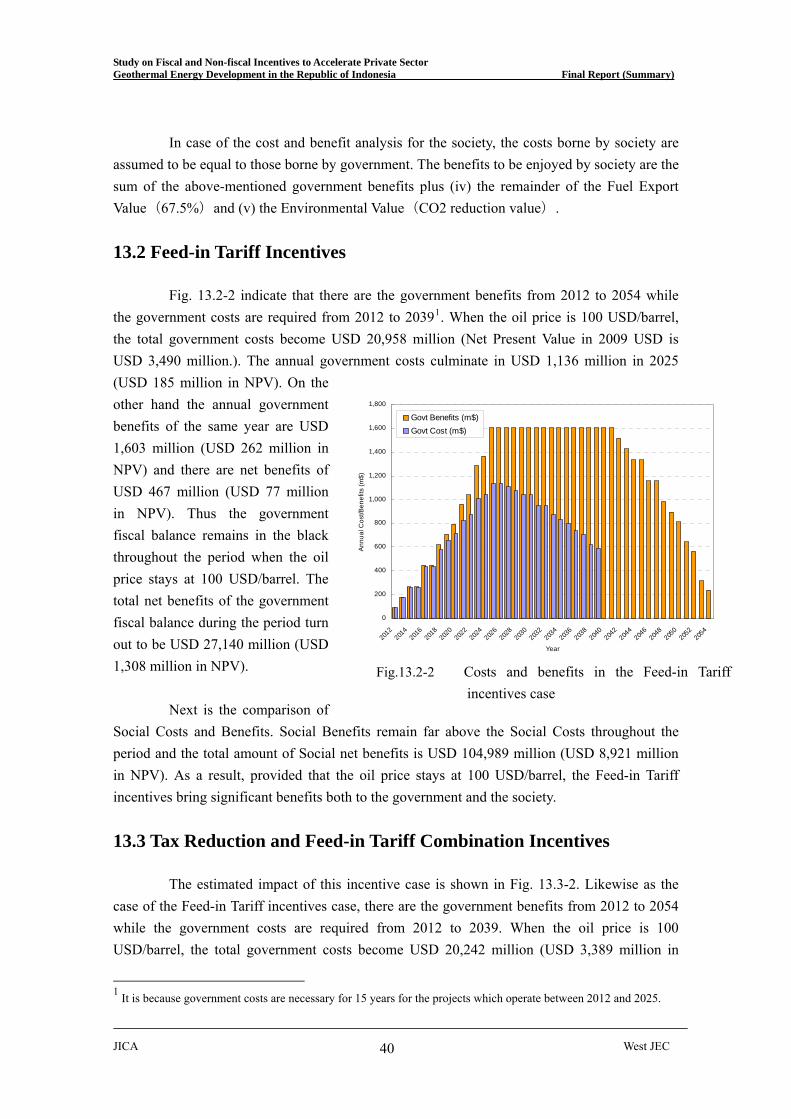
Study on Fiscal and Non-fiscal Incentives to Accelerate Private Sector Geothermal Energy Development in the Republic of Indonesia Final Report (Summary)
In case of the cost and benefit analysis for the society, the costs borne by society are assumed to be equal to those borne by government. The benefits to be enjoyed by society are the sum of the above-mentioned government benefits plus (iv) the remainder of the Fuel Export Value(67.5%)and (v) the Environmental Value(CO2 reduction value). 13.2 Feed-in Tariff Incentives
0
200
400
600
800
1,000
1,200
1,400
1,600
1,800
2012
2014
2016
2018
2020
2022
2024
2026
2028
2030
2032
2034
2036
2038
2040
2042
2044
2046
2048
2050
2052
2054
Year
Ann
ual C
ost/B
enef
its (m
$)
Govt Benefits (m$)Govt Cost (m$)
Fig. 13.2-2 indicate that there are the government benefits from 2012 to 2054 while the government costs are required from 2012 to 20391. When the oil price is 100 USD/barrel, the total government costs become USD 20,958 million (Net Present Value in 2009 USD is USD 3,490 million.). The annual government costs culminate in USD 1,136 million in 2025 (USD 185 million in NPV). On the other hand the annual government benefits of the same year are USD 1,603 million (USD 262 million in NPV) and there are net benefits of USD 467 million (USD 77 million in NPV). Thus the government fiscal balance remains in the black throughout the period when the oil price stays at 100 USD/barrel. The total net benefits of the government fiscal balance during the period turn out to be USD 27,140 million (USD 1,308 million in NPV).
Next is the comparison of
Social Costs and Benefits. Social Benefits remain far above the Social Costs throughout the period and the total amount of Social net benefits is USD 104,989 million (USD 8,921 million in NPV). As a result, provided that the oil price stays at 100 USD/barrel, the Feed-in Tariff incentives bring significant benefits both to the government and the society.
Fig.13.2-2 Costs and benefits in the Feed-in Tariff incentives case
13.3 Tax Reduction and Feed-in Tariff Combination Incentives
The estimated impact of this incentive case is shown in Fig. 13.3-2. Likewise as the
case of the Feed-in Tariff incentives case, there are the government benefits from 2012 to 2054 while the government costs are required from 2012 to 2039. When the oil price is 100 USD/barrel, the total government costs become USD 20,242 million (USD 3,389 million in
1 It is because government costs are necessary for 15 years for the projects which operate between 2012 and 2025.
JICA West JEC 40
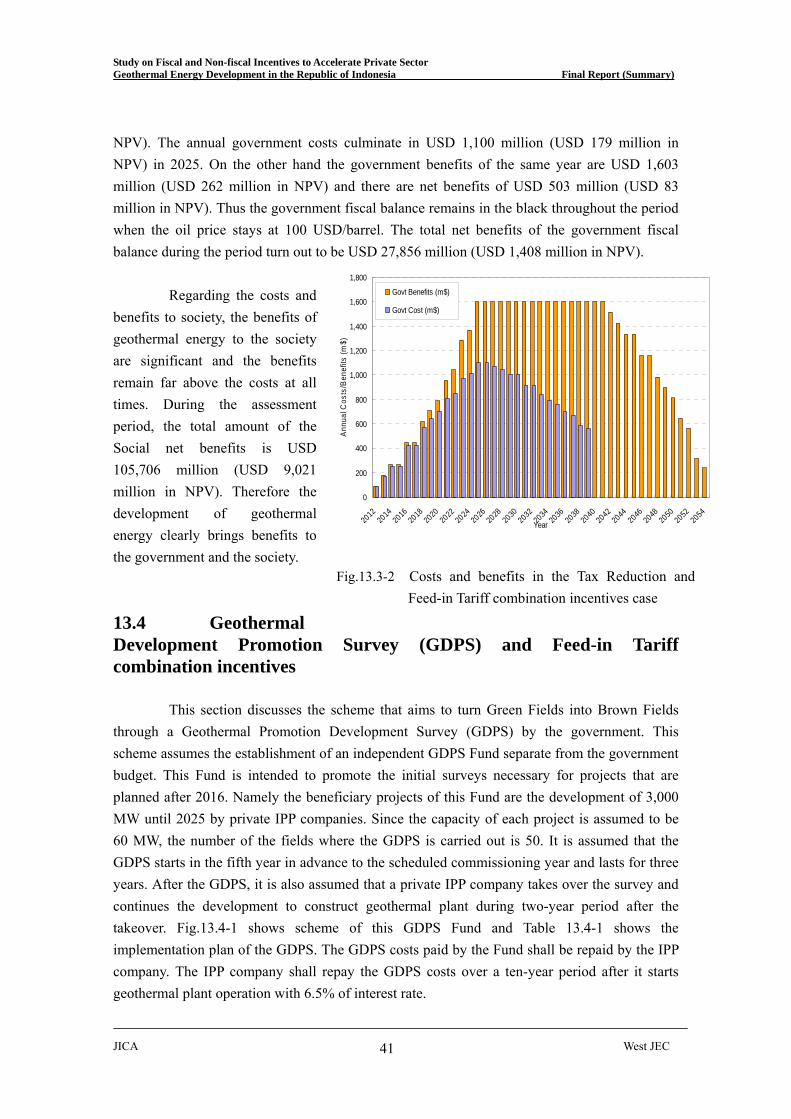
Study on Fiscal and Non-fiscal Incentives to Accelerate Private Sector Geothermal Energy Development in the Republic of Indonesia Final Report (Summary)
NPV). The annual government costs culminate in USD 1,100 million (USD 179 million in NPV) in 2025. On the other hand the government benefits of the same year are USD 1,603 million (USD 262 million in NPV) and there are net benefits of USD 503 million (USD 83 million in NPV). Thus the government fiscal balance remains in the black throughout the period when the oil price stays at 100 USD/barrel. The total net benefits of the government fiscal balance during the period turn out to be USD 27,856 million (USD 1,408 million in NPV).
0
200
400
600
800
1,000
1,200
1,400
1,600
1,800
2012
2014
2016
2018
2020
2022
2024
2026
2028
2030
2032
2034
2036
2038
2040
2042
2044
2046
2048
2050
2052
2054
Year
Ann
ual C
osts
/Ben
efits
(m$)
Govt Benefits (m$)
Govt Cost (m$)Regarding the costs and
benefits to society, the benefits of geothermal energy to the society are significant and the benefits remain far above the costs at all times. During the assessment period, the total amount of the Social net benefits is USD 105,706 million (USD 9,021 million in NPV). Therefore the development of geothermal energy clearly brings benefits to the government and the society. 13.4 Geothermal Development Promotion Survey (GDPS) and Feed-in Tariff combination incentives
Fig.13.3-2 Costs and benefits in the Tax Reduction and Feed-in Tariff combination incentives case
This section discusses the scheme that aims to turn Green Fields into Brown Fields
through a Geothermal Promotion Development Survey (GDPS) by the government. This scheme assumes the establishment of an independent GDPS Fund separate from the government budget. This Fund is intended to promote the initial surveys necessary for projects that are planned after 2016. Namely the beneficiary projects of this Fund are the development of 3,000 MW until 2025 by private IPP companies. Since the capacity of each project is assumed to be 60 MW, the number of the fields where the GDPS is carried out is 50. It is assumed that the GDPS starts in the fifth year in advance to the scheduled commissioning year and lasts for three years. After the GDPS, it is also assumed that a private IPP company takes over the survey and continues the development to construct geothermal plant during two-year period after the takeover. Fig.13.4-1 shows scheme of this GDPS Fund and Table 13.4-1 shows the implementation plan of the GDPS. The GDPS costs paid by the Fund shall be repaid by the IPP company. The IPP company shall repay the GDPS costs over a ten-year period after it starts geothermal plant operation with 6.5% of interest rate.
JICA West JEC 41

Study on Fiscal and Non-fiscal Incentives to Accelerate Private Sector Geothermal Energy Development in the Republic of Indonesia Final Report (Summary)
Table 13.4-1 Implementation plan of GDPS
Study period No. offields
20102011 2011-2013 102012 2012-2014 02013 2013-2015 52014 2014-2016 52015 2015-2017 02016 2016-2018 5 6002017 2017-2019 5 02018 2018-2020 10 3002019 2019-2021 0 3002020 2020-2022 10 02021 3002022 3002023 6002024 02025 600Total 50 3,000
Year Additional
MW byNew IPP
GDPSExpenditure
Income
Year -5 -4 -3 -2 -1 1 2 3 ・・・・・・・・ 10
Sales of Survey results
Construction Operation
GDPS FundCosts of GDPS
Repayment of Costs of GDPS
・・・・・・・・・
Private Repayment after Operation(10 year-repayment with 6.5%
interest)
Fund
Survey by Gov't
-300
-200
-100
0
100
200
300
2011
2012
2013
2014
2015
2016
2017
2018
2019
2020
2021
2022
2023
2024
2025
2026
2027
2028
2029
2030
2031
2032
2033
2034
2035
2036
2037
Year
Annual
Exp
endi
ture
/In
com
e (
m$)
-1,300
-800
-300
200
700
1,200
Fund
Year
-end
Bal
ance (
m$)
GDPS Fund Total Expenditure (m$)
GDPS Fund Total Income(m$)Fund Year-end Balance (m$)
Fig.13.4-1 Scheme of the GDPS Fund
Under such conditions, the annual cash flow of the Fund is calculated. Fig. 13.4-3
shows annual expenditure and income from and to the Fund and the year-end balance of the Fund. This figure indicates that the Fund should bear the GDPS costs from 2011 to 2022. On the other hand, the Fund can obtain the income of interest payment from 2014 and can obtain the repayment of the GDPS costs from 2016. The repayment culminates in 2025 and lasts until 2034. The FIRR of this cash flow of the Fund in the period is calculated to be 4.9%. Although the FIRR is small, it would be possible to establish the Fund if the Official Development Assistance fund (ODA fund) is used. Fig. 13.4-3 Expenditure, income and year-end balance of the GDPS Fund
Fig. 13.4-4 shows the results of the calculation of benefits and costs to government
and to society in this incentive case. In this incentives case, the GDPS Fund supports private geothermal development projects as an independent body from the governmental budget. Since
JICA West JEC 42
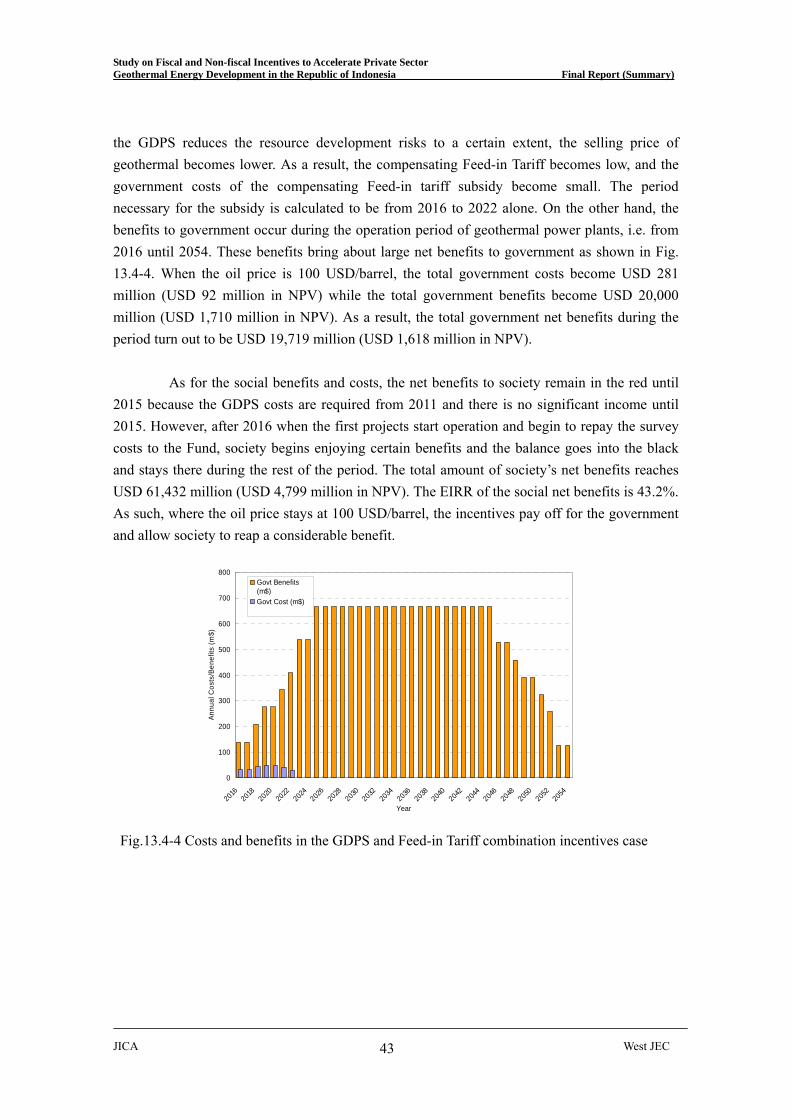
Study on Fiscal and Non-fiscal Incentives to Accelerate Private Sector Geothermal Energy Development in the Republic of Indonesia Final Report (Summary)
JICA West JEC 43
the GDPS reduces the resource development risks to a certain extent, the selling price of geothermal becomes lower. As a result, the compensating Feed-in Tariff becomes low, and the government costs of the compensating Feed-in tariff subsidy become small. The period necessary for the subsidy is calculated to be from 2016 to 2022 alone. On the other hand, the benefits to government occur during the operation period of geothermal power plants, i.e. from 2016 until 2054. These benefits bring about large net benefits to government as shown in Fig. 13.4-4. When the oil price is 100 USD/barrel, the total government costs become USD 281 million (USD 92 million in NPV) while the total government benefits become USD 20,000 million (USD 1,710 million in NPV). As a result, the total government net benefits during the period turn out to be USD 19,719 million (USD 1,618 million in NPV).
As for the social benefits and costs, the net benefits to society remain in the red until
2015 because the GDPS costs are required from 2011 and there is no significant income until 2015. However, after 2016 when the first projects start operation and begin to repay the survey costs to the Fund, society begins enjoying certain benefits and the balance goes into the black and stays there during the rest of the period. The total amount of society’s net benefits reaches USD 61,432 million (USD 4,799 million in NPV). The EIRR of the social net benefits is 43.2%. As such, where the oil price stays at 100 USD/barrel, the incentives pay off for the government and allow society to reap a considerable benefit.
0
100
200
300
400
500
600
700
800
2016
2018
2020
2022
2024
2026
2028
2030
2032
2034
2036
2038
2040
2042
2044
2046
2048
2050
2052
2054
Year
Annu
al C
osts
/Ben
efits
(m$)
Govt Benefits (m$)Govt Cost (m$)
Fig.13.4-4 Costs and benefits in the GDPS and Feed-in Tariff combination incentives case
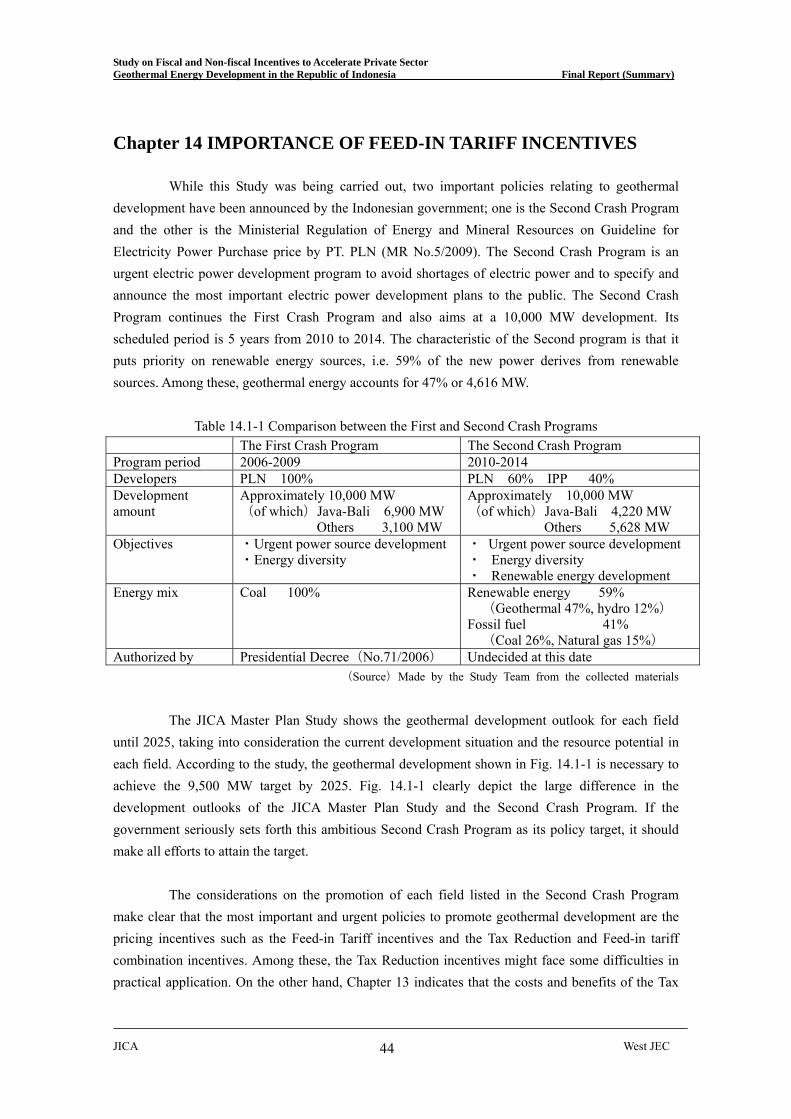
Study on Fiscal and Non-fiscal Incentives to Accelerate Private Sector Geothermal Energy Development in the Republic of Indonesia Final Report (Summary)
Chapter 14 IMPORTANCE OF FEED-IN TARIFF INCENTIVES
While this Study was being carried out, two important policies relating to geothermal development have been announced by the Indonesian government; one is the Second Crash Program and the other is the Ministerial Regulation of Energy and Mineral Resources on Guideline for Electricity Power Purchase price by PT. PLN (MR No.5/2009). The Second Crash Program is an urgent electric power development program to avoid shortages of electric power and to specify and announce the most important electric power development plans to the public. The Second Crash Program continues the First Crash Program and also aims at a 10,000 MW development. Its scheduled period is 5 years from 2010 to 2014. The characteristic of the Second program is that it puts priority on renewable energy sources, i.e. 59% of the new power derives from renewable sources. Among these, geothermal energy accounts for 47% or 4,616 MW.
Table 14.1-1 Comparison between the First and Second Crash Programs The First Crash Program The Second Crash Program Program period 2006-2009 2010-2014 Developers PLN 100% PLN 60% IPP 40% Development amount
Approximately 10,000 MW (of which)Java-Bali 6,900 MW Others 3,100 MW
Approximately 10,000 MW (of which)Java-Bali 4,220 MW Others 5,628 MW
Objectives ・Urgent power source development ・Energy diversity
・ Urgent power source development ・ Energy diversity ・ Renewable energy development
Energy mix Coal 100% Renewable energy 59% (Geothermal 47%, hydro 12%)
Fossil fuel 41% (Coal 26%, Natural gas 15%)
Authorized by Presidential Decree(No.71/2006) Undecided at this date (Source)Made by the Study Team from the collected materials
The JICA Master Plan Study shows the geothermal development outlook for each field
until 2025, taking into consideration the current development situation and the resource potential in each field. According to the study, the geothermal development shown in Fig. 14.1-1 is necessary to achieve the 9,500 MW target by 2025. Fig. 14.1-1 clearly depict the large difference in the development outlooks of the JICA Master Plan Study and the Second Crash Program. If the government seriously sets forth this ambitious Second Crash Program as its policy target, it should make all efforts to attain the target.
The considerations on the promotion of each field listed in the Second Crash Program make clear that the most important and urgent policies to promote geothermal development are the pricing incentives such as the Feed-in Tariff incentives and the Tax Reduction and Feed-in tariff combination incentives. Among these, the Tax Reduction incentives might face some difficulties in practical application. On the other hand, Chapter 13 indicates that the costs and benefits of the Tax
JICA West JEC 44

Study on Fiscal and Non-fiscal Incentives to Accelerate Private Sector Geothermal Energy Development in the Republic of Indonesia Final Report (Summary)
Reduction and Feed–in Tariff combination incentives and those of the Feed-in Tariff incentives are not so different. Therefore, the Feed-in Tariff incentives can be said to be the easiest, the most important and the most urgent incentives to adopt under the current situation.
0
1,000
2,000
3,000
4,000
5,000
6,000
7,000
8,000
9,000
10,000
2010 2011 2012 2013 2014 2015 2016 2017 2018 2019 2020 2021 2022 2023 2024 2025
Year
Cap
acity
(MW
)
OthersIPP undecidedIPP in TenderIPP in Pertamina Work AreaPLNPertaminaExistingCrash program
2,400MW
1,200MW
9,500MW
500MW700MW
1,200MW
1,900MW
1,200MW
2,450MW
2,450MW
220MW
70MW
2nd Crash program(new 4,600MW)
(Source)Made by the Study Team referring to the JICA Master Plan Study
Fig. 14.1-1 Geothermal development outlook in the JICA Master Plan Study
The second important policy which has been implemented during this Study is the Ministerial Regulation of Energy and Mineral Resources on Guideline for Electricity Power Purchase price by PT. PLN (MR No.5/2009). This Ministerial Regulation replaces the old Ministerial Regulation on Benchmark Prices for Electric Power Sales from Geothermal Power Plants (MR No. 14/2008). The old regulation empowered the Ministry of Energy and Mineral Resources to set the purchase price of geothermal energy. The purchase price for PT PLN was stipulated as 80%-85% of the PT PLN’s average generation costs in each electric system. On the other hand, the new regulation empowers PT PLN to decide the purchase price project by project, although the price is subject to final approval by MEMR. As mentioned before, the most important policies in the current situation are the price incentives. From this point of view, the new Ministerial Regulation is imperfect. If the government intends to empower PT PLN to decide the purchase price by itself, the government should at the same time obligate PT PLN to purchase a certain amount of geothermal power. Otherwise, the government should revoke the new Ministerial Regulation (MR No. 5/2009) and should designate appropriate purchase prices. Again here, the Study Team would like to emphasize the importance and the urgency of the Feed-in Tariff incentives in promoting geothermal energy development in Indonesia.
JICA West JEC 45

Study on Fiscal and Non-fiscal Incentives to Accelerate Private Sector Geothermal Energy Development in the Republic of Indonesia Final Report (Summary)
Chapter 15 AIMING FOR ECONOMIC GROWTH THROUGH GEOTHERMAL DEVELOPMENT ~ A WAY TO FOSTER THE GEOTHERMAL INDUSTRY IN INDONESIA ~
Indonesia, with 150 volcanoes and more than 27,000 MW of geothermal resource
potential, is the world’s richest country in geothermal resources. There is a large development potential, although currently only about 1,100 MW has been developed. This is a good time for Indonesia to adopt a Green New Deal strategy focused on the development of geothermal energy, when many countries are beginning to identify the type of renewable energy development in which they can achieve a comparative advantage. When the geothermal industry is well developed and serves a large domestic market, the localization of technology will start, triggering the next round of cost reductions and leading to the further expansion of the domestic market. Investment in geothermal projects has a far larger effect in stimulating the national economy and creating more new employment than coal-fired projects. Therefore, the encouragement of investment in geothermal energy raises the likelihood of economic growth and employment expansion. For instance, approximately 400,000 new jobs and around IDR 66.5 trillion in increased production will be created by the geothermal development of 2,400 MW by 2016, according to the Input Output Analysis. This job creation is 2.5 times greater than the 160,000 jobs that would be created if the same capacity was developed with coal-fired plants (BAU case), and the production increase is 3.4 times greater than the IDR 19.4 trillion increase in the BAU case. This can be called the Green New Deal policy of Indonesia (Fig.15.1-4).
Government
Private Sector
Geothermal Industry
National Economic Growth
Geothermal Development Target9,500 MW by 2025
Geothermal Incentive Policy
Market Expansion
Domestic ProcurementIncrease
Localization ofTechnology
Cost ReductionGeothermal SupportIndustry Growth
National Economic Growth
EmploymentCreation
Fig. 15.1-4 Green New Deal Policy of Indonesia
JICA West JEC 46
Study on Fiscal and Non-fiscal Incentives to Accelerate Private Sector Geothermal Energy Development in the Republic of Indonesia Final Report (Summary)
What kinds of policy should the government implement to develop the geothermal industry of Indonesia? It is important to have appropriate industrial development policies and technology promotion policies. In the case of industrial policy, it must be emphasized that the key to success will not be industry protection, but the encouragement of dynamic industrial development that involves competent players with the necessary knowledge and international competence. Thoughtless local content regulations are useless for effectively promoting fledgling industries. To fully realize the technological potential of local industry, most effort should be focused on making domestic industry more competitive with foreign industry.
In formulating policy to promote technology, it is important to strengthen the
infrastructure available for future technological development. It is also important to maintain the capacity-building programs of universities and other institutions of higher education. It is necessary to train an adequate number of engineers to promote geothermal development in line with the Geothermal Development Road Map. The program to train a sufficient number of engineers to respond to the quantitative and qualitative needs of the geothermal industry should be strengthened.
However, there is one policy that is more important than these policies and that is “to
convince everyone of the existence of an extremely large geothermal market in Indonesia”. Specifically, the government should put into practice the policies proposed in Chapter 9, thus convincing the public of its serious determination to develop Indonesia’s geothermal potential. By implementing these policies in a stable manner over a long period of time, the government can establish popular confidence in a large domestic geothermal market. Once people have this confidence, some will invest in geothermal IPP projects, and others will invest in local factories to produce equipment or materials for geothermal activities. Through these investments, steady steps will be taken in the creation of a geothermal industry cluster in Indonesia. The first policy should be to "implement the incentives to accelerate geothermal energy development" proposed in Chapter 9, and to “continue the incentives for a certain period” to convince everyone inside and outside of Indonesia of the golden future that lies ahead for Indonesia geothermal development.
JICA West JEC 47
![Dampak Kebijakan Biaya Pokok Penyediaan Pembangkitan Listrik … · 2020. 3. 10. · teknis, seperti Rencana Usaha Penyediaan Tenaga Listrik (RUPTL) oleh PLN [PLN, 2019], rencana](https://img.dokumen.tips/doc/110x75/6101728ebc4cd22a49242291/dampak-kebijakan-biaya-pokok-penyediaan-pembangkitan-listrik-2020-3-10-teknis.jpg)

![平成 年度円借款事業事後評価報告書open_jicareport.jica.go.jp/pdf/11994811.pdf · RUPTL ' PLN G H , 2009-2018 Ì 5 g8 ]^R e e Ò O?@ 5 8 eÏ!NÑ! ÉÊ 5](https://img.dokumen.tips/doc/110x75/5b8435df7f8b9a317e8b7ba6/-open-ruptl-pln-g-h-2009-2018.jpg)