Embed Size (px)
Citation preview

Lehrstuhl für Ernährungsphysiologie
Studies on dietary and hormonal regulation of selected nutrient
transporters in mouse small intestine
Mena Katharina Eidens
Vollständiger Abdruck der von der Fakultät Wissenschaftszentrum Weihenstephan
für Ernährung, Landnutzung und Umwelt der Technischen Universität München zur Erlangung des akademischen Grades eines
Doktors der Naturwissenschaften
genehmigten Dissertation.
Vorsitzender: Univ.-Prof. Dr. M. Schemann Prüfer der Dissertation: 1. Univ.-Prof. Dr. H. Daniel
2. Univ.-Prof. Dr. M. Klingenspor
Die Dissertation wurde am 03. 04. 2014 bei der Technischen Universität München
eingereicht und durch die Fakultät Wissenschaftszentrum Weihenstephan für Ernährung, Landnutzung und Umwelt am 23. 09. 2014 angenommen.


“Nur wenige wissen, wie viel man wissen muss, um zu wissen, wie wenig man weiß.”
Werner Karl Heisenberg (1901-1976)


Contents
Abstract .................................................................................................... I
Zusammenfassung ................................................................................ III
1. Introduction ....................................................................................... 1
1.1 Organization and major functions of mammalian small intestine ............ 1
1.2 The Sodium-dependent Neutral Amino Acid Transporter B0AT1 or the
B0 Neutral Amino Acid Transporter AT1 .................................................. 5
1.3 The System IMINO or the Sodium/IMINO Acid Transporter 1 (SIT1) ...... 6
1.4 The Proton-coupled Amino Acid Transporter 1 (PAT1) ........................... 6
1.5 The Sodium-coupled Glucose Cotransporter 1 (SGLT1) ........................ 7
1.6 The facilitative Glucose Transporter Type 2 (GLUT2) ........................... 11
1.7 The Proton-coupled Peptide Transporter 1 (PEPT1) ............................. 14
1.7.1 The SLC15A1 gene and the PEPT1 protein ............................................. 14
1.7.2 PEPT1 transport mode and substrate affinity .......................................... 16
1.7.3 Expression pattern of PEPT1 ................................................................... 18
1.7.4 Regulation of PEPT1 ................................................................................ 18
2. Material and Methods .................................................................... 24
2.1 Animals .................................................................................................. 24
2.2 Functional characterization of epithelial transporters ........................... 25
2.2.1 Techniques used ...................................................................................... 25
2.2.2 Preliminary studies to determine parameters of transporter activity ....... 25
2.3 Experimental procedures intended to modify transporter activities ..... 26

Contents
2.3.1 Effect of high-fat feeding on intestinal transporter activity ...................... 26
2.3.2 Effect of insulin on intestinal transporter function .................................... 26
2.3.3 Luminal exposure of the small intestine to high glucose ......................... 27
2.3.4 Effect of diabetes on intestinal transporter function ................................ 28
2.4 Electrophysiological experiments using the Ussing chamber ............... 29
2.4.1 Electrophysiological principals ................................................................. 29
2.4.2 Electrodes ................................................................................................ 30
2.4.3. Tissue preparation .................................................................................... 31
2.4.4 Measurements .......................................................................................... 32
2.5 Uptake experiments using radiolabeled substrates .............................. 33
2.5.1 Tissue preparation .................................................................................... 33
2.5.2 Principles of uptake experiments ............................................................. 34
2.5.3 Quantification ........................................................................................... 34
2.6 Intestinal RNA purification and cDNA synthesis ................................... 35
2.6.1 Quantitative real-time PCR ...................................................................... 35
2.7 Intestinal tissue preparation .................................................................. 36
2.8 H & E staining ........................................................................................ 36
2.9 Tissue changes (Villus length and diameter) ......................................... 37
2.10 Brush border membrane preparation .................................................. 38
2.10.1 Western blot ............................................................................................. 38
2.11 Urine osmolarity ................................................................................... 39
2.12 Statistical analysis ............................................................................... 39

Contents
3. Results ............................................................................................. 40
3.1 Transporter activities in jejunum – comparing wild type, pept1-/+ and
pept1-/- mice .......................................................................................... 40
3.1.1 Uptake studies and Ussing chamber measurements .............................. 40
3.1.2 Kinetic parameters in wt, pept1-/- and sglt1-/- mice .................................. 42
3.1.3 Segmental differences in transport of PEPT1 and SGLT1 ....................... 44
3.2 Influence of diet-induced obesity on transporter function .................... 45
3.2.1 Comparative Ussing chamber studies ..................................................... 45
3.3 Influence of insulin on transporter functions ......................................... 47
3.3.1 In vitro effects of insulin ........................................................................... 47
3.4. Effects of in vivo insulin treatment on transporter activities ................ 48
3.4.1 Body weight and blood glucose ............................................................. 48
3.4.2. mRNA and protein concentrations of PEPT1 and SGLT1 ...................... 49
3.4.3 Uptake experiments ................................................................................. 51
3.4.4 Ussing chamber measurements .............................................................. 52
3.5 Effect of high luminal glucose on intestinal transporter function .......... 53
3.5.1 Ussing chamber measurements before and after high glucose perfusion ................................................................................................................ 53
3.5.2 Effect of glucose on an oral glucose bolus .............................................. 56
3.6 Effect of glucose on intestinal transporters in STZ-induced type 1
diabetes ................................................................................................. 57
3.6.1 STZ-induced effects on body weight and blood glucose ........................ 57
3.6.2 Body weight ............................................................................................. 58

Contents
3.6.3 Blood glucose .......................................................................................... 58
3.6.4 Changes in tissue and organ weights in response to STZ-induced diabetes .................................................................................................... 60
3.6.5 Effects of STZ on pancreatic tissues ....................................................... 62
3.6.6 mRNA and protein concentrations of PEPT1 and SGLT1 ....................... 62
3.6.7 Uptake experiments in everted gut rings of control and diabetic mice ... 64
3.6.8 Ussing chamber based Isc measurements in control and diabetic mice 65
4. Discussion ...................................................................................... 67
References ............................................................................................ 76
Appendix ................................................................................................ IV
Abbreviations ................................................................................................ IV
Units of measurements ............................................................................... VIII
Diets .............................................................................................................. IX
Standard chow SPF Tierhaltung .......................................................................... IX
Standard chow open mouse facility ................................................................... XII
Control diet (11% energy from fat) open mouse facility .................................... XV
High-fat diet (60% energy from fat) open mouse facility ................................. XVIII
Danksagung ........................................................................................ XXI
Eidesstattliche Erklärung ................................................................. XXIII
Curriculum Vitae ............................................................................... XXIV
List of Publications ............................................................................ XXV

List of Tables
Tables:
Table 1 Reported SGLT1 substrate affinities (Km) and maximal transport rates
(Vmax) ........................................................................................................... 9
Table 2 SLC2-family members and their expression sites ............................... 13
Table 3 PEPT1 substrate affinities (Km) and maximal transport rates (Vmax) ... 17
Table 4 Composition of modified Krebs-Henseleit-Buffer in mM for Ussing
chamber experiments ............................................................................. 31
Table 5 Transporters and substrates used in Ussing chamber studies ......... 32
Table 6 Modified KHB used for uptake experiments in everted gut rings ...... 33
Table 7 Transporter and housekeeping genes with corresponding primer
sequences ............................................................................................... 35
Table 8 Hemalum and eosin staining protocol for jejunal segments .............. 37
Table 9 Substrate-induced short-circuit currents ............................................. 42
Table 10 Isc responses before and after in vitro insulin treatment of tissues in
Ussing chambers .................................................................................... 48
Table 11 Body weight and blood glucose levels before and after i.p. injection
of insulin ................................................................................................... 49
Table 12 Transporter-mediated Isc in insulin-treated and control mice .......... 52

List of Tables
Table 13 Open-circuit current (Ioc calculated as Isc) and measured short-
circuit current (Isc) of PEPT1 and SGLT1 before and after high
luminal glucose perfusion ...................................................................... 55
Table 14 Tissue and organ weights of control and diabetic mice ..................... 60
Table 15 Substrate-induced Isc currents measured in control and diabetic
mice .......................................................................................................... 66

List of Figures
I
Figures:
Figure 1 Structure and details of the gut ............................................................... 2
Figure 2 Transporter systems expressed in the enterocytes of the mammalian
small intestine ........................................................................................... 4
Figure 3 Predicted membrane topology of the secondary structure of human
SGLT1 protein ........................................................................................... 8
Figure 4 Predicted PEPT1 membrane topology .................................................. 15
Figure 5 Interplay of PEPT1 (SLC15A1) with other solute transporters in apical
and basolateral membranes of enterocytes ........................................ 16
Figure 6 Schematic overview of a proposed inverse regulation of transporter
proteins in the apical membrane in response to a high luminal
glucose exposure .................................................................................... 22
Figure 7 Chemical structure of Streptozotocin .................................................. 28
Figure 8 Schematic illustration of an Ussing chamber ...................................... 30
Figure 9 Razor blade panel with everted small intestine and 1 cm rings ......... 34
Figure 10 [14C] Gly-Sar uptake into everted gut rings in wt and pept1-/- mice ... 40
Figure 11 Representative current trace of substrate-induced Isc measured in
jejunal segments of a wt and pept1-/- mouse ....................................... 41
Figure 12 Kinetic parameters of PEPT1 in wt and sglt1-/- mice determined in
Ussing chamber studies ......................................................................... 43

List of Figures
II
Figure 13 Kinetic parameters of SGLT1 in wt and pept1-/- mice determined in
the Ussing chamber studies .................................................................. 43
Figure 14 Segmental [14C] Gly-Sar and [14C] α-MDG uptake in wt mice ............. 44
Figure 15 Representative current trace of electrogenic transporter activities
measured in an Ussing chamber with one segment of wt mice fed a
C- or HF-diet ............................................................................................ 45
Figure 16 Transporter activities in wt mice fed a C-diet or HF-diet ................... 46
Figure 17 Representative current traces of electrogenic transporters recorded
in Ussing chambers before and after exposure of tissues to insulin 47
Figure 18 Insulin effects on blood glucose concentration .................................. 49
Figure 19 mRNA levels of PEPT1 and SGLT1 in tissues of control and insulin-
treated mice ............................................................................................ 50
Figure 20 PEPT1 and SGLT1 protein tissue levels ................................................ 50
Figure 21 Transporter activities assessed in gut rings of control and insulin-
treated mice ............................................................................................ 51
Figure 22 Representative current traces of Ussing chamber measurement. .... 52
Figure 23 Representative current traces in Ussing chambers before and after
luminal perfusion .................................................................................... 53
Figure 24 Isc responses of PEPT1, SIT1 and SGLT1 before and after 75 mM
glucose perfusion ................................................................................... 54
Figure 25 Blood glucose levels after oral glucose bolus ..................................... 56

List of Figures
III
Figure 26 Substrate uptake rates after the oral glucose bolus ........................... 57
Figure 27 Body weight development over 5 days after STZ treatment .............. 58
Figure 28 Blood glucose development over 5 days after STZ treatment ........... 59
Figure 29 Post-injectional blood glucose measurements in STZ-treated mice
................................................................................................................. 59
Figure 30 Determination of mean intestinal villus length in control and diabetic
mice .......................................................................................................... 61
Figure 31 Morphology of Langerhans-islet cells of pancreatic tissue of control
and diabetic mice .................................................................................... 62
Figure 32 Relative mRNA levels of PEPT1 and SGLT1 in intestine of control and
diabetic mice ........................................................................................... 63
Figure 33 PEPT1 and SGLT1 protein levels in intestinal tissues ......................... 63
Figure 34 Transporter activities of PEPT1 and SGLT1 in control and diabetic
mice .......................................................................................................... 64
Figure 35 Tissue resistance measured in control and T1-diabetic mice ............ 65
Figure 36 Representative current traces of Ussing chamber measurements in
control and diabetic mice ...................................................................... 66
Abstract
I
Abstract
Transport proteins in the apical membrane of enterocytes mediate the selective uptake of
ingested nutritional components into epithelial cells. Di- and tripeptides as products of
gastrointestinal protein hydrolysis are transported by the proton-coupled peptide
transporter 1 (PEPT1) whereas glucose absorption is mainly mediated by the sodium-
dependent glucose transporter 1 (SGLT1). The proton-coupled amino acid transporter 1
(PAT1), the sodium / imino transporter 1 (SIT1) and the sodium-dependent neutral amino
acid transporter (B0AT1) are responsible for the absorption of neutral amino acids (AA)
derived from protein digestion. Amongst these transporters especially PEPT1 and SGLT1
have been described as to undergo regulation by nutritional, hormonal and pathological
factors with changes in expression level and in function. We here describe mouse studies
that aimed to investigate the impact of such factors on the function of selected electrogenic
transporters with the following questions: i) is the ablation of pept1 compensated by an
elevated uptake of AA via PAT1 and SIT1, ii) does insulin (in vitro & in vivo) regulate the
expression and activity of the intestinal transporters in wild type mice and iii) does a
Streptozotocin-induced diabetic state affect transporter expression and activity? To answer
these questions, transporter gene expression and protein levels were quantified, whereas
transporter activities were determined by electrophysiological experiments using the Ussing
chamber and by everted gut rings with uptake experiments employing radiolabeled
substrates.
Results showed (i) that none of the transporters (SIT1, PAT1 and SGLT1) that can be
assessed by electrophysiological means displayed changes that may be taken as a
compensatory adaptation to the lack of PEPT1 although heterozygous (pept1-/+) mice
revealed a decrease in AA transporter activities when compared to pept1-/- mice. These
findings support previous studies that a PEPT1-deficiency seems – at least under normal
dietary conditions – to generate no obvious phenotype. None of the experiments could
confirm an effect of insulin on jejunal tissues with changes in transporter activity which
suggest that insulin does not play a role in the regulation of transporter expression and
function as proposed by studies in cultured cells. Induction of a diabetic state by
Streptozotocin in mice caused PEPT1 mRNA and protein expression level to increase
whereas transporter activity seemed reduced. SGLT1 mRNA levels were also elevated,
while protein levels remained unchanged and electrogenic transporter activity was
decreased.

Abstract
II
In summary, the role of PEPT1 in overall intestinal AA absorption in mice seems less
important than expected. There is also no evidence that the lack of a phenotype in animals
with a deleted peptide transporter gene results in compensatory changes in electrogenic
transporters that mediate the apical uptake of free amino acids or sugar. Although diabetes
seems to have an impact on the investigated transporters, their functional impairments do
not follow the changes in mRNA and/or protein expression suggesting that the driving
forces for electrogenic transport – provided by the basolateral Na+ / K+ ATPase activity –
may be subject to regulation in a diabetic state.

Zusammenfassung
III
Zusammenfassung
Der Transport von Nährstoffen über die Epithelzellen des Darms wird von spezifischen,
integralen Membranproteinen vermittelt. Di- und Tripeptide, welche die Hauptprodukte der
gastrointestinalen Protein-Verdauung darstellen, werden vom protonenabhängigen
Peptidtransporter 1 (PEPT1) in die Enterozyten aufgenommen. D-Glucose wird
hauptsächlich über den natriumabhängigen Glukosetransporter 1 (SGLT1) resorbiert. Für die
Aufnahme neutraler Aminosäuren (AS) dienen unter anderem der protonengekoppelte
Aminosäuretransporter 1 (PAT1), der natriumabhängige IMINO-Transporter 1 (SIT1) sowie
der natriumabhängige neutrale Aminosäuretransporter 1 (B0AT1). Sie alle sind elektrogene
Transportsysteme, deren Aktivität sich mittels elektrophysiologischer Techniken ermitteln
lässt.
Studien an PEPT1 und SGLT1 deuteten darauf hin, dass diese Systeme durch diätetische
und hormonelle Maßnahmen reguliert werden können. Die hier vorgelegten experimentellen
Studien an Mäusen hatten das Ziel, im Tier und in vitro den Einfluss solcher Faktoren auf der
Ebene der Expression und der Funktion ausgewählter Transporter zu untersuchen.
Insbesondere wurde geprüft, inwieweit eine Deletion von PEPT1 zu einer gesteigerten
Aufnahme von freien Aminosäuren mittels PAT1 und SIT1 führte und ob Insulin bzw. ein
Insulinmangel die Expression und Aktivität der untersuchten Carrier änderte.
Auf molekularer Ebene wurden die Transporter anhand von Genexpressions- und
Proteinanalysen untersucht; ihre Transportaktivität wurde mittels elektrophysiologischer
Analysen in der Ussing-Kammer sowie durch Aufnahmestudien in everted gut rings unter
Verwendung radioaktiver Substrate untersucht. Dabei zeigte sich, dass der Verlust von
PEPT1 - der zu keinem auffälligen Phänotyp der Mäuse führt – auch keine markanten
Änderungen in der Aufnahme von freien Aminosäuren herbeiführte. Allerdings waren die
Transporteraktivitäten in den heterozygoten – nicht aber den homozygoten Tieren-
herabgesetzt. Es konnten keine Regulationsvorgänge unter dem Einfluss von Insulin
gefunden werden. Im Insulinmangel, d.h. nach Gabe von Streptozotocin zeigte sich im Darm
für PEPT1 ein erhöhter mRNA- und Proteinspiegel, nicht aber eine erhöhte, sondern
erniedrigte Aktivität des Transporters. Der mRNA-Spiegel von SGLT1 war unter Diabetes
erhöht, die Proteinkonzentration blieb unverändert und die Aktivität war ebenfalls reduziert.
Diese Diskordanz von mRNA-/Proteinspiegeln und Aktivität lässt vermuten, dass die
Funktion der Na+ / K+ ATPase beeinflusst ist und damit keine Erhöhung der
Transportleistungen elektrogener Transporter herbeigeführt werden konnte.

Introduction
1
1. Introduction
1.1 Organization and major functions of mammalian small intestine
Since the beginning of evolution, cellular structures of organisms evolved in complexity;
from protozoans (unicellular organisms) with simple cellular structures up to metazoans
(multicellular organisms) with highly organized cellular structures forming tissues and
organs. In all organisms, membranes separate the inter- and intracellular space from the
extracellular space. Compartments built by epithelial structures, especially by polar
epithelial cells, enable the controlled exchange of substances between the inner and outer
milieu [1]. Changes in complexity of organisms’ organization were accompanied by
changes in nutrient supply. To absorb the monomers contained in complex nutritional
polymers, such as proteins, lipids and carbohydrates, digestion mediated by enzyme-
secreting organs such as pancreas had to evolve and the site of absorption, the intestinal
tract, was evolutionarily modified to satisfy these needs.
The small intestinal tract is functionally divided in three sections: 1) the duodenum 2) the
jejunum 3) the ileum. The duodenum is the first section following the stomach and is
responsible for food breakdown by enzymes secreted by the pancreas (e.g. proteases,
amylases and lipases) and liver (bile acids) [2]. In the jejunum, the degradation of
carbohydrates into monosaccharides, of proteins into amino acids (single amino acids and
oligopeptides) and of triglycerides into fatty acids is completed. The jejunum therefore is
the major site of absorption that is further completed in the ileum.
The intestinal tract is characterized by enlarging folds called the Kerckig folds (Fig. 1 a, b).
Attached to these folds villi further enlarge the absorptive surface area of the intestine. Villi
(Fig. 1 c) are protrusions of the intestinal mucosa and consist of a layer of columnar
epithelial cells, which display a polarized structure and a central core of connective tissue
[2]. A further increase of the absorptive surface area is achieved by the microvilli that cover
the apical membrane of epithelial cells. A layer of glycolipids, glycoproteins and
mucopolysaccharides called the glycocalyx covers the brush border formed by the
microvilli. The carbohydrate side chains of the glycocalyx bind water and allow enzymes
secreted by the epithelial cells to adhere and to promote digestion of proteins and sugars
[3]. The epithelial cells found in the small intestine possess different functions. Goblet cells
(Fig. 1 c) produce and secrete mucins that dissolve in water and form the mucus layer
covering and protecting the epithelial cells. Paneth cells (Fig. 1 c) at the bottom of the crypt

Introduction
2
region serve as immune cells of the intestine and secrete for example antibacterial
compounds for host defense. Endocrine cells (Fig. 1 c) are responsible for hormone
secretion while the enterocytes absorb nutrients. At the bottom of the crypt region stem
cells differentiate to all these kinds of epithelial cells and move along the crypt upwards.
Reaching the villus mid the cells become mature and replace the once that have been
sloughed off, since the lifespan of epithelial cells is only a few days [4].
Nutrients have to pass the epithelial layer to reach circulation. Two major transport routs
are known: 1) the paracellular and the 2) transcellular route. Paracellular transport appears
through tight junctions. Tight junctions connect the neighboring epithelial cells to each
other by nearly closing the extracellular space in between. In some tissues, these
connections are very tight, while in the intestine or in the proximal convolute tubule, the
connection is leaky thereby allowing small molecules (e.g. water, some sugars, and
alcohols) to pass [5].
Figure 1 Structure and details of the gut
Gut architecture (a), view onto the surface area with enlarging intestinal folds (b) and villi (c) (modified according to [3]).

Introduction
3
Transcellular transport can be passive diffusion and is thus depending on the permeability
of the cell membrane for the solute. Although it was believed that permeation of lipid
soluble compounds such as fatty acids, monoacylgylceroles and cholesterol occurs by
passive diffusion, recent years have demonstrated that those compounds also possess
specialized transport proteins. Integral membrane proteins serving as transporters can be
divided into: 1) symporters, 2) antiporters and 3) uniporters. As illustrated in the Fig. 2,
primary active transport (I) is energized by the hydrolysis of ATP as for example in the ABC-
transporter proteins whereas secondary active transport processes are classified by
coupling to sodium/potassium ATPase (Na+ / K+ ATPase) that provides the driving force for
secondary transporter by utilizing the Na+-gradient for uptake (e.g. NHE3, II). A tertiary
active transport process may be an exchanger coupled to a secondary active transporter
[6] as for example for intestinal amino acid absorption in which a Na+-dependent
transporter generates an amino acid gradient for exchange with other luminal amino acids
allowing their uptake (III).
Since the jejunum is the major absorption site of nutrients that serve as building blocks for
protein synthesis and energy metabolites, the pivotal role of the enterocytes is the transport
of amino acids, peptides and glucose derived from the ingested food. The absorption over
the apical membrane is accomplished by a variety of transporters (Fig. 2). The absorbed
nutrients are secreted into systemic circulation by basolateral transporters and transport
mainly follows the concentration gradient.

Introduction
4
Figure 2 Transporter systems expressed in the enterocytes of the mammalian small intestine
Apical transporters: AA (amino acids); PEPT1 (proton-coupled peptide transporter 1, SLC15A1, III: tertiary active transporter); PAT1 (proton-coupled amino acid transporter 1, SLC36A1); SIT1 (sodium/imino-acid transporter 1, SLC6A20); SGLT1 (sodium/glucose cotransporter 1, SLC5A1); B0AT1 (sodium-dependent neutral amino acid transporter neutral and cationic transporter, SLC6A19); NHE3 (sodium proton exchanger 3, SLC9A3, II: secondary active transporter). Basolateral transporters SAAT (single amino acid transporter); BLPT (basolateral peptide transporter); GLUT2 (facilitative glucose transporter type 2, SLC2A2); Na+ / K+ ATPase (sodium-potassium ATPase, ATP1A1, I: primary active transporter).
The majority of these apical transport systems, as depicted in Fig. 2, use electrochemical
gradients coupled to either sodium ions (Na+) or protons (H+) as driving force. The Na+-
gradient is generated by the basolateral Na+ / K+ ATPase creating a downhill transepithelial
concentration gradient for sodium across the apical membrane (Fig. 2). In case of the
proton-motive force, the pH gradient is generated by the apical sodium proton exchanger
NHE3 that in exchange for Na+ in a 1:1 coupling exports protons to the lumen. The proton-
gradient thus serves as a driving force for PEPT1 and PAT1.

Introduction
5
1.2 The Sodium-dependent Neutral Amino Acid Transporter B0AT1 or the
B0 Neutral Amino Acid Transporter AT1
Transport of neutral and aromatic amino acids across the apical membrane of intestinal and
renal enterocytes is accomplished by the Na+-depended transporter protein B0AT1
belonging to the system B0, also referred to as the neurotransmitter transporters (NTT’s) or
the neurotransmitter-sodium-symporter family [7, 8]. The transport system belongs to the
solute carrier family 6 (SLC6), with the SLC6A19 gene encoding for the transporter protein
B0AT1 [8, 9] as a secondary active transporter.
The membrane topology of this protein displays 12 transmembrane domains (TMD) with
inward facing N -and C termini [10]. Most transporters of this family contain about 600
amino acids and reveal a 40% amino acid sequence identity [10]. Transport stoichiometry
of the B0AT1 transporter was identified by Böhmer et al. (2005), using flux and
electrophysiological transport studies in Xenopus laevis oocytes expressing murine B0AT1.
They identified the previously described Na+ dependency of the transport of neutral amino
acids [11] with a coupling ratio of 1:1, displaying an electrogenic co-transport [12].
Substrates of the transporter are e.g. alanine and phenylalanine with a Km of 4 mM and
leucine with a Km of 1.1 mM. While the transporter shows a rather low affinity to glycine with
around 11 mM [13]. Km values display a high heterogeneity and reflect the Na+- dependency
by a decreasing Km with increasing Na+ concentration [12]. It was demonstrated that the
human B0AT1 displayed the same transporter activities as the mouse orthologous with
similar affinities for the substrates [8]. Mutation studies of the SLC6A19 gene revealed
SLC6A19 to be the candidate gene in the development of Hartnup disorder, an autosomal
recessive disorder leading to aminoaciduria (OMIM 234500) [8] that was first described in
the 1956. Up to date 21 mutations in over 20 families have been described to contribute to
the disorder [13]. In rabbit ileum the B0 class of transporters is represented by two proteins,
the B0,+ transporter that in a Na+-dependent manner accepts large neutral amino acids and
cationic amino acids and the system ASC that transports mid-sized neutral amino acids
[14].

Introduction
6
1.3 The System IMINO or the Sodium/IMINO Acid Transporter 1 (SIT1)
The intestine is the major site of proline uptake and proline metabolism is immediately
linked to arginine metabolism, urea cycle and citrulline but also to creatinine or polyamine
synthesis [15]. Uptake of proline and hydroxyproline in intestine occurs mainly via the
sodium/imino acid transporter 1 (SIT1). The transport system belongs to the SLC6 family
and the SLC6A20 gene encodes for the transporter protein SIT1. The membrane topology
of the protein displays the typical 12 transmembrane spanning domains with the inward
facing N- and C-termini [16]. Investigations on the stoichiometry of SIT1 revealed many
different coupling ratios depending on the transported substrate [16, 17]. Mutation,
expression and functional studies of the transporter when expressed in X. laevis oocytes by
Bröer et al. (2009) revealed that the substrate translocation of SIT1 is coupled to 2 Na+ and
1 Cl-. Two functional binding sites for Na+ and one for Cl- have been identified. Uptake
studies showed that the Cl- binding site is crucial for the correct folding and function of the
protein [18]. The transporter protein shows a low proline affinity reflected by a Km value of
0.2 mM [16]. Expression studies of murine XT3s1 in X. laevis oocytes revealed that in mice
two gene homologues are expressed that share amino acid sequence identity of over 93 %.
The gene encoding the transporter XT3 (IMINOk) is expressed in kidney, while transcripts of
XT3s1 (IMINOb) were found to be expressed in lung, brain, kidney, small intestine and
spleen [19, 20]. Genetic defects of the SIT1 expressed either in the kidney or the small
intestine in humans causes impaired transport of hydroxyproline, proline and glycine with
elevated levels in urine, defined as iminoglycinuria (OMIM 242600). Studies though indicate
this genetic disorder to be rather a multiple gene based disease, that is not only caused by
disturbed SIT1 function, but also by incorrect function of other transporters affecting proline
absorption such as the proton amino acid transporter 1, PAT1 [21].
1.4 The Proton-coupled Amino Acid Transporter 1 (PAT1)
The transport of a variety of amino and imino acids (proline and hydroxyproline) is mediated
by the proton-coupled amino acid transporter, PAT1 as a member of the SLC36 family with
the SLC36A1 gene encoding for the intestinal transporter protein [22]. The transporter was
first identified in plants and yeast [23, 24] and later detected in mammals (rat, mouse, rabbit
and human) [25]. The membrane topology of the protein is characterized by 11
transmembrane spanning domains with an inward facing N-terminus and an outward facing
C-terminus. The transport is Na+ and Cl- independent but displays an H+-coupled symport.

Introduction
7
The stoichiometry of the co-transport of substrate to proton is 1:1. Km values of PAT1 (1-10
mM) indicate a low affinity and high capacity transport system [26]. In epithelia PAT1 shows
a Na+-dependency, which originates likely from the function of the sodium/proton
exchanger NHE3 mediating H+ efflux via Na+ influx. This functional cooperation has also
been observed for other transporters such as PEPT1 [27].
In 2002, Boll et al. identified the mouse orthologous to PAT1 [21, 26] and in 2003 the PAT1
protein was identified in the human intestinal cell line Caco-2 [28]. Human PAT1 is a 476
amino acid containing membrane protein sharing about 85 % sequence identity with the rat
PAT1. Tissue distribution and cellular expression of PAT1 spreads from brain, small
intestine to kidney, lung and neurons [21]. A unique feature of PAT1 is that it can transport
in electroneutral fashion H+ and short-chain fatty acids such as acetate, propionate and
butyrate [29].
Apart from small neutral amino acids (glycine, L-proline and L-alanine), PAT1 is also able to
transport the neurotransmitter γ-aminobutyric acid (GABA) [30] and the osmolyte taurine
[27]. In 2009, Anderson et al. [31] described two transporter systems to be responsible for
intestinal absorption of taurine in humans. Under physiological conditions TauT (Cl--
dependent taurine transporter, SLC6A6) is responsible for the basal uptake, while under
high luminal concentrations as they may occur during a meal, taurine uptake is mainly
accomplished by PAT1 [31].
1.5 The Sodium-coupled Glucose Cotransporter 1 (SGLT1)
An essential feature of almost all cells (from bacteria up to highly specialized mammalian
cells) is the transport of glucose and galactose across the plasma membrane. Glucose is
required for many metabolic processes occurring in cells, e.g. oxidative and non-oxidative
ATP production. In the intestine glucose and galactose uptake depends on the
sodium/glucose cotransporter SGLT1 encoded by the SLC5A1 gene. The SLC5 gene family
accounts for more than 298 transporter genes and expression of these transporters is
found in various tissues: brain, small intestine, muscle, heart, kidney and others [32, 33].
The sodium/glucose cotransporter branch (SGLT’s) include seven members (SGLT1-7) with
different expression patterns [33] and the first discovered and identified cotransporter of
this family was SGLT1. SGLT1 is a - species dependent - 580 to 718 (human: 664; rat: 665
and mouse: 665) amino acid containing polypeptide with a predicted molecular weight of
60 to 80 kDa. Amino acid sequence studies of rabbit, rat and human SGLT1 isoforms

Introduction
8
expressed in X. laevis oocytes revealed that rat and human isoforms are functionally more
similar to each other than the rabbit isoform [34]. The isoforms display different putative
protein kinase C (PKC) and protein kinase A (PKA) phosphorylation sites and show different
activation patterns by kinases depending on the actual amino acid sequence of the
transporter protein [35, 36].
As shown in Fig. 3 the SGLT1 protein contains 14 transmembrane domains (TMD’s) with N-
and C- termini facing the extracellular compartment [32]. Two large loops are found at the
extracellular side connecting TMDs 6-7 and TMDs 8-9 while the orientation (outward or
inward direction) and existence of the third loop, connecting TMDs 13-14 is still
controversially discussed [37]. The stoichometry was found to be 2 Na+:1 glucose.
Figure 3 Predicted membrane topology of the secondary structure of human SGLT1 protein (modified from [32])
The model shows 14 TMD’s with two large ECL’s and the NH3 and COOH termini facing the extracellular space. ECL between TMD 13 and 14 is facing the intracellular side. Color-coding reveals conservation of the amino acid residues among 19 divergent members (pro-and eukaryotes) of the sodium/substrate symporter family [37].
Crane was the first, in 1961, who described the coupled transport of Na+ with glucose by
SGLT1 (not known in nature as yet). He verified a coupled downhill Na+ transport to uphill
glucose transport across the brush-border membrane (BBM) of the small intestine [38]. The
chemical Na+ gradient needed for sugar transport is primarily maintained by the action of
the basolateral Na+ / K+ ATPase. Transepithelial glucose transport requires the glucose
transporter 2 (GLUT2) in the basolateral membrane for sugar release into circulation [39-41].

Introduction
9
Natural substrates of SGLT1 are D-glucose and D-galactose while non-metabolizable
substrates are represented by 3-O-methylglucoside and α-MDG [42].
SGLT1 is designated as a high affinity transporter [43] therefore various studies in different
species, tissues and cell lines have been performed to determine apparent Km values for the
transporter (Tab.1).
Table 1 Reported SGLT1 substrate affinities (Km) and maximal transport rates (Vmax)
BBMV: Brush-border membrane vesicles; rb SGLT1 (rabbit), rSGLT1 (rat), hSGLT1 (human); Caco-2: human epithelial colorectal adenocarcinoma cells; RIE-1: Rat Intestinal Epithelial cells; IEC: rat derived Intestinal Epithelial Cells. All data represent apparent values (n.d.: no data).
Publication Tissue/Cell Substrate Concentration (mM)
Km (mean ± SE)
Vmax
(mean ± SE) Debnam & Levin 1974 [44]
jejunum in vivo (rat)
D-Glucose D-galactose α-MDG
0 – 64 0 – 64 0 – 64
22.6 ± 1.3 32.4 ± 2.3 31.2 ± 1.8
85.8 ± 4.8 113 ± 11.1 48.8 ± 3.9 (µm/10cm*15min)
Brot-Laroche et al. 1986 [45]
jejunum, BBMV (rabbit) jejunum BBMV (guinea pig)
D-Glucose D-Glucose
0.1 – 350 0.1 – 350 10-6 – 10-3 [M]
0.4 ± 0.1 0.5 ± 0.1 0.4 ± 0.1
n.d. n.d. n.d.
Hirayama et al. 1996 [34]
X. laevis oocytes: rbSGLT1 rSGLT1 hSGLT1
α-MDG α-MDG α-MDG
0 – 100 0 – 100 0 – 100
0.17 ± 0.01 0.31 ± 0.02 0.49 ± 0.03
n.d. n.d. n.d.
Cheeseman 1997 [46]
jejunum BBMV (rat)
D-Glucose 33 µM – 6.7 0.13 ± 0.01 about 400 (pmol/mg prot/sec)
Kellet & Helliwell 2000 [47]
jejunum in vivo (rat)
D-Glucose 1 – 100 26.9 ± 6.5 13.6 ± 1.5 (µmol*min-1*(g of dry weight)-1)
Mate et al. 2006 [48]
Jejunum BBMV Ileum BBMV (rat)
D-Glucose D-Glucose
0.01 – 100 0.01 – 100
0.14 ± 0.02 0.15 ± 0.01
455 ± 12 200 ± 25 (pmol*mg protein-
1* s-1) Yang et al. 2010 [49]
jejunum, upper villus middle villus crypt (piglet)
D-Glucose D-Glucose D-Glucose
2.3 – 92 2.3 – 92 2.3 – 92
2.02 ± 0.52 3.7 ± 1.05 2.76 ± 0.5
390 ± 96.2 590 ± 167.7 492.4 ± 87.3 (pmol*mg protein-
1*s-1)
Zeng et al. 2011[50]
Caco-2 RIE-1 IEC-6
D-Glucose D-Glucose D-Glucose
0.5 – 50 0.5 – 50 0.5 – 50
7.5 ± 0.6 6.7 ± 0.8 7.6 ± 0.4
709 ± 18 199 ± 11 235 ± 4 (nmol/mg 1min)

Introduction
10
The regulation of SGLT1 activity and expression was shown to depend on hormones such
as insulin [51], glucagon-like peptide 2 (GLP2) from L-cells [46] and gastric inhibitory
polypeptide (GIP) derived from K-cells [52]. Cholecytokinin 8 (CCK-8) secreted by I-cells
[53] appeared to decrease the abundance of SGLT1 in the enterocytes of the jejunum.
Since insulin regulates glucose homeostasis, it is intriguing to assume that intestinal
glucose absorption is influenced by the action of insulin. Pennington and colleagues
demonstrated in 1994 that vascular as well as luminal insulin decreases the Na+ dependent
glucose uptake [51], while Banerjee and colleagues reported before (1989) that the Na+
dependent glucose uptake is increased by the action of insulin [54]. In this respect, data are
still highly controversial on whether insulin affects nutrient uptake in the gut.
In addition to hormonal regulation of SGLT1, transporter activity on an expression or
functional level appears to be affected by the intracellular 617-amino-acid long protein RS1,
described by Osswald et al. (2005). Mice lacking the Rsc1A1 gene, respectively the RS1
protein showed increased SGLT1 activity and an accelerated development of obesity [55].
Type 1 diabetes (T1D) has been shown to have effects on SGLT1 abundance and activity.
Hyperglycemia was attributed to an increased electrochemical driving force for SGLT1
mediated by increased food intake [56]. Additionally, SGLT1 appearance in enterocytes of
the ileum with usually low abundance of SGLT1 and an enlargement of villus length [57, 58]
was reported in diabetic rats. The renin-angiotensin system (RAS) found with its most key
enzymes and peptides in the intestine is additionally described to effect SGLT1 activity in
diabetes [59].
Expression studies performed in intestinal tissue of mice by Yoshikawa et al. (2011) indicate
a wide distribution of the transporter along the small intestine. SGLT1 protein was found to
be located exclusively in the BBM of enterocytes. Highest gene expression levels were
observed in the proximal part of the small intestine, but compared to other glucose
transporters even the distal part and the large intestine showed relatively high SGLT1
transcript levels [60]. Studies performed on villi of rabbit small intestine showed SGLT1
protein expression only in mature enterocytes and not in Paneth, Goblet and
enteroendocrine cells (EEC’s). No transcripts were detected in the crypt cells but
expression increased about 6-fold by reaching the epithelial cells at the villus tip [61]. Apart
from the intestine, SGLT1 is also expressed in the kidney – like its orthologous protein
SGLT2 - which is exclusively found in the S1 and S2 segments of the renal convoluted

Introduction
11
proximal tubules, where it is responsible for the majority of glucose reabsorption from the
glomerular filtrate [62, 63].
Sugar transport studies and hormone secretion studies with ELISA-based detection of
hormones have been described in GLUTag cells, a murine L cell model [64], as well as in
murine K-cells [65] suggesting that SGLT1 may also be found in EE L-cells and could be
involved in triggering hormone secretion.
Mutations in the human SLC5A1 on chromosome 22 gene can lead to glucose-galactose
malabsorption (GGM) with the clinical symptoms of watery diarrhea and weight loss when
eating carbohydrates. The origins can be missense, frame shift, and nonsense mutations.
GGM is an autosomal recessive disorder affecting mainly the trafficking of the protein to the
plasma membrane [66, 67].
1.6 The facilitative Glucose Transporter Type 2 (GLUT2)
The facilitative glucose transporter GLUT2 belongs to the SLC2 family and the protein is
encoded by the gene SLC2A2. The SLC2 protein/transporter family comprises 14 isoforms
(SLCA1-14) and based on primary sequence comparison, the GLUT family can be divided
in three subclasses (Tab. 2). Class I comprises GLUT1-4 and GLUT14 (splice variant of
GLUT3 [68]); Class II comprises GLUT5, 7, 9 and 11 and class III includes the GLUT
isoforms GLUT6, 8, 10, 12 and the proton driven myo-inositol transporter GLUT13 (HMIT)
[69, 70].
Common features of the GLUT-family are 12 TMD’s with N- and C-termini facing the
cytoplasm. Class I-II harbor an N-linked glycosylation site in the first ECL, while class III
family members exhibit that site within the 9th ECL [70]. Another common feature of the
GLUT-family is the energy-independent transport of their substrates downhill the
concentration gradient. These systems are also called passive carriers.
Cloning from human sample cDNA libraries in 1988 revealed prominent GLUT2 expression
in liver, kidney and intestine [41]. Further analysis identified GLUT2 in insulin-producing β-
cells of the Langerhans-islets in the pancreas with an apparent Km of 17 mM for 3-O-methyl
glucose, similar to that reported for liver GLUT2 [71, 72]. Natural occurring substrates of the
glucose transporter are D-glucose (Km ~ 17 mM), D-galactose (Km ~ 92 mM), D-mannose
(Km ~ 125 mM) and D-fructose (Km ~ 76 mM) [72, 73]. In 2002, Uldiy et al. [73] showed
GLUT2 to transport also glucosamine with a much higher affinity (Km ~ 0.8 mM) than

Introduction
12
glucose and proposed a lack of specific substrate binding motif (QLS) in the protein of helix
7.
In the pancreatic β-cells, GLUT2 is expressed in the plasma membrane and functions
together with the cytosolic localized glucose phosphorylating enzyme glucokinase as a
glucose sensor for insulin secretion [74]. In the kidney and small intestine GLUT2 is
expressed in the basolateral membrane of epithelial cells and participates in the release of
cytosolic glucose into the bloodstream [32, 75].
The expression of GLUT2 in the basolateral membrane of epithelial cells has been studied
extensively. Newer findings however question the exclusive basolateral expression. Some
groups were able to show apical localization of GLUT2 in the enterocytes of the small
intestine in rats [75, 77, 78]. Furthermore, a reciprocal expression pattern of GLUT2 and
PEPT1 under high luminal glucose concentrations has been described [79].

Introduction
13
Table 2 SLC2-family members and their expression sites
Modified according to [76]. Red: class I isoforms; green: class II isoforms; black: class III isoforms.
Gene Protein Isoform (aa) Major site of expression
SLC2A1 GLUT1 492 Ubiquitous expression, brain
SLC2A2 GLUT2 524 Liver, islets, small intestine, kidney
SLC2A3 GLUT3 496 Brain, nerve cells
SLC2A4 GLUT4 509 Muscle, fat, heart
SLC2A5 GLUT5 501 Intestine, kidney, testis
SLC2A6 GLUT6 507 Spleen, leucocytes, brain
SLC2A7 GLUT7 524 Small intestine, colon, testis
SLC2A8 GLUT8 477 Testis, blastocysts, brain muscle adipocytes
SLC2A9 GLUT9 511/540 Liver, kidney
SLC2A10 GLUT10 541 Liver, pancreas
SLC2A11 GLUT11 496 Heart, muscle
SLC2A12 GLUT12 617 Heart, prostate, mammary gland
SLC2A14 GLUT14 497/520 Testis
SLC2A13 GLUT13 (HMIT) 618/629 Brain
To elucidate the role of GLUT2 in glucose homeostasis, different transgenic mouse models
have been introduced since 1994. One of the first studies was the overexpression of a
GLUT2 antisense mRNA in β-cells of transgenic mice (RIP-I/anti-GLUT2) by Valera et al.
[80]. They showed that a significantly reduced GLUT2 protein concentration in the
pancreatic β-cells led to impaired glucose-stimulated insulin secretion (GSIS) resulting in
diabetes in these animals. [80]. The next transgenic mouse model was the constitutive glut2
knockout mouse by Guillam et al. in 1997 demonstrating lethality beyond the age of 3
weeks [81]. The reexpression of GLUT1 specifically in the pancreatic β-cells of the GLUT2-
deficient mice rescued the animals and led to a normal first phase GSIS. On the other hand
these animals showed a fasting hypoglycemia, glycosuria and a shift in pancreatic α- to β-
cell ratio and an elevated glucagon to insulin ratio [82].

Introduction
14
1.7 The Proton-coupled Peptide Transporter 1 (PEPT1)
For a long time it was believed that ingested peptides had to be hydrolyzed into single
amino acids to be absorbed by the intestinal enterocytes. This was disproved by the
discovery of a dipeptide carrier system in the human jejunum [83-86]. Furthermore,
dipeptide uptake studies performed in intestinal brush-border membrane vesicles (BBMV)
by Ganapathy & Leibach (1983, 1985) and Ganapathy et al. (1984) demonstrated that this
was a Na+-independent but H+-coupled peptide transport system, which was activated by
an inwardly-directed pH-gradient [87-89]. Transport studies performed in X. laevis oocytes
expressing rabbit PEPT1 cDNA revealed that peptide transport across the membrane was
independent of extracellular Na+, K+ and Cl-, but driven by an electrochemical H+-gradient
and electrogenic in nature. Apart from its ability to transport over 400 dipeptides and 8000
tripeptides, the peptide transporter (PEPT1) is also capable of transporting various
peptidomimetics and thereby improving the oral bioavailability of drugs such as
cephalosporins, penicillins (β-lactam antibiotics), antivirals and for example pro-drugs of L-
DOPA [90].
1.7.1 The SLC15A1 gene and the PEPT1 protein
The identified intestinal peptide transporter PEPT1 belongs to the SLC15 family, which in
55 gene subfamilies has 362 functional proteins [91]. PEPT1 (SLC15A1) is a low affinity,
high capacity transporter protein with a size of 78 kDa. An orthologous of this transporter
(PEPT2) is expressed in epithelial cells of the kidney, mammary glands and other tissues
with very similar characteristics and substrate specificity. Except that PEPT2 is a high
affinity but low capacity transporter [92].

Introduction
15
Figure 4 Predicted PEPT1 membrane topology
The model shows 12 transmembrane spanning domains (TMD’s) with one large extracellular loops (ECL) between TMD 9 and TMD 10 and an intercellular facing loop between TMD 6 and TMD 7. The NH3 and COOH termini are facing the intracellular space.
The PEPT1 protein consists of 708 amino acid residues in humans and 709 in mouse [93]
and as shown in Fig. 4, 12 predicted TMD´s with a large extracellular loop between TMD 9
and TMD 10. Both amino and carboxyl termini are facing the intracellular side and there are
two predicted putative protein kinase C phosphorylation sites in TMD 8-9 (Ser357) and in
TMD 12 (Ser704) [93, 94]. The TMDs 1-4 and TMDs 7-9 reflect important sites concerning
the affinity and binding of the substrate. Mutational studies (in X. laevis oocytes and HeLa
cells) of the amino acid residue histidine 57 (H57), which is located in the extracellular loop
between TMD1-2 and H121 that is located in the TMD 4, pronounce the importance of
these residues in catalytic function of PEPT1. H57 seems to be involved in H+ binding and
H121 for the protonation of acidic peptides before the translocation by the transporter [95-
98]. The aromatic tyrosine residue Y56, which flanks H57, decreases the affinity of PEPT1
for different charged dipeptides when mutated to phenylalanine [98].
Deletion analysis of the human pept1 promoter suggested a region spanning 172 -35bp to
be essential for basal pept1 transcription activity. Though it was found that the TATA boxes
were unusually far upstream the transcription start site (511-517bp), while the GC boxes (29
bp, 300 bp) are located near the transcription start site [90]. This makes the GC box a more
promising promoter element [94]. The transcription factor SP1 binds to the GC-box and
plays a significant role in transcriptional regulation of PEPT1. As an intestinal-specific
transcription factor for the expression of the SLC15A1 gene, Cdx2 (caudal-related

Introduction
16
homeobox protein 2) has been identified to interact with SP1 [99] thereby regulating PEPT1
expression.
1.7.2 PEPT1 transport mode and substrate affinity
The transport of di- and tripeptides by PEPT1 is a substrate-coupled H+-cotransport,
allowing transport against the substrate concentration gradient. The accumulation of
protons and the resulting acidification of the enterocyte are counteracted by the sodium-
proton exchanger 3 (NHE3), found in the apical membrane of enterocytes (Fig 5). The
dependency of PEPT1 activity on NHE3 has been shown by transport studies in X. laevis
oocytes, Caco-2 cell monolayers, and intercellular pH measurements in enterocytes (in vivo)
and oocytes [100, 101]. The extrusion of the sodium ions is accomplished by the
basolateral Na+ / K+ ATPase (Fig 5). In addition to the apical NHE3 also the basolateral Na+-
coupled bicarbonate (HCO3-) symporter may influence the efficiency of PEPT1-mediated di-
/and tripeptide transport [102].
Figure 5 Interplay of PEPT1 (SLC15A1) with other solute transporters in apical and basolateral membranes of enterocytes
Acidification due to proton-coupled substrate transport by PEPT1 (light green) is counter-acted by proton extrusion via the sodium-proton exchanger NHE3 (grey). Export of sodium is accomplished by the basolateral expressed Na+ / K+ ATPase (sodium-potassium ATPase, grey).

Introduction
17
The minimal requirements of a peptide to be transported by PEPT1 have been investigated
by Döring et al. (1998) using yeast transport assay studies and X. laevis oocytes expressing
rabbit cDNA of PEPT1 for uptake studies. These experiments showed that the minimal
determinants of substrate recognition by PEPT1 requires two ionized head groups (i.e.
amino-and carboxyl group), which are separated by four intermolecular spacers (CH2) with
a distance of 5 - 6.3 Å. A peptide bond is not necessarily required but only transported in
the trans-form when present while the cis-form is considered to be too small to be
accepted [103].
Table 3 PEPT1 substrate affinities (Km) and maximal transport rates (Vmax)
HeLa: cervical cancer derived cell line; Caco-2: human epithelial colorectal adenocarcinoma cells; SKPT: rat renal cell line; hcDNA: human complementary DNA.
Publication Tissue / Cell Substrate (dipeptide)
Concentration (mM)
Km (mean ± SEM)
Vmax
(mean ± SEM) Adibi et al. 1974 [84]
human jejunum Gly-Gly 20,50,75,100 43.3 ± 2.6 837 ± 62 (µmol/min/15cm)
Liang et al. 1995 [104]
HeLa hcDNA Gly-Sar 0.05 – 5 0.29 ± 0.04 4.7 ± 0.3 (nmol/2min/ 106cells)
Thamotharan et al. 1999 [105]
rat BBMV (jejunum)
Gly-Gln 5 - 40 39.5 ± 5.11 19.9 ± 1.6 (nmol/mg protein/10s)
Thamotharan et al. 1999 [106]
Caco-2 Gly-Gln 0.1 – 5 1.49 ± 0.55 3.53 ± 0.61 (nmol*mg protein-
1*5min-1) Winckler et al. 1999 [107]
Porcine jejunum
Gly-L-Sar 1 - 30 11.6 ± 3.32 1.67 ± 0.06 (µeq*cm-2*h-1)
Gangopadhyay et al. 2002[108]
rat BBMV (jejunum)
Gly-Gln 5 - 40 15.33 ± 5.33 17.24 ± 2.75 (nmol*mg protein-
1*10s-1) Wenzel et al. 2002 [109]
Caco-2 Cefexime 0.05 – 5 1.9 ± 0.2 36.2 ± 2.7 (nmol*cm-2
*30min-1) Knütter et al. 2008 [110]
Caco-2 SKPT
Gly-Sar Gly-Sar
0 – 10 0 – 10
1.1 ± 0.1 0.14 ± 0.02
39.4 ± 1.0 (nmol*mg protein-1/10min) 6.9 ± 0.3 (nmol*mg protein-
1/10min) Jappar et al. 2010 [110]
mouse jejunum Gly-Sar 0.01 - 200 19.8 ± 3.3 4.4 ± 0.2 (nmol/cm2/s)
Ma et al. 2011 [111] mouse jejunum
Gly-Sar 0 - 40 9.96 233 (pmol/mg/20sec)
The affinities of PEPT1 to its substrates have been determined by many groups and in
many different systems [84, 104-106, 108-112]. As depicted in Tab. 3, Km’s as well as the
Vmax values display a high heterogeneity, which can on the one hand be explained by the
different tissues or cells and on the other hand by the different experiments carried out.

Introduction
18
1.7.3 Expression pattern of PEPT1
The mRNA expression pattern of PEPT1 was studied by Lu and Klaassen (2005) in 19
tissues of mice and rats (male and female). As expected, highest expression levels were
found in the small intestine, especially the jejunum, which was independent of gender and
species. Expression was also detected in kidney, gonads (male) and uterus (female) in rats.
In mice, PEPT1 was additionally detected in the large intestine and the gonads of female
animals [113].
Studies performed by Merlin et al. (2001, 2009) suggested an induction of PEPT1
expression in an inflammatory state (chronic ulcerative colitis and Crohn's disease) in the
human colon and the induction of PEPT1 expression after inflammation in mice [114, 115].
Immunofluorescence stainings of colonic sections and mRNA expression studies (oral
communication with Tilo Wünsch) additionally reveal that PEPT1 is found in the distal but
not in the proximal part of the colon of healthy male C57BL/6 mice.
In 1990, first evidence of the existence of a basolateral peptide transport system was
observed by Dyer et al., by the glycyl-L-proline transport found in rabbit basolateral
membrane vesicles [116]. Further studies performed in Caco-2 cell lines by several groups
enforced the existence of a basolateral peptide transport system using hydrolysis-resistant
substrates such as the dipeptide Gly-Sar [117-119]. However, the nature of this protein
remains a mystery and all cloning attempts failed.
1.7.4 Regulation of PEPT1
The regulation of intestinal PEPT1 protein expression and activity is influenced by various
factors such as hormones, nutritional or dietary factors and by pathological states.
Insulin
So far, only a little is known about insulin receptor (IR) expression in the small intestine und
literature provides conflicting data. It may be expected that IR are restricted to the
basolateral side of enterocytes. However, in 1987, Weström et al. described high
concentrations of insulin in the colostrum and in porcine milk and proposed that this insulin
may affect growth of the intestine and cell proliferation during the neonatal and nursing
periods [120]. The addition of oral insulin to the diet of newborn pigs indeed showed trophic
effects on the intestinal cell mass and increased disaccharidase activity [121], while

Introduction
19
inhibition of the IR’s induced an inhibition of mucosal growth and expression of hydrolases
in suckling and weaning rats [122]. In adult animals conflicting results were obtained on the
intestinal IR expression. IR’s were shown to be exclusively expressed on the vascular side
of the intestinal epithelium of dogs [123], whereas in rabbit BBM of proximal colonic
epithelium the expression of IR’s suggest apical localization [124]. Buts et al. (1997)
demonstrated IR expression on the endoluminal and vascular side in the rat small intestine
and found it to be independent of age [125]. Human colonic adenocarcinoma cells (Caco-2)
were shown to express IR’s [126, 127] and those cells were used investigate possible
effects of insulin on transporter function and in particular on PEPT1 which shows high
expression in Caco-2 cells.
Thamotharan et al. (1999) demonstrated that physiological concentrations of insulin, added
to the incubation medium, significantly increased PEPT1-mediated glycyl-sarcosine (Gly-
Sar) transport in Caco-2 cells. This was due to an increase in maximal transporter capacity
(Vmax) of PEPT1 and postulated to result from increasing the membrane density of the
transporter protein and its synthesis. Disruption of the microtubuli eliminated the effect of
insulin on the peptide transporter; what is yet not defined is the mechanisms by which
insulin increases the translocation of preformed PEPT1 proteins from cytoplasmic pools
into the apical membrane [106]. Exposure of only the basolateral side of Caco-2 cells to
insulin also increased PEPT1 activity as described by Nielsen et al. [128].
Leptin
Leptin is secreted as ob gene product mainly from adipocytes but it can also be secreted
from tissues such as brain, placenta and stomach. Its pivotal role is satiety control and to
regulate lipid metabolism [129-131]. Leptin receptors (ob-R) are expressed at both, apical
and basolateral, membranes of enterocytes with adipocyte-derived leptin reaching the
basolateral side and stomach-derived leptin reaching the apical membrane [131].
Studies performed in diet-induced obese (DIO) mice showed reduced dipeptide transport
via PEPT1 and a down-regulation of the leptin receptor protein [131], while hyperleptinemia
induced for 7 days in rats led to an increase of PEPT1 gene expression and transporter
activity. In addition to the described effects of leptin on PEPT1 activity, SGLT1, PAT1 and
B0AT1 were down regulated by apical exposure to leptin in a study performed in Caco-2
cells by Ducroc et al. 2012 [132, 133].

Introduction
20
Peptides and amino acids
In vitro studies performed in PEPT1 expressing Caco-2 cells [134] were carried out to
determine whether expression and activity of the transporter could be influenced by its
substrates. 24-hour exposure of cells to Gly-Sar increased the maximal velocity for
glycylglutamine transport (Gly-Gln) and revealed a twofold increase in PEPT1 abundance.
At the same time, when free glycine or sarcosine were added, no change in velocity or
protein levels of PEPT1 appeared. Furthermore, it was shown that the stimulation of PEPT1
transport by its substrate was due to newly synthesized PEPT1 since stimulation was
disrupted after brefeldin treatment that impairs endoplasmatic reticulum (ER) the trans-
Golgi network processing [134]. The described effects were attributed to increased gene
transcription and stabilization of the mRNA of PEPT1.
A feeding study performed in rats with supply for 3 days with a standardized diet
supplemented with the dipeptide Gly-Phe led to an increased mRNA expression level of
PEPT1 [135]. Dipeptides are thus able to stimulate PEPT1-mediated transport possibly by
increasing PEPT1 membrane protein density while single amino acids fail to influence
PEPT1-mediated transport [121].
Calcium-mediated regulation
The key function of cytosolic Ca2+ is to serve as a second messenger by regulating cellular
processes such as hormone secretion, gene expression, neurotransmission and cellular
proliferation [136].
Ca2+ is stored in intracellular pools, mainly the ER and either a receptor activation or
membrane depolarization causes the raise in intracellular calcium. For example inositol-
1,4,5-triphosphat (IP3) mediates the release of Ca2+ from the intracellular pools with an
increase in cytosolic Ca2+ that can further lead to activation of membrane bound voltage
gated L-type Ca2+ channels (Cav 1.3) that enhance the Ca2+ concentration by influx from the
outside. An activation of these apical Cav 1.3 channels can be induced by an increased
entry of Na+ ions into the cell, which in consequence via a depolarization of the membrane
causes the opening of these channels [5]. Cav 1.3 channels were shown to reside in the
apical membrane of epithelial cells of jejunum and are crucial for the control of Ca2+ entry
into the enterocytes. Studies performed in Caco-2 cells by Wenzel et al. (2002) using
different Ca2+ channel blockers, e.g. nifedipine, a specific L-type Ca2+ channel blocker [137],
demonstrated that changes in intracellular Ca2+ concentration led to an upregulation in

Introduction
21
PEPT1 mediated transport. Nifedipine treatment of cells led to an increased Vmax of PEPT1
(Km remained unaffected) and caused increased intracellular acidification [109].
Although SGLT1 is the prime glucose transporter in the apical membrane of enterocytes, it
has been postulated – based on studies mainly in rats – that by high luminal concentrations
(such as after a meal) GLUT2 may be recruited to the apical membrane and most
interestingly is associated with a retrieval of PEPT1 from the apical membrane (Fig. 6).
These studies were extended by Mace et al. (2009) demonstrating that in the small intestine
of rats this may be coordinated via calcium and T1R taste receptors and thereby PEPT1
and GLUT2 function in the apical membrane of enterocytes would be regulated in a
reciprocal manner [79].
The G-protein coupled receptors (GPCR’s) of the family Type 1 (T1R), which can be
subdivided into two groups: (a) T1R2/T1R3 heterodimers that sense sweet taste (sugar,
artificial sweeteners), (b) T1R1/T1R3 heterodimers sensing umami and savory amino acids.
The second taste receptor family (T2R) is responsible for mediating the bitter taste [138,
139]. Expression studies performed in various species (mouse, rat, dog and human)
showed transcripts of the T1R family and T2R family along the GI tract together with
transducin and α-gustducin in EECs [79, 139].
The proposed model with the reciprocal regulation of GLUT2 and PEPT1 (Fig. 6) is based
on the conception that luminal high glucose levels are sensed by SGLT1 and the sweet
taste receptor dimers T1R2/T1R3. SGLT1 activity would cause membrane depolarization
leading to opening of apical L-type voltage gated calcium channels (Cav 1.3.) and calcium
increase in the cells.

Introduction
22
Figure 6 Schematic overview of a proposed inverse regulation of transporter proteins in the apical membrane in response to a high luminal glucose exposure
Reciprocal regulation under high luminal glucose concentration of PEPT1 (green) and GLUT2 (red) [79] in the apical membrane of an enterocyte, induced by the activation of Cav 1.3 (yellow) and Ca2+-mediated (yellow dashed line) PKC βII activation. Terminal web and cytoskeletal rearrangements and PKC βII action (dashed black arrows) change expression patterns by retrieval of PEPT1 in- (black arrow) and insertion of GLUT2 (black arrow) - from intracellular preformed vesicle pools - in the apical membrane.
According to the model an increase in intracellular calcium concentration induces the
translocation of cytosolic, inactive but phosphorylated protein kinase C βII (PKC βII) to the
apical membrane where it becomes activated by a second signal (not depicted in Fig. 6)
mediated by sweet taste receptor activation. The full activation of the pathway is achieved
via diacylglycerol (DAG) promoting the removal of the N-terminal pseudosubstrate region
from the active site of PKC βII. The events lead finally to terminal web and cytoskeletal
rearrangements [77] that allow transporter trafficking into the apical membrane (GLUT2)
from intracellular preformed vesicle pools and retrievement out of the membrane in case of
PEPT1 [79].
Diabetes and Inflammatory bowel disease
Diabetes is the most progressive metabolic disease of the 21st century (WHO, 2012). Many
studies have been conducted to understand the pathophysiological impact the organism.

Introduction
23
Studies on the effect of a diabetic state on the small intestine and nutrient uptake by
enterocytes started as early as the 1970´s by using isolated intestinal microvillus
membranes [140]. In addition, autonomic neuropathy resulting in disturbances of
gastrointestinal motility in diabetes [141] with changes in stomach emptying and a delayed
stomach to caecum transit time were reported [142].
The β-cell toxic agent Streptozotocin (STZ) is frequently used to generate experimental
diabetes in rodents. Gangopadhyay et al. in 2002 reported that PEPT1 function is altered
when brush-border membrane vesicles (BBMV) from STZ diabetic rats were studied for
transport. After 96 h of STZ treatment, the maximal velocity (Vmax) of PEPT1 in BBMV was
markedly increased. This was proposed to result from changes in translation as gene
expression changes were not found [108]. Studies performed by Bikhazi et al. (2004) and
Der-Bogosshian et al. (2010) in rats, revealed that STZ-treatment and diabetes without
substitution of insulin, caused PEPT1 mRNA to increase whereas the protein level
decreased. Functional studies with Gly-Sar revealed a decreased transporter activity.
Although the duration of uncontrolled diabetes varied between the two studies, the results
remained essentially the same [143, 144].
Besides diabetes, PEPT1 expression and activity was proposed to be altered in Crohn´s
disease and ulcerative colitis [114, 115]. In addition to those reports, recent studies
performed in a human colonic cell line (HT29-Cl.19A) that does not express PEPT1 under
basal conditions, showed induction of expression of PEPT1 upon exposure to
enteropathogenic Escherichia coli possibly via the transcription factor Cdx2 [115]. In
addition to Cdx2, intact lipid rafts seem to be as well important role in PEPT1 activation
[115].

Material and Methods
24
2. Material and Methods
2.1 Animals
Wild type C57/BL6J and C57/BL6N mice were either breed in the open mouse facility
(Liese-Beckmannstr.4, 85350 Freising/Weihenstephan, Kellerraum K20), or in the SPF
(Specific Pathogen Free) facility (SPF-Tierhaltung Biowissenschaften, Gregor-Mendel-
Strasse 2, 85350 Freising/Weihenstephan). The pept1-/- mice were obtained from Deltagen
(San Mateo, USA) and breed in house, in the open and SPF facilities. The sglt1-/- mice were
kindly provided by Prof. Koepsell (Lehrstuhl für Anatomie, Würzburg, Germany) and further
breed under SPF conditions.
Mouse husbandry
All mice were kept under a 12h dark-light cycle at 24°C room temperature. Animals had free
access to water and were kept on a standard laboratory chow (SPF- facility: V1534-3 sniff,
Germany; open facility: V-1534-0, sniff, Germany) ad libitum or a modified glucose deficient
diet (sniff, Germany). The homozygous C57BL/6 wild-type mice (pept1+/+) were mated, as
well as the homozygous PEPT1-deficient (pept1-/-) mice, to obtain entirely homozygous
offspring. All animals were treated according to the German guidelines for animal care as
approved by the states ethics committee (reference number: 55.2.1-54-2532-22-11 and
reference number: 55.2.1-54-2532-39-10).
For the conducted studies animals were anesthetized by inhalation of Isoflurane (Baxter,
Germany), and immediately killed by cervical dislocation. The small intestine was carefully
and quickly removed after dissection and stored in ice cold modified Krebs-Henseleit Buffer
(mKHB, for composition see Tab. 4).

Material and Methods
25
2.2 Functional characterization of epithelial transporters
2.2.1 Techniques used
Functional characterization of transporters was performed by electrophysiological
measurements using Ussing chambers and by quantifying uptake using radiolabeled
substrates in everted gut ring preparations.
Ussing chamber
Jejunal segments of homozygous wild type (C57/BL6J), pept1-/- and the heterozygous
pept1+/- mice, as well as sglt1-/- mice were used to determine changes in selected
transporters by electrophysiological measurements as described below (2.4) in detail.
Uptake of radiolabeled substrates
Everted gut rings of the small intestine of wild type (C57/BL6J), and pept1-/- mice were
prepared as described below (2.5) and uptake of radiolabeled substrate was determined. In
the following, these experiments will be referred to as “uptake experiments”.
2.2.2 Preliminary studies to determine parameters of transporter activity
Kinetic studies
To study PEPT1, SGLT1, B0AT1 and SIT1 substrate affinities [120] and maximal transporter
velocities (Imax), transport studies were conducted in the Ussing chamber. Jejunal segments
of wild type (C57/BL6J), pept1-/- and sglt1-/- mice were used to determine major kinetic
parameters. In these experiments, the basolateral and apical solutions both contained 75
mM glucose and were constantly recirculated. Every 2 min, substrate was added to the
apical solution from a stock with increasing concentrations (1, 5, 10, 20, 35, 50, 75 mM). By
carefully pipetting the individual volumes into the apical reservoir, the starting volume of 5
ml was maintained and any pressure differences were prevented.
Segmental uptakes
To determine PEPT1 and SGLT1 highest regional activity in the small intestine, the complete
small intestine of wild-type mice (C57/BL6J) was everted and segments were prepared with

Material and Methods
26
three consecutive rings incubated together for 2 min with the respective radiolabeled PEPT1
or SGLT1 substrate.
2.3 Experimental procedures intended to modify transporter activities
2.3.1 Effect of high-fat feeding on intestinal transporter activity
By 6 weeks of age wild type mice (C57/BL6J, SPF-facility) received a high-fat (HF) diet
containing 60 % of energy from fat (E15741-34, sniff, Germany) for twelve weeks. The
control mice of same age, received a corresponding control (C) diet containing 11 % energy
from fat (E15000-04, sniff, Germany). Electrophysiological analysis of the transporters
(PEPT1, PAT1, SIT1 and SGLT1) was conducted in the Ussing chambers.
2.3.2 Effect of insulin on intestinal transporter function
In vitro
In wild type (C57BL/6J) mice, substrate-induced short-circuit currents (Isc’s) of PEPT1, SIT1
PAT1, EAAC1 and SGLT1 were measured in the Ussing chambers before and after a 30 min
exposure to insulin (100 nM, Sigma Aldrich, USA) added to the basolateral compartment.
In vivo
Twelve week old male, wild type (C57/BL6N) mice were treated with a single intraperitoneal
(i.p.) insulin injection (0.1 U/kg body weight, Sigma-Aldrich, Missouri, USA) in HEPES buffer
(pH 8.2), or received a vehicle of same amount (HEPES buffer, pH 8.2) (n = 10 per group).
Blood glucose concentration was measured 30 min following the i.p. injection and for this
blood was drawn from the tail tip and determined by using a glucose monitoring device
(FreeStyle® Freedom Lite, Abbott, Germany). Transporter activities of PEPT1, SIT1 B0AT1
and SGLT1 in jejunal segments were analyzed by electrophysiological and uptake
experiments. RNA and protein amounts were determined by following the protocols
described in 2.6 and 2.10.

Material and Methods
27
2.3.3 Luminal exposure of the small intestine to high glucose
In vitro
In wild type (C57BL/6J) mice substrate-induced short-circuit currents (Isc’s) of PEPT1, SIT1
and SGLT1 were measured in the Ussing chamber before and after a luminal exposure for
30 min to a high glucose (75 mM) containing modified Krebs-Henseleit Buffer (mKHB, for
composition see Tab.4). Control measurements were conducted in wild type (C57BL/6J)
mice with mKHB containing 75 mM glucose to exclude possible osmotic effects.
Experiments following the same protocol were conducted at open-circuit voltage, given as a
calculated Ioc to assess if changes in membrane potential by short-circuiting had any effect
on the observed glucose induced changes of transporter activities.
In vivo oral glucose bolus
Uptake experiments to investigate PEPT1, GLUT2 and SGLT1 transporter activity in jejunal
everted gut rings, were conducted in twelve weeks old wild-type mice (C57/BL6J) that were
fasted for 6h and subsequently received an intragastric gavage of 20 % glucose (glucose /
kg body weight in 250 µl tap water). Control mice received a vehicle (tap water). Glucose
concentration at defined time points (30, 60 and 90 min) after the intragastric bolus was
measured from blood collected from the tail tip by using a glucose monitoring device
(FreeStyle® Freedom Lite, Abbott, Germany).

Material and Methods
28
2.3.4 Effect of diabetes on intestinal transporter function
Streptozotocin treatment
Streptozotocin (STZ) (Fig.7) is known to cause cell-death of insulin producing β-cell of
Langerhans-islets leading to a type 1 diabetes (T1D).
Figure 7 Chemical structure of Streptozotocin
A cytotoxic methylnitrosourea moiety (N-methyl-N-nitrosourea) linked to the carbon 2 of the glucose (2-deoxyglucose) molecule. The hydrophilic β-cell selective toxin is used to induce experimental T1D in animals.
Twelve week old, male wild-type (C57/BL6N) mice were separated into two groups (n = 10
per group). The diabetes group received a single high-dose i.p. injection (180 mg/kg body
weight) of Streptozotocin (STZ, Sigma-Aldrich, Missouri, USA), dissolved in 0.1 M citrate
buffer (pH 4.5). The control group received the same amount of 0.1 M citrate buffer (pH 4.5),
as a vehicle. Before injection, each mouse (unfasted) was weighted and blood glucose was
determined by collecting blood from the tail tip (FreeStyle® Freedom Lite, Abbott,
Germany). Body weight and blood glucose were monitored for the subsequent 5 days post
STZ-injection to document and ensure a proper health status and to observe the
development of hyperglycemia in the STZ-treated group.
Lengths and diameter of jejunal villi were measured and evaluated under the light
microscope (Leica, Wetzlar, Germany). Histological sections and stainings of the pancreas
were produced and evaluated. Organ weights and the length of the intestine were
measured.
Activity of transport systems of jejunal tissue segments was profiled using radiotracer
substrates (for PEPT1 and SGLT1) or electrophysiology (PEPT1, B0AT1, SIT1 and SGLT1).
Furthermore, tissue samples were used for RNA quantification (PEPT1, SGLT1,

Material and Methods
29
Glyceraldehyde-3-phosphate dehydrogenase (GAPDH) and Villin) and protein isolation
(PEPT1, SGLT1 and Villin).
2.4 Electrophysiological experiments using the Ussing chamber
In 1950, the Danish biologist Hans H. Ussing and his colleague Zerahn established a
method to determine sodium/chloride transport and the resulting current across the frog
skin, the Ussing chamber. In order to quantify the amount of transported substrate only by
active transport systems (electrogenic transporters), Ussing clamped the spontaneous
transepithelial potential (Vt), which might drive diffusion processes, to zero [122] by short-
circuiting the epithelia. The recorded short circuit current [110] allowed quantification of
substrates actively transported over the epithelia. Therefore, Ussing chambers offer studies
on transport processes of drugs, nutrients, and ions.
2.4.1 Electrophysiological principals
To obtain the electrophysiological data by Ussing chamber measurements a piece of
epithelial tissue is mounted vertically between the two chamber halves (Fig. 8). Two sets of
electrodes are connected to the chambers. Voltage sensing electrodes, placed close to the
tissue, are connected by agar bridges (3 %) to the chamber and measure the transepithelial
potential (Vt) difference. Current electrodes, placed at the outer end of the chamber,
conduct current of an external current source to the mounted tissue. Both electrode pairs
are connected to the clamp device that injects current to keep the Vt at zero (short circuit
current) thus allowing measuring the sum of active electrogenic transport processes across
the epithelium.
Change in the tissue potential difference (Δ Vt) by the application of a defined amount of
current impulse (ΔI) allows the calculation of transepithelial resistance (TER; Rt) by Ohm’s
law: R = U / I (R: resistance; U: voltage; I: current), which is an indirect measure of tissue
integrity.

Material and Methods
30
Figure 8 Schematic illustration of an Ussing chamber
The mounted epithelia (1) is vertically separating the chamber halves in the mucosal (A) and the serosal side (B). Tissue close potential electrodes (2) connected by KCl agar bridges and the current (Ag/AgCl) electrodes, which are placed at the outer chamber, used (3) for defined current entry. Inflow for selected substrates (4). Entrance for carbogen gassing (5) on the serosal side and mixture of the glass lift reservoir-containing buffer (6). Luminal (A): one-pass perfusion, serosal (B): recirculation.
Recording and analysis of all experiments was performed by a computer-based program
(Aquire and Analyze 2.3 181, Physiological Instruments, USA).
2.4.2 Electrodes
Two voltage-sensing electrodes (DRIREF-5SH, World Precision Instruments, Inc., Florida,
USA) were connected to each of the Ussing chamber sides. The 3 % agar-bridges were
prepared by heating 3 g of agar in 100 ml of 3 M KCl. The liquid agar was filled by a syringe
into the electrodes and PE tubes and were stored at 4 °C in 3 M KCl and reused until
bacterial growth was detected. The current electrodes consisted of an Ag / AgCl wire, which
was fixed in an electrode and was ready for measurement. The voltage-sensing and the
current electrodes were linked to a converter that was connected to the multichannel
voltage-current-clamp (VCC MC6, Physiological Instruments, Inc., California, USA). Before
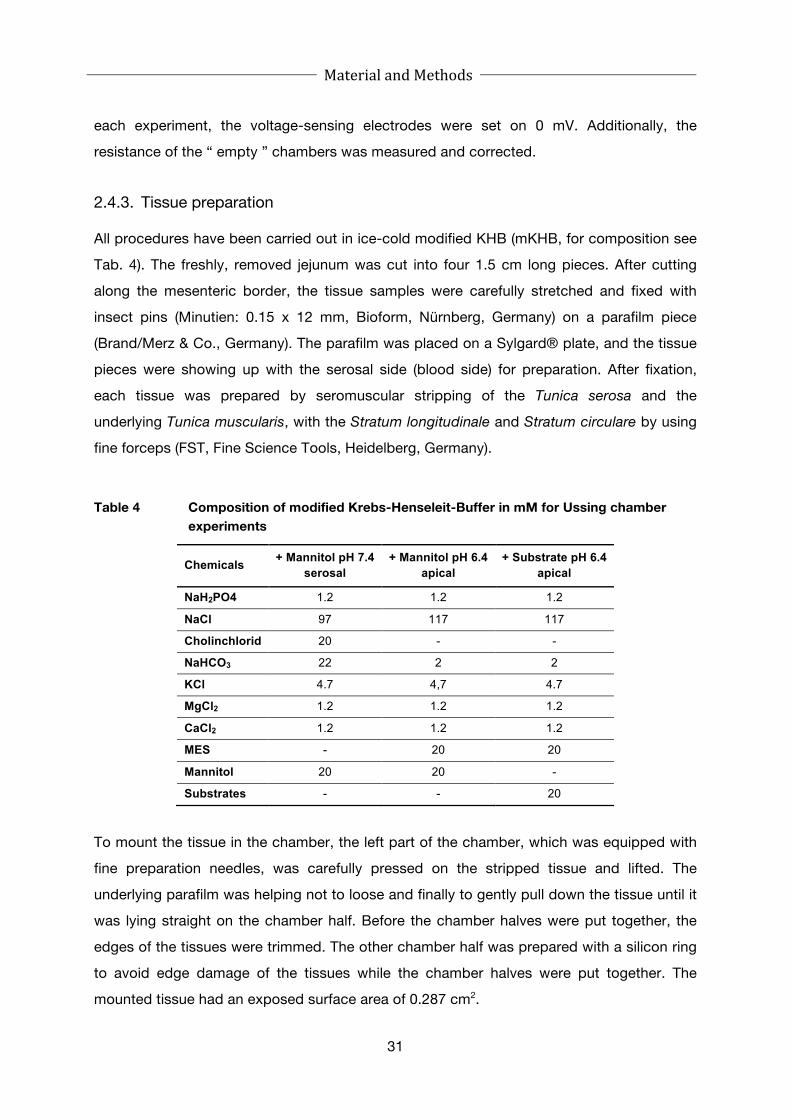
Material and Methods
31
each experiment, the voltage-sensing electrodes were set on 0 mV. Additionally, the
resistance of the “ empty ” chambers was measured and corrected.
2.4.3. Tissue preparation
All procedures have been carried out in ice-cold modified KHB (mKHB, for composition see
Tab. 4). The freshly, removed jejunum was cut into four 1.5 cm long pieces. After cutting
along the mesenteric border, the tissue samples were carefully stretched and fixed with
insect pins (Minutien: 0.15 x 12 mm, Bioform, Nürnberg, Germany) on a parafilm piece
(Brand/Merz & Co., Germany). The parafilm was placed on a Sylgard® plate, and the tissue
pieces were showing up with the serosal side (blood side) for preparation. After fixation,
each tissue was prepared by seromuscular stripping of the Tunica serosa and the
underlying Tunica muscularis, with the Stratum longitudinale and Stratum circulare by using
fine forceps (FST, Fine Science Tools, Heidelberg, Germany).
Table 4 Composition of modified Krebs-Henseleit-Buffer in mM for Ussing chamber experiments
Chemicals + Mannitol pH 7.4 serosal
+ Mannitol pH 6.4 apical
+ Substrate pH 6.4 apical
NaH2PO4 1.2 1.2 1.2
NaCl 97 117 117
Cholinchlorid 20 - -
NaHCO3 22 2 2
KCl 4.7 4,7 4.7
MgCl2 1.2 1.2 1.2
CaCl2 1.2 1.2 1.2
MES - 20 20
Mannitol 20 20 -
Substrates - - 20
To mount the tissue in the chamber, the left part of the chamber, which was equipped with
fine preparation needles, was carefully pressed on the stripped tissue and lifted. The
underlying parafilm was helping not to loose and finally to gently pull down the tissue until it
was lying straight on the chamber half. Before the chamber halves were put together, the
edges of the tissues were trimmed. The other chamber half was prepared with a silicon ring
to avoid edge damage of the tissues while the chamber halves were put together. The
mounted tissue had an exposed surface area of 0.287 cm2.

Material and Methods
32
2.4.4 Measurements
Short-circuit measurements
After mounting of the tissues, the four chambers were installed into their fixtures. Serosal
mKHB (pH 7.4, 37 °C) and mucosal mKHB (pH 6.4, 37 °C) were filled into the chambers
simultaneously, to avoid strong stretching of the tissue by differential pressure.
The tissues were clamped to a potential of 0mV and equilibration started for 20 min, while
the mucosal sides of the tissues were one-pass perfused (constantly) with mKHB at pH 6.4,
at 37 °C. The selected substrates were applied at a temperature of 37 °C to the mucosal
side of the tissues over a selecting valve for 2 min, followed by a washout period for 7
minutes. The resulting substrate-induced transport current [110] was calculated as the peak
current in the presence of substrate (Tab. 5) minus the baseline current. The resulting Isc
was defined as the degree of electrogenic transport over epithelia and was given as µA cm–
2.
Table 5 Transporters and substrates used in Ussing chamber studies
Transporter Substrates
PEPT1 Glycyl-Sarcosine (Gly-Sar)
PAT1 Glycine
SIT1 L- Proline
EAAC1 L-Glutamat
B0AT1 L-Leucine
SGLT1 D-Glucose
Open-circuit (OC) voltage
In some experiments, measurements were performed in the OC mode. Active transport of
ions from apical to serosal side was measured without the application of external current by
the current electrodes. The resulting transepithelial voltage [Ut] was calculated into short-
circuit currents by the computer program A & A 2.3. (Physiological Instruments, USA).

Material and Methods
33
2.5 Uptake experiments using radiolabeled substrates
2.5.1 Tissue preparation
Freshly removed small intestine was moisturized with ice-cold mKHB (for composition see
Tab. 6), carefully turned insight out by fixing one side to a metal rod (Ø 2 mm) and pulling
the intestine down over the rod.
Table 6 Modified KHB (in mM) used for uptake experiments in everted gut rings
After 1 h of carbogen gassing the pH of both solutions were adjusted.
Chemicals Transporter tested
PEPT1 at pH 6.4
SGLT1 at pH 7.4
NaCl 119 119
KCl 4.7 4.7
CaCl2 2.5 2.5
MgSO4 1.2 1.2
KH2PO4 1.2 1.2
NaHCO3 12.5 25
MES 22.5 -
HEPES - 10
As soon as the intestine was everted, it was placed on an ice cooled acrylic glass plate (Fig.
9). The proximal 8 rings were used to investigate PEPT1 mediated [14C] Gly-Sar (GE
Healthcare, Germany) uptake at pH 6.4, followed by the consecutive 8 rings, which were
used to study [14C] α-MDG (Hartmann, Germany) uptake at pH 7.4.

Material and Methods
34
Figure 9 Razor blade panel with everted small intestine (left) and 1 cm rings (right)
Starting at the ligament of Treitz, reflecting the junction of duodenum to jejunum, 16 cm of intestine were cut into single rings of 1 cm length (reflecting the proximal length of the jejunum). Cutting was performed by a rod with 7 razor blades, which were exactly aligned in a distance of 1 cm from center to center on a threaded rod (left).
For testing whether GLUT2 can be found in the apical membrane, [3H]-labeled 2-deoxy-D-
glucose (Hartmann, Germany) was used (at pH 6.4) with only duodenal tissue samples. To
reduce variability due to the experimental settings and the regional distribution of
transporter activity, the order of rings was strictly attended.
2.5.2 Principles of uptake experiments
Everted gut rings were incubated in 9 well plates (Becton Dickson Labware, Germany) on a
constant shaking device (Heidolph-Titrimar 100, Germany) at 37 °C. A radiolabeled solution
(the measuring solution) containing 10 µM [14C] labeled Gly-Sar and 1 mM non-labeled Gly-
Sar (1 : 100) was prepared and used to measure PEPT1 activity. An “ inhibition ” solution
was prepared, by a concentration of non-labeled Gly-Sar of 100 mM (ratio
labeled/unlabeled, 1 : 10000) to assess only uptake into tissues with full inhibition of the
transporter. For SGLT1, a substrate solution containing 1 µM of 14C-labeled α-MDG and
inhibitor-solution, containing a 10000-fold excess of unlabeled substrate was employed. 3H
labeled 2-d-D-glucose (0.19 µM) was used for GLUT2 with non-labeled substrate excess of
1 : 10000 for inhibition. All incubations were performed for 2 min and the rings were quickly
removed and placed in 3 ml of ice-cold mKHB and washed 3 times with ice-cold buffer. The
rings were carefully dried and separately placed in scintillation vials for drying over night at
50 °C.
2.5.3 Quantification
After overnight drying, tissues were solubilized in 200 µl Biosol® (National Diagnostics,
USA) for two hours on a shaking device (Heidolph-Titrimar 100, Germany) at 37 °C. After
dissolving of the rings, 10 % v/w hydrogen peroxide (H2O2) was added for discoloration and

Material and Methods
35
incubated for 1 hour. The clear solution in every vial was then spiked with 3 ml of Bioscint®
(National Diagnostics, USA) and placed in racks in the β-TriCarb™ 2810TR Scintillation
Analyzer (PerkinElmer, USA). Transporter activity was determined as the difference between
test and inhibition sample.
2.6 Intestinal RNA purification and cDNA synthesis
Small intestinal mucosa was scraped off and stored at -80 °C for RNA purification and
mRNA quantification. Briefly, samples were kept on ice and 1 ml of TRIZOL® (Invitrogen,
Karlsruhe, Germany) was added and followed by homogenizing using an Ultraturrax
(Polytron Pt1600E, Kinematic AG, Switzerland). Chloroform (Roth, Germany) was added to
each sample and centrifuged with 13.000 rpm (Eppendorf, Hamburg, Germany) for 30 min
at 4 °C. The clear phase was taken and 1 % volume of 96 % EtOH was added. For further
RNA purification, the Rneasy Mini Kit (Quiagen, Hilden, Germany) procedures were followed.
RNA concentrations were measured by NanoDrop (NanoDrop, 1000, PeqLab) and the
required amount of 5 µg RNA for reverse cDNA transcription was calculated and performed
by using the Transcriptor High Fidelity cDNA Synthesis Kit (Roche, Germany).
2.6.1 Quantitative real-time PCR
For quantitative real-time PCR 62.5 ng / µl cDNA were used per reaction and performed
using a Light Cycler (Roche, Germany). The FastStart SYBR Green Kit (Roche, Germany)
was used for quantification of the PCR products by using the product specific primers (Tab.
7).
Table 7 Transporter and housekeeping genes with corresponding primer sequences
Protein Gene Forward primer Reverse primer
PEPT1 Slc15a1 TGATCCGAAGGGCGAG GGCGAATATCACGCAG
SGLT1 Slc5a1 TACCGTTGGAGGCTTC AGATACTCCGGCATCG
GAPDH GAPDH ATCCCAGAGCTGAACG GAAGTCGCAGGAGACA
Villin Villin CTCTCGGACGGAGAAACAAG GAACACATCCTCCTCCTCCTCCA
Cycle parameters were annealing at 62 °C for 10 s, elongation at 72 °C for 10 s and melting
at 95 °C for 10 s. Melting curve analysis controlled the specificity of PCR products. The

Material and Methods
36
geometric mean of crossing points (CP) of the two housekeeping genes GAPDH and Villin
was calculated and the Bestkeeper Index was used as CP of the reference gene to calculate
and normalize the mean values of the transporter expression of the samples.
2.7 Intestinal tissue preparation
Freshly collected tissue was immediately transferred into a 4 % formalin solution (Roth,
Germany) and stored for 10-12 h on a shaking device. Until preparation, the tissue and
organ samples were stored in 70 % EtOH at 4 °C. Tissues were then dehydrated in
ascending concentrations of ethanol and xylene at 40 °C (70 % and 80 % 30 min, 2 x 95 %
45 min, 3 x 100 % 45 min and 2 x 100 % xylene 45 min). The embedding followed in
paraffin (Paraplast embedding media, Sigma Aldrich, Germany). Samples were cut in 7 µm
slices and fixed on Superfrost Plus microslides (Menzel GmbH, Germany) and dried over
night at 37 °C. Further preparation of the samples was performed by incubation steps for 2
x 5 min in 100 % Xylol for dewaxing and for dehydration in decreasing concentration of
ethanol (2 x 100 %, 96 % and 80 %). Slides were subsequently, three times washed under
running water and cooked in citrate-buffer (0.1 M citric acid, 0.1 tri-sodiumcitrate-dihydrate,
pH 6.0) for 20 min at 95 °C.
2.8 H & E staining
Tissue samples were cut in 7 µM slices after paraffin embedding. Hemalum and Eosin (H &
E) staining was used to visualize cellular nuclei in dark violet and the eosinophilic structures
of the cytosol in pink shades. The selected slices were rehydrated by the following
incubation steps (Tab. 8) and carried out at room temperature.

Material and Methods
37
Table 8 Hemalum and eosin (H & E) staining protocol for jejunal segments
Agent Time
100 % Xylol 3 min
100 % Xylol 3 min
100 % Ethanol 2 min
96 % Ethanol 2 min
80 % Ethanol 1 min
deionized water 1 min
Meyer’s Hemalum 4 min
Tap water 2 min 2 min
96 % Ethanol 0.5 min
Eosin 2 min
70 % Ethanol 1 min
96 % Ethanol 1 min
100 % Ethanol 1 min
100 % Ethanol 1.5 min
100 % Xylol 1.5 min
Slides were covered by a drop of mounting medium (DAKO fluorescent mounting medium
S3023, Dako, California, USA) and covered with a cover slip. Drying was allowed under the
hood for one day until the mounting medium was dried out completely and slides were
examined under the light microscope (Leica, Wetzlar, Germany).
2.9 Tissue changes (Villus length and diameter)
Villus length and diameter were quantified in control and diabetic mice using paraffin
embedded jejunal sections, which were treated as described above (2.7). The length was
measured from the bottom villus, at the starting region of the crypts up to the top of the
villus. Diameters were determined in the upper third of the villus part. Three animals per
group were compared (N = 17 villi) using a light microscopy with a 10 x magnification (Leica
Microsystems, Wetzlar, Germany).

Material and Methods
38
2.10 Brush border membrane (BBM) preparation
Segments of the small intestine were quickly everted by use of a metal rod and the mucosa
was scraped off by a glass slide and immediately frozen (-80 °C). Scrapings were defrosted
on ice and homogenized by Ultraturrax (Polytron, Pt1600E, Kinematic AG, Switzerland) for
30 sec in ice-cold M300 buffer (300 mM glucose, 20 mM HEPES, pH 7.4 adjusted with Tris).
Quickly 1 % protease inhibitor (Protease Inhibitor Tablets, Roche, Germany) was added to
the M300 buffer and again homogenized for 2 x 10 seconds. For BBM preparation the
MgCl2 EGTA precipitation was used. 1 M of MgCl2 and 0.416 M of EGTA was added to the
homogenate containing M300 anti-protease buffer and centrifuged for 5 min at 4 °C at 3600
rcf (Beckmann, Germany). The pellet was discarded and the supernatant was incubated for
15 min with 20 mM of MgCl2 on a mixing device on ice followed by a centrifugation step for
15 min at 4 °C at 2400 rcf. The obtained supernatant was transferred in a new tube and
again centrifuged by 32400 rcf at 4 °C for 30 min (Ultraspeed-Vacuum Centrifuge). The
pellet was resuspended in M300 buffer containing 1 % anti-protease using by a 23 G needle
and frozen in liquid nitrogen and stored at -80 °C.
2.10.1 Western blot
A BioRad protein assay (Bradford) was used to determine protein concentration. 12 µg
protein were separated by SDS-10 % PAGE followed by a transfer to a nitrocellulose
membrane in a full tank blotter (Bio-Rad Laboratories GmbH, München, Germany). After
blocking with blocking buffer (PBST: 1x PBS, 0.1 % Tween20, 1 % skim milk powder) 3 x
times for 20 min, the primary antibodies (rabbit anti-mouse PEPT1 (1 : 5000), rabbit anti-
mouseSGLT1 (1 : 5000) Pineda Antikörper Service, Germany) and goat anti-mouse Villin (1 :
1500) Santa Cruz Biosciences, Inc., USA) were added and incubated over night at 4 °C in
PBS-T additionally, containing 1 % BSA. After washing, the secondary antibodies for PEPT1
and SGLT1 (donkey anti-rabbit (1 : 12000), IRDye 680, Licor Biosciences GmbH, Germany)
and for Villin (donkey anti-goat (1 : 12000), IRDye 800, Licor Biosciences GmbH, Germany)
were added. After incubation at room temperature (2 h) and 3 x times washing with PBS,
fluorescence was detected by Odyssey Infrared Imaging System (LI-COR, Germany). For
quantification of band intensities the Odyssey V3.0 Image software was used.

Material and Methods
39
2.11 Urine osmolarity
Urine from STZ-treated T1D mice and control mice was collected each day to measure
osmilarity and samples were immediately frozen at -20 °C. To detect changes in osmolarity,
50 µl of urine of each mouse were used and analyzed by a Micro-Osmometer Type OM 806
(Vogel, Gießen, Germany).
2.12 Statistical analysis
Using GraphPad Prism 4.01 statistical analysis was performed. Unless not quoted
differently an unpaired Student’s t-test, Mann-Whitney test or a two-way ANOVA and
Bonferroni test was used to quantify statistical significance. Data are presented as mean ±
SEM.

Results
40
3. Results
3.1 Transporter activities in jejunum – comparing wild type, pept1-/+ and
pept1-/- mice
In patients suffering of Hartnup syndrome and cystinuria it was shown that the peptide
transporter delivers the critical amino acids that cannot be absorbed by the malfunction of
the amino acid transporter [145]. It was therefore reasonable to assume that in pept1-/- mice
some compensation of the loss of peptide transporter by amino acid transporters might
occur. This was expecting since the animals lacking PEPT1 did not display any distinct
phenotypic changes. To demonstrate loss of PEPT1 uptake experiments were conducted
with radiolabeled Gly-Sar as a substrate. In order to evaluate a possible compensation by
other transporter systems we performed also other functional, mainly electrophysiological
measurements in the Ussing chamber.
3.1.1 Uptake studies and Ussing chamber measurements
Uptake of Gly-Sar into jejunal tissues of wild type and PEPT1-deficient mice (Fig. 10)
demonstrates that dipeptide uptake is essentially missing in animals lacking the transporter.
Figure 10 [14C] Gly-Sar uptake into everted gut rings in wt and pept1-/- mice
Everted gut rings were prepared from proximal jejunum of wt (n = 3) and pept1-/- (n = 3) mice and incubated in 1 mM of [14C] radiolabeled Gly-Sar for 2 minutes. Statistical analysis was performed by unpaired student t-test. Data are presented as mean ± SEM (*** p < 0.001).

Results
41
Functional transport studies in the Ussing chamber were carried out in wt, pept1-/- and the
heterozygous pept1+/- mice. Transport currents were recorded for PEPT1 with Gly-Sar, for
PAT1 with glycine, for SIT1 with L-proline and for SGLT1 with D-glucose as substrates. All
substrates were added at 20 mM concentration. Jejunal segments of the different
genotypes were short-circuited and substrate-induced changes were recorded as Isc in the
Ussing chamber.
Figure 11 Representative current trace of substrate-induced Isc measured in jejunal segments of a wt and pept1-/- mouse
Measurements in one jejunal segment of a wt (black line) and pept1-/- (grey line) mouse were performed in Ussing chamber. Each substrate (20 mM) was applied for 2 min (black bar) followed by a washout period of 7 minutes.
PEPT1-mediated Gly-Sar transport was absent in pept1-/- mice (p < 0.001) when compared
to the wild type mice (Fig. 11, Tab. 9). In contrast, neither glycine transport by PAT1, L-
proline transport by SIT1 nor glucose transport by SGLT1 was significantly altered in the
pept1-/- mice, compared to wt mice (Tab. 9).

Results
42
Table 9 Substrate-induced short-circuit currents
Absolute values of substrate-induced short-circuit currents (Isc, µA cm-2) measured in wt (n = 8), pept1 +/- (n = 5) and pept1 -/- (n = 8) mice. Data presented as mean ± SEM, wt vs. pept1-/- (* p < 0.05; *** p < 0.001) and pept1-/+ vs. pept1-/- (§§§ p < 0.001; § p < 0.05).
Substrates Mouse genotype
wt pept1 +/- pept1 -/-
Gly-Sar 29 ± 10 19 ± 5 §§§ 0 ± 7 ***
Glycine 30 ± 10 23 ± 6§ 34 ± 10
L-Proline 41 ± 12 39 ± 8§ 53 ± 19
D-Glucose 93 ± 26 84 ± 23§ 111 ± 31
Although, heterozygous mice when compared to the pept1-/- mice revealed significant
changes in all transporter activities (Tab. 9) this can be attributed to a rather low variability in
currents, in homozygous animals compared to wild type these differences – except for
PEPT1 – were not found.
3.1.2 Kinetic parameters in wt, pept1-/- and sglt1-/- mice
Data on substrate affinities and maximal transport rates for PEPT1 and SGLT1 (for reference
see table 1 & 3) mostly come from cell culture studies (with or without heterologous
expression of the transporter) or from tissues of rats and mice.
We carried out transport studies in Ussing chambers to determine apparent substrate
affinities and maximal transport rates (expressed as Imax current) of the PEPT1 protein in wt
and in sglt1-/- mice and for SGLT1 in wt and pept1-/- mice (Fig. 14, 15). Apparent Km and Imax
were determined by a non-linear regression fit based on the Michaelis-Menten equation
(Y = Vmax * X / (Km + X)) of the different genotypes.
The Michaelis-Menten plot in Fig. 12 (black line) revealed an apparent Km value of 21.3 ± 2.2
mM and a Imax of 66.0 ± 2.6 µA cm-2 respectively, for PEPT1 mediated Gly-Sar transport in
wt mice. The affinity of the transporter in the sglt1-/- mice to Gly-Sar showed a Km of 22.24 ±
1.4 mM and a maximal velocity of Imax of 51.64 ± 1.31 µA cm-2 (Fig. 12, grey line), thus not
different between the two different genotypes.
Affinity studies for SGLT1 in wt mice determined an apparent Km of 13.6 ± 0.5 mM and an
Imax of 95.7 ± 1.1 µA cm-2 (Fig. 13, black line), while in the pept1-/- mice the affinity [120] of
SGLT1 to its substrate glucose was elevated up to 24.6 ± 1.0 mM.

Results
43
Figure 12 Kinetic parameters of PEPT1 in wt and sglt1-/- mice determined in Ussing chamber studies
Transport currents induced by apical Gly-Sar (1, 5, 10, 20, 35, 50 and 75 mM) were recorded at a constant osmolarity and Km and Imax were determined (wt: black line, n = 4; sglt1-/-: grey line, n = 4). Data were fitted by non-linear regression analysis to the Michaelis-Menten equation to determine Km
and Imax (mean ± SEM) using GraphPad Prism 4.0™.
The maximal velocity of the glucose transporter in the knockout mouse (pept1-/-) remained
unaffected (Imax: 104.7 ± 1.7 µA cm-2) (Fig. 13, grey line).
Figure 13 Kinetic parameters of SGLT1 in wt and pept1-/- mice determined in the Ussing chamber studies
Transport currents induced by apical D-glucose (1, 5, 10, 20, 35, 50 and 75 mM) were recorded at constant osmolarity and Km and Imax were determined (wt: black line, n = 4; pept1-/-: grey line, n = 4). Data were fitted by non-linear regression analysis to the Michaelis-Menten equation to determine Km
and Imax (mean ± SEM) using GraphPad Prism 4.0™.

Results
44
Substrate affinities and maximal transport rates of the other electrogenic transporters SIT1
and B0AT1 in wt mice revealed for SIT1 with glycine a Km value of 28.9 ± 1.9 mM and a Imax
of 51.8 ± 4.3 µA cm-2, while B0AT1 revealed a Km value of 9.5 ± 0.7 mM and a Imax value of
67.8 ± 1.3 µA cm-2 (data not shown).
3.1.3 Segmental differences in transport of PEPT1 and SGLT1
Tracer uptake studies using 1 mM Gly-Sar and 1 mM α-MDG as specific substrates for
PEPT1 and SGLT1 respectively, were performed to determine segmental activities of the
transporters along the small intestine of mice for further uptake experiments.
As shown in Fig. 14, the highest transporter activity for both, PEPT1 (a) and SGLT1 (b) was
detected in the proximal part of the small intestine (ring 6-15) with decreasing activity
towards the distal small intestine.
Figure 14 Segmental [14C] Gly-Sar and [14C] α-MDG uptake in wt mice
PEPT1 (n = 6) and SGLT1 (n = 3) activity was determined by uptake experiments of the transporter specific substrate throughout the whole length of the small intestine. Represented by the numbering on the X-axis, 3 rings each were incubated together (mean ± SEM).
For further uptake studies we decided to use rings 4-11 (indicated by the black lines, Fig. 14
a) for PEPT1 and rings 12-19 (indicated by the black lines, Fig. 14 b) for SGLT1. It became
obvious, that uptake by SGLT1 was almost twice as high when compared to Gly-Sar uptake
mediated by PEPT1.

Results
45
3.2 Influence of diet-induced obesity on transporter function
Diet-induced obesity (DIO) in mice was described to affect PEPT1-mediated transport in the
small intestine via a down-regulation of transporter mRNA and protein levels [131].
Furthermore, Caco-2 cells expressing PEPT1, SGLT1, PAT1 and B0AT1 and exposed
apically to leptin (leptin levels are increased on obese states) showed a reduced transporter
activity for all proteins [132, 133]. However transport currents of the respective proteins
have so far never been determined. Thus, effects of HF feeding (60% energy from fat) on
activities of PEPT1, PAT1, SIT1 and SGLT1 were compared to those in mice fed a control
diet (C-diet, 11% energy from fat).
3.2.1 Comparative Ussing chamber studies
Four segments of stripped jejunum of each mouse were used for Ussing chamber
measurements. The following transporter specific substrates (each 20 mM) were used to
quantify transporter activity (measured as short-circuit current, Isc), in the Ussing chamber:
Gly-Sar (PEPT1), Glycine (PAT1), L-proline (SIT1) and D-glucose (SGLT1).
As shown in Fig. 15, Ussing chamber measurements revealed a significant decrease in
transporter activity in the mice that received the HF-diet.
Figure 15 Representative current trace of electrogenic transporter activities measured in an Ussing chamber with one segment of wt mice fed a C- or HF-diet
After equilibration, transporter specific substrates (black bars) were applied for 2 min at a concentration of 20 mM and each application was followed by a 7 min washout period. Grey line: HF-diet mouse (60%), black line: C-diet mouse (9%).

Results
46
PEPT1 mediated Gly-Sar current displayed a basal activity in C-diet fed mice of 27.6 ± 5.78
µA cm-2 (Fig. 16 a), while in the HF mice showed a significant decrease of PEPT1 activity to
4.2 ± 0.58 µA cm-2 (p < 0.01).
Figure 16 Transporter activities in wt mice fed a C-diet or HF-diet
Transporter activities of (a) PEPT1 (Gly-Sar), (b) PAT1 (Glycine), (c) SIT1 (L-proline) and (d) SGLT1 (D-glucose) were measured in wt mice receiving either a C-diet (n = 5) or HF-diet (n = 5). Values of the substrate induced Isc by the selected electrogenic transporters were compared (mean ± SEM) (* p < 0.05, ** p < 0.01, *** p < 0.001).
The PAT1-mediated Isc by 20 mM glycine remained essentially unaffected by the HF-diet
(Fig. 16 b) whereas the IMINO-transport system SIT1 (Fig. 16 c) displayed a basal activity of
38.8 ± 6.2 µA cm-2 in wt mice fed the C-diet and significantly lower levels in the HF group
reduced to 21.4 ± 3 µA cm-2 (p < 0.05). Glucose-induced SGLT1-mediated Isc in wt mice on
C-diet accounted to 96.8 ± 8.2 µA cm-2 (Fig. 16 d) and was reduced to 45.0 ± 7.2 µA cm-2 in
the HF fed group (p < 0.001).

Results
47
3.3 Influence of insulin on transporter functions
Insulin was shown in Caco-2 cells to increase PEPT1 transporter activity after a short-term
(30 min) basolateral exposure to cells [106, 146] at physiological concentrations of 5 nM. In
situ, SGLT1 transporter activity was shown to be maximally reduced by the action of insulin
at a concentration of 100 nM [51]. We first assessed whether jejunal segments of wt mice
mounted in the Ussing chamber change current responses to a short term (30 min)
basolateral insulin (100 nM) exposure.
3.3.1 In vitro effects of insulin
Jejunal segments of wt (C57BL/6J) mice were freshly prepared and mounted into the
Ussing chambers. One half of the segments of each mouse were used for the insulin
incubation experiment and one half was used as a control. Transporter activities (PEPT1,
SIT1, PAT1, EAAC1 and SGLT1) were measured before and after 30 min of basolateral
insulin exposure (Fig. 17).
Figure 17 Representative current traces of electrogenic transporters recorded in Ussing chambers before and after exposure of tissues to insulin
First, basal transporter activities of PEPT1 (1: Gly-Sar), PAT1 (2: Glycine), SIT1 (3: L-proline), EAAC1 (4: L-glutamate) and SGLT1 (5: D-glucose) were measured after the 2 min application of the transporter specific substrates (indicated by the black boxes) each followed by a 7 min washout period. 100nM insulin was added to the basolateral side (indicated by the black arrow) and after 30 min all substrates were applied again to determine transporter current responses.

Results
48
In essence, none of the transporters showed any significant changes in transport currents in
response to insulin exposure of tissues as shown in Tab. 10.
Table 10 Isc (µA cm-2) responses before (basal) and after in vitro insulin treatment of tissues in Ussing chambers
Data are presented as mean ± SEM.
PEPT1 PAT1 EAAC1 SIT1 SGLT1
Basal activity
29 ± 7 (n = 10)
24 ± 6 (n = 5)
31 ± 18 (n = 2)
37 ± 8 (n = 8)
85 ± 8 (n = 9)
After insulin incubation 20 ± 2 (n = 8)
16 ± 3 (n = 5)
29 ± 10 (n = 2)
30 ± 5 (n = 6)
105 ± 11 (n = 8)
After time control 26 ± 10 (n = 5)
14 ± 3 (n = 5)
29 ± 10 (n = 2)
49 ± 22 (n = 4)
116 ± 19 (n = 5)
Other experiments with prolonged (60 min) expose times of insulin of the same
concentration did also not reveal changes in any of the electrogenic transporters (data not
shown).
3.4. Effects of in vivo insulin treatment on transporter activities
Previous studies suggested that insulin affects the peptide transporter in the intestine. This
was studied in vivo in non-diabetic male rats, treated with an i.p. injection (1U / kg bw) twice
daily, for one month [144]. In these experiments, insulin did not affect blood glucose
concentrations but decreased PEPT1 mRNA concentration without alterations in PEPT1
protein levels or transport activity. Our study was intended to show short-term (acute)
effects of insulin and thus wt mice were treated with insulin and after 30 min PEPT1 and
SGLT1 activities were analyzed.
3.4.1 Body weight and blood glucose
C57BL/6J wt mice (12 weeks) were separated in two groups (each n = 10) with one group of
animals receiving a single i.p. injection of 0.1 U / kg bw human insulin in HEPES 2-[4-(2-
hydroxyethyl)-1-piperazineethanesulfonic acid] (pH 8.4) and the control group was HEPES
injected, as a vehicle. Blood glucose concentration was measured before and 30 min after
the injection.

Results
49
Table 11 Body weight and blood glucose levels before and after i.p. injection of insulin
Data are presented as mean ± SEM (*** p < 0.001) (n = 10 each group).
Treatment Body weight (g)
Basal blood glucose (mg / dl)
After injection (mg / dl)
0.1 U/kg bw insulin 30 ± 1 126 ± 5 130 ± 9
0.1U / kg bw control 29 ± 1 126 ± 8 183 ± 7 ***
As shown in Tab. 11, all mice started out with a similar basal blood glucose concentration (n
= 20). The i.p. administration per se (HEPES) increased blood glucose levels, most likely as
a consequence of a stress-mediated release of glucose from liver glycogen that was
markedly reduced as shown in Fig. 18 by insulin administration (p < 0.001).
Figure 18 Insulin effects on blood glucose concentration
Blood glucose concentration before and after 0.1 U kg-1 bw i.p. injection of insulin (30 min). Data are normalized to the HEPES injected controls and presented as mean ± SEM (*** p < 0.001).
3.4.2. mRNA and protein concentrations of PEPT1 and SGLT1
mRNA and protein levels were determined in samples of freshly scraped mucosa of the
small intestine of the insulin treated mice, as well as of the controls. Determinations of
transporter mRNA amounts were carried out by Light Cycler measurements. Villin (actin-
binding protein) and GAPDH (glyceraldehyde-3-phosphate dehydrogenase) were chosen
and used as housekeeping genes and transporter mRNA was normalized to the chosen
reference genes.

Results
50
Figure 19 mRNA levels of PEPT1 and SGLT1 in tissues of control and insulin-treated mice
PEPT1 mRNA (a) and (b) SGLT1 mRNA content of isolated mucosal tissue. Villin and GAPDH were used as housekeeping genes and used as references for normalization of transporters mRNA amount. Data are presented as mean ± SEM (control mice: n = 5, black bar) (insulin treated mice: n = 5, grey bar).
The mRNA concentration of PEPT1 measured by qRT-PCR (Control: 0.38 ± 0.05) revealed
no significant changes when compared (Insulin: 0.55 ± 0.09) (Fig. 19 a).
Figure 20 PEPT1 and SGLT1 protein tissue levels
Western blot analysis was performed using (a) mPEPT1 antibody in control mice (black bar, n = 4) and insulin-treated mice (grey bar, n = 4), with a related ~90kDa protein band and (b) mSGLT1 antibody in control (black bar, n =4) and insulin treated mice (grey bar, n = 4). Villin (~43 kDa) was used as reference protein for analysis. Statistical analysis was performed by Mann-Whitney-test and data are presented as mean ± SEM.

Results
51
For SGLT1 also no differences in mRNA levels were found (Fig. 19 b). Western blot analysis
of PEPT1 and SGLT1 protein levels in control mice and insulin-treated mice revealed also
no significant changes in PEPT1 (Fig. 20, a) or SGLT1 (Fig. 20, b) levels in the two groups.
3.4.3 Uptake experiments
To determine PEPT1 and SGLT1 activity in control and insulin-treated mice, everted gut
rings of the proximal small intestine were used for uptake of radiolabeled substrates.
Figure 21 Transporter activities assessed in gut rings of control and insulin-treated mice
PEPT1 activity determined by [14C] Gly-Sar (a) and SGLT1 activity by [14C] α-MDG (b) uptake for 2 min in control (black bar; n = 5) and insulin-injected mice (grey bar; n = 5; mean ± SEM) (* p < 0.05).
PEPT1 activity (Fig. 21 a) was significantly decreased in the insulin-injected mice (4513 ±
414 pmol cm-1 min-1; p < 0.05) when compared to control animals (5904 ± 366 pmol cm-1
min-1).
Whereas SGLT1 transporter activity (Fig. 21 b) was not altered by insulin administration (C.:
14780 ± 1853 pmol cm-1 min-1, insulin: 14513 ± 2280 pmol cm-1 min-1).

Results
52
3.4.4 Ussing chamber measurements
A representative current trace obtained in Ussing-chambers is depicted in Fig. 24 for a
jejunal segment of either an insulin -treated, or control mouse.
Figure 22 Representative current traces of Ussing chamber measurement.
Substrate (black bars) induced Isc by the selected transporters (PEPT1 (Gly-Sar), B0AT1 (L-leucine), SIT1 (L-proline), SGLT1 (glucose)) were recorded for the insulin injected mice (grey line) and control mice (black line).
Mean values for the Isc in tissues of animals treated with insulin or HEPES are summarized
in Tab.12.
Table 12 Transporter-mediated Isc (µA cm-2) in insulin treated and control mice
Data are presented as mean ± SEM.
Treatment PEPT1 B0AT1 SIT1 SGLT1
HEPES 30.4 ± 3.9 34.8 ± 2.1 35.3 ± 4.7 78.5 ± 10.7
Insulin 29.5 ± 3.7 34.4 ± 2.2 36.0 ± 3.4 71 ± 7.7
Taken together, insulin administration in vivo led to a decrease in blood glucose levels 30
min after injection but failed to affect the intestinal transporters assessed by changes in
mRNA and protein levels or function.

Results
53
3.5 Effect of high luminal glucose on intestinal transporter function
Previous studies in rats with in situ perfusion of the small intestine suggested that high
luminal glucose levels (75 mM) as they may occur after a meal lead to a significant decrease
in apical PEPT1 protein and increase apical GLUT2 by recruiting this protein from vesicles
into the brush border membrane [79]. To mimic this condition, we performed prolonged
luminal perfusions (30 min) of jejunal segments with 75 mM glucose and assessed
transporter activity of PEPT1 and SGLT1 in Ussing chambers. Since GLUT2 is not an
electrogenic transporter, we additionally investigated GLUT2 activity under high glucose
conditions by an oral glucose tolerance test (OGGT).
3.5.1 Ussing chamber measurements before and after high glucose perfusion
To assess the response to high luminal glucose conditions (75 mM), jejunal segments of wt
mice were constantly perfused for 30 min with mKHB containing 75 mM of glucose or 75
mM mannitol, serving as osmotic control (Fig. 23). The short circuit currents induced by Gly-
Sar (PEPT1), L-proline (SIT1) and D-glucose (SGLT1) before and after the perfusion were
recorded and compared.
Figure 23 Representative current traces in Ussing chambers before and after luminal perfusion
Substrate (black bars, 1: Gly-Sar, 2: L-proline, 3: glucose) induced short-circuit currents were measured before and after 75 mM glucose (black line) or 75 mM mannitol serving as control (grey line). Substrates were again applied in the same order (black bars).

Results
54
As shown in Figure 24 a, the initially measured Gly-Sar-induced PEPT1-mediated Isc (23.8 ±
3.7 µA cm-2) revealed a significant decline to 14.3 ± 2.5 µA cm-2 after the high glucose
perfusion. The control recording did not reveal any alterations of PEPT1 activity before (23.1
± 3.2 µA cm-2) and after mannitol perfusion (22.1 ± 4.1 µA cm-2).
Figure 24 Isc responses of PEPT1, SIT1 and SGLT1 before and after 75 mM glucose perfusion
Basal transporter activities (black bars) of PEPT1 (n = 10), SGLT1 (n = 11) and SIT1 (n= 5) before the glucose or glucose (PEPT1, n = 7; SGLT1, n = 9; SIT1, n = 4) perfusion were recorded. Following the 30 min incubation of either 75 mM glucose or 75 mM mannitol, the transporter activities were determined again (grey bars). Data are presented as mean ± SEM (* p < 0.05).
The SGLT1-mediated Isc levels (Fig. 24 b) were not significantly altered by the high glucose
perfusion (114.5 ± 15.3 µA cm-2) when compared to the initially measured Isc (98.7 ± 12.4
µA cm-2). Control measurements revealed also no changes in the glucose induced Isc before

Results
55
(136.1 ± 13.9 µA cm-2) and after (94.8 ± 14.5 µA cm-2) mannitol perfusion. SIT1-mediated L-
proline currents (39.2 ± 8.6 µA cm-2) remained unaffected, as shown in Figure 24 c, by
glucose perfusion (39.4± 9.5 µA cm-2) and control values before (41.8 ± 8.4 µA cm-2) and
after (42.5 ± 14.6 µA cm-2) mannitol perfusion did not change.
Additional measurements in the open-circuit voltage mode [Voc] of jejunal segments were
performed in wt mice under high luminal glucose (75 mM). Activity of PEPT1 was
significantly reduced by the high luminal glucose perfusion, as shown by short-circuit and
open-circuit measurements (Tab. 13). Measurements of SGLT1 activity before and after high
luminal glucose revealed no changes either in the open-circuit mode or in the short-circuit
mode.
Table 13 Open-circuit current (Ioc calculated as Isc) and measured short-circuit current (Isc) of PEPT1 and SGLT1 before and after high luminal glucose perfusion
Data are presented as µA cm-2 and expressed as mean ± SEM.
Ioc calculated to Isc
PEPT1 SGLT1
Basal 59.1 ± 7.8 138.0 ± 12.8
After 75 mM glucose 35.6 ± 5.9 * 114.5 ± 15.3
Measured Isc
Basal 23.8 ± 3.7 98.7 ± 12.4
After 75 mM glucose 14.3 ± 2.5 * 114.5 ± 15.3
Control measurements did not indicate any significant effects of glucose perfusion in the
open-circuit mode (data not shown).

Results
56
3.5.2 Effect of glucose on an oral glucose bolus
Blood glucose
After an oral glucose bolus (20 % in 200 µl), blood was drawn by tail punctuation and blood
glucose levels were measured at defined time points (basal, 15, 30, 90 min).
Figure 25 Blood glucose levels after oral glucose bolus
Blood glucose was determined by tail puncture for each time point (basal, n = 9; 15 min, n = 7; 30 min, n = 4 and 90 min, n = 3) after glucose (a) or (b) tap water gavage (n = 5 per time point). Data are presented as mean ± SEM (* p < 0.05; ** p < 0.01).
Blood glucose significantly increase from 122 ± 8 mg / dl to 206 ± 21 mg / dl (p < 0.01) at 15
min and returned to 109 ± 14 mg / dl 90 min after the gavage (Fig. 25 a). The gavage itself –
by administration of water - did not change blood glucose levels (basal: 126 ± 10 mg / dl; 15
min: 139 ± 13 mg / dl; 30 min: 132 ± 19 mg / dl and 90 min: 116 ± 13 mg/ dl, Fig. 25 b).

Results
57
Figure 26 Substrate uptake rates after the oral glucose bolus
Transporter activity of (a) PEPT1 by [14C] Gly-Sar and (b) SGLT1 by [14C] α-MDG was determined at basal state (n = 9) and after 15 min (n = 7), 30 min (n = 4) and 90 min (n = 2). Data are presented as mean ± SEM.
Transporter activity of PEPT1 and SGLT1 determined in mice that received a glucose bolus
displayed no significant changes in [14C] Gly-Sar (Fig. 26 a) or [14C] α-MDG (Fig. 26 b) uptake
at any time point
Uptake studies for GLUT2 in these mice failed to detect any GLUT2 activity in the everted
gut rings with the [3H] 2-deoxy-D-glucose as a GLUT2-substate (data not shown).
3.6 Effect of glucose on intestinal transporters in STZ-induced type 1
diabetes
STZ-induced diabetes in rats was shown to dramatically increase blood glucose and to
additionally modulate PEPT1 and SGLT1 expression and function [144, 147, 148]. We
therefore tested in analogy whether STZ treatment in mice alters blood glucose, body
weight and organ / tissue and transporter function. STZ-treatment was performed by a
single high-dose i.p. injection of STZ or a vehicle (citrate buffer). Intestinal expression of
PEPT1 and SGLT1 was determined on mRNA and protein levels. Functional studies were
performed by uptake and in Ussing chambers experiments.
3.6.1 STZ-induced effects on body weight and blood glucose
Twelve weeks old male wt (C57BL/6N) mice received a single high-dose i.p. injection of STZ
(180mg / kg bw) in 0.1mol/L citrate-buffer (pH 4.5; n = 10). The control group (n = 10)
received citrate buffer as a vehicle. Body weight and blood glucose levels were determined
before injection and for the consecutive five days after STZ-injection.

Results
58
3.6.2 Body weight
Body weight of the STZ-treated mice over five days post-injection (p.i.) showed a significant
decrease. While the body weight in the control group did not change over 5 days p.i. (28 ±
1.2 g), the STZ-treated mice showed a significant loss of bodyweight over time (23.2 ± 0.9
g; p < 0.001) accounting to around 20 % (Fig. 27).
Figure 27 Body weight development over 5 days after STZ treatment
The control group (black line, n = 10) received a vehicle (0.1 M citrate buffer) injection and the STZ-treated mice (grey line, n = 10) received 180mg / kg bw Streptozotocin. Body weight was monitored over five consecutive days post injection. Statistical analysis was performed by 2-way ANOVA (* p < 0.05, ** p < 0.01, *** p < 0.001).
3.6.3 Blood glucose
Blood glucose measurements were performed by tail punctuation and measured before the
i.p. injections and continuously every day at 9:15 for the next five days. Whereas basal
blood glucose concentration of the control group (Figure 28 a) varied between 110 and 125
mg / dl glucose in STZ-treated mice (Figure 28 b), glucose concentrations here, significantly
decrease just one day post-injection from 109.2 ± 4.8 mg / dl to 65.2 ± 13.4 mg / dl, (p <
0.001). On the second day after the injection, blood glucose concentration increased to
143.9 ± 31.4 mg / dl and significantly increased further to reach 283.6 ± 41.4 mg / dl (p <
0.001) at day three, 368 ± 26.6 mg / dl (p < 0.001) at day four and 428.9 ± 20.5 mg / dl on
day five (p < 0.001).

Results
59
Figure 28 Blood glucose development over 5 days after STZ treatment
Blood glucose was determined before injection (basal) and measured every day continuously (day 1 – day 5) until day five post injection of either (a) the control (n = 10) or (b) the STZ treated mice (n = 10). Data are presented as mean ± SEM (* p < 0.05, ** p < 0.01, *** p < 0.001).
To determine the onset of the initial hypoglycemia, blood glucose concentration of the STZ-
treated mice was measured over nine hours post injection (Fig. 29). Blood glucose revealed
a significant increase from basal state, measured at 9:15 in the morning, from (104 ± 4.3 mg
/ dl) up to 181.2 ± 5.2 mg / dl (p < 0.001) three hours post STZ injection.
Figure 29 Post-injectional blood glucose measurements in STZ-treated mice
After basal blood glucose determination at 9:15, repeated measurements followed 3 h, 6 h, 9 h and 24hours post injection of STZ (n = 5). Data are presented as mean ± SEM (*** p < 0.001).
Measurements at 15:15 revealed a significant decline in blood glucose to 76.2 ± 2 mg / dl (p
< 0.001), 42.4 ± 5.7 mg / dl (p < 0.001) at 18:15 and further declined on the next day at 9:15
to 39.0 ± 4.1 mg / dl (p < 0.001, Fig. 29).

Results
60
3.6.4 Changes in tissue and organ weights in response to STZ-induced diabetes
All tissues and organs were immediately dissected from the sacrificed mice at the last day
of the experiment. As shown in Table 14 organ weights of pancreas, liver and kidney did not
change 5 days post injection in the STZ-induced T1D mice compared to the control mice.
However, muscle displayed significantly reduced organ weights in STZ-treated mice (C:
0.151 ± 0.016 g, STZ: 0.126 ± 0.004 g). Epididymal fat tissue declined from 0.29 ± 0.02 g
(control animals) to 0.06 ± 0.01 g (p < 0.001) in diabetic mice (Tab. 14).
Table 14 Tissue and organ weights of control and diabetic mice
Data are presented in gram (g) and presented as mean ± SEM (** p < 0.01; *** p < 0.001).
Tissue/ Organ weights Control Diabetic
Pancreas 0.26 ± 0.02 0.21 ± 0.02
Liver 0.30 ± 0.02 0.26 ± 0.02
Kidney 0.16 ± 0.05 0.16 ± 0.01 Thigh muscle 0.15 ± 0.02 0.13 ± 0.00**
Epididymal fat 0.29 ± 0.02 0.06 ± 0.01***
The length of the small intestine, caecum and colon of the control group (n = 5) and the
STZ-treated group (n = 5) was also determined (data not shown). The length of the small
intestine in the control group (33.4 ± 0.68 cm) did not differ when compared to the diabetic
group (34.8 ± 0.86 cm) and no changes in caecum between the two groups (C: 2.9 ± 0.19,
STZ: 2.8 ± 0.2 cm) nor in colon length (5.5 ± 0.27 versus 6.3 ± 0.37 cm) was found.

Results
61
Figure 30 Determination of mean intestinal villus length in control and diabetic mice
Determination of mean villus length in control (a, n = 3, N = 17 per mouse) and STZ-treated mice (b, n
= 3, N = 17 per mouse) based on light microscopy (10 x magnification) measurements. Data are
presented as mean ± SEM (*** p < 0.001).
Mean villus length in diabetic animals increased significantly from 324 ± 7.1 µm (controls) to
519 ± 12.7 µm as shown in Figure 30 c. Mean villus diameter did not change (data not
shown).

Results
62
3.6.5 Effects of STZ on pancreatic tissues
Histological sections of pancreatic tissue of the control and diabetic mice were obtained
(Fig. 31) and visualized by hematoxylin and eosin (H & E) staining to identify the
abnormalities in the Langerhans islets as induced by STZ.
Figure 31 Morphology of Langerhans-islet cells of pancreatic tissue of control and diabetic mice
Langerhans-islet cells in (a) control mice and (b) after diabetic mice (H & E staining, 10 x field).
Morphological changes in Langerhans-islets with cellular atrophy, accompanied by
beginning vacuolization and infiltration of lymphocytes were detected in the STZ-treated
animals (Fig. 31).
3.6.6 mRNA and protein concentrations of PEPT1 and SGLT1
Freshly scraped intestinal mucosa from both, the control group and the STZ-treated group
were used for RNA isolation. Light Cycler measurements were performed to determine
PEPT1 and SGLT1 mRNA levels (Fig. 32).
PEPT1 mRNA levels were significantly higher in tissues of STZ-treated mice (Fig. 32 a) with
a mean increase of around 52 % (p < 0.05) in case of PEPT1 and 53 % (p < 0.05) in the
case of SGLT1 (Fig. 32 b).

Results
63
Figure 32 Relative mRNA levels of PEPT1 and SGLT1 in intestine of control and diabetic mice
PEPT1 and (b) SGLT1 mRNA measured in small intestinal samples (a) of control (black bar) and diabetic mice (grey bar, each group n = 5). Villin and GAPDH were used as housekeeping genes and used as references for normalization. Data are presented as mean ± SEM (* p < 0.05).
PEPT1 and SGLT1 protein levels were determined (Fig. 33) in fresh mucosal scrapings from
the control group and the STZ-treated group by western blot analysis with 20 µg of protein
applied for each sample. Villin was used as reference protein.
Figure 33 PEPT1 and SGLT1 protein levels in intestinal tissues
Western blots analysis was performed using (a) mPEPT1 antibody in control mice (black bar, n=4) and diabetic mice (grey bar, n = 4), with a related ~ 90 - kDa protein band and (b) with an mSGLT1 antibody in control (black bar, n = 4) and diabetic mice (grey bar, n = 4). Villin (~ 43 kDa, green) was used as reference protein for analysis. Statistics was performed by Mann-Whitney-test (mean ± SEM) (* p < 0.05).

Results
64
Whereas the protein concentration of PEPT1 was significantly increased in the STZ-treated
mice (p < 0.05) when compared to control mice (Fig. 33), SGLT1 protein changes failed to
reach significance in the diabetic mice.
3.6.7 Uptake experiments in everted gut rings of control and diabetic mice
Everted gut rings and radiolabeled substrates were used, to determine PEPT1 and SGLT1
transporter activity in control and diabetic mice.
Figure 34 Transporter activities of PEPT1 and SGLT1 in control and diabetic mice
PEPT1 (a) and SGLT1 (b) activity was determined by specific uptake of radiolabeled substrates in control (black bar, n = 5) and diabetic mice (grey bar, n = 5). Data are presented as mean ± SEM.
As shown in Figure 34 (a), PEPT1 activity in control mice was 5290 ± 602 pmol cm-1 min-1
and increased significantly in the diabetic mice to 8166 ± 1435 pmol cm-1 min-1 but failed to
reach significance. SGLT1 activity (Fig. 34 b) similarly increased in diabetic mice from 10620
± 1630 pmol cm-1 min-1 (controls) to 14950 ± 1731 pmol cm-1 min-1 but also not significantly.

Results
65
3.6.8 Ussing chamber based Isc measurements in control and diabetic mice
Jejunal tissue segments of non-fasted mice were used for resistance and Isc measurements
that included PEPT1, SGLT1, B0AT1 and SIT1. Recorded tissue resistance of the selected
segments of control and diabetic mice revealed a significant increase in resistance in the
diabetic state, as shown in Fig. 35
Figure 35 Tissue resistance measured in control and T1-diabetic mice
During Isc measurements the transepithelial conductance was measured and converted in tissue resistance by the use of Ohms` law.
Substrate-induced Isc levels in control mice were comparable to those reported in Tab. 12
and 15. Diabetic mice showed a significant decrease in electrogenic transport capacity for
all transporters when compared to control mice. PEPT1 mediated transport for example was
significant reduced from 29.4 ± 2.3 µA cm-2 in controls to 16.0 ± 2.2 µA cm-2 (p < 0.01).

Results
66
Figure 36 Representative current traces of Ussing chamber measurements in control and diabetic mice
Substrate induced short-circuit currents of PEPT1 with Gly-Sar, of B0AT1 with L-leucine, of SIT1 with L-proline and of SGLT1 with D-glucose as substrates (black bars) were recorded in control (black line) and diabetic mice (grey line).
The B0AT1 mediated transport of leucine was decreased from 46.4 ± 5.8 µA cm-2 to 29.6 ±
10.1 µA cm-2 but this reduction failed to be significant.
Table 15 Substrate-induced Isc (µA cm-2) currents measured in control and diabetic mice
Data are presented as mean ± SEM (* p < 0.05; ** p < 0.01).
Treatment PEPT1 B0AT1 SIT1 SGLT1
Control 29.4 ± 2.3 46.4 ± 5.8 40.2 ± 4.8 87.0 ± 10.0
STZ 16.0 ± 2.2** 29.6 ± 10.1 16.4 ± 2.4* 43.6 ± 6.0**
SIT1 activity declined from 40.2 ± 4.8 µA cm-2 in control animals to 16.4 ± 2.4 µA cm-2 (p <
0.05) and for SGLT1 control currents accounting to 87.0 ± 10.0 µA cm-2 were reduced to
43.6 ± 6.0 µA cm-2 (p < 0.01) in STZ-treated mouse tissues.

Discussion
67
4. Discussion
Until the 1970’s it was believed that only monomers as the products of protein degradation
were absorbed in the small intestine. However, as the main products of protein hydrolysis in
the intestine, di-/ and tripeptides (80 %) were identified and it was shown that their
concentration exceeds the levels of free amino acids (AA) around 3 to 4 times [149]. This
observation stimulated studies aiming to assess whether short chain peptides can be
absorbed in intact form. A novel proton-dependent transport system was finally identified
and designated as PEPT1 [83, 84]. Transport of di-/tri-peptides derived from dietary intake
in the small intestine is accordingly believed to be mediated by this proton-coupled peptide
transporter in the apical membrane of the enterocytes. Whether transport of amino acids in
peptide-bound form is quantitatively more important than transport of the free amino acids
is still not known and the mouse model lacking PEPT1 was hoped to be able to define this
question.
The pept1-/- mouse
Studies in the nematode C. elegans lacking the corresponding peptide transporter gene
revealed a severe phenotype with an amino acid deficiency, retarded growth and
development and reduced reproduction capacity [150]. Supplementation with free amino
acids in the pept1-/- worm restored the number of progeny but had no effect on the
postembryonic development or on body size. Yet, these experiments revealed for the first
time that PEPT1 is needed and important for proper growth, development and reproduction.
Different from the results obtained in C. elegans, the mouse lacking PEPT1 [151] showed no
obvious phenotypic changes in development, body weight or fertility [152].
The aim of the present study was determine whether evidence can be found that in animals
lacking the peptide transporter changes in expression and function of other intestinal
nutrient (amino acid, sugar) transporters are compensating for the lack of a phenotype. For
these experiments we focused on electrogenic transporters that can easily be determined in
the transport capacity by currents generated in the transport cycle in Ussing chambers. In
addition, tracer uptake studies were employed to determine for example differences in
expression sites in the small intestine.
The present findings with Gly-Sar as a substrate confirmed that the deletion of PEPT1
leaves a residual transport of around 5 % , very similar to data reported by Hu et al. [151]

Discussion
68
and Ma et al. [111]. An explanation for this residual activity may be some endocytosis [111,
153] or another (unknown) transporter capable of accepting Gly-Sar as a substrate.
For possible compensating mechanisms that could provide amino acids when PEPT1 is
missing we selected amino acid transporters such as PAT1 and SIT1 and the glucose
transporter SGLT1 for comparison. Our Ussing chamber studies did not reveal any
indication for an adaptation in any of these transporters to the loss of PEPT1. Although we
only studied a few transporters Hu et al., could also not find other amino acid transporters
that showed changes in mRNA levels when PEPT1 was deleted [151] similar to our studies
by Nässl et al. [152] that did not reveal changes in mRNA levels of any amino acid
transporter in the gut nor changes in plasma amino acid levels. Interestingly, the
heterozygous mice pept1+/- displayed in the present studies a decreased substrate-induced
Isc’s of PAT1, SIT1 and SGLT1 when compared to the pept1-/- mice but not when
compared to wild type mice there was no difference and therefore these data were not
considered as relevant to follow up. Taken together, the present findings argue against a
compensation of the lack of PEPT1 in mice that could explain that animals show no
impairments. A prominent role of PEPT1 in amino acid nutrition at least under normal dietary
conditions is thus not assumed.
Since AA and glucose are the most important macronutrients absorbed in the intestine,
PEPT1 and SGLT1 have been subjects of intensive studies. While PEPT1 is a low affinity
high capacity transporter [92], SGLT1 shows the transport characteristics of a high affinity
transporter [43]. Substrate affinities of the transporters and concentration dependent
kinetics have been determined in numerous studies but mainly by using cell lines, especially
Caco-2, and membrane vesicles of various species [45, 46, 48, 50, 105, 106, 108-110].
Kinetic constants as derived here in intact tissues via Ussing chamber studies are sparse
and thus it is hard to compare our findings with those in literature.
We observed no major changes in Km or Vmax respectively maximal Isc (Imax) between mice
lacking either PEPT1 or SGLT1T. The loss of PEPT1 increased the affinity of SGLT1 for its
substrate modestly but did not change its maximal transporter capacity. What becomes
obvious is that the apparent Km values observed in our Ussing chamber studies are
markedly higher that those determined in membrane vesicles or with the respective cloned
transporters in heterologous expression systems. The apparent affinities determined in
Ussing chambers are around 10-fold lower than those found in cell systems. The most
plausible explanation for this deviation is the existence of an unstirred layer (UL) in intact
tissues [154]. Unstirred layer effects on the absorptive capacity of enterocytes have been

Discussion
69
investigated and discussed controversially. The glycocalyx of the villi entrap water and
mucin adjacent to the BBM and therefore form a stagnant layer. The UL also has a lower pH
than the bulk luminal fluid and this results in a hydrodynamic barrier [155]. However, the UL
is not equally distributed across the epithelial cells, forming different diffusion limits and is
described as vulnerable to stirring conditions [156]. This means in essence that a
comparison of kinetic constants across models even for the same transporter protein is
almost impossible as the experimental conditions overrule the affinity as defined by the
protein structure.
Do high fat diets and obesity alter PEPT1 and SGLT1 transport?
A Western diet is characterized by intake of energy-dense food and usually contained a
high-fat level. Paired with insufficient physical activity these key lifestyle parameters
determine obesity and associated diseases such as type 2 diabetes and cardiovascular
diseases. Indicators for the underlying metabolic impairments are hyperinsulinemia,
hyperlipidemia, intra-abdominal obesity and hypertension.
Besides genetic models such as the ob / ob and db / db mice, the C57BL/6J (B6) mouse
with feeding of a high fat (and high sugar) diet (HFD) represents the most frequently used
model (diet-induced obesity, DIO) as it also reveals most alterations in human obesity
syndromes [157]. In the present study we used this model with mice fed a diet providing 60
% of energy from fat. Such high fat diets change the morphology of the small intestine. We
also found that the mean villus length in the proximal small intestine was significant
increased in the HFD mice [158]. This finding confirmed data by Goda and Takase (1994)
describing that a HFD (73 % energy from fat) in rats led in the jejunum to increased height of
villi. Additionally, microvilli structure showed a reduced length and an increased diameter,
leading to a reduced absorptive surface area of microvilli per enterocyte. They also reported
a reduced total protein level in the BBM associated with decreased disaccharidase activities
[159].
Our Ussing chamber measurements in DIO mice revealed a decrease in the Isc response of
PEPT1, SIT1 and SGLT1, which may be caused by the changes in gut architecture. In a
study by Hindlet et al., HFD (38 % energy from fat) in mice caused DIO and hyperleptinemia
and the mRNA of PEPT1 was found to be reduced by 50 %, protein levels by 30 % and
dipeptide transport in jejunal loops also was reduced [131]. In contrast to our Ussing
chamber data, uptake studies employing the radiotracers failed to confirm a reduced PEPT1
Discussion
70
activity in DIO mice but displayed a reduced SGLT1 activity. One reason for this
discrepancy in the different outcomes of the Ussing chamber and uptake experiments might
be the fact that we only used jejunal segments for the electrophysiological measurements,
while mixed segments of the small intestine including duodenum, jejunum and ileum were
used for the uptake experiments. Although changes in gut morphology in obese mice may
cause these effects on the transporters, there is also evidence that leptin may be a key
regulator in these obesity-associated changes. Leptin as the ob gene product is a
multifunctional hormone produced and secreted by various tissues (placenta, brain, bone
marrow) with many peripheral acting sides. Besides regulation of body weight and
adiposity, leptin was shown to affect sugar and amino acid transport by either apical or
basolateral receptor binding and signal transduction cascades [129, 133]. Fanjul et al. (2012)
demonstrated a down-regulation of SGLT1 and B0AT1 transporter activities in Caco-2 cells
as a result of short-term apical administration of leptin and detected reduced transporter
protein levels in BBM [133]. It has been suggested that luminal leptin produced by the
gastric mucosa directly modulates SGLT1 in small intestinal BBM. In contrary, systemic
leptin was found to lead to a less pronounced decrease in SGLT1 activity that in part is
mediated by CCK [132]. Although we cannot assess whether leptin regulation is contributing
to the effects observed, those need to be seen in light of the changes in intestinal
morphology.
Is there a role of insulin in transporter regulation?
Insulin is a key regulator of metabolism that also exhibits important physiological actions on
growth of the intestine and cell proliferation [120-122]. Whether insulin directly via its
receptors also regulates intestinal transporter activity is a subject of controversy. Insulin
receptors (IR’s) were shown to be expressed on the vascular side of the intestinal epithelium
of dogs [123] and rats [125]. Human Caco-2 were shown to possess IR’s in the apical
membranes [126, 127] and studies by Thamotharan et al. (1999) in these cells suggested
insulin to act on PEPT1. Gly-Gln transport was determined in Caco-2 cells treated with 5 nM
insulin over 90 min and was shown to increase dipeptide transport [106]. The increase was
already detected after 30 min and was blocked by the addition of genistein, a tyrosine
kinase inhibitor suggesting but not proving that the effects were mediated by the insulin
receptor. Additional experiments in Caco-2 cells demonstrated also an elevation in
cephalexin uptake by PEPT1 after insulin treatment [146]. Caco-2 as cancer cells suffer
from the limitation that they are transformed and have a high expression level of IR’s and

Discussion
71
therefore are highly responsive to insulin which may not reflect the normal phenotype of
enterocytes [126]. We therefore employed intestinal tissues for assessing putative insulin
effects in in vitro and in vivo experiments.
In the in vitro studies, activities of the electrogenic transporters were measured in Ussing
chambers while insulin was added to the basolateral site of the tissue. However, no
changes in activity of the selected transporter systems were observed with the in vitro
administration of insulin. It needs to be emphasized that in these experiments the tissue is
disconnected from blood supply and from the hepatoenteral nerves which were postulated
to be involved for example in the portal insulin stimulation of glucose absorption in the small
intestine of rats [160]. To investigate insulin effects under more physiological conditions, we
administered insulin in non-diabetic mice and determined transporter responses in isolated
tissues. Although blood glucose was reduced after insulin injection (0.1U/kg body weight),
similar to previous studies [161], insulin failed to significantly affect PEPT1 and SGLT1
mRNA and protein levels but resulted in a significantly decreased PEPT1 activity in uptake
experiments while SGLT1 remained unaffected whereas Ussing chamber studies revealed
no effect on transport currents.
Der-Boghossian et al. found when using a ten times higher insulin dose than used by us that
mRNA levels of PEPT1 were significantly reduced whereas protein levels and transport
activity of PEPT1 remained unchanged [154]. Pennington et al. described an increase in
intestinal glucose uptake after insulin administration (1U / kg bodyweight) via SGLT1 [51]
and Serhan et al. (2010) demonstrated in situ an increased SGLT1 activity following insulin
treatment associated with alterations in Na+ / K+ ATPase in rat jejunum [162]. However, in
our acute experiments with insulin lasting for only 30min, we did not find any evidence for a
short-term regulation at any level of either PEPT1 or SGLT1 in intestine.
Is high luminal glucose modulating intestinal transport processes?
After a meal, intestinal luminal glucose increases to high levels. Despite the fact that SGLT1
is recognized as the most important glucose transporter in intestine, it was postulated that a
second system that it phlorizin-insensitive (in contrast to SGLT1) contributes to overall
glucose absorption when luminal concentrations exceed the capacity of SGLT1. Mace et al.
proposed in 2009 based on their in vivo and in vitro studies in rats, that at luminal glucose
concentrations of > 75 mM GLUT2 proteins are recruited into the apical membrane of
enterocytes [79] to allow as an uniporter high glucose influx. They also demonstrated that

Discussion
72
simultaneously to the insertion of GLUT2 into apical membranes PEPT1 was retrieved from
the apical membrane at high luminal glucose. Mace et al. described the decrease of PEPT1
density as dependent on the PKC isoform βII, which in turn for activation depends on an
increase in intracellular Ca2+. The Ca2+ increase was accomplished by opening of apical
voltage dependent calcium channels (Cav1.3) initiated by the membrane depolarizing action
of SGLT1. Morgan et al. (2007) reported an influx of Ca2+ by membrane depolarization
through SGLT1 activity as the initial intracellular signal for the PKC βII-dependent GLUT2
recruitment [78] and this was shown to depend on cytoskeleton rearrangements, like
contractions of myosin II in the terminal web [77]. These studies collectively pointed to a
prime role of cytosolic Ca2+ changes in a reciprocal regulation of PEPT1 and GLUT2.
That PEPT1 activity in epithelial cells is altered via changes in intracellular Calcium has been
observed in other studies and models. Brandsch et al. already in 1994 showed PEPT1
expression and activity to be significantly decreased by the treatment of Caco-2 cells with
different phorbol esters (PMA, Pbu) that activate PKC. Additionally they showed that the
presence of staurosporine, a PKC inhibitor, increased PEPT1 mediated Gly-Sar uptake
[163]. Besides PKC, changes in intracellular calcium (Ca2+) regulating PEPT1 activity, was
shown by Wenzel et al. (2002), in Caco-2 cells. The application of nifedipine, a Ca2+ channel
blocker increased PEPT1-mediated transport, whereas ionomycin, a ionophore that
increases intracellular Ca2+ concentration, induced a significant decrease in PEPT1
mediated uptake in Caco-2 cells [109].
We also observed that PEPT1 activity was decreased when the protein kinase C (PKC)
activator Pbu (1 µM) was added for 30 min to the serosal side of the tissues in Ussing
chambers (data not shown) suggesting that PKC activity may also regulate PEPT1 in mouse
intestine. Similarly, ionomycin (data not shown) effects were observed in uptake studies with
the radiotracers in everted gut rings.
When tissues in Ussing chambers were perfused with a high (75 mM) luminal glucose
concentration under short-circuit and open voltage conditions a significantly reduced
PEPT1 activity was observed while SIT1 and SGLT1 remained unaffected. In this respect we
observed an effect according to the model by Mace et al. in which GLUT2 moves into the
apical membrane while PEPT1 is retrieved [79]. If this would be the case also in mice, we
should have observed a similar effect also in the radiotracer flux in the everted tissue
showing a decline of Gly-Sar influx and an increase in glucose uptake attributed to GLUT2
but we could not find such effects. We therefore also conducted in vivo studies in which
mice were submitted to an OGTT followed by uptake experiments in gut rings using a

Discussion
73
GLUT2-specific substrate. However, all these studies failed to detect any GLUT2 activity in
apical membranes. A possible explanation for the lack of an effect could be that the
retention time of GLUT2 in the apical membrane was described as very short by a fast
internalization (t1/2 ~ 3.5 min) [164]. Thus, the time necessary for tissue preparation in our
studies may have been too long to be able to observe GLUT2 activity and PEPT1 decrease.
Even after changes in the experimental protocol (oral communication by Prof. Georg Kellet)
by exposing the tissues to 75 mM glucose until incubation did not lead to any GLUT2
activity or an expected reciprocal decrease in PEPT1 activity. The observation by Stümpel
et al. (2001) that the absorbed amount of glucose after an OGTT remained the same in mice
lacking GLUT2 [165] raises the question, whether such a glucose-induced (high luminal
glucose concentrations) GLUT2 insertion in the BBM might be species-dependent and only
found in rats. The decreased electrogenic PEPT1 activity found in Ussing chambers when
perfused with high glucose but not observed in gut rings in tracer studies or after an OGTT
remains currently unexplained. Changes in membrane voltage or pH effects can essentially
be ruled out as SGLT1 and PAT1 did not show any changes and both are dependent on
these driving forces.
Are transporter activities altered in STZ-induced type 1 diabetes?
Type 1 diabetes (T1D) in laboratory animals is usually imposed by Streptozotocin (STZ)
treatment via injections of various doses and variable frequencies [57-59, 108, 142-144,
148, 160, 166-172]. STZ is β-cell toxic and its uptake into ß-cells depends on GLUT2. It is a
nitrosourea analogue linked to the carbon-2 of a hexose and acts via DNA alkylation in
GLUT2 expressing cells in pancreas but also in liver and kidney [173].
We used a single high dose injection as described for BALB/c mice [148] leading to a
dramatic increase in blood glucose within 5 days after STZ injection. However, initially, a
dramatic drop in blood glucose was detected beginning three hours after STZ injection and
lasting for 24 h before the hyperglycemia developed. This decline in blood glucose was
most likely caused by a massive release of insulin into circulation as a result of ß-cell
necrosis [174]. Our hematoxylin stainings of the Langerhans-islets, 5 days after STZ-
injection, revealed atrophy, vacuolization and infiltrations with lymphocytes as described by
others [166, 167, 175]. We also observed a glycosuria as a characteristic feature in the early
phase of diabetes mellitus and accompanied by osmotic diuresis, glomerular hyperfiltration
and polyuria [176]. Diabetic mice also showed a significant reduction in body weight over
time with a major loss of pad fats or epididymal fat depots by excessive lipolysis [128] in

Discussion
74
addition to a reduction in muscle mass [177]. These changes were associated with changes
in plasma metabolites such as in branched-chain amino acids, intermediates of the urea
cycle, ketogenic amino acids and gluconeogenic amino acids, such as threonine, proline
and histidine (oral communication Pieter Giesbertz). These plasma metabolite changes are
similar to those reported for humans and rabbits suffering from type 1 diabetes and in
humans with type 2 diabetes [178, 179].
T1D effects on the gastrointestinal tract are described by delayed stomach to caecum
transit time and slower propagation of myoelectric activity, as a result of changed glucagon
and insulin concentrations and due to an increased intestinal length [142]. We were not able
to detect any changes in the length of the small intestine, caecum or colon in the STZ-
treated animals. However, villus morphology in jejunum changed and revealed that villus
length was significantly increased in diabetic animals. Increased villus length was postulated
to be a result of hyperplasia and/or hypertrophy of the intestinal epithelial cells [57, 58] and
GLP-2 has been described as to affect primarily villus length [46, 180].
T1D was reported to markedly reduce intestinal transporter expression and impair
regulation [59, 148, 170]. In the present study we examined PEPT1 and SGLT1 by profiling
mRNA and protein expression levels and determined functional activity. In case of SGLT1
only the mRNA was increased but not protein level or function. In case of PEPT1, we
observed an increase in mRNA and protein levels and increased tracer-based influx. This
finding is in line with some reported that found PEPT1 mRNA and protein levels to increase
while others show increased mRNA levels but a decrease in protein and transport activity
[108, 144]. However, these studies are generally very difficult to compare with some groups
carry out short-term experiments (analysis 96 h post injection) [108, 143] while other look at
long-term effects (experiments up to 1 month post injection) [144] and moreover, all these
studies were performed in rats.
Electrical measurements of transport activity of PEPT1, SIT1 and SGLT1 in Ussing
chambers revealed for all proteins a significantly reduced activity. Initial transepithelial
membrane potentials did not differ between tissues from control and T1D animals but tissue
resistance was significant higher in diabetic mice indicating a reduced conductance. Only a
few studies have been conducted with Ussing chamber measurements of tissues from STZ-
treated animals - mostly from long-term treatment [169, 181, 182]. Perdue and Davidson
(1988) found the mucosa of long-term STZ-treated rats to be thicker and the conductance
of the tissue to be significantly lower [181]. The increase of thickness could account for an
increased resistance as a consequence of the decreased conductance and is mirrored in

Discussion
75
the increase in villus length for example that we observed here. The lower conductance
however could also originate from a reduced density of ion-conducting proteins like
channels or by effects on Na+ / K+ ATPase that changes in expression and catalytic activity
in T1D [183, 184]. Since all electrogenic transporters – regardless of their function and
specificity displayed a reduced Isc response, it is likely that changes in Na+ / K+ ATPase in
T1D are causative. However, we can also not exclude that STZ that is transported via
GLUT2 into cells enters epithelial cells in the intestine from the basolateral side causes cell
dysfunctions. Findings on changes in Na+/K+-ATPase activity in the intestine of STZ-induced
diabetic rodents mainly describe an increase in activity for the enzyme [184-186].
Since we did not determine Na+ / K+ ATPase activity nor expression levels in the intestine of
STZ-treated mice, it remains speculative to propose that such changes may cause all
electrogenic transporters to decrease in activity in type 1 diabetes.
Taken together, all studies described here that utilized primarily Ussing chambers to assess
changes in electrogenic transporter expression in animals lacking PEPT1 or in animals
treated with insulin or high fat diets did not reveal major alterations. Only in diabetic mice
major reductions in transporter currents were observed and it is speculated that those arise
by impairments in the driving forces and linked to Na+ / K+ ATPase.

References
76
References
1. Westheide, W.u.R., R., Spezielle Zoologie Teil 1: Einzeller und Wirbellose Tiere, ed. W.u.R. Westheide, R. Vol. 1. 2004, München: Spektrum Akademischer Verlag.
2. Müller, W.F., S., Die Grundversorgung: Gehalt und Aufbereitung der Nahrung, in Tier- und Humanphysiologie, W.u.F.S. Müller, Editor. 2007, Springer Verlag: Heidelberg. p. 1-657.
3. Hildebrand, M. and G.J. Gloslow, Vergleichende und funktionelle Anantomie der Wirbeltiere. 5 ed. 2004, Berlin, Heidelberg: Springer Berlin Heidelberg.
4. Levin, R.J., Digestion and absorption of carbohydrates--from molecules and membranes to humans. Am J Clin Nutr, 1994. 59(3 Suppl): p. 690S-698S.
5. Eckert, R., Burggren, W., French, K., Randall, D., Membranen: Barrieren und selektiver Transport, in Tierphysiologie. 2002, Thieme Verlag, Stuttgart.
6. Clauss, W.C., C., Tierphysiologie kompakt. 1 ed. 2007, München: Spektrum Akademischer Verlag.
7. Lynch, A.M. and J.D. McGivan, Evidence for a single common Na+-dependent transport system for alanine, glutamine, leucine and phenylalanine in brush-border membrane vesicles from bovine kidney. Biochim Biophys Acta, 1987. 899(2): p. 176-84.
8. Kleta, R., et al., Mutations in SLC6A19, encoding B0AT1, cause Hartnup disorder. Nat Genet, 2004. 36(9): p. 999-1002.
9. Seow, H.F., et al., Hartnup disorder is caused by mutations in the gene encoding the neutral amino acid transporter SLC6A19. Nat Genet, 2004. 36(9): p. 1003-7.
10. Kristensen, A.S., et al., SLC6 neurotransmitter transporters: structure, function, and regulation. Pharmacol Rev. 63(3): p. 585-640.
11. Curran, P.F., et al., Kinetic relations of the Na-amino acid interaction at the mucosal border of intestine. J Gen Physiol, 1967. 50(5): p. 1261-86.
12. Bohmer, C., et al., Characterization of mouse amino acid transporter B0AT1 (slc6a19). Biochem J, 2005. 389(Pt 3): p. 745-51.
13. Broer, S., The role of the neutral amino acid transporter B0AT1 (SLC6A19) in Hartnup disorder and protein nutrition. IUBMB Life, 2009. 61(6): p. 591-9.
14. Sepulveda, F.V. and M.W. Smith, Discrimination between different entry mechanisms for neutral amino acids in rabbit ileal mucosa. J Physiol, 1978. 282: p. 73-90.
15. Wu, G., Intestinal mucosal amino acid catabolism. J Nutr, 1998. 128(8): p. 1249-52.
16. Takanaga, H., et al., Identification of mammalian proline transporter SIT1 (SLC6A20) with characteristics of classical system imino. J Biol Chem, 2005. 280(10): p. 8974-84.

References
77
17. Stevens, B.R. and E.M. Wright, Kinetics of the intestinal brush border proline (Imino) carrier. J Biol Chem, 1987. 262(14): p. 6546-51.
18. Broer, A., et al., Sodium translocation by the iminoglycinuria associated imino transporter (SLC6A20). Mol Membr Biol, 2009. 26(5): p. 333-46.
19. Kowalczuk, S., et al., Molecular cloning of the mouse IMINO system: an Na+- and Cl--dependent proline transporter. Biochem J, 2005. 386(Pt 3): p. 417-22.
20. Munck, B.G., Transport of imino acids and non-alpha-amino acids across the brush-border membrane of the rabbit ileum. J Membr Biol, 1985. 83(1-2): p. 15-24.
21. Boll, M., H. Daniel, and B. Gasnier, The SLC36 family: proton-coupled transporters for the absorption of selected amino acids from extracellular and intracellular proteolysis. Pflugers Arch, 2004. 447(5): p. 776-9.
22. Thwaites, D.T. and C.M. Anderson, The SLC36 family of proton-coupled amino acid transporters and their potential role in drug transport. Br J Pharmacol, 2011. 164(7): p. 1802-16.
23. Frommer, W.B., S. Hummel, and J.W. Riesmeier, Expression cloning in yeast of a cDNA encoding a broad specificity amino acid permease from Arabidopsis thaliana. Proc Natl Acad Sci U S A, 1993. 90(13): p. 5944-8.
24. Russnak, R., D. Konczal, and S.L. McIntire, A family of yeast proteins mediating bidirectional vacuolar amino acid transport. J Biol Chem, 2001. 276(26): p. 23849-57.
25. Sagne, C., et al., Identification and characterization of a lysosomal transporter for small neutral amino acids. Proc Natl Acad Sci U S A, 2001. 98(13): p. 7206-11.
26. Boll, M., et al., Functional characterization of two novel mammalian electrogenic proton-dependent amino acid cotransporters. J Biol Chem, 2002. 277(25): p. 22966-73.
27. Anderson, C.M., et al., H+/amino acid transporter 1 (PAT1) is the imino acid carrier: An intestinal nutrient/drug transporter in human and rat. Gastroenterology, 2004. 127(5): p. 1410-22.
28. Chen, Z., et al., Structure, function and immunolocalization of a proton-coupled amino acid transporter (hPAT1) in the human intestinal cell line Caco-2. J Physiol, 2003. 546(Pt 2): p. 349-61.
29. Foltz, M., et al., A novel bifunctionality: PAT1 and PAT2 mediate electrogenic proton/amino acid and electroneutral proton/fatty acid symport. FASEB J, 2004. 18(14): p. 1758-60.
30. Thwaites, D.T., et al., Gamma-Aminobutyric acid (GABA) transport across human intestinal epithelial (Caco-2) cell monolayers. Br J Pharmacol, 2000. 129(3): p. 457-64.
31. Anderson, C.M., et al., Taurine uptake across the human intestinal brush-border membrane is via two transporters: H+-coupled PAT1 (SLC36A1) and Na+- and Cl(-)-dependent TauT (SLC6A6). J Physiol, 2009. 587(Pt 4): p. 731-44.
References
78
32. Wright, E.M. and E. Turk, The sodium/glucose cotransport family SLC5. Pflugers Arch, 2004. 447(5): p. 510-8.
33. Hediger, M.A., et al., The ABCs of solute carriers: physiological, pathological and therapeutic implications of human membrane transport proteinsIntroduction. Pflugers Arch, 2004. 447(5): p. 465-8.
34. Hirayama, B.A., et al., Kinetic and specificity differences between rat, human, and rabbit Na+-glucose cotransporters (SGLT-1). Am J Physiol, 1996. 270(6 Pt 1): p. G919-26.
35. Wright, E.M., et al., Regulation of Na+/glucose cotransporters. J Exp Biol, 1997. 200(Pt 2): p. 287-93.
36. Hirsch, J.R., D.D. Loo, and E.M. Wright, Regulation of Na+/glucose cotransporter expression by protein kinases in Xenopus laevis oocytes. J Biol Chem, 1996. 271(25): p. 14740-6.
37. Tyagi, N.K., et al., A biophysical glance at the outer surface of the membrane transporter SGLT1. Biochim Biophys Acta, 2011. 1808(1): p. 1-18.
38. Crane, R.K., Intestinal absorption of glucose. Biomembranes, 1974. 4A(0): p. 541-53.
39. Thorens, B., et al., Cloning and functional expression in bacteria of a novel glucose transporter present in liver, intestine, kidney, and beta-pancreatic islet cells. Cell, 1988. 55(2): p. 281-90.
40. Thorens, B., Molecular and cellular physiology of GLUT-2, a high-Km facilitated diffusion glucose transporter. Int Rev Cytol, 1992. 137: p. 209-38.
41. Fukumoto, H., et al., Sequence, tissue distribution, and chromosomal localization of mRNA encoding a human glucose transporter-like protein. Proc Natl Acad Sci U S A, 1988. 85(15): p. 5434-8.
42. Hediger, M.A., et al., Expression cloning and cDNA sequencing of the Na+/glucose co-transporter. Nature, 1987. 330(6146): p. 379-81.
43. Takata, K., Glucose transporters in the transepithelial transport of glucose. J Electron Microsc (Tokyo), 1996. 45(4): p. 275-84.
44. Debnam, E.S. and R.J. Levin, An experimental method of identifying and quantifying the active transfer electrogenic component from the diffusive component during sugar absorption measured in vivo. J Physiol, 1975. 246(1): p. 181-96.
45. Brot-Laroche, E., et al., Temperature sensitivity and substrate specificity of two distinct Na+-activated D-glucose transport systems in guinea pig jejunal brush border membrane vesicles. J Biol Chem, 1986. 261(14): p. 6168-76.
46. Cheeseman, C.I., Upregulation of SGLT-1 transport activity in rat jejunum induced by GLP-2 infusion in vivo. Am J Physiol, 1997. 273(6 Pt 2): p. R1965-71.
47. Kellett, G.L. and P.A. Helliwell, The diffusive component of intestinal glucose absorption is mediated by the glucose-induced recruitment of GLUT2 to the brush-border membrane. Biochem J, 2000. 350 Pt 1: p. 155-62.

References
79
48. Mate, A., et al., Regulation of sodium-glucose cotransporter SGLT1 in the intestine of hypertensive rats. Am J Physiol Regul Integr Comp Physiol, 2006. 291(3): p. R760-7.
49. Yang, C., et al., Apical Na+-D-glucose cotransporter 1 (SGLT1) activity and protein abundance are expressed along the jejunal crypt-villus axis in the neonatal pig. Am J Physiol Gastrointest Liver Physiol, 2011. 300(1): p. G60-70.
50. Zheng, Y., et al., Mechanisms of glucose uptake in intestinal cell lines: role of GLUT2. Surgery, 2012. 151(1): p. 13-25.
51. Pennington, A.M., C.P. Corpe, and G.L. Kellett, Rapid regulation of rat jejunal glucose transport by insulin in a luminally and vascularly perfused preparation. J Physiol, 1994. 478 ( Pt 2): p. 187-93.
52. Cheeseman, C.I. and R. Tsang, The effect of GIP and glucagon-like peptides on intestinal basolateral membrane hexose transport. Am J Physiol, 1996. 271(3 Pt 1): p. G477-82.
53. Hirsh, A.J. and C.I. Cheeseman, Cholecystokinin decreases intestinal hexose absorption by a parallel reduction in SGLT1 abundance in the brush-border membrane. J Biol Chem, 1998. 273(23): p. 14545-9.
54. Banerjee, A.K., K. Raja, and T.J. Peters, Effect of insulin induced hypoglycaemia on in vitro uptake of 3-O-methylglucose by rat jejunum. Gut, 1989. 30(10): p. 1348-53.
55. Osswald, C., et al., Mice without the regulator gene Rsc1A1 exhibit increased Na+-D-glucose cotransport in small intestine and develop obesity. Mol Cell Biol, 2005. 25(1): p. 78-87.
56. Kellett, G.L., The facilitated component of intestinal glucose absorption. J Physiol, 2001. 531(Pt 3): p. 585-95.
57. Fedorak, R.N., et al., Altered glucose carrier expression: mechanism of intestinal adaptation during streptozocin-induced diabetes in rats. Am J Physiol, 1991. 261(4 Pt 1): p. G585-91.
58. Debnam, E.S., et al., The effects of streptozotocin diabetes on sodium-glucose transporter (SGLT1) expression and function in rat jejunal and ileal villus-attached enterocytes. Pflugers Arch, 1995. 430(2): p. 151-9.
59. Wong, T.P., E.S. Debnam, and P.S. Leung, Diabetes mellitus and expression of the enterocyte renin-angiotensin system: implications for control of glucose transport across the brush border membrane. Am J Physiol Cell Physiol, 2009. 297(3): p. C601-10.
60. Yoshikawa, T., et al., Comparative expression of hexose transporters (SGLT1, GLUT1, GLUT2 and GLUT5) throughout the mouse gastrointestinal tract. Histochem Cell Biol, 2011. 135(2): p. 183-94.
61. Hwang, E.S., B.A. Hirayama, and E.M. Wright, Distribution of the SGLT1 Na+/glucose cotransporter and mRNA along the crypt-villus axis of rabbit small intestine. Biochem Biophys Res Commun, 1991. 181(3): p. 1208-17.

References
80
62. Kanai, Y., et al., The human kidney low affinity Na+/glucose cotransporter SGLT2. Delineation of the major renal reabsorptive mechanism for D-glucose. J Clin Invest, 1994. 93(1): p. 397-404.
63. Wright, E.M., Renal Na(+)-glucose cotransporters. Am J Physiol Renal Physiol, 2001. 280(1): p. F10-8.
64. Gribble, F.M., et al., A novel glucose-sensing mechanism contributing to glucagon-like peptide-1 secretion from the GLUTag cell line. Diabetes, 2003. 52(5): p. 1147-54.
65. Parker, H.E., et al., Nutrient-dependent secretion of glucose-dependent insulinotropic polypeptide from primary murine K cells. Diabetologia, 2009. 52(2): p. 289-98.
66. Martin, M.G., et al., Defects in Na+/glucose cotransporter (SGLT1) trafficking and function cause glucose-galactose malabsorption. Nat Genet, 1996. 12(2): p. 216-20.
67. Wright, E.M., et al., Molecular genetics of intestinal glucose transport. J Clin Invest, 1991. 88(5): p. 1435-40.
68. Wu, X. and H.H. Freeze, GLUT14, a duplicon of GLUT3, is specifically expressed in testis as alternative splice forms. Genomics, 2002. 80(6): p. 553-7.
69. Joost, H.G., et al., Nomenclature of the GLUT/SLC2A family of sugar/polyol transport facilitators. Am J Physiol Endocrinol Metab, 2002. 282(4): p. E974-6.
70. Joost, H.G. and B. Thorens, The extended GLUT-family of sugar/polyol transport facilitators: nomenclature, sequence characteristics, and potential function of its novel members (review). Mol Membr Biol, 2001. 18(4): p. 247-56.
71. Orci, L., et al., Localization of the pancreatic beta cell glucose transporter to specific plasma membrane domains. Science, 1989. 245(4915): p. 295-7.
72. Johnson, J.H., et al., The high Km glucose transporter of islets of Langerhans is functionally similar to the low affinity transporter of liver and has an identical primary sequence. J Biol Chem, 1990. 265(12): p. 6548-51.
73. Uldry, M., et al., GLUT2 is a high affinity glucosamine transporter. FEBS Lett, 2002. 524(1-3): p. 199-203.
74. Jorns, A., M. Tiedge, and S. Lenzen, Nutrient-dependent distribution of insulin and glucokinase immunoreactivities in rat pancreatic beta cells. Virchows Arch, 1999. 434(1): p. 75-82.
75. Kellett, G.L. and E. Brot-Laroche, Apical GLUT2: a major pathway of intestinal sugar absorption. Diabetes, 2005. 54(10): p. 3056-62.
76. Zhao, F.Q. and A.F. Keating, Functional properties and genomics of glucose transporters. Curr Genomics, 2007. 8(2): p. 113-28.
77. Mace, O.J., et al., Calcium absorption by Cav1.3 induces terminal web myosin II phosphorylation and apical GLUT2 insertion in rat intestine. J Physiol, 2007. 580(Pt. 2): p. 605-16.

References
81
78. Morgan, E.L., et al., Apical GLUT2 and Cav1.3: regulation of rat intestinal glucose and calcium absorption. J Physiol, 2007. 580(Pt. 2): p. 593-604.
79. Mace, O.J., et al., An energy supply network of nutrient absorption coordinated by calcium and T1R taste receptors in rat small intestine. J Physiol, 2009. 587(Pt 1): p. 195-210.
80. Valera, A., et al., Expression of GLUT-2 antisense RNA in beta cells of transgenic mice leads to diabetes. J Biol Chem, 1994. 269(46): p. 28543-6.
81. Guillam, M.T., et al., Early diabetes and abnormal postnatal pancreatic islet development in mice lacking Glut-2. Nat Genet, 1997. 17(3): p. 327-30.
82. Thorens, B., et al., Transgenic reexpression of GLUT1 or GLUT2 in pancreatic beta cells rescues GLUT2-null mice from early death and restores normal glucose-stimulated insulin secretion. J Biol Chem, 2000. 275(31): p. 23751-8.
83. Adibi, S.A., Intestinal transport of dipeptides in man: relative importance of hydrolysis and intact absorption. J Clin Invest, 1971. 50(11): p. 2266-75.
84. Adibi, S.A. and M.R. Soleimanpour, Functional characterization of dipeptide transport system in human jejunum. J Clin Invest, 1974. 53(5): p. 1368-74.
85. Adibi, S.A. and E.L. Morse, The number of glycine residues which limits intact absorption of glycine oligopeptides in human jejunum. J Clin Invest, 1977. 60(5): p. 1008-16.
86. Adibi, S.A., et al., Evidence for two different modes of tripeptide disappearance in human intestine. Uptake by peptide carrier systems and hydrolysis by peptide hydrolases. J Clin Invest, 1975. 56(6): p. 1355-63.
87. Ganapathy V. and Leibach F.H., Is intestinal peptide transport energized by a proton gradient? Am J Physiol, 1985. 249: p. 153-60.
88. Ganapathy, V. and F.H. Leibach, Role of pH gradient and membrane potential in dipeptide transport in intestinal and renal brush-border membrane vesicles from the rabbit. Studies with L-carnosine and glycyl-L-proline. J Biol Chem, 1983. 258(23): p. 14189-92.
89. Ganapathy, V., G. Burckhardt, and F.H. Leibach, Characteristics of glycylsarcosine transport in rabbit intestinal brush-border membrane vesicles. J Biol Chem, 1984. 259(14): p. 8954-9.
90. Thwaites, D.T. and C.M. Anderson, H+-coupled nutrient, micronutrient and drug transporters in the mammalian small intestine. Exp Physiol, 2007. 92(4): p. 603-19.
91. He, L., K. Vasiliou, and D.W. Nebert, Analysis and update of the human solute carrier (SLC) gene superfamily. Hum Genomics, 2009. 3(2): p. 195-206.
92. Rubio-Aliaga, I. and H. Daniel, Mammalian peptide transporters as targets for drug delivery. Trends Pharmacol Sci, 2002. 23(9): p. 434-40.
93. Daniel, H., et al., From bacteria to man: archaic proton-dependent peptide transporters at work. Physiology (Bethesda), 2006. 21: p. 93-102.

References
82
94. Urtti, A., S.J. Johns, and W. Sadee, Genomic structure of proton-coupled oligopeptide transporter hPEPT1 and pH-sensing regulatory splice variant. AAPS PharmSci, 2001. 3(1): p. E6.
95. Fei, Y.J., et al., Identification of the histidyl residue obligatory for the catalytic activity of the human H+/peptide cotransporters PEPT1 and PEPT2. Biochemistry, 1997. 36(2): p. 452-60.
96. Bossi, E., et al., Residues R282 and D341 act as electrostatic gates in the proton-dependent oligopeptide transporter PepT1. J Physiol, 2008. 589(Pt 3): p. 495-510.
97. Rubio-Aliaga, I. and H. Daniel, Peptide transporters and their roles in physiological processes and drug disposition. Xenobiotica, 2008. 38(7-8): p. 1022-42.
98. Chen, X.Z., A. Steel, and M.A. Hediger, Functional roles of histidine and tyrosine residues in the H(+)-peptide transporter PepT1. Biochem Biophys Res Commun, 2000. 272(3): p. 726-30.
99. Terada, T. and K. Inui, Gene expression and regulation of drug transporters in the intestine and kidney. Biochem Pharmacol, 2007. 73(3): p. 440-9.
100. Kennedy, D.J., et al., Optimal absorptive transport of the dipeptide glycylsarcosine is dependent on functional Na+/H+ exchange activity. Pflugers Arch, 2002. 445(1): p. 139-46.
101. Chen, M., et al., Gene ablation for PEPT1 in mice abolishes the effects of dipeptides on small intestinal fluid absorption, short-circuit current, and intracellular pH. Am J Physiol Gastrointest Liver Physiol, 2010. 299(1): p. G265-74.
102. Lee, V.H., J.L. Sporty, and T.E. Fandy, Pharmacogenomics of drug transporters: the next drug delivery challenge. Adv Drug Deliv Rev, 2001. 50 Suppl 1: p. S33-40.
103. Doring, F., et al., Minimal molecular determinants of substrates for recognition by the intestinal peptide transporter. J Biol Chem, 1998. 273(36): p. 23211-8.
104. Liang, R., et al., Human intestinal H+/peptide cotransporter. Cloning, functional expression, and chromosomal localization. J Biol Chem, 1995. 270(12): p. 6456-63.
105. Thamotharan, M., et al., Functional and molecular expression of intestinal oligopeptide transporter (Pept-1) after a brief fast. Metabolism, 1999. 48(6): p. 681-4.
106. Thamotharan, M., et al., Hormonal regulation of oligopeptide transporter pept-1 in a human intestinal cell line. Am J Physiol, 1999. 276(4 Pt 1): p. C821-6.
107. Winckler, C., et al., Characteristics of dipeptide transport in pig jejunum in vitro. J Comp Physiol B, 1999. 169(7): p. 495-500.
108. Gangopadhyay, A., M. Thamotharan, and S.A. Adibi, Regulation of oligopeptide transporter (Pept-1) in experimental diabetes. Am J Physiol Gastrointest Liver Physiol, 2002. 283(1): p. G133-8.
109. Wenzel, U., et al., PEPT1-mediated cefixime uptake into human intestinal epithelial cells is increased by Ca2+ channel blockers. Antimicrob Agents Chemother, 2002. 46(5): p. 1375-80.

References
83
110. Knutter, I., et al., High-affinity interaction of sartans with H+/peptide transporters. Drug Metab Dispos, 2009. 37(1): p. 143-9.
111. Ma K, H.Y., Smith DE., Peptide transporter 1 is responsible for intestinal uptake of the dipeptide glycylsarcosine: studies in everted jejunal rings from wild-type and Pept1 null mice. J Pharm Sci., 2011. 100(2): p. 767-774.
112. Jappar, D., et al., Significance and regional dependency of peptide transporter (PEPT) 1 in the intestinal permeability of glycylsarcosine: in situ single-pass perfusion studies in wild-type and Pept1 knockout mice. Drug Metab Dispos, 2010. 38(10): p. 1740-6.
113. Lu, H. and C. Klaassen, Tissue distribution and thyroid hormone regulation of Pept1 and Pept2 mRNA in rodents. Peptides, 2006. 27(4): p. 850-7.
114. Merlin, D., et al., Colonic epithelial hPepT1 expression occurs in inflammatory bowel disease: transport of bacterial peptides influences expression of MHC class 1 molecules. Gastroenterology, 2001. 120(7): p. 1666-79.
115. Nguyen, H.T., et al., Pathogenic bacteria induce colonic PepT1 expression: an implication in host defense response. Gastroenterology, 2009. 137(4): p. 1435-47 e1-2.
116. Dyer, J., et al., Glycyl-L-proline transport in rabbit enterocyte basolateral-membrane vesicles. Biochem J, 1990. 269(3): p. 565-71.
117. Saito, H. and K. Inui, Dipeptide transporters in apical and basolateral membranes of the human intestinal cell line Caco-2. Am J Physiol, 1993. 265(2 Pt 1): p. G289-94.
118. Terada, T., et al., Functional characteristics of basolateral peptide transporter in the human intestinal cell line Caco-2. Am J Physiol, 1999. 276(6 Pt 1): p. G1435-41.
119. Irie, M., et al., Efflux properties of basolateral peptide transporter in human intestinal cell line Caco-2. Pflugers Arch, 2004. 449(2): p. 186-94.
120. Westrom, B.R., et al., Levels of immunoreactive insulin, neurotensin, and bombesin in porcine colostrum and milk. J Pediatr Gastroenterol Nutr, 1987. 6(3): p. 460-5.
121. Shulman, R.J., Oral insulin increases small intestinal mass and disaccharidase activity in the newborn miniature pig. Pediatr Res, 1990. 28(2): p. 171-5.
122. Buts, J.P., et al., Response of rat immature enterocytes to insulin: regulation by receptor binding and endoluminal polyamine uptake. Gastroenterology, 1994. 106(1): p. 49-59.
123. Gingerich, R.L., et al., Identification and characterization of insulin receptors in basolateral membranes of dog intestinal mucosa. Diabetes, 1987. 36(10): p. 1124-9.
124. Pillion, D.J., V. Ganapathy, and F.H. Leibach, Identification of insulin receptors on the mucosal surface of colon epithelial cells. J Biol Chem, 1985. 260(9): p. 5244-7.
125. Buts, J.P., et al., Expression of insulin receptors and of 60-kDa receptor substrate in rat mature and immature enterocytes. Am J Physiol, 1997. 273(1 Pt 1): p. G217-26.

References
84
126. Baron-Delage, S., et al., Reduced insulin receptor expression and function in human colonic Caco-2 cells by ras and polyoma middle T oncogenes. J Biol Chem, 1994. 269(28): p. 18686-93.
127. MacDonald, R.S., W.H. Thornton, Jr., and T.L. Bean, Insulin and IGE-1 receptors in a human intestinal adenocarcinoma cell line (CACO-2): regulation of Na+ glucose transport across the brush border. J Recept Res, 1993. 13(7): p. 1093-113.
128. Nielsen, C.U., et al., Epidermal growth factor and insulin short-term increase hPepT1-mediated glycylsarcosine uptake in Caco-2 cells. Acta Physiol Scand, 2003. 178(2): p. 139-48.
129. Zhang, Y., et al., Positional cloning of the mouse obese gene and its human homologue. Nature, 1994. 372(6505): p. 425-32.
130. Kiess, W., et al., Adipocytes and adipose tissue. Best Pract Res Clin Endocrinol Metab, 2008. 22(1): p. 135-53.
131. Hindlet, P., et al., Reduced intestinal absorption of dipeptides via PepT1 in mice with diet-induced obesity is associated with leptin receptor down-regulation. J Biol Chem, 2009. 284(11): p. 6801-8.
132. Ducroc, R., et al., Luminal leptin induces rapid inhibition of active intestinal absorption of glucose mediated by sodium-glucose cotransporter 1. Diabetes, 2005. 54(2): p. 348-54.
133. Fanjul, C., et al., Leptin regulates sugar and amino acids transport in the human intestinal cell line Caco-2. Acta Physiol (Oxf), 2012. 205(1): p. 82-91.
134. Thamotharan, M., et al., Mechanism of dipeptide stimulation of its own transport in a human intestinal cell line. Proc Assoc Am Physicians, 1998. 110(4): p. 361-8.
135. Shiraga, T., et al., Cellular and molecular mechanisms of dietary regulation on rat intestinal H+/Peptide transporter PepT1. Gastroenterology, 1999. 116(2): p. 354-62.
136. Khanal, R.C. and I. Nemere, Regulation of intestinal calcium transport. Annu Rev Nutr, 2008. 28: p. 179-96.
137. Furukawa, T., et al., Selectivities of dihydropyridine derivatives in blocking Ca(2+) channel subtypes expressed in Xenopus oocytes. J Pharmacol Exp Ther, 1999. 291(2): p. 464-73.
138. Chandrashekar, J., et al., The receptors and cells for mammalian taste. Nature, 2006. 444(7117): p. 288-94.
139. Steinert, R.E. and C. Beglinger, Nutrient sensing in the gut: interactions between chemosensory cells, visceral afferents and the secretion of satiation peptides. Physiol Behav, 2011. 105(1): p. 62-70.
140. Hopfer, U., Diabetes mellitus: changes in the transport properties of isolated intestinal microvillous membranes. Proc Natl Acad Sci U S A, 1975. 72(6): p. 2027-31.

References
85
141. Feldman, M. and L.R. Schiller, Disorders of gastrointestinal motility associated with diabetes mellitus. Ann Intern Med, 1983. 98(3): p. 378-84.
142. Chesta, J., et al., Delayed stomach to caecum transit time in the diabetic rat. Possible role of hyperglucagonaemia. Gut, 1990. 31(6): p. 660-2.
143. Bikhazi, A.B., et al., Effect of diabetes mellitus and insulin on the regulation of the PepT 1 symporter in rat jejunum. Mol Pharm, 2004. 1(4): p. 300-8.
144. Der-Boghossian, A.H., et al., Role of insulin on jejunal PepT1 expression and function regulation in diabetic male and female rats. Can J Physiol Pharmacol, 2010. 88(7): p. 753-9.
145. Daniel, H., Molecular and integrative physiology of intestinal peptide transport. Annu Rev Physiol, 2004. 66: p. 361-84.
146. Watanabe, K., et al., Effect of insulin on cephalexin uptake and transepithelial transport in the human intestinal cell line Caco-2. Eur J Pharm Sci, 2004. 21(1): p. 87-95.
147. Wong, T.P., E.S. Debnam, and P.S. Leung, Involvement of an enterocyte renin-angiotensin system in the local control of SGLT1-dependent glucose uptake across the rat small intestinal brush border membrane. J Physiol, 2007. 584(Pt 2): p. 613-23.
148. Masumoto, S., et al., Dietary phloridzin reduces blood glucose levels and reverses Sglt1 expression in the small intestine in streptozotocin-induced diabetic mice. J Agric Food Chem, 2009. 57(11): p. 4651-6.
149. Adibi, S.A. and D.W. Mercer, Protein digestion in human intestine as reflected in luminal, mucosal, and plasma amino acid concentrations after meals. J Clin Invest, 1973. 52(7): p. 1586-94.
150. Meissner, B., et al., Deletion of the intestinal peptide transporter affects insulin and TOR signaling in Caenorhabditis elegans. J Biol Chem, 2004. 279(35): p. 36739-45.
151. Hu, Y., et al., Targeted disruption of peptide transporter Pept1 gene in mice significantly reduces dipeptide absorption in intestine. Mol Pharm, 2008. 5(6): p. 1122-30.
152. Nassl, A.M., et al., Amino acid absorption and homeostasis in mice lacking the intestinal peptide transporter PEPT1. Am J Physiol Gastrointest Liver Physiol, 2011. 301(1): p. G128-37.
153. Ocheltree SM, K.R., Shen H, Yang D, Hughes BA, Smith DE., Preliminary investigation into the expression of proton-coupled oligopeptide transporters in neural retina and retinal pigment epithelium (RPE): lack of functional activity in RPE plasma membranes. Pharm Res. , 2003. 20(9): p. 1364-1372.
154. Ferraris, R.P., et al., Luminal glucose concentrations in the gut under normal conditions. Am J Physiol, 1990. 259(5 Pt 1): p. G822-37.
155. Doherty, M.M. and K.S. Pang, First-pass effect: significance of the intestine for absorption and metabolism. Drug Chem Toxicol, 1997. 20(4): p. 329-44.

References
86
156. Pohl, P., S.M. Saparov, and Y.N. Antonenko, The size of the unstirred layer as a function of the solute diffusion coefficient. Biophys J, 1998. 75(3): p. 1403-9.
157. Collins, S., et al., Genetic vulnerability to diet-induced obesity in the C57BL/6J mouse: physiological and molecular characteristics. Physiol Behav, 2004. 81(2): p. 243-8.
158. Kolodziejczak, D., et al., Mice lacking the intestinal peptide transporter display reduced energy intake and a subtle maldigestion/malabsorption that protects them from diet-induced obesity. Am J Physiol Gastrointest Liver Physiol, 2013. 304(10): p. G897-907.
159. Goda, T. and S. Takase, Effect of dietary fat content on microvillus in rat jejunum. J Nutr Sci Vitaminol (Tokyo), 1994. 40(2): p. 127-36.
160. Stumpel, F., T. Kucera, and K. Jungermann, Impaired stimulation of intestinal glucose absorption via hepatoenteral nerves in streptozotocin-diabetic rats. Am J Physiol, 1999. 277(2 Pt 1): p. G285-91.
161. Krauland, A.H., D. Guggi, and A. Bernkop-Schnurch, Oral insulin delivery: the potential of thiolated chitosan-insulin tablets on non-diabetic rats. J Control Release, 2004. 95(3): p. 547-55.
162. Serhan, M.F. and S.I. Kreydiyyeh, Insulin down-regulates the Na+/K+ ATPase in enterocytes but increases intestinal glucose absorption. Gen Comp Endocrinol, 2010. 167(2): p. 228-233.
163. Brandsch, M., et al., Expression and protein kinase C-dependent regulation of peptide/H+ co-transport system in the Caco-2 human colon carcinoma cell line. Biochem J, 1994. 299 ( Pt 1): p. 253-60.
164. Kellett, G.L., et al., Sugar absorption in the intestine: the role of GLUT2. Annu Rev Nutr, 2008. 28: p. 35-54.
165. Stumpel, F., et al., Normal kinetics of intestinal glucose absorption in the absence of GLUT2: evidence for a transport pathway requiring glucose phosphorylation and transfer into the endoplasmic reticulum. Proc Natl Acad Sci U S A, 2001. 98(20): p. 11330-5.
166. Yu, R., et al., Anti-hyperglycemic, antioxidant and anti-inflammatory effects of VIP and a VPAC1 agonist on streptozotocin-induced diabetic mice. Peptides, 2011. 32(2): p. 216-22.
167. Li, H.T., et al., Antihyperglycemic effects of baicalin on streptozotocin - nicotinamide induced diabetic rats. Phytother Res, 2010. 25(2): p. 189-94.
168. Motyl, K.J., et al., Bone inflammation and altered gene expression with type I diabetes early onset. J Cell Physiol, 2009. 218(3): p. 575-83.
169. Forrest, A., R. Makwana, and M. Parsons, The short-circuit current of the ileum, but not the colon, is altered in the streptozotocin diabetic rat. Can J Physiol Pharmacol, 2006. 84(2): p. 173-9.

References
87
170. Burant, C.F., et al., Small intestine hexose transport in experimental diabetes. Increased transporter mRNA and protein expression in enterocytes. J Clin Invest, 1994. 93(2): p. 578-85.
171. Debnam, E.S., W.H. Karasov, and C.S. Thompson, Nutrient uptake by rat enterocytes during diabetes mellitus; evidence for an increased sodium electrochemical gradient. J Physiol, 1988. 397: p. 503-12.
172. Schmidt, R.E., J.S. Nelson, and E.M. Johnson, Jr., Experimental diabetic autonomic neuropathy. Am J Pathol, 1981. 103(2): p. 210-25.
173. Lenzen, S., The mechanisms of alloxan- and streptozotocin-induced diabetes. Diabetologia, 2008. 51(2): p. 216-26.
174. West, E.S., OR. Morrison, EY., Streptozotocin alters pancreatic beta-cell responsiveness to glucose within six hours of injection into rats. West Indian Med, 1996(45): p. 60-62.
175. Ravi, K., B. Ramachandran, and S. Subramanian, Effect of Eugenia Jambolana seed kernel on antioxidant defense system in streptozotocin-induced diabetes in rats. Life Sci, 2004. 75(22): p. 2717-31.
176. Vidotti, D.B., et al., Effect of long-term type 1 diabetes on renal sodium and water transporters in rats. Am J Nephrol, 2008. 28(1): p. 107-14.
177. Pighin, D., et al., Role of lipids in the early developmental stages of experimental immune diabetes induced by multiple low-dose streptozotocin. J Appl Physiol, 2005. 98(3): p. 1064-9.
178. Vannini, P., et al., Branched-chain amino acids and alanine as indices of the metabolic control in type 1 (insulin-dependent) and type 2 (non-insulin-dependent) diabetic patients. Diabetologia, 1982. 22(3): p. 217-9.
179. Mochida, T., et al., Time-dependent changes in the plasma amino acid concentration in diabetes mellitus. Mol Genet Metab. 103(4): p. 406-9.
180. Ramsanahie, A.P., et al., Effect of glucagon-like peptide-2 (GLP-2) on diurnal SGLT1 expression. Dig Dis Sci, 2004. 49(11-12): p. 1731-7.
181. Perdue, M.D., JS., Altered regulation of intestinal ion transport by enteric nerves in diabetic rats. Am J Physiol., 1988(254): p. 444-449.
182. Chang, E.B., R.M. Bergenstal, and M. Field, Diarrhea in streptozocin-treated rats. Loss of adrenergic regulation of intestinal fluid and electrolyte transport. J Clin Invest, 1985. 75(5): p. 1666-70.
183. Krishnan, A.V., C.S. Lin, and M.C. Kiernan, Activity-dependent excitability changes suggest Na+/K+ pump dysfunction in diabetic neuropathy. Brain, 2008. 131(Pt 5): p. 1209-16.
184. Vague, P., et al., C-peptide, Na+,K(+)-ATPase, and diabetes. Exp Diabesity Res, 2004. 5(1): p. 37-50.

References
88
185. Luppa, D. and F. Muller, Effect of diabetes and adrenocortical state on intestinal transport capacity and (Na+ + K+)-activated adenosine triphosphatase activity. Diabete Metab, 1986. 12(4): p. 191-6.
186. Gnanaprakasam, M.S. and L.M. Srivastava, Effect of starvation, alloxan diabetes and adrenalectomy on Na+ K+-ATPase of the mucosa of the small intestine of rat. Biochem Exp Biol, 1978. 14(3): p. 257-62.

Appendix
IV
Appendix
Abbreviations 14C carbon 14 3H hydrogen 3, Tritium AA amino acids Ag silver ATP adenosine triphosphate ATPase sodium-potassium ATPase B0AT1 the sodium-dependent neutral amino acid transporter BBM brush border membrane BBMV brush border membrane vesicles BLPT basolateral peptide transporter C control Ca2+ calcium ion Caco-2 human epithelial colorectal adenocarcinoma cells Cav 1.3 voltage gated L-type Ca2+ channels CCK-8 cholecystokinin 8 cDNA complementary deoxyribonucleic acid Cdx2 caudal-related homeobox protein 2 Cl- chloride ion CP crossing points DAG diacylglycerol DIO diet induced obesity DPP-IV dipeptidylpeptidase IV ECL extracellular loop EEC enteroendocrine cell EGTA ethylene glycol tetraacetic acid ELISA Enzyme Linked Immunosorbent Assay EPEC enteropathogenic Escherichia coli ER endoplasmic reticulum GABA γ-aminobutyric acid GAPDH glyceraldehyde-3-phosphate dehydrogenase GGM glucose-galactose malabsorption GI gastrointestinal tract

Appendix
V
GIP gastric inhibitory polypeptide GLP-1 glucagon-like-peptide 1 GLP2 glucagon-like peptide 2 GLUT2 facilitative glucose transporter type 2 GLUT4 insulin-depended facilitative glucose transporter 4 GLUTag differentiated murine enteroendocrine cells Gly-Gln glycylglutamine Gly-Phe glycyl phenylalanine Gly-Sar glycyl-sarcosine GPCR G-protein coupled receptor GSIS glucose-stimulated insulin secretion H&E Hemalum and Eosin H+ proton H121 histidine residue 121 H2O2 hydrogen peroxide H57 histidine residue 57 hcDNA human complementary DNA HCO3 hydrogen carbogen HeLa cervical cancer derived cell line HEPES 4-(2-hydroxyethyl)-1-piperazineethanesulfonic acid HFD high-fat diet HMIT myoinositol transporter hSGLT1 human derived sodium/glucose cotransporter 1 HT29-Cl.19A human colonic cell line I current i.p intraperitoneal IEC rat derived Intestinal Epithelial Cells Ioc open-circuit voltage IP3 inositol-1,4,5-triphosphat IR insulin receptor Isc short-circuit current K+ potassium ion KCl potassium chloride L-DOPA L-3,4-dihydroxyphenylalanine MAPK Mitogen-Activated Protein Kinase MES 2-(N-morpholino) ethanesulfonic acid
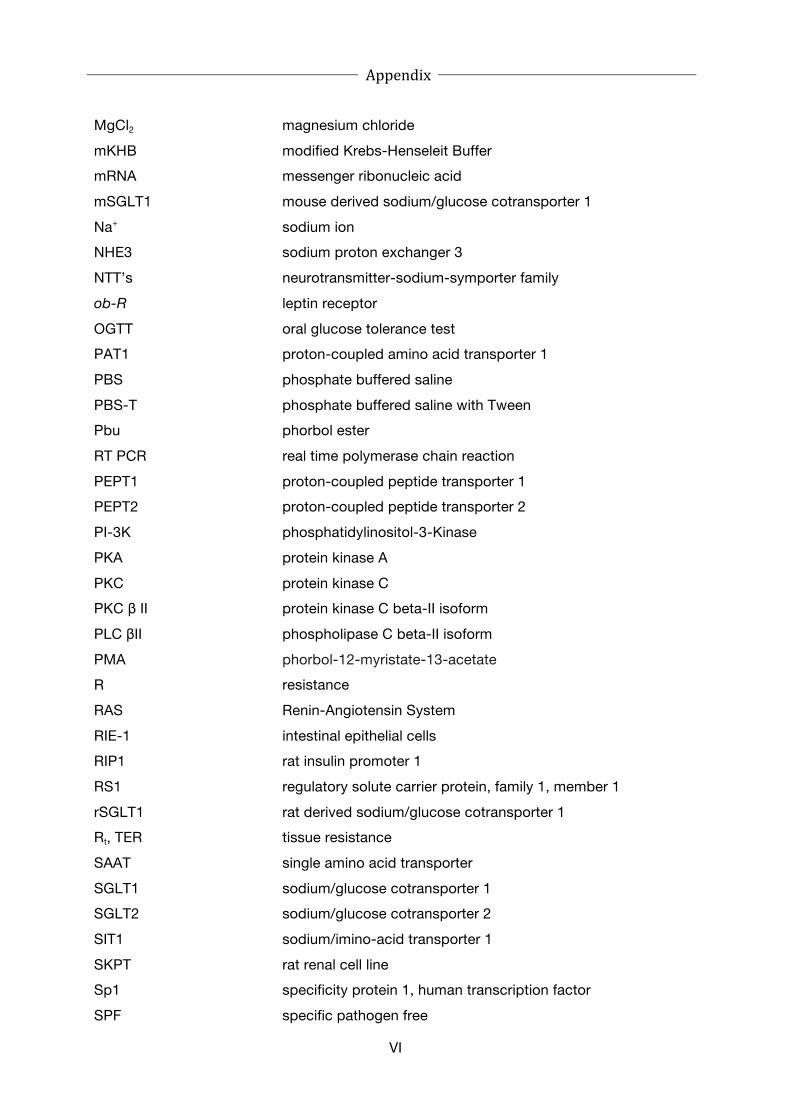
Appendix
VI
MgCl2 magnesium chloride mKHB modified Krebs-Henseleit Buffer mRNA messenger ribonucleic acid mSGLT1 mouse derived sodium/glucose cotransporter 1 Na+ sodium ion NHE3 sodium proton exchanger 3 NTT’s neurotransmitter-sodium-symporter family ob-R leptin receptor OGTT oral glucose tolerance test PAT1 proton-coupled amino acid transporter 1 PBS phosphate buffered saline PBS-T phosphate buffered saline with Tween Pbu phorbol ester RT PCR real time polymerase chain reaction PEPT1 proton-coupled peptide transporter 1 PEPT2 proton-coupled peptide transporter 2 PI-3K phosphatidylinositol-3-Kinase PKA protein kinase A PKC protein kinase C PKC β II protein kinase C beta-II isoform PLC βII phospholipase C beta-II isoform PMA phorbol-12-myristate-13-acetate R resistance RAS Renin-Angiotensin System RIE-1 intestinal epithelial cells RIP1 rat insulin promoter 1 RS1 regulatory solute carrier protein, family 1, member 1 rSGLT1 rat derived sodium/glucose cotransporter 1 Rt, TER tissue resistance SAAT single amino acid transporter SGLT1 sodium/glucose cotransporter 1 SGLT2 sodium/glucose cotransporter 2 SIT1 sodium/imino-acid transporter 1 SKPT rat renal cell line Sp1 specificity protein 1, human transcription factor SPF specific pathogen free

Appendix
VII
STZ Streptozotocin System ASC sodium-dependent neutral amino acid transporters T1D type 1 diabetes T1R sweet taste receptor family 1 T1R1/T1R3 heterodimers of TR1 (umami and savory amino acids) T1R2/T1R3 heterodimers of TR1 (sweet taste) T2D type 2 diabetes T2R taste receptor family 2 (bitter taste) TATA Goldberg-Hogness-Box TauT Cl- -dependent taurine transporter TMD transmembrane domain TRC taste receptor cell U voltage UL unstirred layer Ut transepithelial voltage VCC voltage current clamp Vt transepithelial potential WHO world health organization Y56 tyrosine residue 56 α-MDG alpha methyl-D-glucopyranoside Δ Vt tissue potential difference ΔI current difference Km Michaelis-Menten constant Vmax/Imax maximal transport velocity rpm rounds per minutes

Appendix
VIII
Units of measurements
(°C) degree Celsius
(Å) Angstrom
(cm) centimeter
(μm) micrometer
(cm2) square centimeter
(M) molar
(mM) millimolar
(μM) micromolar
(nM) nanomolar
(kg) kilogram
(g) gram
(kDa) kilo Dalton
(l) liter
[81] milliliter
(μl) microliter
(rcf) relative centrifugal force
(pmol) picomole
(mosmol) milliosmolarity
(μA) microampere

Appendix
IX
Diets
Standard chow SPF Tierhaltung
(Gregor-Mendel-Strasse 2, 85350 Freising, Germany )
Standard Chow Einheit
Artikelnummer V1534-3
Bezeichnung R/M-H autoklavierbar
Kategorie Alleinfutter
Hersteller ssniff
Pelletgröße 10 mm
Haltung SPF
Bestrahlung 25 kGy
Energie
Bruttoenergie (GE) MJ/Kg 16,3
Umsetzbare Energie (ME) MJ/Kg 12,8
Umsetzbare Energie (ME) MJ/Kg
Zusammensetzung
Protein kJ% 33
Fettsäuren kJ% 9
Kohlenhydrate kJ% 58
Rohnährstoffe
Trockensubstanz % 87,8
Rohprotein (Nx6,25) % 19,0
Rohfett % 3,3
Rohfaser % 4,9
Rohasche % 6,4
N-freie Extrakt-stoffe (NfE) % 54,2
Stärke % 36,6
Zucker % 4,7
Casein %
Maisstärke, mod./pre-gelat. %
Maltodextrin %
Saccharose %
Glukose/Dextrose %
Cellulose %
L-Cystin %

Appendix
X
Vitamine %
Mineralstoffe& Spurenelement %
Cholin-Chlorid %
Butylhydroxy-toluol %
Sojaöl %
Palmöl %
Rindertalg %
Fettsäuren
C4:0 %
C12:0 %
C14:0 % 0,01
C16:0 % 0,47
C16:1 % 0,01
C17:0 %
C18:0 % 0,08
C18:1 % 0,62
C18:2 % 1,79
C18:3 % 0,23
C20:0 % 0,01
C20:1 % 0,02
C20:4 %
Cholesterol mg/kg
Mineralstoffe %
Calcium % 1,00
Phosphor % 0,70
Natrium % 0,24
Magnesium % 0,23
Kalium % 0,92
Vitamine per kg
Vitamin A IE 25000
Vitamin D3 IE 1000
Vitamin E mg 135
Vitamin K (als Menadion) mg 20
Vitamin C mg
Vitamin B1 mg 86
Vitamin B2 mg 32
Vitamin B6 mg 32

Appendix
XI
Vitamin B12 µg 150
Nicotinsäure mg 165
Pantothensäure mg 62
Folsäure mg 10
Biotin µg 730
Cholin-Chlorid mg 3000
Inositol mg 100
Spurenelemente per kg
Eisen mg 176,00
Mangan mg 69,00
Zink mg 94,00
Kupfer mg 16,00
Iod mg 2,20
Selen mg 0,30
Cobalt mg 2,10
Aminosäuren %
Lysin % 1,10
Methionin % 0,35
Met+Cys % 0,70
Threonin % 0,68
Tryptophan % 0,25
Arginin % 1,16
Histidin % 0,45
Valin % 0,90
Isoleucin % 0,78
Leucin % 1,33
Phenylalanin % 0,87
Phe+Tyr % 1,47
Glycin % 0,82
Glutaminsäure % 3,97
Asparaginsäure % 1,66
Prolin % 1,28
Alanin % 0,81
Serin % 0,92

Appendix
XII
Standard chow open mouse facility
(Liese-Beckmannstr.4, 85350 Freising, Germany)
Standard Chow Einheit
Artikelnummer V 1534-0
Bezeichnung R/M-H
Kategorie Alleinfutter
Hersteller ssniff
Pelletgröße 10 mm
Energie
Bruttoenergie (GE) MJ/Kg 16,3
Umsetzbare Energie (ME) MJ/Kg 12,8
Umsetzbare Energie (ME) MJ/Kg
Zusammensetzung
Protein kJ% 33
Fettsäuren kJ% 9
Kohlenhydrate kJ% 58
Rohnährstoffe
Trockensubstanz % 87,7
Rohprotein (Nx6,25) % 19,0
Rohfett % 3,3
Rohfaser % 4,9
Rohasche % 6,4
N-freie Extrakt-stoffe (NfE) % 54,1
Stärke % 36,5
Zucker % 4,7
Casein %
Maisstärke, mod./pre-gelat. %
Maltodextrin %
Saccharose %
Glukose/Dextrose %
Cellulose %
L-Cystin %
Vitamine %
Mineralstoffe& Spurenelement %
Cholin-Chlorid %

Appendix
XIII
Butylhydroxy-toluol %
Sojaöl %
Palmöl %
Rindertalg %
Fettsäuren
C4:0 %
C12:0 %
C14:0 % 0,01
C16:0 % 0,47
C16:1 % 0,01
C17:0 %
C18:0 % 0,08
C18:1 % 0,62
C18:2 % 1,80
C18:3 % 0,23
C20:0 % 0,01
C20:1 % 0,02
C20:4 %
Cholesterol mg/kg
Mineralstoffe %
Calcium % 1,00
Phosphor % 0,70
Natrium % 0,24
Magnesium % 0,22
Kalium % 0,91
Vitamine per kg
Vitamin A IE 15000
Vitamin D3 IE 1000
Vitamin E mg 110
Vitamin K (als Menadion) mg 5
Vitamin C mg
Vitamin B1 mg 18
Vitamin B2 mg 23
Vitamin B6 mg 21
Vitamin B12 µg 100
Nicotinsäure mg 135

Appendix
XIV
Pantothensäure mg 43
Folsäure mg 7
Biotin µg 525
Cholin-Chlorid mg 2990
Inositol mg 100
Spurenelemente per kg
Eisen mg 179,00
Mangan mg 69,00
Zink mg 94,00
Kupfer mg 16,00
Iod mg 2,20
Selen mg 0,30
Cobalt mg 2,10
Aminosäuren %
Lysin % 1,00
Methionin % 0,30
Met+Cys % 0,65
Threonin % 0,68
Tryptophan % 0,25
Arginin % 1,14
Histidin % 0,44
Valin % 0,88
Isoleucin % 0,76
Leucin % 1,30
Phenylalanin % 0,85
Phe+Tyr % 1,43
Glycin % 0,80
Glutaminsäure % 3,90
Asparaginsäure % 1,61
Prolin % 1,25
Alanin % 0,79
Serin % 0,89

Appendix
XV
Control diet (11% energy from fat) open mouse facility
(Liese-Beckmannstr.4, 85350 Freising, Germany)
Control Diet (11%) Einheit
Artikelnummer E15000-04
Bezeichnung EF R/M Kontrolle
Kategorie Experimentalfutter
Hersteller ssniff
Pelletgröße 10mm
Energie
Bruttoenergie (GE) MJ/Kg 18,0
Umsetzbare Energie (ME) MJ/Kg 15,4
Umsetzbare Energie (ME) MJ/Kg 15,0
Zusammensetzung
Protein kJ% 23
Fettsäuren kJ% 11
Kohlenhydrate kJ% 66
Rohnährstoffe
Trockensubstanz % 95,2
Rohprotein (Nx6,25) % 20,8
Rohfett % 4,2
Rohfaser % 5,0
Rohasche % 5,6
N-freie Extrakt-stoffe (NfE) % 59,4
Stärke % 46,8
Zucker % 10,8
Casein % 24,00
Maisstärke, mod./pre-gelat. % 30,00
Maltodextrin % 19,60
Saccharose %
Glukose/Dextrose % 10,00
Cellulose % 5,00
L-Cystein % 0,20
Vitamine % 1,00
Mineralstoffe& Spurenelement % 6,00
Cholin-Chlorid % 0,20

Appendix
XVI
Butylhydroxy-toluol %
Sojaöl % 4,00
Palmöl %
Rindertalg %
Fettsäuren
C4:0 %
C12:0 %
C14:0 % 0,02
C16:0 % 0,45
C16:1 % 0,02
C17:0 %
C18:0 % 0,19
C18:1 % 1,07
C18:2 % 2,12
C18:3 % 0,26
C20:0 % 0,02
C20:1 %
C20:4 %
Cholesterol mg/kg
Mineralstoffe %
Calcium % 0,90
Phosphor % 0,63
Natrium % 0,19
Magnesium % 0,21
Kalium % 0,97
Vitamine per kg
Vitamin A IE 15000
Vitamin D3 IE 1500
Vitamin E mg 150
Vitamin K (als Menadion) mg 20
Vitamin C mg 30
Vitamin B1 mg 16
Vitamin B2 mg 16
Vitamin B6 mg 18
Vitamin B12 µg 30
Nicotinsäure mg 49

Appendix
XVII
Pantothensäure mg 56
Folsäure mg 19
Biotin µg 310
Cholin-Chlorid mg 1040
Inositol mg 80
Spurenelemente per kg
Eisen mg 166,00
Mangan mg 98,00
Zink mg 65,00
Kupfer mg 14,00
Iod mg 1,20
Selen mg 0,14
Cobalt mg 0,15
Aminosäuren %
Lysin % 1,71
Methionin % 0,73
Met+Cys % 0,82
Threonin % 0,93
Tryptophan % 0,27
Arginin % 0,76
Histidin % 0,66
Valin % 1,42
Isoleucin % 1,09
Leucin % 2,05
Phenylalanin % 1,11
Phe+Tyr % 2,22
Glycin % 0,43
Glutaminsäure % 4,69
Asparaginsäure % 1,55
Prolin % 2,39
Alanin % 0,68
Serin % 1,24

Appendix
XVIII
High-fat diet (60% energy from fat) open mouse facility
(Liese-Beckmannstr.4, 85350 Freising, Germany)
High-fat diet (60%) Einheit
Artikelnummer E15741-34
Bezeichnung EF R/M nach
D12492 mod.
Kategorie Experimentalfutter
Hersteller ssniff
Pelletgröße 10mm
Energie
Bruttoenergie (GE) MJ/Kg 25,2
Umsetzbare Energie (ME) MJ/Kg 20,6
Umsetzbare Energie (ME) MJ/Kg 21,4
Zusammensetzung
Protein kJ% 19
Fettsäuren kJ% 60
Kohlenhydrate kJ% 21
Rohnährstoffe
Trockensubstanz % 97,1
Rohprotein (Nx6,25) % 24,1
Rohfett % 34,0
Rohfaser % 6,0
Rohasche % 6,1
N-freie Extrakt-stoffe (NfE) % 27,0
Stärke % 2,2
Zucker % 22,4
Casein % 27,69
Maisstärke, mod./pre-gelat. %
Maltodextrin % 15,70
Saccharose % 8,00
Glukose/Dextrose %
Cellulose % 6,00
L-Cystin % 0,35
Vitamine % 1,00
Mineralstoffe& Spurenelement % 6,40

Appendix
XIX
Cholin-Chlorid % 0,25
Butylhydroxy-toluol % 0,01
Sojaöl % 3,10
Palmöl %
Rindertalg % 31,50
Fettsäuren
C4:0 % 0,01
C12:0 % 0,03
C14:0 % 1,03
C16:0 % 8,06
C16:1 % 0,78
C17:0 % 0,38
C18:0 % 5,61
C18:1 % 12,13
C18:2 % 2,37
C18:3 % 0,33
C20:0 % 0,04
C20:1 % 0,01
C20:4 % 0,07
Cholesterol mg/kg 290,00
Mineralstoffe %
Calcium % 1,05
Phosphor % 0,61
Natrium % 0,20
Magnesium % 0,17
Kalium % 1,00
Vitamine per kg
Vitamin A IE 15000
Vitamin D3 IE 1500
Vitamin E mg 150
Vitamin K (als Menadion) mg 20
Vitamin C mg 30
Vitamin B1 mg 16
Vitamin B2 mg 16
Vitamin B6 mg 18
Vitamin B12 µg 30

Appendix
XX
Nicotinsäure mg 45
Pantothensäure mg 55
Folsäure mg 19
Biotin µg 310
Cholin-Chlorid mg 2300
Inositol mg 80
Spurenelemente per kg
Eisen mg 139,00
Mangan mg 82,00
Zink mg 56,00
Kupfer mg 12,00
Iod mg 0,97
Selen mg 0,13
Cobalt mg 0,13
Aminosäuren %
Lysin % 1,98
Methionin % 0,83
Met+Cys % 1,28
Threonin % 1,07
Tryptophan % 0,31
Arginin % 0,88
Histidin % 0,76
Valin % 1,64
Isoleucin % 1,25
Leucin % 2,36
Phenylalanin % 1,29
Phe+Tyr % 2,57
Glycin % 0,5
Glutaminsäure % 5,41
Asparaginsäure % 1,79
Prolin % 2,76
Alanin % 0,79
Serin % 1,43

Danksagung
XXI
Danksagung
Eine Vielzahl von Menschen hat mich während der Entstehung dieser Arbeit begleitet,
deshalb möchte ich mich hier und jetzt von Herzen für die Unterstützung, Zuspruch und
Kritik bedanken:
Frau Daniel, ohne Sie und die Bereitstellung dieses Themas wäre diese Arbeit nie
entstanden. Ich möchte mich bei Ihnen für die vielen konstruktiven, kritikreichen und sehr
interessanten Gespräche während meiner Zeit in Ihrer Arbeitsgruppe bedanken. Auch wenn
es nicht immer einfach war, ist es für mich eine sehr schöne und lehrreiche Zeit gewesen.
Herr Kottra, auch Ihnen möchte ich danken für Ihre geduldige Begleitung während dieser
Zeit. Sie haben mir gezeigt, dass handwerkliches Geschick und eine Menge Geduld bei
Messungen mit der Ussing-Kammer von Nöten sind und haben mich bei diversen Aufbau-,
Umbau- und Neubauarbeiten immer tatkräftig unterstützt. Ich weiß nicht, wie viel Meterware
Kunstoffschlauch durch unsere Hände gegangen ist?! Es war Einiges! Danke für Ihre
Diskussionsbereitschaft, Ihr immer offenes Ohr für kleine oder auch große Probleme und all
die zahlreichen guten und hilfreichen Ratschläge, die zum Entstehen dieser Arbeit
beigetragen haben.
Liebe Helene, auch Dir gilt an dieser Stelle ein großes Dankeschön. Du hast mich bei allen
Präparationen unglaublich unterstützt! Daher ist es nicht vermessen zu sagen, dass es nur
ganz schwer ohne Dich gegangen wäre! Ich vermisse Deine Schleckerschublade und Deine
aufbauenden Worte wenn es mal wieder nicht so lief wie es sollte!
Ich möchte mich auch bei Dagmar vom Lehrstuhl für Humanbiologie bedanken, die mich
anfangs in die Kunst der Darmpräparation eingewiesen hat.
Im Institut habe ich viele liebe und hilfsbereite Menschen kennenlernen dürfen, ohne die die
Arbeitszeit nur halb so schön gewesen wäre. Mein Dank gilt im Speziellen Pia, Kathrin,
Chrissi, Anja und Vero für die vielen schönen und unvergesslichen Momente die ich mit
Euch erleben durfte.
Liebe Tamara! Du hast mir immer mit der Arbeit weitergeholfen und Mut zugesprochen. Die
inspirativen Balkongespräche, inklusive Kaffee und Kippchen werden mir fehlen. Danke.
Liebe Manu, ich danke Dir für die tolle Zeit die ich mit Dir am Lehrstuhl und vor allem
darüber hinaus verbringen durfte. Ich denke so gerne an unsere Abende zurück, an denen
doch das eine oder andere Gläschen getrunken und ausgesprochen lecker gekocht wurde.
Du bist mir auch sehr ans Herz gewachsen.

Danksagung
XXII
Meine lieben Eltern haben mich mein ganzes Leben und besonders während der Promotion
immer mit viel Zuversicht unterstützt. Ohne Euch wäre ich nicht der Mensch, der ich heute
bin. Eure bedingungslose Liebe trägt mich und macht mich stark. Ich danke Euch aus
tiefstem Herzen!
Zuletzt möchte ich meinem Mann Corvin danken. Du hast mein Leben unglaublich
bereichert und ihm Sinn gegeben. Wenn ich mal den Weg aus den Augen verloren habe,
oder der Verzweiflung nahe war, hast Du mich immer wieder ermutigt und mir gezeigt, dass
es sich lohnt zu kämpfen. Spätestens mit der Geburt unseres Sohnes weiß ich, dass mir
Eure Liebe so viel Kraft gibt, dass nichts unmöglich ist!
Ich liebe Euch. DANKE!

Erklärung
XXIII
Eidesstattliche Erklärung
Hiermit versichere ich, dass die vorliegende Arbeit
Studies on dietary and hormonal regulation of selected nutrient
transporters in mouse small intestine
selbständig verfasst und keine anderen als die angegebenen Quellen und Hilfsmittel benutzt
habe. Die den benutzten Quellen wörtlich und inhaltlich entnommenen Stellen sind als
solche kenntlich gemacht.
Diese Arbeit hat in gleicher oder ähnlicher Form noch keiner anderen Prüfungsbehörde
vorgelegen.
Freising, den
Mena Katharina Eidens

Curriculum Vitae
XXIV
Curriculum Vitae
Name: Eidens (geb. Marth)
Vorname: Mena Katharina
Geburtsdatum: 20. März. 1979
Geburtsort: Halle (Westfalen)
Familienstand: verheiratet (1 Kind)
Bildung
Seit 04/2008 Technische Universität München
Wissenschaftszentrum Weihenstephan
Lehrstuhl für Ernährungsphysiologie
Promotion
10/1999-02/2008 Justus-Liebig-Universität, Gießen
Studium: Biologie
Abschluss: Diplom
08/1989-05/1999 Ratsgymnasium, Rheda-Wiedenbrück
Abschluss: Hochschulreife
Freising, den

Publications
XXV
List of Publications
Amino acid absorption and homeostasis in mice lacking the intestinal peptide
transporter PEPT1.
Nässl AM, Rubio-Aliaga I, Fenselau H, Marth MK, Kottra G, Daniel H. Am J Physiol
Gastrointest Liver Physiol. 2011 Jul;301(1):G128-37
Increased plasma citrulline in mice marks diet-induced obesity and may
predict the development of the metabolic syndrome.
Sailer M, Dahlhoff C, Giesbertz P, Eidens MK, deWit N, Rubio-Aliaga I, Boekschoten M, Müller M and Daniel H. PLoS One. 2013 May 14;8(5):e63950. doi: 10.1371