Embed Size (px)
Citation preview

Student Sustainability Assessment at Colgate University
Andrew Hacker, Ashlynne Rando, Allison Shafritz
ENST 390 Spring 2015
Colgate University
2
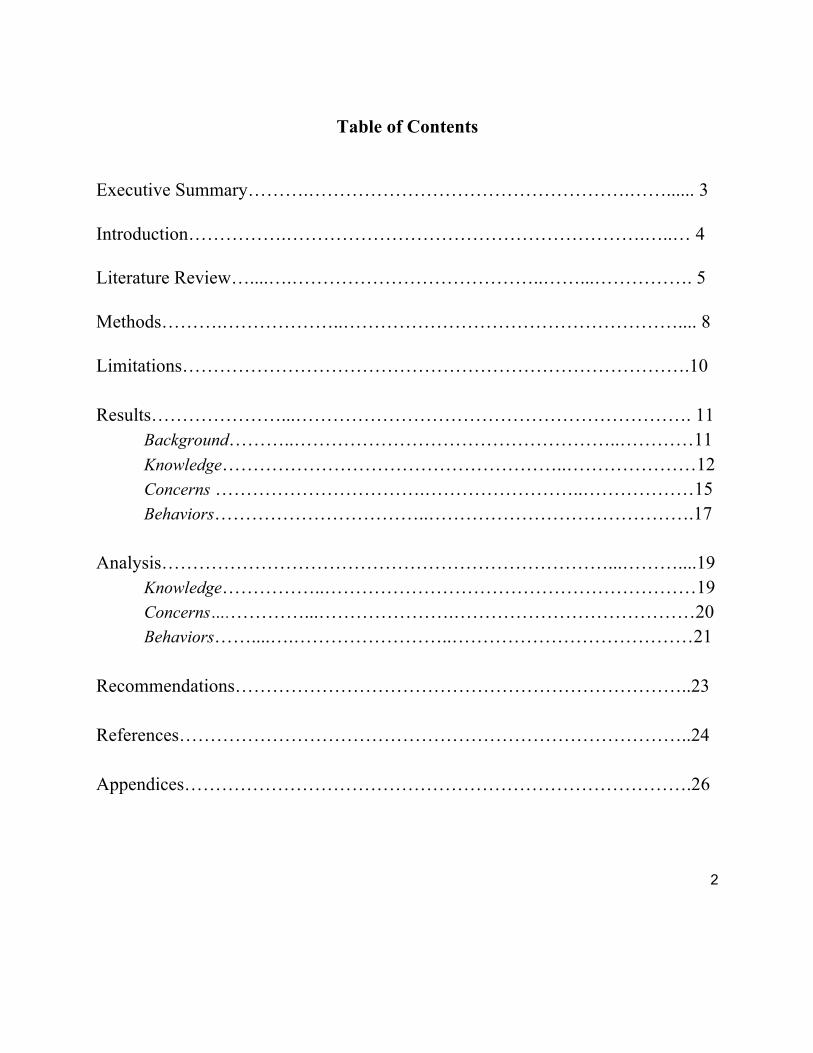
Table of Contents
Executive Summary……….…………………………………………….……...... 3 Introduction…………….………………………………………………….…..… 4 Literature Review…....….…………………………………..……...……………. 5 Methods……….………………..……………………………………………….... 8 Limitations……………………………………………………………………….10 Results…………………...………………………………………………………. 11
Background………..……………………………………………..…………11Knowledge………………………………………………..…………………12
Concerns …………………………….……………………..………………15
Behaviors……………………………..…………………………………….17
Analysis………………………………………………………………...………....19
Knowledge……………..……………………………………………………19
Concerns….…………...………………….…………………………………20
Behaviors……....….……………………..…………………………………21
Recommendations………………………………………………………………..23 References………………………………………………………………………..24 Appendices……………………………………………………………………….26
3
Executive Summary This report details a research project aimed at measuring student engagement in
sustainability at Colgate University. In order to reach its carbon neutrality goal of 2019, Colgate must engage the student body in different sustainable initiatives on campus. Creating a culture of sustainability on a college campus requires understanding levels of engagement among the student body. Measuring knowledge, concerns, and behaviors among the student body allows us to assess engagement in sustainability at Colgate. We define knowledge as awareness related to sustainability issues, both on campus and on a global scale. We define concerns as reasons why students care about sustainability. Finally, we define behaviors as daily actions that promote or advance sustainability.
In order to measure the student body’s levels of knowledge, concerns, and behaviors, we created a survey. The first portion of the survey collected background information for participants; the second portion measured knowledge; the third measured concerns and the fourth portion measured behaviors. We collected the results from our survey and analyzed the data using statistical software. The results show that the overall level of engagement at Colgate is high, but can be improved upon. With these results in mind we recommend that Colgate create a sustainability orientation program where students can become engaged with sustainability within their first days at Colgate, make sustainable behaviors more convenient for students by creating environmentally focused settings that are automatic for students such as double sided printing (that is already in place), increase participation in environmental clubs or organizations through a separate activities fair to broadcast such groups, and the continued implementation of the survey on an annual basis.

4
Introduction Institutions of higher education have a responsibility to advance sustainability. Many
institutions have created plans and set goals in order to reduce emissions and become more sustainable (Zilahy, 2006). Colgate University has set an ambitious carbon neutrality goal of 2019, the bicentennial. A large part of becoming sustainable and reaching this goal is creating an ethos of sustainability on Colgate’s campus. Students must be engaged in sustainability for an institution to reach its sustainability-related goals. However, levels of student engagement are largely unknown. The purpose of this report is to measure the current levels of student engagement in sustainability at Colgate University.
We use knowledge, concerns, and behavior to measure student engagement. These three themes represent the three primary aspects of student engagement in sustainability. For the purposes of this paper, knowledge is defined as basic background in sustainability and sustainable initiatives at Colgate; concern is defined as the students’ views and attitudes towards sustainability issues; and behavior is defined as students’ active engagement with sustainability. We believe that knowledge helps to develop concerns, which ultimately leads to sustainable behaviors. Therefore, these are three very important aspects to measure in determining student engagement in sustainability at Colgate University.
Given the size of the student population at Colgate, and our need to assess students’ levels of knowledge, concerns, and behaviors, we developed an assessment tool in the form of a survey. We used this data to make recommendations for the Office of Sustainability. Survey results show areas of weakness and help demonstrate where the Office of Sustainability should be placing its efforts. The survey provides us with a baseline for the levels of knowledge, concerns, and behaviors among the student body in 2015. It can and should be used in future years to provide the Office of Sustainability with continuously updated information on student engagement. This report explains the process involved in assessing student engagement in sustainability at Colgate. To do this, we first set the context for our research project by discussing and reviewing all of the relevant literature that we examined for the project. The next section details the methods we used to conduct the necessary research and formulate a survey appropriate for Colgate. The next section presents our survey results followed by an in-depth analysis of our results. Finally, the concluding sections provide our recommendations for the Office of Sustainability to improve student engagement on campus. Literature Review/ Background
Sustainability is difficult to define because it is a broad and fluid concept. Many definitions instead focus on sustainable development, intergenerational equity, and the three

5
pillars of sustainability—economic growth, ecological health, and social equity. The most widely accepted definition of sustainability comes from the Brundtland report, which states that sustainable development is “development that meets the needs of the present without compromising the ability of future generations to meet their own needs.” The report also emphasizes the connections between social equity, economic growth, and environmental quality (Theis & Tomkin, 2012, p. 6). Bartlett (2008, p. 1079) presents a different but similar definition of sustainability, arguing that sustainability is the “necessary and difficult struggle to find a balance between competing legitimate claims for economic growth, environmental health, and social justice.”
Institutions of higher education can and should play a role in the advancement of sustainability nationwide (Earl et al., 2003, p. 90). While many colleges and universities have committed to sustainability through the American College and University President’s Climate Commitment (ACUPCC), students’ attitudes and responses to campus sustainability are not well understood (Sadusky, 2014, p. 4). Student engagement in sustainability is critical to the success of sustainability programs, so we need to better understand the factors that drive people towards engagement in sustainability. Effectively dealing with environmental problems requires changes in individual behavior (Schahn & Holzer, 1990, p. 768). True engagement in sustainability requires knowledge of sustainability-related issues, concern for the sustainability of the planet, and engagement in sustainable behaviors. The ability to measure student engagement in sustainability is a crucial component in determining an institution’s success in reaching its sustainability related goals (Earl et al., 2003, p. 85). To date, assessment tools are largely nonexistent in the context of sustainability and higher education (Zwickle et al., 2013, p.3).
In January 2009, Colgate University signed the American College and University Presidents’ Climate Commitment (ACUPCC) (Colgate University, 2011). Following this, Colgate created a comprehensive Sustainability and Climate Action Plan for the university and committed to an ambitious goal of carbon neutrality by 2019. Since then, Colgate has implemented many different programs and projects aimed at reducing carbon emissions. These include the Green Bikes program, electronic waste recycling, the installation of low-flow showerheads, the community garden, and a carbon offset program through Patagonia Sur (Colgate Sustainability Website, 2015). While all of these projects have helped Colgate reduce emissions and become more sustainable, there is no program in place aimed at measuring student engagement in sustainability on campus. For this reason, we performed an assessment of the extent to which the Colgate student body engages in sustainability.
We chose to focus on three key factors in evaluating student engagement in sustainability at Colgate; these are knowledge of sustainability, concerns about sustainability, and sustainable behaviors among the student body. The three factors are intertwined with each other. Theoretically, an increase in environmental knowledge and concern may be a necessary condition for an increase in sustainable behavior (Fransson & Garling, 1999, p. 369). However, this is not necessarily true in every situation. Similarly, sustainable behavior does not necessarily imply a certain level of knowledge or concern. While the three are interconnected, we will strive to pull them apart and analyze each one individually.

6
The first aspect of measuring engagement among the student body is measuring knowledge. Measuring the levels of knowledge among the student body will demonstrate how much students do or do not know about sustainability-related issues at Colgate and on a global scale. However, we must be careful to avoid treating knowledge as simply a prerequisite for sustainable behavior. There is disagreement in existing literature regarding the influence of knowledge on behavior. Fransson and Garling (1999, p. 373) argue that the level of knowledge for an individual or population can help predict the level of engagement in sustainability. On the other hand, Schahn and Holzer (1990, p. 772) argue that the effect of knowledge on behavior in empirical studies is very indirect. In terms of the influence of knowledge on concerns, it can be assumed that knowledge of a certain issue can shape an individual’s concern for that issue (Fransson & Garling, 1999, p. 379). Discovering the levels of knowledge about sustainability on Colgate’s campus will show us where we need to place our efforts in the future.
The second aspect of measuring engagement among the student body is measuring the level of concern for sustainability issues. Fransson and Garling (1999, p. 370) argue that environmental concern is a broad term that includes a specific attitude towards sustainable behavior as well as a more general value orientation. Concerns and values are the most intangible factors, and are therefore the most difficult to measure. Learning the extent to which students care about sustainability-related issues on campus will help us gauge whether or not students are inclined to act in a sustainable manner. Concerns should always be measured in relation to particular issues or behaviors, such as recycling or energy efficient transportation.
The third and final aspect of measuring engagement among the student body is measuring sustainable behaviors. Behavior is a tangible measure of engagement and therefore not as difficult to assess. We can measure behavior by assessing student participation in environmental groups and assessing the frequency of different sustainable behaviors among students on campus. Assessing engagement in different sustainable behaviors will identify areas of weakness where the Office of Sustainability should focus its efforts in the future. Unfortunately, very little existing literature focuses on empirically measuring sustainable behavior.
Several other institutions in the United States have attempted to measure student engagement in sustainability on campus. Instead of utilizing peer institutions for research purposes, we use “comparison institutions.” We describe them as comparison institutions rather than peer institutions because the colleges and universities we examine are not similar to Colgate in size, geographic location, or academic rigor. The comparison institutions used in this research are the University of Connecticut, the Ohio State University, Meredith College, North Carolina State University, the University of Maryland, and Green Mountain College. All of these institutions have implemented effective surveys that measure knowledge, concerns, and behaviors related to sustainability. Although these schools vary greatly in size, geographic location, and level of academic rigor, their surveys ask similar questions. This indicates that there are common successful tactics regardless of differences between schools. We analyzed the different survey instruments used by comparison institutions and found a number of similarities among the questions used to assess student engagement with sustainability. Figure 1 below displays the results of this analysis; knowledge, concerns, and behaviors were the most frequent types of questions in other institutions’ surveys.

7
Figure 1: Percentages of broadly categorized questions from comparison institutions’ assessments.
Creating a culture of sustainability on a college campus requires understanding levels of engagement among the student body. Measuring knowledge, concerns, and behaviors among the student body allows us to assess engagement in sustainability at Colgate. Therefore, we ask two research questions. The first is “To what extent do students at Colgate University engage in sustainability on campus?” The second question is “How can we measure levels of knowledge, concern, and behaviors of sustainability among the student body?” Methods
We used a survey instrument to assess knowledge, concerns, and behaviors of sustainability among the student body at Colgate. A survey is the most appropriate measurement tool because we are interested in collecting quantitative data from a representative sample of the population—in this case, the Colgate University student body (Creswell, 1994).
We took several steps to develop the assessment survey. First, we researched comparison institutions and collected data from their sustainability assessments. As mentioned in the introduction, the term “comparison” institution is more appropriate than “peer” institution in this case, because the schools we analyzed are not necessarily similar to Colgate in size, geographic location, or student body characteristics. Rather, we selected our comparison institutions because they all have implemented effective surveys that we could use as our templates. The majority of

8
the questions from these surveys pertain to three main themes: knowledge, concerns, and behaviors.
The next step in our process was to modify other surveys and create questions that are applicable in the Colgate context. To do this, we referred to Colgate’s Sustainability and Climate Action Plan to see how many sustainability-related goals were proposed and how many of those goals have been completed to date. We decided to formulate closed-ended questions that closely related to Colgate’s sustainability goals. We primarily did this because closed-ended questions are easy to code, easy to analyze, easy to interpret, and do not leave a lot of room for subjectivity in interpretation (Seibert, 2002).
Once we decided on appropriate questions that pertained to the Colgate context, we created the survey using a software called Qualtrics. We then sent the survey out to the Colgate student body via Campus Distributions. Using a 95% confidence interval and a +/- 5% margin of error, we determined that we would need a minimum of 341 respondents for a population of ~3,000 people. The total number of participants in our survey was 494; this is well above our goal (Rea & Parker, 2005). We acknowledge that there is self-selection bias in our survey results because students who are more interested in sustainability are more likely to participate in the survey. However, we decided to collect demographic information to try to correct for this.
We sent the email out via Campus Distributions on April 7, 2015. The email contained a link to the anonymous survey, as well as a brief paragraph explaining how long it would take to complete and how the results would be used to assist the Office of Sustainability. It also mentioned the possible prizes that students could win for participating in our survey. We used incentives in the form of prizes as a means to reduce self-bias, as well as gain the interest of people outside of the Environmental Studies majors and concentrations. After three days (on April 10, 2015), another email was sent via Campus Distributions that reiterated the importance of the survey and notified the student body that the survey would be closed on April 12, 2015.
We placed an arguably short time period (six days) on the survey. We did this for two reasons. First, we reached our target of 341 participants within the first five days, giving us two days to gain more data. The second reason is that we hoped that the short survey time would decrease the amount of incomplete surveys, especially with the follow up emails. In addition this period would give us ample time to analyze the results, and formulate an effective method of assessing the student body.
The survey began with six general questions about participants’ background that provided insight into the overall survey demographics. The background questions we asked were class year, major, minor, current residence at Colgate, membership in an environmental club or organization, and whether or not the individual is a varsity athlete. When we asked about major or intended major (including second major if applicable) we quantified the results by grouping them into the four divisions that Colgate uses; these are Natural Sciences & Mathematics, Social Sciences, Arts & Humanities, and University Studies. Using this information, we gained a general sense of who was taking the survey and what their background. This allowed for deeper analysis of the results.
The second section of the survey was aimed at measuring knowledge. We can measure knowledge by assessing understanding of the concept of sustainability and understanding of

9
sustainability initiatives at Colgate. This section was comprised of four questions. The first question in this section was “While at Colgate what has had the largest influence on your understanding of sustainability?” There were eight possible answers: a course at Colgate, the Office of Sustainability, friends, the Maroon News, the Colgate Sustainability Website, Colgate social media, other, or have not been influenced. The next question asked students to indicate their level of agreement with the following statements: sustainability includes environmental stewardship; sustainability includes social consciousness; sustainability encompasses economic responsibility. The third question in the knowledge section asked students about their opinions on the level of commitment Colgate has towards certain sustainable initiatives. This was phrased, “I feel that Colgate University has a strong commitment to…”; the options were carbon neutrality, designing and constructing green buildings, local sustainable food, renewable energy on campus, reducing emissions from transportation, and waste reduction through recycling and composting. Finally, the fourth question asked “Please indicate whether or not Colgate currently has the following initiatives.” We provided a list of thirteen initiatives and asked students to indicate either yes, no, or unsure.
The third section of the survey was aimed at measuring concerns. We can measure concerns by assessing how important it is to students that Colgate addresses different sustainability issues. The first question in this section was “Please indicate how important it is to you that Colgate addresses the following issues.” The possible responses were climate action planning, sustainability initiatives on campus, recycling and waste minimization, energy conservation and efficiency, renewable energy, sustainable food and dining services, water conservation, and energy efficient transportation. The second question asked students how much they agree with the statements that “Climate change is a problem in my lifetime” and that “Climate change will be a problem for future generations.”
The fourth and final section of the survey was aimed at measuring behaviors. The first question in this section asked students to indicate how often they engage in a list of sustainable behaviors. We provided twelve different sustainable behaviors; these were recycle, encourage others to recycle, turn off the water while brushing my teeth, use a reusable cup or mug, print double-sided, walk to class, ride cruiser to class, take showers less than five minutes, turn off the lights when leaving a room, use energy efficient appliances to conserve energy, unplug electronics when not in use to conserve energy, and eat locally grown or organic foods. If students indicated that they engaged in any of the behaviors listed above, we asked a follow up question about why they engage. There were five possible answers; these were because it is convenient, to be sustainable, peer influence, to avoid hazards, and others. The second question in this section, and the final question of the survey, asked “How much extra would you be willing to pay per meal at the Coop to reduce waste?” The options were $0, less than $1, between $1 and $2, between $2 and $3, between $3 and $4, and above $4.
Our survey used three different scales: a scale from strongly disagree to strongly agree; a scale from not at all important to very important; and a scale from never to all of the time. To analyze these results we represent the majority of the data in a mean. This was calculated by giving each choice a value. We coded this as follows: 1=strongly disagree (not at all important, never), 2=disagree (not important, rarely), 3=unsure (neither important or unimportant,

10
sometimes), 4=agree (important, often), 5=strongly agree (very important, all of the time). The total responses were summed based on this numerical scale then divided by the number of responses to give us the mean. Therefore for an agreement question, if an answer’s mean was closer to 1 then majority of the students strongly disagreed, and if it was closer to 5 then the majority of the students strongly agreed.
The survey results from the three main sections (knowledge, concerns and behaviors) were then analyzed through Stata. This analysis was conducted by calculating means, creating histograms, running cross-tabulations, and running tests for statistical significance. We used the data and analysis to examine why and how these answers are important in understanding the current levels of student sustainability at Colgate University. Limitations
Based on the size of the population we decided to take on the risk associated with an online survey. While we admit that self-selection bias exists, we tried to diminish these effects by offering prizes as well as keeping the survey short and concise. In addition, the majority of the survey questions did not allow for right or wrong answers, instead they encouraged individuals to rank themselves on various scales. Through the steps listed above and the justification of why we took the risk we did, we feel as though our survey is adequate in finding answers to our research questions. Results
Background The first section of the survey contains background information about survey participants. Table 1 shows the survey results for our background questions. By class year, first years are represented the most and juniors are represented the least. We hypothesize that this is because a large percentage of the junior class is studying abroad and therefore less likely to participate in this survey. By division, Natural Sciences & Mathematics is represented the most, followed closely by Social Sciences. By residence, the majority of participants live in first year housing. This makes sense because all first years live in first year housing and sophomores, juniors, and seniors have more housing options. The majority of participants in this survey were not members of environmental clubs or organizations and were not varsity athletes.

11
Table 1: Frequencies and percentages of demographic variables. Demographic Variable Percentage (Frequency)
Class Year
2015 27.3% (127)
2016 19.3% (90)
2017 24.0% (112)
2018 29.4% (137)
Division
Arts & Humanities 16.3% (76)
Natural Sciences & Mathematics 36.8% (171)
Social Sciences 33.9% (158)
University Studies 11.4% (53)
Undecided 1.7% (8)
Residence
Broad Street/Interest housing 8.5% (42)
First year housing 31.2% (154)
Greek housing 6.3% (31)
Sophomore housing (excluding Townhouses) 20.7% (102)
On-campus apartments 16.0% (79)
Townhouses 5.5% (27)
Off-campus apartments 11.9% (59)
Membership in an Environmental Club or Organization
Yes 15.6% (73)
No 84.4% (393)
Varsity Athlete
Yes 14.6% (68)

12
No 85.4% (398)
Knowledge
The second section of the survey contains questions that measure knowledge about sustainability. Table 2 shows the survey results for the question “While at Colgate what has had the largest influence on your understanding of sustainability?”
Table 2: Sources of sustainability-related knowledge at Colgate.
Influential Source Percentage (Frequency)
A Colgate course 31.70% (148)
Office of Sustainability 11.5% (54)
Friends 27.2% (126)
Maroon News 0.85% (4)
Colgate sustainability website 0.43% (2)
Colgate social media 4.0% (19)
Other 9.2% (43)
Not been influenced 15.1% (70)
From the knowledge results it is clear that taking a course at Colgate had the greatest influence on sustainability knowledge followed by friends. The Colgate sustainability website had the least influence on sustainability knowledge. Table 3 shows the survey results for the second knowledge question. This question asked students to select their level of agreement with the statement that sustainability includes each of the following: environmental stewardship, social consciousness, and economic responsibility. Table 3: Agreement with the inclusion of the three pillars in the definition of sustainability. Sustainability includes... Mean
Environmental stewardship 4.09

13
Social consciousness 4.43
Economic responsibility 4.16
Table 4 shows the survey results for the third knowledge question. This question asked
students to select their level of agreement that Colgate is committed to a list of initiatives.
Table 4: Agreement with Colgate’s commitment to sustainable initiatives. Colgate has a strong commitment to... Mean
Carbon Neutrality 3.38
Design and construct green building 3.43
Local sustainable food 3.27
Renewable energy on campus 3.04
Reduce emissions from transportation 2.81
Waste reduction through recycling and composting 3.26
The final question in the knowledge section asked students to indicate whether or not Colgate currently has different sustainable initiatives. Table 5 shows the survey results. The chi-squared test results show statistically significant differences in responses between different class years. A chi-squared test shows that there are statistically significant differences by class year for seven of the initiatives. These are thermal solar energy, electric vehicle charging station, electronic waste disposal, protected land in Patagonia Sur, community garden, PV solar energy, and rainwater harvesting.

14
Table 5: Yes, No, and Unsure responses to the existence of sustainable initiatives on campus.
Initiative Yes No Unsure Chi Squared (p-value)
Thermal solar energy* 19.5% (91) 14.4% (67) 66.1% (308) 15.50 (.02)
Leed certified green buildings* 55.9% (260) 5.2% (24) 38.9% (181) 17.34 (.01)
Electric vehicle charging station 58.4% (272) 12.9% (60) 28.8% (134) 10.59 (.10)
Electronic waste disposal* 44.6% (208) 9.7% (45) 45.7% (213) 37.19 (.00)
Reforestation project in Patagonia, Chile* 36.5% (170) 6.9% (32) 56.7% (264) 19.97 (.00)
Certified forest for long-term sustainability* 39.1% (182) 6.4% (30)
54.5% (254) 41.59 (.00)
Low flow shower heads 48.2% (224) 12.5% (58) 39.4% (183) 7.13 (.31)
Community garden 88.6% (413) 1.7% (8) 9.7% (45) 7.29 (.29)
PV solar energy^ 17.9% (83) 14.4% (67) 67.7% (315) 9.50 (.15)
Cruisers that run on biofuel^ 4.7% (22)
32.6% (152) 62.7% (292) 10.90 (.09)
Green roof on campus^* 18.2% (85) 20.8% (97) 60.9% (284) 16.34 (.01)
Rainwater harvesting^ 10.1% (47) 18.7% (87) 71.2% (331) 3.39 (.76)
Zero waste stadium^* 4.3% (20) 22.5% (105) 73.2% (341) 32.62 (.00)
Note: initiatives that Colgate does not currently have are denoted with (^). Note: significant items are noted with an asterisk (*).

15
Concerns The first question in this portion of the survey asked students to indicate how important
the specific sustainability initiatives are to them. Table 7 shows the results, as well as a cross tabulation means for those involved in green groups on campus. A chi-squared test shows that there are statistically significant differences in importance between members of environmental groups and non-members. Table 7: How important it is to students that Colgate addresses the list of issues.
Initiative Mean Mean (Member of
Environmental Club)
Chi Squared (p-value)
Climate action planning* 4.01 4.38 35.39 (.00)
Sustainability initiatives on campus*
4.33 4.62 23.19 (.00)
Recycling and waste minimization* 4.49 4.68 9.35 (.05)
Energy conservation and efficiency*
4.43 4.67 13.88 (.01)
Renewable energy* 4.35 4.62 14.26 (.01)
Sustainable food and dining services*
4.36 4.68
20.87 (.00)
Water conservation* 4.27 4.58 21.16 (.00)
Energy efficient transportation* 4.26 4.54 15.06 (.00)
Note: significant items are noted with an asterisk (*). The last question in this section asked participants to select their level of agreement with the statement that climate change will be a problem in the present and in the future. Table 8 shows the results.

16
Table 8: Means of climate change viewpoints within two different time frames.
Statement Mean
Climate change is a problem in my lifetime 4.49
Climate change will be a problem for future generations
4.79
Behaviors
Table 9 shows the results to the first behavior section question. The question asked students to indicate how often they partake in the specific sustainability actions on a scale from never to all of the time. Table 10 asks students why they engage in these behaviors. Table 9: A comparison between the total participant means and the environmental club means.
Behavior Mean Mean (Member of Environmental Club
Chi Squared (p-value)
Recycle* 4.23 4.58 24.75 (.00)
Encourage others to recycle* 3.61 4.30 40.15 (.00)
Turn off the water while brushing teeth
4.31 4.58 6.39 (.17)
Use a reusable cup or mug 4.23 4.23 1.52 (.82)
Print double-sided 4.54 4.64 2.56 (.63)
Walk to class 4.27 4.23 3.18 (.53)
Ride cruiser to class 2.23 2.51 7.35 (.12)
Take showers less than 5 minutes 2.63 2.91 9.27 (.05)
Turn off lights when leaving a room*
4.32 4.66 25.29 (.00)
Use energy efficient appliances to conserve energy*
3.13 3.59 22.80 (.00)
Unplug electronics when not in use to conserve energy*
2.82 3.20 11.41 (.02)

17
Eat locally grown or organic foods*
3.12 3.42 20.86 (.00)
Note: significant items are noted with an asterisk (*). A chi-squared test shows that there are statistically significant differences between students in environmental clubs and students not in environmental clubs for six of the initiatives. Table 10: Reasons why individuals participate in sustainable actions.
Reason Percentage of Respondents
Because it is convenient 20.8% (93)
To be sustainable 71.4% (320)
Peer influence 2.2% (10)
Avoid hazards 1.6% (7)
Other 4.0% (18)
The final question asked students how much they are willing to pay per meal at the coop
to reduce waste (Table 11). A chi-squared test shows that there are statistically significant differences by class year. The chi-squared value is 26.18 with a p-value of 0.04. Table 11: Willingness to pay by class year.
Class Year Average Amount
2015 $1.02
2016 $1.20
2017 $1.32
2018 $1.42
Analysis Knowledge

18
The first question in this section was aimed at understanding how Colgate students are most heavily influenced towards sustainability on campus (Table 2). This question is important because it can tell us where the majority of students learn about sustainability. The results can also demonstrate the difference between what the Office of Sustainability is doing to educate students and where students are actually receiving the information. The thing that most influenced students’ understanding of sustainability was a course taken at Colgate. The second highest answer was that students are influenced by friends, and the third highest answer was that students have not been influenced at all while at Colgate. This suggests that at Colgate, academic courses are extremely important in influencing students. Because the majority of participants were influenced by their courses, classes at Colgate are a good place to increase awareness and knowledge surrounding sustainability. Question two asked the participants to indicate how much they agreed or disagreed with the three pillars of sustainability (Table 3). This is extremely important in understanding how students think about the concept of sustainability. Fransson and Garling (1999, p. 373) argue that the level of knowledge for an individual or population can help predict the level of engagement in sustainability. For each of the three categories the means were all above a 4. With these results, we can infer that the students at Colgate have a good understanding of the definition of sustainability. However, there is still room for improvement in students’ understanding of the concept of sustainability. The third question (Table 4) asked how strongly students felt Colgate had a commitment to six different initiatives. The results for this question can tell us a lot about how much students know about different initiatives and issues on campus. All of the means are relatively neutral. The lowest mean is for Colgate’s commitment to reducing emissions from transportation. Contradictory to this, it is important to note is that over 50% of participants indicated that they know Colgate has an electrical vehicle charging station (Table 5). Thus, the lack of transportation emission reduction knowledge may be due to the fact that majority of participants are first years, who constantly see cruisers running up and down the hill. It is possible that they believe that a large number of cruisers are only being filled half full with passengers. Because of this, they conclude that the cruisers are contributing to transportation emissions. With this in mind, the goal of the cruisers is to reduce carbon emissions and reduce the number of individual cars driving to class by providing a form of public transportation (Colgate University Sustainability, 2015). Question four in our knowledge section (Table 5) had thirteen yes or no questions asking if different initiatives exist at Colgate. Five of the initiatives in this list are false; Colgate does not have PV solar energy, cruisers that run on biofuel, a green roof on campus, rainwater harvesting, or a zero waste stadium. Table 6 shows the aggregate results of these knowledge

19
questions by class year. We ran a chi-squared test at the 5% level between these knowledge question and class year and found statistical significance for six of the initiatives. The initiatives that had significance differences in results by class year were thermal solar energy, electric vehicle charging station, electronic waste disposal, protected land in Patagonia sur, community garden, PV solar energy and rainwater harvesting. We believe that in many cases, the significance between class year exists because of students’ exposure to initiatives through their time at Colgate. For example, as upperclassmen begin to live down the hill as they get older, they are more likely to pass the Creative Arts house which has been outfitted with thermal solar energy. As a student spends more time at Colgate they are more likely to be exposed to different things on campus; this is how we explain the significant differences by class year in terms of knowledge about sustainable initiatives on campus. Table 6 shows the aggregate percentage of correct and incorrect answers by class year. As shown, juniors and seniors have a much higher percentage of correct answers compared to sophomores and first years. This table also shows how sophomores have a higher percentage of correct answer than first years, which solidifies our claim that as students get older they become more knowledgeable about campus initiatives. Through the above analysis it is easy to see that students at Colgate have generally high levels of knowledge. While not every initiative is apparent to every student, many initiatives are fairly well known by many. Concerns
As we predicted prior to implementing the survey, high knowledge would lead to high concerns. The first question in the concerns section was aimed at understanding how important different sustainability issues are for students. As seen in Table 7, all of the means are above four. This means that all of the initiatives are at least important to students at Colgate. The chi-squared test that was run for this question shows that there are significant differences between members of environmental clubs or organizations and non-members. Typically people who join an environmental group at Colgate have some sort of passion for the environment and its issues. Therefore, it is logical that the mean level of importance for the different concerns is statistically significant at the 5% level between “green group” members and others.
The second question in the section was aimed at understanding students’ perceptions of climate change impacts (Table 8). As seen in the results, students think climate change will be more significant in the future than it is today, but not by much. Though there were no statistically significant differences between groups, our participants did have a high level of knowledge. It can then be assumed that they understand that while climate change is a present threat, it also will severely affect the future. This is in line with the notion of intergenerational equity, which is included in our definition of sustainability. Intergenerational equity is the idea that well-being is

20
distributed through time to ensure the well-being of both present and future generations (Summers & Smith, 2014, p. 718). Therefore we concluded that the means are very similar (and very high) due to the understanding that our choices not only affect our generation but also affect future generations.
Behavior
Table 9 shows the breakdown of how often students engage in different sustainable behaviors. The behavior with the highest mean is printing double-sided. The Office of Sustainability spearheaded a project which defaulted the settings of most of the printers on campus to print double sided. Obviously this initiative worked very well given that double-sided printing had the highest mean of all sustainable behaviors we researched. The behavior with the lowest mean was riding the cruiser to class. We don’t believe this statistic accurately describes the student body because there was a high number of first years and sophomores that took our survey. First years and many sophomores live in close proximity to the academic buildings and therefore do not need to ride the cruiser to class. The behavior with the second lowest mean was taking showers less than 5 minutes long. This is a great example of why it is so important to assess students’ behaviors; knowing what behaviors students engage in the least often can lead to the creation of new initiatives on campus. As Table 9 shows, we also ran a chi-squared test to test the significance between behavior frequency and membership in an environmental club or organization. The chi-squared test shows that there is a statistically significant difference between students in an environmental group and the rest of the student body for how often students recycle, encourage others to recycle, turn off lights when leaving a room, use energy efficient appliances to conserve energy, unplug electronics when not in use to conserve energy, and eat locally grown or organic food. We believe this difference comes from the fact that students who are in environmental groups know the difference these simple actions can make. They are also more concerned about environmental issues, which leads them to make a constant effort to be sustainable. Lastly, Table 10 shows the cross tabulation of how much people are willing to spend per meal at the coop to reduce waste in relation to class year. The chi-squared test shows significance for difference between class years in relation to how much they are willing to pay. As students get older they are less willing to pay. We hypothesize that this may be due to the fact that many underclassmen are on meal plans and therefore have money at the Coop automatically added to their Gate Cards. By having this money, and not having to continuously load cash onto their student cards or use their own credit cards, the underclassmen may not understand the true value of a dollar. In addition, many seniors are headed to work in the months following college and are trying to save as much money as possible before graduation.

21
Recommendations Major Recommendations The first recommendation we would like to make is increasing the availability, ease, and convenience of sustainable behaviors on Colgate’s campus. We make this recommendation because according to our survey results, the most common sustainable behavior is double-sided printing. Double-sided printing is a default setting on most printers on campus, so this behavior is automatic and convenient. We recommend that in order to increase the frequency of other sustainable behaviors, such as taking showers shorter than five minutes and unplugging appliances when not in use to conserve energy, these behaviors must be as convenient as double-sided printing. One example of this is increasing the use of Smart Strip power strips in residence halls to decrease energy use. We could provide incoming first years with Smart Strip power strips, sell these devices at the Colgate Bookstore and C-Store, and mandate that all students use these devices in their residence halls. This is just one example of increasing the convenience and ease of a sustainable behavior.
The second recommendation we would like to make is to create a space within the orientation schedule to expose students to sustainability related initiatives. In our knowledge section many participants selected “unsure” in Table 5. We believe that to decrease the percentages in this column, the students at Colgate need to be familiarized to the goals of the university. The purpose of implementing sustainability at some point during orientation is to make sure all students come into contact with sustainability, if we leave it up to classes to give the students knowledge about sustainability then we will not be reaching as many students as we could be. In addition, by becoming familiar with the initiatives the students are furthering their knowledge of sustainability. Ultimately this will become the source of knowledge in the survey (see below). The chi-squared tests, shown in Tables 7 and 9, are great proof for how much of a difference being a member of an environmental group on campus is when it comes to one’s concerns and behavior in relation to sustainability. Spreading this passion and membership would be a significant step toward having the ethos of sustainability that is desired by many on this campus. Our recommendation is to increase the presence of these groups on campus. We suggest having a separate activities fair for environmental related groups to increase their exposure. With the vast amount of clubs that exist on this campus it is very easy for ones to get lost in the mix. An environmental activities fair would ensure that students would get exposed to these groups. If membership in these groups increases, it is not too far of a stretch to believe that environmental concerns and behaviors on campus will also increase.

22
Minor Recommendations The obvious outcome of this research is the assessment tool. With that in mind we propose that this be administered to all Colgate students. By doing this the Office of Sustainability will be able to see how the knowledge, concerns, and behaviors change throughout the students time at Colgate to see how much Colgate is or is not contributing to the individuals sustainability growth. This survey can be administered to all students, however given the required amount of time that it would take to reach every student we feel as though it would be easiest to implement it within FSEM’s and Senior Seminars. In order to do this, the questions must be continuously updated to make sure the survey is current. For example, all new sustainability initiatives on campus should be added to the survey. We could also create an “orientation” answer in knowledge question number four. Lastly, many students selected that they partake in certain behaviors “to be sustainable” (Tables 9 and 10). To create an ethos of sustainability at Colgate there needs to be more teaching. By this we mean making sure students know what some sustainable actions are. In other words, there needs to be a way to have these behaviors be easily acted upon. Like we mentioned in the first major point regarding Smart Strip surge protectors, if sustainable items are rapidly available then we can assume that individuals will be more inclined to buy sustainably. This is concluded given the knowledge that the student will be potentially exposed to through sustainability in orientation.

23
References Barlett, P. (2008). Reason and Reenchantment in Cultural Change: Sustainability in Higher
Education. 49(6), 1077-1098. Chicago, Il: The University of Chicago Press. Retrieved: April 3, 2015.
Creswell, J. W. (1994). Research Design: Qualitative, Quantitative, and Mixed Methods
Approaches. p. 116. Lincoln, NE: University of Nebraska. Retrieved: April 11, 2015. Colgate University. (n.d.). Alternative Transportation. Retrieved from Colgate University
Sustainability Website. April 26, 2015. Web. Colgate University. (2011). Sustainability and Climate Action Plan. Hamilton, NY: Colgate
University. Retrieved: February 3, 2015. Earl, C., Lawrence, A., Harris, N., & Stiller, H. (2003). Chrestomathy: Annual Review of
Undergraduate Research at the College of Charleston. 2, 90. Charleston, SC: College of Charleston. Retrieved: April 3, 2015.
Franson, N., & Garling, T. (1999). Environmental Concern: Conceptual Definitions,
Measurement Methods, and Research Findings Journal of Environmental Psychology, 19(4), 369-382.
Rea, L., & Parker, R. (2005). Designing and Conducting Survey Research. San Francisco, CA:
Jossey-Bass. Sadusky, H. (2014). College Student Perception & Behavior Towards Sustainability: Results of
A Campus Survey. Tallahassee, FL: Florida State University. Retrieved March 17, 2015. Web. http://diginole.lib.fsu.edu/uhm/354
Siebert, T. (2002). Designing Surveys that Count. Retrieved: April 11, 2015. Retrieved from
http://www.keene.edu/crc/forms/designingsurveysthatcount.pdf Schahn, J. & Holzer, E. (1990). Studies of Environmental Concern: The Role of Knowledge,
Gender, and Background Variables. 22(6), 767-786. Retrieved: April 15, 2015. Web. http://eab.sagepub.com/content/22/6/767.short
Summers, J., & Smith, L. (2014). The Role of Social and Intergenerational Equity in Making
Changes in Human Well-Being Sustainable. Ambio - A Journal Of The Human Environment, 43(6), 718-728. doi:10.1007/s13280-013-0483-6 Retrieved: April 28, 2015.

24
Theis, T., & Tomkin, J. (2012). Sustainability: A Comprehensive Foundation. Houston, TX: Rice University. Retrieved January 20, 2015.. http://www.earth.illinois.edu/documents/col11325-1.38.pdf
Zilahy, G. (2006). Toward sustainability: The role of higher education: Clean Technologies and
Environmental Policy, 8(1), 1-2. doi:http://dx.doi.org/10.1007/s10098-005-0023-6 Zwickle, A., Koontz, T., Slagle, K., & Bruskotter, J. (2013). Assessing Sustainability Knowledge
of a Student Population: Developing a Tool to Measure Knowledge in the Environmental, Economic, and Social Domains. Columbus, OH: The Ohio State University. Retrieved: February 18, 2015.

25
Appendices Appendix A - Evaluation Tool (Final Survey) Intro: We are students in ENST 390: Community perspectives on environmental issues, currently conducting research on levels of student engagement in sustainability. The purpose of this questionnaire is to gauge and assess your level of engagement with environmental sustainability. Please answer each question as honestly as possible; your responses are completely anonymous and will be used to inform our campus sustainability program. The survey should take between 5 to 10 minutes to complete. Thank you for your participation in this joint Environmental Studies and Office of Sustainability research. Please direct any questions to Andrew Hacker ([email protected]) or April Baptiste ([email protected]). 1. What is your class year? a) 2015 b) 2016 c) 2017 d) 2018 2. What is your (intended) major(s) and/or minor? Three dropdown menus of all potential major and minors 3. Where do you live at Colgate? Dropdown menu of all potential residences 4. Are you a member of an environmental club/organization on-campus? a) Yes b) No 5. Are you a varsity athlete? a) Yes b) No 6. While at Colgate what has had the largest influence on your understanding of sustainability? Dropdown including: a) Course at Colgate b) Office of Sustainability c) Friends d) Maroon News e) Colgate sustainability website f) Colgate social media

26
g) Other h) I have not been influenced If you selected "other," please identify what has had the largest influence on your understanding of sustainability. 7. Please indicate your level of disagreement or agreement with each of the following. (Strongly disagree, disagree, unsure, agree, strongly agree) a) Sustainability includes environmental stewardship b) Sustainability includes social consciousness c) Sustainability includes economic responsibility 8. Please indicate your level of disagreement or agreement with each of the following. (Strongly disagree, disagree, unsure, agree, strongly agree) a) I feel that Colgate University has a strong commitment to carbon neutrality b) I feel that Colgate University has a strong commitment to design and construct green building c) I feel that Colgate University has a strong commitment to local sustainable food d) I feel that Colgate University has a strong commitment to renewable energy on campus e) I feel that Colgate University has a strong commitment to reduce emissions from transportation f) I feel that Colgate University has a strong commitment to waste reduction through recycling and composting 9. Please indicate whether or not Colgate currently has the following initiatives. (Yes, No, Unsure) a) Thermal Solar Energy b) PV Solar Energy c) LEED Certified Green Building d) Electric Vehicle Charging Station e) Electronic Waste Disposal f) Protected land in Patagonia Sur g) Certified forest for long-term sustainability h) Low flow shower heads i) Cruisers that run on biofuel j) Green roof on campus k) Rainwater harvesting l) Zero Waste Stadium m) Community Garden 10. Please indicate how important it is to you that Colgate addresses the following issues.(not at all important, unimportant, neither important nor unimportant, important, extremely important)

27
a) Climate action planning b) Sustainability initiatives on campus c) Recycling and waste minimization d) Energy conservation and efficiency e) Renewable energy f) Sustainable food and dining services g) Water conservation h) Energy efficient transportation 11. Please indicate your level of disagreement or agreement with each of the following. (Strongly disagree, disagree, unsure, agree, strongly agree) a) Climate change is a problem in my lifetime b) Climate change will be a problem for future generations 12. Please indicate how often you engage in each of the following behaviors, whenever possible. (Never, rarely, sometimes, often, all the time) a) Recycle b) Encourage others to recycle c) Turn off water while brushing teeth d) Use a reusable cup or mug e) Print double-sided f) Walk to class g) Take showers less than 5 minutes h) Turn off lights when leaving a room i) Use energy efficient appliances to conserve energy j) Unplug electronics when not in use to conserve energy k) Eat locally grown or organic foods 13. If you engage in any of the behaviors listed above, please indicate the primary reason. (Dropdown) a) It is convenient b) To be sustainable c) Peer Influence d) To avoid hazards e) Other 14. If you do not engage in one or more of the behaviors listed above, please indicate the primary reason. (Dropdown) a) Inconvenient b) Don’t see environmental benefits c) Other

28
If you selected other please state your reason. 15. How much extra would you be willing to pay per meal at the coop to reduce waste? a) $0 b) Less than $1 c) Between $1 and $2 d) Between $2 and $3 e) Between $3 and $4 f) Above $4 16. To be eligible for a reward please enter your Colgate email below