Embed Size (px)
Citation preview

ELSEVIER Structural Safety 14 (1994) 277-298
Structural safety
Reliability evaluation of reinforced concrete beams
Renj ian Lu, Y u a n h u i Luo, Joel P. Conte *
Department of Civil Engineering, Rice University, P.O. Box 1892, Houston, TX 77251, USA
Abstract
The purpose of this paper is to evaluate the time-invariant reliability of reinforced concrete beams designed under the provisions of the ACI Building Code. A wide range of practical design situations is considered. The beams are subjected to bending, shear, and torsion. The interaction between shear and torsion is considered via an elliptical failure surface defined in the shear-torsion stress space. No interaction is assumed between flexural resistance and resistance in both shear and torsion. Representative statistics and appropriate probability distributions of the basic resistance and load variables are selected from previous related work. The reliability analysis is performed using modern reliability methods, in which the formulation of the limit-state functions is consistent with the underlying design criteria. Reliability indices for various failure modes are compared and a system reliability analysis is performed to include all failure modes. It is found that the reliability indices are most sensitive to live load, model uncertainties, and material strengths. For the failure modes considered, the reliability indices are found to be rather insensitive to design parameter values, indicating that the ACI Building Code achieves its desired objective of uniform reliability across a wide range of design situations.
Key words: Reinforced concrete beam; Bending; Shear; Torsion; Shear-torsion interaction; Component and system reliability analysis; FORM; SORM; Limit-state function; Reliability index
1. I n t r o d u c t i o n
Probability-based structural design became practically realizable in the 1970's and its conceptual framework was developed by Ang and Cornell [1] influenced by Freudenthal's pioneering work on structural safety [2]. Evaluation of structural safety associated with the design procedure was studied by Ellingwood and Ang [3] for reinforced concrete beams in pure bending and pure shear. The so-called safety index method was also used by Ravindra et al. [4] to design reinforced concrete beams and structural steel members. In these early studies, the
* Corresponding author. * Discussion is open until February 1995 (please submit your discussion paper to the Editor, Ross B. Corotis).
0167-4730/94/$07.00 © 1994 Elsevier Science B.V. All rights reserved SSDI 0167-4730(94)00007-D

278 R. Lu et al. / Structural Safety 14 (1994) 277-298
reliability index was calculated by the MVFOSM ~ method, which lacks invariance with respect to the formulation of the limit-state function, i.e., equivalent formulations of the limit-state lead to different values of the reliability index. Since then, rapid developments have occurred in reliability analysis methods and reliability-based structural design, generating a rich literature on the subject. Ellingwood [5] further investigated probability-based design criteria, using the FOSM 2 method, which is invariant with respect to the limit-state formulation. Although originally formulated in a deterministic framework, current design codes, such as ACI 318-89 for reinforced concrete structures [6], have gradually incorporated results of probability theory.
Parametric reliability analyses of reinforced concrete beams designed according to the ACI Code are performed in this study. Two elements of major importance are required for this purpose. First, appropriate behavioral models of the beam subjected to bending and combined shear-torsion are essential for the formulation of realistic limit-state functions or failure conditions. In the above referred studies, reliability analyses were carried out for members under single action, such as pure bending or pure shear. In the present study, the limit-state formulation will be improved for reinforced concrete beams by accounting for the interaction between shear and torsion at failure. Experimental and analytical research on reinforced concrete members has contributed to a refined understanding of both flexural behavior and interaction between shear and torsion [9-11]. These models will be employed to derive the limit-state functions used herein. Second, once the limit-state functions are defined, usually as complicated functions of the basic variables, a versatile and efficient reliability algorithm is necessary to estimate the corresponding modal probabilities of failure or a directly related quantity called the reliability index. Reliability analysis methods such as FORM 3, SORM 4 and directional Monte Carlo simulation have been developed extensively in recent years [7,8] and implemented in general-purpose computer programs [12]. System reliability analysis is required when a structure or structural element has several potential failure modes, which is the case for a reinforced concrete beam subjected simultaneously to bending, shear and torsion. System reliability analyses of reinforced concrete beams were not performed in the above referred studies. Today, system reliability can also be evaluated using existing structural reliability computer programs. In this study, modern full-distribution reliability methods and refined mechanical models for concrete beam behavior, especially for shear-torsion interaction, are combined to evaluate the reliability of beams as implied by application of the current design code.
2. Design of reinforced concrete beam
The reliability analysis will focus on a typical spandrel beam and an interior beam of the continuously-supported one-way floor system shown in Fig. 1. The spandrel beam is subjected
Mean-value first-order second-moment. 2 First-order second-moment. 3 First-order reliability methods (using full probability distributions). 4 Second-order reliability methods (using full probability distributions).

R. Lu et al . / Structural Safety 14 (1994) 277-298 279
[ 9 L 1 _ I _ L 1 _ I
Fig. 1. One-way slab and beam system.
to bending moment, shear force, and torque, whereas the interior beam is essentially subjected to bending and shear only. No slab participation effects are considered for the resistance of the rectangular beams. A uniform live load is applied on the floor. By changing the short-to-long span ratio, L 1 / L 2 , a number of combinations can be obtained concerning the relative magnitudes of bending moment, shear force and torque.
The total load intensity from the floor, p (psf), consists of the factored live and dead loads:
p = "yL L + TDWhs (1)
where YL and YI~ are the live and dead load factors; L is the live load intensity (psf); w is the unit weight of concrete (pcf); and h s is the slab thickness (increased to account for additional dead loads such as topping and partitions). The uniform load per unit length of beam is calculated as follows:
q = ½PL 1 + yDWhbw (spandrel beam)
q = p L 1 -}- yDWhbw (interior beam) (2)
where h and b w represent the height and width of the beam, respectively. Hence the maximum bending moment and shear force, occurring at the ends of the beam, are
1 qL 2 Mu = 2, (3)
V u = ½qL 2. (4)
The interior beam is free of torsion, whereas the spandrel beam has a maximum torque at the ends,
Tu = ½mL 2 (5)
l pL2 is the distributed torque along the beam as suggested by the ACI Code in which m = ~ procedure.
Once the external bending moment, shear force and torque are determined, the design procedure for these load effects can be applied. The beam dimensions are usually selected a priori, leaving the reinforcement ratios as the dependent design variables to be determined from strength requirements. Then, these strength models are employed to formulate the

280 R. Lu et al. /Structural Safety 14 (1994) 277-298
various limit-state functions in which the resistance and load variables are unfactored and modeled as random variables.
Bending. To satisfy the flexural strength requirement, the applied factored bending moment , M u, must satisfy the following inequality:
M u <~ 4'pfybw de 1 2(0.85)f~ ' (6)
In the above relation, d = effective depth of the beam; 4' = flexural strength reduction factor ( = 0.9); p =As/(bwd), the reinforcement ratio; and fy and fd represent the yield strength of reinforcing steel and compressive strength of concrete, respectively.
Shear. The shear strength requirement is satisfied if the factored nominal shear strength of the beam with vertical stirrups equals or exceeds the applied factored shear force, V u, namely
Vu <~ 4'(2vf[bwd + fyd~-~ ) (7)
where 4' = shear strength reduction factor ( = 0.85); A v = shear stirrup area, s = spacing of stirrups.
Torsion. The torsional strength requirement is met provided that the factored nominal torsional strength equals or exceeds the applied factored torque, T u, i.e.,
in which a t = 0.66 + 0.33(Yl/X 1) <~ 1.5 is an empirical geometric coefficient de termined from test data [11]; A t = area of one leg of a closed vertical stirrup resisting torsion within a distance s; 4' = torsional strength reduction factor ( = 0.85); x and y correspond to the short and long dimensions of the rectangular beam cross section, namely b w and h, respectively, if b w ~< h; x 1 and Yl are the shorter and longer center- to-center dimensions of the closed rectangular stirrups.
Combined shear-torsion. In computing the beam resistance under combined shear-torsion, the interaction effect has to be considered. Define r c and Vc, respectively, as the concrete torsional and shear strength capacity under the combined action of shear and torsion, and let rco and Vco denote the concrete torsional and shear resistance under pure torsion and pure shear, respectively. The code provisions of ACI 318-89 are based on the following two assumptions. First, in combined shear-torsion the interaction between r c and v c can be represented by an elliptical function (see Fig. 2): ,)2 (,)2
.+ - - = 1 ( 9 )
in which the pure torsional capacity %0 = 2 . 4 f ~ (psi) and the pure shear capacity Vco = 2 . 0 f ~ (psi). This assumption has been verified experimentally [11]. Second, the shear-to-torsion stress

R. Lu et al. / Structural Safety 14 (1994) 277-298 281
V c
t (,°)2 (vol2 Vc° C o p c r e t e ~ - ~ l / - "J/'~Applied shearing stress
~ rfa(a)
~ "r, c
resistance
O "l;co Fig. 2. Interaction model of torsion and shear resistance.
ratio remains constant during the loading history. Under these assumptions, the shear and torsion resistances of the beam are given by
Vu<6( (1o)
Av) 2"0 f~bwd +fyd~-
~/1+( 2"5c:u 2 Vu ) (11)
where the coefficient C t : bwd/x2y. The strength reduction factor, ~b, is set to 0.85 by the Code for both shear and torsion.
3. Reliability analysis
3.1. Analysis methods
The objective of a "component" reliability analysis is to estimate the probability of failure
P f= f fx(x)dx (12) "{g(x) < O}
where the random vector X contains all the uncertain basic variables such as material properties, loads, member dimensions, and model uncertainty parameters; fx(X) represents the

282 R. Lu et al. / Structural Safety 14 (1994) 277-298
joint probability density of the basic random variables; and g(x) is the limit-state function corresponding to the failure mode considered and defined such that the failure event corre- sponds to g ~< 0. In the present study, first- and second-order reliability methods, commonly referred to as FORM and SORM, as well as the directional simulation method are employed. These methods are described elsewhere in the literature [7,13,14] and only a brief summary is presented below.
FORM and SORM reliability methods have been developed to approximately evaluate the probability of failure (Eq. (12)) or probability volume in the failure region defined by {g(x) ~< 0}. First, the original space X is transformed into the standard normal space U through a transformation U = T(X) which always exists for random variables having strictly increasing continuous joint cumulative distribution functions. Then Eq. (12) becomes
1 Pf = f(G(u)~o}(2rr)-n/2 exp(-- ~uVu)du (13)
where n is the number of random variables; and G(u) the limit-state function in the standard normal space. The next stage consists in finding the point u* on the limit-state surface G(u) = 0 which is nearest to the origin. This point, known as the design point, is the most likely failure point and is an opt imum point at which to approximate the surface G(u) = 0, since the primary contribution to the probability integral in Eq. (13) comes from the part of the failure region closest to the origin. The FORM approximation is obtained by replacing G(u)= 0 by the tangent hyperplane at u*, and the corresponding first-order estimate of Pf is Pfl = qb(-/3), where ~ ( . . . ) is the standard normal probability distribution function and /3, called the reliability index, is the distance from the origin to the nearest point on the limit-state surface, u*. The SORM approximation is obtained by replacing the limit-state surface by a hyper- parabolic surface at the design point u*. The corresponding second-order estimate of the failure probability, Pf2, is obtained in terms of /3 and the principal curvatures of the hyper- parabolic surface [7]. Several exact and approximate techniques to fit the approximating second-order surface to the limit-state surface at the design point have been developed. In the present study, the point-fitting method developed by Der Kiureghian et al. [14] is used.
FORM analysis has the most important feature of readily providing the sensitivities of the reliability index /3 and of the first-order estimate of the failure probability Pf~ with respect to both probability distribution and limit-state function parameters. These sensitivities are very useful in identifying the relative importance of the basic variables in terms of the failure probability; they also provide insight into the behavior of complex systems, and can be used to suggest design alternatives to improve the reliability of the system such as in reliability-based opt imum design.
The joint distributions of the random variables employed in this study are assumed to be of the Natal type, as described by Liu and Der Kiureghian [13]. The Natal model assumes that available observations of the random variables are sufficient for selecting appropriate marginal distributions but insufficient for determining joint statistics beyond the covariances, which corresponds to a case of incomplete probability information.
Estimation of the failure probability accounting for multiple failure modes and therefore multiple limit-state functions is a system reliability problem. The reliability of the reinforced concrete beams considered in this study against failures in flexure, shear, and torsion is

R. Lu et aL / Structural Safety 14 (1994) 277-298 283
determined by representing the beams as a series system. Second-order approximations of the system failure probability are obtained based on the second-order modal approximation surfaces together with a directional simulation method [15]. All the component and system reliability calculations reported hereafter have been performed using CALREL, a general-pur- pose reliability analysis code [12].
3.2. Basic variables
(1) Live load. The National Bureau of Standards (NBS) has published the results of the first extensive load survey of office buildings in the U.S., wherein the data on unit floor loads were presented for various conditions. Ellingwood et al. [16] suggested that the live load in office buildings fit a type I extreme value distribution. The mean of the 50 year maximum value is given by
[ E[L] = L 0 0.25 + ~ - - (psf) (14)
in which L 0 = basic unreduced live load (see Table 2 of ANSI A58.1-1982); A = influence (rather than tributary) area expressed in square feet. However, in order to evaluate the reliability of the Code-based design, E[L] is varied by specifying a live-to-dead load ratio in order to cover a wide range of possible live loads. In this manner, numerous design situations and corresponding reliability analyses are performed. If this ratio is denoted by 0, then the design live load intensity L in Eq. (1) is given by
L=O'(whs) (15)
where (wh S) is the dead load per unit floor area. The design live load intensity of Eq. (15) is also used as the expected value, E[L], for the reliability analysis. A coefficient of variation (c.o.v.) of 25 percent is assigned to L as suggested by Ellingwood et al. [16]. Using a type I extreme value distribution to describe the probabilistic nature of the maximum live load, a time-invariant reliability problem under extreme live load condition is solved.
(2) Material strengths. The variability of the static yield strength fy of reinforcing steel based on nominal area of bar cross section can be represented by a beta distribution as shown in a statistical study by Mirza and MacGregor [17]. The mean and c.o.v, of the yield strength are 48.8 ksi and 0.107, respectively, for Grade 40 reinforcing bars, and 71.0 ksi and 0.093, respec- tively, for Grade 60 steel. The lower and upper bounds of these beta distributions are 33/62 ksi for Grade 40 bars, and 54/102 ksi for Grade 60 bars. The overall variability of reinforcing bars from many locations is considered here, as opposed to within a single bar and in-batch variabilities.
In a different study on the variability of concrete strength, Mirza et al. [18] found that the compressive strength of in-situ normal weight concrete for loading rates similar to that of a cylinder test (35 psi /s) can be described by a normal distribution. The mean value of this distribution is equal to 0.675f" + 1100 ~< 1.15f~ (psi) where f~ is the nominal design strength. Based on several studies on the dispersion of concrete strength [3,5,18], a representative value for the c.o.v, of f~ was taken as 0.18. This c.o.v, includes the inherent variability of the "real"
284 R. Lu et al. / Structural Safety 14 (1994) 277-298
cylinder strength and the in-situ variations; the variations due to the loading rate effects are negligible. In this study, two types of concrete corresponding to f" = 3 and 4 ksi are considered.
Although the splitting tensile strength of concrete is usually related to the square root of its compressive strength, the variability of the former variable derived analytically from the variability of f~ is very different from the observed variability. Therefore , f ~ is introduced as an additional basic variable. According to the recommendat ions of Mirza et al. [18], a normal distribution is used to describe ~/~ with a mean equal to the square root of the nominal compressive strength, and a c.o.v, of 0.18.
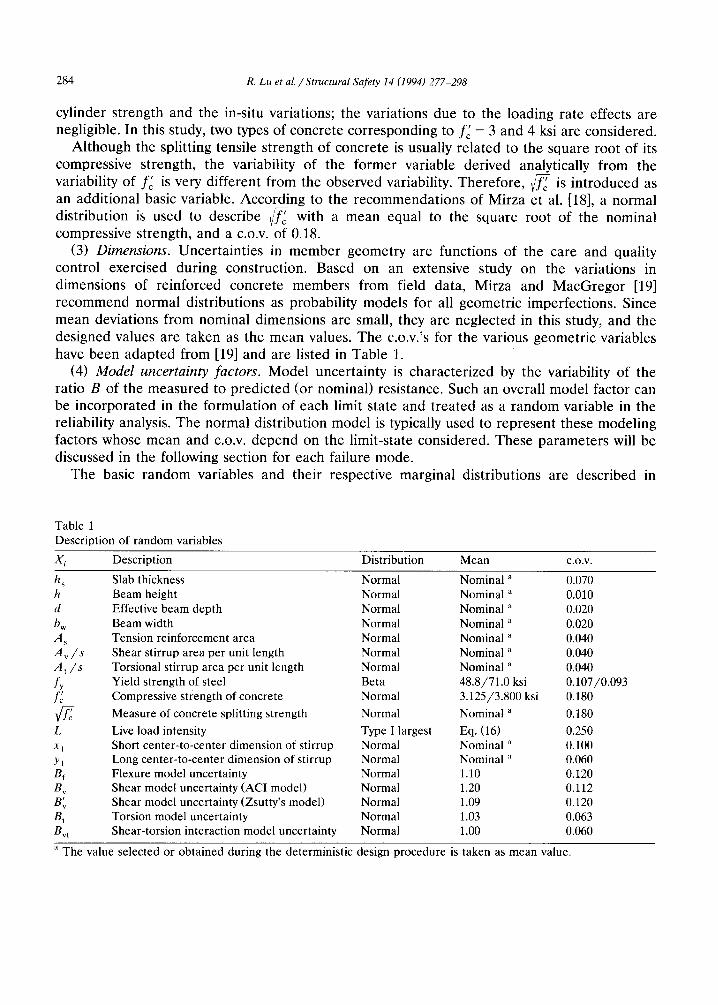
(3) Dimensions. Uncertaint ies in member geometry are functions of the care and quality control exercised during construction. Based on an extensive study on the variations in dimensions of reinforced concrete members from field data, Mirza and MacGregor [19] recommend normal distributions as probability models for all geometr ic imperfections. Since mean deviations from nominal dimensions are small, they are neglected in this study, and the designed values are taken as the mean values. The c.o.v.'s for the various geometr ic variables have been adapted from [19] and are listed in Table 1.
(4) Model uncertainty factors. Model uncertainty is character ized by the variability of the ratio B of the measured to predicted (or nominal) resistance. Such an overall model factor can be incorporated in the formulation of each limit state and t reated as a random variable in the reliability analysis. The normal distribution model is typically used to represent these modeling factors whose mean and c.o.v, depend on the limit-state considered. These parameters will be discussed in the following section for each failure mode.
The basic random variables and their respective marginal distributions are described in
Table 1 Description of random variables
X i Description Distribution Mean c.o.v.
h s h d bw A~ A v / s A t / s fy f; C L XI
Yl Bf Bv B" Bt Bvt
Slab thickness Normal Nominal a 0.070 Beam height Normal Nominal a 0.010 Effective beam depth Normal Nominal a 0.020 Beam width Normal Nominal a 0.020 Tension reinforcement area Normal Nominal a 0.040 Shear stirrup area per unit length Normal Nominal a 0.040 Torsional stirrup area per unit length Normal Nominal a 0.040 Yield strength of steel Beta 48.8/71.0 ksi 0.107/0.093 Compressive strength of concrete Normal 3.125/3.800 ksi 0.180 Measure of concrete splitting strength Normal Nominal a 0.180 Live load intensity Type I largest Eq. (16) 0.250 Short center-to-center dimension of stirrup Normal Nominal ~ 0.100 Long center-to-center dimension of stirrup Normal Nominal ~ 0.060 Flexure model uncertainty Normal 1.10 0.120 Shear model uncertainty (ACI model) Normal 1.20 0.112 Shear model uncertainty (Zsutty's model) Normal 1.09 0.120 Torsion model uncertainty Normal 1.03 0.063 Shear-torsion interaction model uncertainty Normal 1.00 0.060
a The value selected or obtained during the deterministic design procedure is taken as mean value.

R. Lu et al. / Structural Safety 14 (1994) 277-298 285
Table 1. Although not a limitation of F O R M / S O R M analysis, all variables are assumed to be mutually statistically independent . Most of the random variables considered are inherently uncorrelated and the weak correlation between beam section and stirrup dimensions, and reinforcement location, is neglected. The prescribed floor dimensions are assumed to be less variable than the beam cross section dimensions and are therefore taken as deterministic.
3.3. Limit-state functions
The limit-state functions gi(X) for the various failure modes are formulated as gi(X)= Ci (X) - Oi(X) where C i and O i denote the modal capacities and demands, respectively, and are given below.
Bending. When a reinforced concrete beam is loaded up to failure, three distinct flexural failure modes are possible. The particular failure mode that occurs is dictated by the percent- age of reinforcement steel located in the tension zone. If the beam is lightly reinforced, the beam will fail due to sudden yielding of the steel which cannot carry the stress redistribution caused by the cracking of concrete; such a failure is of the brittle type, characterized by a rapid crack development. If the beam is over-reinforced, the beam will fail by crushing of the concrete, also in a brittle fashion. The following two limit-state functions define analytically the conditions of light and heavy reinforcement:
200 gl =As -~-ybwd, (16)
0.85/31f" 87000 g2 =As bwd. (17)
fy 87000 + fy
The condition {gl < 0} corresponds to a lightly reinforced member, whereas the condition {g2 > 0} indicates an over-reinforced member, since in the latter case the tension reinforcement area A S is larger than the balanced one. The beam is moderately reinforced otherwise, namely when the condition {(gl > 0) n (g2 < 0)} holds. In Eq. (17), 0.85f~ is the average concrete stress acting over an equivalent compression zone of depth /31c where c is the distance between the compression face and the neutral axis. Based on experimental results, ACI 318-89 prescribes /31 = 0.85 for concrete with fc ~< 4 ksi and 0.05 less for each ksi of f" in excess of 4 ksi. The conditional probabilities of flexural failure given that the beam is lightly, moderately, or over-reinforced are determined respectively by using the following limit-state functions:
g3 = B f (1 .25bwh2~cc ) - M ,
g4 = B f A s f y d 1 . 7 f ~ b w
(18)
1 2 r g5=nf(~bwd f~)-M (20)
where the external bending moment M is produced by the unfactored floor live and dead loads and the own weight of the beam, as expressed by Eqs. (1)-(3). The model factors for g3, g4, and gs should be treated as having different means and c.o.v.'s. However, due to the scarcity of
- M , (19)

286 R. Lu et al. /Structural Safety 14 (1994) 277-298
experimental data for lightly and over-reinforced beams, the distribution parameters for the moderately reinforced case have been adopted uniformly for the three cases. This approxima- tion is further justified by the negligible contribution of g3 and g5 to the failure probability as discussed below. Based on the results of the statistical studies reported by MacGregor et al. [20] on the resistance of reinforced concrete members, a mean of 1.10 and c.o.v, of 0.12 have been chosen for Bf. These statistics have also been adopted by Israel et al. [21].
Shear. When the concrete shear strength is not sufficient to resist the external shear force, shear reinforcement in the form of stirrups, assumed vertical in this study, is required to provide the additional resistance. With A v defined as the area of shear reinforcement within a distance s, the limit-state function representing shear failure is given by
g6 = Bv( 2~-f~ bwd + f yd ~ ) - V (21)
according to ACI 318-89 [6], or by
' = Bvbd' [ 2"29'6"4vJ ~( ' / f ' -77)(As]l /3(d) ] ~ + fY -blAv l - s - V (22) g6
according to Zsutty [22]. In Eqs. (21) and (22), V is the shear force produced by the external live and dead loads as calculated from Eqs. (1), (2), and (4), omitting the load factors. The Zsutty's model is more accurate for predicting the shear capacity than the more commonly used ACI model. However, it is used here only for purposes of comparison with the ACI model. If the amount of shear reinforcement is relatively high with respect to the size of the beam cross section, shear reinforcement will not yield and shear failure is controlled by the strength of
FF/- concrete. In this case, the shear strength contribution of the steel is limited to 8vf c bwd, and the corresponding limit-state function is
g7=BvlO(f;bwd-V. (23)
In all cases of this study, the beams are purposely designed such that lateral shear reinforce- ment is needed and shear failure occurs by diagonal cracking followed by yielding of the stirrups and crushing of concrete. In other words, the analysis examines the reliability of beams designed under normal situation, namely moderate reinforcement; this also applies to flexure and torsion. According to the results of Mirza and MacGregor [23] on statistical analysis of shear strength, the following parameters have been used: a mean of 1.20 and c.o.v, of 0.112 for the shear modeling factor B v of the ACI model, and a mean of 1.09 and c.o.v, of 0.125 for the shear modeling factor B'v of the Zsutty's model. In the ACI models g6 and g7, the same shear modeling factor has been assumed for the moderately and over-reinforced cases for lack of experimental results.
Torsion. When lateral torsional reinforcement is required to supplement the torsional resistance provided by the concrete, the limit-state function corresponding to torsion failure is of the form
gs= Bt(O.8~ffcX2y + atxly,fy-~ ) - T (24)

R. Lu et al. / Structural Safety 14 (1994) 277-298 287
in which the applied torque T is obtained from Eqs. (1) and (5) without the load factors. When the amount of torsion reinforcement is relatively high with respect to the size of the beam cross section, the limit-state function reduces to
g 9 = B t ( 4 . 0 f f ~ x Z y ) - V (25)
following the same reasoning as in developing Eqs. (21) and (23). The following statistics for the torsion modeling factor B t a r e given in [10]: a mean of 1.03 and c.o.v, of 0.063 for the moderately reinforced case, and a mean of 1.18 and c.o.v, of 0.14 for the over-reinforced case.
Combined shear-torsion. When a cross section is subjected to both shear and torsion, the concrete is resisting the total shear stress in a combined and optimal way. The interdependence between the shear resistance contribution, v¢, and the torsional resistance contribution, r c, is represented by the interaction equation expressed in Eq. (9), which corresponds to a quarter ellipse in the first quadrant of the torsion-shear stress space, see Fig. 2. When expressed in parametric form, Eq. (9) reads
r c = "rco cos a, v c = Vco sin a. (26)
The direction a, which is uncertain, can be treated as a random variable distributed in the range (0, "rr/2). An option for the distribution of a is the uniform distribution which would imply that, regardless of the relative amplitude of the applied shear and torsional stresses, the relative amplitude of the shear and torsional resistance contributions provided by the concrete, Vc/'r c = tana, can take any value between 0 and ~, as long as these two resistance components are related by Eq. (9). Notice that the total shear and torsional load effects are balanced by the shear and torsional actions developed by both concrete and steel. The assumption of a uniform distribution for a is physically unrealistic and should result in a conservative estimate of the resistance to shear and torsion, and consequently of the reliability estimate. An alternative is the Dirac delta distribution for c~, implying that the ratio -Cc/V c, of the shear to torsional resistance contribution of concrete is identical to the ratio of shear to torsional load effect. A better choice for the probability distribution of a, f~(a), is to consider a distribution concen- trated around the direction of the load effects as indicated in Fig. 2. Accordingly, the distribution parameters of a are functions of the loading random variables. Since no experi- mental or analytical information is available to deduce such a distribution, the Dirac delta distribution is adopted in this study. A closer examination of the Code design formulas indicates that they are based on the same assumption.
Under combined shear-torsion, the beam section fails when the concrete has reached its full combined shear-torsional resistance and the total lateral reinforcement provided has yielded and is incapable of resisting further shearing stresses. With this argument, the interaction between torsion stirrups and shear stirrups is accounted for as well. The underlying assumption is that torsion stirrups should not remain unyielded while the beam cross section has already failed in shear, and vice versa. Following this reasoning, the required contribution of the stirrups to the torsional resistance, Ts, is given by the applied torque minus the torsional resistance provided by concrete. The required torsion stirrup area per unit length of beam, A~eq/s, is then computed from the relation:
A~q T s = T - T c = o l t X l Y l f y - - (27)
s

288 R. Lu et al. /Structural Safety 14 (1994) 277-298
Similarly, the required shear stirrup area per unit length of beam, / [ r e q / ~ is obtained from A A V / ~ ,
Areq V
V s = V - V c = f y d - - (28) s
Therefore, the limit-state function representing section failure under combined shear-torsion can be expressed as
A t + - - - (29) gl0 = Bvt s 2 s s 2 s
in which ( A t / s +½Av/s) is the provided area (capacity) per unit length of one leg of a closed 1Areq/e) stirrup, and ( A ~ e q / s + 2za v / o , is the corresponding required quantity (demand). Due to the
symmetry of shear deformation and the anti-symmetry of torsional deformation, failure occurs on the side where shear and torsional stresses act in the same direction. For the shear-torsion interaction failure mode, the model uncertainty is expressed in this study as the ratio of the "equivalent" lateral reinforcement (which would result into the actual shear-torsion capacity by using the proposed interaction model) to the provided one. Based on judgement and interpre- tation of scarce experimental results [24], a mean of 1.0 and a c.o.v of 0.06 have been selected to represent the normal random variable Bvt.
Beam failure as a series system. When subjected to bending, shear and torsion, the beam could fail either in flexure or combined shear-torsion or both. Thus the reliability of the beam can be analyzed as a series system whose components are the flexure and shear-torsion failure modes. Other system failure conditions exist such as failure in flexure and shear without torsion, but they will not be given separate consideration here, since their treatment is not different from that for the flexure-shear-torsion failure mode.
4. Results and discussion
Based on the basic random variables defined above and limit-state functions consistent with traditional mechanical models of reinforced concrete behavior, the general-purpose structural reliability analysis program CALREL [12] is used to compute component and system reliability indices for various loading conditions. The component reliability indices for the flexure, shear, and torsion individual failure modes are shown in Figs. 3, 4 and 5, respectively, in terms of the live-to-dead load ratio. Two groups of material strength have been considered, namely (fy = 40 ksi, f" = 3 ksi) a n d ( f y = 60 ksi, f" = 4 ksi). In Fig. 4, the results for both the ACI and the Zsutty's shear failure models are presented. It is seen that the Zsutty's model leads to a larger sensitivity of/3 with respect to the material strengths than the ACI model. Overall these two models result into similar/3 values. In the sequel, only the ACI shear model will be used for comparison purposes with other failure modes. The drop of the reliability index at the lower end of the live-to-dead ratio can be explained by the fact that in this parameter range, shear resistance is increasingly contributed by concrete which has a wider strength distribution than steel.
In the design phase, the beam is sized to attain a moderate reinforcement ratio. However, even though the beam is designed to be moderately reinforced, the reliability analysis must

R. Lu et al. / Structural Safety 14 (1994) 277-298 2 8 9
6.0
5.5
5.0
4.5
p 4.0
3.5
3.0
2.5
2.0 0.0
fy = 40 ksi, fo' = 3 ksi
. . . . fy = 60 ksi, f~' = 4 ksi
i i i i h i
0.5 1.0 1.5 2.0 2.5 3.0
Live-to-Dead Load Ratio (0)
10"S
10-7
10 ~
10"5
Pf
110 4
10-3
10-2
3.5
Fig. 3. Flexure reliability index vs. live-to-dead load ratio.
consider the events in which the reinforcement ratio is below the minimum or above the balanced ratio if, according to the chosen probability distribution functions, these events have a non-zero probability of occurrence. For the probability distributions used and the values of the steel ratio adopted in the design, it was found that the probabilities of light- and over-rein- forcement are of very small magnitude (10 -4 or less). Therefore, the probabilities of the intersections of light-reinforcement and over-reinforcement with flexure failure are negligible compared to the probability of flexure failure under moderate reinforcement, and have been neglected.
6.0
5.5
5.0
4.5
4.0
3.5
3.0
2.5
2.0
fy = 40 ksi, f¢' = 3 ksi A C I m o d e l { . . . . . . fy = 60 ksi, f¢' = 4 ksi
Zsut ty ' s m o d e l { o o fy = 40 ksi, f=' = 3 ksi - ~ - - e - fy 6 0 k s i , f=' 4 k s i
~r
10 .8
10"7
10 ~
10-5
Pr
10"4
10-3
10-2
0.0 0.5 1.0 1.5 2.0 2.5 3.0 3.5
Live-to-Dead Load Ratio (O)
Fig. 4. Shear reliability index vs. live-to-dead load ratio.

2 9 0 R. Lu et al. /Structural Safety 14 (1994) 277-298
6.0
5.5
5.0
4.5
13 4.0
3.5
3.0
fy = 4 0 ks i , f¢' = 3 ks i
. . . . fy = 6 0 ks i , f~' = 4 k s i
10-8
10-7
10 ~5
10-5
Pf
104
10 -3
2.5 10-2
2.0 ~ ~ ~ ~ ~ 0.0 0.5 1.0 1.5 2.0 2.5 3.0 3.5
Live-to-Dead Load Ratio (0)
Fig. 5. Torsion reliability index vs. live-to-dead load ratio.
Then the beam is examined under the shear-torsion interaction mode. The shear-torsion component reliability index is reported in Fig. 6 in terms of the live-to-dead load ratio, in Fig. 7 in terms of the total lateral reinforcement ratio (1/bwd)(2At/s +Av/s), and in Fig. 8 as a function of the torsion-to-shear reinforcement ratio (At/s)/(A,:/(2s)). Both Figs. 6 and 7 contain two sets of material strengths (fy and f ' ) . Notice that each point defining the/3-curves corresponds to a specific design; hence all design parameters change from one point to another. The reliability index /3 is found to be relatively insensitive to the total lateral reinforcement ratio and to the torsion-to-shear reinforcement ratio. The results of this study
6.0
5.5
5.0
4.5
I~ 4.o
3.5
3.0
2.5
2.0
- - fy = 4 0 ksi, f~' = 3 ksi
. . . . fr = 6 0 ksi , f¢' = 4 ksi
l0 8
10 7
10 -6
10 -5
10 -4
10 -3
10 -2
0.0 0.5 1.0 1.5 2.0 2.5 3.0 3.5
Live-to-Dead Load Ratio (0)
Fig. 6. Shear-torsion reliability index vs. live-to-dead load ratio.

R. Lu et a l . / Structural Safety 14 (1994) 277-298 2 9 1
6.0
5.5
5.0
4.5
4.0
3.5
3.0
- - fy = 4 0 ks i , f j = 3 ks i
. . . . fy = 6 0 ks i , f~' = 4 ks i
10-8
10 .7
10 "5
10-5
P ,
10 .4
10 -3
2.5 10-2
2.0 , , ~ ~ , , , 2.0 3.0 4.0 5.0 6.0 7.0 8.0 9.0 10
Total Lateral Reinforcement Ratio 1 0 0 ( 2 A t + @ ) b w d \ s
Fig. 7. Shear-torsion reliability index vs. total lateral reinforcement ratio.
indicate that the reliability index/3 for shear-torsion interaction is mostly influenced by the live load, the material strengths, and the model uncertainty factor.
The component reliability index as a function of the live-to-dead load ratio is plotted in Fig. 9 for all the individual failure modes, namely flexure, shear, torsion, and combined shear-tor- sion. First, it is noticed that all the component failure probabilities are of the same order of magnitude, namely from 10 -3 to 10 -4. In the range of l ive-to-dead load ratio larger than one (e.g., warehouses) , the reliability against flexure failure is lower than the reliability against any
6.0
5.5
5.0
4.5
]3 4 .0
3.5
3.0
- - L a r g e cross s e c t i o n . . . . M e d i u m cross s ec t i o n . . . . . . . . . . . . S m a l l cross s ec t i o n
(fy = 6 0 ks i , fc' = 4 ks i )
.......
lo'S
10 .7
10"6
10"5
p, 10"4
I0-3
2.5 10-2
2.0 , , , , ~ , J 0.5 1.0 1.5 2.0 2.5 3.0 3.5
T o . i o n to Shoat Roinforcoment Ra o k s \ 2 s ] ]
Fig. 8. Shear-torsion reliability index vs. torsion-to-shear reinforcement ratio (L/D = 0.75 and h / b w = 1.8).

292 R. Lu et al. /Structural Safety 14 (1994) 277 298
individual shearing failure mode (by shearing mode, it is meant either shear, or torsion, or combined shear-torsion). The fact that the flexure mode controls the safety of the beam in this parameter range is desirable, since flexure failure is of a ductile type and gives warnings. On the other hand, for live-to-dead load ratios less than one (e.g., office buildings), the reliability calculations show that safety is controlled equally by flexure and shear failures. The reliability curves in Fig. 9 also reveal a slight systematic conservatism of designs obtained using lower strength materials (fy = 40 ksi, f" = 3 ksi) as compared to those generated using higher strength materials (fy = 60 ksi, f" = 4 ksi).
Table 2 lists the range (min, max) and average value of the sensitivity o f /3 for flexure and shear-torsion with respect to the mean and standard deviation of each basic variable, normal- ized by the corresponding standard deviation so that the parameter variations are statistically equivalent. These ranges and averages of sensitivity values were obtained from reliability analyses performed on ensembles of designs corresponding to different live-to-dead load ratios and material strengths. The sensitivity results for all failure modes are also represented graphically in Fig. 10. The following conclusions can be drawn from these sensitivity results. The six most influential distribution parameters are by order of decreasing importance in the average sense: - for bending: - for shear:
- for torsion:
- for shear-torsion:
O'L, O'Bb , /tZBb , O ' f , /.Zfv , /.EL,
trL, O-B,, ~B,, o-/~, gL, ~V~'
O'L, O '~c , O'fv , ]..b ~ , ['£L' ]'L fv
O-L, ~r:,, ~z/;, ~L, ~ X/~' O-V~ The largest sensitivity of the reliability index corresponds to the distribution parameter or L
for all four failure modes. This result indicates the extreme importance of an accurate estimation of the extreme live load variability prior to design, since overestimation of this variability results into a large loss of reliability. The bending and shear reliability indices are
6.0
5.5
5.0
4.5
13 4.0
3.5
3.0
2.5
2.0 0.0
- - fy = 40 ksi, ~ '= 3 ksi
. . . . ~ =60ksi , ~ '= 4 ksi
s = shear ; t = torsion; f = flexure
s-t = shear - to rs ion in te rac t ion
. . . . f ~
10-8
10 .7
10"6
10-5
P~
10 -4
10-3
10 -2
i i i i i i
0.5 1.0 1.5 2.0 2.5 3.0 3.5
Live-to-Dead Load Ratio (0)
F ig . 9. C o m p a r i s o n o f r e l i a b i l i t y i n d i c e s f o r v a r i o u s f a i l u r e m o d e s .

R. L u et al. / Structural Safety 14 (1994) 2 7 7 - 2 9 8 2 9 3
Table 2
Sensitivity of reliability index /3 with respect to the basic variables
xi /3 ( f l e x u r e ) /3 (shear-torsion interaction) 0/3 ~/3 0/3 0/3
[ - 0 . 0 7 1 , 0 . 0 2 7 ] [ - 0 . 0 1 9 , - 0 . 0 0 2 ] [ - 0 . 0 7 5 , - 0 . 0 2 8 ] [ - 0 . 0 2 1 , - 0 . 0 0 3 ]
h s - 0 . 0 4 4 - 0 . 0 0 8 - 0 . 0 5 1 - 0 . 0 1 1
[ - 0 . 0 0 5 , 0 . 0 0 2 1 [ - 0 . 0 0 1 , - 0 . 0 0 0 ] [ 0 . 0 0 5 , 0 . 0 1 0 ] [ - 0 . 0 0 0 , - 0 . 0 0 0 ]
h - 0 . 0 0 3 - 0 . 0 0 0 0 . 0 0 7 - 0 . 0 0 0
[ 0 . 0 7 5 , 0 . 0 8 6 ] [ - 0 . 0 2 6 , - 0 . 0 1 8 ] [ 0 . 0 1 9 , 0 . 0 2 5 ] [ - 0 . 0 0 2 , - 0 . 0 0 1 ]
d 0 . 0 8 0 - 0 . 0 2 2 0 . 0 2 2 - 0 . 0 0 2
[ - 0 . 0 0 7 , 0 . 0 1 1 ] [ - 0 . 0 0 0 , 0 . 0 0 0 ] [ 0 . 0 2 4 , 0 . 0 5 4 ] [ - 0 . 0 1 1 , - 0 . 0 0 2 ]
b w 0 . 0 0 2 - 0 . 0 0 0 0 . 0 3 6 - 0 . 0 0 5
[ 0 . 1 1 0 , 0 . 1 5 5 1 [ - 0 . 0 8 8 , - 0 . 0 4 1 1
A s 0 . 1 2 9 - 0 . 0 5 9 - -
[ 0 . 0 3 2 , 0 . 0 3 5 ] [ - 0 . 0 0 4 , - 0 . 0 0 4 1
A v / s - - 0 . 0 3 4 - 0 . 0 0 4
[ 0 . 0 8 2 , 0 . 0 9 4 ] [ - 0 . 0 3 4 , - 0 . 0 2 3 ]
A t / s - - 0 . 0 8 7 - 0 . 0 2 7
[ 0 . 3 1 1 , 0 . 4 6 8 ] [ - 0 . 8 0 9 , - 0 . 3 1 6 ] [ 0 . 2 9 4 , 0 . 3 8 2 ] [ - 0 . 5 6 0 , - 0 . 3 0 0 ]
f y 0 . 3 7 7 - 0 . 5 1 0 0 . 3 3 7 - 0 . 4 0 9
[ 0 . 0 3 3 , 0 . 1 5 5 ] [ - 0 . 0 8 2 , - 0 . 0 0 4 ]
0 . 0 7 8 - 0 . 0 2 8 - -
[ 0 . 1 3 1 , 0 . 3 5 3 ] [ - 0 . 4 5 9 , - 0 . 0 5 6 ]
V t ~ - - 0 . 2 1 1 - 0 . 1 8 7
[ - 0 . 3 5 2 , - 0 . 3 0 0 ] [ - 1 . 3 3 4 , - 0 . 9 5 8 ] [ - 0 . 3 5 7 , - 0 . 3 1 4 ] [ - 1 . 7 2 8 , - 1 . 6 5 5 ]
L - 0 . 3 3 0 - 1 . 1 9 9 - 0 . 3 3 6 - 1 . 6 8 4
[ 0 . 0 8 8 , 0 . 1 1 7 ] [ - 0 . 0 5 1 , - 0 . 0 2 9 ]
x 1 - - 0 . 1 0 1 - 0 . 0 3 7
[ 0 . 1 2 9 , 0 . 1 8 3 ] [ - 0 . 1 2 6 , - 0 . 0 6 0 ]
YL -- -- 0 . 1 5 2 - - 0 . 0 8 4
[ 0 . 5 0 1 , 0 . 6 7 8 ] [ - - 1 . 6 9 4 , - - 0 . 8 3 3 ]
B b 0 . 5 6 5 - 1 . 1 2 8 - -
[ 0 . 1 7 9 , 0 . 1 9 7 ] [ - 0 . 1 3 9 , - 0 . 1 1 4 ]
Bvt - - 0 . 1 8 7 - 0 . 1 2 4
mostly sensitive to the mean and standard deviation of the three variables L, B, and material strength (i.e., fy for bending and f ~ for shear), whereas the torsion and shear-torsion reliability indices are mostly influenced by L, f ~ , and fy. The next important parameter is f~ for flexure, fy for shear, and B for both torsion and shear-torsion. Thus, model uncertainty was found to have an important effect on the reliability results for flexure and shear. This signifies that reduction of model uncertainty through development of more refined mechanical models is crucial to increase the reliability of concrete structures in the future. The large sensitivity of the reliability indices with respect to fy suggests that poor manufacturing of steel inducing a larger variability of its yield strength results into a significant loss of reliability. The importance of the concrete strength parameter emphasizes the significance of quality control in producing

2 9 4 R. Lu et al. / Stntctural Safety 14 (1994) 277-298
this material. The normalized sensitivity results also indicate that the sensitivity of /3 with respect to the standard deviation of a basic variable tends to be larger than the sensitivity with respect to the mean of this variable.
The geometric parameters do not influence significantly the reliability index. However, the most influential among them are the longitudinal tension reinforcement area A S and the effective beam depth d for flexure, the shear stirrup area per unit length Av/s and d for shear, and the torsional stirrup area per unit length At/s and the center-to-center stirrup dimensions x I and Yl for torsion and shear-torsion.
Finally, the reliability of the beam as a system is examined. The beam is designed for the simultaneous effects of bending moment, shear force, and torque. The influence of the live-to-dead load ratio and material strengths is considered here. The reliability indices /3 of the componental failure modes (flexure and combined shear-torsion) and of the system defined as a series system of the above two components are displayed in Fig. l l against the live-to-dead load ratio for two sets of material strengths. The system reliability analysis was performed using directional simulation with second-order modal approximation [15]. It appears that the system
Mean Standard Deviation
Flexure
Shear
""-l-
Torsion
Shear-Torsion
I t I /
min
max I
',T"
'1
. r . i ... . . t . . , I . , ~ , .T . ,~ . . . ~
..... ~/ll ~,,1.,~,,~..~
! I
i
~ ' 1 . . . . . . ' " ' l "~ ' : z '~ "'¸ (
I
' l - ' ' ~ ' ~ ' "
I
.1
I
i'q h d b ~ A , A ~ A ' f y L ' 4 ~ ' L xlYl B . . . . l'q h d b . A , A " A t f y L ' ~ ' L xlYl B S S S S
Fig . 10. N o r m a l i z e d sens i t iv i ty resul ts .

R. Lu et al. / Structural Safety 14 (1994) 277-298 2 9 5
6.0
5.5
5.0
4.5
4.0
3.5
3.0
- - f~ = 4 0 ks i , fc' = 3 ks i
. . . . fy = 6 0 ks i , fc' = 4 ks i
f = flexure; sys = system s-t = shear-torsion interaction
10-7
10"6
P, 10 .4
10-3
2.5 10-2
2.0 ~ J i ~ i
0.0 0.5 1.0 1.5 2.0 2.5 3.0 3.5
L i v e - t o - D e a d L o a d R a t i o (0)
Fig. 11. Component and system reliability indices vs. live-to-dead load ratio.
reliability (or overall reliability of the beam) cannot be assessed accurately on the basis of a single failure mode. In the lower end of the live-to-dead load ratio, the system effect is more pronounced for high strength than for low strength materials.
5. C o n c l u s i o n s
Based on the results of the present study on reliability evaluation of reinforced concrete beams, the following conclusions and remarks are made: (1) For all the failure modes (flexure, shear, torsion, and combined shear-torsion), the reliabil-
ity index remains confined in a relatively narrow band and varies slowly over a wide realistic range of design parameter values. All component reliability indices computed vary from 3.2 to 4.2. This indicates that, for the particular type of structure studied here, ACI Code 318-89 fulfills its objective of approaching a uniform reliability for many design situations.
(2) The component and system reliability indices are most sensitive to live load, material strengths, and model uncertainty. Furthermore, the sensitivity of the reliability index with respect to the standard deviation of a basic variable tends to be larger than the sensitivity with respect to the mean of this variable.
(3) Designs using the lower strength steel and concrete have a slightly larger reliability (more conservative) than those adopting higher strength materials. However, this difference is practically negligible.
(4) The flexure failure mode is found to control the reliability of the beam in the case of large live-to-dead load ratios (larger than one), a result which differs from the findings of most previous investigators such as [3] and [5]. For small live-to-dead load ratios (less than one), however, it was found that shear failure tends to control safety.

296 R. Lu et al. /Structural Safety 14 (1994) 277-298
(5) The reliability index /3 corresponding to the shear-torsion failure mode is insensitive to the total lateral reinforcement ratio and to the torsion-to-shear reinforcement ratio obtained by complying with the ACI Code recommendations.
Fur ther research in evaluating the reliability of reinforced concrete beams should address the following issues: (1) the interaction between flexure, shear and torsion should be incorpo- rated. This interaction becomes significant at the failure stage as the longitudinal reinforce- ment plays a role in the shear and torsion resisting mechanisms; (2) the assumption that the shear-to-torsional resistance ratio equals the shear-to-torsional load effect ratio should be relaxed. Therefore, a physically more representative probability density function for the angle defining the resistance direction (see Fig. 2) should be investigated; (3) finally, given that the /3 values are not fully uniform across the range of design parameter values considered, a calibration procedure should be developed to determine a new set of load and resistance factors leading to more uniform reliability values.
Notation
A
A s =
A v / S , A t / s =
A r~"/Sv . , A T n / s =
b , , , d , h =
g ( x ) , G ( u ) =
hs, L l , L2 = L , p , q =
m
M , M u =
P f , Pf l , Pf2 =
T, To = T~ ,T , =
S
V, VL, =
I/c, V, = w =
Xl, Yl, O~t, Ct =
influence floor area (ft2), 1 ft 2 = 0.093 m2; area of tension reinforcement (in2), 1 in 2 = 6.45 cm2; design area of shear, torsion reinforcement per unit length of beam (in2/ft) , 1 inZ/f t = 21.17 cm2/m; required area of shear, torsion reinforcement to resist the uncertain load effects ( ine/f t ) ; width, effective depth, and height of beam cross section (in), 1 in = 2.54 cm; compressive strength of concrete, yield strength of steel (psi), 1 psi = 6.895 kN/m2; limit-state function in the physical space x, and in the standard normal space u; thickness (in), short span (ft), and long span (ft) of slab, 1 ft = 0.3049 m; floor live load intensity (psf), total factored load on floor (psf), total factored load on beam ( lb / f t ) , 1 psf = 47.88 N / m 2, 1 l b / f t = 14.6 N / m ; uniformly distributed torque on beam (k-f t / f t ) , 1 k - f t / f t = 4.448 k N - m / m ; uncertain applied moment, applied factored moment (k-ft), 1 k - f t = 1.356 kN-m; probability of failure, first- and second-order estimate of Pf;
uncertain applied torque, applied factored torque (k-ft); torsional resistance contributions of concrete and stirrups (k-ft); longitudinal spacing of stirrups (in); uncertain applied shear force, applied factored shear force (kips), 1 kips = 4.448 kN; shear resistance contributions of concrete and stirrups (kips); unit weight of concrete (pcf), 1 pcf = 16.02 kg/m3; geometric parameters associated to stirrups and beam cross section; direction of concrete resistance in the shear-torsion stress space (rad);

R. Lu et al. / Structural Safety 14 (1994) 277-298 297
,;b, YD, 7L /~, 0", C.O.V.
P Tc, Uc
• " r c o , t . )co
= reliability index; = strength reduction factor, dead and live load factors; = mean, standard deviation, and coefficient of variation; = tension reinforcement ratio; = torsional and shear stress capacities of concrete under combined shear-tor-
sion action (psi); = torsional and shear stress resistance of concrete under pure torsion and pure
shear, respectively (psi).
References
[1] A.H.-S. Ang and C.A. Cornell, Reliability bases of structure safety and design, J. Struct. Div., ASCE, 100(9) (1974) 1755-1769.
[2] A.M. Freudenthal, Safety of structures, Trans. ASCE, 112 (1947) 125-180. [3] B.R. Ellingwood and A.H.-S. Ang, Risk-based evaluation of design criteria, J. Struct. Dit~., ASCE, 100(9) (1974)
1771-1788. [4] M.K. Ravindra, N.C. Lind and W. Siu, Illustration of reliability-based design, J. Struct. Div., ASCE, 100(9)
(1974) 1789-1811. [5] B.R. Ellingwood, Probabilistic codified design, presented at Structural Reliability: Theory and Applications,
University of California, Berkeley, 1983. [6] ACI, Building Code Requirements for Reinforced Concrete, American Concrete Institute Standard Committee
318, Detroit, 1989. [7] H.O. Madsen, S. Krenk and N.C. Lind, Methods of Structural Safety, Prentice-Hall, Englewood Cliffs, N.J.,
1986. [8] R.E. Melchers, Structural Reliability Analysis and Prediction, Ellis Horwood, Chichester, 1987. [9] R. Park and T. Paulay, Reinforced Concrete Structures, Wiley, New York, 1974.
[10] T.T.C. Hsu, Ultimate torque of reinforced rectangular beams, J. Struct. Die., ASCE, 94(3) (1968) 485-510. [11] T.T.C. Hsu, Torsion of Reinforced Concrete, Van Nostrand Reinhold, New York, 1984. [12] P.-L. Liu, H.-Z. Lin and A. Der Kiureghian, CALREL User Manual, Research Report No. UCB/SEMM-89/18,
Structural Engineering, Mechanics and Materials, Department of Civil Engineering, University of California, Berkeley, 1990.
[13] A. Der Kiureghian and P.-L. Liu, Structural reliability under incomplete probability information, J. Engrg. Mech. Div., ASCE, 111(1) (1986) 85-104.
[14] A. Der Kiureghian, H.-Z. Lin and S.-J. Hwang, Second-order reliability approximations, J. Engrg. Mech. Dit'., ASCE, 113(8) (1987) 1208-1225.
[15] A. Der Kiureghian and H.-Z. Lin, Second-order system reliability with directional simulation, Proc. 5th ICASP, Vancouver, Canada, 1987.
[16] B. Ellingwood, T.V. Galambos, J.G. MacGregor and A.C. Cornell, Development of a probability based load criterion for American National Standard A58, National Bureau of Standards Special Publication No. 577, National Bureau of Standards, Washington, D.C., 1980.
[17] S.A. Mirza and J.G. MacGregor, Variability of mechanical properties of reinforcing bars, J. Struct. Dit:., ASCE, 105(5) (1979) 921-937.
[18] S.A. Mirza, M. Hatzinikolas and J.G. MacGregor, Statistical descriptions of strength of concrete, J. Struct. Dill., ASCE, 105(6) (1979) 1021-1035.
[19] S.A. Mirza and J.G. MacGregor, Variations of dimensions of reinforced concrete members, J. Struct. Die., ASCE, 105(4) (1979) 751-765.
[20] J.G. MacGregor, S.A. Mirza and B.R. Ellingwood, Statistical analysis of resistance of reinforced and pre- stressed concrete members, ACI J., 80(3) (1983) 167-176.

298 R. Lu et al. /Structural Safety 14 (1994) 277-298
[21] M. Israel, B. Ellingwood and R. Corotis, Reliability-based code formulation for reinforced concrete buildings, J. Struct. DiLl., ASCE, 113(10)(1987) 2235-2251.
[22] T.C. Zsutty, Shear strength prediction for separate categories of simple beam tests, A C I J., 68(2) (1971) 138-143.
[23] S.A. Mirza and J.G. MacGregor, Statistical study of shear strength of reinforced concrete slender beams, A C I J., 76(5)(1979) 1159-1175.
[24] H.M. Liao and P.M. Ferguson, Combined torsion in reinforced concrete L-beams with stirrups, A C I J., 66(12) (1969) 986-993.


