Embed Size (px)
Citation preview

This document is downloaded from DR‑NTU (https://dr.ntu.edu.sg)Nanyang Technological University, Singapore.
Structural behaviour of precast concrete framessubject to column removal scenarios
Kang, Shaobo
2015
Kang, S. (2015). Structural behaviour of precast concrete frames subject to column removalscenarios. Doctoral thesis, Nanyang Technological University, Singapore.
https://hdl.handle.net/10356/65737
https://doi.org/10.32657/10356/65737
Downloaded on 18 Nov 2021 06:39:57 SGT

STRUCTURAL BEHAVIOUR OF PRECAST CONCRETE
FRAMES SUBJECT TO COLUMN REMOVAL SCENARIOS
KANG SHAOBO
SCHOOL OF CIVIL AND ENVIRONMENTAL ENGINEERING
2015


STRUCTURAL BEHAVIOUR OF PRECAST CONCRETE
FRAMES SUBJECT TO COLUMN REMOVAL SCENARIOS
KANG SHAOBO
School of Civil and Environmental Engineering
A thesis submitted to the Nanyang Technological University in partial fulfilment of
the requirement for the degree of Doctor of Philosophy
2015


i
ACKNOWLEDGEMENT
I would like to express my deeply and sincere gratitude and appreciation to my
supervisors, Professor Tan Kang Hai and Assistant Professor Yang En-Hua, for their
invaluable advice, patient guidance and support. Their enthusiasm and faith in
research will always inspire me in the future career.
I also wish to thank Dr. Yu Jun, Dr. Yang Bo, Dr. Nyugen Truong Thang, Dr. Liu
Chang, Dr. Nyugen Tuan Trung, Ms Trieska Yokhebed Wahyudi, Mr. Qiu Ji-Shen,
Mr. Namyo Salim Lim and Mr. Chen Kang for their constructive discussions and
critical comments on the experimental and analytical work.
Special thanks are extended to technician staffs from Protective Engineering and
Construction Technology Laboratory, in particular, Mr. Chelladurai Subasanran, Mr.
Jee Kim Tian, Mr. Tui Cheng Hoon, Mr. Ho Yaow Chan and Mr. Chan Chiew Choon.
Without their kind assistance, the experimental work would not have been
accomplished.
Finally, I am indebted to my parents, sisters, wife and daughter for their love and
encouragement through my entire life.

ii

iii
TABLE OF CONTENT
Acknowledgement......................................................................................................... i
Table of Content.......................................................................................................... iii
Abstract....................................................................................................................... ix
List of Figures ............................................................................................................. xi
List of Tables ............................................................................................................ xxi
List of Symbols ........................................................................................................ xxiii
Chapter 1 Introduction.................................................................................................. 1
1.1 Research Background ......................................................................................... 1
1.2 Alternate Load Paths .......................................................................................... 2
1.3 Objectives and Scope of Research ...................................................................... 4
1.4 Layout of the Thesis ........................................................................................... 6
Chapter 2 Literature Review ......................................................................................... 9
2.1 Overview ............................................................................................................ 9
2.2 Design Approaches against Progressive Collapse................................................ 9
2.2.1 Indirect design approach ............................................................................. 10
2.2.2 Direct design approach ............................................................................... 11
2.2.3 Relationship between indirect and direct approaches................................... 12
2.3 Experimental Tests under Progressive Collapse Scenarios ................................ 14
2.3.1 Quasi-static tests under column removal scenarios...................................... 14
2.3.2 Dynamic tests ............................................................................................. 27
2.4 Engineered Cementitious Composites (ECC) .................................................... 30
2.4.1 Material properties ..................................................................................... 30
2.4.2 Structural performance under various loading conditions ............................ 31
2.4.3 Interactions between ECC and reinforcement.............................................. 33
iv
2.4.4 Bond stress of reinforcement embedded in ECC ......................................... 35
2.5 Component-Based Joint Models ....................................................................... 37
2.5.1 Procedure of joint characterisation.............................................................. 37
2.5.2 Joint models under cyclic loading............................................................... 38
2.5.3 Joint models under progressive collapse ..................................................... 39
2.6 Summary.......................................................................................................... 41
Chapter 3 Experimental Tests of Precast Concrete Beam-Column Sub-Assemblages.. 43
3.1 Introduction...................................................................................................... 43
3.2 Test Programme ............................................................................................... 44
3.2.1 Prototype structure ..................................................................................... 44
3.2.2 Specimen design ........................................................................................ 45
3.2.3 Test setup ................................................................................................... 48
3.2.4 Instrumentations......................................................................................... 50
3.3 Material Properties ........................................................................................... 51
3.4 Experimental Results of Sub-Assemblages ....................................................... 52
3.4.1 Load-displacement history of beam-column sub-assemblages..................... 52
3.4.2 Resistances of beam-column sub-assemblages............................................ 54
3.4.3 Components of vertical load ....................................................................... 57
3.4.4 Rotational capacities of beam-column sub-assemblages.............................. 59
3.4.5 Crack patterns and failure modes of precast beams ..................................... 63
3.4.6 Horizontal shear transfer between precast beam units and cast-in-situ
concrete topping ................................................................................................. 66
3.4.7 Strains of beam longitudinal reinforcement ................................................ 68
3.5 Discussions and Suggestions ............................................................................ 70
3.6 Conclusions...................................................................................................... 71

v
Chapter 4 Experimental Tests of Precast Beam-Column Sub-Assemblages with
Engineered Cementitious Composites......................................................................... 73
4.1 Introduction ...................................................................................................... 73
4.2 Experimental Programme on Sub-Assemblages ................................................ 74
4.2.1 Specimen design......................................................................................... 74
4.2.3 Material properties ..................................................................................... 77
4.3 Resistances of Beam-Column Sub-Assemblages ............................................... 79
4.3.1 Effect of ECC ............................................................................................. 80
4.3.2 Effect of reinforcement detailing ................................................................ 82
4.3.3 Effect of top reinforcement ratios ............................................................... 83
4.3.4 Effect of bottom reinforcement ratios ......................................................... 84
4.4 Crack Patterns and Failure Modes of Sub-Assemblages .................................... 85
4.5 Horizontal Reaction Forces and Bending Moments ........................................... 88
4.6 Deformation Capacities of Beam-Column Sub-Assemblages ............................ 91
4.7 Local Rotations in the P lastic Hinge Region ..................................................... 93
4.8 Interactions between Steel Reinforcement and ECC.......................................... 96
4.9 Conclusions .................................................................................................... 100
Chapter 5 Experimental Study on Precast Concrete Frames with Different Horizonta l
Restraints ................................................................................................................. 103
5.1 Introduction .................................................................................................... 103
5.2 Test Programme ............................................................................................. 104
5.2.1 Frame design and detailing ....................................................................... 104
5.2.2 Test setup ................................................................................................. 108
5.2.3 Instrumentations ....................................................................................... 110
5.3 Material Properties ......................................................................................... 111
5.4 Experimental Results of Precast Concrete Frames........................................... 112

vi
5.4.1 Load-displacement curves .........................................................................112
5.4.2 Effect of reinforcement detailing on frame behaviour ................................114
5.4.3 Effect of boundary conditions on frame behaviour.....................................116
5.4.4 Pseudo-static resistances of precast concrete frames ..................................116
5.4.5 Load paths of horizontal reaction forces to the support ..............................118
5.4.6 Crack patterns and failure modes of precast beams ....................................120
5.4.7 Behaviour of side columns and joints ........................................................122
5.4.8 Variation of steel strains in beams and columns .........................................128
5.5 Summary.........................................................................................................133
Chapter 6 Experimental Study on Exterior Precast Concrete Frames .........................135
6.1 Introduction.....................................................................................................135
6.2 Experimental Programme ................................................................................135
6.2.1 Specimen design and detailing...................................................................135
6.2.2 Material properties ....................................................................................138
6.3 Test Results of Exterior Frames .......................................................................139
6.3.1 Load-displacement curves .........................................................................139
6.3.2 Resistances of precast concrete frames ......................................................141
6.3.3 Failure modes of precast frames ................................................................142
6.3.4 Lateral deflections of side columns............................................................149
6.3.5 Shear strength of beam-column joints ........................................................150
6.3.6 Flexural strength of side columns subjected to horizontal tension ..............152
6.3.7 Variation of steel strain in side joints .........................................................155
6.4 Summary.........................................................................................................158
Chapter 7 Analytical Model for Compressive Arch Action of Beam-Column Sub-
Assemblages .............................................................................................................161
7.1 Introduction.....................................................................................................161

vii
7.2 Development of the Analytical Model............................................................. 162
7.2.1 Constitutive models .................................................................................. 163
7.2.2 Equilibrium condition ............................................................................... 167
7.2.3 Compatibility condition ............................................................................ 171
7.2.4 Solution procedure ................................................................................... 175
7.3 Validation of the Analytical Model ................................................................. 178
7.3.1 Prediction of CAA capacity and horizontal reaction force ......................... 179
7.3.2 Prediction of load-displacement curve ...................................................... 180
7.3.3 Variation of bending moments .................................................................. 183
7.3.4 Estimate of neutral axis depth and reinforcement strain............................. 183
7.4 Limitations of the Analytical Model ............................................................... 185
7.5 Parametric Studies .......................................................................................... 186
7.5.1 Effect of concrete models ......................................................................... 186
7.5.2 Effect of tensile strength of ECC .............................................................. 190
7.5.3 Effect of tensile strain capacity of ECC .................................................... 191
7.5.4 Effect of stiffness of horizontal restraint ................................................... 192
7.5.5 Effect of reinforcement ratio ..................................................................... 195
7.6 Conclusion ..................................................................................................... 197
Chapter 8 Component-Based Joint Model for Precast Concrete Beam-Column Sub-
Assemblages ............................................................................................................ 201
8.1 Introduction .................................................................................................... 201
8.2 Beam-Column Joint Model ............................................................................. 202
8.3 Properties of Tensile Spring............................................................................ 203
8.3.1 Zero strain with zero slip .......................................................................... 204
8.3.2 Zero strain with non-zero slip ................................................................... 212
8.3.3 Non-zero strain with zero slip ................................................................... 222

viii
8.4 Properties of Compressive Spring....................................................................226
8.4.1 Determination of compression force ..........................................................227
8.4.2 Bond stress in compression .......................................................................230
8.4.3 Force-slip relationship of compressive spring ............................................231
8.5 Shear Panel Spring ..........................................................................................232
8.6 Validation of Joint Model ................................................................................232
8.6.1 Parameters of springs ................................................................................232
8.6.2 Comparisons with experimental results......................................................234
8.7 Discussions .....................................................................................................235
8.8 Conclusions.....................................................................................................236
Chapter 9 Conclusions and Future Work ...................................................................239
9.1 Conclusions.....................................................................................................239
9.2 Future Works ..................................................................................................244
References ................................................................................................................247
Publications ..............................................................................................................259
Appendix A Quantification of Boundary Conditions .................................................261
A.1 Precast Concrete Beam-Column Sub-Assemblages .........................................261
A.1.1 Horizontal reaction forces.........................................................................261
A.1.2 Stiffness of horizontal restraints................................................................263
A.2 Precast Beam-Column Sub-Assemblages with ECC........................................266
A.2.1 Horizontal reaction forces.........................................................................266
A.2.2 Stiffness of horizontal restraints................................................................267
A.3 Precast Concrete Frames.................................................................................273
A.3.1 Horizontal reaction forces.........................................................................273
A.3.2 Stiffness of horizontal restraints................................................................275

ix
ABSTRACT
From time to time, structural collapse incidents throughout the world prompt research
works on the robustness of building structures to mitigate progressive collapse.
Among the design approaches, alternate path method tends to prevent the spread of
local damage through mobilisation of compressive arch action (CAA) and catenary
action in the bridging beam and the floor system. However, development of alternate
load path is contingent on structural ductility and integrity at large deformations.
This study aims to investigate the ability of precast concrete joints to develop CAA
and catenary action. An experimental programme was conducted on beam-column
sub-assemblages and frames under column removal scenarios. The middle beam-
column joint and double-span beam over the removed column were extracted from a
typical precast concrete structure and scaled down to one-half models. Two enlarged
end column stubs were designed in the sub-assemblages, to which horizonta l
restraints were connected. In addition, engineered cementitious composites (ECC),
with strain-hardening behaviour and superior strain capacity in tension, were utilised
in the cast-in-situ structural topping and beam-column joint. In the precast frames,
side columns were curtailed between the column inflection points below and above
the bridging beam to represent realistic boundary conditions to the bridging beam.
In comparison with flexural resistance, development of CAA and catenary action
substantially enhanced the progressive collapse resistance of beam-column sub-
assemblages. Besides, the effects of reinforcement detailing in the joint, longitudina l
reinforcement ratios in the beam, and horizontal interface preparation between the
precast beam unit and cast-in-situ concrete topping, on the resistance and deformation
capacity of sub-assemblages were studied experimentally under relatively rigid
boundary condition. Furthermore, a comparison was made between sub-assemblages
with conventional concrete and ECC to highlight the effect of ECC on structura l
behaviour of sub-assemblages under column removal scenarios. In the experimenta l
tests on precast concrete frames, the influence of joint detailing and boundary
conditions on progressive collapse resistance of the frames was investigated. Special
attention was placed on the behaviour of side columns subjected to CAA and catenary
action. Design recommendations were made in accordance with experimental results.

x
Based on previous studies, an analytical model was proposed to predict the CAA of
beam-column sub-assemblages. The tensile strength of ECC and stress-strain model
of concrete were considered in the model. A series of parametric studies was
conducted through the analytical model to identify dominant parameters on the
resistance of sub-assemblages subjected to CAA. In addition, the pseudo-static
resistance was calculated through the energy balance method. In the catenary regime,
the component-based joint was developed for precast concrete joints to provide an
efficient and explicit representation of joint behaviour. Interactions between the
structural members and beam-column joint were modelled by zero-length springs
with specific constitutive relationships. The average bond stress for calculating the
force-slip relationship of a spring was evaluated. Furthermore, a tension spring
representing pull-out failure of embedded reinforcement was derived for precast
concrete joints. Finally, the model was calibrated by experimental results of precast
and reinforced concrete beam-column sub-assemblages.

xi
LIST OF FIGURES
Fig. 2.1: Design approaches to resist progressive collapse (DOD 2013) ........................ 9
Fig. 2.2: Location restriction for internal and peripheral ties (DOD 2013) ................... 10
Fig. 2.3: Reinforcement details in beams (Orton et al. 2009) ....................................... 15
Fig. 2.4: Vertical and axial loads in beams (Orton 2007)............................................. 16
Fig. 2.5: Failure modes of beams (Orton 2007) ........................................................... 17
Fig. 2.6: Reinforcement detailing of beam-column sub-assemblages (Yu and Tan 2013b)
................................................................................................................................... 18
Fig. 2.7: Test setup for beam-column sub-assemblages (Yu and Tan 2013b)............... 18
Fig. 2.8: Variations of vertical load and horizontal reaction force with middle joint
displacement (Yu and Tan 2013b) .............................................................................. 19
Fig. 2.9: Failure mode of sub-assemblage S1 (Yu and Tan 2013b) .............................. 19
Fig. 2.10: Reinforcement details of reinforced concrete beam-column assemblies (Sadek
et al. 2011) ................................................................................................................. 21
Fig. 2.11: Test setup and instrumentation for beam-column assemblies (Sadek et al. 2011)
................................................................................................................................... 21
Fig. 2.12: Vertical load-middle joint displacement histories (Sadek et al. 2011) .......... 22
Fig. 2.13: Test setup and instrumentation for beam-column assemblies (Yi et al. 2008)
................................................................................................................................... 24
Fig. 2.14: Variation of load cell reaction force versus middle column displacement (Yi et
al. 2008) ..................................................................................................................... 24
Fig. 2.15: Effect of middle column displacement on horizontal displacement of columns
at first floor level (Yi et al. 2008)................................................................................ 25
Fig. 2.16: Beam-to-column connection details for SMF building (Main et al. 2014).... 26
Fig. 2.17: Vertical load versus vertical displacement of centre column (Main et al. 2014)
................................................................................................................................... 26
Fig. 2.18: Failure mode at connections to centre column (Main et al. 2014) ................ 27
xii
Fig. 2.19: Location of column removal (circled) (Sasani and Sagiroglu 2010) ............ 28
Fig. 2.20: Vertical displacements of second and seventh floor joints above removed
column (Sasani and Sagiroglu 2010) .......................................................................... 28
Fig. 2.21: Axial compressive force in column C3 on different floors (Sasani and
Sagiroglu 2010).......................................................................................................... 28
Fig. 2.22: Typical plan of the building and location of column removal (Sasani et al.
2007) ......................................................................................................................... 29
Fig. 2.23: Variations of axial forces in column B5 (Sasani et al. 2007) ....................... 29
Fig. 2.24: Bending moment diagram and deformed shape of axis 5 (Sasani et al. 2007)
.................................................................................................................................. 30
Fig. 2.25: Uniaxial tensile stress-strain curves of ECC with 2% PVA fibres (Li 2003) 31
Fig. 2.26: Load-deformation responses of columns subjected to reversed cyclic loading
(Fischer and Li 2002a) ............................................................................................... 32
Fig. 2.27: Damage properties of beams (Fukuyama et al. 2000) .................................. 32
Fig. 2.28: Load-deflection curves and failure modes of concrete/ECC composite beams
(Yuan et al. 2013) ...................................................................................................... 33
Fig. 2.29: Load-deformation responses of specimens in uniaxial tension (Fischer and Li
2002b)........................................................................................................................ 33
Fig. 2.30: Interface condition in reinforced concrete and ECC (Fischer and Li 2002b) 34
Fig. 2.31: Total load in specimens versus average strain (Moreno et al. 2014) ............ 35
Fig. 2.32: Cracks in specimens prior to fracture of reinforcement (Moreno et al. 2014)
.................................................................................................................................. 35
Fig. 2.33: Bond stress-reinforcement slip response (Bandelt and Billington 2014) ...... 36
Fig. 2.34: Reinforced concrete beam-column joint models under cyclic loads............. 38
Fig. 2.35: Bond and bar stress distribution along a reinforcing bar embedded under pull-
out force (Lowes et al. 2004) ...................................................................................... 39
Fig. 2.36: Beam-column joint models under column removal scenarios ...................... 40

xiii
Fig. 2.37: Bond and bar stress distribution along a reinforcing bar under axial tension
(Yu and Tan 2010b) ................................................................................................... 41
Fig. 3.1: The prototype precast concrete structure ....................................................... 44
Fig. 3.2: Reinforcement detailing of precast concrete beam-column sub-assemblages . 46
Fig. 3.3: Test setup for beam-column sub-assemblages ............................................... 48
Fig. 3.4: Restraints on beam-column sub-assemblages ................................................ 49
Fig. 3.5: Schematic of hinge rotation and beam deformation measurement ................. 50
Fig. 3.6: Layout of strain gauges on longitudinal reinforcement .................................. 50
Fig. 3.7: Stress-strain curves of concrete and reinforcement ........................................ 52
Fig. 3.8: Vertical load-middle joint displacement curves of beam-column sub-
assemblages ............................................................................................................... 52
Fig. 3.9: Horizontal reaction-middle joint displacement curves of beam-column sub-
assemblages ............................................................................................................... 53
Fig. 3.10: Free body diagram of the single-span beam ................................................ 57
Fig. 3.11: Contributions of axial force and bending moments to vertical load of sub-
assemblages ............................................................................................................... 58
Fig. 3.12: Deformed profiles of beam-column sub-assemblages.................................. 60
Fig. 3.13: Partial hinge at the curtailment point of top bars ......................................... 62
Fig. 3.14: Rotations of partial hinges at the curtailment point...................................... 62
Fig. 3.15: Rotations of plastic hinges at the end column stub of sub-assemblages ....... 63
Fig. 3.16: Crack patterns of beam-column sub-assemblages........................................ 63
Fig. 3.17: Failure modes of sub-assemblages at the middle joint ................................. 65
Fig. 3.18: Failure modes of beam-column sub-assemblages at the end column stub .... 66
Fig. 3.19: Horizontal cracking across the concrete interface ........................................ 66
Fig. 3.20: Strains of beam longitudinal reinforcement in MJ-B-0.88/0.59R ................. 68
Fig. 3.21: Strains of beam longitudinal reinforcement in the beam of sub-assemblage MJ-
B-0.88/0.59R.............................................................................................................. 69

xiv
Fig. 3.22: Strains of beam longitudinal reinforcement at the middle joint.................... 70
Fig. 4.1: Geometric properties of precast beam-column sub-assemblages ................... 74
Fig. 4.2: Load-deflection curve of ECC plates under four-point bending..................... 78
Fig. 4.3: Stress-strain relationships of concrete and steel bar....................................... 79
Fig. 4.4: Variations of vertical loads and horizontal reaction forces of sub-assemblages
of bottom reinforcement with 90o bend....................................................................... 81
Fig. 4.5: Variations of vertical loads and horizontal reaction forces of sub-assemblages
with lap-spliced bottom reinforcement ....................................................................... 81
Fig. 4.6: Crack patterns and failure modes of CMJ-B-1.19/0.59.................................. 86
Fig. 4.7: Development of multi-cracking in the structural topping of EMJ-B-1.19/0.59
.................................................................................................................................. 86
Fig. 4.8: Failure modes of sub-assemblage EMJ-B-1.19/0.59 ..................................... 87
Fig. 4.9: Failure modes at the end column stub of sub-assemblages ............................ 87
Fig. 4.10: Failure modes of EMJ-L-0.88/0.88 ............................................................. 88
Fig. 4.11: Force equilibrium of deformed sub-assemblage .......................................... 88
Fig. 4.12: Variations of horizontal reaction forces in sub-assemblages........................ 89
Fig. 4.13: Variations of bending moments in EMJ-B-1.19/0.59 .................................. 90
Fig. 4.14: Interaction of bending moment and beam axial force .................................. 90
Fig. 4.15: Rotations in plastic hinge regions of sub-assemblages ................................ 94
Fig. 4.16: Layout of strain gauges on beam longitudinal reinforcement ...................... 96
Fig. 4.17: Variations of steel strains in EMJ-L-1.19/0.59 ............................................ 97
Fig. 4.18: Strains of reinforcement H16 at the end column stub of EMJ-L-1.19/0.59 .. 98
Fig. 4.19: Curvatures of steel bars along the embedment length .................................. 99
Fig. 5.1: Geometry and reinforcement detailing of precast concrete frames................107
Fig. 5.2: Test setup for precast concrete frames .........................................................109
Fig. 5.3: Restraints on precast concrete frames ..........................................................110
Fig. 5.4: Layout of LVDTs on precast concrete frames ..............................................111

xv
Fig. 5.5: Material stress-strain curves of reinforcement and concrete ........................ 112
Fig. 5.6: Vertical load-middle joint displacement curves of precast frames ............... 113
Fig. 5.7: Horizontal reaction force-middle joint displacement curves of precast frames
................................................................................................................................. 113
Fig. 5.8: Neutral axis depth of beam sections at the face of the side column .............. 115
Fig. 5.9: Pseudo-static load-middle joint displacement curves of precast concrete frames
................................................................................................................................. 117
Fig. 5.10: Load paths of horizontal reaction forces to the support.............................. 119
Fig. 5.11: Crack patterns and failure modes of IF-B-0.88-0.59 .................................. 120
Fig. 5.12: Crack patterns and failure modes of EF-B-0.88-0.59 ................................. 121
Fig. 5.13: Crack patterns and failure modes of IF-L-0.88-0.59 .................................. 121
Fig. 5.14: Crack patterns and failure modes of EF-L-0.88-0.59 ................................. 122
Fig. 5.15: Crack patterns and failure modes of side columns ..................................... 124
Fig. 5.16: Lateral deflections of side columns ........................................................... 125
Fig. 5.17: Column deflection-middle joint displacement curves of exterior frames.... 126
Fig. 5.18: Shear distortion of side beam-column joints.............................................. 127
Fig. 5.19: Strain gauge layout along the bottom bars of precast beams ...................... 128
Fig. 5.20: Variations of steel strains in the middle beam-column joint of IF-L-0.88-0.59
................................................................................................................................. 129
Fig. 5.21: Strains of beam bottom reinforcement embedded in the right column........ 130
Fig. 5.22: layout of strain gauges in side beam-column joint ..................................... 131
Fig. 5.23: Variations of reinforcement strains in side columns .................................. 132
Fig. 5.24: Strains of horizontal hoops in side joint zone ............................................ 133
Fig. 6.1: Geometry and reinforcement detailing of precast concrete frames ............... 138
Fig. 6.2: Vertical loads and horizontal reaction forces of exterior frames EF-B-1.19/0.59
and EF-L-1.19/0.59 .................................................................................................. 139

xvi
Fig. 6.3: Vertical loads and horizontal reaction forces of exterior frames EF-B-1.19/0.59S
and EF-L-1.19/0.59S .................................................................................................140
Fig. 6.4: Failure modes of middle beam-column joints ..............................................143
Fig. 6.5: Crack patterns of bridging beams ................................................................144
Fig. 6.6: Propagation of shear cracks in the side joint of EF-B-1.19/0.59 ...................146
Fig. 6.7: Crack patterns and failure modes of side beam-column joints ......................148
Fig. 6.8: Lateral deflections of side columns..............................................................149
Fig. 6.9: Shear forces and bending moments on side column .....................................151
Fig. 6.10: Shear forces in side beam-column joints ....................................................151
Fig. 6.11: Variations of bending moments at column sections....................................154
Fig. 6.12: Layout of strain gauges in the side joint .....................................................155
Fig. 6.13: Variations of reinforcement strains in side columns ...................................156
Fig. 6.14: Strains of horizontal hoops in side beam-column joints..............................157
Fig. 6.15: Actions in side beam-column joint.............................................................158
Fig. 7.1: Geometric configuration of horizontally restrained beams ...........................162
Fig. 7.2: P lastic hinge mechanism of beam-column sub-assemblages ........................163
Fig. 7.3: Stress-strain relationship of steel bars ..........................................................163
Fig. 7.4: Constitutive model for concrete in compression...........................................165
Fig. 7.5: Stress-strain relationship of ECC .................................................................167
Fig. 7.6: Free-body diagram of the single-span beam.................................................167
Fig. 7.7: Force equilibrium of beam sections .............................................................168
Fig. 7.8: Configuration of beam at small deformation stage .......................................171
Fig. 7.9: Compatibility condition of beam at large deformation stage ........................172
Fig. 7.10: Solution procedure for the analytical model ...............................................177
Fig. 7.11: Comparisons of analytical and experimental vertical load-middle joint
displacement curves of reinforced concrete sub-assemblages.....................................180

xvii
Fig. 7.12: Comparisons of analytical and experimental vertical load-middle joint
displacement curves of precast beam-column sub-assemblages................................. 181
Fig. 7.13: Comparisons of analytical and experimental horizontal reaction force-middle
joint displacement curves of precast beam-column sub-assemblages......................... 182
Fig. 7.14: Variations of bending moments at the middle joint and end support .......... 183
Fig. 7.15: Variations of numerical strains of steel reinforcement and concrete with middle
joint displacement .................................................................................................... 185
Fig. 7.16: Variations of neutral axis depths with middle joint displacement .............. 185
Fig. 7.17: Comparison of stress-strain models for concrete ....................................... 187
Fig. 7.18: Comparisons of load-displacement curves with different concrete models 187
Fig. 7.19: Comparisons of bending moments at the middle joint and end support...... 188
Fig. 7.20: Comparisons of neutral axis depths with different concrete models ........... 189
Fig. 7.21: Comparisons of load-displacement curves with different tensile strengths of
ECC ......................................................................................................................... 190
Fig. 7.22: Comparisons of neutral axis depths with different tensile strengths of ECC
................................................................................................................................. 191
Fig. 7.23: Comparisons of load-displacement curves with different tensile strain
capacities of ECC ..................................................................................................... 192
Fig. 7.24: Comparisons of load-displacement curves with different horizontal restraints
................................................................................................................................. 193
Fig. 7.25: Pseudo-static resistances of sub-assemblages with different horizonta l
restraints................................................................................................................... 194
Fig. 7.26: Comparisons of neutral axis depths with different horizontal restraints ..... 194
Fig. 7.27: Comparisons of load-displacement curves with different reinforcement ratios
................................................................................................................................. 195
Fig. 7.28: Comparisons of neutral axis depths with different reinforcement ratios ..... 196
Fig. 7.29: Pseudo-static resistances of sub-assemblages with different reinforcement
ratios ........................................................................................................................ 197

xviii
Fig. 8.1: Component-based joint model for beam-column sub-assemblages ...............203
Fig. 8.2: Variation of bond stresses along embedment length of a reinforcing bar ......207
Fig. 8.3: Relationship of average bond stress with force and stress at the loaded end of
reinforcing bars .........................................................................................................208
Fig. 8.4: Relationships of applied force and loaded end slip for steel bars ..................209
Fig. 8.5: Comparisons of experimental and analytical force-slip relationships............212
Fig. 8.6: Bond-slip model for embedded reinforcing bars at elastic stage ...................214
Fig. 8.7: Bond stress distribution along a reinforcing bar at the peak pull-out force....215
Fig. 8.8: Comparisons between experimental and analytical results under pull-out loads
.................................................................................................................................217
Fig. 8.9: Variations of bond stress along embedment length at different loading stages
.................................................................................................................................218
Fig. 8.10: Bond stresses and slips of an embedded reinforcing bar at elastic ascending
stage .........................................................................................................................218
Fig. 8.11: Bond stresses and slips of an embedded reinforcing bar at plastic ascending
stage .........................................................................................................................219
Fig. 8.12: Bond stresses and slips of an embedded reinforcing bar at descending stage
.................................................................................................................................221
Fig. 8.13: Bond stress distribution for an elastic steel bar under axial tension ............223
Fig. 8.14: Bond stress distribution for a yielded steel bar at loaded end......................224
Fig. 8.15: Bond stress distribution for a yielded steel bar at mid-point of embedment
length ........................................................................................................................225
Fig. 8.16: Relationship of applied force and loaded end slip for reinforcing bar T13 under
axial tension ..............................................................................................................226
Fig. 8.17: Neutral axis depth at beam end ..................................................................228
Fig. 8.18: Enhancement factors and compression forces at middle joint and end column
stub ...........................................................................................................................229
Fig. 8.19: Force-slip relationships of compressive springs .........................................231

xix
Fig. 8.20: Comparisons of experimental and numerical results of precast concrete beam-
column sub-assemblages .......................................................................................... 234
Fig. 8.21: Comparisons of experimental and numerical results of reinforced concrete sub-
assemblages ............................................................................................................. 235
Fig. A.1 Horizontal reaction forces of precast concrete beam-column sub-assemblages
................................................................................................................................. 262
Fig. A.2 Horizontal force-displacement relationships of MJ-B-0.52/0.35S ................ 263
Fig. A.3 Horizontal force-displacement relationships of MJ-L-0.52/0.35S ................ 263
Fig. A.4 Horizontal force-displacement relationships of MJ-B-0.88/0.59R................ 264
Fig. A.5 Horizontal force-displacement relationships of MJ-L-0.88/0.59R................ 264
Fig. A.6 Horizontal force-displacement relationships of MJ-B-1.19/0.59R................ 264
Fig. A.7 Horizontal force-displacement relationships of MJ-L-1.19/0.59R................ 265
Fig. A.8 Horizontal reaction forces of precast beam-column sub-assemblages with ECC
................................................................................................................................. 267
Fig. A.9 Horizontal force-displacement relationships of CMJ-B-1.19/0.59................ 268
Fig. A.10 Horizontal force-displacement relationships of EMJ-B-1.19/0.59 .............. 268
Fig. A.11 Horizontal force-displacement relationships of EMJ-B-0.88/0.59 .............. 269
Fig. A.12 Horizontal force-displacement relationships of EMJ-L-1.19/0.59 .............. 269
Fig. A.13 Horizontal force-displacement relationships of EMJ-L-0.88/0.59 .............. 269
Fig. A.14 Horizontal force-displacement relationships of EMJ-L-0.88/0.88 .............. 270
Fig. A.15 Equivalent connection gap at the beam centroid ........................................ 271
Fig. A.16 Bending moment-rotation relationships of end column stubs ..................... 272
Fig. A.17 Horizontal reaction forces of precast concrete frames................................ 274
Fig. A.18 Horizontal force-displacement relationships of IF-B-0.88-0.59 ................. 275
Fig. A.19 Horizontal force-displacement relationships of IF-L-0.88-0.59.................. 275
Fig. A.20 Horizontal force-displacement relationships of exterior frames ................. 276

xx

xxi
LIST OF TABLES
Table 2.1: Difference between earthquake and progressive collapse (DOD 2013) ....... 11
Table 2.2: Occupancy categories (DOD 2013) ............................................................ 13
Table 2.3: Occupancy category and design requirements (DOD 2013) ........................ 13
Table 3.1: Geometric property of beam-column sub-assemblages ............................... 47
Table 3.2: Material properties of reinforcing bars ....................................................... 51
Table 3.3: Compressive strength of concrete............................................................... 51
Table 3.4: Test results of beam-column sub-assemblages............................................ 54
Table 3.5: Components of vertical load sustained by sub-assemblages ........................ 59
Table 3.6: Rotations of plastic hinges and beam-column sub-assemblages .................. 60
Table 3.7: Failure modes of beam-column sub-assemblages ....................................... 64
Table 4.1: Reinforcement details of precast beam-column sub-assemblages................ 75
Table 4.2 Mixture proportions of ECC........................................................................ 77
Table 4.3 Strength of ECC in tension and compression ............................................... 78
Table 4.4: Material properties of reinforcing and concrete .......................................... 79
Table 4.5: Resistances of beam-column sub-assemblages ........................................... 80
Table 4.6: Rotation angles of beam-column sub-assemblages ..................................... 92
Table 5.1: Details of precast concrete frames ............................................................ 105
Table 5.2: Material properties of concrete and reinforcement .................................... 112
Table 5.3: Resistances and deformations of precast concrete frames ......................... 114
Table 5.4: Pseudo-static resistances of precast concrete frames ................................. 118
Table 5.5: Failure modes of precast concrete frames ................................................. 120
Table 6.1: Geometry and reinforcement details of precast concrete frames................ 136
Table 6.2: Material properties of steel reinforcement ................................................ 139
Table 6.3: Compressive and splitting tensile strengths of concrete ............................ 139

xxii
Table 6.4: Experimental results of precast concrete frames at CAA stage ..................141
Table 6.5: Resistances and deformations of precast concrete frames at catenary action
stage .........................................................................................................................142
Table 6.6: Maximum shear forces in side beam-column joints ...................................152
Table 6.7: Maximum bending moments at column sections .......................................154
Table 7.1: Boundary conditions of beam-column sub-assemblages ............................178
Table 7.2: Comparisons of experimental and analytical results ..................................179
Table 7.3: Reinforcement ratios in beam-column sub-assemblages ............................195
Table 8.1: Failure modes of embedded bars subjected to pull-out force .....................204
Table 8.2: Average bond stress predicted by Shima’s model......................................206
Table 8.3: Material properties of embedded reinforcement (Bigaj 1995) ....................211
Table 8.4: Bond stress of embedded steel bars under pull loading condition ..............215
Table 8.5: Material properties of embedded bars .......................................................216
Table 8.6: Material properties and embedment length for T13 rebar (Yu 2012) .........226
Table 8.7: Material and geometric properties of beam sections ..................................229
Table 8.8: Parameters of springs in joint model .........................................................233
Table A.1 Horizontal stiffness of precast concrete beam-column sub-assemblages ....265
Table A.2 Horizontal stiffness of beam-column sub-assemblages with ECC ..............270
Table A.3 Rotational stiffness of beam-column sub-assemblages with ECC ..............273
Table A.4 Horizontal stiffness of precast concrete frames..........................................277

xxiii
LIST OF SYMBOLS
1sa , 2sa Distances from the centroid of tension reinforcement to the extreme tension fibre at the faces of end the column stub and the middle joint, respectively
'1sa , '
2sa Distances from the centroid of compression reinforcement to the extreme compression fibre at the faces of the end column stub and the middle joint, respectively
b Width of beam section
c Neutral axis depth at the beam end
1c , 2c Neutral axis depths at the faces of the end column stub and the middle joint, respectively
d Diameter of steel reinforcement
'cf Compressive strength of concrete
sf Stress of steel reinforcement at the loaded end
scf Tensile stress of steel reinforcement at the centre of its embedment length when subjected to axial tension
'scrf
Compressive stress of reinforcement at the critical state when the tensile reinforcement attains its yield strain and concrete reaches its ultimate compressive strain simultaneously
yf , 'yf Yield strengths of reinforcement in tension and compression,
respectively
h Depth of beam section
th Thickness of ECC topping
btk , bbk Properties of top and bottom springs at the joint interface
l Clear span of beam
1l , 2l Distances from the inflection point of the beam to the left and right ends, respectively
1pl , 2 pl Horizontal distances between the linear variable different ia l transducers in the plastic hinge region near the end column stub

xxiv
bl , tl Lengths of the column segments below and above the side joint
dl Length of debonded region
el Length of elastic steel reinforcement
jl Diagonal length of the joint panel
sl Length of the straight portion of embedded reinforcement in front of the hook
yl Length of yielded steel segment
ABl Length of steel segment AB under axial tension
CDl , CGl , EFl Length of elastic steel segments CD, CG and EF under axial tension
GDl Length of inelastic steel segment GD under axial tension
q Self-weight of beam
s Slip of reinforcement relative to concrete
1s Slip of reinforcement when the maximum bond stress is attained
2s Slip of reinforcement when the local bond stress starts to decrease
3s Slip of reinforcement at the onset of frictional bond stress
ds Slip of reinforcement at the section where debonding occurs
fs , ls Slip of reinforcement at the free and loaded ends, respectively
ys Slip at the section where the steel bar attains its yield strength
Ds Slip at the end of steel segment CD for axial tension
Fs Slip at the end of steel segment EF for axial tension
t Horizontal movement of end support

xxv
0t Connection gap
du Vertical displacement of middle joint
sA , 'sA Areas of reinforcement in the tension and compression zones
cC , sC Compression forces sustained by concrete and steel reinforcement at the beam end, respectively
1cC , 2cC Compressive forces in concrete at the faces of the end column stub and the middle joint, respectively
1sC , 2sC Forces in the compressive reinforcement at the faces of the end column stub and the middle joint, respectively
cE Tangent modulus of elasticity of concrete
sE Modulus of elasticity of steel bars
hE Hardening modulus of steel bars
secE Secant modulus of elasticity of concrete
dF Force at the section where debonding occurs
yF Yield force of steel bars
aK , rK Stiffness of horizontal and rotational restraints, respectively
1M , 2M Bending moments at the faces of the end column stub and the middle joint, respectively
bbM Moment resistance of bean end section
cM Moment capacity of side column under combined axial compression force and bending moment
cdM , ceM Bending moments at column sections D-D and E-E corresponding to the top and bottom faces of beam
N Axial force in the beam
cN , tN Maximum horizontal compression force at the compressive arch action stage and tension force at the catenary action stage

xxvi
crN Axial compression force in the beam at a critical state when the tensile reinforcement attains its yield strain and extreme compression fibre reaches its crushing strain simultaneously
P Vertical load on the middle joint
cP , fP , tP Capacities of flexural action, compressive arch action and catenary action, respectively
dP Pseudo-static resistance of precast concrete frames
dcP , dtP Pseudo-static resistances of precast concrete frames at the compressive arch action and the catenary action stages
bR , tR Horizontal reaction forces in the bottom pin support and top horizontal restraint
T Tension force sustained by the top longitudinal reinforcement in the beam
1sT , 2sT Tension forces sustained by reinforcement at the faces of the end column stub and the middle joint, respectively
1tT Tension force sustained by engineered cementit ious composites in the structural topping
yT Yield force of top reinforcement in the beam
jcV Horizontal shear force in the side beam-column joint under compressive arch action
jfV Shear force in the side joint under flexural action
δ Vertical displacement of middle joint
1δ , 2δ Deformations of the joint panel in the diagonal directions
1LEδ − , 2LEδ − ,
3LEδ − , 4LEδ − Readings of linear variable differential transducers in the plastic hinge region near the end column stub
3SDδ − , 4SDδ − Measurements of linear variable differential transducers SD-3 and SD-4 corresponding to the top and bottom faces of the beam
ε Strain of steel segment
bε Axial compressive strain of beam

xxvii
cε Strain corresponding to the compressive strength of concrete
0cε Compressive strain of engineered cementitious composites corresponding to the compressive strength
1cε , 2cε Strain of extreme compression fibres at the end column stub and the middle joint
cuε Ultimate compressive strain of engineered cementit ious composites
dε Strain of reinforcement at the section where debonding occurs
lε Steel strain at the loaded end of reinforcement at post-yield stage
'mε Maximum compressive strain that reinforcement has attained
sε , 'sε Tensile and compressive strains of steel reinforcement,
respectively
1sε , '1sε Tensile strain of top reinforcement and compressive strain of
bottom reinforcement at the end column stub, respectively
2sε , '2sε Tensile strain of bottom reinforcement and compressive strain
of top reinforcement at the middle joint
tcε , tuε First cracking and ultimate tensile strains of engineered cementitious composites, respectively
yε , 'yε Yield strains of steel reinforcement in tension and
compression, respectively
1ETε − , 2ETε − Readings of strain gauges ET-1 and ET-2 at the face of the end column stub
ϕ Rotation angle of beam
γ Shear distortion of side beam-column joint
aγ Normalised stiffness of horizontal restraint
cγ Ratio of the total compression force in the compression zone to the force sustained by the compressive reinforcement
θγ Ratio of rotations in the plastic hinge region

xxviii
1/2RCκ − Curvature of beam top reinforcement at the face of the end column stub
0cσ Compressive strength of engineered cementitious composites
1cσ , 2cσ Compressive stresses of concrete at the faces of the end column stub and the middle joint, respectively
cuσ cuσ Ultimate compressive strength of engineered cementit ious composites
sσ , 'sσ Tensile and compressive stresses of steel reinforcement,
respectively
1tσ Tensile stress of ECC topping
tcσ , tuσ First cracking and ultimate tensile strengths of engineered cementitious composites, respectively
1θ , 2θ Rotations measured in the plastic hinge region near the end column stub
cθ , pθ Chord rotation of the bridging beam and plastic hinge rotation at the end column stub
rθ Rigid-body rotation of side joint
1τ Maximum bond stress
2τ Frictional bond stress
dτ Bond stress at the section where debonding occurs
fτ , lτ Bond stress at the free and loaded ends of steel bars at the elastic stage
yτ Post-yield bond stress of steel reinforcement
yeτ Bond stress at the section where the steel bar attains its yield strength
CDτ , CGτ , EFτ Bond stress along elastic steel segments CD, CG and EF under axial tension
Θ Rotation of end support due to insufficient stiffness
0Θ Free rotation angle of end support due to connection gap
CHAPTER 1 INTRODUCTION
1
CHAPTER 1 INTRODUCTION
1.1 Research Background
Progressive collapse is defined by ASCE 7-05 (ASCE 2006) as “the spread of local
damage from an initiating event, from element to element resulting, eventually, in the
collapse of an entire structure or a disproportionately large part of it; also known as
disproportionate collapse”. The partial collapse of Ronan Point Apartment initia ted
the research interest of engineering communities to seek design methods to mitiga te
progressive collapse. Following the aftermath of the partial collapse of Ronan Point
Apartment, provisions for preventing disproportionate collapse were formulated in
the U.K. and formed the basis of subsequent research (Izzudin et al. 2008). In recent
years, the disastrous collapse of the Alfred P. Murrah Federal Building in Oklahoma
City and the World Trade Centre in New York refocused the intellectual debates on
clarifying the load redistribution mechanisms of building structures when subjected
to local failure. Thereafter, design guidelines were released by U.S. government
agencies, such as Department of Defence (DOD 2013) and General Service
Administration (GSA 2003), to prevent progressive collapse of various types of
building structures.
With respect to progressive collapse design, two categories of approaches, namely,
indirect and direct design, have been proposed by Ellingwood and Leyendecker (1978)
and incorporated in the design guides (DOD 2013; GSA 2003). In the indirect method,
progressive collapse resistance of structures is implicitly addressed through the
provisions for minimum level of strength, continuity and ductility in the form of tie
force requirements (DOD 2013). Regarding the direct approach, alternate path
method and enhanced local resistance are used to give explicit considerations of
maintaining the overall structural robustness when accidental loading condition
occurs (NIST 2007). Indeed, both tie forces and alternate path method seek to limit
the extent of damage through mobilisation of alternate load paths in bridging
members, such as the beam and the floor or roof system, under large deformation
conditions. Tie forces are basically contributed by catenary or tensile membrane
action in the floor or roof system, possibly accompanied by catenary action in interna l

CHAPTER 1 INTRODUCTION
2
beams (Stevens et al. 2011; Stevens et al. 2009), while alternate path method is
primarily implemented through the formation of compressive arch action (CAA) and
catenary action in bridging beams.
Experimental tests on beam-column sub-assemblages under middle column removal
scenarios indicate that the bridging beam is able to develop significant CAA to resist
progressive collapse (Lew et al. 2011; Su et al. 2009; Yu and Tan 2013b). In
comparison with catenary action, development of CAA requires relatively small
vertical displacement (less than one beam depth) (Gurley 2008), which makes it more
attractive to structural engineers. However, in order to mobilise effective CAA in the
beam to mitigate progressive collapse, adequate horizontal restraints have to be
provided for the beam (Yu and Tan 2013a), in particular, at the structure perimeter.
1.2 Alternate Load Paths
Following the removal of a supporting column, CAA and catenary action develop
sequentially in the bridging beam over the “damaged” column, if adjacent structura l
members provide adequate horizontal restraints for the beam. CAA features axial
compression force in the beam at relatively small vertical displacement and it
substantially contributes to the flexural resistance of the beam (Park and Gamble
2000; Yu and Tan 2013a). At large deformation stage, tensile strength of the beam is
mobilised to sustain vertical load; catenary action kicks in as the last line of defence
to mitigate disproportionate propagation of the initial damage. Development of
catenary action in a damaged structure requires certain degree of structural integr ity
after undergoing considerable vertical deformations (Khandelwal and El-Tawil 2007).
It is likely to cause premature failure of beam-column joints due to limited rotation
capacity under column removal scenarios (Stevens et al. 2011). Thus, beam-column
joints, in particular, in precast concrete structures, have to satisfy the rotation
requirements in order to develop catenary action.
Greater reinforcement ratios in the beam and special reinforcement detailing in the
beam-column joint have shown to increase the rotation capacity of reinforced
concrete structures under progressive collapse scenarios (Yu and Tan 2013c; Yu and
Tan 2014). Besides, ductile concrete material, such as engineered cementitious

CHAPTER 1 INTRODUCTION
3
composites (ECC), is expected to enhance the ductility and robustness due to its
strain-hardening behaviour, ultra-high strain capacity and damage tolerance in
tension (Li 2003). Furthermore, compatible deformations between steel
reinforcement and ECC reduce the required embedment length of steel bars (Fischer
and Li 2002b). Its potential application to column removal scenarios has to be
investigated in terms of its enhancement to progressive collapse resistance and
rotation capacity of the beam-column joint.
Similar to reinforced concrete one-way slabs (Park and Gamble 2000), development
of CAA and catenary action in the bridging beam is sensitive to horizontal restraints
under column removal scenarios. The progressive collapse resistance of beam-
column sub-assemblages is substantially increased if nearly rigid horizontal restraints
are applied (Su et al. 2009; Yu and Tan 2013c). By reducing the stiffness of horizonta l
restraints, lower CAA and catenary action can be expected. Thus, flexible boundary
conditions of the bridging beam have to be considered in precast concrete structures,
in which realistic adjacent columns to the local damage are designed instead of
enlarged column stubs.
At the structural level, development of CAA and catenary action in the beam imposes
additional horizontal compression and tension forces on adjacent columns. In case of
interior column removal scenario, horizontal forces in both the CAA and catenary
action stages can be equilibrated by the surrounding floor system as a rigid diaphragm.
However, at the perimeter of the structure, shear failure of the beam-column joints
(Choi and Kim 2011) and flexural failure of the columns (Lew et al. 2011) may occur
as a result of additional horizontal forces. Thus, in the flexural and shear design of
adjacent columns, a certain level of horizontal force has to be considered to prevent
potential failure under column removal scenarios. In the UFC 4-023-03 (DOD 2013),
it is suggested that lateral stability and second-order effects be implicitly taken into
account in the provisions of lateral loading in load case combinations, which origina te
from the seismic design code (ASCE 2007). Nonetheless, the magnitude of the
horizontal forces depends on lateral stiffness of the columns. By enlarging the cross
sections of columns, horizontal forces acting on the columns can be increased
considerably. Therefore, more practical and explicit considerations have to be taken
against potential failure of the columns.

CHAPTER 1 INTRODUCTION
4
In addition to experimental tests, the component-based joint model can also be used
to simulate the behaviour of precast concrete structures subject to column removal
scenarios. In the model, reinforced concrete beams and columns are simplified as
fibre elements, and beam-column joints are represented by a panel, in which shear
distortion is considered (Lowes et al. 2004; Mitra and Lowes 2007). The interactions
between structural members and joints are modelled by zero-length inelastic springs.
The constitutive relationships of springs are defined as a function of material and
geometric properties. The method offers a direct approach to representing the
complicated mechanisms in the beam-column joints and to predicting the joint
response accurately (Lowes and Altoontash 2003). In precast concrete structures, the
main challenge lies in the modelling of pull-out failure of embedded steel
reinforcement in the joint due to inadequate anchorage length.
Thus far, limited attention is paid onto the behaviour of precast concrete structures
under column removal scenarios. As an assembly of precast concrete units, precast
concrete structure requires integral and robust beam-column joints when subjected to
progressive collapse. Welded joints are vulnerable to column loss due to the reduced
ductility in heat-affected zones (Main et al. 2014). Cast-in-situ concrete joints, which
connect precast concrete beam and column units through special reinforcement
detailing, exhibit equivalent behaviour to monolithic reinforced concrete joints under
cyclic loading conditions (CAE 1999; FIB 2003). However, further experimental and
analytical investigations are needed on the behaviour of these types of joints under
column removal scenarios.
1.3 Objectives and Scope of Research
Under column removal scenarios, the ability of precast concrete structures to develop
effective alternate load paths to mitigate progressive collapse remains questionab le
due to a lack of experimental and analytical results. Therefore, an experimenta l
programme is proposed in the current study and four series of experimental tests are
conducted under quasi-static loading condition. The primary objectives of the
research are as follows:

CHAPTER 1 INTRODUCTION
5
(1) To investigate the resistance and deformation capacity of precast concrete beam-
column sub-assemblages under quasi-static loading. In the experimental programme,
enlarged column stubs are designed for the bridging beam over the removed column,
and relatively rigid horizontal restraints are applied to the column stubs. The effect
of joint detailing and reinforcement ratios on structural behaviour of sub-assemblages
is studied. Horizontal shear transfer between the precast beam units and cast-in-situ
concrete topping is examined through different treatment of concrete interface. For
this series of tests, horizontal restraints to the column stubs are assumed to be fully
effective.
(2) To study the behaviour of beam-column sub-assemblages with ECC in the
structural topping and beam-column joint in place of conventional concrete. The
enhancement of ECC to the resistance of sub-assemblages under progressive collapse
scenarios is quantified through this comparison study. Furthermore, interactions
between ECC and steel reinforcement are qualitatively analysed.
(3) To explore the effect of boundary conditions and reinforcement detailing on the
development of CAA and catenary action and to gain a deeper insight into the
behaviour of side columns under column removal scenarios. Experimental tests are
conducted on precast concrete frames with realistic side columns under quasi-static
loading condition. Special attention is placed on the flexural and shear resistance of
side columns when subjected to horizontal compression and tension forces from the
bridging beam.
(4) To develop an analytical model to predict the CAA of beam-column sub-
assemblages with ECC structural topping. Different from conventional concrete,
ECC exhibits strain-hardening behaviour and superior strain capacity in tension. Thus,
its tensile strength has to be considered in the analytical model. The stress-strain
model of concrete is used in place of the equivalent rectangular concrete stress block
to consider crushing of concrete at CAA stage. The model is calibrated by
experimental results at the fibre, member cross section and structural levels.
(5) To develop a component-based model for precast concrete beam-column joints.
Force transfer between structural members and beam-column joints is simplified as a
series of nonlinear springs at the joint interface. Properties of the springs are derived

CHAPTER 1 INTRODUCTION
6
based on the bond-slip model of embedded reinforcement. A method to determine the
force-slip relationship of steel reinforcement with insufficient embedment length is
proposed such that pull-out failure of reinforcement can be incorporated into the
component model.
This study provides necessary information on the deformation capacity of precast
concrete beam-column joints under column removal scenarios to examine the failure
cretiria in UFC 4-023-03 and to assess robustness of buildings arising from this
research. Observations from experimental tests reveal the major characteristics of
precast concrete joints in resisting progressive collapse, such as pull-out failure of
embedded reinforcement, horizontal interfacial cracking between precast units and
cast-in-situ concrete topping. Furthermore, an attempt is made to investigate the
flexural and shear failures of connecting columns subject to CAA and catenary action
through equilibrium of lateral forces acting on the columns. Analytical and
component-based joint models are proposed to help engineers to evaluate the CAA
and catenary action capacities. In the component model, fracture and pull-out failure
of steel reinforcement embedded in the joint play a major role and new nonlinea r
springs are developed for fracture and pull-out failure. The work will facilita te
progressive collapse analysis of precast concrete structures by future researchers and
structural engineers.
However, current experimental and analytical studies only focus on the quasi-static
behaviour of two-dimensional precast concrete structures under column removal
scenarios. Potential enhancement of precast concrete planks or cast-in-situ concrete
slabs to the collapse resistance of structures is not considered. The out-of-plane
deflection and torsion of the bridging beam in the realistic structures is prevented in
the experimental tests through lateral restraints.
1.4 Layout of the Thesis
The thesis is divided into nine chapters. The content of the following chapters are
briefly described as follows:
Chapter Two presents an overview of design approaches that have been incorporated
in the design codes and guidelines to mitigate progressive collapse. Experimenta l

CHAPTER 1 INTRODUCTION
7
tests on reinforced concrete buildings and numerical models for beam-column joints
are also reviewed under column removal scenarios. Moreover, material properties
and structural applications of ECC are introduced.
In Chapter Three, experimental tests on precast concrete beam-column sub-
assemblages are described in detail. The resistance and deformation capacity of sub-
assemblages are provided. The effect of reinforcement detailing in the joint and
reinforcement ratios on the CAA and catenary action is discussed. Conclusions and
design recommendations are drawn based on the experimental results of beam-
column sub-assemblages.
Chapter Four introduces the experimental programme on precast beam-column sub-
assemblages with cast-in-situ ECC in the structural topping and beam-column joint.
Behaviour of ECC sub-assemblages subjected to CAA and catenary action is
presented. A comparison is made between conventional concrete and ECC sub-
assemblages in terms of the resistance, crack pattern and failure mode. Prelimina ry
conclusions on the enhancement of ECC to the resistance of sub-assemblages are
obtained.
In Chapter Five, the quasi-static resistance of interior and exterior precast concrete
frames is addressed. The influence of joint detailing and boundary conditions on the
behaviour of frames is quantified. Besides, the pseudo-static resistance is calculated
based on the energy balance method. Chapter Six focuses on the robustness of
exterior precast concrete frames subjected to middle column removal scenarios.
Attempt is made to evaluate the flexural and shear resistance of side columns when
CAA and subsequent catenary action are mobilised in the bridging beam.
In Chapter Seven, an analytical model is proposed to predict the CAA of beam-
column sub-assemblages under column removal scenarios. In the model, the tensile
strength of ECC in tension and stress-strain model of concrete in compression are
taken into account. The model is calibrated against experimental results of reinforced
concrete and ECC sub-assemblages. Furthermore, a series of parametric studies is
conducted to identify dominant factors on CAA of sub-assemblages.
Chapter Eight addresses the component-based joint model for precast concrete beam-
column joints subject to column removal scenarios. In the model, boundary

CHAPTER 1 INTRODUCTION
8
conditions of embedded reinforcement are classified according to the anchorage
length and loading conditions, and average bond stresses at the elastic and post-yield
stages are evaluated. A new model is proposed to estimate the force-slip relationship
of reinforcement with inadequate embedment length. The model can predict the
vertical load-middle joint displacement curves and horizontal reaction force-midd le
joint displacement curves with reasonably good accuracy. In Chapter Nine,
conclusions of current research are drawn and future work is listed.

CHAPTER 2 LITERATURE REVIEW
9
CHAPTER 2 LITERATURE REVIEW
2.1 Overview
This chapter presents an overview of previous studies related to progressive collapse.
First, design approaches included in the design codes and guidelines against
progressive collapse are reviewed. Thereafter, experimental tests on reinforced and
precast concrete structures are discussed to shed light on the load transfer
mechanisms in the bridging beam over the “damaged” column. Finally, the
component-based joint model is introduced under cyclic loadings and column
removal scenarios.
2.2 Design Approaches against Progressive Collapse
The partial collapse of Ronan Point Apartment in 1968 triggered off intens ive
research works on robustness of precast concrete beam-column joints to resist
progressive collapse and eventually formed the basis of design approaches against
progressive collapse proposed by Ellingwood and Leyendecker (1978). Generally,
indirect and direct design approaches are classified, as shown in Fig. 2.1. These
approaches have been widely accepted in the design codes (ACI 2005; BSI 2004) and
guidelines (DOD 2013; GSA 2003) following the tragic collapse of the Alfred P.
Murrah Federal Building and the World Trade Centre twin towers. In the design of
building structures against progressive collapse, tie forces, alternate path method and
enhanced local resistance method can be selected in accordance with occupancy
category.
Design approaches
Indirect design approach
Direct design approach
Tie forces
Alternate path method
Enhanced local resistance method
Fig. 2.1: Design approaches to resist progressive collapse (DOD 2013)

CHAPTER 2 LITERATURE REVIEW
10
2.2.1 Indirect design approach
Indirect design approach is defined as a threat-independent approach to evaluate the
ability of a structure to redistribute vertical loads through the specification of
minimum levels of strength, continuity, and ductility (Stevens et al. 2011). In the
UFC 4-023-03 (DOD 2013) and BS EN 1991-1-7:2006 (BSI 2006), tie forces, which
mechanically tie a structure together, are expressed in quantitative terms to enhance
structural robustness and redundancy. Three horizontal ties, namely, transverse,
longitudinal and peripheral, should be provided in the floor or roof system so as to
transfer the vertical loads through catenary or tensile membrane action to undamaged
horizontal members (Stevens et al. 2009). Vertical ties are required in the columns
and structural walls. The main concern about the aforementioned tie forces lies in the
potential inability of structural members and joints to provide horizontal tie forces
after experiencing significant rotation (Stevens et al. 2009). Therefore, UFC 4-023-
03 (DOD 2013) requires that the primary load-bearing members, such as beams,
girders, and spandrels, are exempted from tie forces unless these members and their
joints can satisfy the specified rotation demands (see Fig. 2.2).
Fig. 2.2: Location restriction for internal and peripheral ties (DOD 2013)
Progressive collapse caused by failure of corner and penultimate supporting members
cannot be mitigated through tie forces due to insufficient lateral restraints to develop
catenary action (Stevens et al. 2011). Furthermore, the effectiveness of tie forces in
preventing the spread of local damage largely depends on initial damage to a single
supporting element at one time, and it fails to survive local failure caused by
simultaneous removal of two adjacent columns (Hansen et al. 2006). Therefore, direct

CHAPTER 2 LITERATURE REVIEW
11
design approach has to be employed in case that catenary or membrane action in the
floor system cannot be successfully mobilised.
2.2.2 Direct design approach
Direct design approach represents explicit considerations of resistance to progressive
collapse in the design (ASCE 2006). It stems from the design methods defined by
Ellingwood and Leyendecker (1978) and includes alternate path method and
enhanced local resistance method.
2.2.2.1 Alternate path method
Table 2.1: Difference between earthquake and progressive collapse (DOD 2013)
Event Earthquake Progressive collapse
Extent Entire structure Localized to the column/wall removal area
Load types Horizontal and temporary Vertical and permanent
Damage distribution Distributed throughout the structure Localized and prevented from progressing
Connection and member response
Cyclic loads with increasing magnitude, without axial loading
One half cycle of loading, in conjunction with a significant
axial load
The alternate path method allows a local failure to occur while seeking to restrain its
extensive propagation through the mobilisation of alternate load paths in the bridging
structural members (ASCE 2006). In this method, threat-independent column
removal scenarios are considered, and their extent and locations are prescribed in the
UFC 4-023-03 (DOD 2013). Analysis procedures, including elastic static, inelast ic
static and inelastic dynamic analyses, are adopted to assess structural behaviour after
the removal of supporting members. However, the acceptance criteria for members
and joints in the UFC 4-023-03 (DOD 2013) are largely imported from ASCE 41-06
(ASCE 2007) under cyclic loading conditions. Significant differences exist between
the two guidelines in terms of extent, load types, damage distribution, connection and
member response (DOD 2013), as shown in Table 2.1. Therefore, the criteria for
seismic design are considered too conservative when applied to progressive collapse
scenarios (Foley et al. 2007).

CHAPTER 2 LITERATURE REVIEW
12
The alternate path method consists of diverse vertical load redistribution mechanisms,
whereas significant discrepancies exist between current design standards and
guidelines. The Building Regulation 2000 (ODPM 2004) and the General Services
Administration (GSA 2003) do not indicate whether the alternate path method
involves a flexural or a catenary mechanism (Gurley 2008), while development of
flexural and catenary actions is implicitly incorporated in the UFC 4-023-03 (DOD
2013). Indeed, following the nominal removal of a supporting column, flexura l
mechanism is mobilised at relatively small deflections (comparable to in-service
deflections) to meet the gravity load requirements (Gurley 2008). With increasing
vertical deformations, the load-resisting mechanism is shifted to catenary action. It is
possible to calculate the resistance provided by the flexural mechanism but not by the
catenary mechanism, as the latter greatly relies on damage locations and availab le
lateral restraints from adjacent structures. Therefore, it is imperative to propose an
analytical model to quantify the resistance of building structures when different load
redistribution mechanisms are mobilised.
2.2.2.2 Enhanced local resistance method
In the enhanced local resistance method, structural members at the specified locations
are intentionally strengthened to reduce the likelihood or extent of the initial damage
(DOD 2013). Shear capacity of structural members is designed to exceed their
flexural capacity so as to ensure a more ductile and controllable failure mode. This
method is oriented to the threat that can be quantified through a risk analysis or
specified through performance-based design requirements. It also acts as an effective
alternative to provide a level of protection for structures unable to mitigate the failure
of corner or penultimate supporting members through tie forces (Stevens et al. 2011).
2.2.3 Relationship between indirect and direct approaches
As a matter of fact, both tie forces and alternate path method attempt to avert the
propagation of local failures via the activation of catenary action, which represents
the last line of defence against progressive collapse. However, development of
catenary action highly relies on the stiffness of lateral restraints and the extent of
localised damage in the affected spans. Thus, in accordance with the level of

CHAPTER 2 LITERATURE REVIEW
13
occupancy and building function or criticality (see Table 2.2), the prerequisite of the
mobilisation of catenary action prompts the combined application of the three
methods in the UFC 4-023-03 (DOD 2013), as shown in Table 2.3.
Table 2.2: Occupancy categories (DOD 2013)
Nature of occupancy Occupancy category Buildings in Occupancy Category I in Table 2-2 pf UFC 3-301-01 Low occupancy buildings, as defined by UFC 4-010-01 I
Buildings in Occupancy Category II in Table 2-2 pf UFC 3-301-01 Inhabited buildings with less than 50 personnel, primary gathering buildings, billeting, and high occupancy family housing
II
Buildings in Occupancy Category III in Table 2-2 pf UFC 3-301-01 III Buildings in Occupancy Category IV in Table 2-2 pf UFC 3-301-01 Buildings in Occupancy Category V in Table 2-2 pf UFC 3-301-01 IV
Table 2.3: Occupancy category and design requirements (DOD 2013)
Occupancy category Design requirement
I No specific requirements
II
Option 1: tie force for the entire structure and enhanced local resistance for the corner and penultimate columns or walls at the first storey.
or Option 2: alternate path for specified column and wall removal locations.
III Alternate path for specified column and wall removal locations; enhanced local resistance for all perimeter first storey columns or walls
IV
Tie forces; Alternate path for specified column and wall removal locations; enhanced local resistance for all perimeter first storey columns or walls.
For occupancy category II structures, the limitation of tie forces in mitigating damage
caused by failure of corner or penultimate supporting members requires the
application of enhanced local resistance method to these members to reduce the
possibility of initial damage (Stevens et al. 2008). In addition, tie forces are difficult
to be used in existing or non-ductile floor systems. These limitations enable the
application of alternate path method as an alternative to evaluating existing structures
(DOD 2013). Concerning occupancy category III, considerations are given to the
increased probability of deliberate attacks and the greater extent of local damage,
which exceeds the assumption in the alternate path method that only one supporting
member is removed in an event (DOD 2013). Therefore, additional protection is
provided by the enhanced local resistance method to minimise the likelihood of
column/wall failure at the perimeter. With regard to occupancy category IV buildings,

CHAPTER 2 LITERATURE REVIEW
14
the addition of tie forces supplements the flexural and catenary action resistances
through alternate path method. Additionally, the enhanced local resistance method is
applied to reduce the possibility of simultaneous removal of two adjacent columns or
walls (DOD 2013). However, there are several limitations associated with the
alternate path method. It does not give any guidance on dealing with transfer
structures such as plate girders or deep beams, neither does it give any guidance if
more than one column is to be removed.
2.3 Experimental Tests under Progressive Collapse Scenarios
Typically, accompanying flexural action, axial compression increases gradually in
axially-restrained beams, which represents the onset of compressive arch action
(CAA) (Izzudin and Elghazouli 2004a). At comparatively large deformations,
crushing of concrete in the flexural compression zone slowly reduces the beam axial
force. At the moment when the beam axial force change from compression to tension,
catenary action sets in as the last line of defence against progressive collapse (Su et
al. 2009), provided structural joints are sufficiently ductile and continuous and there
is sufficient axial restraint on both ends of the beam (Gurley 2008). Catenary action
refers to a chain-like mechanism in structural members subjected to large
deformations. It is dominant when the deflection is comparable or greater than the
depth of the section (Izzudin and Elghazouli 2004b). At catenary stage, tensile
strength of the bridging beam is activated to transfer vertical loads from the damaged
region to the undamaged parts. However, the capacity of structural joints to undergo
large deformations while maintaining their continuity to carry tension forces is not
taken into account in conventional design practice. Consequently, experimental tests
were performed to investigate the deformation capacity and integrity of joints subject
to column removal scenarios.
2.3.1 Quasi-static tests under column removal scenarios
2.3.1.1 Orton’s tests on reinforced concrete beams
In order to evaluate the resistance of existing reinforced concrete beams against
progressive collapse and the efficiency of carbon fibre-reinforced polymer (CFRP)

CHAPTER 2 LITERATURE REVIEW
15
in providing continuity, Orton (2007) tested eight reinforced concrete beams under
middle column removal scenarios. Vertical and axial restraints were provided at the
beam ends. Three point loads were applied to represent uniformly distributed load on
the beam.
(a) NR-2
(b) CR-1
Fig. 2.3: Reinforcement details in beams (Orton et al. 2009)
Among all the beams, NR-2 represented a reinforced concrete beam with
discontinuous bottom reinforcement in the middle joint but not strengthened by
CFRP (see Fig. 2.3(a)). Fig. 2.4(a) shows the measured vertical load and axial force
in the beam. The maximum vertical load in the compression phase was only 10.3 kN
(2.3 kip) at each loading point, accounting for 23% of the required load for
progressive collapse resistance by General Service Administration, U.S. Catenary
effect commenced in the beam beyond the descending branch of vertical load.
Localisation of cracks at the middle joint face enabled the beam to develop large
vertical deflection prior to failure, as shown in Fig. 2.5(a). Eventually, the beam
attained its catenary action capacity of 23.4 kN (5.2 kip). In beam CR-1, continuous
longitudinal reinforcement was provided in the beam and embedded in the joint, as
shown in Fig. 2.3(b). Correspondingly, the maximum vertical load was increased to

CHAPTER 2 LITERATURE REVIEW
16
22.5 kN (5 kip) in the compression phase, 117% greater in comparison with NR-2.
However, lower vertical load was obtained in the catenary regime of CR-1 than NR-
2, due to premature fracture of negative moment reinforcement (see Fig. 2.5(b)), even
though CR-1 was able to mobilise a greater tension force in the beam than NR-2, as
shown in Fig. 2.4(b). Further experimental tests on reinforced concrete beams
retrofitted by CFRP also demonstrate that negative moment reinforcement and CFRP
played a crucial role in developing catenary action in the beam under column removal
scenarios (Orton et al. 2009). By contrast, positive moment reinforcement and CFRP
were favourable to the development of flexural action at relatively small vertical
displacement.
(a) NR-2
(b) CR-1
Fig. 2.4: Vertical and axial loads in beams (Orton 2007)

CHAPTER 2 LITERATURE REVIEW
17
(a) NR-2
(b) CR-1
Fig. 2.5: Failure modes of beams (Orton 2007)
2.3.1.2 Yu’s tests on beam-column sub-assemblages and frames
To identify the load redistribution mechanisms in the bridging beam after column
removal and to investigate the resistance of reinforced concrete structures to mitiga te
progressive collapse, Yu and Tan (2013b) tested two beam-column sub-assemblages
designed per ACI 318-05 with seismic and non-seismic detailing (see Fig. 2.6). Fig.
2.7 shows the test setup for the sub-assemblages. To capture the reaction forces at
each support, restraints on the end stub were decomposed into two horizonta l
restraints and one vertical restraint. The reaction forces were measured through load
cells. Two transverse frames were used to prevent out-of-plane deflections of the
specimens. During each test, displacement-controlled vertical load was applied on
the middle column stub through a servo-hydraulic actuator.

CHAPTER 2 LITERATURE REVIEW
18
Fig. 2.6: Reinforcement detailing of beam-column sub-assemblages (Yu and Tan 2013b)
Fig. 2.7: Test setup for beam-column sub-assemblages (Yu and Tan 2013b)
Fig. 2.8 shows the measured vertical load and horizontal reaction force. Under
column removal scenarios, three phases of force redistribution mechanisms, namely,
flexural action, CAA, and catenary action, were classified in the bridging beam (see
Fig. 2.8(a)). At the early stage, the specimens behaved in flexural action and cracks
formed and spread in the vicinity of the middle joint. After the formation of plastic
hinges at the critical sections, CAA kicked in to sustain additional vertical load and
axial compressive force developed in the beam, as shown in Fig. 2.8(b). Beyond the

CHAPTER 2 LITERATURE REVIEW
19
CAA capacity of the beam, crushing of concrete in the flexural compression zones
induced a descending branch of the vertical load (see Fig. 2.8(a)). At large
deformation stage, catenary action was mobilised to resist the vertical load on the
middle joint, with axial tension force developed in the beam. Final failure of the sub-
assemblages was caused by fracture of beam top reinforcement near the end stub, as
shown in Fig. 2.9.
(a) Vertical load
(b) Horizontal reaction force
Fig. 2.8: Variations of vertical load and horizontal reaction force with middle joint displacement (Yu and Tan 2013b)
Fig. 2.9: Failure mode of sub-assemblage S1 (Yu and Tan 2013b)
At CAA stage, sub-assemblage S1 developed the maximum load of 41.6 kN. Once
catenary action started, vertical load was gradually increased to 68.9 kN, 65% greater
than the CAA capacity. Thus, under relatively rigid boundary conditions, the sub-
assemblage was able to mobilise effective catenary action to mitigate progressive
collapse. A comparison between sub-assemblages with seismic and non-seismic
detailing indicates that contrary to previous suggestions (Corley 2002; Corley 2004;
Hayes et al. 2005a), seismic detailing contributed little to the collapse resistance of
sub-assemblages under column removal scenarios.

CHAPTER 2 LITERATURE REVIEW
20
Further experimental tests were conducted on beam-column sub-assemblages to
investigate the effect of reinforcement ratios and span-depth ratios on the CAA and
catenary action (Yu and Tan 2013c). Most of the sub-assemblages were demonstrated
to be capable of developing significant catenary action, except those with
comparatively short span which exhibited premature shear failure prior to
commencement of catenary action. It is reported that CAA substantially contributed
to structural resistance of sub-assemblages with lower longitudinal reinforcement
ratios and smaller span-depth ratios. By increasing the reinforcement ratio and span-
depth ratio, the contribution of catenary action to structural resistance became more
significant. However, at the frame level, only limited catenary action developed in
the beam with conventional reinforcement detailing, due to consecutive fracture of
reinforcing bars at the column face (Yu 2012). Therefore, special reinforcement
detailing, such as an additional middle layer of reinforcement in the beam, partial
debonding of embedded reinforcement in the middle joint, and partial hinge at the
beam ends, were utilised in an attempt to enhance collapse resistance of reinforced
concrete frames at catenary action stage (Yu and Tan 2014).
2.3.1.3 Sadek’s tests on reinforced concrete assembly
(a) Schematic
(b) Section properties of IMF assembly

CHAPTER 2 LITERATURE REVIEW
21
(c) Section properties of SMF assembly
Fig. 2.10: Reinforcement details of reinforced concrete beam-column assemblies (Sadek et al. 2011)
Sadek et al. (2011) carried out experimental tests on reinforced concrete beam-
column assemblies. Two full-scale specimens were designed in accordance with ACI
318-02. One represented a portion of an intermediate moment frame (IMF) for
Seismic Design Category C, and the other for a fraction of a special moment frame
(SMF) for Seismic Design Category D. Fig. 2.10 shows the details of the reinforced
concrete assemblies.
Fig. 2.11: Test setup and instrumentation for beam-column assemblies (Sadek et al. 2011)
Fig. 2.11 shows the test setup for the assemblies. The footings of exterior columns
were anchored to the testing floor, and horizontal restraints were applied to the top of
exterior columns. Thereafter, displacement-controlled vertical load was applied to the
middle column stub at a rate of 25 mm/min. Fig. 2.12 shows the vertical load-midd le
column displacement history of the assemblies. With increasing vertical displacement,
flexural resistance of the beam-column assemblies was mobilised gradually up to an

CHAPTER 2 LITERATURE REVIEW
22
initial peak of vertical load. A further increase in vertical displacement resulted in
crushing of concrete in the compression zones, which in turn reduced the vertical load.
At large deformation stage, development of catenary action in the bridging beams
enhanced the resistance of the assemblies. Once fracture of bottom reinforcement
occurred in the middle joint, the vertical load dropped sharply, indicating failure of
the assemblies. For each specimen, catenary action provided a greater vertical load
resistance than flexural action. It indicates that beam-column assemblies with seismic
design were capable of mitigating collapse by means of catenary action at large
deformations. Compared to IMF, SMF was able to resist 2.25 times greater vertical
load at failure. It implies the applicability of seismic design in mitigating progressive
collapse, which agrees well with the conclusion drawn by Hayes et al. (2005b).
(a) IMF assembly
(b) SMF assembly
Fig. 2.12: Vertical load-middle joint displacement histories (Sadek et al. 2011)
Besides failure of the bridging beams under column removal scenarios, severe
cracking were also observed on the exterior columns, in particular, the joint zone
(Lew et al. 2011). However, the horizontal reaction forces were not measured in the
tests, and it was not possible to evaluate the flexural strength of the column and the
shear strength of the joint when subjected to catenary action.
2.3.1.4 Yi’s tests on reinforced concrete frame
A four-span and three-storey one-third scale planar frame was tested by Yi et al.
(2008) to study the behaviour of reinforced concrete frame subjected to column loss.
The model frame was designed in accordance with the Chinese concrete design code.
Fig. 2.13 shows the test setup and instrumentations for the frame. The frame was built

CHAPTER 2 LITERATURE REVIEW
23
on a foundation beam fixed to the reaction floor. Prior to testing, a constant vertical
load of 109 kN was applied to the top of the middle column by a servo-hydraulic
actuator and it was supported by two jacks on the first floor. Then the mechanica l
jacks were lowered step-by-step to apply vertical load to the middle column until
steel bars fractured near the end of the first floor beam. During loading, change in the
axial force in the middle column was recorded with a load cell mounted on the top of
the mechanical jacks. Linear variable differential transducers were affixed to specific
locations to measure the vertical and lateral displacements of the model frame.
(a) Details of model frame and instrumentation
(b) Reinforcement detail in beam-column joint

CHAPTER 2 LITERATURE REVIEW
24
(c) Loading configuration
Fig. 2.13: Test setup and instrumentation for beam-column assemblies (Yi et al. 2008)
Fig. 2.14: Variation of load cell reaction force versus middle column displacement (Yi et al. 2008)
Five states were identified on the basis of the relationship of the measured load by
the load cell and the vertical displacement, as shown in Fig. 2.14. At a displacement
less than 5 mm, beams in the frame were at the elastic stage. Then the inelastic stage
continued until yielding of steel bars occurred at the interface of the middle column
on the first floor. Formation of plastic hinges at the beam ends indicated the start of
plastic stage mechanism. Softening stage induced by crushing of concrete in the
plastic hinge region was not significant, possibly due to less flexural stiffness of
adjacent columns. A further increase in vertical displacement mobilised catenary

CHAPTER 2 LITERATURE REVIEW
25
action and tension cracks propagated across the whole beam section. Eventually,
rupture of bottom steel bars near the middle column led to the collapse of the frame.
In addition to the vertical deflection of the middle column, horizontal displacement
of the column on the first floor was also measured, as shown in Fig. 2.15. Negative
deflections represent the measured point moving away from the middle column, and
positive values refer to deflections towards the middle column. Hence, at the init ia l
stage, net compression force existed in the first-floor beams, which pushed the
columns out. At catenary action stage, axial tension force in the beam pulled the
columns towards the middle column. The results agree well with the measured
horizontal force on the beam-column sub-assemblages (Yu and Tan 2013c). The
significant lateral deflections of the columns at the first floor level demonstrated the
deleterious effect of beam catenary action on the stability of adjacent columns.
Fig. 2.15: Effect of middle column displacement on horizontal displacement of columns at first floor level (Yi et al. 2008)
2.3.1.5 Main’s tests on precast concrete assembly
To examine the effectiveness of precast concrete buildings in resisting progressive
collapse, Main et al. (2014) tested a precast concrete beam-column subassembly with
welded connection. Fig. 2.16 shows the details of the beam-to-column connectio n.
Steel angles were embedded in the spandrel beam and welded to the longitudina l
reinforcement. The beam was connected to the external column through steel link
plates welded to the steel angles in the beam and the steel plate in the column.

CHAPTER 2 LITERATURE REVIEW
26
Fig. 2.16: Beam-to-column connection details for SMF building (Main et al. 2014)
Fig. 2.17: Vertical load versus vertical displacement of centre column (Main et al. 2014)
Fig. 2.17 shows the vertical load-displacement curve of the subassembly. Limited
vertical load resistance of the subassembly was obtained due to premature fracture of
beam longitudinal reinforcement at the weld location (see Fig. 2.18). In nature, the
fracture resulted from a reduction in the ductility of the reinforcing bars in the heat-
affected zone. Following the rupture of reinforcement, arch action in the specimen
slightly increased the vertical load. However, significant plastic deformation of the
link plates and severe cracking and spalling of concrete eventually hindered the

CHAPTER 2 LITERATURE REVIEW
27
development of vertical load. Test results indicate that this type of welded connection
in precast concrete structures was not able to develop efficient alternate load path
under column removal scenarios.
Fig. 2.18: Failure mode at connections to centre column (Main et al. 2014)
2.3.2 Dynamic tests
In addition to experimental tests on isolated structural members under column
removal scenarios, on-site dynamic tests were also conducted on reinforced concrete
structures to gain insight into the vertical load redistribution and the deformation of
the bridging beam under different column loss scenarios (Sasani et al. 2007; Sasani
and Sagiroglu 2008; Sasani and Sagiroglu 2010).
2.3.2.1 Interior column removal scenarios
Sasani and Sagiroglu (2010) investigated the resistance and gravity load
redistribution of a reinforced concrete structure subject to a dynamic interior column
removal. Fig. 2.19 shows the plan of the building in which the circled column on the
first floor was removed by explosion. Fig. 2.20 shows the vertical displacement of
joint C3 above the removed column on the second and seventh floors. It was observed
that the vertical displacement of the joint on the seventh floor was substantia lly
smaller than that on the second floor, due to a reduction in the axial compression
force in column C3. Following the removal of the supporting column, the axial
compression forces in the columns above were reduced significantly, as shown in Fig.
2.21. Thus, the columns elongated due to reduced axial forces. Eventually, the axial
compression forces in column C3 attained its minimum value on the second floor and
maximum value on the eighth floor. Experimental results indicated that the reinforced
concrete structure was able to resist the loss of one interior column on the first floor

CHAPTER 2 LITERATURE REVIEW
28
without progressive collapse. Furthermore, contribution of the bridging beams to the
resistance of the structure decreased towards the top of the structure due to elongation
of columns above the local damage.
Fig. 2.19: Location of column removal (circled) (Sasani and Sagiroglu 2010)
Fig. 2.20: Vertical displacements of second and seventh floor joints above removed column (Sasani and Sagiroglu 2010)
Fig. 2.21: Axial compressive force in column C3 on different floors (Sasani and Sagiroglu 2010)
2.3.2.2 Exterior column removal scenarios
Besides instantaneous loss of an interior column, the progressive collapse resistance
of a reinforced concrete structure was evaluated under an exterior column removal

CHAPTER 2 LITERATURE REVIEW
29
scenario (Sasani et al. 2007). Fig. 2.22 shows the plan of the building and the location
of a removed exterior column. It is notable that the effect of direct air blast on the
structure was not included in the experimental study.
Fig. 2.22: Typical plan of the building and location of column removal (Sasani et al. 2007)
Fig. 2.23: Variations of axial forces in column B5 (Sasani et al. 2007)
Following the removal of the first storey column, the second storey column elongated
due to vertical movement of the joint, which reduced the axial force in the column.
A similar reduction of column axial force was also observed on the storeys above.
Fig. 2.23 shows the reduction of axial compression force in the columns with time.
The compression forces on the lower storeys reduced faster than those on the storeys
above. Finally, the compression forces in the columns were substantially reduced in
comparison with those at the original state. However, progressive collapse did not
occur in the structure as a result of development of Vierendeel action in the beams
and columns, as shown in Fig. 2.24. Viereendeel action is characterised by relative
displacement between the beam ends and double-curvature deformation of the beams
and columns (Sasani et al. 2007). It reversed the bending moment in the vicinity of
the removed column. Therefore, pull-out failure of bottom reinforcement in the beam
has to be prevented above the removed exterior column.

CHAPTER 2 LITERATURE REVIEW
30
Fig. 2.24: Bending moment diagram and deformed shape of axis 5 (Sasani et al. 2007)
So far, only Main et al. (2014) tested the behaviour of welded joints in precast
concrete structures under quasi-static column removal scenarios. The joints are
vulnerable to mitigate progressive collapse due to the reduced ductility of steel
reinforcement in the heat-affected zones. However, other types of precast concrete
joints, such as those recommended by FIB (2002), have not yet been experimenta lly
investigated. Thus, experimental programme on the resistance and deformation
capacity of precast concrete beam-column joints has to be conducted. Besides the
joint detailing, the effect of boundary conditions on structural performance of precast
concrete joints needs to be considered in the experimental programme. Furthermore,
development of CAA and subsequent catenary action in the bridging beams imposes
additional horizontal forces to adjacent columns, which may lead to premature
flexural or shear failure of the columns before the beams attain the catenary action
capacity (Lew et al. 2011; Yu 2012). Therefore, to prevent progressive collapse of
precast concrete structures, special attention has to be paid to flexural and shear
resistances of adjacent columns.
2.4 Engineered Cementitious Composites (ECC)
2.4.1 Material properties
ECC is a high-performance fibre-reinforced cementitious composite which features
strain-hardening behaviour and superior strain capacity in tension (Li 2003). Fig. 2.25
shows a typical tensile stress-strain curve of ECC. A tensile strain capacity up to 5%

CHAPTER 2 LITERATURE REVIEW
31
in uniaxial tension can be achieved with only 2% fibres by volume. Extensive
research studies have been conducted on the material properties of ECC. Its matrix
toughness and fibre bridging strength have been optimised by means of the
mechanical model so as to achieve high tensile strength and ductility under quasi-
static loadings (Li et al. 2001; Li et al. 2002; Yang and Li 2010). Fibre, matrix and
fibre/matrix interface have been designed for impact resistance under higher loading
rates (Yang and Li 2012).
Fig. 2.25: Uniaxial tensile stress-strain curves of ECC with 2% PVA fibres (Li 2003)
2.4.2 Structural performance under various loading conditions
Regarding the performance of structural members and joints made of ECC,
experimental programmes have been conducted under various loading conditions.
Fig. 2.26 shows the load-displacement response of columns under reversed cyclic
load. Reinforced ECC columns exhibited greater load-carrying capacity and ductility
in comparison with reinforced concrete members (Fischer and Li 2002b). Compatible
deformations between reinforcement and ECC postponed localisation of cracks in the
plastic hinge region beyond yielding of steel bars, thereby resulting in higher energy
absorption under large deformations. In terms of shear design, transverse steel
reinforcement could be eliminated in the reinforced ECC column, as ECC was able
to provide sufficient shear resistance for the column. Furthermore, confinement effect
of ECC prevented buckling of steel reinforcement when subjected to compression.
Reinforced ECC beams exhibited similar hysteretic behaviour to the columns when
subjected to cyclic load reversal (Fukuyama et al. 2000). Moreover, brittle shear
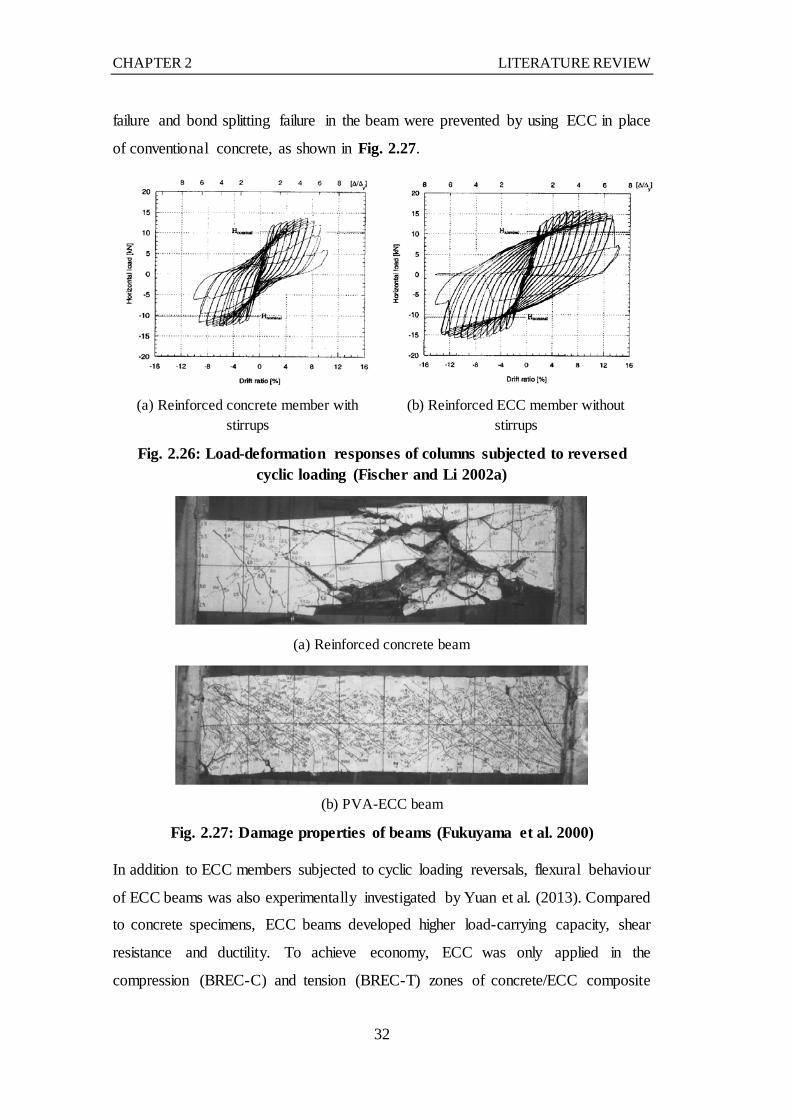
CHAPTER 2 LITERATURE REVIEW
32
failure and bond splitting failure in the beam were prevented by using ECC in place
of conventional concrete, as shown in Fig. 2.27.
(a) Reinforced concrete member with
stirrups
(b) Reinforced ECC member without
stirrups
Fig. 2.26: Load-deformation responses of columns subjected to reversed cyclic loading (Fischer and Li 2002a)
(a) Reinforced concrete beam
(b) PVA-ECC beam
Fig. 2.27: Damage properties of beams (Fukuyama et al. 2000)
In addition to ECC members subjected to cyclic loading reversals, flexural behaviour
of ECC beams was also experimentally investigated by Yuan et al. (2013). Compared
to concrete specimens, ECC beams developed higher load-carrying capacity, shear
resistance and ductility. To achieve economy, ECC was only applied in the
compression (BREC-C) and tension (BREC-T) zones of concrete/ECC composite

CHAPTER 2 LITERATURE REVIEW
33
beams. Fig. 2.28 depicts the failure modes and the load-deflection curves. It indicates
that ECC was more effective in resisting flexural loads when applied in the tension
zone of BREC-T compared to in the compression zone of BREC-C. Nevertheless, by
increasing the depth of ECC layer, final failure was shifted from rupture of fibre-
reinforced polymer reinforcement to crushing of concrete in the compression zone.
(a) Load-deflection curve
(b) BREC-C
(c) BREC-T
Fig. 2.28: Load-deflection curves and failure modes of concrete/ECC composite beams (Yuan et al. 2013)
2.4.3 Interactions between ECC and reinforcement
Fig. 2.29: Load-deformation responses of specimens in uniaxial tension (Fischer and Li 2002b)
To investigate the interactions between ECC and steel reinforcing bars, uniaxia l
tension tests were conducted on reinforced ECC members (Fischer and Li 2002b;
Moreno et al. 2014; Moreno et al. 2012). Prior to first cracking, both concrete matrix

CHAPTER 2 LITERATURE REVIEW
34
and ECC exhibited similar tension-stiffening behaviour in terms of load-deformation
response, as shown in Fig. 2.29. At post-cracking stage, the multi-cracking behaviour
of ECC allowed compatible deformations between ECC and reinforcement, and
tensile stress could be transferred across the crack by bridging fibres. Thus, the
contribution of ECC to the total load could be maintained after yielding of steel
reinforcement (Fischer and Li 2002b).
Fig. 2.30: Interface condition in reinforced concrete and ECC (Fischer and
Li 2002b)
Fig. 2.30 shows the interface condition between reinforcement, concrete and ECC.
Other than inclined cracking in concrete matrix, multiple cracks surrounding the
embedded reinforcement prevented debonding between reinforcement and ECC at
the post-yield stage of reinforcement (Li 2003), which provided significant tension-
stiffening behaviour to reinforced ECC in uniaxial tension. However, beyond the
multi-cracking stage of ECC, a substantial reduction in the average strain of
reinforced ECC was obtained as compared with bare steel bar and reinforced concrete
specimens (Moreno et al. 2014), as shown in Fig. 2.31. Multi-cracking and strain-
hardening behaviour of ECC led to localisation of a major crack, as shown in Fig.
2.32. It considerably reduced the ductility of the reinforced ECC specimen. The
tension-stiffening behaviour of reinforced ECC specimens possibly resulted from
higher bond stress between ECC and steel reinforcement.

CHAPTER 2 LITERATURE REVIEW
35
(a) Reinforced concrete
(b) Reinforced ECC
Fig. 2.31: Total load in specimens versus average strain (Moreno et al. 2014)
(a) Reinforced concrete member
b) Reinforced ECC member
Fig. 2.32: Cracks in specimens prior to fracture of reinforcement (Moreno et al. 2014)
2.4.4 Bond stress of reinforcement embedded in ECC
Bandelt and Billington (2014) tested a series of beam specimens under four-point
bending to investigate the bond-slip behaviour of steel reinforcement embedded in
conventional concrete, ECC, self-consolidating high performance fibre reinforced
concrete (SC-HPFRC) and self-consolidating hybrid fibre reinforced concrete (SC-
HyFRC). All beams exhibited splitting bond cracks due to insufficient concrete cover
for steel reinforcement. Comparisons of normalised bond stress-slip curves indicate
that when the same concrete cover (equal to the diameter of beam longitudinal bars)
and no stirrup were used in beams, reinforcement embedded in ECC developed the

CHAPTER 2 LITERATURE REVIEW
36
greatest bond stress among the four concrete materials, as shown in Fig. 2.33(a). The
maximum value was around 39% higher as compared to that in concrete. Additiona l
confinement provided by stirrups exhibited little effect on the bond stress of
reinforcement in ECC (see Fig. 2.33(b)), whereas bond strength of steel bars in
concrete, SC-HPFRC and SC-HyFRC was increased. It indicates that ECC could
provide better confinement condition than conventional concrete, SC-HPFRC and
SC-HyFRC with the given cover thickness. Besides, bond-splitting strength of
reinforced ECC elements was also studied through pull-out bond tests on embedded
reinforcement with various cover thickness (Asano and Kanakubo 2012; Kunakubu
and Hosoya 2015). Empirical equations were also derived for predicting the bond-
splitting strength of ECC.
(a) Unconfined
(b) Confined by stirrups
Fig. 2.33: Bond stress-reinforcement slip response (Bandelt and Billington 2014)
Compatible deformations and greater bond strength between ECC and steel
reinforcement are likely to reduce the required embedment length of steel bars in
ECC, thereby facilitating the design and construction of precast concrete beam-
column joints. Moreover, tensile strength of ECC can also be taken into considerat ion
(JSCE 2008), which could increase the flexural resistance of reinforced ECC
members. When applied to progressive collapse design, localised cracks at large
deformation stage reduce the ductility of reinforced ECC members, as reported by
Bandelt and Billington (2014). Therefore, further experimental tests are necessary to
investigate the behaviour of ECC sub-assemblages under column removal scenarios.

CHAPTER 2 LITERATURE REVIEW
37
2.5 Component-Based Joint Models
The concept of component method is to idealise the force transfer at the perimeter of
a typical joint as a series of basic components to explicitly represent the joint
behaviour (Zoetemeijer 1983). It has been incorporated in BS EN 1993-1-8: 2005
(BSI 2005) and recommended for the design of steel and composite beam-column
joints. Nowadays, a unified characterisation procedure for structural joints has been
developed (Jaspart 2000). Application of component-based model to reinforced
concrete structural joints under cyclic loading conditions has also been proposed
(Lowes and Altoontash 2003; Mitra and Lowes 2007). These research works form
the common basis for future seismic design codes. However, for beam-column joints
under progressive collapse scenarios, the transformation of resisting mechanisms at
different stages necessitates special considerations of component characterisation.
2.5.1 Procedure of joint characterisation
In the characterisation process, a joint is considered as a set of individual components,
including relevant components in the compression zone, tension zone, interface and
joint panel. Each of these components possesses its own constitutive model, and
various combinations of these components allow a wide range of joint configuratio ns
to be incorporated in the joint model. Although coexistence of different components
is likely to affect the strength and stiffness of each fundamental component (Guisse
and Jaspart 1995), the principle of component method is still valid for beam-column
joints (Jaspart 2000).
Application of component method to the beam-column joint requires the following
steps (Jaspart 2000): 1) identification of active components for the joint; 2) evaluat ion
of the response of each basic component; 3) assembly of the components to assess
the mechanical properties of the whole joint. All the three steps require a sufficient
knowledge on distribution and transfer of internal forces within the joint. Generality
of the framework of component method allows for adoption of various techniques of
component characterisation and joint assemblies. The stiffness and strength
characteristics of the components can be obtained from component tests in laboratory,
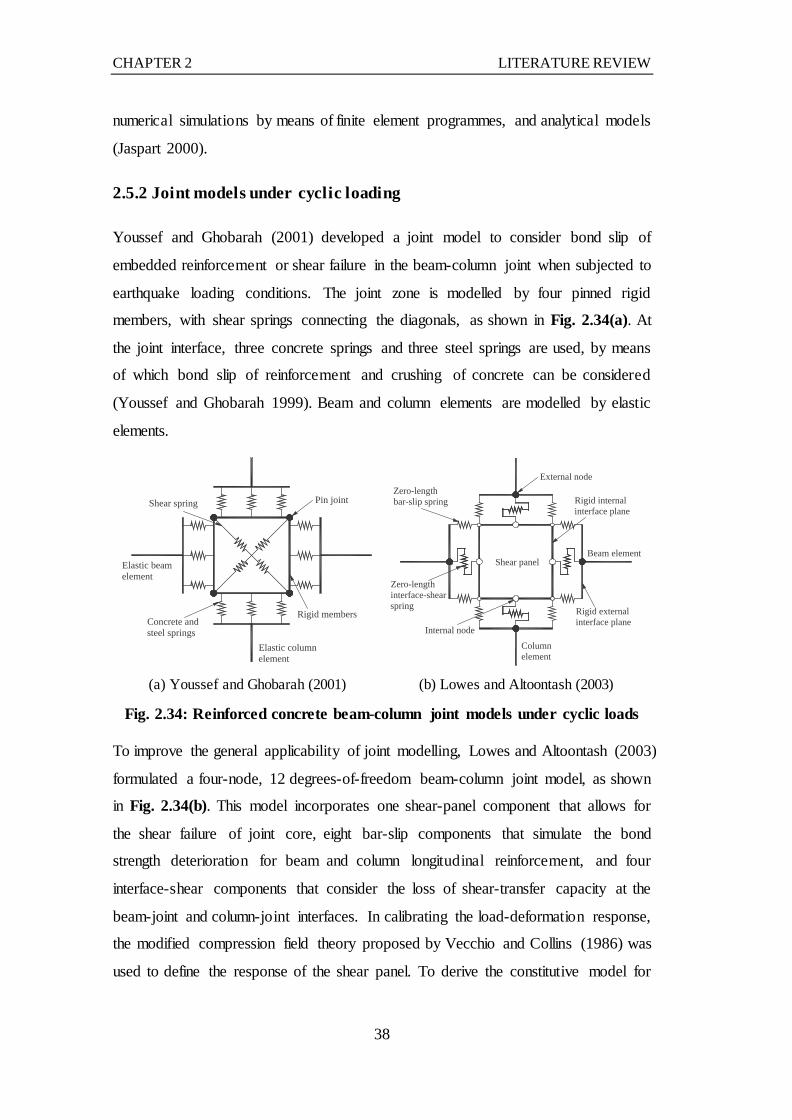
CHAPTER 2 LITERATURE REVIEW
38
numerical simulations by means of finite element programmes, and analytical models
(Jaspart 2000).
2.5.2 Joint models under cyclic loading
Youssef and Ghobarah (2001) developed a joint model to consider bond slip of
embedded reinforcement or shear failure in the beam-column joint when subjected to
earthquake loading conditions. The joint zone is modelled by four pinned rigid
members, with shear springs connecting the diagonals, as shown in Fig. 2.34(a). At
the joint interface, three concrete springs and three steel springs are used, by means
of which bond slip of reinforcement and crushing of concrete can be considered
(Youssef and Ghobarah 1999). Beam and column elements are modelled by elastic
elements.
(a) Youssef and Ghobarah (2001)
(b) Lowes and Altoontash (2003)
Fig. 2.34: Reinforced concrete beam-column joint models under cyclic loads
To improve the general applicability of joint modelling, Lowes and Altoontash (2003)
formulated a four-node, 12 degrees-of-freedom beam-column joint model, as shown
in Fig. 2.34(b). This model incorporates one shear-panel component that allows for
the shear failure of joint core, eight bar-slip components that simulate the bond
strength deterioration for beam and column longitudinal reinforcement, and four
interface-shear components that consider the loss of shear-transfer capacity at the
beam-joint and column-joint interfaces. In calibrating the load-deformation response,
the modified compression field theory proposed by Vecchio and Collins (1986) was
used to define the response of the shear panel. To derive the constitutive model for
Pin joint
Rigid members
Elastic columnelement
Elastic beamelement
Concrete andsteel springs
Shear spring
Shear panel
External node
Rigid externalinterface plane
Zero-lengthinterface-shearspring
Zero-lengthbar-slip spring
Beam element
Columnelement
Rigid internalinterface plane
Internal node

CHAPTER 2 LITERATURE REVIEW
39
tensile springs at the joint interface, it was assumed that the embedment length of
reinforcement is adequate in the joint. Pull-out force is applied at one end of
reinforcement, whereas strain and slip are zero at the other end. A piecewise constant
bond stress distribution was assumed along the embedment length of steel
reinforcement anchored in the joint, as shown in Fig. 2.35. Accordingly, the force-
slip relationship of steel reinforcement in tension could be determined. For
compressive springs, plane-section assumption was utilised to quantify the total
compression force sustained by the spring, whereas corresponding slip could be
calculated from the bond-slip model in Fig. 2.35. An elastic response was postulated
for interface-shear components due to a lack of test data in defining their constitut ive
relationships. A further study by Mitra and Lowes (2007) recommended ways to
improve the accuracy of joint behaviour prediction and to eliminate numerica l
instability problems: 1) bar-slip springs are located at the centroid of beam and
column flexural tension and compression zone; 2) a diagonal compressive strut
mechanism is assumed in the joint-panel component; 3) a new bond-slip model is
proposed to simulate the frictional resistance for bars in tension and compression.
However, the models are not appropriate for modelling of beam-column joints with
no transverse reinforcement (Sharma et al. 2011).
Fig. 2.35: Bond and bar stress distribution along a reinforcing bar embedded under pull-out force (Lowes et al. 2004)
2.5.3 Joint models under progressive collapse
Unlike seismic loading conditions, axial force develops in the bridging beam when
subject to column removal (Lew et al. 2014; Yu and Tan 2014), of which the
magnitude depends on the stiffness of horizontal restraints to the beam. Thus, based
on the joint model formulated by Lowes and Altoontash (2003), Bao et al. (2008) and

CHAPTER 2 LITERATURE REVIEW
40
Yu and Tan (2010b) constructed their macro-models for reinforced concrete beam-
column joints under column removal scenarios, as shown in Figs. 2.36(a and b). In
these models, a series of nonlinear springs is assembled at the joint interface, through
which the force transfer between structural members and beam-column joints is
fulfilled. These springs comprise a shear spring, a compression spring and a tension
spring. The difference between the two models lies in the formulation of the joint
panel. In Bao’s model (Bao et al. 2008), the joint panel is constructed by four rigid
elements connected by four pin nodes and two rotational springs are used at the pin
nodes to represent the shear distortion of the joint core. Yu and Tan (2010b) assumed
a rigid joint panel in the analysis of reinforced concrete beam-column sub-
assemblages under column removal scenarios. In the later study, the joint core was
represented by four pinned rigid members, with two diagonal springs in the joint
panel (Yu 2012). However, under progressive collapse scenarios, the joint panel is
less significant in the behaviour of sub-assemblages due to limited shear force in the
middle joint.
(a) Bao et al. (2008)
(b) Yu and Tan (2010b)
Fig. 2.36: Beam-column joint models under column removal scenarios
Under middle column removal scenarios, bottom reinforcement in the middle joint is
subjected to axial tension at two ends. Thus, the bond-slip model proposed by Lowes
et al. (2004) is not suitable if the reinforcement passing through the middle joint is
insufficiently long to ensure zero strain in the middle of its embedment length. Instead,
a bond-slip model for embedded reinforcement under axial tension was derived by
Yu and Tan (2010b), as shown in Fig. 2.37. In the mode, non-zero tensile strain in
the middle of the embedment length of reinforcement was considered and a stepwise
bond stress profile was still employed to derive the force-slip relationship of steel

CHAPTER 2 LITERATURE REVIEW
41
bars. Similar steel strain and bond stress profiles were also assumed by Bao et al.
(2014) for reinforced concrete frames subject to column removal scenarios. In
deriving the force-slip relationship of compressive springs, equivalent concrete
compressive stress block was used and additional compression force in the beam was
considered to determine the neutral axis depth at the beam end (Yu 2012). Total force
in the compression zone was correlated to the slip of compressive reinforcement so
as to obtain the force-slip relationship of compressive springs.
Fig. 2.37: Bond and bar stress distribution along a reinforcing bar under axial tension (Yu and Tan 2010b)
However, in those models, bond stressed at elastic and post-yield stages of steel
reinforcement are quite different from one another and need to be re-evaluated by test
data. Besides, pull-out failure of reinforcement, which is common for reinforcement
with insufficient embedment length in the joint (Orton et al. 2009), has not been
incorporated in the component-based models. For the properties of compressive
spring, equivalent concrete stress block is not valid at large deformation scenarios as
a result of crushing of concrete in compression. Instead, constitutive model for
concrete can be more reasonable for calculating the compression force sustained by
concrete. Therefore, further improvements are necessary for the component-based
joint model under column removal scenarios.
2.6 Summary
In recent years, the increasing risk of terrorist attack necessitates experimental and
analytical studies on the progressive collapse resistance of building structures.
Meanwhile, design approaches against progressive collapse have been proposed and
incorporated in the design guidelines, such as UFC 4-023-03 (DOD 2013). In the

CHAPTER 2 LITERATURE REVIEW
42
design of building structures against progressive collapse, special focus is placed on
the ability to develop alternate load paths under column removal scenarios, which
requires beam-column joints to exhibit adequate ductility and robustness when local
damage occurs. Experimental tests on reinforced concrete structures at different
levels and on static and dynamic loading conditions indicate that CAA and catenary
action develop sequentially under middle column removal to resist progressive
collapse. However, when it comes to precast concrete structures subject to column
removal scenarios, there are very limited results on the resistance and deformation
capacity of precast beam-column joints (Main et al. 2014). Therefore, experimenta l
tests on precast concrete beam-column sub-assemblages and frames are necessary in
order to assess the resistance, deformation capacity and failure mode under different
boundary conditions.
Although utilisation of ECC in structural members is suggested in the design
recommendations (JSCE 2008), behaviour of beam-column sub-assemblages with
ECC joints and structural topping has not yet been explored under column removal
scenarios. Similar to fibre-reinforced concrete (FIB 2013), ductility of ECC under
compression is improved by the bridging fibres. Besides, tensile strength of ECC can
be considered at strain-hardening stage. Thus, the CAA capacity of beam-column
sub-assemblages is expected to be enhanced if ECC is utilised in the beam in place
of conventional concrete. However, the behaviour of beam-column sub-assemblages
cast with ECC topping remains unknown at large deformations. Therefore, the
applicability of ECC with strain-hardening behaviour and superior strain capacity in
tension to progressive collapse scenarios needs to be explored through experimenta l
tests.
Finally, based on experimental results, component-based joint models need to be
proposed for precast concrete beam-column joints and calibrated to facilita te
structural analysis under column removal scenarios. In the models, different failure
modes of steel reinforcement embedded in beam-column joints have to be
incorporated. Besides, crushing of concrete at large deformation scenarios should
also be considered in deriving the force-slip relationship of compressive springs.

CHAPTER 3 TESTS OF PRECAST CONCRETE SUB-ASSEMBLAGES
43
CHAPTER 3 EXPERIMENTAL TESTS OF PRECAST
CONCRETE BEAM-COLUMN SUB-ASSEMBLAGES
3.1 Introduction
In precast concrete structures, precast beam units with cast-in-situ structural topping
and beam-column joints have been used as ductile moment-resisting frames, as
reported by FIB bulletins (FIB 2002; FIB 2003) and other documents (CAE 1999;
Shiohara and Watanabe 2000; Van Acker 2013). Its design is compatible with design
codes for monolithic reinforced concrete structures, but minor modifications are
made in the reinforcement detailing to achieve high productivity (Shiohara and
Watanabe 2000). With proper reinforcement detailing in beam-column joints, frames
can exhibit equivalent behaviour to monolithic reinforced concrete structures under
flexure condition (CAE 1999). Detailing practice of structural joints in precast
concrete structures have also been recommended under progressive collapse
scenarios, which requires utilisation of continuous beam top longitudina l
reinforcement passing through the joint (Van Acker 2013). The pertinent question is
whether this type of precast beam-column sub-assemblages can exhibit catenary
action under column removal scenarios. Thus, experimental studies are necessary to
evaluate the resistance and deformation capacity of precast concrete beam-column
sub-assemblages under column removal scenarios.
This chapter describes the behaviour of precast concrete beam-column sub-
assemblages under middle column removal scenarios. The effects of reinforcement
detailing in the joint and longitudinal reinforcement ratio in the beam on compressive
arch action (CAA) and catenary action were investigated, and recommendations were
made for the design of precast concrete structures against progressive collapse. These
findings are relevant to any form of precast concrete construction that does not require
special embedded metal inserts or mechanical couplers for the bottom reinforcement
in the joint region.

CHAPTER 3 TESTS OF PRECAST CONCRETE SUB-ASSEMBLAGES
44
3.2 Test Programme
3.2.1 Prototype structure
(a) Plan view
(b) Elevation view
Fig. 3.1: The prototype precast concrete structure
A six-storey precast concrete frame building was designed under gravity loads in
accordance with Eurocode 2 (BSI 2004). Figs. 3.1(a and b) show the plan and
elevation views of the structure. The height of a typical storey was 3.6 m, except the
4.5 m high first floor. The centre-to-centre spacing of columns in two orthogona l
directions was 6 m. The cross sections of a prototype beam and a column were 300
mm by 600 mm and 500 mm by 500 mm, respectively. Under column removal
6000
6000
6000
1
2
3
4
6000 6000 6000 6000 6000
A B C D E F
6000
5
column loss
6000
G
column removed
specimen to be tested
4500
3600
3600
3600
3600
3600
6000 6000 6000 6000 6000
A B C D E F
2250
0
A B C
6000
G

CHAPTER 3 TESTS OF PRECAST CONCRETE SUB-ASSEMBLAGES
45
scenarios, one middle column at the ground floor of the peripheral frame was
assumed to be forcibly removed, as shown in Fig. 3.1(b). A beam-column sub-
assemblage, incorporating the two-span beam and the middle column over the
column removal, was extracted from the precast concrete frame.
To fit the extracted sub-assemblage within the physical constraints of the Protective
Engineering laboratory in Nanyang Technological University, the beams and
columns in the prototype building were scaled down to one-half, but the beam
reinforcement ratio remained unchanged. Thus, the spacing of precast columns in two
orthogonal directions was 3 m, and the dimensions of beams and columns were scaled
down to 150 mm by 300 mm and 250 mm square, respectively. Two enlarged column
stubs were erected on both sides of the sub-assemblage to simulate horizonta l
restraints from adjacent columns.
3.2.2 Specimen design
Welded connections in precast concrete structures exhibit limited capacity to develop
alternate load paths due to the reduced ductility of steel reinforcement in the heat-
affected zone (Main et al. 2014). Cast-in-situ concrete provides better robustness for
precast structural elements, as reported by FIB bulletin 19 (FIB 2002). Therefore, to
enhance the structural performance of precast concrete structures under column
removal scenarios, precast beam units mixed with cast-in-situ concrete topping and
beam-column joint were used for the ductile moment resisting frame in the
experimental programme. Two stages of casting were adopted in fabricating the
beam-column sub-assemblages. Firstly, the 225 mm deep precast beam unit, as
depicted by the hatched zones in the beam-column sub-assemblages in Fig. 3.2, was
fabricated. Thereafter, the two beam units were assembled and continuous top
reinforcement was placed inside the projecting stirrups. Finally, 75 mm deep concrete
topping, the middle beam-column joint and the end column stubs were cast to form
an integral sub-assemblage. It is noteworthy that cast-in-situ middle column and end
column stubs were used in the sub-assemblages, as reinforcement details in the
column do not significantly affect the development of alternate load paths in the
bridging beam when adequate horizontal restraints are provided by adjacent structura l
members.
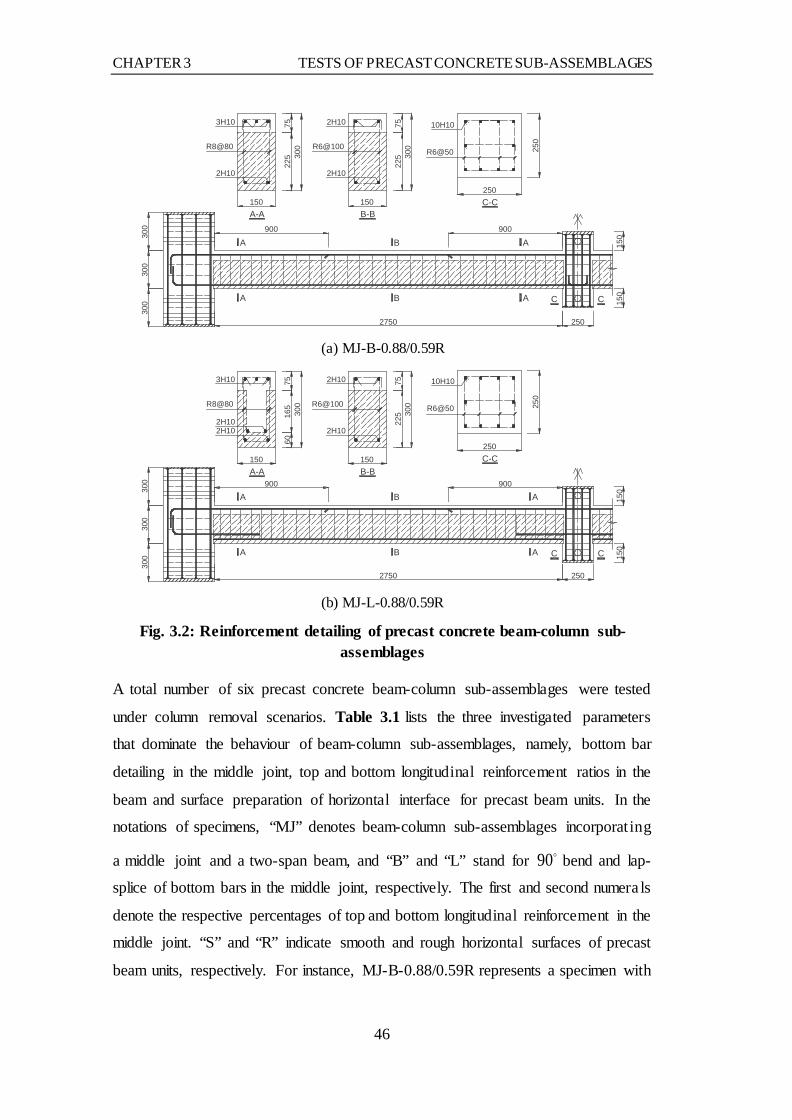
CHAPTER 3 TESTS OF PRECAST CONCRETE SUB-ASSEMBLAGES
46
(a) MJ-B-0.88/0.59R
(b) MJ-L-0.88/0.59R
Fig. 3.2: Reinforcement detailing of precast concrete beam-column sub-assemblages
A total number of six precast concrete beam-column sub-assemblages were tested
under column removal scenarios. Table 3.1 lists the three investigated parameters
that dominate the behaviour of beam-column sub-assemblages, namely, bottom bar
detailing in the middle joint, top and bottom longitudinal reinforcement ratios in the
beam and surface preparation of horizontal interface for precast beam units. In the
notations of specimens, “MJ” denotes beam-column sub-assemblages incorporat ing
a middle joint and a two-span beam, and “B” and “L” stand for 90 bend and lap-
splice of bottom bars in the middle joint, respectively. The first and second numera ls
denote the respective percentages of top and bottom longitudinal reinforcement in the
middle joint. “S” and “R” indicate smooth and rough horizontal surfaces of precast
beam units, respectively. For instance, MJ-B-0.88/0.59R represents a specimen with
300
300
300
2750 250
150
150
A
A
B
B
A
A
900 900
300
150
7522
5 300
150
7522
5
3H10
R8@80
2H10
R6@100
10H10
R6@50 250
250
C C
A-A B-BC-C
2H10
2H10
300
300
300
2750 250
150
150
A
A
B
B
900 900
300
150
7516
5
300
150
7522
5
A-A
A
A
60
3H10
R8@80
2H10
2H10
R6@100
2H102H10
10H10
R6@50 250
250
B-BC-C
C C

CHAPTER 3 TESTS OF PRECAST CONCRETE SUB-ASSEMBLAGES
47
bottom reinforcement of 90o bend in the middle joint, a top reinforcement ratio of
0.88%, a bottom reinforcement ratio of 0.59%, and a rough horizontal concrete
surface for the two precast beam units.
Table 3.1: Geometric property of beam-column sub-assemblages
Specimen Clear span (m)
Length of curtailed top bar (mm)
Bottom bars at middle joints and length&
(mm)
Longitudinal reinforcement Surface
treatment A-A
section B-B
section Top Bottom Top Bottom
MJ-B-0.52/0.35S
2.75
900 90o bend (190+70) 3H10 2H10 2H10 2H10 Smooth
MJ-L-0.52/0.35S 900 Lap-spliced
(360) 3H10 2H10 2H10 2H10 Smooth
MJ-B-0.88/0.59R 1000 90o bend
(190+90) 3H13 2H13 2H13 2H13 Rough
MJ-L-0.88/0.59R 1000 Lap-spliced
(470) 3H13 2H13 2H13 2H13 Rough
MJ-B-1.19/0.59R 1000 90o bend
(190+90) 2H16+
H13 2H13 2H16 2H13 Rough
MJ-L-1.19/0.59R 1000 Lap-spliced
(470) 2H16+
H13 2H13 2H16 2H13 Rough &: The anchorage length is calculated from the face of the middle column, and the length (190+90) denotes the horizontal portion of the 90o bend bar is 190 mm and the vertical portion is 90 mm.
For discontinuous bottom reinforcing bars in precast concrete beams, two widely-
used joint detailing in local practice were studied. The first joint detailing features
protruded bottom longitudinal bars terminating with a 90o bend in the joint region
(see Fig. 3.2(a)). This type of joint detailing performs well even under earthquake
loading conditions and has been recommended for construction in New Zealand
(CAE 1999). However, this detailing may lead to congestion of reinforcement in the
joint region, and the column size should be sufficiently wide to accommodate the
required embedment length (FIB 2003). The second joint detailing is characterised
by U-shaped beam trough sections at the beam ends connecting to the joint (Fig.
3.2(b)). Unlike the precast concrete beam shells tested by Park and Bull (1986), the
U-shaped trough section was only located at the two ends of the precast beams and
its length depends on the required embedment length of bottom reinforcement passing
through the middle joint. In-situ concrete was cast in the trough, the joint region and
the structural topping consisting of continuous top reinforcement. Composite action
between precast beam units and concrete topping relies on the roughness of horizonta l
interface, the amount of protruded stirrups and the concrete strength (Patnaik 2000).
In the study, across the horizontal interface between the precast beam units and cast-

CHAPTER 3 TESTS OF PRECAST CONCRETE SUB-ASSEMBLAGES
48
in-situ concrete topping, two types of surface preparation were employed to examine
the effectiveness of horizontal shear transfer at large deformation stage. “Smooth
surface” refers to one without any treatment after vibration, whereas “rough surface”
represents an interface that is intentionally roughened to approximately 3 mm
roughness complying with Eurocode 2 (BSI 2004). In all specimens, mild steel
stirrups of 8 mm diameter at 80 mm spacing were placed at the beam end sections,
whereas stirrups of 6 mm diameter at 100 mm spacing were used at the middle
sections.
3.2.3 Test setup
The boundary conditions of beam-column sub-assemblages in the frame structure
were simplified as two horizontal restraints and one vertical restraint on the column
stub at each end, as shown in Fig. 3.3. Load cells were used in the horizontal direction
to record reaction forces, as shown in Fig. 3.4(a). At the bottom of each column stub,
a pin support was seated on steel rollers (see Fig. 3.4(b)), and load cells were placed
under the rollers to measure the vertical reaction force. The fairly rigid horizonta l
restraints from the A-frame and the reaction wall provided the upper bound values of
structural resistances of the beam-column sub-assemblage under column removal
scenarios.
Fig. 3.3: Test setup for beam-column sub-assemblages
Load cell
Roller support
A-frame
Out-of-plane restraint
Rotational restraint
Actuator
Reaction wall

CHAPTER 3 TESTS OF PRECAST CONCRETE SUB-ASSEMBLAGES
49
In addition to the boundary conditions at the end column stubs, two pairs of universa l
steel columns with steel rollers were erected on each side of precast beams to prevent
out-of-plane bending of the beams as load was applied onto the middle joint, as shown
in Fig. 3.4(c). This was to simulate the full restraint from the slab, so that the sub-
assemblage could only deflect vertically. In the vicinity of the middle joint, two sets
of short columns were employed in front of and behind the sub-assemblage. Steel
rods were placed in the PVC pipes embedded in the middle column, as shown in Fig.
3.4(d). Hence, rotation of the middle joint could be prevented if reinforcing bars only
fractured at one vertical face of the joint. A displacement-controlled point load at a
rate of 6 mm/min was applied vertically on the middle column through a servo-
hydraulic actuator.
(a) Horizontal restraints
(b) Bottom pin support on steel rollers
(c) Out-of-plane restraint on beams
(d) Rotational restraint in middle joint
Fig. 3.4: Restraints on beam-column sub-assemblages
Load cells
Pin support
Steel roller
Steel rods
A-frame End column stub
End column stub
Steel column
Beam Middle joint
Short column

CHAPTER 3 TESTS OF PRECAST CONCRETE SUB-ASSEMBLAGES
50
3.2.4 Instrumentations
Besides the reaction forces measured by the horizontal and vertical load cells, the
deformed geometry of the beam-column sub-assemblages was monitored through
linear variable differential transducers (LVDTs) placed along the beam length at
regular intervals. Additionally, plastic hinges at the beam ends played a crucial role
in the deformation capacity of sub-assemblages, and they were measured by a group
of LVDTs mounted onto the beam. Fig. 3.5 shows the LVDT arrangement to measure
the vertical deflections of the beam and the rotations of plastic hinges at the beam
ends. The plastic hinge length for a typical beam was taken as 0.5h, where h is the
full depth of the beam cross section (Paulay and Priestley 1992). Thus, the first row
of LVDTs measured the plastic hinge rotations over a length of 150 mm. Since the
development of catenary action could extend the plastic hinge length, another row of
LVDTs was installed at 120 mm away from the first row of LVDTs at both beam
ends. As CAA is sensitive to any connection gaps between sub-assemblages and
restraints (Yu 2012), horizontal movements of end column stub were monitored
through LVDTs LS-1 and LS-2 at the horizontal restraints to account for the effect of
connection gaps on the behaviour of sub-assemblages.
Fig. 3.5: Schematic of hinge rotation and beam deformation measurement
Fig. 3.6: Layout of strain gauges on longitudinal reinforcement
Strain gauges were mounted onto the beam longitudinal reinforcement at the
interfaces with the middle joint and end column stub to measure steel strains at
150 120 150120LS-1
LS-2
LE-1 LE-3 LM-1LM-3
200
200
LB-1 LB-2 LB-3 LB-4 LB-5LB-6
300 450 625 625 450 300
S1 S2
Column stub
Middle joint
LE-2 LE-4 LM-2LM-4
A B C D E F G
ET-1ET-2ET-3
EB-1
EB-2
End column stub face Middle joint face
MB-2
MB-1
MT-1MT-2MT-3
TP-1TP-2TP-3 TC-2
TC-1
BP-1
BP-2TB-2
TB-1

CHAPTER 3 TESTS OF PRECAST CONCRETE SUB-ASSEMBLAGES
51
different loading stages. Besides, strains of longitudinal reinforcement were also
traced at a section 300 mm away from the faces of the middle joint and end column
stub and at the curtailment point of beam top reinforcement. Fig. 3.6 shows the layout
of steel strain gauges on the top and bottom longitudinal bars in the beam. It should
be noted that for beam-column sub-assemblages with lap-spliced bottom bars, strain
gauges were mounted on the bottom bars passing through the joint.
3.3 Material Properties
Hot-rolled deformed steel bars with diameters of 10, 13 and 16 mm were used for
longitudinal reinforcement in the beam, and round bars with 6 and 8 mm diameters
were used for stirrups. Concrete with the maximum coarse aggregate size of 10 mm
was mixed for the precast beam units, the cast-in-situ concrete topping and the joint
itself. Prior to testing, material properties of reinforcement and concrete were
obtained, as listed in Table 3.2 and Table 3.3. Fig. 3.7 shows the typical stress-strain
curves of concrete and steel reinforcement.
Table 3.2: Material properties of reinforcing bars
Material Diameter (mm)
Yield Strength (MPa)
Modulus of elasticity
(GPa)
Ultimate strength (MPa)
Fracture strain* (%)
Longitudinal bars
H10 10 462 187.3 553 11.9
H13 13 471 186.5 568 12.2
H16 16 527 196.3 618 11.9
Stirrups R6 6 264 217.9 351 7.9
R8 8 353 209.6 460 14.9 *: Fracture strain refers to the average strain over a gauge length of 300 mm when steel reinforcement ruptures.
Table 3.3: Compressive strength of concrete
Concrete Compressive strength (MPa) Secant modulus (GPa)
Precast beam unit 27.9 24.7
Concrete topping and beam-column joint
MJ-B-0.52/0.35S 35.8 27.8
MJ-L-0.52/0.35S
MJ-B-0.88/0.59R
20.3 20.5 MJ-L-0.88/0.59R
MJ-B-1.19/0.59R
MJ-L-1.19/0.59R

CHAPTER 3 TESTS OF PRECAST CONCRETE SUB-ASSEMBLAGES
52
0.00 0.03 0.06 0.09 0.12 0.150
160
320
480
640
800St
ress
(MPa
)
Strain
H10 H13 H16
(a) Reinforcement
0.000 0.002 0.004 0.006 0.008 0.010 0.0120
8
16
24
32
40
Stre
ss (M
Pa)
Strain
Precast beam Concrete topping
(b) Concrete
Fig. 3.7: Stress-strain curves of reinforcement and concrete
3.4 Experimental Results of Sub-Assemblages
In the experimental tests, the resistance and deformation capacity of precast concrete
beam-column sub-assemblages were obtained under middle column removal
scenarios. In addition, crack patterns of the bridging beams and failure modes of the
beam-column sub-assemblages were observed. Strains of beam longitudina l
reinforcement were also measured by means of strain gauges to shed light on the
behaviour of sub-assemblages subjected to progressive collapse.
3.4.1 Load-displacement history of beam-column sub-assemblages
0 100 200 300 400 500 600 7000
20
40
60
80
100
Verti
cal l
oad
(kN)
Middle joint displacement (mm)
MJ-B-0.52/0.35S MJ-B-0.88/0.59R MJ-B-1.19/0.59R
Catenary action
CAA
Fracture of beam bottomreinforcement at middle joint facesX
XX
(a) 90o bend of bottom bars
0 100 200 300 400 500 600 7000
20
40
60
80
100
XVerti
cal l
oad
(kN)
Middle joint displacement (mm)
MJ-L-0.52/0.35S MJ-L-0.88/0.59R MJ-L-1.19/0.59R
X Fracture of beam bottom bars at middle joint faces
Catenary actionCAA
(b) Lap-splice of bottom bars
Fig. 3.8: Vertical load-middle joint displacement curves of beam-column sub-assemblages

CHAPTER 3 TESTS OF PRECAST CONCRETE SUB-ASSEMBLAGES
53
0 100 200 300 400 500 600 700
-300
-200
-100
0
100
200
300
Horiz
ontal
reac
tion f
orce
(kN)
Middle joint displacement (mm)
MJ-B-0.52/0.35S MJ-B-0.88/0.59R MJ-B-1.19/0.59R
Catenary action
CAA
(a) 90o bend of bottom bars
0 100 200 300 400 500 600 700
-300
-200
-100
0
100
200
300
Horiz
onta
l rea
ctio
n fo
rce (
kN)
Middle joint displacement (mm)
MJ-L-0.52/0.35S MJ-L-0.88/0.59R MJ-L-1.19/0.59R
Catenary action
CAA
(b) Lap-splice of bottom bars
Fig. 3.9: Horizontal reaction-middle joint displacement curves of beam-column sub-assemblages
Fig. 3.8 and Fig. 3.9 show the vertical load and horizontal reaction force of beam-
column sub-assemblages versus the middle joint displacement. Two mechanisms,
namely, CAA and catenary action, were sequentially developed in the beam-column
sub-assemblages. CAA is termed as the force-transfer mechanism in which
significant axial compression force develops in the bridging beam, whereas catenary
action represents the stage when axial tension force is initiated in the beam (Su et al.
2009; Yu and Tan 2010a). At CAA stage, horizontal compression force increased
with vertical load, but vertical load attained its peak value earlier than the maximum
horizontal compression. Due to crushing of concrete in the compression zone at the
top beam surface next to the middle joint and the bottom beam surface near the end
column stub, both vertical load and horizontal compression force started decreasing
with increasing middle joint displacement. In the descending branch, a sudden drop
of vertical load marked by crosses as shown in Figs. 3.8(a and b) resulted from
fracture of bottom reinforcing bars at the middle joint interfaces. However, the
fracture of bottom bars imposed a minor effect on the horizontal compression force.
When the displacement was larger than one beam depth of 300 mm, catenary action
kicked in and the applied load was sustained by the tensile strength of the beam until
final failure occurred. Significant catenary action developed in beam-column sub-
assemblages except MJ-B-0.52/0.35S, as shown in Fig. 3.8(a). The catenary action
capacity surpassed the value of CAA, and therefore catenary action was effective to
mitigate progressive collapse under column removal scenarios. It should be noted that

CHAPTER 3 TESTS OF PRECAST CONCRETE SUB-ASSEMBLAGES
54
sub-assemblage MJ-B-1.19/0.59R sustained much smaller maximum vertical load
and horizontal tension force at catenary action stage in comparison with MJ-L-
1.19/0.59R, as shown in Fig. 3.8(a) and Fig. 3.9(a), due to accidental breakdown of
the controlling system. Its catenary action capacity was not attained at that moment.
3.4.2 Resistances of beam-column sub-assemblages
The resistance of beam-column sub-assemblages under column removal scenarios is
characterised by the CAA and catenary action capacities. Table 3.4 lists the load
capacities and maximum horizontal compression and tension forces at different
loading stages. It is assumed that all the bottom bars in the middle joint are able to
develop their yield strength under flexural action, and the flexural capacity of sub-
assemblages is calculated based on the plastic hinge mechanism. Accordingly, the
enhancement factors of CAA and catenary action to flexural action are calculated, as
shown in Table 3.4.
Table 3.4: Test results of beam-column sub-assemblages
Specimen Flexural capacity
fP (kN)
CAA capacity
cP (kN)
Peak horizontal
compression (kN)
c fP P
Catenary action
capacity tP (kN)
Peak tension
(kN) t fP P
MJ-B-0.52/0.35S 33.89 50.52 -231.26 1.49 26.05 16.22 0.77
MJ-L-0.52/0.35S 31.23 41.36 -186.10 1.32 49.50 127.74 1.59
MJ-B-0.88/0.59R 55.00 63.28 -282.40 1.15 98.55 229.85 1.79
MJ-L-0.88/0.59R 51.29 53.85 -242.00 1.05 77.24 182.05 1.51
MJ-B-1.19/0.59R 67.62 65.23 -287.25 0.96 -- -- --
MJ-L-1.19/0.59R 61.71 57.37 -290.30 0.93 86.60 227.10 1.40
3.4.2.1 Effect of reinforcement detailing
Although the same reinforcement ratio was used in MJ-B-0.52/0.35S and MJ-L-
0.52/0.35S, significantly different CAA and catenary action capacities were obtained
for those two specimens, as shown in Table 3.4. The CAA capacity of MJ-B-
0.52/0.35S was 50.5 kN, 22.1% greater than that of MJ-L-0.52/0.35S. Sub-
assemblage MJ-B-0.52/0.35S was able to develop 24.3% larger horizonta l

CHAPTER 3 TESTS OF PRECAST CONCRETE SUB-ASSEMBLAGES
55
compression force than MJ-L-0.52/0.35S at CAA stage. Similar results were obtained
for the other four sub-assemblages. MJ-B-0.88/0.59R developed 17.5% larger CAA
capacity and 16.7% greater horizontal compression force than MJ-L-0.88/0.59R. A
comparison between MJ-B-1.19/0.59R and MJ-L-1.19/0.59R indicates that MJ-B-
1.19/0.59R sustained 9.6% greater CAA capacity than MJ-L-1.19/0.59R, but its
maximum horizontal compression force was slightly lower than MJ-L-1.19/0.59R.
These differences between the CAA capacities were mainly due to reinforcement
detailing of beam bottom longitudinal bars in the joint. In comparison with lap-
spliced reinforcement, 90o bend of bottom longitudinal reinforcement in the joint
provided a larger distance between the compression and tension reinforcement at the
middle joint and end column stub faces. Thus, sub-assemblages with 90o bend of
bottom bars developed larger moment capacities at the beam end sections than those
with lap-spliced bottom reinforcement. Correspondingly, greater CAA capacity and
horizontal compression force were attained in sub-assemblages with 90o bend of
bottom bars.
At catenary action stage, MJ-L-0.52/0.35S developed 90.0% greater catenary action
capacity than MJ-B-0.52/0.35S, indicating the beneficial effect of lap-spliced bottom
reinforcement on development of catenary action. Nonetheless, in MJ-L-0.88/0.59R,
pull-out failure of bottom beam reinforcement near the end column stub hindered the
development of tension force in the beam, as shown in Fig. 3.9(b). Hence, its catenary
action capacity was 21.6% lower than that of MJ-B-0.88/0.59R. Therefore, due to
different failure modes of sub-assemblages, no apparent effect of reinforcement
detailing was observed on the catenary action capacity.
Reinforcement detailing in the beam-column joint also affected the enhancement
factor of CAA to flexural action. Table 3.4 indicates that development of CAA
enhanced the flexural capacities of sub-assemblages with 90o bend of bottom
longitudinal reinforcement in the joint more than those with lap-spliced bottom bars,
due to a larger distance between the compression and tension reinforcement at the
joint interface.

CHAPTER 3 TESTS OF PRECAST CONCRETE SUB-ASSEMBLAGES
56
3.4.2.2 Effect of reinforcement ratio
By increasing the top and bottom reinforcement ratios in MJ-B-0.88/0.59R and MJ-
L-0.88/0.59R, the sagging and hogging moments of beam end sections were
substantially increased compared to sub-assemblages MJ-B-0.52/0.35S and MJ-L-
0.52/0.35S. Therefore, both the CAA capacity and horizontal compression force were
increased in sub-assemblages MJ-B-0.88/0.59R and MJ-L-0.88/0.59R, as shown in
Fig. 3.8 and Fig. 3.9. It should be noted that the compressive strength of cast-in-situ
concrete topping in MJ-B-0.88/0.59R and MJ-L-0.88/0.59R was lower than that in
MJ-B-0.52/0.35S and MJ-L-0.52/0.35S. If concrete topping with the same
compressive strength as that in MJ-B-0.52/0.35S and MJ-L-0.52/0.35S were used in
MJ-B-0.88/0.59R and MJ-L-0.88/0.59R, the CAA capacities would have been even
greater than those obtained in the tests. A further increase in the beam top
reinforcement ratio in MJ-B-1.19/0.59R and MJ-L-1.19/0.59R did not significant ly
increase the CAA capacities as a result of severe shear cracking across the horizonta l
interface. Although the CAA capacity of beam-column sub-assemblages was
increased with increasing reinforcement ratios, as shown in Figs. 3.8(a and b), the
enhancement factor of CAA relative to flexural action was reduced, as listed in Table
3.4, since the flexural capacity of sub-assemblages was also substantially increased.
Thus, the enhancement of CAA to flexural action was more effective when the beam
longitudinal reinforcement ratio was relatively low.
Compared with MJ-B-0.52/0.35S and MJ-L-0.52/0.35S, catenary action capacities of
MJ-B-0.88/0.59R and MJ-L-0.88/0.59R were increased with greater top and bottom
reinforcement ratios in the beam, as shown in Figs. 3.8(a and b). The increase in the
catenary action capacities mainly came from the increased top reinforcement ratio in
the bridging beam, as bottom longitudinal reinforcement in the middle joint had been
pulled out prior to initiation of catenary action. Only the top reinforcement ratio in
the beam of MJ-L-1.19/0.59R was increased in comparison with MJ-L-0.88/0.59R.
Correspondingly, the catenary action capacity of MJ-L-1.19/0.59R was increased by
12% and the horizontal tension force was increased by 25%, as shown in Fig. 3.9(b).
It indicates that a greater top reinforcement ratio favoured the development of
catenary action in beam-column sub-assemblages.

CHAPTER 3 TESTS OF PRECAST CONCRETE SUB-ASSEMBLAGES
57
3.4.3 Components of vertical load
Fig. 3.10: Free body diagram of the single-span beam
Under column removal scenarios, axial force develops in the bridging beam with
horizontal restraints. Therefore, total vertical load on the middle joint can be
decomposed into two components, viz. contributions of bending moments at the beam
ends and axial force in the beam. Based on the deformation configuration and the
force equilibrium of the single-span beam, as shown in Fig. 3.10, the components are
calculated from Eq. (3-1), in which the first term represents the contribution of
bending moments to the vertical load and the second term denotes the contribution of
axial force in the beam.
1 2 1 2
2M M N M MP N
l l lδ δ+ + +
= = + (3-1)
where P is the vertical load applied on the middle joint; and 2M are the bending
moments at the interface of the end column stub and middle joint, respectively; N is
the axial force in the beam, equal to the horizontal reaction force; δ is the middle
joint displacement; and l is the length of the single-span beam.
0 50 100 150 200 250 300 350 400 450
-40
-20
0
20
40
60
80
Com
pone
nts o
f ver
tical
load
(kN
)
Middle joint displacement (mm)
Contribution of axial force Contribution of bending moments
(a) MJ-B-0.52/0.35S
0 100 200 300 400 500 600 700
-40
-20
0
20
40
60
80
Com
pone
nts o
f ver
tical
load
(kN)
Middle joint displacement (mm)
Contribution of axial force Contribution of bending moments
(b) MJ-L-0.52/0.35S
1
2
δ
M1
M2
N
N
P/2
l

CHAPTER 3 TESTS OF PRECAST CONCRETE SUB-ASSEMBLAGES
58
0 100 200 300 400 500 600 700 800
-50
-25
0
25
50
75
100
125
150Co
mpo
nent
s of v
ertic
al lo
ad (k
N)
Middle joint displacement (mm)
Contribution of axial force Contribution of bending moments
(c) MJ-B-0.88/0.59R
0 100 200 300 400 500 600 700
-50
-25
0
25
50
75
100
125
150
Com
pone
nts o
f ver
tical
load
(kN)
Middle joint displacement (mm)
Contribution of axial force Contribution of bending moments
(d) MJ-L-0.88/0.59R
0 100 200 300 400 500
-50
-25
0
25
50
75
100
125
150
Com
pone
nts o
f ver
tical
load
(kN)
Middle joint displacement (mm)
Contribution of axial force Contribution of bending moments
(e) MJ-B-1.19/0.59R
0 100 200 300 400 500 600
-50
-25
0
25
50
75
100
125
150
Com
pone
nts o
f ver
tical
load
(kN)
Middle joint displacement (mm)
Contribution of axial force Contribution of bending moments
(f) MJ-L-1.19/0.59R
Fig. 3.11: Contributions of axial force and bending moments to vertical load of sub-assemblages
Fig. 3.11 shows the contributions of bending moments and axial force in the beam to
the total vertical load. At CAA stage, vertical load was mainly contributed by moment
resistances of the beam, whereas horizontal compression force contributed a negative
portion to the vertical load, as shown in Figs. 3.11(a-f). However, moment resistances
of the beam were increased by axial compression force in the beam according to axial
force-bending moment interaction diagram. Bending moments in the beam with 90o
bend of beam bottom reinforcement provided more contributions to the vertical load
than that with lap-spliced reinforcement in the joint, as included in Table 3.5, due to
a relatively larger distance between the compression and tension reinforcement.
Nevertheless, after the commencement of catenary action, horizontal tension force
took up a major portion of the vertical load, whereas bending moment made limited
contribution to the vertical load at the ultimate stage. Special attention has to be paid
to sub-assemblage MJ-L-0.88/0.59R, in which the horizontal tension force decreased

CHAPTER 3 TESTS OF PRECAST CONCRETE SUB-ASSEMBLAGES
59
(see Fig. 3.9(b)) due to pull-out failure of beam bottom reinforcement near the end
column stub prior to failure. However, the contribution of axial tension force in the
beam could still increase with increasing middle joint displacement, as shown in Fig.
3.11(d), as a result of a greater deformation capacity.
Table 3.5: Components of vertical load sustained by sub-assemblages
Specimen
Components at CAA stage Components at catenary action stage
Min. contribution of
Axial force (kN)
Max. contribution of bending
moment (kN)
Max. contribution of
Axial force (kN)
Min. contribution of
bending moment (kN)
MJ-B-0.52/0.35S -32.16 66.49 4.86 18.57
MJ-L-0.52/0.35S -27.08 51.85 58.52 9.56
MJ-B-0.88/0.59R -36.71 85.67 121.77 -24.16
MJ-L-0.88/0.59R -33.38 78.91 84.34 -10.19
MJ-B-1.19/0.59R -31.24 91.00 -- --
MJ-L-1.19/0.59R -36.06 80.54 86.58 -4.50
3.4.4 Rotational capacities of beam-column sub-assemblages
Fig. 3.12 shows the overall deformed profiles of sub-assemblages MJ-B-0.88/0.59R
and MJ-L-0.88/0.59R at different stages, measured by a series of LVDTs along the
beam length (see Fig. 3.5). It is apparent that when the catenary action capacity was
attained, rotation of the middle joint was substantially larger than that of plastic
hinges at the end column stubs, due to significant flexural deformations of the beam
at catenary action stage. To evaluate the deformation capacity of sub-assemblages,
rotation of sub-assemblages is calculated as a ratio of the middle joint displacement
to the clear span 2.75 m of the beam when sub-assemblages attained their catenary
action capacities. Rotation of plastic hinges near the end column stub was measured
by the LVDTs mounted at the beam ends. Table 3.6 lists the rotations of the beam-
column sub-assemblages and the plastic hinges at the end column stub.

CHAPTER 3 TESTS OF PRECAST CONCRETE SUB-ASSEMBLAGES
60
-3000 -2000 -1000 0 1000 2000 3000
-700
-600
-500
-400
-300
-200
-100
0
Verti
cal d
isplac
emen
t (m
m)
Monitor point position (mm)
CAA capacityPeak horizontal compressionOnset of catenary actioncatenary action capacity
End to A-frame Middle column End to reaction wall
(a) MJ-B-0.88/0.59R
-3000 -2000 -1000 0 1000 2000 3000
-700
-600
-500
-400
-300
-200
-100
0
Verti
cal d
isplac
emen
t (m
m)
Monitor point position (mm)
CAA capacityPeak horizontal compressionOnset of catenary actioncatenary action capacity
End to A-frame Middle column End to reaction wall
(b) MJ-L-0.88/0.59R
Fig. 3.12: Deformed profiles of beam-column sub-assemblages
Table 3.6: Rotations of plastic hinges and beam-column sub-assemblages
Specimen
At the CAA capacity At the catenary action capacity Plastic hinge
rotation (o)
Rotation of sub-assemblage (o)
Plastic hinge
rotation (o)
Rotation of sub-assemblage (o)
Rotation of partial hinge (o)
MJ-B-0.52/0.35S 0.9 1.6 7.7 8.4 0.5
MJ-L-0.52/0.35S 0.5 1.5 6.9 13.2 5.7
MJ-B-0.88/0.59R 0.5 2.1 9.5 15.2 5.6
MJ-L-0.88/0.59R 0.7 2.1 8.2 14.0 8.0
MJ-B-1.19/0.59R 0.6 2.3 -- -- --
MJ-L-1.19/0.59R 0.7 2.1 8.4 10.8 1.5

CHAPTER 3 TESTS OF PRECAST CONCRETE SUB-ASSEMBLAGES
61
Table 3.6 indicates that under column removal scenarios precast concrete beam-
column sub-assemblages were able to develop comparable rotations to reinforced
concrete sub-assemblages (Yu and Tan 2013c). The calculated rotation of sub-
assemblages MJ-L-0.52/0.35S, MJ-B-0.88/0.59R and MJ-L-0.88/0.59R was
significantly larger than the plastic hinge rotation at catenary action stage. The
difference between the plastic hinge rotation and rotation of sub-assemblages was
mainly attributable to the formation of a partial hinge in the vicinity of the curtailment
point of beam top bars, as shown in Fig. 3.13. In accordance with the LVDT
measurements along the beam length, the partial hinge rotation is approximate ly
quantified as the difference between rotational angles of beam segments CD and BC
(see Fig. 3.5), as expressed in Eq. (3-2). Fig. 3.14 shows the calculated rotations of
partial hinges in MJ-L-0.52/0.35S, MJ-B-0.88/0.59R and MJ-L-0.88/0.59R. It is
observed that the rotation angle increased rapidly after the onset of catenary action,
indicating the localisation of beam rotation at the partial hinge. Simultaneously, the
rotation of plastic hinges near the end column stub levelled off, as shown in Figs.
3.15(a and b). Eventually, the rotation of plastic hinges increased once again and led
to failure of sub-assemblages. For sub-assemblage MJ-B-0.88/0.59R, the maximum
rotation angle of partial hinge was 5.6o, as listed in Table 3.6. Similar results were
obtained for MJ-L-0.52/0.35S and MJ-L-0.88/0.59R. Thus, the partial hinge rotation
significantly increased the deformation capacity of beam-column sub-assemblages
under column removal scenarios.
3 2 2 1LB LB LB LBPH
CD BCl lδ δ δ δθ − − − −− −
= − (3-2)
where PHθ is the rotation angle of the partial hinge at the curtailment point of beam
top reinforcement; 1LBδ − , 2LBδ − and 3LBδ − are the readings of LVDTs LB-1, LB-2 and
LB-3, respectively, as shown in Fig. 3.5; and BCl and CDl are the distances between
sections B and C, and sections C and D, i.e. 450 mm and 625 mm, respectively.

CHAPTER 3 TESTS OF PRECAST CONCRETE SUB-ASSEMBLAGES
62
(a) MJ-L-0.52/0.35S
(b) MJ-B-0.88/0.59R
(c) MJ-L-0.88/0.59R
Fig. 3.13: Partial hinge at the curtailment point of top bars
0 100 200 300 400 500 600 7000.0
1.5
3.0
4.5
6.0
7.5
9.0
Parti
al h
inge
rota
tion
(o )
Middle joint displacement (mm)
MJ-L-0.52/0.35S MJ-B-0.88/0.59R MJ-L-0.88/0.59R
Fig. 3.14: Rotations of partial hinges at the curtailment point
Partial hinge
Partial hinge
Partial hinge

CHAPTER 3 TESTS OF PRECAST CONCRETE SUB-ASSEMBLAGES
63
0 100 200 300 400 500 600 700 8000
3
6
9
12
15
Plas
tic h
inge
rota
tion
(o )
Middle joint displacement (mm)
MJ-B-0.52/0.35S MJ-B-0.88/0.59R
(a) 90o bend of bottom bars
0 100 200 300 400 500 600 7000
2
4
6
8
10
Plas
tic h
inge
rota
tion
(o )
Middle joint displacement (mm)
MJ-L-0.52/0.35S MJ-L-0.88/0.59R MJ-L-1.19/0.59R
(b) Lap-splice of bottom bars
Fig. 3.15: Rotations of plastic hinges at the end column stub of sub-assemblages
3.4.5 Crack patterns and failure modes of precast beams
(a) MJ-B-0.88/0.59R
(b) MJ-L-0.88/0.59R
Fig. 3.16: Crack patterns of beam-column sub-assemblages
Fig. 3.16 shows the crack patterns of beam-column sub-assemblages MJ-B-
0.88/0.59R and MJ-L-0.88/0.59R when their catenary action capacities were attained.
Severe cracking was observed along the beam length. In the vicinity of the middle
joint, axial tension force in the beam generated more full-depth tension cracks.
Diagonal cracks were formed near the end column stub, due to the combined effect
of axial tension and shear forces in the beam.
End column stub
Middle joint
Middle joint
End column stub
End column stub
End column stub

CHAPTER 3 TESTS OF PRECAST CONCRETE SUB-ASSEMBLAGES
64
Table 3.7: Failure modes of beam-column sub-assemblages
Specimen In the middle joint At the end column stub
MJ-B-0.52/0.35S Fracture of bottom bars Fracture of top bars
MJ-L-0.52/0.35S Fracture of one bottom bar, pull-out of the other bar Fracture of top bars
MJ-B-0.88/0.59R Pull-out of bottom bars Fracture of top bars
MJ-L-0.88/0.59R Pull-out of bottom bars Pull-out of bottom bars
MJ-L-1.19/0.59R Pull-out of bottom bars Fracture of top bars, pull-out of bottom bars
Table 3.7 summarises the failure modes of beam-column sub-assemblages at the
middle joint and end column stub. Sub-assemblage MJ-B-0.52/0.35S exhibited
fracture of bottom longitudinal reinforcement at the middle joint face, as shown in
Fig. 3.17(a). However, in MJ-B-0.88/0.59R, pull-out failure of beam bottom
reinforcement was observed at the interface of the middle joint, as shown in Fig.
3.17(b), due to inadequate embedment length of reinforcement. Similar pull-out
failure of beam bottom reinforcement was also observed in the middle joint of MJ-L-
0.88/0.59R, MJ-B-1.19/0.59R and MJ-L-1.19/0.59R, as shown in Figs. 3.17(c-e).
Final failure of beam-column sub-assemblages was caused by fracture of beam top
longitudinal reinforcement near the end column stub (see Figs. 3.18(a-c)).
Development of tension force in the beam also resulted in pull-out failure of beam
bottom longitudinal reinforcement near the end column stub of MJ-L-0.88/0.59R and
MJ-L-1.19/0.59R, as shown in Figs. 3.18(d and f). It is notable that final failure of
MJ-B-1.19/0.59R did not occur when the test stopped. Only the crack pattern in the
plastic hinge region is shown in Fig. 3.18(e).
(a) MJ-B-0.52/0.35S
(b) MJ-B-0.88/0.59R
Rupture of bottom bars (bottom view)
Middle joint
Pull-out failure of bottom rebars
Middle joint
Crushing of concrete

CHAPTER 3 TESTS OF PRECAST CONCRETE SUB-ASSEMBLAGES
65
(c) MJ-L-0.88/0.59R
(d) MJ-B-1.19/0.59R
(e) MJ-L-1.19/0.59R
Fig. 3.17: Failure modes of sub-assemblages at the middle joint
(a) MJ-B-0.52/0.35S
(b) MJ-L-0.52/0.35S
(c) MJ-B-0.88/0.59R
(d) MJ-L-0.88/0.59R
Middle joint
Pull-out failure of bottom bars
Middle joint
Crushing of concrete
Pull-out failure of bottom bars
Pull-out failure of bottom bars
Middle joint
Fracture of top reinforcement
Pull-out failure Crushing of concrete
Concrete crushing
Fracture of top reinforcement

CHAPTER 3 TESTS OF PRECAST CONCRETE SUB-ASSEMBLAGES
66
(e) MJ-B-1.19/0.59R
(f) MJ-L-1.19/0.59R
Fig. 3.18: Failure modes of beam-column sub-assemblages at the end column stub
3.4.6 Horizontal shear transfer between precast beam units and cast-in-
situ concrete topping
(a) MJ-B-0.52/0.35S
(b) MJ-L-0.52/0.35S
(c) MJ-B-1.19/0.59R
(d) MJ-L-1.19/0.59R
Fig. 3.19: Horizontal cracking across the concrete interface
Depending on the surface preparation of precast beam units, different horizonta l
interface behaviour was observed between the precast beam units and cast-in-situ
concrete topping, as shown in Fig. 3.19. In MJ-B-0.52/0.35S and MJ-L-0.52/0.35S,
a smooth horizontal interface was prepared between precast beam units and concrete
topping, and horizontal shear strength was designed in accordance with Eurocode 2
(BSI 2004). Under column removal scenarios, severe horizontal cracking was
observed across the concrete interface at CAA stage, as illustrated in Figs. 3.19(a
Fracture of rebars
Pull-out failure Crushing of concrete
Interface cracking Interface cracking
Interface cracking Interface cracking

CHAPTER 3 TESTS OF PRECAST CONCRETE SUB-ASSEMBLAGES
67
and b). These cracks were mainly initiated in the region between the cut-off point of
top bars and the end column stub. The horizontal interface cracks resulted from axial
compression force in the beam at CAA stage. The compression force increased
sagging moment at the middle joint face and hogging moment at the end column stub
face. Shear force in the beam was increased as well, which induced interface cracking
between the precast beam units and cast-in-situ structural topping.
Compared to MJ-B-0.52/0.35S and MJ-L-0.52/0.35S, shear force acting on the
horizontal interface of MJ-B-0.88/0.59R and MJ-L-0.88/0.59R was increased due to
high moment resistance at the beam ends. However, by intentionally roughening the
concrete interface to around 3 mm roughness according to BS EN 1992-1-1:2004
(BSI 2004), only limited interface cracks developed in the plastic hinge region near
the end column stub. It indicates that a roughened interface was more effective in
preventing horizontal cracking in comparison with a smooth interface.
In MJ-B-1.19/0.59R and MJ-L-1.19/0.59R, the same rough surface preparation and
stirrups were utilised for the precast beam units, but the beam top reinforcement ratio
was increased to 1.19% compared with MJ-B-0.88/0.59R and MJ-L-0.88/0.59R.
Severe interface cracking was observed across the horizontal interface, as shown in
Figs. 3.19(c and d). Horizontal cracking weakened the composite action between
precast beam units and structural topping, thereby reducing the CAA capacity of
beam-column sub-assemblage. For instance, the beam top reinforcement ratio in MJ-
B-1.19/0.59R and MJ-L-1.19/0.59R was increased by 0.31% in comparison with MJ-
B-0.88/0.59R and MJ-L-0.88/0.59R. However, its CAA capacity was only increased
by 2.0 kN and 3.5 kN, respectively, as listed in Table 3.4. Therefore, effective
horizontal shear transfer between the precast beam units and cast-in-situ concrete
topping played a crucial role in the resistance of beam-column sub-assemblages at
CAA stage.

CHAPTER 3 TESTS OF PRECAST CONCRETE SUB-ASSEMBLAGES
68
3.4.7 Strains of beam longitudinal reinforcement
0 100 200 300 400 500 600 700 800
-10000
0
10000
20000
30000
40000
Stee
l stra
in (µ
ε)
Middle joint displacement (mm)
MT-1 MT-3 MB-1 MB-2
(a) At the face of middle joint
0 100 200 300 400 500 600 700
-2000
-1000
0
1000
2000
3000
4000
5000
Stee
l stra
in (µ
ε)
Middle joint displacement (mm)
ET-1 ET-2 ET-3 EB-1 EB-2
(b) At the face of end column stub
Fig. 3.20: Strains of beam longitudinal reinforcement in MJ-B-0.88/0.59R
To investigate the behaviour of bridging beams at different loading stages, strain
gauges were mounted on the longitudinal reinforcement in the beams, as shown in
Fig. 3.6. The failure mode of MJ-B-0.88/0.59R can also be demonstrated by the
measured steel strains of the top and bottom longitudinal reinforcement at the middle
joint and end column stub faces, as shown in Fig. 3.20. At the middle joint face,
strains of bottom longitudinal reinforcement started decreasing gradually after
attaining the maximum value at CAA stage, as shown in Fig. 3.20(a), indicating pull-
out failure of reinforcing bars. However, at the end column stub face, tensile strains
of top longitudinal reinforcement kept increasing until the rebars ruptured at catenary
action stage, as shown in Fig. 3.20(b). Top longitudinal bars near the middle joint
and bottom bars near the end column stub experienced compression at CAA stage,
and then were transformed to tension due to subsequent development of catenary
action, as shown in Figs. 3.20(a and b). The measured steel strains agree well with
the crack pattern and failure mode of MJ-B-0.88/0.59R (see Fig. 3.17(b) and Fig.
3.18(c)).

CHAPTER 3 TESTS OF PRECAST CONCRETE SUB-ASSEMBLAGES
69
0 100 200 300 400 500 600 700 8000
500
1000
1500
2000
Stee
l stra
in (µ
ε)
Middle joint displacement (mm)
BP-1 BP-2
(a) At the section 300 mm away from the
middle joint face
0 100 200 300 400 5000
1000
2000
3000
4000
5000
Stee
l stra
in (µ
ε)
Middle joint displacement (mm)
TP-1 TP-2 TP-3
(b) At the section 300 mm away from the
end column stub face
0 100 200 300 400 500 600 700 800-2000
-1000
0
1000
2000
3000
4000
Stee
l stra
in (µ
ε)
Middle joint displacement (mm)
TC-1 TC-2 TB-1 TB-2
(c) At the curtailment point of top bars
Fig. 3.21: Strains of beam longitudinal reinforcement in the beam of sub-assemblage MJ-B-0.88/0.59R
At the beam section 300 mm away from the middle joint face, strains of bottom
longitudinal reinforcement in the beam increased to their peak values at CAA stage,
and then decreased as a result of pull-out failure of beam bottom reinforcement
passing through the middle joint, as shown in Fig. 3.21(a). Following the onset of
catenary action, steel strains at the section increased once again due to development
of axial tension force in the beam. At the section 300 mm away from the end column
stub face, steel strains experienced a plateau stage, with values less than the yield
strain of steel reinforcement, and then increased at catenary action stage, as shown in
Fig. 3.21(b). It indicates that the length of plastic hinge near the end column stub was
shorter than one beam depth (300 mm) at CAA stage. When catenary action kicked
in, a partial hinge was formed at the curtailment point of beam top longitudina l
reinforcement (see Fig. 3.13(b)). Accordingly, the top reinforcement at the section

CHAPTER 3 TESTS OF PRECAST CONCRETE SUB-ASSEMBLAGES
70
attained its yield strain, whereas the bottom reinforcement was still in compression,
as shown in Fig. 3.21(c). Eventually, bottom reinforcement at the curtailment point
of top reinforcement was transformed from compression to tension due to the
presence of axial tension force in the beam.
0 100 200 300 400 500 600
-1000
0
1000
2000
3000
4000
Stee
l stra
in (µ
ε)
Middle joint displacement (mm)
MT-1 MT-2 MT-3 MB-1 MB-2
(a) MJ-L-0.52/0.35S
0 50 100 150 200 250 300 350 400 450
-9000
-6000
-3000
0
3000
6000
9000
Stee
l stra
in (µ
ε)Middle joint displacement (mm)
MT-1 MT-2 MT-3 MB-1 MB-2
(b) MJ-B-0.52/0.35S
Fig. 3.22: Strains of beam longitudinal reinforcement at the middle joint
Fig. 3.22(a) shows the variations of strains of beam longitudinal reinforcement in the
middle joint of MJ-L-0.52/0.35S. Similar to MJ-B-0.88/0.59R, strains MB-1 and
MB-2 decreased due to pull-out failure of beam bottom reinforcement in the middle
joint. Rupture of one bottom bar in the middle joint led to a sudden reduction of
tensile strains of bottom reinforcing bars. Following the rupture of bottom
reinforcement, strains of bottom bars could increase with increasing middle joint
displacement, as bottom reinforcement at the opposite middle joint face was
mobilised by the rotational restraint in the middle joint to resist tension force.
Nevertheless, MJ-B-0.52/0.35S exhibited rupture of all bottom bars in the middle
joint, as shown in Fig. 3.17(a). Thus, bottom reinforcement at the middle joint
interface kept increasing until rupture of reinforcement occurred (see Fig. 3.22(b)).
3.5 Discussions and Suggestions
In accordance with UFC 4-023-03 (DOD 2013), the plastic rotation angle for beam-
column sub-assemblage MJ-B-0.52/0.35S is determined as 1.7o (0.029 radian),
whereas the angle for the other five beam-column sub-assemblages is reduced to 0.6o
(0.01 radian) due to pull-out failure of beam bottom bars in the middle joint. The
acceptance criteria are reasonable if only CAA is taken into account in analysis.

CHAPTER 3 TESTS OF PRECAST CONCRETE SUB-ASSEMBLAGES
71
However, when catenary action in the beam-column sub-assemblages is considered,
the criteria are too conservative in comparison with the calculated sub-assemblage
rotations, as listed in Table 3.6. Moreover, pull-out failure of bottom reinforcement
in the joint did not significantly reduce the rotation capacity of beam-column sub-
assemblages, as long as continuous longitudinal reinforcement was placed in the
structural topping and properly embedded in the beam-column joint with adequate
anchorage length. Therefore, it is suggested that the acceptance criteria be increased
to 11.5o (0.2 radian) to account for catenary action at large deformations, which is
consistent with the required rotation for development of tie force in the bridging beam
(DOD 2013). It is noteworthy that the revised acceptance criteria are only suitable for
fairly rigid boundary conditions. As for inadequate horizontal restraints, more
experimental tests are needed to investigate the deformation capacity of beam-
column sub-assemblages.
In the design of precast concrete structures against progressive collapse, pull-out
failure of embedded reinforcement in the beam-column joint has to be prevented to
ensure a more robust structure. Thus, the embedment length of steel reinforcement is
suggested to be increased. It may lead to an increase in the cross section of middle
columns to accommodate longer embedment length of bottom reinforcement with
hooked anchorage, which in turn elevate the difficulties in construction of middle
joints; however, only the length of precast trough needs to be adjusted for lap-spliced
reinforcement in the middle joint. Besides, in determining the horizontal shear stress
across the concrete interface, it is suggested an amplification factor be incorporated
to consider the effect of axial compression force in the beam on horizontal shear stress.
More stringent requirements on interface treatment have to be employed to ensure
full composite action between precast beam units and cast-in-situ concrete topping.
3.6 Conclusions
In this chapter, six experiments were conducted to investigate the behaviour of
precast concrete beam-column sub-assemblages under middle column removal
scenarios. Two types of middle joint detailing, namely, 90o bend and lap-splice of
bottom reinforcement, were studied under quasi-static loading conditions. The
following conclusions can be made:

CHAPTER 3 TESTS OF PRECAST CONCRETE SUB-ASSEMBLAGES
72
(1) With continuous top reinforcement in the structural topping, CAA and catenary
action could be developed in sub-assemblages with 90o bend and lap-splice of bottom
longitudinal reinforcement in the joint. A typical failure mode in the middle joint of
sub-assemblages was pull-out failure of bottom longitudinal reinforcement, except
MJ-B-0.52/0.35S which exhibited fracture of bottom bars. Near the end column stub,
fracture of beam top longitudinal reinforcement represented the most common failure
mode. However, in MJ-L-0.88/0.59R and MJ-L-1.19/0.59R, bottom beam bars
exhibited pull-out failure.
(2) Greater top and bottom reinforcement ratios in MJ-B-0.88/0.59R and MJ-L-
0.88/0.59R enhanced CAA and catenary action compared with MJ-B-0.52/0.35S and
MJ-L-0.52/0.35S. A further increase in top reinforcement ratio of MJ-B-1.19/0.59R
and MJ-L-1.19/0.59R did not impose a considerable beneficial effect on the CAA
capacity in comparison with MJ-B-0.88/0.59R and MJ-L-0.88/0.59R, possibly due to
severe shear cracking across the horizontal interface between precast beam units and
cast-in-situ concrete topping.
(3) Horizontal cracking was observed between the curtailment point of top bars and
the end column stub in MJ-B-0.52/0.35S, MJ-L-0.52/0.35S, MJ-B-1.19/0.59R and
MJ-L-1.19/0.59R. At CAA stage, development of compression force in the beam
increased the horizontal shear stress at the concrete interface. Therefore, more
stringent interface preparation has to be implemented to achieve full composite action
between precast beam units and cast-in-situ concrete topping.
(4) Except MJ-B-0.52/0.35S, precast concrete beam-column sub-assemblages were
able to develop much greater rotations compared to the requirements in UFC 4-023-
03 if catenary action in the beam was considered. Thus, it is suggested that the
acceptance criteria be revised in accordance with experimental results.
The experimental results represent the resistance of precast beam-column sub-
assemblages with relatively rigid boundary conditions. In comparison with realist ic
horizontal restraints, the CAA and catenary action capacities of the bridging beam
are overestimated. Therefore, further experimental tests are necessary to evaluate the
influence of restraint boundary conditions on the behaviour of sub-assemblages,
which is the topic in the following chapters.

CHAPTER 4 TESTS OF PRECAST SUB-ASSEMBLAGES WITH ECC
73
CHAPTER 4 EXPERIMENTAL TESTS OF PRECAST BEAM-
COLUMN SUB-ASSEMBLAGES WITH ENGINEERED
CEMENTITIOUS COMPOSITES
4.1 Introduction
By using either lap-splice or 90o bend of bottom reinforcement in the joint, precast
concrete beam-column sub-assemblages exhibited significant compressive arch
action (CAA) and catenary action under column removal scenarios, as discussed in
Chapter 3. Pull-out failure of bottom reinforcement was observed in the middle joint,
indicating inadequate embedment length of reinforcement. Besides special
reinforcement detailing in the joint, precast concrete structures also allow innovative
materials such as engineered cementitious composites (ECC) to be placed in critica l
regions so as to enhance structural performance under various loading conditions.
One potential advantage of applying ECC lies in its compatible deformations with
steel reinforcing bars (Fischer and Li 2002b; Li 2003), which can significantly reduce
the required embedment length or lap length between steel bars to develop the full
yield strength. Moreover, it exhibits superior strain capacity and damage tolerance in
uniaxial tension. However, applications of ECC to mitigate progressive collapse
remains a concern due to a high deformation demand on bridging beams to develop
CAA and subsequent catenary action under column removal scenarios.
This chapter presents an experimental study on the behaviour of six beam-column
sub-assemblages subject to column removal, in which ECC was placed in the
structural topping and the beam-column joint. The resistances and failure modes of
sub-assemblages were investigated in the experimental programme. Comparisons
were also made between the deformation capacities of sub-assemblages made of
conventional concrete and ECC. Finally, interactions between steel reinforcement
and ECC were studied to gain a deep insight into the effect of ECC on the behaviour
of beam-column sub-assemblages under column removal scenarios.

CHAPTER 4 TESTS OF PRECAST SUB-ASSEMBLAGES WITH ECC
74
4.2 Experimental Programme on Sub-Assemblages
4.2.1 Specimen design
(a) EMJ-B-1.19/0.59
(b) EMJ-L-1.19/0.59
Fig. 4.1: Geometric properties of precast beam-column sub-assemblages
To develop alternate load paths, one middle supporting column was assumed to be
“forcibly removed” without any damage to the beam-column joint (DOD 2013). This
is a threat-independent approach and it embodies a number of assumptions. Chiefly
among them is the assumption that only one column is removed at one time of an
300
150
7522
5 300
15075
225
300
300
300
2750 250
150
150
A
A
B
B
A
A
1000 1000
2H16
2H13
R8@80
2H13
R8@80
2H16+H13
D D
A-A B-B
C C
400
450
12H13
C-C
R8@100
10H13
R8@50 250
250
D-D
10 mm steel plate
20 mm steel plate
20 mm steel plate
10 mm steel plate
All the units are in mm.
PVC pipes
PVC pipes
300
300
300
2750 250
150
150
B
B
1000 1000
300
150
7516
5
300
150
7522
5
A-A
60
470 470 D D
2H16+H13 2H16
2H13
R8@80
2H13
R8@80
B-B
C C
400
450
12H13
C-C
R8@100
10H13
R8@50 250
250
D-D
All the units are in mm.10 mm steel plate
20 mm steel plate
20 mm steel plate
10 mm steel plate
A
A
A
A
PVC pipes
PVC pipes

CHAPTER 4 TESTS OF PRECAST SUB-ASSEMBLAGES WITH ECC
75
analysis, which implies that the approach can only be used for a small blast charge.
In this regard, the double-span bridging beam with a middle joint above the removed
column was extracted from the damaged region and tested under quasi-static push-
down loading condition to investigate the resistance and ductility of the joint. Two
enlarged concrete stubs were designed at the beam ends to provide horizontal and
vertical restraints for the beam-column sub-assemblage, as illustrated in Fig. 4.1.
To investigate the integrity of precast concrete structures subject to column removal
scenarios, precast beam units with cast-in-situ concrete topping were selected in the
experimental programme based on local and international construction practices
(CAE 1999; FIB 2003). Beam units with bottom longitudinal reinforcement were
prefabricated in the casting yard, and then assembled with top reinforcement prior to
placement of cast-in-situ concrete topping and beam-column joint. This type of
construction technology enables precast concrete structures to perform as well as
monolithic reinforced concrete structures, but at the same time seeks to achieve
higher productivity through reinforcement detailing (Shiohara and Watanabe 2000).
Fig. 4.1 shows the geometry and reinforcement detailing in beam-column sub-
assemblages. It is noteworthy that the hatched zones represent the precast concrete
beam units, whereas other parts were made of ECC. The cross section of the beam
was 150 mm wide by 300 mm high, in which the depths of the precast beam unit and
structural topping were 225 mm and 75 mm, respectively, as shown in Fig. 4.1. The
clear span of the beam was 2.75 m. The middle column stub was 250 mm square,
with a total height of 600 mm.
Table 4.1: Reinforcement details of precast beam-column sub-assemblages
Specimen Joint detailing
Longitudinal reinforcement*
Stirrups& A-A section B-B section
Top Bottom Top Bottom
CMJ-B-1.19/0.59# 90o bend 2H16+H13
(1.19%) 2H13
(0.59%) 2H16
(0.90%) 2H13
(0.59%) R8@80 EMJ-B-1.19/0.59 90o bend
EMJ-L-1.19/0.59 Lap-splice
EMJ-B-0.88/0.59 90o bend 3H13 (0.88%) 2H13
(0.59%) 2H13
(0.59%) 2H13
(0.59%) R8@80 EMJ-L-0.88/0.59 Lap-splice
EMJ-L-0.88/0.88 Lap-splice 3H13 (0.88%) 3H13 (0.88%)
2H13 (0.59%)
2H13 (0.59%) R8@80

CHAPTER 4 TESTS OF PRECAST SUB-ASSEMBLAGES WITH ECC
76
*: H16 and H13 denote high-yield strength deformed reinforcement with nominal diameters of 16 mm and 13 mm, respectively. The value in parenthesis is the geometric reinforcement ratio calculated from As /(bh), where b=150 mm and h=300 mm. &: R8 represents low-yield strength round bar with nominal diameter of 8 mm. The concrete clear cover was 20 mm, measured from the beam surface to the outmost of stirrups. #: The beam-column joint and concrete topping of specimen CMJ-B-1.19/0.59 were made of conventional concrete. In the experimental programme, longitudinal reinforcement was placed in structura l
topping and passed through the middle beam-column joint of sub-assemblages
continuously. Two types of bottom reinforcement detailing, which were identical to
those used in precast concrete beam-column sub-assemblages in Chapter 3, were used
in the joint of sub-assemblages, as shown in Fig. 4.1. The first joint detailing
consisted of 90o bend of beam bottom reinforcement protruding from the beam end
and anchored in the joint, as shown in Fig. 4.1(a). The second detailing was
characterised by lap-spliced bottom reinforcement in the joint, as shown in Fig. 4.1(b).
For the second detailing, precast beam units with a trough at each end were cast first,
and bottom reinforcement was placed in the middle joint to provide continuity. Based
on a concrete cylinder strength of 30 MPa, the anchorage length of bottom steel
reinforcing bars was calculated as 470 mm (36 times the rebar diameter). Precast
concrete beam-column sub-assemblages exhibited horizontal cracking across the
interface between precast beam unit and cast-in-situ concrete topping under column
removal scenarios, as discussed in Section 3.4.6. To prevent horizontal cracking and
to ensure adequate composite action between the precast beam unit and cast-in-situ
concrete topping, sufficient stirrups with a diameter of 8 mm at 80 mm spacing were
placed along the beam length. Horizontal interface between precast concrete beam
units and ECC was intentionally roughened to 3 mm deep, so as to comply to
requirements from Eurocode 2 (BSI 2004).
CMJ-B-1.19/0.59 made from conventional concrete was designed against gravity
loads in accordance with Eurocode 2 (BSI 2004). Another five sub-assemblages with
different reinforcement detailing and longitudinal reinforcement ratios in the beam
were fabricated, in which ECC was used to replace conventional concrete in the
structural topping of the double-span beam and beam-column joint. Table 4.1 lists
the reinforcement details of beam-column sub-assemblages. In the notations, the
alphabets “CMJ” and “EMJ” represent precast beam-column sub-assemblages with
conventional concrete and ECC in structural topping and beam-column joint,

CHAPTER 4 TESTS OF PRECAST SUB-ASSEMBLAGES WITH ECC
77
respectively, and “B” and “L” stand for 90o bend and lap-splice of bottom bars in the
middle joint. The first and second numerals denote the respective percentages of top
and bottom reinforcement at the middle joint. Beam-column sub-assemblage CMJ-
B-1.19/0.59 with conventional concrete beam and structural topping served as the
control specimen, in which 90o bend of beam bottom reinforcement was used in the
joint. In EMJ-B-1.19/0.59, concrete topping and beam-column joint were replaced by
ECC, whereas the other parameters remained the same as CMJ-B-1.19/0.59, as shown
in Fig. 4.1(a), so as to study the effect of ECC on structural resistance. In comparison
with EMJ-B-1.19/0.59, lap-spliced beam bottom reinforcement was applied in the
middle joint of EMJ-L-1.19/0.59 (see Fig. 4.1(b)) to study the effect of reinforcement
detailing on the middle joint behaviour. To quantify the effect of beam top
reinforcement ratios on progressive collapse resistance, the top reinforcement ratio
of EMJ-B-0.88/0.59 and EMJ-L-0.88/0.59 was reduced from 1.19% to 0.88% (see
‘A-A’ section in Table 4.1), but the bottom reinforcement ratio was kept the same at
0.59%. Lastly, compared with EMJ-L-0.88/0.59, only the bottom reinforcement ratio
was increased from 0.59% to 0.88% in sub-assemblage EMJ-L-0.88/0.88 to
investigate the influence of bottom reinforcement ratios. Exactly the same test setup
as that for precast concrete beam-column sub-assemblages was employed, as shown
in Fig. 3.3 and Fig. 3.5.
4.2.3 Material properties
Table 4.2 Mixture proportions of ECC
Ingredient Cement Water Micro-sand GGBS PVA fibre Unit weight
(kg/m3) 430 387 287 1004 26
The key point of the experimental programme lies in the utilisation of ECC materia ls
in precast beam-column sub-assemblages. Thus, the desirable material properties of
ECC play a crucial role in potentially enhancing the progressive collapse resistance
of the sub-assemblages. Hence, prior to the tests, ECC was designed and tailored
made with ordinary Portland cement, ground granulated blast-furnace slag (GGBS),
micro-sand, water, and Polyvinyl Alcohol (PVA) fibres, so as to achieve the desired
multi-cracking and strain-hardening behaviour in tension. Table 4.2 shows the mix
design of ECC. It is noteworthy that PVA fibres with a diameter of 0.039 mm and a

CHAPTER 4 TESTS OF PRECAST SUB-ASSEMBLAGES WITH ECC
78
length of 12 mm were used for ECC. ECC plates of dimensions 75 mm wide by 300
mm long by 12 mm thick were prepared and tested under four-point bending with a
240 mm clear span. Fig. 4.2 shows a typical load-deflection curve of ECC plates.
After the first cracking, applied load increased with significant hardening behaviour,
and the deflection corresponding to the maximum load of ECC plates could be up to
13.6 mm. Based on experimental results of ECC plates under four-point bending,
tensile stresses and strain capacity of ECC were calculated through inverse methods
(Qian and Li 2007; Qian and Li 2008), as shown in Table 4.3. The effective tensile
strength was estimated as 3.1 MPa and the strain capacity of ECC in tension was
around 2.6%. Table 4.3 also includes the properties of ECC in compression. It should
be noted that the compressive strength of ECC was obtained experimentally by
testing 50 mm cubes. The equivalent compressive strength of 150 mm diameter by
300 mm high cylinder was around 45.0 MPa.
0 2 4 6 8 10 12 14 16 18 200
50
100
150
200
250
300
350
Verti
cal l
oad
(N)
Deflection (mm)
Fig. 4.2: Load-deflection curve of ECC plates under four-point bending
Table 4.3 Strength of ECC in tension and compression
Compressive strength (MPa) Effective tensile strength (MPa)
Tensile strain capacity 50 mm cube 150 mm by 300 mm cylinder
(equivalent)* 62.7 45.0 3.1 2.6%
*: Compressive strength of 50 mm ECC cubes was converted to that of 150 mm cubes by multiplying a reduction factor of 0.9; thereafter, the equivalent compressive strength of 150 mm diameter by 300 mm long cylinders was calculated by multiplying a modification factor of 0.8.
In addition to ECC plates, material tests were also conducted on concrete cylinde rs
and steel reinforcing bars. Fig. 4.3 shows a typical stress-strain relationship of a
concrete cylinder and a steel bar. It is notable that concrete strain was calculated from
the contraction in the middle zone (100 mm long) of 150 mm diameter by 300 mm
80 80 80

CHAPTER 4 TESTS OF PRECAST SUB-ASSEMBLAGES WITH ECC
79
long concrete cylinder measured by LVDTs, and it represented the average strain in
the concrete zone with little confinement effect. Table 4.4 summarises the materia l
properties of steel reinforcing bars and concrete, which represent the average values
of three coupons for each material.
0.000 0.002 0.004 0.006 0.008 0.0100
8
16
24
32
40
48
Com
pres
sive s
tress
(MPa
)
Compressive strain (a) Concrete
0.00 0.04 0.08 0.12 0.160
160
320
480
640
800
Tens
ile st
ress
(MPa
)Tensile strain
H13 H16
(b) Reinforcement
Fig. 4.3: Stress-strain relationships of concrete and steel bar
Table 4.4: Material properties of reinforcing and concrete
Steel reinforcement Yield Strength (MPa)
Modulus of elasticity (GPa)
Ultimate strength (MPa)
Fracture strain* (%)
Longitudinal reinforcement
H13 549 206.6 698 16.3
H16 573 211.3 674 12.9
Stirrup R8 270 202.5 371 27.5
Concrete Compressive strength (MPa) Secant modulus (GPa)
Precast beam unit 40.5 29.2 Cast-in-situ concrete topping
(CMJ-B-1.19/0.59 only) 36.1 31.4 *: Fracture strain refers to the average strain over a gauge length of 300 mm when steel reinforcement ruptures.
4.3 Resistances of Beam-Column Sub-Assemblages
Under column removal scenarios, CAA and catenary action sequentially developed
in the bridging beam. Table 4.5 summarises the vertical load resistances and
horizontal reaction forces of beam-column sub-assemblages subjected to CAA and
catenary action. The CAA capacity refers to the maximum vertical load at the stage
when horizontal compression force develops in the beam, whereas the catenary action
capacity represents the peak load when the beam is subjected to axial tension force.

CHAPTER 4 TESTS OF PRECAST SUB-ASSEMBLAGES WITH ECC
80
Horizontal force represents the average value of total horizontal forces acting on the
left and right end column stubs. Variations of vertical loads and horizontal reaction
forces versus middle joint displacement are shown in Fig. 4.4 and Fig. 4.5.
Discussions are made on the effects of ECC, reinforcement detailing in the middle
joint and reinforcement ratios in the beam on the behaviour of sub-assemblages.
Table 4.5: Resistances of beam-column sub-assemblages
Specimen
CAA Catenary action
Capacity cP (kN)
Displacement at cP (mm)
Max. horizontal
compression cN (kN)
Capacity tP (kN)
Displacement at tP (mm)
Max. horizontal
tension force tN (kN)
CMJ-B-1.19/0.59 90.4 105.7 -281.1 108.2 452.0 200.4
EMJ-B-1.19/0.59 91.1 108.9 -274.7 110.3 430.2 199.0
EMJ-L-1.19/0.59 91.1 103.1 -305.8 88.3 431.2 192.2
EMJ-B-0.88/0.59 83.7 101.9 -262.8 55.2 319.3 16.2
EMJ-L-0.88/0.59 82.5 106.9 -317.7 65.3 339.3 97.3
EMJ-L-0.88/0.88 79.2 171.2 -74.4 78.7 386.0 144.1
4.3.1 Effect of ECC
In CMJ-B-1.19/0.59, conventional concrete was used in the structural topping and
the beam-column joint. When middle joint displacement was smaller than 25 mm,
horizontal reaction force was zero due to gaps in connection between the end column
stub and the horizontal restraints, as shown in Fig. 4.4(b). Sub-assemblage CMJ-B-
1.19/0.59 was under flexure. With increasing middle joint displacement beyond 25
mm, development of horizontal compression force indicated the commencement of
CAA. After attaining the CAA capacity of 90.4 kN and the maximum horizonta l
compression force of 281.1 kN, both the applied vertical load and horizonta l
compression force decreased, as shown in Figs. 4.4(a and b), due to progressive
crushing of concrete in the compression zones at the middle joint and end column
stub. In the descending phase of vertical load, fracture of beam bottom longitudina l
reinforcement at the right face of the middle joint led to a sudden drop of the applied
load (see Fig. 4.4(a)). Thereafter, vertical load started increasing again prior to the
onset of catenary action as a result of rotational restraint in the middle joint. When

CHAPTER 4 TESTS OF PRECAST SUB-ASSEMBLAGES WITH ECC
81
the middle joint displacement surpassed one beam depth of 300 mm, catenary action
was mobilised with increasing axial tension force in the beam, as shown in Fig. 4.4(b).
Eventually, fracture of beam top longitudinal reinforcement at the face of the left
column stub caused final failure of CMJ-B-1.19/0.59. The sub-assemblage was able
to develop the catenary action capacity of 108.2 kN and the maximum horizonta l
tension force of 200.4 kN at the catenary action stage, as included in Table 4.5. The
ultimate middle joint displacement attained at the catenary action capacity was 452
mm, at about middle joint displacement of 1.5 times the beam depth.
0 100 200 300 400 5000
20
40
60
80
100
120
Ver
tical
load
(kN
)
Middle joint displacement (mm)
CMJ-B-1.19/0.59 EMJ-B-1.19/0.59 EMJ-B-0.88/0.59
(a) Load-displacement curve
0 100 200 300 400 500
-300
-200
-100
0
100
200
300
Horiz
ontal
reac
tion f
orce
(kN)
Middle joint displacement (mm)
CMJ-B-1.19/0.59 EMJ-B-1.19/0.59 EMJ-B-0.88/0.59
(b) Horizontal reaction force-displacement
curve
Fig. 4.4: Variations of vertical loads and horizontal reaction forces of sub-assemblages of bottom reinforcement with 90o bend
0 100 200 300 400 5000
20
40
60
80
100
120
Ver
tical
load
(kN
)
Middle joint displacement (mm)
EMJ-L-1.19/0.59 EMJ-L-0.88/0.59 EMJ-L-0.88/0.88
(a) Load-displacement curve
0 100 200 300 400 500
-300
-200
-100
0
100
200
300
Horiz
ontal
reac
tion
forc
e (kN
)
Middle joint displacement (mm)
EMJ-L-1.19/0.59 EMJ-L-0.88/0.59 EMJ-L-0.88/0.88
(b) Horizontal reaction force-displacement
curve
Fig. 4.5: Variations of vertical loads and horizontal reaction forces of sub-assemblages with lap-spliced bottom reinforcement
Compared to CMJ-B-1.19/0.59, sub-assemblage EMJ-B-1.19/0.59 possessed the
same top and bottom reinforcement ratios in the beam and joint detailing. Although

CHAPTER 4 TESTS OF PRECAST SUB-ASSEMBLAGES WITH ECC
82
ECC was used in the structural topping and the beam-column joint in place of
conventional concrete, sub-assemblage EMJ-B-1.19/0.59 exhibited a simila r
behaviour to CMJ-B-1.19/0.59 under column removal scenarios, as shown in Figs.
4.4(a and b). At CAA stage, the maximum vertical load sustained by EMJ-B-
1.19/0.59 was 91.1 kN and the peak horizontal compression force was 274.7 kN (see
Table 4.5). Following the fracture of beam bottom reinforcement at the right face of
the middle joint, catenary action kicked in as the last line of defence against collapse.
At the catenary action stage, vertical load was continually increased with increasing
middle joint displacement (see Fig. 4.4(a)), whereas a plateau stage with almost
constant horizontal tension force was observed in the horizontal reaction force-
middle joint displacement curve, as shown in Fig. 4.4(b). At middle joint
displacement of 430.2 mm (1.45 times the beam depth), sub-assemblage EMJ-B-
1.19/0.59 attained its catenary action capacity of 110.3 kN. The maximum horizonta l
tension force was 199.0 kN at catenary action stage. Compared with CMJ-B-
1.19/0.59, EMJ-B-1.19/0.59 developed almost the same CAA capacity and catenary
action capacity, as included in Table 4.5, although ECC was utilised in the structura l
topping and the beam-column joint. It seems to indicate that ECC did not significant ly
enhance the resistance of beam-column sub-assemblage at large deformation stage.
4.3.2 Effect of reinforcement detailing
In EMJ-L-1.19/0.59, lap-spliced beam bottom reinforcement was employed in the
middle beam-column joint, whereas the top and bottom reinforcement ratios in the
beam remained the same as EMJ-B-1.19/0.59. Figs. 4.5(a and b) show the vertical
load and horizontal reaction force versus the middle joint displacement curves of sub-
assemblage EMJ-L-1.19/0.59. In comparison with EMJ-B-1.19/0.59, EMJ-L-
1.19/0.59 attained the same vertical load capacity of 91.1 kN at CAA stage, but its
maximum horizontal compression force was 305.8 kN, 11% greater than EMJ-B-
1.19/0.59, as listed in Table 4.5. At catenary action stage, vertical load and horizonta l
tension force reached their maximum values simultaneously after fracture of one
beam longitudinal bar occurred at the face of the left column stub. The catenary action
capacity of EMJ-L-1.19/0.59 was 88.3 kN, 20% lower than that of EMJ-B-1.19/0.59.
The maximum horizontal tension force in EMJ-L-1.19/0.59 was only 4% less than

CHAPTER 4 TESTS OF PRECAST SUB-ASSEMBLAGES WITH ECC
83
that in EMJ-B-1.19/0.59. With increasing middle joint displacement, subsequent
fracture of all beam top reinforcement at the face of the left column stub led to
reductions in vertical load and horizontal tension force, as shown in Figs. 4.5(a and
b). Thereafter, a pin joint was formed at the left column stub, indicating failure of
beam-column sub-assemblage EMJ-L-1.19/0.59. Therefore, by changing the
reinforcement detailing in the middle joint from 90o bend to lap-splice, similar CAA
capacities were obtained in EMJ-L-1.19/0.59 and EMJ-B-1.19/0.59. However, the
catenary action capacity of EMJ-L-1.19/0.59 was significantly lower compared to
EMJ-B-1.19/0.59.
4.3.3 Effect of top reinforcement ratios
Top reinforcement ratio in the beam of sub-assemblage EMJ-B-0.88/0.59 was
reduced from 1.19% to 0.88% in comparison with EMJ-B-1.19/0.59, but
reinforcement detailing in the joint and beam bottom reinforcement ratio remained
the same, as included in Table 4.1. As a result, the CAA capacity of EMJ-B-0.88/0.59
was reduced to 83.7 kN, around 8% lower than that of EMJ-B-1.19/0.59, as shown in
Table 4.5. Likewise, the maximum horizontal compression force was reduced by 14%
to 262.8 kN at CAA stage. In the descending branch of the vertical load, beam bottom
reinforcement at the right face of the middle joint fractured sequentially, leading to
reductions of vertical load. At the initial stage of catenary action, premature fracture
of beam top reinforcement at the face of the right end column stub substantia lly
reduced the vertical load at 320 mm displacement, as shown in Fig. 4.4(a). Sub-
assemblage EMJ-B-0.88/0.59 attained its catenary action capacity of 55.2 kN (see
Table 4.5), only 50% of that of EMJ-B-1.19/0.59. With increasing middle joint
displacement, beam bottom longitudinal reinforcement at the end column stub could
sustain a certain level of tension force. Thus, horizontal tension force increased
slowly at the catenary action stage, as shown in Fig. 4.4(b), but vertical load could
not surpass the catenary action capacity due to a reduction of hogging moment
resistance at the beam end section. Therefore, by reducing the top reinforcement ratio
in the beam of EMJ-B-0.88/0.59 compared with EMJ-B-1.19/0.59, the former
resistance was substantially reduced, in particular, the catenary action capacity.

CHAPTER 4 TESTS OF PRECAST SUB-ASSEMBLAGES WITH ECC
84
Similar conclusions are obtained when a comparison is made between sub-
assemblages EMJ-L-0.88/0.59 and EMJ-L-1.19/0.59. The top reinforcement ratio of
the former was reduced from 1.19% to 0.88% compared to the latter. Fig. 4.5(a)
shows the vertical load-middle joint displacement curve of EMJ-L-0.88/0.59. At the
CAA stage, the maximum vertical load resisted by EMJ-L-0.88/0.59 was 82.5 kN, as
included in Table 4.5, 9% lower than that of EMJ-L-1.19/0.59. However, the
maximum horizontal compression force in EMJ-L-0.88/0.59 was 274.7 kN, around
5% greater in comparison with EMJ-B-0.88/0.59. At the catenary action stage, the
capacity of EMJ-L-0.88/0.59 was 26% lower than that of EMJ-L-1.19/0.59. It is
noteworthy that prior to fracture of beam top reinforcement at the end column stub,
vertical load of EMJ-L-0.88/0.59 decreased gradually with increasing middle joint
displacement, as shown in Fig. 4.5(a).
4.3.4 Effect of bottom reinforcement ratios
To study the effect of beam bottom longitudinal reinforcement on the behaviour of
beam-column sub-assemblages, bottom reinforcement ratio in the beam of EMJ-L-
0.88/0.88 was increased from 0.59% to 0.88% in comparison with EMJ-L-0.88/0.59.
Fig. 4.5(a) shows the vertical load-middle joint displacement curve of EMJ-L-
0.88/0.88. The sub-assemblage exhibited the CAA capacity of 79.2 kN, 4% lower
than EMJ-L-1.19/0.59. No significant descending phase was observed following the
CAA capacity. When the middle joint displacement was below 100 mm, horizonta l
tension force was generated in sub-assemblage EMJ-L-0.88/0.88, as shown in Fig.
4.5(b). This unusual behaviour arose from comparatively large connection gaps
between the end column stub and the bottom horizontal restraint. The connection
gaps also reduced the horizontal compression force in the beam and hindered the full
development of CAA capacity at the initial stage. At catenary action stage, EMJ-L-
0.88/0.88 was able to sustain the maximum vertical load of 78.7 kN and the peak
horizontal tension force of 144.1 kN. Even though only the bottom reinforcement
ratio in the beam was increased in EMJ-L-0.88/0.88 compared to EMJ-L-0.88/0.59,
both the catenary action capacity and horizontal tension force of the former were
substantially greater than those of the latter, as included in Table 4.5.
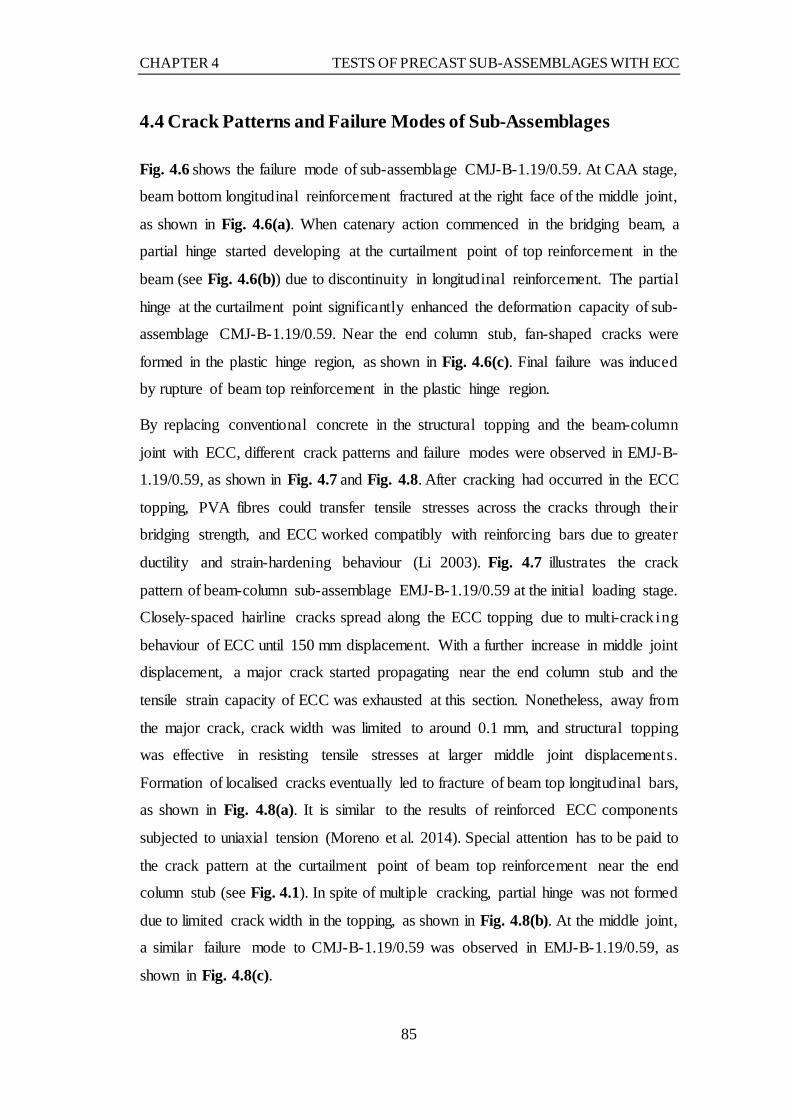
CHAPTER 4 TESTS OF PRECAST SUB-ASSEMBLAGES WITH ECC
85
4.4 Crack Patterns and Failure Modes of Sub-Assemblages
Fig. 4.6 shows the failure mode of sub-assemblage CMJ-B-1.19/0.59. At CAA stage,
beam bottom longitudinal reinforcement fractured at the right face of the middle joint,
as shown in Fig. 4.6(a). When catenary action commenced in the bridging beam, a
partial hinge started developing at the curtailment point of top reinforcement in the
beam (see Fig. 4.6(b)) due to discontinuity in longitudinal reinforcement. The partial
hinge at the curtailment point significantly enhanced the deformation capacity of sub-
assemblage CMJ-B-1.19/0.59. Near the end column stub, fan-shaped cracks were
formed in the plastic hinge region, as shown in Fig. 4.6(c). Final failure was induced
by rupture of beam top reinforcement in the plastic hinge region.
By replacing conventional concrete in the structural topping and the beam-column
joint with ECC, different crack patterns and failure modes were observed in EMJ-B-
1.19/0.59, as shown in Fig. 4.7 and Fig. 4.8. After cracking had occurred in the ECC
topping, PVA fibres could transfer tensile stresses across the cracks through their
bridging strength, and ECC worked compatibly with reinforcing bars due to greater
ductility and strain-hardening behaviour (Li 2003). Fig. 4.7 illustrates the crack
pattern of beam-column sub-assemblage EMJ-B-1.19/0.59 at the initial loading stage.
Closely-spaced hairline cracks spread along the ECC topping due to multi-crack ing
behaviour of ECC until 150 mm displacement. With a further increase in middle joint
displacement, a major crack started propagating near the end column stub and the
tensile strain capacity of ECC was exhausted at this section. Nonetheless, away from
the major crack, crack width was limited to around 0.1 mm, and structural topping
was effective in resisting tensile stresses at larger middle joint displacements.
Formation of localised cracks eventually led to fracture of beam top longitudinal bars,
as shown in Fig. 4.8(a). It is similar to the results of reinforced ECC components
subjected to uniaxial tension (Moreno et al. 2014). Special attention has to be paid to
the crack pattern at the curtailment point of beam top reinforcement near the end
column stub (see Fig. 4.1). In spite of multiple cracking, partial hinge was not formed
due to limited crack width in the topping, as shown in Fig. 4.8(b). At the middle joint,
a similar failure mode to CMJ-B-1.19/0.59 was observed in EMJ-B-1.19/0.59, as
shown in Fig. 4.8(c).

CHAPTER 4 TESTS OF PRECAST SUB-ASSEMBLAGES WITH ECC
86
(a) At the middle joint
(b) At the cut-off point
(c) At the end column stub
Fig. 4.6: Crack patterns and failure modes of CMJ-B-1.19/0.59
Fig. 4.7: Development of multi-cracking in the structural topping of EMJ-B-1.19/0.59
Fracture of bottom bars
Middle joint
Partial hinge
Plastic hinge
60 mm 120 mm
180 mm A major
crack 240 mm A major
crack
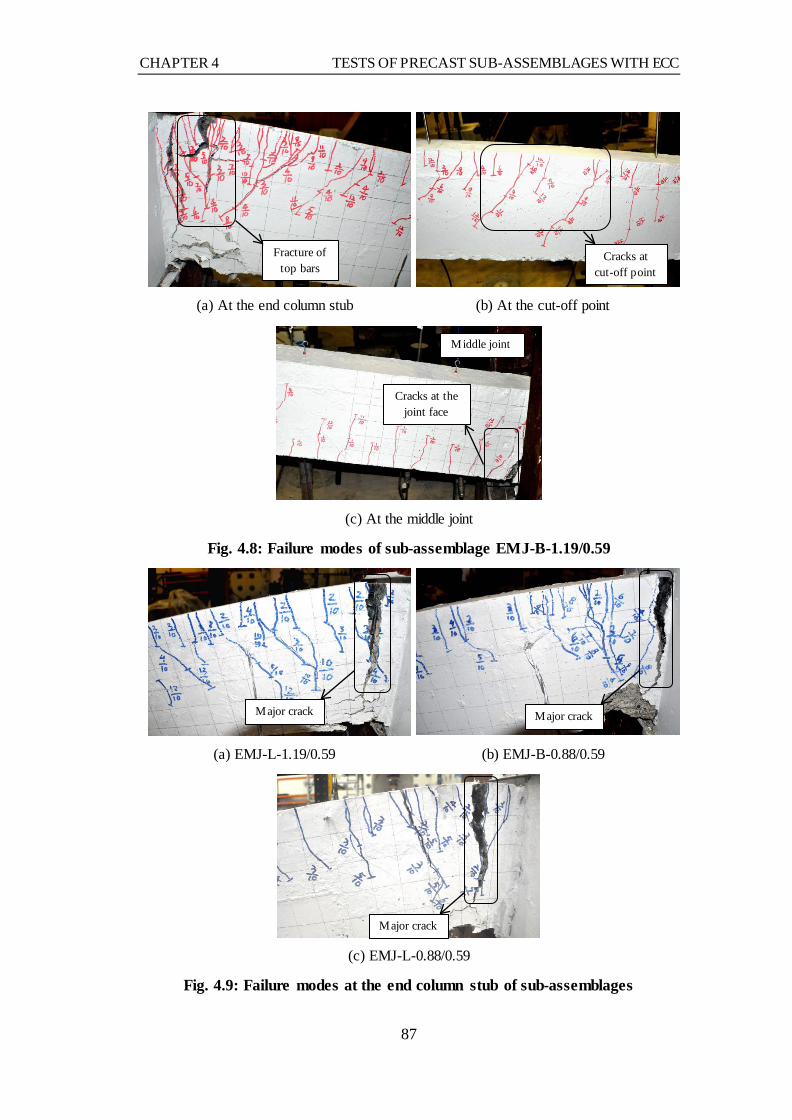
CHAPTER 4 TESTS OF PRECAST SUB-ASSEMBLAGES WITH ECC
87
(a) At the end column stub
(b) At the cut-off point
(c) At the middle joint
Fig. 4.8: Failure modes of sub-assemblage EMJ-B-1.19/0.59
(a) EMJ-L-1.19/0.59
(b) EMJ-B-0.88/0.59
(c) EMJ-L-0.88/0.59
Fig. 4.9: Failure modes at the end column stub of sub-assemblages
Fracture of top bars
Cracks at cut-off point
Middle joint
Cracks at the joint face
Major crack
Major crack Major crack
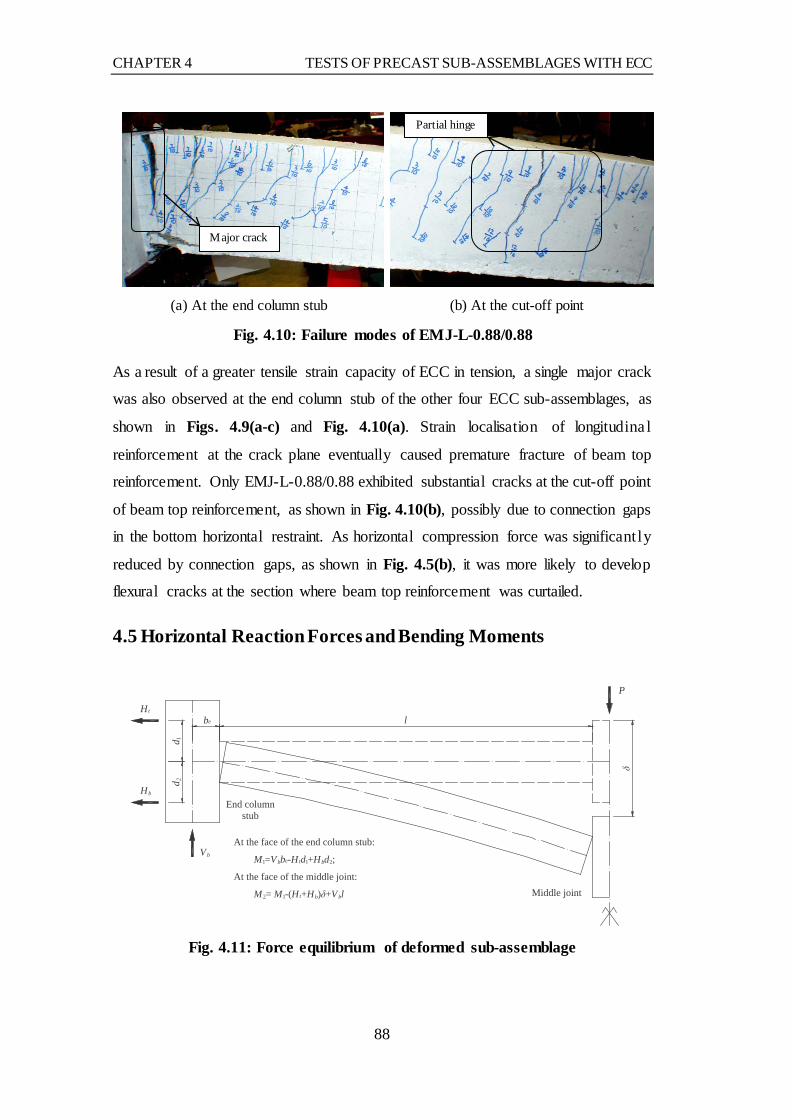
CHAPTER 4 TESTS OF PRECAST SUB-ASSEMBLAGES WITH ECC
88
(a) At the end column stub
(b) At the cut-off point
Fig. 4.10: Failure modes of EMJ-L-0.88/0.88
As a result of a greater tensile strain capacity of ECC in tension, a single major crack
was also observed at the end column stub of the other four ECC sub-assemblages, as
shown in Figs. 4.9(a-c) and Fig. 4.10(a). Strain localisation of longitudina l
reinforcement at the crack plane eventually caused premature fracture of beam top
reinforcement. Only EMJ-L-0.88/0.88 exhibited substantial cracks at the cut-off point
of beam top reinforcement, as shown in Fig. 4.10(b), possibly due to connection gaps
in the bottom horizontal restraint. As horizontal compression force was significant ly
reduced by connection gaps, as shown in Fig. 4.5(b), it was more likely to develop
flexural cracks at the section where beam top reinforcement was curtailed.
4.5 Horizontal Reaction Forces and Bending Moments
Fig. 4.11: Force equilibrium of deformed sub-assemblage
P
Ht
Hb
Vb
End columnstub
δ
l
Middle joint
be
At the face of the end column stub:
M1=Vbbe-Htd1+Hbd2;
At the face of the middle joint:
M2= M1-(Ht+Hb)δ+Vbl
d 1d 2
Partial hinge
Major crack

CHAPTER 4 TESTS OF PRECAST SUB-ASSEMBLAGES WITH ECC
89
0 100 200 300 400 500
-300
-200
-100
0
100
200
Horiz
ontal
reac
tion f
orce
(kN)
Middle joint displacement (mm)
Ht in top restraint Hb in bottom restraint
(a) EMJ-B-1.19/0.59
0 100 200 300 400 500
-200
-150
-100
-50
0
50
100
150
200
Hor
izon
tal r
eact
ion
forc
e (kN
)
Middle joint displacement (mm)
Ht in top restraint Hb in bottom restraint
(b) EMJ-L-0.88/0.88
Fig. 4.12: Variations of horizontal reaction forces in sub-assemblages
To investigate the load path of horizontal forces to the support, total horizontal force
was decomposed into the reaction forces in the top and bottom restraints, as shown
in Fig. 4.11. In sub-assemblage EMJ-B-1.19/0.59, the bottom restraint sustained
compression force while the top restraint was in tension at CAA stage, as shown in
Fig. 4.12(a). The maximum compression force in the bottom restraint was 313.5 kN.
Once catenary action commenced, the horizontal tension was primarily transferred to
the top restraint. Meanwhile, the reaction force in the bottom restraint was gradually
shifted to tension. When the catenary action capacity was attained, the peak tension
force in the top restraint was 200 kN, but limited tension force was sustained by the
bottom restraint. Eventually, fracture of top reinforcement at the end column stub
substantially reduced the tension force in the top restraint. Similar load paths of
horizontal forces were also recorded in other sub-assemblages. However, in EMJ-L-
0.88/0.88, the presence of connection gaps between the end column stub and the
bottom restraint postponed the development of horizontal compression in the bottom
restraint, as shown in Fig. 4.12(b). The maximum compression force was only 168.2
kN. Additionally, the tension force in the top restraint developed much earlier in
comparison with EMJ-B-1.19/0.59. Therefore, the maximum horizontal compression
force at the CAA stage of EMJ-L-0.88/0.88 was significantly smaller than the other
sub-assemblages (see Fig. 4.5(b)).

CHAPTER 4 TESTS OF PRECAST SUB-ASSEMBLAGES WITH ECC
90
0 100 200 300 400 5000
15
30
45
60
75M
omen
t at m
iddl
e col
umn
face
s (kN
.m)
Middle joint displacement (mm)
At left face of middle joint At right face of middle joint
(a) Sagging moment at middle joint face
0 100 200 300 400 500
-100
-80
-60
-40
-20
0
Mom
ent a
t end
colu
mn
stub
face
s (kN
.m)
Middle joint displacement (mm)
At face of left column stub At face of right column stub
(b) Hogging moment at end column stub
face
Fig. 4.13: Variations of bending moments in EMJ-B-1.19/0.59
0 20 40 60 80 100 120-2000
-1500
-1000
-500
0
500
Beam
axial
forc
e (kN
)
Bending moment (kN.m)
M-N interaction Test results
A
(a) At the face of end column stub
0 20 40 60 80 100 120-2000
-1500
-1000
-500
0
500
B
Beam
axial
forc
e (kN
)
Bending moment (kN.m)
M-N interaction Test results
(b) At the face of middle joint
Fig. 4.14: Interaction of bending moment and beam axial force
Bending moments at the faces of the end column stub and middle joint of sub-
assemblage EMJ-B-1.19/0.59 are calculated based on the force equilibrium of the
deformed sub-assemblages (see Fig. 4.11). With increasing middle joint
displacement, sagging and hogging moments developed at the beam ends and attained
their maximum values of 65.1 kN.m and 95.6 kN.m at the CAA stage, as shown in
Figs. 4.13(a and b). At about 200 mm middle joint displacement, sagging moments
were suddenly reduced as a result of rupture of bottom reinforcement at the left face
of the middle joint, as shown in Fig. 4.13(a). Thereafter, rotational restraint on the
middle joint allowed for an increase in sagging moment at the right face of the middle
joint. Beyond the maximum values, hogging moments near the end column stub
decreased gradually until fracture of top reinforcement occurred (see Fig. 4.13(b)).

CHAPTER 4 TESTS OF PRECAST SUB-ASSEMBLAGES WITH ECC
91
Based on the deformed shape of the beam, axial force in the beam was approximate ly
identical to total horizontal reaction force on each end column stub. Through the axial
force-bending moment (N-M) interaction diagram for the beam, correlations between
the calculated bending moments at the beam ends and the axial force are established,
as shown in Fig. 4.14. At the initial stage, hogging moment at the face of the end
column stub increased almost linearly with increasing axial compression force in the
beam, as shown in Fig. 4.14(a), until the maximum hogging moment was attained.
Thereafter, variations of axial compression force and hogging moment followed the
theoretical interaction diagram. Similar results were obtained at the face of the middle
joint, as shown in Fig. 4.14(b). However, premature fracture of beam bottom
reinforcement at the joint interface reduced the sagging moment. Furthermore,
comparisons are made between the calculated sagging and hogging moments and the
moment capacities of the beam under pure flexure without axial force, as shown in
Fig. 4.14. At the end column stub, the beam developed a maximum hogging moment
of 95.6 kN.m, around 32% greater than the hogging moment capacity of 72.2 kN.m
(point A in Fig. 4.14(a)) under flexure. Likewise, the calculated sagging moment
(65.1 kN.m) was roughly 75% greater than the sagging moment capacity of 37.1
kN.m (point B in Fig. 4.14(b)). It indicates that development of horizonta l
compression force at the CAA stage substantially increased the moment resistances
of the bridging beam.
4.6 Deformation Capacities of Beam-Column Sub-Assemblages
In addition to structural resistances of beam-column sub-assemblages subject to
column removal scenarios, plastic hinge rotations at the end column stub were also
measured through four LVDTs at the beam ends (LE-1 to LE-4 in Fig. 3.5). Chord
rotation of the beam is calculated as the ratio of the middle joint displacement when
the catenary action capacity is attained to the length of the single-span beam, as
defined in UFC 4-023-03 (DOD 2013) (see Eq. 4-1). Table 4.6 includes the plastic
hinge rotations and chord rotations of beam-column sub-assemblages. The plastic
hinge rotation in a length of 270 mm away from the face of the end column stub was
significantly smaller than the chord rotation of each sub-assemblage. It implies that
the flexural deformation of the bridging beam, in particular, at the curtailment of the

CHAPTER 4 TESTS OF PRECAST SUB-ASSEMBLAGES WITH ECC
92
top reinforcement (1000 mm away from the face of the end column stub, as shown in
Fig. 4.1), contributed a significant portion to the total rotation of the sub-assemblage.
Thus, in quantifying the deformation capacity of beam-column sub-assemblages, the
flexural deformation of the beam has to be considered.
c lδθ = (4-1)
where cθ is the chord rotation; δ is the vertical displacement of the middle joint
when the catenary action capacity is attained; and l is the clear span of the beam.
Table 4.6: Rotation angles of beam-column sub-assemblages
Specimen Rotation of plastic hinges at end column stub (o) Chord
rotation cθ (o) At A-frame At reaction wall Average value pθ
CMJ-B-1.19/0.59 7.2 5.7 6.5 9.4
EMJ-B-1.19/0.59 7.7 6.0 6.9 9.0
EMJ-L-1.19/0.59 8.2 7.2 8.7 9.0
EMJ-B-0.88/0.59 4.9 5.3 5.1 6.7
EMJ-L-0.88/0.59 5.7 5.0 5.4 7.1
EMJ-L-0.88/0.88 4.6 5.2 4.9 8.0
With the same top reinforcement ratio in the beam, sub-assemblages CMJ-B-
1.19/0.59, EMJ-B-1.19/0.59 and EMJ-L-1.19/0.59 were able to develop nearly the
same chord rotations (around 9.0o) under column removal scenarios, as shown in
Table 4.6. By reducing the beam top reinforcement ratio from 1.19% to 0.88% in
sub-assemblage EMJ-B-0.88/0.59, the chord rotation was reduced to 6.7o, by around
26% in comparison with EMJ-B-0.88/0.59. A similar reduction in the chord rotation
is obtained when a comparison is made between EMJ-L-1.19/0.59 and EMJ-L-
0.88/0.59. It indicates that a lower top reinforcement ratio reduced the deformation
capacity of sub-assemblages. In EMJ-L-0.88/0.88, only the bottom reinforcement
ratio in the beam was increased from 0.59% to 0.88% in comparison with EMJ-L-
0.88/0.59. Correspondingly, the chord ration was increased to 8.0o, by about 13%
compared to EMJ-L-0.88/0.59. The increase in the chord rotation was mainly induced
by the connection gap in the bottom horizontal restraint. It allowed the end column
stub to undergo a rotation of 1.1o and postponed the development of plastic hinge
rotations at the beam ends of EMJ-L-0.88/0.88.

CHAPTER 4 TESTS OF PRECAST SUB-ASSEMBLAGES WITH ECC
93
4.7 Local Rotations in the Plastic Hinge Region
Precast concrete beam-column sub-assemblage CMJ-B-1.19/0.59 developed fan-
shaped crack pattern in the plastic hinge region, as shown in Fig. 4.6(c). When ECC
was placed in the structural topping and beam-column joint of sub-assemblages, a
single major crack occurred in the plastic hinge region near the end column stub at
large deformation stage, as shown in Figs. 4.9(a-c) and Fig. 4.10(a). Therefore, to
quantify the different behaviour of plastic hinges in conventional concrete and ECC
sub-assemblages, total rotation of plastic hinges within a length of 270 mm was
decomposed into two portions: 1θ between the end column stub face and section S1
measured by LVDTs LE-1 and LE-2 and 2θ between sections S1 and S2 measured
by LVDTs LE-3 and LE-4 (see Fig. 3.5), as expressed in Eqs. (4-2) and (4-3). Ratio
θγ of 1θ to 1 2θ θ+ is also calculated from Eq. (4-4). If the hogging moment between
the end column stub face and section S2 is constant and no localised failure occurs,
θγ is close to 0.56. When the plastic hinge rotation is fully localised in the beam
segment between end column stub face and section S1, θγ is equal to 1. Thus, θγ
can be interpreted as a factor that indicates the degree of localisation of plastic hinge
rotation at the beam end. The greater the ratio, the more localised the plastic hinge
rotation is at the beam end near the end column stub.
1 21
1
LE LE
plδ δθ − −−
= (4-2)
3 42
2
LE LE
plδ δθ − −−
= (4-3)
1
1 2θ
θγθ θ
=+
(4-4)
where 1θ is the rotation between end column stub face and section S1, measured by
LVDTs LE-1 and LE-2, as shown in Fig. 3.5; 2θ is the rotation between sections S1
and S2, measured by LVDTs LE-3 and LE-4; 1LEδ − , 2LEδ − , 3LEδ − and 4LEδ − are the
readings of LVDTs LE-1, LE-2, LE-3 and LE-4, respectively; 1pl and 2 pl are the
distances between end column stub and S1 and between S1 and S2, 150 mm and 120
mm, respectively.

CHAPTER 4 TESTS OF PRECAST SUB-ASSEMBLAGES WITH ECC
94
0 50 100 150 200 250 300 350 400 450 5000.0
1.5
3.0
4.5
6.0
7.5 θ1 by LE-1 and LE-2 θ2 by LE-3 and LE-4 Ratio γ = θ1 /(θ1 +θ2 )
Middle joint displacement (mm)
Rota
tion
of b
eam
segm
ents
(o )
0.5
0.6
0.7
0.8
0.9
1.0
Ratio
θ 1 /(θ
1 +θ 2 )
(a) CMJ-B-1.19/0.59
0 50 100 150 200 250 300 350 400 450 5000.0
1.5
3.0
4.5
6.0
7.5
9.0 θ1 by LE-1 and LE-2 θ2 by LE-3 and LE-4 Ratio γ = θ1 /(θ1 +θ2 )
Middle joint displacement (mm)
Rota
tion
of b
eam
segm
ents
(o )
0.5
0.6
0.7
0.8
0.9
1.0
1.1
Ratio
θ 1 /(θ
1 +θ 2 )
(b) EMJ-B-1.19/0.59
0 50 100 150 200 250 300 350 400 450 5000.0
1.5
3.0
4.5
6.0
7.5
9.0 θ1 by LE-1 and LE-2 θ2 by LE-3 and LE-4 Ratio γ = θ1 /(θ1 +θ2 )
Middle joint displacement (mm)
Rota
tion
of b
eam
segm
ents
(o )
0.5
0.6
0.7
0.8
0.9
1.0
1.1
Ratio
θ 1 /(θ
1 +θ 2 )
(c) EMJ-L-1.19/0.59
0 50 100 150 200 250 300 3500
1
2
3
4
5
6 θ1 by LE-1 and LE-2 θ2 by LE-3 and LE-4 Ratio γ = θ1 /(θ1 +θ2 )
Middle joint displacement (mm)
Rotat
ion
of b
eam
segm
ents
(o )
0.6
0.7
0.8
0.9
1.0
1.1
1.2
Ratio
θ 1 /(θ 1 +
θ 2 )
(d) EMJ-B-0.88/0.59
0 50 100 150 200 250 300 350 4000
1
2
3
4
5
6
θ1 by LE-1 and LE-2 θ2 by LE-3 and LE-4 Ratio γ = θ1 /(θ1 +θ2 )
Middle joint displacement (mm)
Rotat
ion
of b
eam
segm
ents
(o )
0.6
0.7
0.8
0.9
1.0
1.1
1.2
Ratio
θ 1 /(θ 1 +
θ 2 )
(e) EMJ-L-0.88/0.59
0 50 100 150 200 250 300 350 400 450 5000
1
2
3
4
5 θ1 by LE-1 and LE-2 θ2 by LE-3 and LE-4 Ratio γ = θ1 /(θ1 +θ2 )
Middle joint displacement (mm)
Rotat
ion
of b
eam
segm
ents
(o )
0.6
0.7
0.8
0.9
1.0
1.1
1.2
Ratio
θ 1 /(θ 1 +
θ 2 )
(f) EMJ-L-0.88/0.88
Fig. 4.15: Rotations in plastic hinge regions of sub-assemblages
Fig. 4.15 shows the variations of rotations with middle joint displacement. At the
initial stage, rotations measured in the plastic hinge region were zero due to
connection gaps between horizontal restraint and end column stub. After around 50
mm middle joint displacement, rotations 1θ and 2θ started increasing until beam
longitudinal reinforcement ruptured at the face of the end column stub. In sub-
assemblage CMJ-B-1.19/0.59, ratio θγ increased to its peak value, and then

CHAPTER 4 TESTS OF PRECAST SUB-ASSEMBLAGES WITH ECC
95
decreased with increasing middle joint displacement at CAA stage (see Fig. 4.15(a)).
At catenary action stage, the ratio levelled off at around 0.74 until final failure
occurred. The reduction in the ratio was due to penetration of inelastic strain of beam
top longitudinal reinforcement into the beam and propagation of fan-shaped cracks
in the plastic hinge region, as shown in Fig. 4.6(c). In comparison with CMJ-B-
1.19/0.59, a greater ductility of ECC topping in EMJ-B-1.19/0.59 prevented
formation of more major cracks in the plastic hinge region, as shown in Fig. 4.8(a).
Thus, ratio θγ in EMJ-B-1.19/0.59 increased after the onset of catenary action in the
bridging beam, as shown in Fig. 4.15(b), indicating localisation of rotation at the
plane of major crack. The maximum ratio attained at catenary action stage was 0.90.
By reducing the top reinforcement ratio in the beam from 1.19% to 0.88% in EMJ-
B-0.88/0.59, more severe localisation of rotation occurred at the plane of the single
major crack, as shown in Fig. 4.9(b). Total rotation of plastic hinge was largely
contributed by 1θ , whereas only limited 2θ was measured between sections S1 and
S2, as shown in Fig. 4.15(d). After 100 mm middle joint displacement, θγ kept
increasing and its maximum value was 0.96. A similar behaviour of plastic hinges
was observed in sub-assemblages EMJ-L-1.19/0.59 and EMJ-L-0.88/0.59, as shown
in Figs. 4.15(c and e). Thus, application of ECC to structural topping resulted in
localisation of rotation at the face of end column stub. A reduction in the beam top
reinforcement ratio further led to localisation of rotation near the end column stub.
Moreover, a comparison between sub-assemblages EMJ-L-0.88/0.59 and EMJ-L-
0.88/0.88 indicates that almost the same ratio θγ was obtained in EMJ-L-0.88/0.59
and EMJ-L-0.88/0.88 when beam top reinforcement ratio remained unchanged, as
shown in Figs. 4.15(e and f).

CHAPTER 4 TESTS OF PRECAST SUB-ASSEMBLAGES WITH ECC
96
4.8 Interactions between Steel Reinforcement and ECC
Fig. 4.16: Layout of strain gauges on beam longitudinal reinforcement
To investigate the interactions between ECC and steel reinforcement, strain gauges
were mounted onto the top and bottom faces of reinforcing bars at specific sections,
as shown in Fig. 4.16. Since possible dowel action could generate local bending in
the reinforcing bars (Soltani and Maekawa 2008), strain gauges at the two faces of
reinforcement provided different readings. Fig. 4.17 shows the variations of steel
strains close to the extreme tension fibre of beam sections. In the middle joint, steel
strains attained the maximum value at the joint interface and decreased along the
embedment length of reinforcement (see Fig. 4.17(a)). At the joint interface (section
B), strain gauges MB-6 and MB-8 achieved the yield strain of steel bars at
displacement below 40 mm, and developed the post-yield behaviour until rupture of
bottom reinforcement occurred, as shown in Fig. 4.17(a). However, at the section 60
mm into the middle joint (section A), steel strains MB-2 and MB-4 experienced a
significant plateau stage after the yield strain, and henceforth, attained the peak strain
prior to rupture of bottom bars (see Fig. 4.17(a)). Although the strains at the middle
joint face and inside the joint were significantly different from each other at post-
yield stage, difference between steel stresses was limited. As for top reinforcement at
the end column stub, a similar variation of steel strains was recorded, as shown in
Fig. 4.17(b). Even though strain gauge ET-5 was located in the middle of ET-1 and
ET-9, the reading of ET-5 was closer to that of ET-1 than ET-9, possibly due to
formation of concrete cone near the column stub face which substantially reduced the
bond stress in the region.
End column stub face
Middle joint face
ET-1ET-9 ET-5
ET-3
MT-3
MT-4
MT-1
MT-2
MB-5
MB-7
MB-1
MB-3
TP-1
TP-2
EB-1EB-3
EB-2EB-4
MB-6 MB-2
MB-8 MB-4
ET-2
ET-4ET-8
60
60
ET-10 ET-7
ET-6
60
B AC
DF E

CHAPTER 4 TESTS OF PRECAST SUB-ASSEMBLAGES WITH ECC
97
0 25 50 75 100 125 150 175 2000
8000
16000
24000
32000
40000
Stee
l stra
in (µ
ε)
Middle joint displacement (mm)
MB-6 MB-8 MB-2 MB-4
(a) At the middle joint
0 100 200 300 400 5000
2000
4000
6000
8000
10000
Stee
l stra
in (µ
ε)
Middle joint displacement (mm)
ET-1 ET-3 ET-5 ET-7 ET-9 ET-10
(b) At the end column stub
0 100 200 300 400 5000
1500
3000
4500
6000
7500
Stee
l stra
in (µ
ε)
Middle column displacement (mm)
TP-1 TP-2
(c) 300 mm from the end column stub
Fig. 4.17: Variations of steel strains in EMJ-L-1.19/0.59
Strain gauges TP-1 and TP-2 were used to measure the strains at a section 300 mm
away from the end column stub face (section C), as shown in Fig. 4.16. Fig. 4.17(c)
shows the readings of TP-1 and TP-2. Similar to conventional concrete sub-
assemblages discussed in Section 3.4.7, steel strains levelled off with values less than
the yield strain of reinforcement after the formation of a major crack at CAA stage.
Nevertheless, the strains increased slowly even after the onset of catenary action in
EMJ-L-1.19/0.59, indicating that at section C, 300 mm away from the end column
stub face, ECC remained at its multi-cracking stage and was effective in sustaining
tensile stresses. When final failure occurred, the maximum tensile strain at section C
was around 0.7%, as shown in Fig. 4.17(c), much smaller than the calculated tensile
strain capacity of ECC in Table 4.3.
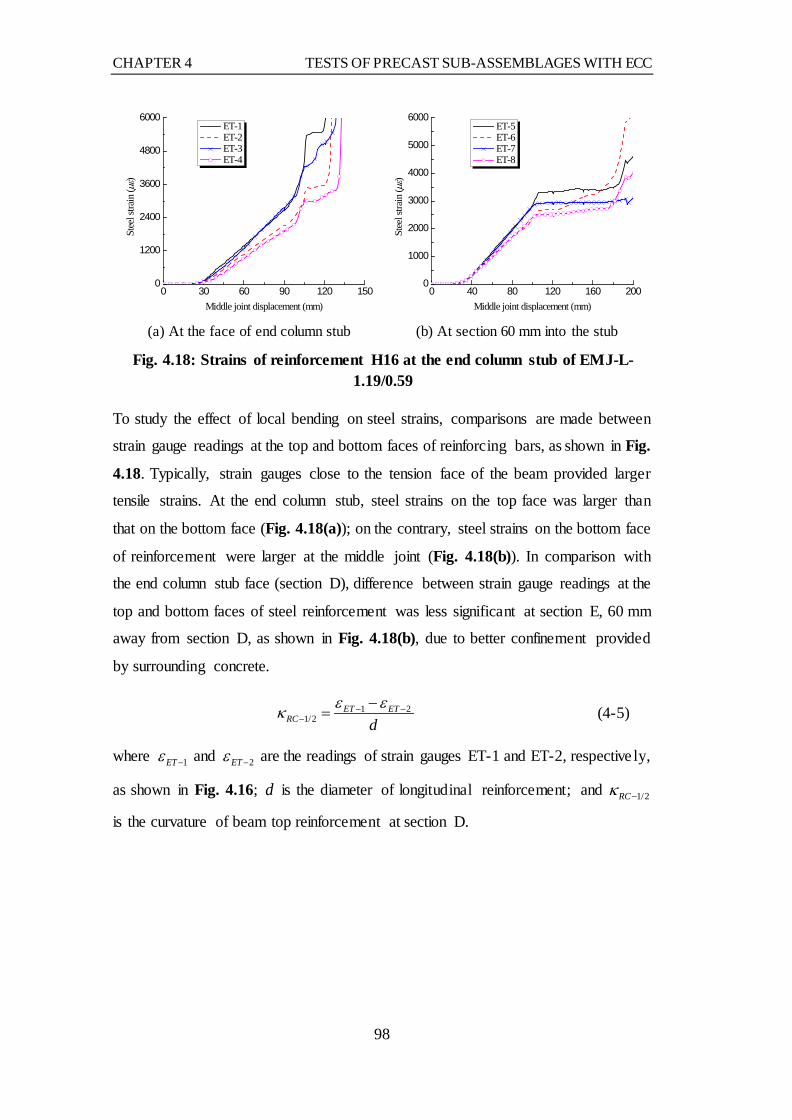
CHAPTER 4 TESTS OF PRECAST SUB-ASSEMBLAGES WITH ECC
98
0 30 60 90 120 1500
1200
2400
3600
4800
6000St
eel s
train
(µε)
Middle joint displacement (mm)
ET-1 ET-2 ET-3 ET-4
(a) At the face of end column stub
0 40 80 120 160 2000
1000
2000
3000
4000
5000
6000
Stee
l stra
in (µ
ε)
Middle joint displacement (mm)
ET-5 ET-6 ET-7 ET-8
(b) At section 60 mm into the stub
Fig. 4.18: Strains of reinforcement H16 at the end column stub of EMJ-L-1.19/0.59
To study the effect of local bending on steel strains, comparisons are made between
strain gauge readings at the top and bottom faces of reinforcing bars, as shown in Fig.
4.18. Typically, strain gauges close to the tension face of the beam provided larger
tensile strains. At the end column stub, steel strains on the top face was larger than
that on the bottom face (Fig. 4.18(a)); on the contrary, steel strains on the bottom face
of reinforcement were larger at the middle joint (Fig. 4.18(b)). In comparison with
the end column stub face (section D), difference between strain gauge readings at the
top and bottom faces of steel reinforcement was less significant at section E, 60 mm
away from section D, as shown in Fig. 4.18(b), due to better confinement provided
by surrounding concrete.
1 21/2
ET ETRC d
ε εκ − −−
−= (4-5)
where 1ETε − and 2ETε − are the readings of strain gauges ET-1 and ET-2, respective ly,
as shown in Fig. 4.16; d is the diameter of longitudinal reinforcement; and 1/2RCκ −
is the curvature of beam top reinforcement at section D.

CHAPTER 4 TESTS OF PRECAST SUB-ASSEMBLAGES WITH ECC
99
0 40 80 120 160 2000.00
0.01
0.02
0.03
0.04
0.05
Curv
ature
of s
teel b
ars (
mm
-1)
Middle joint displacement (mm)
RC-1/2 RC-3/4 RC-5/6 RC-7/8
(a) H16 in EMJ-L-1.19/0.59
0 40 80 120 160 2000.00
0.01
0.02
0.03
0.04
0.05
Curv
ature
of s
teel b
ars (
mm
-1)
Middle joint displacement (mm)
RC-1/2 RC-3/4 RC-5/6 RC-7/8
(b) H13 in EMJ-L-0.88/0.59
Fig. 4.19: Curvatures of steel bars along the embedment length
The effect of local bending on reinforcement strains can also be demonstrated by the
curvature of reinforcement at specific sections, as calculated from Eq. (4-5). Fig. 4.19
shows the curvatures of rebars at sections D and E for H16 and H13. The notation
RC-1/2 represents the curvature of rebar calculated from the readings of strain gauges
ET-1 and ET-2. Generated by bending moment at the end column stub, the rebar
curvature attained the maximum value at section D and decreased along the
embedment length into the end column stub. Thus, it is different from dowel action
of steel bars subjected to shear and tension (Soltani and Maekawa 2008), in which
the rebar curvature is zero at the crack plane. With increasing middle joint
displacement, the curvature of reinforcement at section D kept increasing, whereas
the curvature at section E started decreasing after attaining the maximum value, as
shown in Figs. 4.19(a and b). The reduction of rebar curvature at section E was due
to the increase in strains at the bottom face of steel bars, as shown in Fig. 4.18(b). At
middle joint displacements larger than 120 mm, steel strains of ET-6 and ET-8 started
surpassing those of ET-5 and ET-7, leading to the reduced curvature at section E.
Fundamentally, the variation in curvature might result from inelastic behaviour and
local crushing of the supporting concrete under the rebars (Soltani and Maekawa
2008). Comparisons can also be made between the curvatures of reinforcing bars H16
and H13, as shown in Figs. 4.19(a and b). As for reinforcing bars H16 and H13,
curvatures at section D were close to each other at the same middle joint displacement.
However, curvatures of H13 at section E (60 mm into the end column stub) was
substantially larger compared to H16. It indicates that by increasing the diameter of
CHAPTER 4 TESTS OF PRECAST SUB-ASSEMBLAGES WITH ECC
100
steel reinforcement, the effect of local bending on the curvature of reinforcement
became insignificant along the embedment length of reinforcement when the same
middle joint displacement was attained.
4.9 Conclusions
This paper presents the experimental study on six precast beam-column sub-
assemblages under column removal scenarios. Conventional concrete and ductile
ECC were used in the sub-assemblages. Besides, the effects of reinforcement
detailing in the joint and beam longitudinal reinforcement ratios were also
investigated in the experimental programme. The following conclusions are drawn
based on the test results.
(1) Significant CAA developed in the bridging beam of sub-assemblages subject to
column loss. Horizontal compression force in the beam increased the moment
resistance of beam end sections at the CAA stage. However, only CMJ-B-1.19/0.59
and EMJ-B-1.19/0.59 mobilised higher catenary action than CAA to resist
progressive collapse.
(2) Compared to concrete sub-assemblage CMJ-B-1.19/0.59, nearly the same CAA
and catenary action capacities were obtained for EMJ-B-1.19/0.59 with ECC in
structural topping and the beam-column joints. Thus, ECC did not significant ly
increase the resistance of EMJ-B-1.19/0.59 under column removal scenarios.
(3) Approximately the same CAA capacities were obtained for beam-column sub-
assemblages with 90o bend and lap-splice of beam bottom reinforcement in the
middle beam-column joint (i.e. EMJ-B-1.19/0.59 versus EMJ-L-1.19/0.59, EMJ-B-
0.88/0.59 versus EMJ-L-0.88/0.59). However, sub-assemblages EMJ-L-1.19/0.59
and EMJ-L-0.88/0.59 with lap-spliced bottom reinforcement developed greater
horizontal compression forces at the CAA stage. At the catenary action stage, the
effect of reinforcement detailing on the capacity of sub-assemblages changed with
the top reinforcement ratio in the bridging beam.
(4) With lower top reinforcement ratios in the beam, the CAA capacities of EMJ-B-
0.88/0.59 and EMJ-L-0.88/0.59 were reduced by 8% and 9%, respectively, compared
to EMJ-B-1.19/0.59 and EMJ-L-1.19/0.59. Moreover, the catenary action capacity of

CHAPTER 4 TESTS OF PRECAST SUB-ASSEMBLAGES WITH ECC
101
the sub-assemblages was substantially reduced due to premature fracture of beam top
reinforcement near the end column stub.
(5) Interactions between steel reinforcement and ECC were observed with increasing
middle joint displacement. At the initial stage, closely-spaced hairline cracks with
limited crack width developed along the ECC topping of beam-column sub-
assemblages. Beam longitudinal reinforcing bars and ECC sustained tensile stresses
and deformed in a compatible manner. Beyond the tensile strain capacity of ECC, a
single major crack was formed in the plastic hinge region near the end column stub,
which resulted in premature fracture of top reinforcement and hindered the full
development of catenary action in the sub-assemblages.
(6) Development of catenary action in the bridging beam imposes a greater demand
on the rotation capacity of plastic hinge. However, the formation of a single major
crack caused localised rotation of beam-column sub-assemblages in a limited region,
especially when the top reinforcement ratio in the beam was relatively low. Besides,
a higher toughness of ECC in tension prevented development of flexural deformation
in the beam, thereby reducing the deformation capacity of sub-assemblages with ECC
topping. Therefore, practical applications of ECC for missing column scenarios are
rather limited.
Challenges still exist in the interactions of reinforcement and ECC. Bond stress of
steel reinforcement embedded in ECC has not yet been quantified after the formation
of a major crack in the plastic hinge region. Thus, pull-out tests on steel bars with
short and long embedment lengths are necessary to determine the bond stresses at the
elastic and post-yield stages of reinforcing bars. Besides, ECC sustains tensile
stresses compatibly with steel reinforcement and exhibits multi-cracking behaviour
at relatively small displacement. At the multi-cracking stage, the compatible
deformation between ECC and reinforcement may be different from that of embedded
reinforcement subjected to pull-out force. Therefore, reinforced ECC members under
uniaxial tension need to be tested as well to investigate the bond stress between ECC
and reinforcement before the tensile strain capacity of ECC is exhausted.

CHAPTER 4 TESTS OF PRECAST SUB-ASSEMBLAGES WITH ECC
102

CHAPTER 5 EXPERIMENTAL STUDY ON PRECAST CONCRETE FRAMES
103
CHAPTER 5 EXPERIMENTAL STUDY ON PRECAST
CONCRETE FRAMES WITH DIFFERENT HORIZONTAL
RESTRAINTS
5.1 Introduction
In beam-column sub-assemblage tests, the bridging double-span beam over the
column removal was extracted from a precast concrete structure and tested under
quasi-static loads with enlarged column stubs erected at the two ends. Only rigid
horizontal restraints were utilised to arrest the horizontal movement and rotation of
the end column stubs. Nonetheless, development of compressive arch action (CAA)
and catenary action highly relies on boundary conditions (Park and Gamble 2000; Yu
and Tan 2013a). Rigid restraints may lead to significant overestimation of structura l
resistance of beam-column sub-assemblages. Furthermore, axial compression and
tension forces in the bridging beam subjected to CAA and catenary action possibly
induce flexural and shear failure to adjacent columns (Choi and Kim 2011; Yi et al.
2008; Yu 2012), which in turn hinders the full mobilisation of CAA and catenary
action. Therefore, experimental tests are needed to evaluate the behaviour of precast
concrete frames under column removal, in which side columns are designed and
erected adjacent to the bridging beam.
This chapter describes experimental tests on four precast concrete frames, in which
different horizontal restraints connected to side columns and reinforcement detailing
in the beam-column joint were taken into consideration. Structural resistances and
deformation capacities of the precast concrete frames were determined in the
experimental tests. Dominant factors that affect the behaviour of precast columns and
beam-column joints under column removal scenarios were studied. Besides, load
paths of horizontal reaction force to the support were analysed at CAA and catenary
action stages. Special attention was paid to the behaviour of side columns subjected
to CAA and catenary action.

CHAPTER 5 EXPERIMENTAL STUDY ON PRECAST CONCRETE FRAMES
104
5.2 Test Programme
In accordance with the boundary condition of planar frames, interior and exterior
frames are categorised in a building structure. In the interior frame, beams from the
adjacent span are connected to side columns, thereby providing a certain level of
horizontal restraints against lateral deflections of the columns. By contrast, side
columns in the exterior frame are free of horizontal restraints at the beam level.
Different behaviour of the side columns in the interior and exterior frames is expected
when subjected to CAA and catenary action in the beam. In the experimenta l
programme, both the interior and exterior precast concrete frames were tested so as
to investigate the influence of boundary conditions on the frame behaviour.
5.2.1 Frame design and detailing
A prototype precast concrete structure was designed for gravity loads in accordance
with Eurocode 2 (BSI 2004), and was scaled down to one-half model, as presented in
Section 3.2.1. Precast concrete frames, with 300 mm deep by 150 mm wide beams
and 250 mm square columns, were extracted from the perimeter of the structure. The
clear span of each beam was 2.75 m, and the column height was 2.35 m. Hogging
moment and shear resistances of beam sections were calculated accordingly. As
precast beam units were prefabricated ahead of cast-in-situ structural topping and
beam-column joints, a horizontal interface existed between the precast units and
structural topping. Complying to Eurocode 2 (BSI 2004), the interface was
intentionally roughened to 3 mm deep so as to prevent potential delamination across
the interface. Closely-spaced stirrups, with 8 mm diameter at 80 mm spacing, were
also arranged uniformly along the whole beam length and protruded from the top face
of the precast beam units. Top longitudinal reinforcement was enclosed in the stirrups,
as specified by Van Acker (2013). As for precast columns, continuous longitudina l
reinforcement, confined by stirrups with 8 mm diameter at 100 mm spacing, passed
through the beam-column joint and was welded to the steel plate at the end of the
column.
Two types of beam bottom reinforcement detailing, namely, 90o bend and lap-splice,
were utilised in the beam-column joint region. 90o bend of bottom reinforcement

CHAPTER 5 EXPERIMENTAL STUDY ON PRECAST CONCRETE FRAMES
105
projected from the end of the beam units (see Fig. 5.1(a)) has been widely used in
precast concrete structures (FIB 2002). As for lap-spliced bottom reinforcement in
the middle joint, similar to the practice recommended by (FIB 2003), a U-shaped
trough was cast at each end of the beam unit, and its length depends on the required
embedment length of bottom rebars, as shown in Fig. 5.1(b). The inner face of the
trough was intentionally roughened to increase the interface shear resistance with
cast-in-situ concrete topping. On top of longitudinal bars anchored in the beam-
column joint, horizontal hoops were placed in the joint region. The diameter and
spacing of horizontal hoops remained identical to those in side columns.
Table 5.1: Details of precast concrete frames
Specimen Beam Column
Location Joint detailing TRR* BRR* Stirrup LR§ Stirrup
IF-B-0.88-0.59 90o bend
0.88% (3H13)
0.59% (2H13) R8@80 1.70%
(8H13) R8@100
Interior
IF-L-0.88-0.59 Lap-splice Interior
EF-B-0.88-0.59 90o bend Exterior
EF-L-0.88-0.59 Lap-splice Exterior *: TRR and BRR represent respective top and bottom reinforcement ratios in the beam; §: LR represents longitudinal reinforcement ratio of the column.
In all the four frames, the cross sections of the double-span beam and precast column
remained identical, but reinforcement detailing in the joint and boundary conditions
of the columns were changed. Table 5.1 summarises the joint detailing and the
boundary conditions of precast concrete frames. In the notations of specimens, the
alphabets “IF” and “EF” denote the respective interior and exterior frames, and “B”
and “L” represent the 90o bend and lap-splice of beam bottom reinforcement in the
joint. The last two numerals indicate the top and bottom reinforcement ratios of the
beam end sections joining the middle column, respectively. Fig. 5.1 shows the
geometry and reinforcement detailing of interior and exterior precast frames. Only
half of the frame specimen is shown due to symmetry. In comparison with interior
frames IF-B-0.88-0.59 and IF-L-0.88-0.59 (see Figs. 5.1(a and b)), the short beam
extension protruding beyond the side column was eliminated from exterior frames
EF-B-0.88-0.59 and EF-L-0.88-0.59. Both top and bottom reinforcing bars were
anchored into the side beam-column joint, but the joint detailing and reinforcement
ratio remained identical to those of interior frames, as shown in Figs. 5.1(c and d). It

CHAPTER 5 EXPERIMENTAL STUDY ON PRECAST CONCRETE FRAMES
106
is noteworthy that precast concrete components are hatched to be differentiated from
cast-in-situ concrete.
(a) IF-B-0.88-0.59
(b) IF-L-0.88-0.59
1175
875
2750250
150
150
B
B30
0
3H13
2H13
A-A150
7522
5 300
2H13
2H13
150
7522
5
1000 1000A
A
A
A
300
500
250
250
R8@100
R8@100
8H13
R8@80 R8@80
C C
B-B
C-C
1175
875
2750
250
150
150
B
B
300
3H13
2H13
150
7522
5 300
2H13
2H13
150
7522
5
1000 1000
2H13
A
A
A
A
300
500
250
250
R8@100
R8@100
8H13
R8@80 R8@80
A-A B-B
C-CC C

CHAPTER 5 EXPERIMENTAL STUDY ON PRECAST CONCRETE FRAMES
107
(c) EF-B-0.88-0.59
(d) EF-L-0.88-0.59
Fig. 5.1: Geometry and reinforcement detailing of precast concrete frames
To facilitate installation of horizontal restraints to the beam extension of interior
frames IF-B-0.88-0.59 and IF-L-0.88-0.59, four PVC pipes were embedded in the
beam extension, as shown in Figs. 5.1(a and b). PVC pipes were also installed on
the top of the side columns so as to connect the horizontal restraint. In the middle
column, two pipes were placed below and above the joint, as shown in Figs. 5.1(a-
d), so that restraints could be provided to prevent the middle joint from rotation after
rupture of bottom reinforcement only occurred on one interface of the middle joint.
1175
875
2750250
150
150
B
B
300
150
7522
5 300
150
7522
5
1000 1000A
A
A
A
250
250
300
3H13
2H13
R8@80
2H13
2H13
R8@80R8@100
R8@100
8H13
C C
A-A B-B
C-C
2750
B
B
300
3H13
2H13
150
7522
5 300
2H13
2H13
150
7522
5
1000 1000
2H13
A
A
A
A
250
250
R8@100
R8@100
8H13
R8@80 R8@80
1175
875
300
150
150
250
A-A B-B
C-C
C C

CHAPTER 5 EXPERIMENTAL STUDY ON PRECAST CONCRETE FRAMES
108
5.2.2 Test setup
Fig. 5.2(a) shows the test setup for interior precast concrete frames. Similar to the
rigs employed by Yu (2012), a horizontal load cell was connected to the precast
column, measured 200 mm from its top end, as shown in Fig. 5.3(a). At the bottom,
a pin support was designed with a load pin inserted underneath to measure the
horizontal reaction force. The distance between the centroid of the load pin and
bottom end of the side column was 190 mm, and the effective length of column
between the top load cell and bottom pin support was 2.34 m. Another horizonta l
restraint was applied to the beam extension of interior frames IF-B-0.88-0.59 and IF-
L-0.88-0.59, as shown in Fig. 5.3(b). Short steel columns and steel rollers were
provided to prevent the out-of-plane deflection of the bridging beams (see Fig. 5.3(c)),
and a rotational restraint was applied at the middle joint (Fig. 5.3(d)) to ensure
symmetrical bending if reinforcement fractured on one side only. The same test setup
was used for exterior frames EF-B-0.88-0.59 and EF-L-0.88-0.59, but without the
beam extensions and associated horizontal load cells, as shown in Fig. 5.2(b).
(a) Interior frames
Actuator
Reaction wall
Load cell Self-equilibrating system
A-frame
Pin support Rotational restraint
Out-of-plane restraint

CHAPTER 5 EXPERIMENTAL STUDY ON PRECAST CONCRETE FRAMES
109
(b) Exterior frames
Fig. 5.2: Test setup for precast concrete frames
In a realistic building structure subjected to gravity loads, axial compression force
exists in the supporting columns, and it affects the behaviour of the columns under
progressive collapse scenarios. To simulate the axial compression force, a self-
equilibrating system was installed on each side column, through which a hydraulic
jack was inserted in between the column and a thick steel plate connected by four
steel rods to the bottom pin support, as shown in Fig. 5.3(e). Prior to testing, an axial
stress of '0.3 cf , where 'cf is the cylinder compressive strength of concrete, was
applied to each side column and was kept constant in the course of loading the middle
joint.
(a) Horizontal restraint on column top
(b) Horizontal restraint on beam extension
Out-of-plane restraint Rotational
restraint Pin support
Self-equilibrating system
A-frame
Actuator
Reaction wall
Load cell
Beam extension
Load cell Load cell
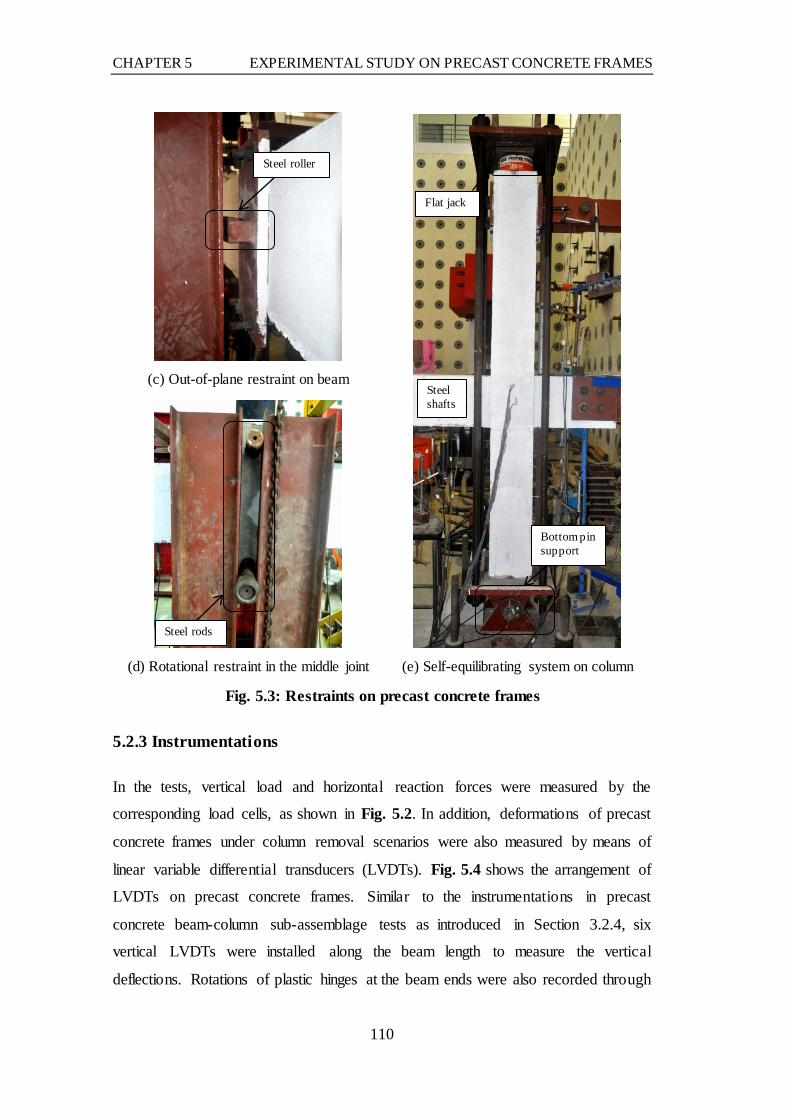
CHAPTER 5 EXPERIMENTAL STUDY ON PRECAST CONCRETE FRAMES
110
(c) Out-of-plane restraint on beam
(e) Self-equilibrating system on column
(d) Rotational restraint in the middle joint
Fig. 5.3: Restraints on precast concrete frames
5.2.3 Instrumentations
In the tests, vertical load and horizontal reaction forces were measured by the
corresponding load cells, as shown in Fig. 5.2. In addition, deformations of precast
concrete frames under column removal scenarios were also measured by means of
linear variable differential transducers (LVDTs). Fig. 5.4 shows the arrangement of
LVDTs on precast concrete frames. Similar to the instrumentations in precast
concrete beam-column sub-assemblage tests as introduced in Section 3.2.4, six
vertical LVDTs were installed along the beam length to measure the vertical
deflections. Rotations of plastic hinges at the beam ends were also recorded through
Steel roller
Bottom pin support
Flat jack
Steel rods
Steel shafts

CHAPTER 5 EXPERIMENTAL STUDY ON PRECAST CONCRETE FRAMES
111
four LVDTs in the plastic hinge regions. Under CAA and catenary action, side
columns and beam-column joints experienced significant deformations (Yi et al.
2008). Five horizontal LVDTs were installed along the column height to capture the
deformed profile of the side columns, and two diagonal LVDTs were mounted in the
side beam-column joint to measure the distortion of the joint, as shown in Fig. 5.4.
Fig. 5.4: Layout of LVDTs on precast concrete frames
5.3 Material Properties
Hot-rolled deformed steel bars with 13 mm diameter were used as the longitudina l
reinforcement in the frames, and mild steel with 8 mm diameter were used as stirrups.
For each type of steel reinforcement, tensile tests were conducted on three coupons
with 300 mm gauge length to obtain the stress-strain curves, as shown in Fig. 5.5(a).
As for concrete materials, three cylinders with 150 mm diameter by 300 mm height
were tested. Two aluminium rings at 100 mm spacing were fixed to the middle one-
third of each cylinder and three LVDTs were mounted between the rings to measure
the average compressive strain in this region. Fig. 5.5(b) shows the stress-strain
curves of concrete. It is noteworthy that precast beam and column units and the cast-
LS-1 LS-3
LS-2 LS-4
100
100
100
150 120Beam
Plastic hinge region
Column face
SD-5
575
400
300
400
665
Pin support
Top restraint
SD-4
SD-3
SD-2
SD-1
LB-1 LB-2 LB-3 LB-4 LB-5
LB-6
LS-1LS-3
LS-5LS-7
Middle joint
Sidecolumn
300 450 625 625 450
300
LJ-1
3523
035
35 180 35
LJ-1Side beam-column joint
Side column
Beam
LJ-2
LS-2LS-4
LS-6LS-8
52°
LJ-2

CHAPTER 5 EXPERIMENTAL STUDY ON PRECAST CONCRETE FRAMES
112
in-situ concrete (including structural topping and beam-column joints) were cast at
different times. Table 5.2 summarises the material properties of concrete and steel
reinforcement.
0.00 0.02 0.04 0.06 0.08 0.10 0.120
160
320
480
640
800
Stre
ss (M
Pa)
Strain
H13-Precast units H13-Beam top bars
(a) Reinforcement
0.000 0.004 0.008 0.012 0.016 0.0200
5
10
15
20
25
30
Stre
ss (M
Pa)
Strain
Precast units Cast-in-situ concrete
(b) Concrete
Fig. 5.5: Material stress-strain curves of reinforcement and concrete
Table 5.2: Material properties of concrete and reinforcement
Material Nominal diameter
(mm)
Yield strength (MPa)
Elastic modulus
(GPa)
Ultimate strength (MPa)
Fracture strain# (%)
Main bars H13 13 553.2 203.9 630.8 10.8
593.7* 202.2* 688.4* 12.0*
Stirrups R8 8 272.4 207.4 359.5 --
Concrete
Compressive strength (MPa)
Modulus of elasticity (GPa)
Splitting tensile strength (MPa)
Precast units 27.7 22.7 2.0 Cast-in-situ
concrete 26.9 25.8 2.1 *: Yield strength of longitudinal reinforcing bars used in the cast-in-situ concrete topping and beam-column joint of precast frames was 593.7 MPa, whereas yield strength of longitudinal reinforcement in the precast beam and column units was 553.2 MPa. #: Fracture strain refers to the average strain over a gauge length of 300 mm when steel reinforcement ruptures.
5.4 Experimental Results of Precast Concrete Frames
5.4.1 Load-displacement curves
Under displacement-controlled loading condition, vertical load applied onto the
middle beam-column joint was recorded by the built-in load cell of the servo-
hydraulic actuator. Simultaneously, horizontal reaction forces in the bottom pin

CHAPTER 5 EXPERIMENTAL STUDY ON PRECAST CONCRETE FRAMES
113
support and horizontal load cells were summed up to calculate the total horizonta l
reaction force. Fig. 5.6 and Fig. 5.7 show the vertical load-middle joint displacement
curves and the horizontal reaction force-middle joint displacement curves.
0 100 200 300 400 500 600 7000
20
40
60
80
100
120
Fracture of top barsat right end
Fracture of top barsat left end
Fracture of top bars
Verti
cal l
oad
(kN)
Middle joint displacement (mm)
IF-B-0.88-0.59 EF-B-0.88-0.59
(a) 90o bend of bottom bars
0 100 200 300 400 500 600 700
0
20
40
60
80
100
120 Fracture of top bars
Column failure
Fracture of top bars
Pull-out of bottom bar
Fracture of bottom bars
Verti
cal l
oad
(kN)
Middle joint displacement (mm)
IF-L-0.88-0.59 EF-L-0.88-0.59
(b) Lap-splice of bottom bars
Fig. 5.6: Vertical load-middle joint displacement curves of precast frames
0 100 200 300 400 500 600 700
-100
-50
0
50
100
150
200
250
300
CAA
Zero axial force
Horiz
ontal
reac
tion
forc
e (kN
)
Middle joint displacement (mm)
IF-B-0.88-0.59 EF-B-0.88-0.59
Catenary action
(a) 90o bend of bottom bars
0 100 200 300 400 500 600 700-100
-50
0
50
100
150
200
250
300
CAA
Zero axial force
Horiz
ontal
reac
tion
forc
e (kN
)
Middle joint displacement (mm)
IF-L-0.88-0.59 EF-L-0.88-0.59
Catenary action
(b) Lap-splice of bottom bars
Fig. 5.7: Horizontal reaction force-middle joint displacement curves of precast frames
Under single column removal scenarios, similar CAA developed in the interior and
exterior frames, as shown in Figs. 5.6(a and b), when the middle joint displacement
was less than 300 mm (one beam depth). With increasing middle joint displacement,
precast concrete frames IF-B-0.88-0.59 and EF-B-0.88-0.59 exhibited sequentia l
fracture of beam top longitudinal reinforcement in the vicinity of the side columns,
which reduced the hogging moment resistance of beam sections at the side column
interface, causing a reduction in the vertical load, as shown in Fig. 5.6(a). Meanwhile,
the measured horizontal tension force in the beam was also significantly reduced, as

CHAPTER 5 EXPERIMENTAL STUDY ON PRECAST CONCRETE FRAMES
114
shown in Fig. 5.7(a). As for exterior frame EF-L-0.88-0.59, beam top bars anchored
in the left column ruptured at catenary action stage, resulting in a drop of vertical
load, as shown in Fig. 5.6(b). However, tension reinforcement near the right column
remained intact until the beam axial tension force attained its maximum value.
Eventually, the axial force of beam decreased at a slow rate (see Fig. 5.7(b)) due to
crushing of concrete in the right column, leading to a gradual decrease of the vertical
load as well (Fig. 5.6(b)). Among the four precast concrete frames, significant
catenary action was only mobilised in interior frame IF-L-0.88-0.59 to redistribute
the vertical load through the tensile strength of the bridging beam, as shown in Fig.
5.6(b), with the catenary action capacity of 127.4 kN and the peak tension force of
283.1 kN in the beam.
Table 5.3 summarises the resistances and associated middle joint displacements of
precast concrete frames under column removal scenarios. CAA is characterised by
compression force in the bridging beam, whereas catenary action commences when
the net axial force across a section changes from compression to tension, as defined
by Yu and Tan (2010a). Capacities of CAA and catenary action correspond to the
maximum vertical loads at CAA and catenary action stages. The maximum horizonta l
compression force at the CAA stage and tension force at the catenary action stage are
also included.
Table 5.3: Resistances and deformations of precast concrete frames
Specimen Capacity of CAA
cP (kN)
MJD at cP
(mm)*
Max. axial compression
(kN)
Capacity of catenary action tP
(kN)
MJD at tP
(mm) *
Peak axial
tension (kN)
IF-B-0.88-0.59 66.3 76.1 -89.1 49.5 390.9 25.3
IF-L-0.88-0.59 65.6 69.0 -73.0 127.4 675.8 283.1
EF-B-0.88-0.59 67.9 191.1 -45.0 51.4 383.9 17.1
EF-L-0.88-0.59 65.9 95.0 -53.9 50.3 457.0 108.3 *: MJD represents middle joint displacement.
5.4.2 Effect of reinforcement detailing on frame behaviour
When subject to column removal scenarios, precast concrete frames IF-B-0.88-0.59
and IF-L-0.88-0.59 developed almost the same CAA capacities, as included in Table
5.3. Nonetheless, at catenary action stage, IF-L-0.88-0.59 behaved in a different

CHAPTER 5 EXPERIMENTAL STUDY ON PRECAST CONCRETE FRAMES
115
manner from IF-B-0.88-0.59. IF-L-0.88-0.59 was able to develop 1.57 times greater
catenary action capacity compared to IF-B-0.88-0.59 (see Table 5.3). The axial
tension force developed in the bridging beam of IF-L-0.88-0.59 was ten times greater
than that in IF-B-0.88-0.59. Similar results are obtained when a comparison is made
between the horizontal tension forces in exterior frames EF-B-0.88-0.59 and EF-L-
0.88-0.59.
Fig. 5.8: Neutral axis depth of beam sections at the face of the side column
The different behaviour of precast concrete frames with lap-splice and 90o bend of
beam bottom reinforcement in the joint was mainly due to the neutral axis depth of
the beam sections at the face of the side column which was in hogging moment. To
calculate the neutral axis depth, it is assumed that the top reinforcement had attained
its yield strength yf , and the bottom compression fibre had reached its crushing strain
cuε , when the maximum horizontal compression forces were obtained at the CAA
stage. Based on the plane-section assumption and the force equilibrium, as shown in
Fig. 5.8, the neutral axis depths for interior frames IF-B-0.88-0.59 and IF-L-0.88-
0.59 are calculated as 35 and 39 mm, respectively. In comparison with 90o bend of
longitudinal reinforcement, precast beams with lap-spliced bottom reinforcement
developed slightly deeper compression zone at the side column face.
Correspondingly, the distance between the neutral axis and top face of the beam was
smaller in IF-L-0.88-0.59, which delayed fracture of beam top reinforcement at
catenary action stage. Moreover, in IF-L-0.88-0.59, the neutral axis depth was smaller
than the distance (around 65 mm) between the centroid of bottom reinforcement and
beam bottom face, and the lap-spliced bottom reinforcement at the column face
0.85f 'c
f 'sb
f y
Nmax
Mu
Mid-depth axis
T
Csb
Cc
a sa' s εcu
εs
T slf 'sl
Lap-splicedbars
βcc
90o bend of bars
CHAPTER 5 EXPERIMENTAL STUDY ON PRECAST CONCRETE FRAMES
116
sustained tensile stress at the CAA stage, as shown in Fig. 5.8. It was equivalent to
additional tension reinforcement in the plastic hinge region. Therefore, the catenary
action capacity of IF-L-0.88-0.59 with lap-spliced bottom reinforcement was
significantly increased compared with IF-B-0.88-0.59 with 90o bend of bottom
reinforcement.
5.4.3 Effect of boundary conditions on frame behaviour
Interior and exterior frames exhibited approximately the same load resistance up to
their capacities of CAA, as shown in Figs. 5.6(a and b). Nonetheless, in the
descending branch of vertical load, less reduction in the vertical load was observed
when comparing exterior frame EF-B-0.88-0.59 with interior frame IF-B-0.88-0.59,
as shown in Fig. 5.6(a). The discrepancy in the descending branch of vertical load
was attributable to horizontal restraints to the precast concrete frames. With
horizontal load cells connected to the beam extensions on both sides of the frame (see
Fig. 5.2(a)), interior frame IF-B-0.88-0.59 developed larger compression force in the
beams than exterior frame EF-B-0.88-0.59, as shown in Fig. 5.7(a). In turn, larger
compression force at the CAA stage caused concrete in the compression zone to crush,
thereby reducing the moment resistance of beam sections. Consequently, the vertical
load on the middle joint of interior frames IF-B-0.88-0.59 were gradually reduced
beyond the capacities of CAA, as shown in Fig. 5.6(a).
5.4.4 Pseudo-static resistances of precast concrete frames
To consider dynamic effect under column removal scenarios, the energy balance
method proposed by Izzudin et al. (2008) could be used to quantify the pseudo-static
resistance of precast concrete frames. In the method, focus is placed on the maximum
dynamic response at each load level when the kinetic energy is reduced to zero. Thus,
the work done by the external load is equal to the internal energy absorbed by the
frames, as expressed in Eq. (5-1). At a vertical displacement du , internal energy (i.e.
( )0
duP u du∫ ) is calculated as the area under the quasi-static load-displacement curve,
as shown in Fig. 5.9(a). Correspondingly, the pseudo-static resistance ( dP ) at vertical
displacement du is determined by Eq. (5-1).

CHAPTER 5 EXPERIMENTAL STUDY ON PRECAST CONCRETE FRAMES
117
( )0
du
d dP u P u du⋅ = ∫ (5-1)
Figs. 5.9(a-d) show that the first pseudo-static resistance (point A) was substantia lly
lower compared to the quasi-static CAA capacity of frames. Dynamic increase factor
for precast concrete frames, which is defined as the ratio of the CAA capacity to the
first peak pseudo-static resistance (point A), fell in the range of 1.10 to 1.23. At
catenary action stage, only interior frame IF-L-0.88-0.59 developed significant ly
greater second peak load (point B) than the first peak load, as shown in Fig. 5.9(b).
Development of catenary action in IF-L-0.88-0.59 increased the first pseudo-static
resistance by 23.6%.
0 100 200 300 400 5000
20
40
60
80
Pd
Ps
BA
Verti
cal l
oad
(kN)
Middle joint displacement (mm)
Quasi-static resistance Pseudo-static resistance
(a) IF-B-0.88-0.59
0 100 200 300 400 500 600 7000
20
40
60
80
100
120
140
B
A
Ver
tical
load
(kN
)
Middle joint displacement (mm)
Quasi-static resistance Pseudo-static resistance
(b) IF-L-0.88-0.59
0 100 200 300 400 5000
20
40
60
80
A
Verti
cal l
oad
(kN)
Middle joint displacement (mm)
Quasi-static resistance Pseudo-static resistance
(c) EF-B-0.88-0.59
0 100 200 300 400 500 6000
20
40
60
80
BA
Verti
cal l
oad
(kN)
Middle joint displacement (mm)
Quasi-static resistance Pseudo-static resistance
(d) EF-L-0.88-0.59
Fig. 5.9: Pseudo-static load-middle joint displacement curves of precast concrete frames

CHAPTER 5 EXPERIMENTAL STUDY ON PRECAST CONCRETE FRAMES
118
Table 5.4: Pseudo-static resistances of precast concrete frames
Specimen First peak load
dcP at point A (kN)
Middle joint displacement at dcP (mm)
Second peak load dtP at point B (kN)
Middle joint displacement at dtP (mm)
dt dcP P
IF-B-0.88-0.59 55.6 178.1 56.6 341.9 1.018
IF-L-0.88-0.59 53.3 178.2 68.7 681.7 1.236
EF-B-0.88-0.59 61.8 342.0 -- -- --
EF-L-0.88-0.59 56.8 171.1 54.1 300.0 0.952
Comparisons are also made between the pseudo-static resistances of precast frames,
as shown in Table 5.4. Although slightly greater CAA capacities of interior frames
IF-B-0.88-0.59 and IF-L-0.88-0.59 were obtained under quasi-static loading
conditions compared to exterior frames EF-B-0.88-0.59 and EF-L-0.88-0.59 (see
Figs. 5.6(a and b)), the calculated first peak pseudo-static resistances of exterior
frames EF-B-0.88-0.59 and EF-L-0.88-0.59 are greater than those of interior frames
IF-B-0.88-0.59 and IF-L-0.88-0.59, as shown in Table 5.4. For instance, the capacity
of EF-B-0.88-0.59 under pseudo-static loading is 61.8 kN, 1.11 times greater than
that of IF-B-0.88-0.59. Similarly, EF-L-0.88-0.59 is able to sustain 1.07 times greater
first peak pseudo-static load than IF-L-0.88-0.59. In comparison with interior frames
IF-B-0.88-0.59 and IF-L-0.88-0.59, greater first peak pseudo-static resistances of
exterior frames EF-B-0.88-0.59 and EF-L-0.88-0.59 result from better energy
absorption capacities of exterior frames in the descending branch of quasi-static loads,
as shown in Figs. 5.6(a and b).
5.4.5 Load paths of horizontal reaction forces to the support
Horizontal reaction forces as shown in Fig. 5.7 represent the summation of horizonta l
forces measured by the horizontal restraint on the column top, the horizontal load cell
on the beam extension and bottom pin support (see Fig. 5.2). To investigate the load
path of horizontal forces to the support, Fig. 5.10 also shows the individual reading
of the load cells and pin support at one side column of the interior and exterior frames.
With respect to interior frame IF-B-0.88-0.59, when it was subjected to CAA, the
horizontal compression force was mainly sustained by the bottom pin support, and
the horizontal load cell connected to the beam extension only took up a small portion
of the compression force, as shown in Fig. 5.10(a). Similar results were obtained at

CHAPTER 5 EXPERIMENTAL STUDY ON PRECAST CONCRETE FRAMES
119
CAA stage of interior frame IF-L-0.88-0.59, as shown in Fig. 5.10(b). Once catenary
action kicked in, the horizontal load cell at the beam started sustaining a greater
portion of horizontal tension force, and the magnitude of reaction forces in the top
load cell and bottom pin support came close to one another (Fig. 5.10(b)), as tension
force in the beam was dominant over bending moment. Likewise, exterior frame EF-
B-0.88-0.59 transmitted the horizontal compression force to the pin support when
subjected to CAA (Fig. 5.10(c)). Under catenary action, the horizontal tension force
developed in the beam was transferred to the support in a different manner from
interior frame IF-L-0.88-0.59, as shown in Fig. 5.10(d). The top load cell carried a
major fraction of the total horizontal tension force, whereas the horizontal force in
the bottom pin support was substantially smaller in comparison with that in the top
load cell.
0 100 200 300 400 500-100
-80
-60
-40
-20
0
20
40
60
Horiz
ontal
reac
tion
forc
e (kN
)
Middle joint displacement (mm)
Load cell on column top Load cell on beam extension Bottom pin support of column Summation of horizontal forces
CAACatenary action
(a) IF-B-0.88-0.59
0 100 200 300 400 500 600 700-100
-50
0
50
100
150
200
250
300
Horiz
ontal
reac
tion
forc
es (k
N)
Middle joint displacement (mm)
Load cell on column top Load cell on beam extension Bottom pin support of column Summation of horizontal forces
CAA
Catenary action
(b) IF-L-0.88-0.59
0 100 200 300 400 500-60
-40
-20
0
20
40
60
Hor
izon
tal r
eact
ion
forc
es (k
N)
Middle joint displacement (mm)
Load cell on column top Bottom pin support of column Summation of horizontal forces
CAACatenary action
(c) EF-B-0.88-0.59
0 100 200 300 400 500 600-90
-60
-30
0
30
60
90
120
Horiz
ontal
reac
tion f
orce
s (kN
)
Middle joint displacement (mm)
Load cell on column top Bottom pin support of column Summation of horizontal forces
CAA
Catenary action
(d) EF-L-0.88-0.59
Fig. 5.10: Load paths of horizontal reaction forces to the support

CHAPTER 5 EXPERIMENTAL STUDY ON PRECAST CONCRETE FRAMES
120
5.4.6 Crack patterns and failure modes of precast beams
Among all four precast concrete frames, only IF-L-0.88-0.59 developed significant
catenary action under column removal scenarios, whereas the other frames only
mobilised CAA due to premature rupture of beam top reinforcement near the side
column. Correspondingly, different crack patterns and failure modes were observed
in the precast concrete frames, as summarised in Table 5.5.
Table 5.5: Failure modes of precast concrete frames
Specimen Middle joint Side column
IF-B-0.88-0.59 Pull-out of all beam bottom bars Rupture of beam top bars
IF-L-0.88-0.59 Rupture of one bottom bar, pull-
out of the other bottom bar Pull-out failure of bottom bars near right
column EF-B-0.88-0.59 Pull-out of all beam bottom bars Rupture of beam top bars
EF-L-0.88-0.59 Rupture of one bottom bar, pull-
out of the other bottom bar Rupture of beam top bar near left
column, flexural failure of right column
Frames IF-B-0.88-0.59 and EF-B-0.88-0.59, with 90o bend of beam bottom
reinforcement in the beam-column joint, developed similar crack patterns and failure
modes in bridging beams, as shown in Fig. 5.11 and Fig. 5.12. At the CAA stage,
cracks were only concentrated in the flexural tension zones of the beam. Bottom
longitudinal reinforcement in the beam was pulled out from the middle joint due to
insufficient embedment length. Thus, the applied vertical load varied smoothly at
CAA stage, as shown in Fig. 5.6(a). Eventually, top longitudinal reinforcement
ruptured at the face of the side column, which caused sudden drops of vertical load.
Following the rupture of top reinforcement, a pin was formed at the face of the side
column, and the vertical load could not increase any further, as shown in Fig. 5.6(a).
Fig. 5.11: Crack patterns and failure modes of IF-B-0.88-0.59
Left column
Middle joint
Crushing of concrete
Pull-out of rebars
Rupture of top bars

CHAPTER 5 EXPERIMENTAL STUDY ON PRECAST CONCRETE FRAMES
121
Fig. 5.12: Crack patterns and failure modes of EF-B-0.88-0.59
Precast frames IF-L-0.88-0.59 and EF-L-0.88-0.59 also exhibited similar failure
modes of embedded beam bottom reinforcement in the middle joint, as shown in Fig.
5.13 and Fig. 5.14. Only one bottom bar fractured at the middle joint interface,
whereas the other bar was pulled out from the joint. Fracture of beam bottom
reinforcement in the middle joint led to a sudden drop of vertical load at the CAA
stage (see Fig. 5.6(b)). Furthermore, after failure of bottom steel bars at one joint
interface, moment resistance at the opposite face of could be mobilised due to the
presence of rotational restraint in the middle joint. With increasing middle joint
displacements, a similar pull-out failure occurred at the opposite face of the middle
joint which reduced the vertical load prior to the commencement of catenary action,
as shown in Fig. 5.6(b).
Fig. 5.13: Crack patterns and failure modes of IF-L-0.88-0.59
Middle joint
Left column
Pull-out of rebars
Crushing of concrete
Fracture of rebars
Middle joint
Right column
Spalling of concrete
Pull-out of rebars
Crushing of concrete

CHAPTER 5 EXPERIMENTAL STUDY ON PRECAST CONCRETE FRAMES
122
Fig. 5.14: Crack patterns and failure modes of EF-L-0.88-0.59
Different crack patterns of the beam and failure modes at the side column interface
were observed in IF-L-0.88-0.59 and EF-L-0.88-0.59, as shown in Fig. 5.13 and Fig.
5.14. Interior frame IF-L-0.88-0.59 developed the highest catenary action capacity
among the four frames (see Table 5.3). Accordingly, remarkable cracking and
flexural deformations were observed in the bridging beam, as shown in Fig. 5.13.
Beam top reinforcement near the right column did not fracture. Instead, the lap-
spliced beam bottom reinforcement developed pull-out failure in the plastic hinge
region near the side column face. Correspondingly, the tension force in the beam was
reduced (see Fig. 5.7(b)). In exterior frame EF-L-0.88-0.59, beam top reinforcement
fractured at the left column face. Thereafter, axial tension dominated the beam
behaviour under catenary action. Full-depth tension cracks ran perpendicular to the
beam axis and distributed uniformly along the beam length, as shown in Fig. 5.14.
Eventually, the right column exhibited crushing of concrete in the region above the
right beam-column joint due to the horizontal tension force, and catenary action could
not be maintained due to excessive lateral deflections of the right column.
5.4.7 Behaviour of side columns and joints
Fig. 5.15 illustrates the crack patterns of side columns subjected to CAA and catenary
action. Under CAA, the horizontal compression force was mainly transferred to the
bottom pin support (see Fig. 5.10). Column sections below the side joint developed
flexural cracks at the outer face, as shown in Figs. 5.15(a-d). Diagonal shear cracks
were also observed in the side beam-column joint of EF-B-0.88-0.59, as shown in
Middle joint
Left column
Pull-out of rebars
Crushing of concrete
Spalling of concrete
Fracture of rebars

CHAPTER 5 EXPERIMENTAL STUDY ON PRECAST CONCRETE FRAMES
123
Fig. 5.15(c). These cracks were mainly initiated at around 150 mm middle joint
displacement, when the horizontal compression force attained its maximum value at
the CAA stage. With increasing middle joint displacement, the crack width remained
limited and the side beam-column joint did not develop shear failure due to the
presence of horizontal hoops in the joint.
At the catenary action stage, significant horizontal tension forces in IF-L-0.88-0.59
and EF-L-0.88-0.59 generated flexural cracks at the column face towards the middle
joint, as shown in Figs. 5.15(b and d). In specimens IF-B-0.88-0.59, IF-L-0.88-0.59
and EF-B-0.88-0.59, the side columns did not fail due to premature fracture of beam
top reinforcement at the side column face, or presence of horizontal restraints on the
beam extension. Only the right column of exterior frame EF-L-0.88-0.59 developed
flexural failure, characterised by crushing of concrete above the side beam-column
joint, as shown in Fig. 5.15(d). Following the column failure, excessive lateral
deflections of the side column hindered development of horizontal tension force, as
shown in Fig. 5.7(b).
(a) IF-B-0.88-0.59
(b) IF-L-0.88-0.59
Flexural cracks under CAA
Flexural cracks under CAA
Flexural cracks under catenary action
Left column Right column

CHAPTER 5 EXPERIMENTAL STUDY ON PRECAST CONCRETE FRAMES
124
(c) EF-B-0.88-0.59
(d) EF-L-0.88-0.59
Fig. 5.15: Crack patterns and failure modes of side columns
When subjected to CAA and subsequent catenary action, side columns developed
significant lateral deflections. Fig. 5.16 shows the deformed profiles of side columns.
In the sign convention, the negative value denotes outward deflection of the side
column relative to the middle joint, and the positive number represents inward
deflection towards the middle joint. Similar to the frame behaviour reported by Yi et
al. (2008), the side column was initially pushed outwards by the horizonta l
compression force under CAA, whereas it was pulled towards the middle joint by the
tension force under catenary action, as shown in Figs. 5.16(a-d). Interior frames IF-
B-0.88-0.59 and IF-L-0.88-0.59 and exterior frames EF-B-0.88-0.59 and EF-L-0.88-
0.59 attained almost the same negative deflections at the maximum horizonta l
compression force. Nonetheless, due to presence of horizontal restraint on the beam
extension, interior frame IF-L-0.88-0.59 only exhibited 7.5 mm positive deflections
at the peak horizontal tension force, as shown in Fig. 5.16(b). In EF-L-0.88-0.59, the
maximum lateral deflection was 15.7 mm due to flexural failure of the right column,
as shown in Fig. 5.16(d).
Diagonal shear cracks under CAA
Flexural cracks under CAA
Flexural cracks under CAA
Crushing of concrete under catenary action
Flexural cracks under catenary action
Left column Right column
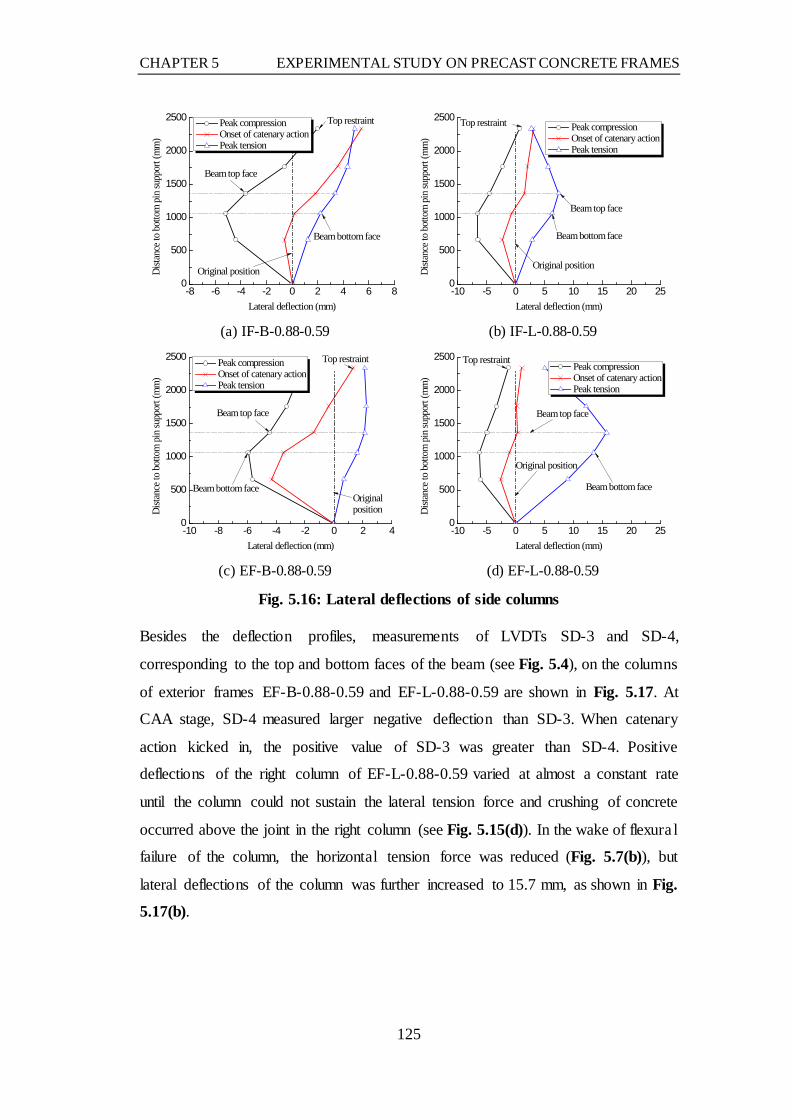
CHAPTER 5 EXPERIMENTAL STUDY ON PRECAST CONCRETE FRAMES
125
-8 -6 -4 -2 0 2 4 6 80
500
1000
1500
2000
2500
Dista
nce t
o bo
ttom
pin
supp
ort (
mm
)
Lateral deflection (mm)
Peak compression Onset of catenary action Peak tension
Original position
Beam top face
Top restraint
Beam bottom face
(a) IF-B-0.88-0.59
-10 -5 0 5 10 15 20 250
500
1000
1500
2000
2500
Dista
nce t
o bo
ttom
pin
supp
ort (
mm
)
Lateral deflection (mm)
Peak compression Onset of catenary action Peak tension
Beam top face
Original position
Top restraint
Beam bottom face
(b) IF-L-0.88-0.59
-10 -8 -6 -4 -2 0 2 40
500
1000
1500
2000
2500
Dista
nce t
o bo
ttom
pin
supp
ort (
mm
)
Lateral deflection (mm)
Peak compression Onset of catenary action Peak tension
Beam top face
Original position
Beam bottom face
Top restraint
(c) EF-B-0.88-0.59
-10 -5 0 5 10 15 20 250
500
1000
1500
2000
2500
Dista
nce t
o bo
ttom
pin
supp
ort (
mm
)
Lateral deflection (mm)
Peak compression Onset of catenary action Peak tension
Original position
Beam top face
Top restraint
Beam bottom face
(d) EF-L-0.88-0.59
Fig. 5.16: Lateral deflections of side columns
Besides the deflection profiles, measurements of LVDTs SD-3 and SD-4,
corresponding to the top and bottom faces of the beam (see Fig. 5.4), on the columns
of exterior frames EF-B-0.88-0.59 and EF-L-0.88-0.59 are shown in Fig. 5.17. At
CAA stage, SD-4 measured larger negative deflection than SD-3. When catenary
action kicked in, the positive value of SD-3 was greater than SD-4. Positive
deflections of the right column of EF-L-0.88-0.59 varied at almost a constant rate
until the column could not sustain the lateral tension force and crushing of concrete
occurred above the joint in the right column (see Fig. 5.15(d)). In the wake of flexura l
failure of the column, the horizontal tension force was reduced (Fig. 5.7(b)), but
lateral deflections of the column was further increased to 15.7 mm, as shown in Fig.
5.17(b).

CHAPTER 5 EXPERIMENTAL STUDY ON PRECAST CONCRETE FRAMES
126
0 100 200 300 400 500-10
-5
0
5
10
15
20
25
Original position
Colu
mn
defle
ctio
n (m
m)
Middle joint displacement (mm)
SD-3 SD-4
CAA
Catenary action
(a) EF-B-0.88-0.59
0 100 200 300 400 500 600
-10
-5
0
5
10
15
20
25
Column failureOriginal position
Colu
mn
defle
ctio
n (m
m)
Middle joint displacement (mm)
SD-3 SD-4
CAA
Catenary action
(b) EF-L-0.88-0.59
Fig. 5.17: Column deflection-middle joint displacement curves of exterior frames
On top of lateral deflections of the side column, shear behaviour of the side joint may
be instrumental to structural resistance of precast concrete frames. To quantify the
shear distortion of the side joint subjected to CAA, four steel threads were embedded
into the joint panel encased by beam and column reinforcement, on which a pair of
diagonal LVDTs LJ-1 and LJ-2 was installed, as shown in Fig. 5.4. At CAA stage, a
diagonal strut was formed by forces in the compression zones of the beam and side
column, as shown in Fig. 5.18(a). LJ-1 was shortened by the diagonal compression
force in the joint, whereas LJ-2 was elongated at CAA stage. This observation agrees
well with the crack pattern of the side joints, as shown in Fig. 5.15(c). To further
calculate the joint distortion from the LVDT measurements, the joint model proposed
by Youssef and Ghobarah (2001) is modified, as plotted in Fig. 5.18(b). In
accordance with the deformation compatibility condition of the joint panel, total shear
distortion γ is computed from Eq. (5-2).
( ) ( )
2 2
1 2 22 2 2 2 24 cos 2
a b
a b a bγ γ γ
θ
−= + =
+ − (5-2)
in which 12jl
a δ= + , 22jl
b δ= − . jl is the diagonal length of the joint panel; 1δ and
2δ are the deformations of the joint panel in the two directions.
SD-4
SD-3Joint
SD-4
SD-3Joint

CHAPTER 5 EXPERIMENTAL STUDY ON PRECAST CONCRETE FRAMES
127
(a) Actions in the side joint
(b) Joint model
0 100 200 300 400 5000.000
0.002
0.004
0.006
0.008
Join
t def
orm
ation
(rad
ian)
Middle joint displacement (mm)
Shear distortion Rigid body rotation
(c) EF-B-0.88-0.59
0 100 200 300 400 500 6000.000
0.002
0.004
0.006
0.008
Join
t def
orm
ation
(rad
ian)
Middle joint displacement (mm)
Shear distortion Rigid body rotation
(d) EF-L-0.88-0.59
Fig. 5.18: Shear distortion of side beam-column joints
In addition to the shear distortion, the rigid-body rotation of the side joint is calculated
as the difference between the readings of SD-3 and SD-4 (see Fig. 5.4) divided by
their vertical spacing, as expressed in Eq. (5-3). Figs. 5.18(c and d) show the
comparisons between the shear distortion and rigid-body rotation of the side joint in
exterior frames EF-B-0.88-0.59 and EF-L-0.88-0.59. In EF-B-0.88-0.59, the
maximum value of the shear distortion was only 0.0012 radian, around 24% of the
joint rotation at the same middle joint displacement. Thus, the shear distortion of the
side beam-column joint was insignificant compared to the rigid-body rotation under
column removal scenarios.
3 4SD SDr d
δ δθ − −−= (5-3)
Tb
Cb
TceCc
Vb
Vc
Tci
θ
δ1
δ2
δ2
δ1
l j
Originalshapeof joint Deformed
shape ofjoint
γ1
γ2
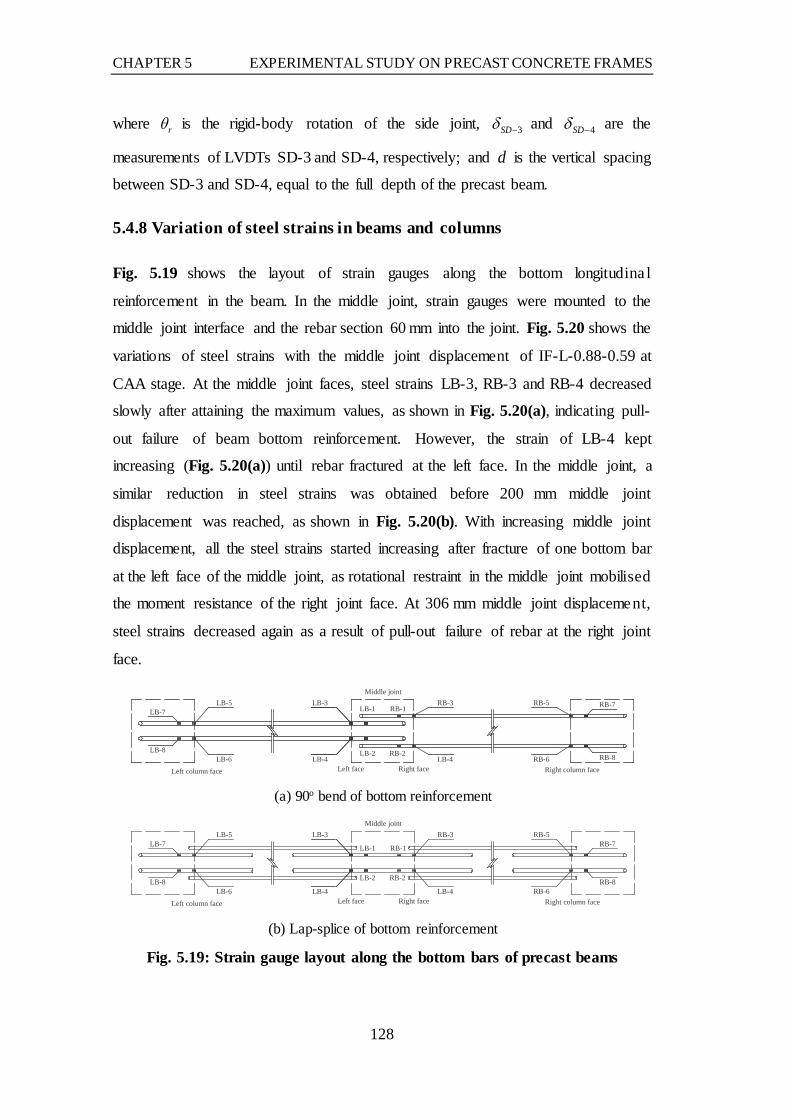
CHAPTER 5 EXPERIMENTAL STUDY ON PRECAST CONCRETE FRAMES
128
where rθ is the rigid-body rotation of the side joint, 3SDδ − and 4SDδ − are the
measurements of LVDTs SD-3 and SD-4, respectively; and d is the vertical spacing
between SD-3 and SD-4, equal to the full depth of the precast beam.
5.4.8 Variation of steel strains in beams and columns
Fig. 5.19 shows the layout of strain gauges along the bottom longitudina l
reinforcement in the beam. In the middle joint, strain gauges were mounted to the
middle joint interface and the rebar section 60 mm into the joint. Fig. 5.20 shows the
variations of steel strains with the middle joint displacement of IF-L-0.88-0.59 at
CAA stage. At the middle joint faces, steel strains LB-3, RB-3 and RB-4 decreased
slowly after attaining the maximum values, as shown in Fig. 5.20(a), indicating pull-
out failure of beam bottom reinforcement. However, the strain of LB-4 kept
increasing (Fig. 5.20(a)) until rebar fractured at the left face. In the middle joint, a
similar reduction in steel strains was obtained before 200 mm middle joint
displacement was reached, as shown in Fig. 5.20(b). With increasing middle joint
displacement, all the steel strains started increasing after fracture of one bottom bar
at the left face of the middle joint, as rotational restraint in the middle joint mobilised
the moment resistance of the right joint face. At 306 mm middle joint displacement,
steel strains decreased again as a result of pull-out failure of rebar at the right joint
face.
(a) 90o bend of bottom reinforcement
(b) Lap-splice of bottom reinforcement
Fig. 5.19: Strain gauge layout along the bottom bars of precast beams
RB-5
RB-6Right column face
RB-3
LB-4
LB-3
LB-4
LB-5
LB-6Left column face
LB-7
LB-8
RB-7
RB-8
LB-1 RB-1
LB-2 RB-2
Right face
Middle joint
Left face
RB-5
RB-6Right column face
RB-3
LB-4
LB-3
LB-4
LB-5
LB-6Left column face
LB-7
LB-8
RB-7
RB-8
LB-1 RB-1
LB-2 RB-2
Right face
Middle joint
Left face

CHAPTER 5 EXPERIMENTAL STUDY ON PRECAST CONCRETE FRAMES
129
0 50 100 150 200 250 300 350 400
0
10000
20000
30000
40000
50000
60000
RB-4
RB-3
LB-4
LB-3
Pull-out failure
Shea
r lin
k str
ain
(µε)
Middle joint displacement (mm)
Pull-out of rebars
(a) At the middle joint face
0 50 100 150 200 250 300 350 4000
800
1600
2400
3200
4000RB-1
RB-1LB-2
LB-1 Increase due to rotational restraint
Pull-out of rebar
Shea
r lin
k str
ain ( µ
ε)
Middle joint displacement (mm)
Rupture of steel bar
(b) In the middle joint
Fig. 5.20: Variations of steel strains in the middle beam-column joint of IF-L-0.88-0.59
Fig. 5.21 shows the strains of beam bottom reinforcement at the face of the side
column. Similar to the beam-column sub-assemblages in Section 3.4.7, bottom
reinforcement at the column face of IF-B-0.88-0.59 and EF-B-0.88-0.59 sustained
compressive stress at CAA stage, as shown in Figs. 5.21(a and c). However, in IF-
L-0.88-0.59 and EF-L-0.88-0.59, bottom bars near the side column were subjected to
tension at the CAA and catenary action stages, as shown in Figs. 5.21(b and d), due
to limited neutral axis depth at the beam end and relatively large distance between
the lap-spliced bottom bars and the extreme compression fibre of the beam. Simila r
to the effect of a middle layer of steel bars as tension reinforcement (Yu and Tan
2014), the two lap-spliced bottom bars helped to improve the rotational capacity of
the plastic hinge near the side column, and enhanced the catenary action of precast
frame IF-L-0.88-0.59. Prior to failure, steel strains RB-7 and RB-8 in the right column
of IF-L-0.88-0.59 decreased dramatically, as shown in Fig. 5.21(b), indicating pull-
out failure of the lap-spliced beam bottom bars.

CHAPTER 5 EXPERIMENTAL STUDY ON PRECAST CONCRETE FRAMES
130
0 100 200 300 400 500
-2000
-1000
0
1000
2000
3000
4000St
eel s
train
(µε)
Middle joint displacement (mm)
RB-5 RB-6 RB-7 RB-8
(a) IF-B-0.88-0.59
0 100 200 300 400 500 600 7000
2000
4000
6000
8000
10000
12000
Shea
r lin
k str
ain
(µε)
Middle joint displacement (mm)
RB-5 RB-6 RB-7 RB-8
Pull-out failure
(b) IF-L-0.88-0.59
0 100 200 300 400 500-2000
-1000
0
1000
2000
3000
4000
Stee
l stra
in (µ
ε)
Middle joint displacement (mm)
RB-7 RB-8
(c) EF-B-0.88-0.59
0 100 200 300 400 500 600
0
1000
2000
3000
4000
5000
Shea
r lin
k str
ain (µ
ε)
Middle joint displacement (mm)
RB-5 RB-6 RB-7 RB-8
(d) EF-L-0.88-0.59
Fig. 5.21: Strains of beam bottom reinforcement embedded in the right column
Fig. 5.22 shows the arrangement of strain gauges on the longitudinal reinforcement
and horizontal hoops of the right column. All measurements were initialised to zero
prior to testing to eliminate the effect of axial compression force in the side columns,
and only steel strains generated by bending moment were recorded. Fig. 5.23 depicts
the variations of steel strains at the selected locations corresponding to the top and
bottom faces of the beam. In interior frame IF-L-0.88-0.59, RC-4 monitored the
tensile strain of steel reinforcement at CAA stage, with its maximum value smaller
than the yield strain, whereas strain gauges RC-1, RC-2 and RC-3 were subjected to
compression, as shown in Fig. 5.23(b). The onset of catenary action transformed the
strains of RC-1 and RC-3 from compression to tension, but the strain of RC-4 was
shifted from tension to compression. Eventually, steel bars RS1 and RS2 were
subjected to tension and compression, respectively, due to the axial tension force in
the beam. Exterior frame EF-L-0.88-0.59 exhibited similar variation of strains of

CHAPTER 5 EXPERIMENTAL STUDY ON PRECAST CONCRETE FRAMES
131
column longitudinal reinforcement, as shown in Fig. 5.23(d). However, RC-2 carried
tensile stress at CAA stage, due to a lack of horizontal restraint on the side beam-
column joint. Similar variations of steel strains to IF-L-0.88-0.59 and EF-L-0.88-0.59
were also recorded in IF-B-0.88-0.59 and EF-B-0.88-0.59, as shown in Figs. 5.23(a
and c).
Fig. 5.22: layout of strain gauges in side beam-column joint
0 100 200 300 400 500-2000
-1000
0
1000
2000
3000
Shea
r lin
k str
ain
(µε)
Middle joint displacement (mm)
RC-1 RC-2 RC-3 RC-4
(a) IF-B-0.88-0.59
0 100 200 300 400 500 600 700-2000
-1000
0
1000
2000
3000
Shea
r lin
k str
ain
(µε)
Middle joint displacement (mm)
RC-1 RC-2 RC-3 RC-4
(b) IF-L-0.88-0.59
100
100
100
RC-3
RC-1
RC-4
RC-2
RS1 RS2Towards middlejoint
Right column
RCS-2
RCS-1

CHAPTER 5 EXPERIMENTAL STUDY ON PRECAST CONCRETE FRAMES
132
0 100 200 300 400 500-2000
-1000
0
1000
2000
3000Sh
ear l
ink
strai
n (µ
ε)
Middle joint displacement (mm)
RC-1 RC-2 RC-3 RC-4
(c) EF-B-0.88-0.59
0 100 200 300 400 500 600-2000
-1000
0
1000
2000
3000
Shea
r lin
k str
ain
(µε)
Middle joint displacement (mm)
RC-1 RC-2 RC-4
(d) EF-L-0.88-0.59
Fig. 5.23: Variations of reinforcement strains in side columns
Strains of horizontal hoops in the side joint were also measured through strain gauges,
as shown in Fig. 5.24. In the notations, “RCS-1” and “RCS-2” represent strain gauges
on the horizontal hoops in the right joint, as depicted in Fig. 5.22, and “LCS-1” and
“LCS-2” correspond to strain gauges in the left joint. Interior frames IF-B-0.88-0.59
and IF-L-0.88-0.59 exhibited similar variations of strains of horizontal hoops in the
joint, as shown in Figs. 5.24(a and b). With minor diagonal cracking in the joint zone
(see Figs. 5.15(a and b)), horizontal hoops only sustained limited tensile strains
under CAA. At catenary action stage, LCS-1 and LCS-2 in IF-L-0.88-0.59 increased
simultaneously as a result of horizontal tension force transmitted to the joint, as
shown in Fig. 5.24(b). Exterior frame EF-B-0.88-0.59 developed significant shear
cracking in the side joint. At about 60 mm middle joint displacement, tensile strains
of horizontal hoops started increasing, as shown in Fig. 5.24(c), indicating formation
of shear cracks in the joint. Following diagonal cracking in the side joint, strains of
horizontal hoops increased slowly. However, the horizontal hoops did not reach their
yield strain and remained largely at the elastic stage up to failure. Therefore, in spite
of shear cracking, the side joint was able to resist the shear force at CAA stage. In
EF-L-0.88-0.59, tension force in the beam also increased the strain of RCS-1, but
slightly reduced that of RCS-2, as shown in Fig. 5.24(d).

CHAPTER 5 EXPERIMENTAL STUDY ON PRECAST CONCRETE FRAMES
133
0 100 200 300 400 500-300
0
300
600
900
1200
Shea
r lin
k str
ain (µ
ε)
Middle joint displacement (mm)
LCS-1 LCS-2 RCS-1 RCS-2
(a) IF-B-0.88-0.59
0 100 200 300 400 500 600 700
-300
0
300
600
900
1200
Shea
r lin
k str
ain (µ
ε)
Middle joint displacement (mm)
LCS-1 LCS-2 RCS-1 RCS-2
(b) IF-L-0.88-0.59
0 100 200 300 400 500
-500
0
500
1000
1500
2000
2500
3000
Shea
r lin
k str
ain (µ
ε)
Middle joint displacement (mm)
LCS-1 LCS-2 RCS-1 RCS-2
(c) EF-B-0.88-0.59
0 100 200 300 400 500 600-250
0
250
500
750
1000
1250
1500
Shea
r lin
k str
ain (µ
ε)
Middle joint displacement (mm)
LCS-1 LCS-2 RCS-1 RCS-2
(d) EF-L-0.88-0.59
Fig. 5.24: Strains of horizontal hoops in side joint zone
5.5 Summary
In the experimental programme, four precast concrete frames were tested under
quasi-static loads to investigate structural resistances and deformation capacities
under middle column removal scenarios. 90o bend and lap-splice of beam bottom
reinforcement were utilised in the middle and side beam-column joints. Apart from
the joint detailing, the effect of boundary conditions on the behaviour of precast
concrete frames was studied experimentally. Conclusions are drawn from
experimental results as follows:
(1) Under quasi-static loading conditions, similar behaviour of precast concrete
frames was obtained at CAA stage, with approximately the same capacities of CAA
for all four frames. However, the catenary action capacities of frames varied greatly
as a result of different reinforcement detailing and horizontal restraints.

CHAPTER 5 EXPERIMENTAL STUDY ON PRECAST CONCRETE FRAMES
134
(2) Compared with 90o bend of beam bottom reinforcement, lap-spliced
reinforcement in the joint enabled the development of greater catenary action in
precast concrete frames, in particular for IF-L-0.88-0.59. Strain gauge readings of
beam longitudinal reinforcement indicate that even the lap-spliced bottom
reinforcement at the right column face was subjected to tension due to limited neutral
axis depth, which substantially enhanced the rotational capacity of the beam plastic
hinge near the side joint.
(3) Exterior frames EF-B-0.88-0.59 and EF-L-0.88-0.59 developed less significant
catenary action than interior frames IF-B-0.88-0.59 and IF-L-0.88-0.59 due to either
premature fracture of beam top longitudinal reinforcement at the side column face
(i.e. EF-B-0.88-0.59), or flexural failure of the side column (i.e. EF-L-0.88-0.59).
(4) Exterior frames EF-B-0.88-0.59 and EF-L-0.88-0.59 develop greater pseudo-
static load resistances at CAA stage than interior frames IF-B-0.88-0.59 and IF-L-
0.88-0.59, due to better energy absorption capacities in the descending branch of
vertical loads at CAA stage.
(5) The side column experienced significant lateral deflections and cracking at CAA
and catenary action stages. However, only the right column of exterior frame EF-L-
0.88-0.59 developed flexural failure under catenary action. Significant shear cracks
were observed in the side beam-column joint of EF-B-0.88-0.59, but horizontal hoops
remained in elastic stage until final failure occurred. At the CAA stage, shear
distortion of the side joint was insignificant in comparison with the rigid-body
rotation of the joint.
In accordance with experimental results, lap-splice of beam bottom reinforcement in
the joint is recommended for use in precast concrete structures against progressive
collapse. To enable the full development of catenary action in exterior frames, the
side column and beam-column joint have to be prevented from potential flexural and
shear failures at large deformations. Thus, further experimental tests on exterior
precast concrete frames are necessary to study the behaviour of side columns under
progressive collapse scenarios.

CHAPTER 6 EXPERIMENTAL STUDY ON EXTERIOR PRECAST FRAMES
135
CHAPTER 6 EXPERIMENTAL STUDY ON EXTERIOR
PRECAST CONCRETE FRAMES
6.1 Introduction
For exterior precast concrete frames, horizontal restraints are only provided by
adjacent columns. If these columns are slender or with low horizontal stiffness,
development of compressive arch action (CAA) and catenary action in the bridging
beam over the column removal will be limited. Besides, horizontal compression and
tension forces imposed by CAA and catenary action on the side columns may induce
shear failure in the side joints and flexural failure of the columns, as introduced in
Section 5.4.7. Therefore, the behaviour of the side columns subjected to CAA and
catenary action has to be investigated when CAA and subsequent catenary action
develop in the bridging beam.
This chapter presents an experimental study on four exterior precast concrete frames
under column removal scenarios, in which the horizontal load cell connected to the
beam extension was eliminated. In comparison with the frame specimens in Chapter
5, the top reinforcement ratio in the bridging beams was increased from 0.88% to
1.19%, as it has been shown to be an effective way to enhance structural resistance
under column removal scenarios (Yu and Tan 2013c). The resistance of exterior
frames was quantified under quasi-static loading condition. An attempt was also
made to quantify the resistance of side columns and beam-column joints under CAA
and catenary action, endeavouring to shed light on the design of columns and beam-
column joints against progressive collapse.
6.2 Experimental Programme
6.2.1 Specimen design and detailing
In the experimental programme, four precast concrete frames were designed and
fabricated in accordance with Eurocode 2 (BSI 2004). Table 6.1 includes the
geometry and reinforcement details of the beams and columns. In the notations, “EF”
represents exterior frames. “B” or “L” denotes 90o bend or lap-splice of bottom layer

CHAPTER 6 EXPERIMENTAL STUDY ON EXTERIOR PRECAST FRAMES
136
of beam longitudinal reinforcement in the joint. The two numerals separated with
slash represent the respective top and bottom reinforcement ratios at beam end
sections. The last letter “S” denotes that the cross section of precast columns was
enlarged from 250 mm square to 300 mm square. The whole cross section of the beam
was 150 mm by 300 mm, with 225 mm deep precast beam unit and 75 mm thick cast-
in-situ concrete topping. The centre-to-centre spacing of columns was 3 m. In frames
EF-B-1.19/0.59 and EF-L-1.19/0.59, the column section was 250 mm square and the
clear span of the beam was 2.75 m. However, due to the enlarged cross section of
side columns in frames EF-B-1.19/0.59S and EF-L-1.19/0.59S, the clear span of these
two specimens was reduced from 2.75 m to 2.7 m. In all the four specimens, the area
of beam and column longitudinal reinforcement was kept constant, as listed in Table
6.1.
Table 6.1: Geometry and reinforcement details of precast concrete frames
Specimen
Beam Column Cross
section (mm)
Clear span (m)
Longitudinal bars Stirrups
Cross section
(mm)
Main bars Stirrups
A-A B-B EF-B-
1.19/0.59
150 x
300
2.75 2H16+H13
(top); 2H13
(bottom)
2H16 (top); 2H13
(bottom)
R8@80
250 x
250 8H13 R8@100
EF-L-1.19/0.59
EF-B-1.19/0.59S 2.70
300 x
300 EF-L-1.19/0.59S
In the frame specimens, the beam and column units were prefabricated, as shown by
the hatched zones in Fig. 6.1. The precast components were assembled into the frame
by proper bottom reinforcement detailing in the joint and continuous top longitudina l
reinforcement. Finally, cast-in-situ concrete was placed as structural topping to form
the integral frames. Two types of reinforcement detailing (i.e. 90o bend and lap-
splice), identical to those in precast concrete sub-assemblages in Chapter 3, were used
in the beam-column joint, as shown in Figs. 6.1(a and b). In frames EF-B-1.19/0.59
and EF-B-1.19/0.59S, beam bottom reinforcement was projected from the beam end
and bent into the joint (see Fig. 6.1(a)). However, in EF-L-1.19/0.59 and EF-L-
1.19/0.59S, bottom longitudinal bars were curtailed at the end of precast beam units,
and two short steel bars were placed in the prefabricated trough in the beam, as shown
in Fig. 6.1(b). The horizontal interface between the precast concrete units and the
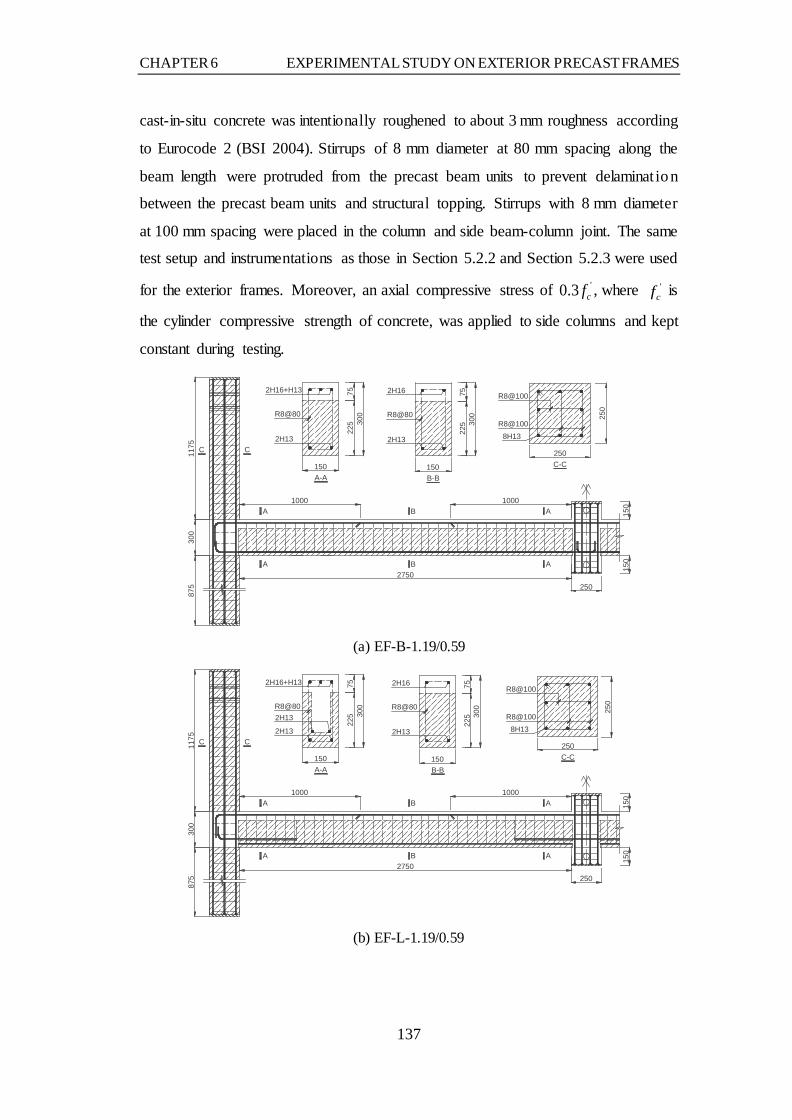
CHAPTER 6 EXPERIMENTAL STUDY ON EXTERIOR PRECAST FRAMES
137
cast-in-situ concrete was intentionally roughened to about 3 mm roughness according
to Eurocode 2 (BSI 2004). Stirrups of 8 mm diameter at 80 mm spacing along the
beam length were protruded from the precast beam units to prevent delaminat ion
between the precast beam units and structural topping. Stirrups with 8 mm diameter
at 100 mm spacing were placed in the column and side beam-column joint. The same
test setup and instrumentations as those in Section 5.2.2 and Section 5.2.3 were used
for the exterior frames. Moreover, an axial compressive stress of '0.3 cf , where 'cf is
the cylinder compressive strength of concrete, was applied to side columns and kept
constant during testing.
(a) EF-B-1.19/0.59
(b) EF-L-1.19/0.59
1175
875
2750250
150
150
B
B
300
A-A150
7522
5 300
15075
225
1000 1000A
A
A
A
250
250
C C
300
B-B
C-C
2H16+H13
2H13
R8@80
2H16
2H13
R8@80R8@100
R8@100
8H13
2750
B
B
300
2H16+H13
2H13
150
7522
5 300
2H16
C C
A-A B-BC-C
2H13
150
7522
5
1000 1000
2H13
A
A
A
A
250
250
R8@100
R8@100
8H13
R8@80 R8@80
1175
875
300
150
150
250
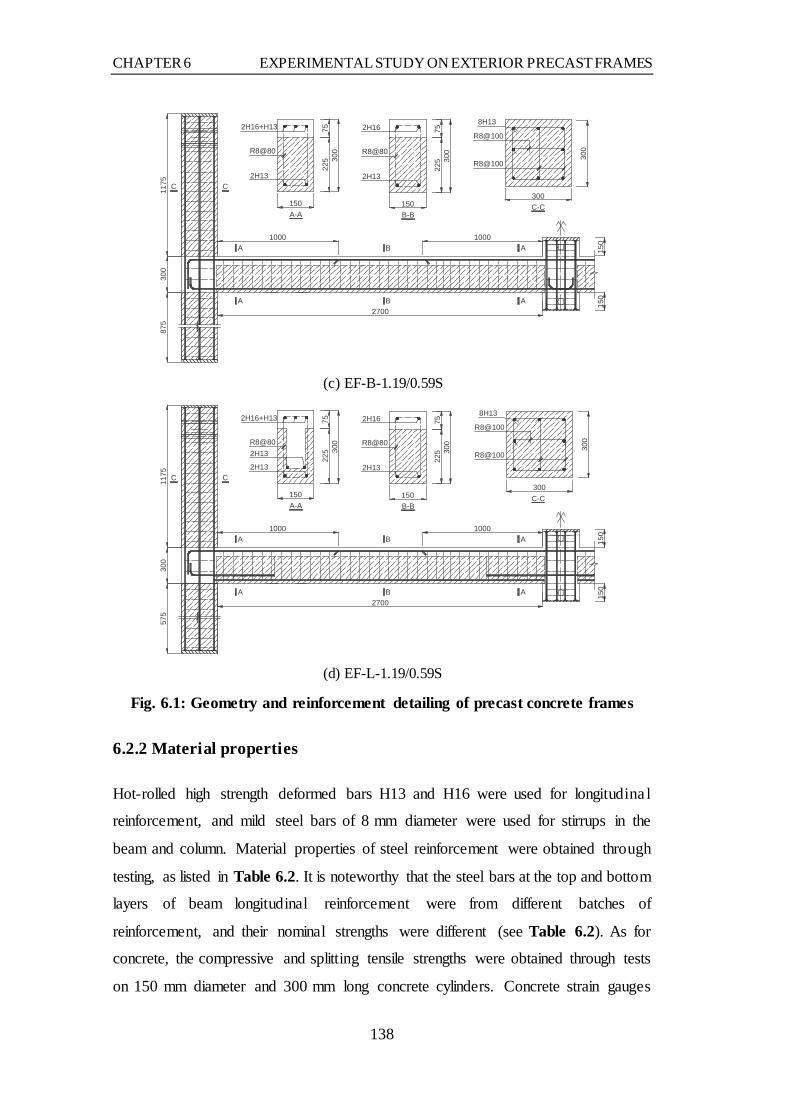
CHAPTER 6 EXPERIMENTAL STUDY ON EXTERIOR PRECAST FRAMES
138
(c) EF-B-1.19/0.59S
(d) EF-L-1.19/0.59S
Fig. 6.1: Geometry and reinforcement detailing of precast concrete frames
6.2.2 Material properties
Hot-rolled high strength deformed bars H13 and H16 were used for longitudina l
reinforcement, and mild steel bars of 8 mm diameter were used for stirrups in the
beam and column. Material properties of steel reinforcement were obtained through
testing, as listed in Table 6.2. It is noteworthy that the steel bars at the top and bottom
layers of beam longitudinal reinforcement were from different batches of
reinforcement, and their nominal strengths were different (see Table 6.2). As for
concrete, the compressive and splitting tensile strengths were obtained through tests
on 150 mm diameter and 300 mm long concrete cylinders. Concrete strain gauges
150
150
300
300
R8@100
R8@100
8H13
R8@80 R8@80
C C
A-A B-BC-C
1175
300
875
2700
B
B
300
2H16+H13
2H13
150
7522
5 300
2H16
2H13
150
7522
5
1000 1000A
A
A
A
150
150
2H13
150
7522
5
1000 1000
2H13
A
A
A
A
300
300
R8@100
R8@100
8H13
R8@80 R8@80
C C
A-A B-BC-C
1175
300
575
2700
B
B
300
2H16+H13
2H13
150
7522
5 300
2H16

CHAPTER 6 EXPERIMENTAL STUDY ON EXTERIOR PRECAST FRAMES
139
with a gauge length of 60 mm were mounted in the middle of each cylinder to obtain
the modulus of elasticity. Table 6.3 shows the strengths and elastic moduli of
concrete cylinders.
Table 6.2: Material properties of steel reinforcement
Material Nominal diameter
(mm)
Yield strength (MPa)
Elastic modulus
(GPa)
Ultimate strength (MPa)
Fracture strain*
(%) Remark
Main bars
H13 13 553.2 203.9 630.8 10.8
Beam bottom bars and column
bars 593.7 202.2 688.4 12.0 Beam top bars
H16 16 493.9 204.0 615.7 16.0 Beam top bars
Stirrups R8 8 272.4 207.4 359.5 -- Beam and column
*: Fracture strain refers to the average strain over a gauge length of 300 mm when steel reinforcement ruptures.
Table 6.3: Compressive and splitting tensile strengths of concrete
Specimen Location Compressive strength (MPa)
Modulus of elasticity (GPa)
Splitting tensile strength (MPa)
EF-B-1.19/0.59 EF-L-1.19/0.59
EF-B-1.19/0.59S EF-L-1.19/0.59S
Precast beam and column units 26.9 25.8 2.1
Cast-in-situ concrete 38.1 26.3 2.8
6.3 Test Results of Exterior Frames
6.3.1 Load-displacement curves
0 100 200 300 400 5000
15
30
45
60
75
90
X
X
X Rupture of beam bottom bars at middle jointVe
ritca
l loa
d (k
N)
Middle joint displacement (mm)
EF-B-1.19/0.59 EF-L-1.19/0.59
Catenary actionCAA
(a) Vertical load
0 100 200 300 400 500
-75
-50
-25
0
25
50
75
Catenary action
CAA
Hor
izon
tal r
eact
ion
forc
e (kN
)
Middle joint displacement (mm)
EF-B-1.19/0.59 EF-L-1.19/0.59
Zero axial force
(b) Horizontal reaction force
Fig. 6.2: Vertical loads and horizontal reaction forces of exterior frames EF-B-1.19/0.59 and EF-L-1.19/0.59

CHAPTER 6 EXPERIMENTAL STUDY ON EXTERIOR PRECAST FRAMES
140
0 100 200 300 400 500 600 7000
20
40
60
80
100
120
Column failure
X Rupture of beam bars at middle joint
X
Ver
itcal
load
(kN
)
Middle joint displacement (mm)
EF-B-1.19/0.59S EF-L-1.19/0.59S
Catenary actionCAA
X
(a) Vertical load
0 100 200 300 400 500 600 700-100
-50
0
50
100
150
200
250
CAA
Catenary actionHoriz
ontal
reac
tion
forc
e (kN
)
Middle joint displacement (mm)
EF-B-1.19/0.59S EF-L-1.19/0.59S
Zero axial force
(b) Horizontal reaction force
Fig. 6.3: Vertical loads and horizontal reaction forces of exterior frames EF-B-1.19/0.59S and EF-L-1.19/0.59S
Fig. 6.2 and Fig. 6.3 show the variations of vertical loads and horizontal reaction
forces with middle joint displacement. Under column removal scenarios, significant
CAA and catenary action sequentially developed in the beam. This was evident from
the beam initial axial compression and subsequent tension forces, as defined by Su et
al. (2009) and Yu and Tan (2010a). At the CAA stage, vertical load increased with
increasing middle joint displacement until a plateau stage was reached, as shown in
Fig. 6.2(a) and Fig. 6.3(a). In the meantime, axial compression force developed in
the bridging beam of precast concrete frames (see Fig. 6.2(b) and Fig. 6.3(b)), which
achieved the maximum value later than the vertical load. Rupture of beam bottom
reinforcement occurred at the face of the middle joint, leading to a sudden drop in the
vertical load, as shown in Fig. 6.2(a) and Fig. 6.3(a). A further increase in the middle
joint displacement increased the vertical load due to the presence of rotationa l
restraint at the middle joint. In EF-B-1.19/0.59 and EF-L-1.19/0.59, shear failure in
the side beam-column joint gradually reduced the vertical load on the middle joint
(Fig. 6.2(a)), even though the horizontal tension force could increase with increasing
middle joint displacement (Fig. 6.2(b)). Frames EF-B-1.19/0.59S and EF-L-
1.19/0.59S attained substantially greater catenary action capacities than the CAA
capacities, as shown in Fig. 6.3(a). Eventually, flexural failure of side columns
hindered the development of tension force in the beam, causing collapse of specimens
EF-B-1.19/0.59S and EF-L-1.19/0.59S.

CHAPTER 6 EXPERIMENTAL STUDY ON EXTERIOR PRECAST FRAMES
141
6.3.2 Resistances of precast concrete frames
Behaviour of precast concrete frames is primarily characterised by the maximum
vertical load imposed on the middle beam-column joint and the peak horizontal force
developed in the bridging beam. Table 6.4 summarises the vertical load resistance,
the horizontal compression force and associated middle joint displacements of precast
concrete frames at CAA stage. Although different bottom reinforcement detailing
was used in the joint, exterior frames EF-B-1.19/0.59 and EF-L-1.19/0.59 developed
almost the same CAA capacities due to relatively weak side columns, as shown in
Table 6.4. However, significant difference existed between the CAA capacities of
EF-B-1.19/0.59S and EF-L-1.19/0.59S with enlarged column sections. EF-B-
1.19/0.59S was able to develop 13% greater CAA capacity compared to EF-L-
1.19/0.59S, as included in Table 6.4. It agrees well with the effect of reinforcement
detailing on the CAA capacity of beam-column sub-assemblages, as discussed in
Section 3.4.2. Besides the reinforcement detailing in the joint, side columns also
affected the CAA capacity of frames. In EF-B-1.19/0.59S and EF-L-1.19/0.59S, the
enlarged side columns provided stronger horizontal restraints for “anchoring” the
bridging beam, thereby increasing the horizontal compression force by 48% and 90%,
respectively, compared to EF-B-1.19/0.59 and EF-L-1.19/0.5. Accordingly, the CAA
capacity of EF-B-1.19/0.59S was also increased in comparison with EF-B-1.19/0.59.
Nonetheless, frame EF-L-1.19/0.59S only developed a CAA capacity of 71.0 kN,
even smaller than EF-L-1.19/0.59.
Table 6.4: Experimental results of precast concrete frames at CAA stage
Specimen Peak
load cP (kN)
Horizontal reaction at
cP (kN)
MJD at cP
(mm)*
Max. horizontal compression
cN (kN)
Vertical load at
cN (kN)
MJD at cN
(mm)* EF-B-1.19/0.59 75.1 -54.3 111.2 -58.3 74.2 143.2
EF-L-1.19/0.59 74.4 -41.5 72.1 -49.8 46.5 199.1
EF-B-1.19/0.59S 80.1 -63.6 87.2 -86.2 77.3 171.1
EF-L-1.19/0.59S 71.0 -70.6 78.2 -94.8 47.1 179.1 *: MJD represents middle joint displacement.
Beyond CAA, catenary action in the bridging beam was mobilised to resist vertical
load. Table 6.5 lists the maximum vertical load and horizontal tension force at the
catenary action stage. In EF-B-1.19/0.59 and EF-L-1.19/0.59, irrespective of joint

CHAPTER 6 EXPERIMENTAL STUDY ON EXTERIOR PRECAST FRAMES
142
detailing, significantly lower catenary action capacities than CAA capacities were
obtained due to shear failure in side beam-column joints, as listed in Table 6.5. With
the column sizes enlarged from 250 mm to 300 mm square, EF-B-1.19/0.59S and EF-
L-1.19/0.59S were capable of sustaining nearly the same catenary action capacities
(see Table 6.5), substantially greater than the CAA capacities. Therefore, to mobilise
catenary action as an effective line of defence against progressive collapse, strong
side columns with sufficient flexural and shear strengths have to be provided in
reinforced concrete frames.
Table 6.5: Resistances and deformations of precast concrete frames at catenary action stage
Specimen Peak
load tP (kN)
Horizontal reaction at
tP (kN)
MJD at tP (mm)
Max. horizontal tension tN
(kN)
Vertical load at
tN (kN)
MJD at tN
(mm) EF-B-1.19/0.59 67.7 1.8 344.0 36.9 64.8 430.9
EF-L-1.19/0.59 67.2 38.7 419.8 57.3 56.5 457.8
EF-B-1.19/0.59S 106.7 180.0 539.8 203.6 88.8 583.9
EF-L-1.19/0.59S 103.1 160.5 516.9 200.7 100.9 590.9
Comparisons can also be made between specimens EF-B-1.19/0.59 and EF-L-
1.19/0.59 and exterior frames EF-B-0.88-0.59 and EF-L-0.88-0.59 in Chapter 5. By
increasing the top reinforcement ratio in the beam from 0.88% to 1.19%, EF-B-
1.19/0.59 developed around 11% greater CAA capacity and 41% higher axial
compression force than EF-B-0.88-0.59. At the catenary action stage, the load
capacity was increased by 33%. However, tension force in the beam was limited due
to shear failure of side beam-column joints. Similar results are also obtained when
comparisons are made between EF-L-1.19/0.59 and EF-L-0.88-0.59.
6.3.3 Failure modes of precast frames
Similar to the failure mode of middle joint in reinforced concrete beam-column sub-
assemblages (Lew et al. 2011; Su et al. 2009; Yu and Tan 2013c), one bottom bar in
EF-B-1.19/0.59 ruptured at the left face of the middle joint, as shown in Fig. 6.4(a),
leading to a drop of the vertical load at the CAA stage, whereas the other steel bar
was pulled out at the left face. Precast concrete frames EF-L-1.19/0.59, EF-B-
1.19/0.59S and EF-L-1.19/0.59S exhibited similar failure modes at the middle joint,

CHAPTER 6 EXPERIMENTAL STUDY ON EXTERIOR PRECAST FRAMES
143
as shown in Figs. 6.4(b-d). Following the rupture of bottom reinforcement at the
middle joint face, sagging moment resistance of beam sections was mobilised at the
right face of the middle joint due to rotational restraint, which increased the vertical
load prior to the commencement of catenary action. With increasing middle joint
displacement, pull-out failure of beam bottom reinforcement was observed at the
right face of the middle joint, as shown in Figs. 6.4(b and d).
(a) EF-B-1.19/0.59
(b) EF-L-1.19/0.59
(c) EF-B-1.19/0.59S
(d) EF-L-1.19/0.59S
Fig. 6.4: Failure modes of middle beam-column joints
(a) EF-B-1.19/0.59
Rupture of beam bars
Rupture of rebars
Rupture of bottom bars
Rupture of steel bars
Pull-out failure
Middle joint
Side column
Plastic hinge at the beam end
Flexural cracks under CAA

CHAPTER 6 EXPERIMENTAL STUDY ON EXTERIOR PRECAST FRAMES
144
(b) EF-L-1.19/0.59
(c) EF-B-1.19/0.59S
(d) EF-L-1.19/0.59S
Fig. 6.5: Crack patterns of bridging beams
Flexural and tension cracks were observed along the bridging beam, as shown in Fig.
6.5. Due to relatively small column size, frames EF-B-1.19/0.59 and EF-L-1.19/0.59
exhibited similar crack patterns along the beam length, as shown in Figs. 6.5(a and
b). Under column removal scenarios, beam bottom longitudinal reinforcement near
the middle joint was subjected to tension. Flexural cracks were formed at the bottom
face of the beam in the vicinity of the middle joint. Similarly, hogging moment at the
side column generated tension force in the top longitudinal reinforcement, and cracks
Middle joint
Side column
Plastic hinge at the beam end
Flexural cracks under CAA
Middle joint
Side column
Cracks in the vicinity of curtailment point
Tension cracks under catenary action
Middle joint
Side column
Cracks in the vicinity of curtailment point
Tension cracks under catenary action

CHAPTER 6 EXPERIMENTAL STUDY ON EXTERIOR PRECAST FRAMES
145
were observed at the top face of the beam. In EF-B-1.19/0.59 and EF-L-1.19/0.59,
premature shear failure of the side beam-column joints hindered the full development
of catenary action in the beams, and therefore only limited tension cracks were
formed along the beam length, as shown in Figs. 6.5(a and b). By enlarging the cross
section of side columns in EF-B-1.19/0.59S and EF-L-1.19/0.59S, significant
catenary action was mobilised in the bridging beams, as shown in Fig. 6.3(a). Tension
cracks developed along the beam length at catenary action stage, in particular, on the
beam segment near the middle joint, as shown in Figs. 6.5(c and d). Axial tension
force in the beam also generated closely-spaced cracks at the curtailment point of top
reinforcement, indicating the formation of a partial hinge. Similar to beam-column
sub-assemblages in Section 3.4.4, these cracks substantially contributed to total
vertical deformation of the frames. Eventually, instead of shear failure in the side
joint, crushing of concrete occurred in the side joints, which lead to flexural failure
of the side columns.
Compared to exterior frames EF-B-0.88-0.59 and EF-L-0.88-0.59 in Chapter 5,
greater beam top reinforcement ratio in EF-B-1.19/0.59 and EF-L-1.19/0.59 led to
severe shear cracking in side beam-column joints, even though the same amount of
horizontal hoops was provided in the side joints. Fig. 6.6 shows the propagation of
shear cracks in the side joint of EF-B-1.19/0.59. Before 150 mm middle joint
displacement, only one single diagonal crack was observed in the joint (Fig. 6.6(a)).
With increasing middle joint displacement, more cracks started developing, as shown
in Figs. 6.6(b-d). At about 270 mm displacement, crushing of concrete took place
near the compression zone of the bottom column segment (Fig. 6.6(e)). A further
increase in the middle joint displacement did not generate more shear cracks in the
joint zone, as shown in Fig. 6.6(f). Instead, width of the diagonal cracks was increased
by the tension force in the beam once catenary action commenced. Fig. 6.7(a) shows
the final failure mode of the side joint in EF-B-1.19/0.59. Spalling of concrete also
occurred along the column height above the side joint. Fig. 6.7(b) shows similar crack
pattern and failure mode in the side joint of EF-L-1.19/0.59. As a result of severe
shear cracks in the joint, top longitudinal reinforcement in the beam remained intact,
particularly for EF-B-1.19/0.59 in which no significant plastic hinge developed at the
beam end, as shown in Fig. 6.7(a). Axial force in the beam also produced flexura l

CHAPTER 6 EXPERIMENTAL STUDY ON EXTERIOR PRECAST FRAMES
146
cracks in the column segment below the side joint. At the CAA stage, horizonta l
compression force in the beam pushed the side columns outwards, thereby generating
cracks on the rear face of the side column, as shown in Figs. 6.7(a and b).
(a) 150 mm
(b) 180 mm
(c) 210 mm
(d) 240 mm
(e) 270 mm
(f) 330 mm
Fig. 6.6: Propagation of shear cracks in the side joint of EF-B-1.19/0.59
By enlarging the size of side columns in EF-B-1.19/0.59S and EF-L-1.19/0.59S,
diagonal shear failure in the side beam-column joints was averted when subjected to
CAA, as shown in Figs. 6.7(c and d), even though horizontal hoops with the same
diameter and spacing were used in the joint. Only limited flexural cracks were formed
on the rear face of the columns at CAA stage. At the catenary action stage, significant
tension force in the beam created more cracks on the inner column face towards the
middle joint, and crushing of concrete eventually occurred in the compression zone
of the column immediately above the side joint as shown in Figs. 6.7(c and d),
indicating flexural failure of the columns under combined vertical axial compression
and horizontal tension forces. Thereafter, the side columns developed substantia l

CHAPTER 6 EXPERIMENTAL STUDY ON EXTERIOR PRECAST FRAMES
147
lateral deflections with increasing middle joint displacement, and both the vertical
load on the middle joint and horizontal tension force were reduced due to column
failure.
(a) EF-B-1.19/0.59
(b) EF-L-1.19/0.59
Flexural cracks under CAA
Shear cracks in the joint
Flexural cracks under CAA
Shear cracks in the joint
Front view Side view
Spalling of concrete in the joint
Front view Side view
Crushing of concrete above the joint
Rear face
Inner face
Rear face
Inner face

CHAPTER 6 EXPERIMENTAL STUDY ON EXTERIOR PRECAST FRAMES
148
(c) EF-B-1.19/0.59S
(d) EF-L-1.19/0.59S
Fig. 6.7: Crack patterns and failure modes of side beam-column joints
Flexural cracks under catenary action Cracks
under CAA
Flexural cracks under catenary action
Flexural cracks under CAA
Crushing of concrete in the joint
Crushing of concrete in the joint
Front view Side view
Front view Side view

CHAPTER 6 EXPERIMENTAL STUDY ON EXTERIOR PRECAST FRAMES
149
6.3.4 Lateral deflections of side columns
-10 -5 0 5 10 15 20 25 300
500
1000
1500
2000
2500Di
stanc
e to
botto
m p
in su
ppor
t (m
m)
Lateral deflection (mm)
Peak compression Onset of catenary action Peak tension
Top restraint
Beam top face
Original position
Beam bottom face
(a) EF-B-1.19/0.59
-10 -5 0 5 10 15 20 25 300
500
1000
1500
2000
2500
Dista
nce t
o bo
ttom
pin
supp
ort (
mm
)
Lateral deflection (mm)
Peak compression Onset of catenary action Peak tension
Top restraint
Beam top face
Original position
Beam bottom face
(b) EF-L-1.19/0.59
-10 -5 0 5 10 15 20 25 300
500
1000
1500
2000
2500
Dista
nce t
o bo
ttom
pin
supp
ort (
mm
)
Lateral deflection (mm)
Peak compression Onset of catenary action Peak tension Failure
Top restrain
Original position
Beam top face
(c) EF-B-1.19/0.59S
-10 -5 0 5 10 15 20 25 300
500
1000
1500
2000
2500 Top restraint
Beam top face
Dista
nce t
o bo
ttom
pin
supp
ort (
mm
)
Lateral deflection (mm)
Peak compression Onset of catenary action Peak tension Failure
Beam bottom faceOriginal position
(d) EF-L-1.19/0.59S
Fig. 6.8: Lateral deflections of side columns
Development of CAA and catenary action in the beam imposed horizonta l
compression and tension forces on the side column. Correspondingly, the side column
developed significant lateral deflections when subjected to CAA and catenary action,
as shown in Fig. 6.8. Negative value denotes deflection away from the middle joint,
and positive value stands for deflection towards the middle joint. Under CAA, simila r
deformed profiles of the side column were obtained in all four frames (see Fig. 6.8).
The side column was pushed outwards by the horizontal compression force in the
bridging beam. A maximum negative deflection of up to 6 mm was attained at the
column section corresponding to the bottom face of the beam. Following the onset of
catenary action, inward deflections were induced to the side column by the horizonta l
tension force. The deformed shape of the side column varied with the failure mode
of the frame. In EF-B-1.19/0.59 and EF-L-1.19/0.59, diagonal shear cracks in the side

CHAPTER 6 EXPERIMENTAL STUDY ON EXTERIOR PRECAST FRAMES
150
beam-column joints created a kink at the column section corresponding to the beam
top face, as shown in Figs. 6.8(a and b). The upper column segment above the side
joint exhibited significant lateral deflections towards the middle joint, whereas the
lower column segment developed much less deflections as a result of diagonal shear
failure in the joint. Nonetheless, frames EF-B-1.19/0.59S and EF-L-1.19/0.59S
showed dramatically different lateral deflection profiles from EF-B-1.19/0.59 and
EF-L-1.19/0.59, as shown in Figs. 6.8(c and d). The side columns were pulled
inwards by considerable horizontal tension force in the bridging beams, until flexura l
failure of the column occurred. The maximum positive deflection took place at the
column section associated with the top face of the beam, with a value of 27.2 mm in
EF-L-1.19/0.59S.
6.3.5 Shear strength of beam-column joints
Precast frames EF-B-1.19/0.59 and EF-L-1.19/0.59 exhibited shear failure in the side
beam-column joints, as shown in Figs. 6.7(a and b). Thus, horizontal shear force in
the joints has to be determined. It is assumed that tensile stress of the beam top
reinforcement at the side column interface increased linearly with increasing middle
joint displacement prior to yielding, and then remained at its yield stress until fina l
failure occurred. In accordance with force equilibrium at the side joint, as shown in
Fig. 6.9(a), shear force in the side joint is calculated from Eq. (6-1). Fig. 6.9(b) shows
the shear force diagram along the column height at CAA and catenary action stages.
Fig. 6.10 shows the shear force-middle joint displacement relationships. It is obvious
that the joint shear force attained its maximum value at the CAA stage, and then
decreased with increasing middle joint displacement before the onset of catenary
action. Thereafter, hogging moment at the beam end, equal to the difference of
bending moments cdM and ceM (see Fig. 6.9(c)), was significantly reduced, which
led to a reduction in the joint shear force. Therefore, the side beam-column joint was
only likely to exhibit shear failure when subjected to CAA. When the cross section
of side columns was enlarged to 300 mm square in frames EF-B-1.19/0.59S and EF-
L-1.19/0.59S, the maximum horizontal shear force sustained by the side joint was
also increased. However, shear failure did not occur due to increased shear resistance
of the side joint.

CHAPTER 6 EXPERIMENTAL STUDY ON EXTERIOR PRECAST FRAMES
151
jc tV T R= + (6-1)
where jcV is the horizontal shear force in the side beam-column joint; tR is the
reaction force in the horizontal load cell on the column top; and T is the tension force
sustained by the beam top longitudinal reinforcement.
Fig. 6.9: Shear forces and bending moments on side column
0 100 200 300 400 500 600 700120
150
180
210
240
270
300
Shea
r for
ce in
the s
ide j
oint
Vjc (k
N)
Middle joint displacement (mm)
EF-B-1.19/0.59 EF-L-1.19/0.59 EF-B-1.19/0.59S EF-L-1.19/0.59S
Fig. 6.10: Shear forces in side beam-column joints
Table 6.6 summarises the maximum horizontal shear force jcV in the side beam-
column joint at CAA stage. The hogging moment capacity of the beam end section
Rt
Rb
V jc
Top restraint
D D
E E
(a) Force equilibrium (c) Bending moment
Mce
Mcd
Mce
McdT
N
L tL b Inner face
Rear face
(b) Shear forceRb
Rt
Rb
V jc
Rt
V jc
Catenary action Catenary actionCAACAA
Pin support

CHAPTER 6 EXPERIMENTAL STUDY ON EXTERIOR PRECAST FRAMES
152
under pure flexural action is calculated in accordance with Eurocode 2 (BSI 2004).
Moreover, the hogging moment is decomposed into a tension force T sustained by
the top reinforcement and a compression force N in the compression zone. Based
on the force equilibrium of the side column (see Fig. 6.9(a)), shear force jfV in the
joint is also calculated under flexural action, as expressed in Eq. (6-2). Comparisons
between joint shear forces under CAA and flexural action indicate that development
of CAA in the bridging beam increased the shear force in the side joint by around 8%
for EF-B-1.19/0.59 and EF-L-1.19/0.59. Additionally, by enlarging the size of side
columns, the shear force in the side joint of EF-B-1.19/0.59S and EF-L-1.19/0.59S
was increased by 15% compared to the calculated shear force under flexural action.
Therefore, shear force in the side joint was related to the horizontal compression force
developed at the CAA stage. A larger compression force induced by stiffer side
columns significantly increased the joint shear force.
bbjf y
t b
MV Tl h l
= −+ +
(6-2)
where jfV is the shear force in the side joint under flexural action; yT is the yield
force of tension reinforcement; bbM is the moment resistance of beam end section,
acting on the column face; tl and bl are the lengths of column segment above and
below the side joint; and h is the depth of the beam.
Table 6.6: Maximum shear forces in side beam-column joints
Specimen Shear force jcV under CAA (kN) Shear force jfV
under flexural action (kN)
jc jfV V Left joint Right joint Average
EF-B-1.19/0.59 276.9 276.9 276.9 255.5 1.08
EF-L-1.19/0.59 281.4 273.2 277.3 256.6 1.08
EF-B-1.19/0.59S 296.1 296.6 296.4 255.5 1.16
EF-L-1.19/0.59S 296.4 292.9 294.7 256.6 1.15
6.3.6 Flexural strength of side columns subjected to horizontal tension
In frames EF-B-1.19/0.59S and EF-L-1.19/0.59S, shear failure of side beam-column
joints was averted by enlarging the size of side columns. Instead, crushing of concrete
took place on the rear face of the side columns, as shown in Figs. 6.7(c and d).

CHAPTER 6 EXPERIMENTAL STUDY ON EXTERIOR PRECAST FRAMES
153
Bending moments at column sections D-D and E-E (see Fig. 6.9) are calculated based
on force equilibrium, as expressed in Eqs. (6-3) and (6-4). It is assumed that the
bending moment is positive when the column face towards the middle joint is in
tension and negative when the rear face is subjected to tension, as shown in Fig. 6.9(c).
Fig. 6.11 shows the variations of bending moments with middle joint displacement.
At CAA stage, horizontal compression force on the side column generated negative
bending moment along the column length (see Fig. 6.9(c)). In all the specimens,
bending moment at section E-E was substantially larger than that at section D-D.
Thus, flexural cracks were only formed at column sections below the side joint, as
shown in Figs. 6.7(a and b). With development of horizontal tension force at
catenary action stage, negative bending moments were gradually transformed to
positive values at sections D-D and E-E (Fig. 6.9(c)). In frames EF-B-1.19/0.59 and
EF-L-1.19/0.59, shear failure of the side joints substantially limited the bending
moments at sections D-D and E-E, as shown in Figs. 6.11(a and b). However, the
side columns of EF-B-1.19/0.59S and EF-L-1.19/0.59S sustained much greater
bending moments than EF-B-1.19/0.59 and EF-L-1.19/0.59. It should be noted that
section D-D generally sustained greater bending moment than section E-E, as shown
in Fig. 6.11(b and d), indicating that flexural failure of the side columns was more
likely to be initiated at section D-D. It agrees well with the failure mode of the side
columns, as shown in Figs. 6.7(c and d).
cd t tM R l= − (6-3)
ce b bM R l= − (6-4)
where cdM and ceM are the bending moments at sections D-D and E-E, respectively;
and bR is the horizontal reaction force in the pin support at the bottom end of the side
column, as shown in Fig. 6.9.

CHAPTER 6 EXPERIMENTAL STUDY ON EXTERIOR PRECAST FRAMES
154
0 100 200 300 400 500-100
-50
0
50
100
150Be
ndin
g m
omen
t at c
olum
n se
ctio
ns (k
N.m
)
Middle joint displacement (mm)
Section D-D Section E-E
(a) EF-B-1.19/0.59
0 100 200 300 400 500-100
-50
0
50
100
150
Bend
ing
mom
ent a
t col
umn
sect
ions
(kN.
m)
Middle joint displacement (mm)
Section D-D Section E-E
(b) EF-L-1.19/0.59
0 100 200 300 400 500 600 700-100
-50
0
50
100
150
Bend
ing
mom
ent a
t col
umn
sect
ions
(kN.
m)
Middle joint displacement (mm)
Section D-D Section E-E
(c) EF-B-1.19/0.59S
0 100 200 300 400 500 600 700-100
-50
0
50
100
150
Bend
ing
mom
ent a
t col
umn
sect
ions
(kN.
m)
Middle joint displacement (mm)
Section D-D Section E-E
(d) EF-L-1.19/0.59S
Fig. 6.11: Variations of bending moments at column sections
Table 6.7: Maximum bending moments at column sections
Specimen
Bending moment under catenary action (kN.m) Moment capacity cM of
column section (kN.m) cd cM M cdM
(section D-D) ceM
(section E-E) EF-B-1.19/0.59 27.0 1.0 75.3 0.36
EF-L-1.19/0.59 47.3 6.4 75.3 0.63
EF-B-1.19/0.59S 123.3 108.6 111.6 1.10
EF-L-1.19/0.59S 127.9 72.4 111.6 1.15
Table 6.7 lists the maximum positive bending moments at column sections D and E
at catenary action stage. Moment capacity cM of the column sections subjected to
combined axial compression force and bending moment is also calculated through
the axial force-bending moment interaction diagram according to Eurocode 2 (BSI
2004). As for frames EF-B-1.19/0.59S and EF-L-1.19/0.59S, the maximum bending
moments sustained by column section D-D were respectively 10% and 15% greater
Side joint
E
D D
E
Side joint
E
D D
E
Side joint
E
D D
E
Side joint
E
D D
E

CHAPTER 6 EXPERIMENTAL STUDY ON EXTERIOR PRECAST FRAMES
155
than the calculated moment capacity, indicating that the moment capacity of column
sections was attained at failure. However, column section D-D in EF-B-1.19/0.59 and
EF-L-1.19/0.59 sustained much less bending moments than their respective capacity
due to premature shear failure in the side joints.
6.3.7 Variation of steel strain in side joints
Fig. 6.12: Layout of strain gauges in the side joint
To gain a deeper insight into the behaviour of side beam-column joints under CAA
and catenary action, steel strain gauges were mounted on column longitudina l
reinforcement and horizontal hoops in the joint, as shown in Fig. 6.12. Fig. 6.13
shows the variations of longitudinal reinforcement strains in the columns. When
subjected to CAA, development of horizontal compression force in the beam
generated tensile strain at LC-4 and compressive strain at LC-3. The longitudina l
reinforcement at LC-1 and LC-2 showed few strains due to limited bending moment
at section D-D. Following the commencement of catenary action in the beam,
horizontal tension force acting on the column reversed the sign of LC-3 and LC-4.
However, strains of LC-1 and LC-2 depended on the failure mode of side beam-
column joints. In EF-B-1.19/0.59 and EF-L-1.19/0.59, diagonal shear cracks in the
joints enabled the development of tensile strains at LC-2, as shown in Figs. 6.13(a
and b), indicating that longitudinal reinforcement in the columns was mobilised to
sustain the joint shear force through dowel action. Nevertheless, in EF-B-1.19/0.59S
LCS-2
LCS-1
Towards middlejoint
100
100
100
Left column
LC-4
LC-2
LC-3
LC-1
D
EE
D

CHAPTER 6 EXPERIMENTAL STUDY ON EXTERIOR PRECAST FRAMES
156
and EF-L-1.19/0.59S, tensile strain of LC-1 and compressive strain of LC-2 were
mobilised (see Figs. 6.13(c and d)) until flexural failure of the side column occurred.
0 100 200 300 400 500-3000
-2000
-1000
0
1000
2000
3000
4000
Shea
r lin
k str
ain
(µε)
Middle joint displacement (mm)
LC-1 LC-2 LC-3 LC-4
(a) EF-B-1.19/0.59
0 100 200 300 400 500-3000
-2000
-1000
0
1000
2000
3000
4000
Shea
r lin
k str
ain
(µε)
Middle joint displacement (mm)
LC-1 LC-2 LC-3 LC-4
(b) EF-L-1.19/0.59
0 100 200 300 400 500 600 700-3000
-2000
-1000
0
1000
2000
3000
4000
Shea
r lin
k str
ain
(µε)
Middle joint displacement (mm)
LC-1 LC-2 LC-3 LC-4
(c) EF-B-1.19/0.59S
0 100 200 300 400 500 600 700-2000
-1000
0
1000
2000
3000
4000
5000
Shea
r lin
k str
ain
(µε)
Middle joint displacement (mm)
LC-1 LC-2 LC-3 LC-4
(d) EF-L-1.19/0.59S
Fig. 6.13: Variations of reinforcement strains in side columns
In addition to the column longitudinal reinforcement, horizontal hoops in the side
joint also contributed to the shear resistance of the joint. Strain gauges LCS-1 and
LCS-2 were mounted on the hoops in the left joint, as shown in Fig. 6.12. Likewise,
strains of the horizontal hoops in the right joint were measured by RCS-1 and RCS-
2. Fig. 6.14 shows the strain development of horizontal hoops in the joint zones. Prior
to diagonal cracking in the side joints of EF-B-1.19/0.59 and EF-L-1.19/0.59 at CAA
stage, horizontal joint hoops were in compression with limited compressive strains,
as shown in Figs. 6.14(a and b). With middle joint displacements greater than 50
mm, strains LCS-1 and RCS-1 in EF-B-1.19/0.59 and EF-L-1.19/0.59 started
increasing and entered into post-yield stage, indicating the formation of shear cracks
along the diagonal line of the joint panel. Comparatively, LCS-2 and RCS-2

CHAPTER 6 EXPERIMENTAL STUDY ON EXTERIOR PRECAST FRAMES
157
developed the post-yield strains much later than LCS-1 and RCS-1 due to greater
distances from the diagonal shear cracks. In EF-B-1.19/0.59S and EF-L-1.19/0.59S,
the enlarged size of the side columns prevented shear failure in the joint. Most
horizontal hoops were in compression at CAA stage, as shown in Figs. 6.14(c and
d). The increase in tensile strains of joint hoops prior to failure was induced by
horizontal tension force transmitted to the joints at catenary action stage. Therefore,
all the strains developed rapidly into post-yield stage.
0 100 200 300 400 500-500
0
500
1000
1500
2000
2500
3000
Shea
r lin
k str
ain (µ
ε)
Middle joint displacement (mm)
LCS-1 LCS-2 RCS-1 RCS-2
Yield strain
(a) EF-B-1.19/0.59
0 100 200 300 400 500
0
500
1000
1500
2000
2500
Shea
r lin
k str
ain (µ
ε)
Middle joint displacement (mm)
LCS-1 LCS-2 RCS-1 RCS-2
Yield strain
(b) EF-L-1.19/0.59
0 100 200 300 400 500 600 700-200
0
200
400
600
800
1000
Shea
r lin
k str
ain (µ
ε)
Middle joint displacement (mm)
LCS-1 LCS-2 RCS-1 RCS-2
(c) EF-B-1.19/0.59S
0 100 200 300 400 500 600 700
0
400
800
1200
1600
2000
Shea
r lin
k str
ain (µ
ε)
Middle joint displacement (mm)
LCS-1 LCS-2 RCS-1 RCS-2 Yield strain
(d) EF-L-1.19/0.59S
Fig. 6.14: Strains of horizontal hoops in side beam-column joints
Based on the strains of reinforcement, actions in the side joint could be simplified at
CAA and catenary action stages, as shown in Fig. 6.15. Under CAA, horizonta l
compression force developed in the bridging beam, but bending moment at cross
section E-E was negligible (see Fig. 6.11). Thus, a strut mechanism as shown in Fig.
6.15(a) was significant. Development of the diagonal compressive strut caused shear
cracking in the joints of frames EF-B-1.19/0.59 and EF-L-1.19/0.59 (see Figs. 6.7(a

CHAPTER 6 EXPERIMENTAL STUDY ON EXTERIOR PRECAST FRAMES
158
and b)), which mobilised horizontal hoops to resist shear force and to confine
concrete in the joint zones (Figs. 6.14(a and b)). Eventually, shear failure occurred
in the side joints of frames EF-B-1.19/0.59 and EF-L-1.19/0.59. In EF-B-1.19/0.59S
and EF-L-1.19/0.59S, joint shear failure was prevented by enlarging the cross
sections of the side columns and catenary action developed in the beams to sustain
vertical load. At catenary action stage, tension force in the beams was mainly
transmitted to the joints through bond stresses between reinforcement and the
concrete, as shown in Fig. 6.15(b). Therefore, tensile strains of the horizontal hoops
were increased to resist the horizontal tension force in the joints, as shown in Figs.
6.14(c and d).
(c) At CAA stage
(d) At catenary action stage
Fig. 6.15: Actions in side beam-column joint
6.4 Summary
This chapter presents an experimental study on the behaviour of four exterior precast
concrete frames subject to column removal scenarios. Two types of reinforcement
detailing were used in the beam-column joints. The effect of the side column
dimensions on the resistance and failure mode was also investigated. Based on force
equilibrium, shear force in the joints and bending moments at the column sections
corresponding to the top and bottom faces of the bridging beam were calculated.
Tbt
Cb
Tcb1Ccb
Vb
VcbTcb2
Tbt
Tcb1
Tcb2
Tbb
Ccb
Vcb
Tct1
Tct2
Cct
Vct

CHAPTER 6 EXPERIMENTAL STUDY ON EXTERIOR PRECAST FRAMES
159
Strains of longitudinal reinforcement and horizontal hoops in the joints were also
measured. According to experimental results, the following conclusions are obtained.
(1) All the precast concrete frames were able to develop CAA in the bridging beam
under column removal scenarios. In comparison with frames EF-B-1.19/0.59S and
EF-L-1.19/0.59S with enlarged column cross section, relatively slender columns in
EF-B-1.19/0.59 and EF-L-1.19/0.59 limited the development of horizonta l
compression forces at CAA stage.
(2) Little catenary action was mobilised in frames EF-B-1.19/0.59 and EF-L-
1.19/0.59 due to premature shear failure in the side beam-column joints. By
increasing the size of side columns, frames EF-B-1.19/0.59S and EF-L-1.19/0.59S
developed significant catenary action, which even surpassed the CAA capacities.
(3) In EF-B-1.19/0.59 and EF-L-1.19/0.59, development of horizontal compression
force at CAA stage increased the shear force in the side joints by 8% compared to the
value calculated under flexural action, which induced severe diagonal shear cracking
in the joints. Frames EF-B-1.19/0.59S and EF-L-1.19/0.59S provided much greater
joint shear resistance due to larger cross section of the side columns. Therefore, shear
failure did not occur in the joints, even though the maximum shear force was
increased by around 15% than that under pure flexural action.
(4) Mobilisation of significant horizontal tension force in EF-B-1.19/0.59S and EF-
L-1.19/0.59S caused flexural failure of the side columns in the vicinity of the side
joints at catenary action stage. At failure, the moment capacity of column sections
was attained as a result of horizontal tension force acting on the column. With
increasing middle joint displacement, horizontal tension force could not increase
further.
To prevent shear failure in the beam-column joint and flexural failure of the side
column under column removal scenarios, horizontal forces have to be considered in
the design of columns and joints in exterior frames. However, the maximum
horizontal compression and tension forces developed in the bridging beam vary with
the column dimensions. By increasing the cross section of the side column, both are
expected to be increased due to stiffer horizontal and rotational restraints provided by
the column for the bridging beam, until the upper bound values are obtained.

CHAPTER 6 EXPERIMENTAL STUDY ON EXTERIOR PRECAST FRAMES
160
Therefore, further experimental and analytical studies are necessary to establish the
relationship between the column size and horizontal forces that are able to develop in
the frame.

CHAPTER 7 ANALYTICAL MODEL FOR CAA OF SUB-ASSEMBLAGES
161
CHAPTER 7 ANALYTICAL MODEL FOR COMPRESSIVE
ARCH ACTION OF BEAM-COLUMN SUB-ASSEMBLAGES
7.1 Introduction
Compressive arch action (CAA) represents a mechanism through which the
resistance of horizontally restrained beams is greatly enhanced due to the
development of axial compression force in the beam. A relatively small vertical
deflection of the bridging beam will lead to rotation and outward movement of the
beam ends against stiff boundaries, which in turn generates compressive thrusts in
between the flexural compression zones at the middle and end joints (Welch et al.
1999). These thrusts will result in an enhancement to moment resistance via arching
effect (Park and Gamble 2000).
Early researchers (Keenan 1969; Park 1964) proposed rigid-plastic analytical models
for predicting the peak capacity and corresponding mid-span deflection of one-way
slabs subjected to CAA. The term “rigid-plastic” refers to the assumption that plastic
hinges have developed at specified points and the one-way slab typically remains
rigid except for the elastic axial shortening and the inelastic rotation of plastic hinges
(Welch et al. 1999). These assumptions form the basis of the following mechanica l
models for predicting the CAA. Nevertheless, Park’s model (Park 1964) does not
provide a clear determination of the stress state of the steel bars in the compression
zones, thereby hindering the precise prediction of the CAA capacity of reinforced
concrete beams and slabs. In analysing the response of reinforced concrete slabs,
Guice et al. (1989) assumed that compressive concrete attained its ultimate strain and
calculated the compressive steel strain by using the plane-section assumption. This
method requires the predetermined peak capacity deflection which leads to
inaccuracy in predicting the response of slabs. Yu and Tan (2013a) proposed an
analytical procedure to predict the CAA capacity of beam-column sub-assemblages
under column removal scenarios and incorporated the rotational stiffness and
connection gap of supports into the model. It is capable of predicting the CAA
capacity and peak axial compression of sub-assemblages with reasonable accuracy.
However, in Yu and Tan’s model, the strain of extreme compression fibre is assumed

CHAPTER 7 ANALYTICAL MODEL FOR CAA OF SUB-ASSEMBLAGES
162
to be constant at the crushing strain of concrete. This assumption results in a reduction
in tensile strain of reinforcement, which violates the realistic variation of the tensile
strain (Yu 2012). Besides, application of the equivalent rectangular concrete block in
the model leads to an overestimation of vertical load at the initial stage. Therefore,
further improvement of the model is still needed.
In this chapter, in accordance with previous analytical studies, a new analytical model
is proposed for beam-column sub-assemblages incorporating the actual stress state of
compressive and tensile reinforcing bars. It can also consider tensile strength of
engineered cementitious composites (ECC). The mechanical model is calibrated with
experimental results of conventional concrete beam-column sub-assemblages, and is
utilised for predicting the behaviour of ECC sub-assemblages under column removal
scenarios. Finally, a series of parametric studies is conducted to investigate factors
that govern the CAA behaviour of beam-column sub-assemblages.
7.2 Development of the Analytical Model
Fig. 7.1: Geometric configuration of horizontally restrained beams
When subject to removal of a supporting middle column, the affected beam-column
sub-assemblage is able to develop CAA between the compression zones of the
bridging beam when the middle joint displacement is less than one beam depth, as
shown in Fig. 7.1. Based on rigid-plastic assumption, the system can be idealised as
two rigid beam segments and four zero-length hinges concentrated at the faces of the
middle joint and column stubs (see Fig. 7.2). The hinges at the interfaces sustain all
flexural rotations, whereas the beam segments only experience axial shortening
generated by net compression force in the beam (Park and Gamble 2000). However,
in either the prototype structure or the test setup, horizontal restraints on the beam-
column sub-assemblage are far from fully fixed with infinite stiffness, and it is
necessary to consider the actual horizontal movements and rotations of the supports
P
lβl
l

CHAPTER 7 ANALYTICAL MODEL FOR CAA OF SUB-ASSEMBLAGES
163
in the model. Comparatively, the vertical support on both beam ends plays a minor
role in the CAA capacity of the sub-assemblages. Therefore, only the effect of the
horizontal and rotational restraints is incorporated in the analytical model, as shown
in Fig. 7.2.
Fig. 7.2: Plastic hinge mechanism of beam-column sub-assemblages
7.2.1 Constitutive models
7.2.1.1 Steel reinforcement
Fig. 7.3: Stress-strain relationship of steel bars
Experimental tests on beam-column sub-assemblages demonstrate that strains of
beam bottom longitudinal reinforcement at the middle joint face and top
reinforcement at the end column stub face keep increasing under column removal
scenarios, whereas top steel bars at the middle joint and bottom bars at the end column
stub are subjected to compressive strains at the initial stage, and are gradually shifted
to tension with increasing middle joint displacement (Yu and Tan 2010a). Therefore,
the constitutive law of reinforcing bars has to be defined prior to the derivation of the
analytical model. Fig. 7.3 shows the elastic-perfectly-plastic stress-strain relationship
of steel bars, with yield strains of yε in tension and 'yε in compression. As the strain
lβl
l
δ
tt
plastic hinges
1
2
4
3Θ Θ
stress
strainεuεyε'y
f y
f 'yε'm

CHAPTER 7 ANALYTICAL MODEL FOR CAA OF SUB-ASSEMBLAGES
164
of compressive steel reinforcement is reduced at large deformations, a linear
unloading phase is defined in the compressive branch of the stress-strain curve, with
its stiffness equal to the elastic modulus of steel. Correspondingly, the stress-strain
relationship of steel reinforcement in tension and compression is expressed in Eqs.
(7-1) and (7-2).
s s sEσ ε= , if s yε ε< (7-1)
s yfσ = , if s yε ε≥ ' 's s sEσ ε= , if ' '
s yε ε< and ' 'm yε ε<
(7-2) ' 's yfσ = , if ' '
s yε ε≥ and ' 'm sε ε≤
( )' ' ' 's y m s sf Eσ ε ε= − − , if ' '
m yε ε≥ and ' 'm sε ε>
where sσ and 'sσ are the tensile and compressive stresses of reinforcement,
respectively; sE is the modulus of elasticity of steel bars; sε and 'sε are the tensile
and compressive strains of reinforcement; yε and 'yε are the yield strains of steel in
tension and compression, respectively; yf and 'yf are the tensile and compressive
yield strengths of steel reinforcement, respectively; and 'mε is the maximum
compressive strain that reinforcement has attained.
7.2.1.2 Concrete
In previous analytical studies on horizontally-restrained reinforced concrete slabs,
equivalent rectangular concrete stress block was used to determine the load-
displacement curves of slabs (Guice and Rhomberg 1988; Park and Gamble 2000).
A similar approach was used for beam-column sub-assemblages under column
removal scenarios (Yu and Tan 2013a). However, severe crushing of concrete
occurred in the compression zone of bridging beams at CAA stage, as discussed in
Section 3.4.5. Thus, under large deformations, rectangular concrete stress block is
not valid. Realistic stress-strain relationship of concrete has to be used to consider the
compressive stress of concrete when subjected to large strains. In deriving the
analytical model, the constitutive model for unconfined concrete in uniaxia l
compression proposed by Mander et al. (1988) is employed to calculate the
compression force sustained by concrete, as expressed in Eq. (7-3). Fig. 7.4 shows
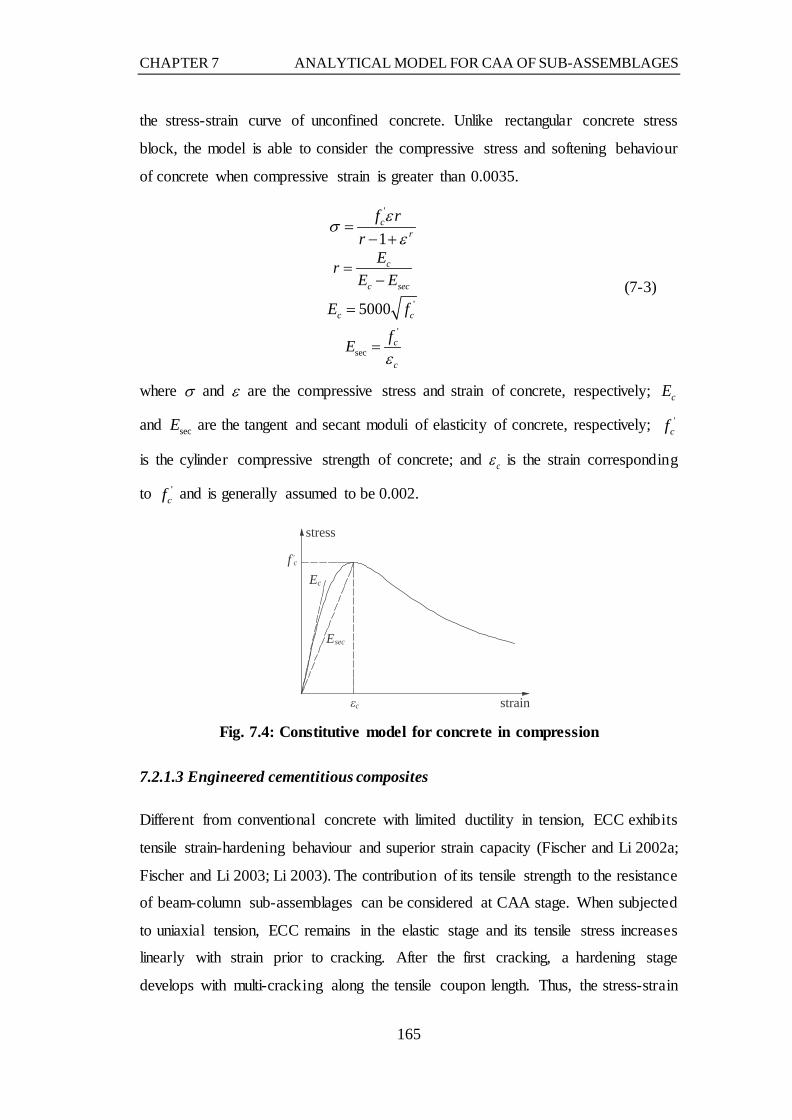
CHAPTER 7 ANALYTICAL MODEL FOR CAA OF SUB-ASSEMBLAGES
165
the stress-strain curve of unconfined concrete. Unlike rectangular concrete stress
block, the model is able to consider the compressive stress and softening behaviour
of concrete when compressive strain is greater than 0.0035.
'
1c
r
f rr
εσε
=− +
(7-3) c
c sec
ErE E
=−
'5000c cE f= '
secc
c
fEε
=
where σ and ε are the compressive stress and strain of concrete, respectively; cE
and secE are the tangent and secant moduli of elasticity of concrete, respectively; 'cf
is the cylinder compressive strength of concrete; and cε is the strain corresponding
to 'cf and is generally assumed to be 0.002.
Fig. 7.4: Constitutive model for concrete in compression
7.2.1.3 Engineered cementitious composites
Different from conventional concrete with limited ductility in tension, ECC exhibits
tensile strain-hardening behaviour and superior strain capacity (Fischer and Li 2002a;
Fischer and Li 2003; Li 2003). The contribution of its tensile strength to the resistance
of beam-column sub-assemblages can be considered at CAA stage. When subjected
to uniaxial tension, ECC remains in the elastic stage and its tensile stress increases
linearly with strain prior to cracking. After the first cracking, a hardening stage
develops with multi-cracking along the tensile coupon length. Thus, the stress-strain
stress
strainεc
f 'c
Esec
Ec

CHAPTER 7 ANALYTICAL MODEL FOR CAA OF SUB-ASSEMBLAGES
166
relationship of ECC can be simplified as a bilinear curve with hardening behaviour,
as shown in Fig. 7.5(a). Eq. (7-4) expresses the tensile stress-strain relationship of
ECC (Yuan et al. 2013).
tc
tc
σσ εε
= , if tcε ε≤ (7-4)
( ) tctc tu tc
tu tc
ε εσ σ σ σε ε
−= + −
−, if tc tuε ε ε< ≤
where tcσ and tcε are the first cracking strength and strain of ECC in tension; tuσ is
the ultimate tensile strength and tuε is the associated tensile strain at tuσ .
Under compression, a bilinear stress-strain relationship of ECC is assumed in the
ascending branch of compressive stress (Maalej and Li 1994), as shown in Fig. 7.5(b).
After attaining the compressive strength, the stress linearly drops to 50% of the
compressive strength, and then decreases slowly with increasing middle joint
displacement. Thus, a constant compressive stress is assumed with increasing
compressive strain. Eq. (7-5) expresses the compressive stress-strain relationship of
ECC (Yuan et al. 2013).
0
0
2 c
c
σσ εε
= , if 0103 cε ε≤ ≤
(7-5) ( )0
0 00
23 2
cc c
c
σσ σ ε εε
= + − , if 0 013 c cε ε ε≤ ≤
( ) 00 0
0
cc cu c
cu c
ε εσ σ σ σε ε
−= + −
−, if 0c cuε ε ε≤ ≤
cuσ σ= , if cuε ε≤
where 0cσ is the compressive strength of ECC; 0cε is the compressive strain at 0cσ ;
cuσ is the ultimate compressive strength in the post-peak branch; cuε is the ultima te
compressive strain. It is assumed that 00.5cu cσ σ= and 01.5cu cε ε= .

CHAPTER 7 ANALYTICAL MODEL FOR CAA OF SUB-ASSEMBLAGES
167
(a) In uniaxial tension
(b) In compression
Fig. 7.5: Stress-strain relationship of ECC
7.2.2 Equilibrium condition
Fig. 7.6: Free-body diagram of the single-span beam
Due to symmetry of geometry and loading, only the single-span beam is extracted
from the plastic hinge mechanism, as shown in Fig. 7.6. Through equilibrium (Yu
and Tan 2013a), the correlation between the applied vertical force on the middle joint
and corresponding vertical deflection can be established as:
( )21 22 2M M N ql
Pl
δ+ − −= (7-6)
where 1M and 2M are the bending moments at sections 1 (end support face) and 2
(middle joint face), respectively; N is the beam axial compression force; q is the
self-weight of the affected beam; l is the clear span of the beam; P is the
concentrated point force on the middle beam-column joint; and δ is the deflectio n
of the middle joint.
To derive the load-displacement curve of the beam, axial compression force N and
bending moments 1M and 2M have to be quantified based on the deformed
geometry shown in Fig. 7.6. Therefore, cross-sectional analysis at sections 1 and 2
are necessary. Fig. 7.7 shows the strain profile and internal force equilibrium at beam
stress
strainεtc εtu
σtu
σtc
stress
strainεcu
σco
2σco/3
εcoεco/3
σcu
1
2δ
M1
M2
N
N
P/2q
l
Rv

CHAPTER 7 ANALYTICAL MODEL FOR CAA OF SUB-ASSEMBLAGES
168
sections 1 and 2. It is assumed that the plane-section assumption is valid at large
deformation stage. Thus, a linear variation of strains is obtained across the section.
Correspondingly, force equilibrium at the section can be established through the
strain profile across the section and the respective material models for reinforc ing
bars, conventional concrete and ECC.
(a) Section 1 at end support
(b) Section 2 at middle joint
Fig. 7.7: Force equilibrium of beam sections
As ECC is utilised in the structural topping of beam-column sub-assemblages, its
tensile strength has to be considered at section 1 (within the depth of th ) subjected to
hogging moment. Compared to conventional concrete sub-assemblages, an additiona l
term is added to the equilibrium condition of internal forces at section 1 of ECC sub-
assemblages, as expressed in Eq. (7-7).
1
11 1
t
h c
t th c hT b dxσ
−
− −= ∫ (7-7)
where 1tT is the tension force sustained by the ECC topping; b is the width of the
beam section; h is the depth of the beam; th is the thickness of the ECC topping; 1c
is the neutral axis depth at section 1; and 1tσ is the tensile stress of the ECC topping.
f 's1
Neutral axis
f s1Ts1
Cc1
Cs1
M1
N
ε's1
c1a'
s1
as1
εt1
εc1b
h
ht εs1
σc1
σt1
T t1
as2
a's2
εc2
c2f '
s2
Neutral axis
f s1T s2
Cc2
Cs2
M2
N
ε's2
εs2
σc2

CHAPTER 7 ANALYTICAL MODEL FOR CAA OF SUB-ASSEMBLAGES
169
In the compression zone, the unconfined stress-strain model proposed by Mander et
al. (1988) is used to calculate the compression force instead of the equivalent
rectangular concrete stress block. Based on the plane-section assumption,
compressive strains of concrete fibres can be determined and associated compressive
stresses can be calculated using the constitutive model for concrete. Integration of
compressive stress across the compression zone is necessary at section 1 to quantify
the compression force sustained by the concrete, as expressed in Eq. (7-8).
1
1 10
c
c cC b dxσ= ∫ (7-8)
2
2 20
c
c cC b dxσ= ∫ (7-9)
where 1cC and 2cC are the compression forces in concrete; 1c and 2c are the
respective neutral axis depths at sections 1 and 2; 1cσ and 2cσ are the respective
compressive stresses of concrete.
A similar procedure can be used to calculate the internal forces at section 2. It is
notable that at section 2 only the beam longitudinal reinforcement sustains tension
force, whereas ECC topping is subjected to compression. The material model for
ECC is employed in Eq. (7-9) to compute the compression force.
In the analytical model, axial compression force in the beam is assumed to be constant
along the beam length (Park and Gamble 2000; Yu and Tan 2013a). From the interna l
force equilibrium illustrated in Fig. 7.7, axial compression force at section 1 is
expressed in Eq. (7-10). Bending moment at section 1 can be calculated. For ECC
sub-assemblages, total hogging moment is a summation of four terms, namely,
contributions of compressive concrete, compressive reinforcement, tensile
reinforcement and tensile ECC, as expressed in Eq. (7-11). Sagging moment at
section 2 is only contributed by three terms, as expressed in Eq. (7-12). Contribut ion
of tensile ECC is eliminated, as the ECC topping is in compression at section 2. The
material model for ECC in compression has to be used in Eq. (7-12) for ECC sub-
assemblages.
1 1 1 1 2 2 2c s s t c s sN C C T T C C T= + − − = + − (7-10)

CHAPTER 7 ANALYTICAL MODEL FOR CAA OF SUB-ASSEMBLAGES
170
( ) ( ) ( )
( )
1
1
1
'1 1 1 1 1 1 10
1 1
0.5 0.5 0.5
0.5t
c
c s s s s
h c
ch c h
M b h c x dx C h a T h a
b x c h dx
σ
σ−
− −
= − + + − + −
+ + −
∫∫
(7-11)
( ) ( ) ( )2 '2 2 2 2 2 2 20
0.5 0.5 0.5c
c s s s sM b h c x dx C h a T h aσ= − + + − + −∫ (7-12)
in which N is the net compression force in the beam; 1sC and 2sC are the
compression forces in the compressive reinforcement; 1sT and 2sT are the tension
forces sustained by reinforcement; 1sa and 2sa are the distances from the centroid of
tension reinforcement to the extreme tension fibre; '1sa and '
2sa are the distances
from the centroid of compression reinforcement to the extreme compression fibre, at
sections 1 and 2, respectively.
The single-span beam is assumed to sustain elastic compressive strain under CAA
due to the axial compression force. The compression force in the beam can be
quantified by its compressive strain (Yu 2012), as expressed in Eq. (7-13).
c bN bhE ε= (7-13)
in which bε is the axial compressive strain of the beam; cE is the equivalent modulus
of elasticity of the section, approximately equal to '4700 cf (ACI 2005). For
sections with several concrete layers of different strengths, the elastic modulus can
be calculated by ( )c ci i iE E b h bh= Σ .
Through internal force equilibrium of the single-span beam, the relationship between
the axial compression force and bending moment at the end section is established.
Nonetheless, in order to calculate the internal forces, neutral axis depths 1c and 2c ,
strains of compressive reinforcement '1sε and '
2sε , strains of tension steel 1sε and 2sε ,
concrete compressive strains 1cε and 2cε , and axial strain bε of the beam have to be
quantified at a certain middle joint displacement δ by means of compatibil ity
condition.

CHAPTER 7 ANALYTICAL MODEL FOR CAA OF SUB-ASSEMBLAGES
171
7.2.3 Compatibility condition
Fig. 7.8: Configuration of beam at small deformation stage
As assumed in previous analytical studies (Park and Gamble 2000; Welch et al. 1999),
all the flexural rotations are concentrated at the hinges at the beam ends, but the beam
sustains axial deformation induced by the constant compression force along the beam
length. Compatibility condition is established based on the rigid-plastic assumption.
In experimental tests, connection gaps between end column stubs and horizonta l
restraints significantly reduce the CAA capacities of sub-assemblages (Yu and Tan
2013a). When the middle joint displacement is relatively small, the beam is only
subjected to flexural action and no axial compression force develops due to the
connection gap between the beam and the horizontal support. The connection gap
also allows free rotation of the end support. Therefore, the connection gap and free
rotation of the end support have to be considered in the analytical model.
Fig. 7.8 shows the deformed configuration of the beam at the free rotation stage of
the end support. The beam only sustains sagging moment in the middle joint and axial
compression force has not been mobilised in the beam. Thus, the resultant force at
section 2 is zero. The initial connection gap is reduced by the vertical deflection of
the beam, as calculated from Eq. (7-14). However, the compatibility condition of the
beam cannot be invoked until the connection gap is closed up.
Endsupport
Top steel
Bottom steel
h
C
Middlecolumn
Bas1
a's1
as2
a's2
Cs2
Cc2D
Ts2
2
c2
Δl2
C
D
ε's2
l2
A
Strain profile of top bars
1
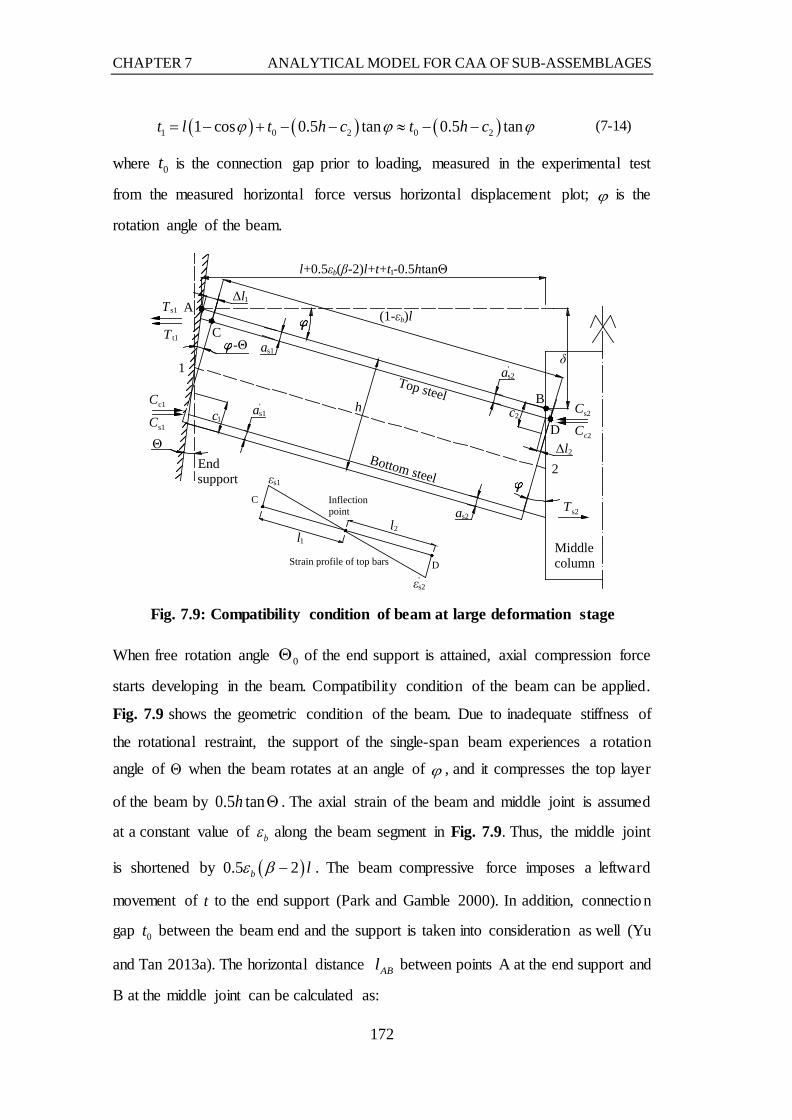
CHAPTER 7 ANALYTICAL MODEL FOR CAA OF SUB-ASSEMBLAGES
172
( ) ( ) ( )1 0 2 0 21 cos 0.5 tan 0.5 tant l t h c t h cϕ ϕ ϕ= − + − − ≈ − − (7-14)
where 0t is the connection gap prior to loading, measured in the experimental test
from the measured horizontal force versus horizontal displacement plot; ϕ is the
rotation angle of the beam.
Fig. 7.9: Compatibility condition of beam at large deformation stage
When free rotation angle 0Θ of the end support is attained, axial compression force
starts developing in the beam. Compatibility condition of the beam can be applied.
Fig. 7.9 shows the geometric condition of the beam. Due to inadequate stiffness of
the rotational restraint, the support of the single-span beam experiences a rotation
angle of Θ when the beam rotates at an angle of ϕ , and it compresses the top layer
of the beam by 0.5 tanh Θ . The axial strain of the beam and middle joint is assumed
at a constant value of bε along the beam segment in Fig. 7.9. Thus, the middle joint
is shortened by ( )0.5 2b lε β − . The beam compressive force imposes a leftward
movement of t to the end support (Park and Gamble 2000). In addition, connection
gap 0t between the beam end and the support is taken into consideration as well (Yu
and Tan 2013a). The horizontal distance ABl between points A at the end support and
B at the middle joint can be calculated as:
Top steel
Bottom steel
δ
Cs2
Cc2
Ts2
Θ
-Θ
1
2
A
Bh
Middlecolumn
Endsupport
Cs1
Cc1
Ts1
l+0.5εb(β-2)l+t+t1-0.5htanΘ
c1 c2
(1-εb)lT t1
a's1
as1
a's2
as2
C
D
Δl1
Δl2
εs1
l2
C
D
ε's2
Inflectionpoint
Strain profile of top bars
l1

CHAPTER 7 ANALYTICAL MODEL FOR CAA OF SUB-ASSEMBLAGES
173
( ) 010.5 ( 2) 0.5 tanAB bl l l t t hε β= + − + + − Θ (7-15)
where t and Θ are the horizontal translation and the rotation of the end support,
respectively.
Support movement t and rotation Θ can be determined by Eqs. (7-16) and (7-17),
respectively. In calculating aK and rK from experimental results, the approach
recommended by Yu and Tan (2013a) is employed.
at N K= (7-16)
0 1 rM KΘ = Θ + (7-17)
where aK and rK are the respective stiffnesses of horizontal and rotationa l
restraints, and 0Θ is the free rotation angle of the end support induced by the
connection gap.
From the geometric compatibility condition of the beam (Yu and Tan 2013a), the
spacing ABl between points A and B can also be expressed in Eq. (7-18). Accordingly,
vertical displacement of the middle joint is calculated from Eq. (7-19).
( ) ( ) ( )( )1 221 tan( ) tan cosAB bl l h c cε ϕ ϕ ϕ= − + − − Θ − (7-18)
( )00.5 (1 2 ) 0.5 tan tanbl l t t hδ ε β ϕ= + − + + − Θ (7-19)
In order to determine the strain profiles at sections 1 and 2, it is assumed that the
strain of beam top longitudinal reinforcement is zero at the inflection point of the
beam and varies linearly between the inflection point and beam end sections, as
shown in Fig. 7.9. Accordingly, at the centroid of reinforcement, total elongation of
the top reinforcement between the inflection point and section 1 is equal to the
distance between the left end of the beam and support, and the shortening of the bar
between section 2 and inflection point is equal to the distance between the right end
of the beam and middle joint interface, as expressed in Eqs. (7-20) and (7-21).
( )1 1 1 1 1tan( ) 0.5s sl h c a lϕ ε∆ = − − − Θ = (7-20)
( )' '2 2 2 2 2tan 0.5s sl c a lϕ ε∆ = − = (7-21)

CHAPTER 7 ANALYTICAL MODEL FOR CAA OF SUB-ASSEMBLAGES
174
where 1l and 2l are the respective distances from the inflection point of the beam to
its left and right ends; 1sε is the tensile strain of top reinforcement at section 1; and
'2sε is the compressive strain of top reinforcement at section 2.
Due to different ratios of top and bottom longitudinal reinforcement in the beam, the
inflection point is not located at the mid-span of the beam between the end support
and middle joint. It shifts with increasing middle joint displacement at large
deformation stage. The position of the inflection point is determined by the bending
moments at sections 1 and 2, as expressed in Eqs. (7-22) and (7-23). The presence of
axial compression force in the beam will reduce the length of beam segment between
the inflection point and end support (section 1). However, in comparison with the
maximum strain of tension reinforcement generated by bending moment, the beam
compressive strain is much smaller, and can be neglected in the model. Thus, the
original beam length is used in place of its deformed length.
11
1 2
lMlM M
=+
(7-22)
22
1 2
lMlM M
=+
(7-23)
where 1M is the hogging moment at section 1; 2M is the sagging moment at section
2. It is notable that 1M is zero at free rotation stage of the end support.
After determining the neutral axis depth and steel strain at each section, the strain
profile can be determined in accordance with the plane-section assumption, as
expressed in Eq. (7-24) to Eq. (7-28).
'' 1 11 1
1 1
ss s
s
c ah c a
ε ε−=
− − (7-24)
'2 22 2'
2 2
ss s
s
h c ac a
ε ε− −=
− (7-25)
'11 1
1 1c s
s
cc a
ε ε=−
(7-26)
'22 2
2 2c s
s
cc a
ε ε=−
(7-27)
11 1
1 1t s
s
h ch c a
ε ε−=
− − (7-28)

CHAPTER 7 ANALYTICAL MODEL FOR CAA OF SUB-ASSEMBLAGES
175
where '1sε is the compressive strain of bottom reinforcement at section 1; 2sε is the
tensile strain of bottom reinforcement at section 2; 1cε and 2cε are the strains of
extreme compression fibres at sections 1 and 2, respectively; and 1tε is the strain of
extreme tension fibre.
7.2.4 Solution procedure
Due to the presence of the connection gap between the beam and end support,
compatibility condition of the beam is not satisfied at the initial stage. Only force
equilibrium is considered when rotation ϕ of the beam is smaller than free rotation
angle 0Θ of the end support. Based on the deformed geometry of the beam, as shown
in Fig. 7.8, neutral axis depth 2c at section 2 is assumed. Due to zero hogging
moment at section 1, 2l is equal to l at this stage, and compressive strain '2sε of the
top longitudinal reinforcement at section 2 is calculated from Eq. (7-21). Accordingly,
tensile strain 2sε of the bottom reinforcement and strain 2cε of the extreme
compression concrete fibre are determined via Eqs. (7-25) and (7-27). Based on the
material models for steel reinforcement and concrete, force equilibrium at section 2
is established through Eq. (7-10). It has to be mentioned that bε , t , 1M and N are
zero, and Θ is equal to ϕ at this stage. Once force equilibrium is satisfied, bending
moment 2M at section 2 is computed from Eq. (7-12). Finally, vertical displacement
of the middle joint and applied load are calculated from Eqs. (7-19) and (7-6),
respectively.
When rotation ϕ of the beam surpasses free rotation angle 0Θ of the end support,
compatibility condition in Fig. 7.9 has to be satisfied in calculating the vertical load
and middle joint displacement. A set of solution procedure is proposed for calculat ing
the CAA capacity of beam-column sub-assemblages under middle column removal
scenarios, as illustrated in Fig. 7.10. In each step, rotation angle ϕ − Θ and neutral
axis depth 1c are assumed at section 1. Initially hogging moment 10M at section 1
has to be assumed so as to determine 1l and 2l from Eqs. (7-22) and (7-23). 2M

CHAPTER 7 ANALYTICAL MODEL FOR CAA OF SUB-ASSEMBLAGES
176
calculated in the previous step is used to locate the inflection point of the beam.
Tensile strain 1sε of the top reinforcement at section 1 is obtained through Eq. (7-20),
and compressive strain '1sε of the bottom reinforcement and concrete strain 1cε are
determined based on the plane-section assumption, as expressed in Eqs. (7-24) and
(7-26). Correspondingly, axial force 1N and bending moment 1M are calculated
through Eqs. (7-10) and (7-11). The analytical procedure continues if 1M is
approximately equal to the initially assumed value within a limited tolerance tolM∆ .
At section 2, neutral axis depth 2c is assumed, and a similar procedure as
abovementioned is repeated to determine axial force 2N and bending moment 2M .
When 1N and 2N are close to each other within a small tolerance tolN∆ , geometric
compatibility condition of the beam is examined via Eqs. (7-15) and (7-18). Once the
compatibility condition is satisfied, the vertical displacement and applied load can be
calculated from Eqs. (7-19) and (7-6).

CHAPTER 7 ANALYTICAL MODEL FOR CAA OF SUB-ASSEMBLAGES
177
Determine the geometry, material properties and boundary conditionsDetermine the geometry, material
properties and boundary conditions
Input Input ϕ
Assume a (from zero to one beam depth)Assume a (from zero to one beam depth)1c
Assume a Assume a 10M
Calculate , , and via Eqs. (7-17), (7-20), (7-24), (7-26) and (7-28)
Calculate , , and via Eqs. (7-17), (7-20), (7-24), (7-26) and (7-28)
1sε '1sε 1cε
Calculate and via Eqs. (7-7), (7-8), (7-10) and (7-11)
Calculate and via Eqs. (7-7), (7-8), (7-10) and (7-11)
1M 1N
1 1o tolM M M− ≤ ∆
1tε
NoNo
Input (from zero to one beam depth)Input (from zero to one beam depth)YesYes
2c
Calculate , and via Eqs. (7-21), (7-25) and (7-27)Calculate , and via Eqs. (7-21), (7-25) and (7-27)2sε '2sε 2cε
Calculate and via Eqs. (7-9), (7-10) and (7-12)
Calculate and via Eqs. (7-9), (7-10) and (7-12)
2M 2N
1 2 tolN N N− ≤ ∆
YesYes
NoNo
Calculate and via Eqs. (7-13), (7-16), (7-15) and (7-18)
Calculate and via Eqs. (7-13), (7-16), (7-15) and (7-18)
( )1ABl ( )2ABl
( ) ( )1 2AB AB toll l l− ≤ ∆
Calculate and via Eqs. (7-6) and (7-19), respectively
Calculate and via Eqs. (7-6) and (7-19), respectively
P δYesYes
NoNo
Plot load-deflection and axial force-deflection curvesPlot load-deflection and axial force-deflection curves
reac
hes i
ts li
mit
reac
hes i
ts li
mit
2c
IncreaseIncrease ϕ
Calculate and by substituting and into Eqs. (7-22) and (7-23)
Calculate and by substituting and into Eqs. (7-22) and (7-23)
1l 2l 10M 2M
Fig. 7.10: Solution procedure for the analytical model

CHAPTER 7 ANALYTICAL MODEL FOR CAA OF SUB-ASSEMBLAGES
178
7.3 Validation of the Analytical Model
The proposed analytical model is validated by experimental results of reinforced
concrete sub-assemblages under column removal scenarios (FarhangVesali et al.
2013; Yu and Tan 2013a). FarhangVesali et al. (2013) did not measure the stiffness
of horizontal restraints in the experimental tests. Thus, referring to Yu and Tan’s
analytical study (Yu and Tan 2013a), horizontal stiffness of each sub-assemblage is
determined to be 1.0x10⁶ kN/m. Free rotation of the end column stub is not considered
for reinforced concrete sub-assemblages tested by Yu (2012). Besides, precast
concrete sub-assemblages with conventional concrete and ECC are also simulated in
the model. It is noteworthy that pull-out failure of longitudinal reinforcement
embedded in the joint is not considered in the model, and thus only conventiona l
concrete sub-assemblage MJ-B-0.52/0.35S is analysed through the model. Table 7.1
lists the boundary conditions of the specimens used in the verification studies. In the
following sections, comparisons are made between the experimental and analytica l
results. Moreover, variations of strains of steel reinforcement and concrete fibres are
also shown to gain a deeper insight into the behaviour of sub-assemblages subjected
to CAA.
Table 7.1: Boundary conditions of beam-column sub-assemblages
Specimen Cross
section (mm)
Clear span (mm)
Boundary conditions
Axial stiffness (kN/m)
Connection gap (mm)
Rotational stiffness
(kN.m/rad)
Free rotation angle
(radian)
FarhangVesali et
al. (2013)
F1
180x180 2200 1.0x10⁶ 0
1.45x10⁴
0
F2 1.35x10⁴
F3 1.85x10⁴
F4 1.80x10⁴
F5 1.60x10⁴
F6 1.45x10⁴
Yu and Tan
(2013a)
S1
150x250 2750
1.06x10⁵ 0.5
1.0x10⁴
0
S2 1.2
S3
4.29x10⁵
1.2
3.0x10⁴ S4 1.0
S5 0.8
S6 0.8

CHAPTER 7 ANALYTICAL MODEL FOR CAA OF SUB-ASSEMBLAGES
179
S7 2150 1.2
S8 1550 0.8
MJ-B-0.52/0.35S
150x300 2750
1.51x10⁵ 1.1 2.14x10⁴ 0.005
CMJ-B-1.19/0.59 2.05x10⁵ 0.9 1.99x10⁴ 0.01
EMJ-B-1.19/0.59* 1.83x105 0.7 1.49x10⁴ 0.006
EMJ-B-0.88/0.59* 1.49x105 0.8 2.30x10⁴ 0.008
EMJ-L-1.19/0.59* 1.77x105 0.2 1.72x10⁴ 0.01
EMJ-L-0.88/0.59* 1.59x105 0.4 2.44x10⁴ 0.008 *: “EMJ” represents beam-column sub-assemblages with ECC in the structural topping and the beam-column joint.
7.3.1 Prediction of CAA capacity and horizontal reaction force
Table 7.2 shows the predicted CAA capacities and horizontal compression forces.
The mean ratio of the analytical and experimental CAA capacities is 0.99, with a
coefficient of variation of 0.05. It indicates that the analytical model gives very good
predictions of the CAA capacity of beam-column sub-assemblages. The horizonta l
compression force in the beams is slightly overestimated, with an average ratio of
1.04 and a coefficient of variation of 0.09, as it is more sensitive to the boundary
conditions of sub-assemblages than the CAA capacity. It is noteworthy that due to
constraints of test set-up, horizontal compression force could not be quantified in
reinforced concrete beam-column sub-assemblages tested by FarhangVesali et al.
(2013).
Table 7.2: Comparisons of experimental and analytical results
Author and Specimen
Capacity of CAA Maximum axial compression Experimental results cP
(kN)
Analytical results aP
(kN)
a
c
PP
Experimental results cN
(kN)
Analytical results aN
(kN)
a
c
NN
FarhangVesali et
al. (2013)
F1 40.5 37.5 0.93 -- 211.1 --
F2 35.7 35.7 1.00 -- 193.0 --
F3 41.4 37.5 0.91 -- 210.6 --
F4 40.1 39.3 0.98 -- 177.9 --
F5 41.6 39.3 0.94 -- 189.3 --
F6 39.4 39.5 1.00 -- 191.7 --
Yu and Tan
(2013a)
S1 41.6 41.9 1.01 177.9 186.7 1.05 S2 38.4 36.8 0.96 155.9 169.2 1.09 S3 54.5 51.8 0.95 221.0 235.3 1.06 S4 63.2 59.1 0.94 212.7 251.8 1.18

CHAPTER 7 ANALYTICAL MODEL FOR CAA OF SUB-ASSEMBLAGES
180
S5 70.3 68.4 0.97 238.4 267.5 1.12 S6 70.3 71.0 1.01 218.1 221.7 1.02 S7 82.8 82.9 1.00 233.1 272.0 1.17 S8 121.3 129.5 1.07 272.5 293.8 1.08
MJ-B-0.52/0.35S 50.5 48.5 0.96 231.3 239.0 1.03 CMJ-B-1.19/0.59 90.4 94.5 1.05 281.1 288.2 1.03 EMJ-B-1.19/0.59 91.1 99.0 1.09 274.7 271.6 0.99 EMJ-B-0.88/0.59 83.7 86.4 1.03 262.8 276.6 1.05 EMJ-L-1.19/0.59 91.1 93.1 1.02 305.8 271.1 0.89 EMJ-L-0.88/0.59 82.5 82.1 1.00 317.7 273.9 0.86
Mean value 0.99 1.04 Coefficient of variation 0.05 0.09
7.3.2 Prediction of load-displacement curve
Fig. 7.11 and Fig. 7.12 show the comparisons between the analytical and
experimental vertical load-middle joint displacement curves. It indicates that the
analytical model is capable of predicting the vertical load-middle joint displacement
curve with reasonable accuracy. However, rupture of beam bottom reinforcement at
the middle joint interface cannot be predicted, as it involves localised strain
concentration of reinforcement at the face of middle joint. Thus, beyond the CAA
capacity, the calculated vertical load decreases slowly with increasing middle joint
displacement.
0 50 100 150 200 2500
10
20
30
40
50
Verti
cal l
oad
(kN)
Middle joint displacement (mm)
S1-Experimental S1-Analytical S2-Experimental S2-Analytical
(a) S1 and S2
0 25 50 75 100 125 1500
10
20
30
40
50
Verti
cal l
oad
(kN)
Middle joint displacement (mm)
F1-Experimental F1-Analytical F2-Experimental F2-Analytical
(b) F1 and F2
Fig. 7.11: Comparisons of analytical and experimental vertical load-middle joint displacement curves of reinforced concrete sub-assemblages

CHAPTER 7 ANALYTICAL MODEL FOR CAA OF SUB-ASSEMBLAGES
181
0 50 100 150 200 250 3000
10
20
30
40
50
60
Verti
cal l
oad
(kN)
Middle joint displacement (mm)
Experimental results Analytical results
(a) MJ-B-0.52/0.35S
0 50 100 150 200 250 3000
20
40
60
80
100
120
Ver
tical
load
(kN
)
Middle joint displacement (mm)
Experimental results Analytical results
(b) CMJ-B-1.19/0.59
0 50 100 150 200 250 3000
20
40
60
80
100
120
Ver
tical
load
(kN
)
Middle joint displacement (mm)
Experimental results Analytical results
(c) EMJ-B-1.19/0.59
0 50 100 150 200 250 3000
20
40
60
80
100
Verti
cal l
oad
(kN)
Middle joint displacement (mm)
Experimental results Analytical results
(d) EMJ-B-0.88/0.59
0 50 100 150 200 250 3000
20
40
60
80
100
120
Verti
cal l
oad
(kN)
Middle joint displacement (mm)
Experimental results Analytical results
(e) EMJ-L-1.19/0.59
0 50 100 150 200 250 3000
20
40
60
80
100
Verti
cal l
oad
(kN)
Middle joint displacement (mm)
Experimental results Analytical results
(f) EMJ-L-0.88/0.59
Fig. 7.12: Comparisons of analytical and experimental vertical load-middle joint displacement curves of precast beam-column sub-assemblages

CHAPTER 7 ANALYTICAL MODEL FOR CAA OF SUB-ASSEMBLAGES
182
0 50 100 150 200 250 300-300
-250
-200
-150
-100
-50
0Ho
rizon
tal re
actio
n fo
rce (
kN)
Middle joint displacement (mm)
Experimental results Analytical results
(a) MJ-B-0.52/0.35S
0 50 100 150 200 250 300-350
-300
-250
-200
-150
-100
-50
0
Horiz
ontal
reac
tion
forc
e (kN
)
Middle joint displacement (mm)
Experimental results Analytical results
(b) CMJ-B-1.19/0.59
0 50 100 150 200 250 300-300
-250
-200
-150
-100
-50
0
Horiz
ontal
reac
tion
forc
e (kN
)
Middle joint displacement (mm)
Experimental results Analytical results
(c) EMJ-B-1.19/0.59
0 50 100 150 200 250 300-300
-250
-200
-150
-100
-50
0
Horiz
ontal
reac
tion
forc
e (kN
)
Middle joint displacement (mm)
Experimental results Analytical results
(d) EMJ-B-0.88/0.59
0 50 100 150 200 250 300-350
-300
-250
-200
-150
-100
-50
0
Horiz
ontal
reac
tion
forc
e (kN
)
Middle joint displacement (mm)
Experimental results Analytical results
(e) EMJ-L-1.19/0.59
0 50 100 150 200 250 300-350
-300
-250
-200
-150
-100
-50
0
Horiz
ontal
reac
tion
forc
e (kN
)
Middle joint displacement (mm)
Experimental results Analytical results
(f) EMJ-L-0.88/0.59
Fig. 7.13: Comparisons of analytical and experimental horizontal reaction force-middle joint displacement curves of precast beam-column sub-
assemblages
With respect to the horizontal reaction force-middle joint displacement curve, good
agreement is reached between the analytical and experimental results, as shown in
Fig. 7.13. At the initial stage, horizontal force is zero due to free rotation of the end

CHAPTER 7 ANALYTICAL MODEL FOR CAA OF SUB-ASSEMBLAGES
183
column stub. Once the connection gap is closed up, horizontal compression force in
the bridging beam starts increasing until it attains the maximum value. With
increasing middle joint displacement, the horizontal compression force decreases due
to crushing of concrete in the compression zones of the beam. The analytical model
cannot predict well this part of the curve, as spalling of concrete is not considered in
Mander’s concrete model.
7.3.3 Variation of bending moments
Sagging moment at the middle joint and hogging moment at the end support can also
be obtained using the model. Fig. 7.14 shows the variations of bending moments with
middle joint displacement of ECC sub-assemblage EMJ-B-1.19/0.59. The predicted
sagging moment at the middle joint agrees well with the experimental results. In the
descending branch of sagging moment, rupture of bottom reinforcement at the middle
joint interface led to a drop of sagging moment, as shown in Fig. 7.14(a). However,
this phenomenon cannot be captured by the model. At the end support, the maximum
hogging moment is predicted earlier than the experimental curve (see Fig. 7.14(b)).
0 50 100 150 200 250 3000
20
40
60
80
Sagg
ing
mom
ent a
t mid
dle j
oint
(kN.
m)
Middle joint displacement (mm)
Analytical results Experimental results
(a) Sagging moment at the middle joint
0 50 100 150 200 250 300-120
-100
-80
-60
-40
-20
0
20
Hogg
ing
mom
ent a
t end
supp
ort (
kN.m
)
Middle joint displacement (mm)
Analytical results Experimental results
(b) Hogging moment at the end support
Fig. 7.14: Variations of bending moments at the middle joint and end support
7.3.4 Estimate of neutral axis depth and reinforcement strain
To investigate the behaviour of beam-column sub-assemblages at the fibre level, Fig.
7.15 shows the strains of reinforcing bars and concrete fibre at each end of the beam
in sub-assemblage EMJ-B-1.19/0.59. Even though the absolute value of the steel

CHAPTER 7 ANALYTICAL MODEL FOR CAA OF SUB-ASSEMBLAGES
184
strain is substantially underestimated in the model, the overall trend agrees well with
the experimental results. Strains of tensile reinforcement keep increasing at the
middle joint and end support, as shown in Fig. 7.15(a). Tensile strain of the bottom
reinforcement at the middle joint is several times larger than that of the top
reinforcement at the end support. Thus, rupture of bottom reinforcement at the middle
joint interface occurs earlier than top reinforcement at the end support. A simila r
variation of extreme compression concrete fibres is obtained, as shown in Fig. 7.15(b).
However, strains of compressive reinforcement increase at CAA stage and then
decrease with increasing middle joint displacement (see Fig. 7.15(c)), in particula r,
at the middle joint. Moreover, compressive strain of the top reinforcement at the
middle joint is considerably smaller than that of the bottom reinforcement at the end
support, due to a greater compressive reinforcement ratio and a smaller neutral axis
depth at the middle joint.
Neutral axis depth at the beam end sections can also be obtained in the analytica l
model. Fig. 7.16 shows the variations of neutral axis depths with middle joint
displacement. Compared to the end support, compressive reinforcement ratio is
greater but tensile reinforcement ratio is smaller at the middle joint. Correspondingly,
the neutral axis depth at the middle joint is significantly smaller than that at the end
support. It continues to decrease with increasing middle joint displacement at CAA
stage. However, different variation of the neutral axis depth is obtained at the end
support. At the initial stage, neutral axis depth at the end support is zero due to free
rotation of the end column stub, and it attains a peak value when the beam top
reinforcement yields. Following the yielding of top tensile reinforcement at the end
section, the neutral axis depth decreases slightly with increasing middle joint
displacement, and then crushing of compressive concrete increases the neutral axis
depth at the end support. A further increase in the middle joint displacement decreases
the neutral axis depth at the end support.

CHAPTER 7 ANALYTICAL MODEL FOR CAA OF SUB-ASSEMBLAGES
185
0 50 100 150 200 250 3000.00
0.01
0.02
0.03
0.04
0.05
Stra
in o
f ten
sile r
einfo
rcem
ent
Middle joint displacement (mm)
At the end support At the middle joint
(a) Tensile reinforcement
0 50 100 150 200 250 300-0.012
-0.009
-0.006
-0.003
0.000
0.003
Stra
in o
f com
pres
sive c
oncr
ete f
ibre
Middle joint displacement (mm)
At the end support At the middle joint
(b) Extreme compression concrete fibre
0 50 100 150 200 250 300-0.008
-0.006
-0.004
-0.002
0.000
0.002
Stra
in o
f com
pres
sive r
einf
orce
men
t
Middle joint displacement (mm)
At the end support At the middle joint
(c) Compressive reinforcement
Fig. 7.15: Variations of numerical strains of steel reinforcement and concrete with middle joint displacement
0 50 100 150 200 250 3000
30
60
90
120
150
Neu
tral a
xis d
epth
(mm
)
Middle joint displacement (mm)
At the end support At the middle joint
Fig. 7.16: Variations of neutral axis depths with middle joint displacement
7.4 Limitations of the Analytical Model
Several limitations are identified in the analytical model as follows:

CHAPTER 7 ANALYTICAL MODEL FOR CAA OF SUB-ASSEMBLAGES
186
(1) The analytical model is not applicable if horizontal shear cracking occurs between
the precast beam units and cast-in-situ concrete topping, as full composite action
between the precast beam unit and concrete topping is assumed in the model.
(2) The strain profile of top longitudinal reinforcement is assumed to be linear
between the inflection point and beam end sections and flexural deformations of the
beam are totally concentrated at the beam ends. However, after yielding of top
reinforcement near the end support, tensile strain of longitudinal reinforcement in the
plastic hinge region is substantially greater than that in the middle portion of the beam,
as reported by Yu and Tan (2013c). A similar variation of compressive strain is also
observed at the face of the middle joint. Therefore, the assumption significant ly
underestimates the maximum strains of steel reinforcement at the middle joint and
end column stub. Accordingly, rupture of longitudinal reinforcement cannot be
predicted in the analytical model.
(3) Due to underestimation of strains at the end support, the contribution of ECC to
the resistance of beam-column sub-assemblages is exaggerated at large deformation
stage, as its tensile strain capacity is attained later in the analytical model than in the
experimental test.
(4) Spalling of concrete in the compression zone is not considered, which results in
increasing discrepancy between the experimental and analytical results in the
descending phase of the vertical load and horizontal reaction force.
7.5 Parametric Studies
Through the proposed analytical model, a series of parametric studies is conducted to
investigate the effects of different concrete models, tensile strength and strain
capacity of ECC, stiffness of horizontal restraint, and longitudinal reinforcement
ratios on the CAA of beam-column sub-assemblages. Beam-column sub-assemblage
EMJ-B-1.19/0.59 is selected as a benchmark in the parametric studies.
7.5.1 Effect of concrete models
In the flexural design of reinforced concrete members, equivalent rectangula r
concrete stress block is generally used to calculate the compression force sustained

CHAPTER 7 ANALYTICAL MODEL FOR CAA OF SUB-ASSEMBLAGES
187
by concrete. However, at large deformation stage, the rectangular stress block is no
longer appropriate due to crushing and spalling of concrete in the compression zone.
Stress-strain models for concrete have to be employed in place of the equivalent
rectangular concrete stress block. In the analytical model, the concrete model
proposed by Mander et al. (1988) is used to predict the CAA capacity of beam-
column sub-assemblages and reasonably accurate results are obtained. Furthermore,
the behaviour of beam-column sub-assemblages may vary greatly through different
stress-strain models for concrete, in particular, the descending branch due to the
assumption of linear strain variation along the beam length. Therefore, it is necessary
to evaluate the effect of concrete models on the behaviour of beam-column sub-
assemblages at CAA stage.
0.000 0.002 0.004 0.006 0.008 0.0100
10
20
30
40
50
Com
pres
sive s
tress
(MPa
)
Compressive strain
Mander's model Maekawa's model Modified Kent and Park model
Fig. 7.17: Comparison of stress-strain models for concrete
0 50 100 150 200 250 3000
20
40
60
80
100
Ver
tical
load
(kN
)
Middle joint displacement (mm)
Mander's model Maekawa's model Modified Kent and Park model Experimental results
(a) Vertical load-middle joint displacement
curve
0 50 100 150 200 250 300-300
-250
-200
-150
-100
-50
0
50
Horiz
ontal
reac
tion
forc
e (kN
)
Middle joint displacement (mm)
Mander's model Maekawa's model Modified Kent and Park model Experimental results
(b) Horizontal reaction force-middle joint
displacement curve
Fig. 7.18: Comparisons of load-displacement curves with different concrete models

CHAPTER 7 ANALYTICAL MODEL FOR CAA OF SUB-ASSEMBLAGES
188
Besides Mander’s model, stress-strain model proposed by Maekawa et al. (2003) and
modified Kent and Park model (Scott et al. 1982) are also incorporated in the
analytical model. Fig. 7.17 shows the comparisons among the three concrete models.
Limited differences exist in the ascending branch of the stress-strain curves. However,
the concrete models differ greatly from one another in the descending branch, which
may affect the behaviour of beam-column sub-assemblages at large deformation
stage.
Fig. 7.18 shows the predicted vertical loads and horizontal compression forces with
different concrete models. Comparisons among the analytical results indicate that
almost the same CAA capacities of the sub-assemblage are estimated with different
concrete models, as shown in Fig. 7.18(a). However, significant differences exist in
the descending phase of the vertical load. Maekawa’s model provides the least
descending vertical load beyond the CAA capacity, whereas modified Kent and Park
model predicts the most significant descending phase. The predicted horizonta l
compression forces also vary from each other, as shown in Fig. 7.18(b). Maekawa’s
model overestimates the maximum compression force due to its more ductile stress-
strain relationship, but modified Kent and Park model substantially underestimates
the peak compression force due to its brittle stress-strain model. Therefore, the
concrete model plays a significant role in the development of compression force in
the beam.
0 50 100 150 200 250 3000
15
30
45
60
75
Sagg
ing
mom
ent a
t end
supp
ort (
kN.m
)
Middle joint displacement (mm)
Mander's model Maekawa's model Modified Kent and Park model Experimental results
(a) Sagging moment at the middle joint
0 50 100 150 200 250 300-120
-100
-80
-60
-40
-20
0
20
Hogg
ing
mom
ent a
t end
supp
ort (
kN.m
)
Middle joint displacement (mm)
Mander's model Maekawa's model Modified Kent and Park model Experimental results
(b) Hogging moment at the end support
Fig. 7.19: Comparisons of bending moments at the middle joint and end support

CHAPTER 7 ANALYTICAL MODEL FOR CAA OF SUB-ASSEMBLAGES
189
Fig. 7.19 shows the comparisons of sagging moment at the middle joint and hogging
moment at the end support. It is observed that the three concrete models predict
almost the same ascending branch of bending moments at the middle joint and end
support. With regard to the maximum sagging and hogging moments, Maekawa’s
model provides the greatest value and modified Kent and Park model gives the
smallest value. Similar results are obtained in the descending branch of bending
moments, as shown in Figs. 7.19(a and b).
0 50 100 150 200 250 3000
15
30
45
60
75
90
Neut
ral a
xis d
epth
at m
iddl
e joi
nt (m
m)
Middle joint displacement (mm)
Mander's model Maekawa's model Modified Kent and Park model
(a) At the middle joint
0 50 100 150 200 250 3000
30
60
90
120
150
180
Neu
tral a
xis d
epth
at en
d su
ppor
t (m
m)
Middle joint displacement (mm)
Mander's model Maekawa's model Modified Kent and Park model
(b) At the end support
Fig. 7.20: Comparisons of neutral axis depths with different concrete models
Variations of neutral axis depths at the middle joint and end support are also estimated
using the analytical model. Fig. 7.20 shows the comparisons of the neutral axis depths
at the end support and middle joint. When the middle joint displacement is smaller
than 100 mm, similar neutral axis depths are obtained at the end support and middle
joint through different concrete models, as shown in Figs. 7.20(a and b). With middle
joint displacement greater than 100 mm, the neutral axis depths start deviating from
one another, in particular, at the end support (see Fig. 7.20(b)). It is due to different
descending branches of the stress-strain models for concrete. At the middle joint,
there is less deviation of neutral axis depth as a result of a greater compressive
reinforcement ratio and relatively less contribution of concrete to total force in the
compression zone.
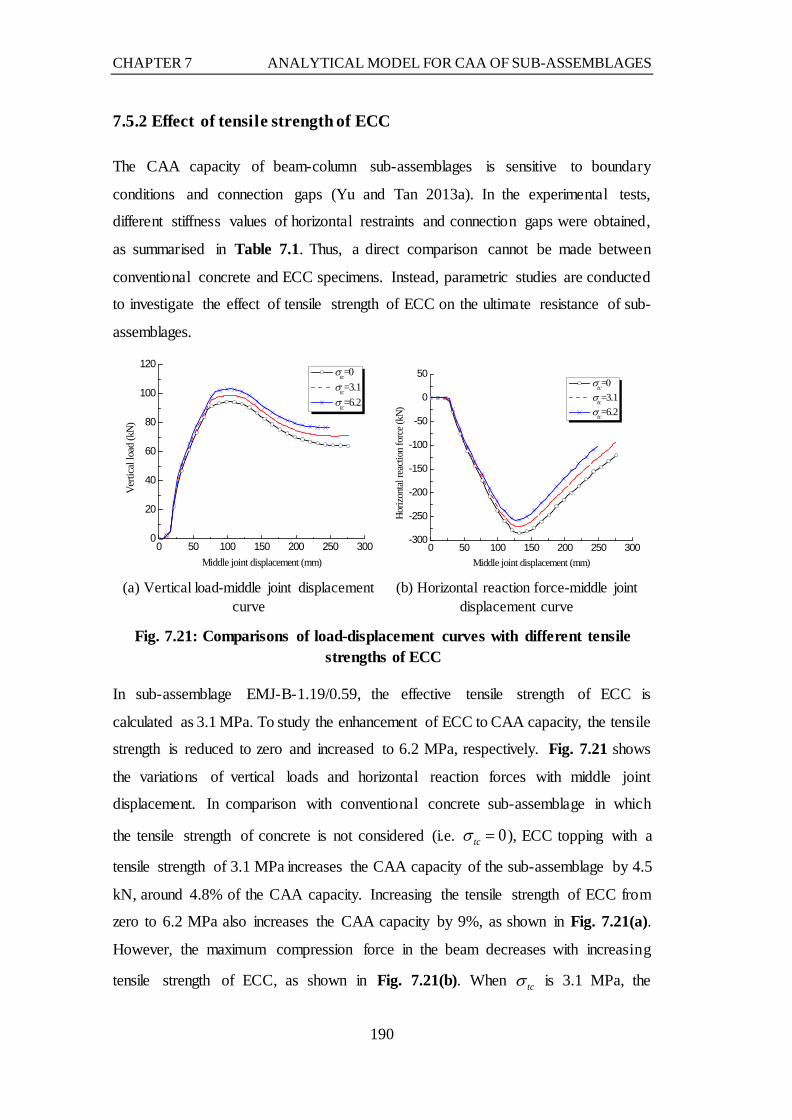
CHAPTER 7 ANALYTICAL MODEL FOR CAA OF SUB-ASSEMBLAGES
190
7.5.2 Effect of tensile strength of ECC
The CAA capacity of beam-column sub-assemblages is sensitive to boundary
conditions and connection gaps (Yu and Tan 2013a). In the experimental tests,
different stiffness values of horizontal restraints and connection gaps were obtained,
as summarised in Table 7.1. Thus, a direct comparison cannot be made between
conventional concrete and ECC specimens. Instead, parametric studies are conducted
to investigate the effect of tensile strength of ECC on the ultimate resistance of sub-
assemblages.
0 50 100 150 200 250 3000
20
40
60
80
100
120
Ver
tical
load
(kN
)
Middle joint displacement (mm)
σtc=0 σtc=3.1 σtc=6.2
(a) Vertical load-middle joint displacement
curve
0 50 100 150 200 250 300-300
-250
-200
-150
-100
-50
0
50
Horiz
ontal
reac
tion
forc
e (kN
)
Middle joint displacement (mm)
σtc=0 σtc=3.1 σtc=6.2
(b) Horizontal reaction force-middle joint
displacement curve
Fig. 7.21: Comparisons of load-displacement curves with different tensile strengths of ECC
In sub-assemblage EMJ-B-1.19/0.59, the effective tensile strength of ECC is
calculated as 3.1 MPa. To study the enhancement of ECC to CAA capacity, the tensile
strength is reduced to zero and increased to 6.2 MPa, respectively. Fig. 7.21 shows
the variations of vertical loads and horizontal reaction forces with middle joint
displacement. In comparison with conventional concrete sub-assemblage in which
the tensile strength of concrete is not considered (i.e. 0tcσ = ), ECC topping with a
tensile strength of 3.1 MPa increases the CAA capacity of the sub-assemblage by 4.5
kN, around 4.8% of the CAA capacity. Increasing the tensile strength of ECC from
zero to 6.2 MPa also increases the CAA capacity by 9%, as shown in Fig. 7.21(a).
However, the maximum compression force in the beam decreases with increasing
tensile strength of ECC, as shown in Fig. 7.21(b). When tcσ is 3.1 MPa, the

CHAPTER 7 ANALYTICAL MODEL FOR CAA OF SUB-ASSEMBLAGES
191
maximum compression force in the beam is reduced by 4.8% compared to that when
the tensile strength is zero.
Fig. 7.22 shows the comparisons of neutral axis depths with different tensile strengths
of ECC. Similar variations of the neutral axis depths are obtained with increasing
middle joint displacement. The tensile strength of ECC has opposite effects on the
neutral axis depths at the middle joint and end support. A higher tensile strength of
ECC reduces the neutral axis depth at the middle joint (see Fig. 7.22(a)), as the net
compression force in the beam is slightly reduced but the force in the tension zone
remains almost the same. However, the neutral axis depth at the end support is
increased (see Fig. 7.22(b)), since total force in the tension zone of the beam is
increased at the end support while axial compression force in the beam is slight ly
reduced. The differences among the neutral axis depths are limited for the range of
tensile strengths investigated.
0 50 100 150 200 250 3000
15
30
45
60
75
Neut
ral a
xis d
epth
at m
iddl
e joi
nt (m
m)
Middle joint displacement (mm)
σtc=0 σtc=3.1 σtc=6.2
(a) At the middle joint
0 50 100 150 200 250 3000
30
60
90
120
150
180
Neu
tral a
xis d
epth
at en
d su
ppor
t (m
m)
Middle joint displacement (mm)
σtc=0 σtc=3.1 σtc=6.2
(b) At the end support
Fig. 7.22: Comparisons of neutral axis depths with different tensile strengths of ECC
7.5.3 Effect of tensile strain capacity of ECC
The effect of tensile strain capacity on the resistance of the sub-assemblage is also
investigated in the analytical model. In sub-assemblage EMJ-B-1.19/0.59, tensile
strain capacity of ECC in the structural topping is around 2.6%. The strain capacity
is reduced to zero and doubled to 5%, respectively, to study the effect of tensile strain
capacity on CAA behaviour.

CHAPTER 7 ANALYTICAL MODEL FOR CAA OF SUB-ASSEMBLAGES
192
0 50 100 150 200 250 3000
20
40
60
80
100Ve
rtica
l loa
d (k
N)
Middle joint displacement (mm)
εtu=εtc
εtu=2.6% εtu=5%
(a) Vertical load-middle joint displacement
curve
0 50 100 150 200 250 300-300
-250
-200
-150
-100
-50
0
50
Horiz
ontal
reac
tion
forc
e (kN
)
Middle joint displacement (mm)
εtu=εtc
εtu=2.6% εtu=5%
(b) Horizontal reaction force-middle joint
displacement curve
Fig. 7.23: Comparisons of load-displacement curves with different tensile strain capacities of ECC
Fig. 7.23 shows the calculated vertical loads and horizontal reaction forces. It is found
that if the tensile strain capacity of ECC is increased from zero to 2.6%, the CAA
capacity of the sub-assemblage is enhanced by 4.7%, but the maximum compression
force in the beam is reduced by 5%. A further increase in the strain capacity of ECC
from 2.6% to 5% does not significantly change the CAA capacity and horizonta l
compression force of the sub-assemblage. Analytical results indicate that an upper
bound value of the strain capacity exists, beyond which the CAA capacity cannot be
increased by a greater tensile strain capacity. As the CAA capacity of sub-assemblage
EMJ-B-1.19/0.59 is attained at around 100 mm middle joint displacement, the upper
bound value of the strain capacity is associated with the strain of extreme ECC fibre
at this displacement. In the analytical model, the value is estimated as 0.6% for sub-
assemblage EMJ-B-1.19/0.59. If ECC with a greater tensile strain capacity is used,
CAA capacity is not increased and only the resistance in the descending branch of
vertical load is enhanced.
7.5.4 Effect of stiffness of horizontal restraint
To investigate the effect of horizontal restraints on the behaviour of beam-column
sub-assemblage at CAA stage, restraint stiffness is normalised by the measured value
of sub-assemblage EMJ-B-1.19/0.59 (see Table 7.1). aγ represents the ratio of the
assumed and measured stiffness. aγ is equal to 1 for EMJ-B-1.19/0.59. aγ is

CHAPTER 7 ANALYTICAL MODEL FOR CAA OF SUB-ASSEMBLAGES
193
increased to 10 and reduced to 0.1 for comparison purpose. Fig. 7.24 shows the
vertical loads and horizontal reaction forces versus the middle joint displacement. By
increasing aγ from 1 to 10, the CAA capacity of the sub-assemblage is increased by
7%. However, the middle joint displacement corresponding to the CAA capacity is
reduced, as shown in Fig. 7.24(a). When aγ is reduced from 1 to 0.1, the CAA
capacity is reduced by 12.7%, but the associated vertical displacement is substantia lly
increased. A more significant effect of horizontal restraint is observed on horizonta l
reaction forces, as shown in Fig. 7.24(b). By reducing aγ from 1 to 0.1, the
maximum compression force in the beam is reduced from 271.6 kN to 88.2 kN.
Therefore, a stiffer horizontal restraint is necessary to mobilise CAA in the beam-
column sub-assemblage.
0 50 100 150 200 250 3000
20
40
60
80
100
120
Ver
tical
load
(kN
)
Middle joint displacement (mm)
γa=0.1 γa=1 γa=10
(a) Vertical load-middle joint displacement
curve
0 50 100 150 200 250 300-400
-300
-200
-100
0
100
Horiz
ontal
reac
tion
forc
e (kN
)
Middle joint displacement (mm)
γa=0.1 γa=1 γa=10
(b) Horizontal reaction force-middle joint
displacement curve
Fig. 7.24: Comparisons of load-displacement curves with different horizontal restraints
In addition to quasi-static resistance of the sub-assemblage subject to column removal,
pseudo-static resistance is also calculated in accordance with the energy balance
method proposed by Izzudin et al. (2008), as discussed in Section 5.4.4. Fig. 7.25
shows the pseudo-static resistance of the sub-assemblage. When aγ is increased
from 1 to 10, the pseudo-static resistance of the sub-assemblage is only increased by
0.9 kN. Similarly, the pseudo-static resistance is reduced by 1.6 kN if aγ is reduced
from 1 to 0.1. Thus, the stiffness of horizontal restraints does not have a significant
influence on pseudo-static resistance of the sub-assemblage. However, by increasing
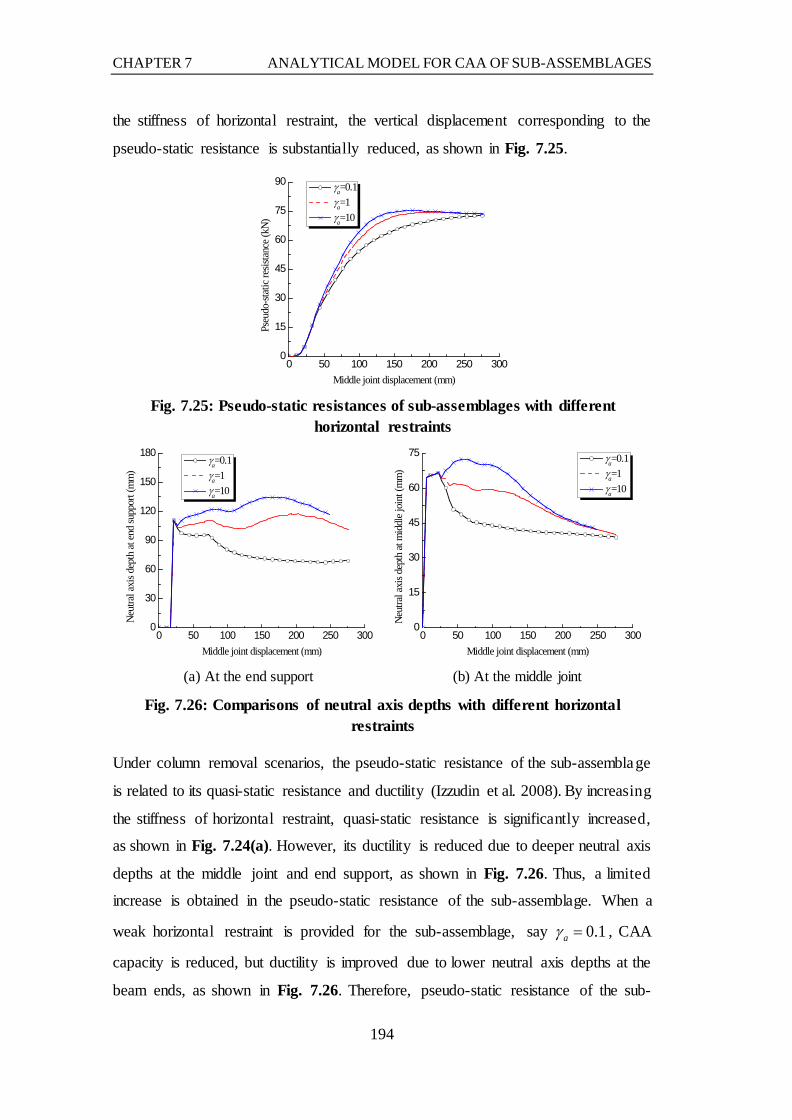
CHAPTER 7 ANALYTICAL MODEL FOR CAA OF SUB-ASSEMBLAGES
194
the stiffness of horizontal restraint, the vertical displacement corresponding to the
pseudo-static resistance is substantially reduced, as shown in Fig. 7.25.
0 50 100 150 200 250 3000
15
30
45
60
75
90
Pseu
do-st
atic r
esist
ance
(kN)
Middle joint displacement (mm)
γa=0.1 γa=1 γa=10
Fig. 7.25: Pseudo-static resistances of sub-assemblages with different horizontal restraints
0 50 100 150 200 250 3000
30
60
90
120
150
180
Neu
tral a
xis d
epth
at en
d su
ppor
t (m
m)
Middle joint displacement (mm)
γa=0.1 γa=1 γa=10
(a) At the end support
0 50 100 150 200 250 3000
15
30
45
60
75
Neut
ral a
xis d
epth
at m
iddl
e joi
nt (m
m)
Middle joint displacement (mm)
γa=0.1 γa=1 γa=10
(b) At the middle joint
Fig. 7.26: Comparisons of neutral axis depths with different horizontal restraints
Under column removal scenarios, the pseudo-static resistance of the sub-assemblage
is related to its quasi-static resistance and ductility (Izzudin et al. 2008). By increasing
the stiffness of horizontal restraint, quasi-static resistance is significantly increased,
as shown in Fig. 7.24(a). However, its ductility is reduced due to deeper neutral axis
depths at the middle joint and end support, as shown in Fig. 7.26. Thus, a limited
increase is obtained in the pseudo-static resistance of the sub-assemblage. When a
weak horizontal restraint is provided for the sub-assemblage, say 0.1aγ = , CAA
capacity is reduced, but ductility is improved due to lower neutral axis depths at the
beam ends, as shown in Fig. 7.26. Therefore, pseudo-static resistance of the sub-

CHAPTER 7 ANALYTICAL MODEL FOR CAA OF SUB-ASSEMBLAGES
195
assemblage is slightly reduced, but vertical displacement corresponding to the
pseudo-static resistance is increased.
7.5.5 Effect of reinforcement ratio
To investigate the effect of the top and bottom reinforcement ratios on the CAA
capacity of the sub-assemblage, two hypothetic beam-column sub-assemblages EMJ-
B-1.48/0.59 and EMJ-B-1.19/0.89, with identical geometry and boundary conditions
to EMJ-B-1.19/0.59, are simulated using the analytical model, as listed in Table 7.3.
In comparison with EMJ-B-1.19/0.59, the top reinforcement ratio is increased from
1.19% to 1.48% in EMJ-B-1.48/0.59, and the bottom reinforcement ratio is increased
from 0.59% to 0.89% in EMJ-B-1.19/0.89. Total reinforcement area in EMJ-B-
1.48/0.59 and EMJ-B-1.19/0.89 remains the same.
Table 7.3: Reinforcement ratios in beam-column sub-assemblages
Specimen Top reinforcement Bottom reinforcement
Area (mm2) Ratio Area (mm2) Ratio
EMJ-B-1.19/0.59 534.9 (2H16+H13) 1.19% 265.5 (2H13) 0.59%
EMJ-B-1.48/0.59 667.6 (2H16+2H13) 1.48% 265.5 (2H13) 0.59%
EMJ-B-1.19/0.89 534.9 (2H16+H13) 1.19% 402.1 (2H16) 0.89%
0 50 100 150 200 250 3000
20
40
60
80
100
120
Verti
cal l
oad
(kN)
Middle joint displacement (mm)
EMJ-B-1.19/0.59 EMJ-B-1.48/0.59 EMJ-B-1.19/0.89
(a) Vertical load-middle joint displacement
curve
0 50 100 150 200 250 300-300
-250
-200
-150
-100
-50
0
50
Horiz
ontal
reac
tion
forc
e (kN
)
Middle joint displacement (mm)
EMJ-B-1.19/0.59 EMJ-B-1.48/0.59 EMJ-B-1.19/0.89
(b) Horizontal reaction force-middle joint
displacement curve
Fig. 7.27: Comparisons of load-displacement curves with different reinforcement ratios
Fig. 7.27 shows the predicted vertical loads and horizontal compression forces. EMJ-
B-1.48/0.59 and EMJ-B-1.19/0.89 exhibit greater CAA capacities in comparison with

CHAPTER 7 ANALYTICAL MODEL FOR CAA OF SUB-ASSEMBLAGES
196
EMJ-B-1.19/0.59, as shown in Fig. 7.27(a). The CAA capacity of EMJ-B-1.19/0.89
is 3.5% greater than that of EMJ-B-1.48/0.59, indicating that a greater bottom
reinforcement ratio is more efficient to enhance the CAA capacity of the sub-
assemblage when the same amount of longitudinal reinforcement is placed in the
beam. Furthermore, horizontal compression force is 14% greater in EMJ-B-1.19/0.89
than that in EMJ-B-1.48/0.59, as shown in Fig. 7.27(b). At the section level, a greater
top reinforcement ratio in the beam of EMJ-B-1.48/0.59 increases the neutral axis
depth at the end support but decreases the depth at the middle joint compared to EMJ-
B-1.19/0.59, as shown in Figs. 7.28(a and b). However, in EMJ-B-1.19/0.89, the
neutral axis depth at the end support is reduced but the depth at the middle joint is
increased compared to EMJ-B-1.19/0.59, as shown in Figs. 7.28(a and b), due to a
greater bottom reinforcement ratio in the beam of EMJ-B-1.19/0.89.
0 50 100 150 200 250 3000
30
60
90
120
150
180
Neu
tral a
xis d
epth
at en
d su
ppor
t (m
m)
Middle joint displacement (mm)
EMJ-B-1.19/0.59 EMJ-B-1.48/0.59 EMJ-B-1.19/0.89
(a) At the end support
0 50 100 150 200 250 3000
15
30
45
60
75
90
Neut
ral a
xis d
epth
at m
iddl
e joi
nt (m
m)
Middle joint displacement (mm)
EMJ-B-1.19/0.59 EMJ-B-1.48/0.59 EMJ-B-1.19/0.89
(b) At the middle joint
Fig. 7.28: Comparisons of neutral axis depths with different reinforcement ratios

CHAPTER 7 ANALYTICAL MODEL FOR CAA OF SUB-ASSEMBLAGES
197
0 50 100 150 200 250 3000
20
40
60
80
100 EMJ-B-1.19/0.59 EMJ-B-1.48/0.59 EMJ-B-1.19/0.89
Pseu
do-s
tatic
resis
tanc
e (kN
)
Middle joint displacement (mm)
Fig. 7.29: Pseudo-static resistances of sub-assemblages with different reinforcement ratios
More significant differences exist between the pseudo-static resistances of sub-
assemblages EMJ-B-1.48/0.59 and EMJ-B-1.19/0.89, as shown in Fig. 7.29, even
though the same amount of longitudinal reinforcement is placed in the beam. The
pseudo-static resistance of EMJ-B-1.19/0.89 is 8.2% greater than that of EMJ-B-
1.48/0.59, since both the CAA capacity and ductility are enhanced in EMJ-B-
1.19/0.89 due to a greater bottom reinforcement ratio in the beam. Thus, in order to
enhance the pseudo-static resistance of beam-column sub-assemblages under column
removal scenarios, more bottom reinforcement is suggested to be placed in the beam,
which reduces the neutral axis depth and improves the ductility of the bridging beam
at the hogging region.
7.6 Conclusion
Based on the rigid-plastic assumption, an analytical model is proposed to predict the
CAA capacity of beam-column sub-assemblages under column removal scenarios. A
linear variation of reinforcement strain along the beam length is assumed in the model.
Instead of employing equivalent rectangular concrete stress block, Mander’s stress-
strain model for concrete is incorporated to take account of the softening branch of
concrete in compression. Tensile strength and strain capacity of ECC in tension can
also be considered if needed. The model is calibrated by experimental results on
reinforced concrete and ECC beam-column sub-assemblages and is able to estimate
the CAA capacity with reasonably good accuracy.

CHAPTER 7 ANALYTICAL MODEL FOR CAA OF SUB-ASSEMBLAGES
198
A series of parametric studies is conducted through the analytical model, in which
the effects of different concrete models, tensile strength and strain capacity of ECC,
stiffness of horizontal restraints, and top and bottom reinforcement ratios are
investigated. The following conclusions are drawn from the parametric studies.
(1) Concrete model does not have a significant influence on the CAA capacity of sub-
assemblages, but it affects the descending phase of vertical load and maximum
compression force due to dramatically different softening branches of the concrete
stress-strain models. Thus, concrete model with a moderate softening branch has to
be selected. Analytical results indicate that Mander’s model (Mander et al. 1988)
provides the best agreement with experimental results.
(2) CAA capacity of sub-assemblages increases with tensile strength of ECC if the
strain capacity of ECC is kept constant. When the strain capacity is 2.6%, the
maximum enhancement of ECC to the CAA capacity of sub-assemblages is 9% for a
practical range of tensile strength from 3.1 MPa to 6.2 MPa. However, the maximum
horizontal compression force in the beam decreases with increasing tensile strength
of ECC.
(3) Increasing the tensile strain capacity of ECC also increases the CAA capacity of
sub-assemblages when the strain capacity is low. When the tensile strain capacity is
2.6%, the CAA capacity of the sub-assemblage is increased by 4.8% compared to the
sub-assemblage with conventional concrete of the same strength as ECC. However,
an upper bound value of the strain capacity exists, beyond which the CAA capacity
cannot be enhanced by a greater strain capacity of ECC. For sub-assemblage EMJ-
B-1.19/0.59, the value is determined as 0.6% through the proposed model. Thus, a
tensile strain capacity of 2.6% obtained in the experimental tests is adequate to ensure
the maximum enhancement of ECC to the CAA capacity of sub-assemblage EMJ-B-
1.19/0.59.
(4) Horizontal restraint with a higher stiffness increases CAA capacity but reduces
ductility of sub-assemblages. Therefore, when the quasi-static resistance of sub-
assemblages is converted to the pseudo-static resistance through the energy balance
method, the effect of a stiffer horizontal restraint on the resistance of sub-assemblages

CHAPTER 7 ANALYTICAL MODEL FOR CAA OF SUB-ASSEMBLAGES
199
becomes limited. Nonetheless, the vertical displacement corresponding to the
pseudo-static resistance is substantially reduced by a stiffer horizontal restraint.
(5) A greater top or bottom reinforcement ratio increases the CAA capacity of sub-
assemblages. However, increasing the bottom reinforcement ratio in the beam is more
efficient to enhancing the CAA capacity of sub-assemblages. Analytical results also
suggest that more bottom reinforcement should be provided at the hogging region of
the beam to improve ductility and to increase the pseudo-static resistance.
Nonetheless, it may hinder the development of catenary action at large deformation
stage.
Limitations exist in the analytical model. The assumption of linear strain profile
between the inflection point and beam end sections substantially underestimate the
strain of top and bottom steel reinforcement at locations where fracturing of
reinforcement occurs. Rupture of tension reinforcement cannot be accurately
predicted in the model. Additionally, spalling of concrete is neglected in the model,
which may lead to increasing discrepancy between the measured and predicted
horizontal compression forces at large deformation stage.

CHAPTER 7 ANALYTICAL MODEL FOR CAA OF SUB-ASSEMBLAGES
200

CHAPTER 8 COMPONENT-BASED JOINT MODEL FOR SUB-ASSEMBLAGES
201
CHAPTER 8 COMPONENT-BASED JOINT MODEL FOR
PRECAST CONCRETE BEAM-COLUMN SUB-ASSEMBLAGES
8.1 Introduction
The component-based joint model can be used for analysis of reinforced concrete
structures subjected to various loading conditions (Bao et al. 2008; Lowes and
Altoontash 2003; Mitra and Lowes 2007; Yu and Tan 2013b). In the model,
interactions between the structural member and beam-column joint are simplified as
a group of nonlinear zero-length springs, namely, tensile, compressive and shear
springs (Lowes et al. 2004). The force-slip relationships of tensile and compressive
springs can be determined by the bond-slip behaviour of embedded reinforcement in
the joint.
Tension force in reinforced concrete members is assumed to be sustained by steel
reinforcement. Transmission of tension force from beams or columns to structura l
joints depends on the bond-slip behaviour of the embedded reinforcement. According
to its anchorage length, two types of boundary conditions have been considered for
embedded reinforcement in axial tension (Yu and Tan 2010b). If the embedment
length of reinforcement is sufficiently long to ensure zero strain in the middle, the
bond-slip model developed by Lowes et al. (2004) can be used; otherwise, non-zero
strain in the middle of the embedment length has to be considered. However, Bond
stresses of steel reinforcement at elastic and post-yield stages are substantia lly
different from experimental results by Lehman and Moehle (2000). Thus, bond
stresses have to be calibrated against test data of steel bars under pull-out force.
Besides, pull-out failure of reinforcement anchored in the middle joint, as discussed
in Chapter 3, cannot be taken into account in the model. As a result, further
improvement is necessary in the bond-slip behaviour of reinforcement with various
embedment lengths.
In the compression zone, total compression force is contributed by both compressive
concrete and reinforcement and it varies with neutral axis depth and the amount of
compressive reinforcement. The contribution of concrete is generally determined
from the equivalent concrete stress block (Lowes et al. 2004; Yu 2012). It seems

CHAPTER 8 COMPONENT-BASED JOINT MODEL FOR SUB-ASSEMBLAGES
202
reasonable to evaluate the seismic resistance of beam-column joints subjected to
cyclic loadings. However, under column removal scenarios, severe crushing and
spalling of concrete occurred in the compression zone. Thus, constitutive model for
concrete should be used in calculating the compressive force instead of the equivalent
concrete stress block.
This chapter presents a component-based model for precast concrete beam-column
joints. In the model, bond stresses of tensile steel reinforcement at elastic and post-
yield stages are re-evaluated and calibrated against experimental results. Besides,
pull-out failure is also considered for reinforcing bars with inadequate embedment
length. Various failure modes of reinforcement can be considered through defining
the force-slip relationship of tensile springs. As for compressive springs, softening
branch of the force-slip curve caused by crushing of compressive concrete is taken
into account. The model is calibrated by experimental results of precast and
reinforced concrete sub-assemblages under column removal scenarios.
8.2 Beam-Column Joint Model
When interface delamination between precast beam units and cast-in-situ concrete
topping is prevented, the component-based joint model is applicable to precast
concrete beam-column sub-assemblages. Fig. 8.1 shows the component model for
precast concrete beam-column joints in Engineers’ Studio (Forum8 2008). In the sub-
assemblage, the precast beam is modelled with 2-node fibre elements, in which a
layered cross section with different compressive strengths of concrete is used and
delamination of horizontal interfaces is assumed not to occur. The end column stub
is simulated by elastic elements. Concrete model proposed by Mander et al. (1988) is
employed for concrete in the beam and end column stub. Trilinear stress-strain model
with yield plateau is utilised for longitudinal reinforcement in the sub-assemblage.
At the interface of the middle joint, three zero-length springs are used to connect the
beam to the joint, as shown in Fig. 8.1. Bottom longitudinal reinforcement passing
through the middle joint sustains tension force under column removal scenarios. Thus,
a tensile spring is defined and located at the centroid of the bottom bars in the beam.
In the compression zone, concrete and compressive reinforcement carry compressive

CHAPTER 8 COMPONENT-BASED JOINT MODEL FOR SUB-ASSEMBLAGES
203
stresses and a compressive spring is placed at the centroid of the compression zone.
The spring can also sustain tension force after the fracture of bottom springs at large
deformation stage. A linear-elastic shear spring is defined at the interface to transmit
shear force between the beam and middle joint. In the middle joint, four rigid
elements are connected by pin nodes to form the joint panel, and two diagonal springs
with infinite stiffness are defined, since shear distortions of the middle joint are
negligible under column removal scenarios. Similar springs are also provided at the
interface of the end column stub. Prior to analysis, constitutive properties of the
springs have to be defined in accordance with material and geometric properties.
Fig. 8.1: Component-based joint model for beam-column sub-assemblages
8.3 Properties of Tensile Spring
When subjected to tension force from one end, embedded reinforcement with various
anchorage lengths exhibits different failure modes, as summarised in Table 8.1. A
“sufficiently long” embedment length enables a reinforcing bar to rupture and the
free end slip is zero even at the ultimate strength of the bar. This can be found in
column longitudinal reinforcement anchored in a reinforced concrete footing.
Although reinforcement with a “long” embedment length mobilises slip at the free
end, it can still rupture in tension. “Short” reinforcement develops inelastic behaviour
at the loaded end and eventually exhibits pull-out failure in tension. With a further
reduction in embedment length to “extremely short”, embedded reinforcement shows
pull-out failure at the elastic stage. In addition to pull-out force, continuous beam
Top AF
Btm AF
Top RW
Btm RW
Beam element (2 nodes)
Elastic element
End column stub
Beam Zero-length springs
Zero-length springs
kbt kbs
kbb
Pin node
Rigid element
Beam
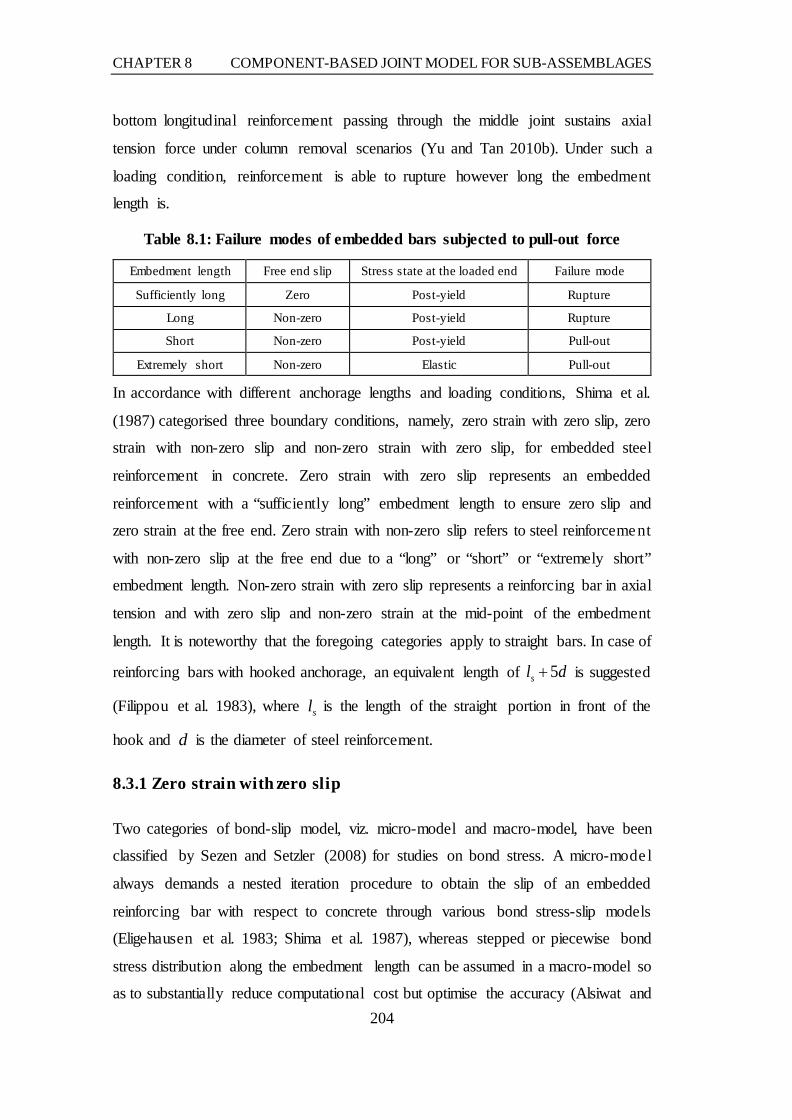
CHAPTER 8 COMPONENT-BASED JOINT MODEL FOR SUB-ASSEMBLAGES
204
bottom longitudinal reinforcement passing through the middle joint sustains axial
tension force under column removal scenarios (Yu and Tan 2010b). Under such a
loading condition, reinforcement is able to rupture however long the embedment
length is.
Table 8.1: Failure modes of embedded bars subjected to pull-out force
Embedment length Free end slip Stress state at the loaded end Failure mode
Sufficiently long Zero Post-yield Rupture
Long Non-zero Post-yield Rupture
Short Non-zero Post-yield Pull-out
Extremely short Non-zero Elastic Pull-out
In accordance with different anchorage lengths and loading conditions, Shima et al.
(1987) categorised three boundary conditions, namely, zero strain with zero slip, zero
strain with non-zero slip and non-zero strain with zero slip, for embedded steel
reinforcement in concrete. Zero strain with zero slip represents an embedded
reinforcement with a “sufficiently long” embedment length to ensure zero slip and
zero strain at the free end. Zero strain with non-zero slip refers to steel reinforcement
with non-zero slip at the free end due to a “long” or “short” or “extremely short”
embedment length. Non-zero strain with zero slip represents a reinforcing bar in axial
tension and with zero slip and non-zero strain at the mid-point of the embedment
length. It is noteworthy that the foregoing categories apply to straight bars. In case of
reinforcing bars with hooked anchorage, an equivalent length of 5sl d+ is suggested
(Filippou et al. 1983), where sl is the length of the straight portion in front of the
hook and d is the diameter of steel reinforcement.
8.3.1 Zero strain with zero slip
Two categories of bond-slip model, viz. micro-model and macro-model, have been
classified by Sezen and Setzler (2008) for studies on bond stress. A micro-mode l
always demands a nested iteration procedure to obtain the slip of an embedded
reinforcing bar with respect to concrete through various bond stress-slip models
(Eligehausen et al. 1983; Shima et al. 1987), whereas stepped or piecewise bond
stress distribution along the embedment length can be assumed in a macro-model so
as to substantially reduce computational cost but optimise the accuracy (Alsiwat and

CHAPTER 8 COMPONENT-BASED JOINT MODEL FOR SUB-ASSEMBLAGES
205
Saatcioglu 1992; Lehman and Moehle 2000; Sezen and Setzler 2008). Therefore,
macro-models have been widely applied to structural analysis under earthquake
loadings (Lowes et al. 2004; Mitra and Lowes 2007) and progressive collapse
scenarios (Bao et al. 2008; Lew et al. 2011; Yu and Tan 2010b). In the macro-model-
based simulation of reinforced concrete joints, predicted behaviour is very sensitive
to the postulated average bond stresses along the embedment length of steel bars.
Hence, the average bond stress has to be elaborately derived based on micro-mode ls
and calibrated by experimental results.
8.3.1.1 Average bond stress at elastic stage
In calculating the average bond stress at the elastic stage, Lowes et al. (2004) utilised
the bond-slip model proposed by Eligehausen et al. (1983) and postulated that zero
and the maximum bond stress in the model are developed at two ends of an embedded
reinforcement. Average bond stress at the elastic stage was determined as '1.8 cf ,
where 'cf is the cylinder compressive strength of concrete. Recently, Yu (2012) used
the same value in deriving the joint model for beam-column joints under column
removal scenarios. It is noteworthy that the bar yields far before the maximum bond
stress is attained in Eligehausen’s bond-slip model. Thus, the average bond stress is
considerably overestimated. Further analytical studies are needed to quantify the
average bond stress at the elastic stage.
In this chapter, the bond stress-strain-slip model proposed and calibrated by Shima et
al. (1987) is used to calculate the average bond stress along the embedment length of
reinforcement. For each reinforcing bar, it is assumed that the yield strength is
attained at the loaded end and the embedment length of reinforcement is adequate to
ensure zero strain and zero slip at the free end. A nested iteration procedure is
employed to determine the required embedment length of reinforcement. Table 8.2
lists the properties of steel reinforcement and concrete and the calculated average
elastic bond stresses. The mean value is 4.97 MPa, with a coefficient of variation of
18%. Typically, average bond stress is expressed as a function of 'cf to consider
the influence of concrete compressive strength (Eligehausen et al. 1983; Lehman and

CHAPTER 8 COMPONENT-BASED JOINT MODEL FOR SUB-ASSEMBLAGES
206
Moehle 2000). Accordingly, the value becomes '1.0 cf , with a coefficient of
variation of 9%.
Table 8.2: Average bond stress predicted by Shima’s model
Author Item
Steel properties Concrete compressive
strength (MPa)
Average bond stress
Diameter (mm)
Yield strength (MPa)
Elastic modulus
(GPa) MPa
In '
cf
In '
c yf f
Shima et al. (1987)
SD30
19.5
350
190.0 19.6
3.70 0.84 0.045
SD50 610 4.55 1.03 0.042
SD70 820 4.95 1.12 0.039
Bigaj (1995)
B16 16 539.67 128.5 27.62
5.21 0.99 0.043
B20 20 526.24 150.3 5.05 0.96 0.042 Yu
(2012) T13 13 494 185.9 38.2 6.35 1.03 0.046
Mean value 4.97 1.00 0.043
Coefficient of variation 18% 9% 6%
Besides the average bond stress when the yield strength of reinforcement is attained
at the loaded end, variation of bond stresses along the embedment length of
reinforcement is obtained through the bond-slip model, as shown in Fig. 8.2. For steel
reinforcement SD-30, SD-50 and SD-70 with the same diameter but different yield
strengths, nonlinear bond stress distribution along the embedment length is mobilised
to transfer steel stress to the surrounding concrete. The calculated average bond
stresses vary significantly from one another for steel reinforcement SD-30, SD-50
and SD-70 (see Table 8.2). In order to capture the effect of reinforcement yield
strength, the average bond stress is expressed as a function of 'c yf f , as listed in
Table 8.2. Therefore, the average bond stress is determined as '0.043 c yf f , with a
coefficient of variation of 6%, when reinforcement is loaded to yield.

CHAPTER 8 COMPONENT-BASED JOINT MODEL FOR SUB-ASSEMBLAGES
207
0 100 200 300 400 500 600 700 800 9000
1
2
3
4
5
6
7
(456, 6.31)(650, 6.64)
SD70
SD50
SD30
SD50/SD70
Bond
stre
ss (M
Pa)
Distance from free end (mm)
SD30
(804, 6.65)
Fig. 8.2: Variation of bond stresses along embedment length of a reinforcing
bar
A similar method can be used to determine the average bond stress of steel bars when
tensile stress at the loaded end is less than the yield strength. Fig. 8.3(a) shows the
average bond stress along the embedment length when different tensile stresses are
applied at the loaded end of reinforcement SD-70. When the tensile stress is 350 MPa,
the associated average bond stress is 3.71 MPa. If the tensile stress is increased to
820 MPa, the average bond stress becomes 4.95 MPa. Fig. 8.3(b) shows the variation
of normalised average bond stress by sf , where sf is the tensile stress at the loaded
end of reinforcing bars. It is observed that the normalised average bond stress
increases first, and then slightly decreases with increasing steel stress from zero to
820 MPa. Therefore, a mean value of 0.19 can be taken in the range of steel stresses
from zero to 820 MPa. Correspondingly, for concrete with a compressive strength of
19.6 kN, the average bond stress can be expressed as '0.043 c sf f . When steel
reinforcement yields at the loaded end, the average bond stress is '0.043 c yf f .
'0.043e c sf fτ = (8-1) 2
8s
e s
f dsEτ
= (8-2)
where eτ is the bond stress at the elastic stage of steel reinforcement; 'cf is the
cylinder compressive strength of concrete; sf is the tensile stress at the loaded end of

CHAPTER 8 COMPONENT-BASED JOINT MODEL FOR SUB-ASSEMBLAGES
208
reinforcement; d is the diameter of reinforcement; s is the slip at the loaded end;
and sE is the modulus of elasticity of reinforcement.
0 150 300 450 600 750 9000
1
2
3
4
5
Aver
age b
ond s
tress
(MPa
)
Tensile stress at loaded end (MPa)
(820, 4.95)
(610, 4.55)
(350, 3.71)
(a) Average bond stress versus stress at
loaded end
0 100 200 300 400 500 600 700 800 9000.00
0.05
0.10
0.15
0.20
0.25
(820, 0.173)(610, 0.184)
Ave
rage
bon
d str
ess/f
s1/2
Stress of reinforcing bar at the loaded end (MPa)
(350, 0.198)
(b) Normalised bond stress versus stress at
loaded end
Fig. 8.3: Relationship of average bond stress with force and stress at the loaded end of reinforcing bars
After determining the average bond stress from Eq. (8-1), reinforcing bars SD30,
SD50 and SD70 tested by Shima et al. (1987) are simulated using the macro-model
(Lowes et al. 2004), as expressed in Eq. (8-2). Besides, comparisons are made among
the force-slip curves predicted by different models (Lowes et al. 2004; Shima et al.
1987; Soltani and Maekawa 2008). Fig. 8.4 suggests that Lowes’s model provides
the stiffest force-slip curve among all the models, as it greatly overestimates the
average bond stress (i.e. '1.8 cf ) at elastic stage. By using the same bond-slip model
as Lowes et al. (2004) but a lower average bond stress (i.e. '0.043 c sf f ), a much
softer force-slip relationship is obtained at elastic stage. Reasonably good agreement
is reached between the force-slip curves by the proposed bond stress and the
analytical model by Soltani and Maekawa (2008), if bond deterioration zone is not
considered in the analysis. It is noteworthy that Shima’s micro bond stress-strain-slip
model gives stiffer force-slip response in comparison with the proposed bond stress,
even though the average bond stress is derived based on Shima’s model. It results
from the fact that only force equilibrium along the whole embedment length is
considered and compatibility between finite steel segments is neglected in macro-
models.

CHAPTER 8 COMPONENT-BASED JOINT MODEL FOR SUB-ASSEMBLAGES
209
0.0 0.1 0.2 0.3 0.4 0.50
20
40
60
80
100
120
140
0.20 0.500.29
Appl
ied
forc
e (kN
)
Slip at the loaded end of SD30 (mm)
Lowes et al. (2004) Shima et al. (1987) Soltani and Maekawa (2008) Proposed bond stress
0.44
(a) SD30
0.0 0.2 0.4 0.6 0.8 1.0 1.20
40
80
120
160
200
240
0.60 1.181.020.79
Appl
ied
forc
e (kN
)
Slip at the loaded end of SD50 (mm)
Lowes et al. (2004) Shima et al. (1987) Soltani and Maekawa (2008) Proposed bond stress
(b) SD50
0.00 0.25 0.50 0.75 1.00 1.25 1.50 1.75 2.000
50
100
150
200
250
300
1.08 1.911.581.36
Appl
ied
forc
e (kN
)
Slip at the loaded end of SD70 (mm)
Lowes et al. (2004) Shima et al. (1987) Soltani and Maekawa (2008) Proposed bond stress
(c) SD70
Fig. 8.4: Relationships of applied force and loaded end slip for steel bars
8.3.1.2 Bond stress at post-yield stage
Once steel reinforcement enters into its post-yield stage, bond stress is suddenly
reduced due to stress redistribution at the interface of the steel bar and surround ing
concrete (Bigaj 1995). Shima et al. (1987) quantified the post-yield bond stress as
'0.40 cf in experimental tests. At the post-yield stage of steel reinforcement,
concrete keys between steel lugs are sheared off due to inelastic elongation of the
bars. It is similar to the pull-out phase of short reinforcement controlled by frictiona l
bond stress (Alsiwat and Saatcioglu 1992; Pochanart and Harmon 1989), except the
Poisson effect on the steel bars, namely, contraction of steel cross section due to
inelastic tensile elongation. Therefore, frictional bond stress given by Eligehausen et
al. (1983) can be used to determine the bond stress at post-yield stage of
reinforcement if the Poisson effect is considered.
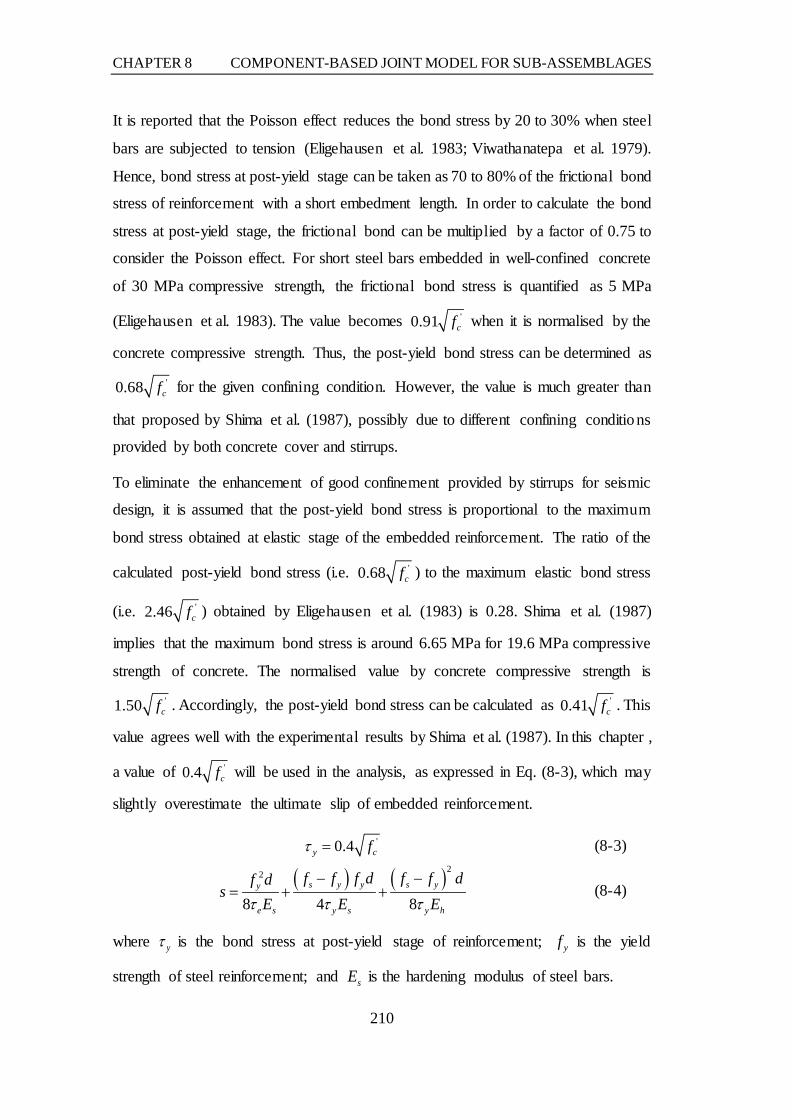
CHAPTER 8 COMPONENT-BASED JOINT MODEL FOR SUB-ASSEMBLAGES
210
It is reported that the Poisson effect reduces the bond stress by 20 to 30% when steel
bars are subjected to tension (Eligehausen et al. 1983; Viwathanatepa et al. 1979).
Hence, bond stress at post-yield stage can be taken as 70 to 80% of the frictional bond
stress of reinforcement with a short embedment length. In order to calculate the bond
stress at post-yield stage, the frictional bond can be multiplied by a factor of 0.75 to
consider the Poisson effect. For short steel bars embedded in well-confined concrete
of 30 MPa compressive strength, the frictional bond stress is quantified as 5 MPa
(Eligehausen et al. 1983). The value becomes '0.91 cf when it is normalised by the
concrete compressive strength. Thus, the post-yield bond stress can be determined as
'0.68 cf for the given confining condition. However, the value is much greater than
that proposed by Shima et al. (1987), possibly due to different confining conditions
provided by both concrete cover and stirrups.
To eliminate the enhancement of good confinement provided by stirrups for seismic
design, it is assumed that the post-yield bond stress is proportional to the maximum
bond stress obtained at elastic stage of the embedded reinforcement. The ratio of the
calculated post-yield bond stress (i.e. '0.68 cf ) to the maximum elastic bond stress
(i.e. '2.46 cf ) obtained by Eligehausen et al. (1983) is 0.28. Shima et al. (1987)
implies that the maximum bond stress is around 6.65 MPa for 19.6 MPa compressive
strength of concrete. The normalised value by concrete compressive strength is
'1.50 cf . Accordingly, the post-yield bond stress can be calculated as '0.41 cf . This
value agrees well with the experimental results by Shima et al. (1987). In this chapter ,
a value of '0.4 cf will be used in the analysis, as expressed in Eq. (8-3), which may
slightly overestimate the ultimate slip of embedded reinforcement.
'0.4y cfτ = (8-3)
( ) ( )22
8 4 8s y y s yy
e s y s y h
f f f d f f df ds
E E Eτ τ τ
− −= + + (8-4)
where yτ is the bond stress at post-yield stage of reinforcement; yf is the yield
strength of steel reinforcement; and sE is the hardening modulus of steel bars.

CHAPTER 8 COMPONENT-BASED JOINT MODEL FOR SUB-ASSEMBLAGES
211
After determining the bond stresses at elastic and post-yield stages, the pull-out tests
conducted by Bigaj (1995) are simulated through the macro-model proposed by
Lowes et al. (2004), as expressed in Eqs. (8-2) and (8-4). The bond stress-strain-slip
model proposed by Shima et al. (1987) is also employed for comparison. A bilinea r
stress-strain relationship is used for steel reinforcement. Table 8.3 includes the
material properties of steel reinforcement and concrete. Fig. 8.5 shows the force-slip
curves of reinforcement. It should be noted that the equivalent bar diameter is
calculated from realistic contact area due to grooving. Slip represents the value at the
starting point of the embedment length, measured 10 times the bar diameter from the
specimen surface. Through comparisons, it is observed that force-slip response of the
embedded reinforcing bars predicted by the proposed bond stresses agrees well with
the experimental results. However, Shima’s model substantially overestimates the
ultimate slip at rupture of steel bars.
Table 8.3: Material properties of embedded reinforcement (Bigaj 1995)
Specimen
Steel properties Concrete comp.
strength (MPa)
Diameter (mm)
Area (mm2)
Yield strength (MPa)
Elastic modulus
(GPa)
Ultimate tensile
strength (MPa)
Hardening modulus
(MPa)
P.16.16.1 16 174.2 539.67 128.5 624.35 945
26.98
P.16.16.2 28.36
P.20.16.1 20 280.9 526.24 150.4 612.87 952
28.36
P.20.16.2 26.78
0 2 4 6 8 100
20
40
60
80
100
120
140
9.657.467.01
Appl
ied
forc
e (kN
)
Slip at the loaded end of P.16.16.1 (mm)
Bigaj (1995) Shima et al. (1987) Proposed bond stress
(a) P.16.16.1
0 2 4 6 8 100
20
40
60
80
100
120
140
9.407.277.11
Appl
ied
forc
e (kN
)
Slip at the loaded end of P.16.16.2 (mm)
Bigaj (1995) Shima et al. (1987) Proposed bond stress
(b) P.16.16.2

CHAPTER 8 COMPONENT-BASED JOINT MODEL FOR SUB-ASSEMBLAGES
212
0 3 6 9 12 15
0
40
80
120
160
200
240
6.88 9.85 13.71
Appl
ied
forc
e (kN
)
Slip at the loaded end of P.20.16.1 (mm)
Bigaj (1995) Shima et al. (1987) Proposed bond stress
(c) P.20.16.1
0 3 6 9 12 150
40
80
120
160
200
240
14.1310.147.37
Appl
ied
forc
e (kN
)
Slip at the loaded end of P.20.16.2 (mm)
Bigaj (1995) Shima et al. (1987) Proposed bond stress
(d) P.20.16.2
Fig. 8.5: Comparisons of experimental and analytical force-slip relationships
8.3.2 Zero strain with non-zero slip
In reinforced concrete structures designed against seismic loading conditions,
sufficient embedment length is provided for tension reinforcement and failure is
defined by rupture of steel bars (Sadek et al. 2011; Yu and Tan 2010a). However, in
precast concrete structures with non-seismic design, bottom reinforcement in the
middle joint may not be able to develop rupture due to inadequate embedment length.
Therefore, it is essential to take account of pull-out failure in analysing the behaviour
of beam-column sub-assemblages subject to progressive collapse.
Eligehausen et al. (1983) tested short embedded reinforcement in beam-column joints
under monotonic loadings and proposed a bond-slip model in accordance with the
experimental results. The model is valid for steel bars with pull-out failure at elastic
stage. When it is applied for reinforcement with inelastic pull-out failure, the ultima te
capacity is greatly overestimated (Monti et al. 1993). Viwathanatepa et al. (1979)
investigated the inelastic bond-slip behaviour and pull-out failure of ribbed bars
embedded in reinforced concrete columns. Nonetheless, little attention was paid to
the post-yield bond stress in the proposed bond-slip model. Indeed, bond stress
decreases dramatically at post-yield stage of embedded reinforcement (Shima et al.
1987), due to contraction of rebar cross section and shearing-off of concrete keys
between steel lugs (Bigaj 1995). Huang et al. (1996) defined a bilinear bond stress-
slip relationship to take account of post-yield bond stress, in which four sets of
parameters are provided in terms of bond conditions and concrete strength. This

CHAPTER 8 COMPONENT-BASED JOINT MODEL FOR SUB-ASSEMBLAGES
213
model provides a possible solution for assessing the pull-out behaviour of steel bars
at post-yield stage. Nevertheless, compared with the experimental results by Shima
et al. (1987) and Bigaj (1995), the model significantly overestimates the post-yield
bond stress.
To accurately evaluate the bond-slip behaviour and potential failure mode of short
steel reinforcing bars embedded in concrete, a new analytical approach is proposed,
in which special attention is paid to the reduction of bond stress and pull-out failure
at post-yield stage. Additionally, this approach is further simplified and calibrated
through published experimental results.
8.3.2.1 Analytical approach
In deriving the load-slip relationship of embedded reinforcing bars, the bond-slip
relationship proposed by Huang et al. (1996) is used for the elastic segments, as
expressed in Eq. (8-5). Compared with Eligehausen’s mode, it is capable of capturing
the decreasing frictional bond stress at large slips. At post-yield stage, bond stress is
approximatly assumed to be uniform over the yielded steel segments, as postulated
in the beam-column joint model by Lowes et al. (2004).
0.4
11
ss
τ τ
=
for 1s s≤ , yε ε≤
(8-5) 1τ τ= for 1 2s s s< ≤ , yε ε≤
( )( ) ( )2 1 2 3 3 2s s s sτ τ τ τ= + − − − for 2 3s s s< ≤ , yε ε≤
( ) ( )2 4 4 3s s s sτ τ= − − for 3 4s s s< ≤ , yε ε≤
yτ τ= for yε ε>
where 1τ , 2τ and yτ are the maximum bond stress, onset of frictional bond and post-
yield bond stress, respectively, which are quantified through experimental results; 1s
and 2s are slips, with 1 1s = mm and 2 3s = mm; 3s is the clear spacing of steel lugs
and taken as 10.5 mm; 4s is the slip when bond stress between concrete and
reinforcement is zero and it is taken as 33s (FIB 2000; Huang et al. 1996); ε is the
strain of steel segment; and yε is the yield strain of steel bar.

CHAPTER 8 COMPONENT-BASED JOINT MODEL FOR SUB-ASSEMBLAGES
214
As for a reinforcing bar with an “extremely short” embedment length, the bond-slip
model shown in Fig. 8.6 can be employed in the whole loading process. Nonetheless,
reinforcement with a “short” embedment length, as defined in Table 8.1, exhibits
post-yield behaviour when subjected to pull-out force. The post-yield bond stress has
to be determined for the yielded steel segments, whereas the model shown in Fig. 8.6
is still valid for the elastic steel segments. Beyond its ultimate load capacity, a
descending branch exists and unloading of yielded steel segments occurs (Engström
et al. 1998). Bond stress along yielded steel segments is assumed to be identical to
the post-yield bond stress, as concrete keys between steel lugs have been sheared off
and bond stress cannot be restored even when steel strains decrease with increasing
loaded end slip.
Fig. 8.6: Bond-slip model for embedded reinforcing bars at elastic stage
The aforementioned bond-slip relationship holds for well-confined concrete, namely,
thick concrete cover or adequate stirrups are provided in the concrete specimens such
that tension splitting cracks can be arrested.
8.3.2.2 Determination of bond stresses
In previous studies, Eligehausen et al. (1983) recommended the maximum elastic
bond stress and the frictional bond through pull-out tests on embedded reinforcement.
Once reinforcing bars enter into inelastic stage under pull-out loads, bond stress at
the post-yield stage has to be determined in order to evaluate the bond-slip behaviour
and failure mode of the embedded reinforcement. As discussed in Section 8.3.1, the
frictional bond stress given by Eligehausen et al. (1983) can be used to calculate the
post-yield bond stress if Poisson effect is considered. It is reported that the Poisson
effect contributes to 20 to 30% increase in the bond stress of steel bars in compression
τ
s
τ1
τ2
s3s2s1 s4

CHAPTER 8 COMPONENT-BASED JOINT MODEL FOR SUB-ASSEMBLAGES
215
(Eligehausen et al. 1983; Viwathanatepa et al. 1979). A value of 25% is selected and
the post-yield bond stress can be quantified as '0.68 cf .
The post-yield bond stress can also be estimated from the embedded bars featuring
pull-out failure at post-yield stage (Engström et al. 1998; Ueda et al. 1986;
Viwathanatepa et al. 1979). When the maximum load is applied to reinforcement, a
stepwise uniform bond stress profile is assumed over the embedment length, as shown
in Fig. 8.7. The maximum elastic bond stress 1τ is attained along the elastic steel
segments and post-yield bond stress yτ is over the yielded segments. As the ratio of
yτ to 1τ is 0.28 as introduced in Section 8.3.1, bond stresses 1τ and yτ can be
determined in accordance with the force equilibrium of the elastic and yielded steel
segments. Table 8.4 shows the bond stresses of embedded reinforcement tested by
Viwathanatepa et al. (1979), Ueda et al. (1986) and Engström et al. (1998). It is
noteworthy that failure cone close to the loaded end is considered by deducting its
length from the total embedment length, and therefore the effective embedment
length is used in calculating the bond stresses. The average post-yield bond stress
under pull-out forces can be quantified as '0.66 cf , close to the value calculated
from Eligehausen’s model by considering the Poisson effect.
Fig. 8.7: Bond stress distribution along a reinforcing bar at the peak pull-out
force
Table 8.4: Bond stress of embedded steel bars under pull loading condition
Author Specimen Effective
embedment length (mm)
Bond stress (with 'cf in MPa)
'1 cfτ '
2 cfτ 'y cfτ
Viwathanatepa et al. (1979) #3 546 2.93 1.08 0.82
τ1τ y
x
Fmax
x
τ
f s f y f max
le ly

CHAPTER 8 COMPONENT-BASED JOINT MODEL FOR SUB-ASSEMBLAGES
216
Ueda et al. (1986)
S61 330 2.48 0.91 0.69
S62 330 2.66 0.96 0.74
S63 330 1.88 0.69 0.53
S101 532 3.13 1.16 0.88
S102 532 2.58 0.95 0.72
S104 532 1.62 0.59 0.45
S105 532 2.15 0.79 0.60
S106 532 2.43 0.90 0.68
S107 532 1.87 0.69 0.52 Engström et al.
(1998) N290b 260 2.19 0.80 0.61
Mean value 2.36 0.87 0.66
After determining the bond stresses, a nested iteration procedure is employed to
calculate the force-slip relationship of embedded bars. The proposed analytica l
approach is calibrated against published relevant experimental results (Engström et
al. 1998; Ueda et al. 1986; Viwathanatepa et al. 1979).
8.3.2.3 Calibration of analytical approach
In calibrating the analytical approach, a bilinear stress-strain relationship of steel
reinforcement is adopted. Table 8.5 includes the material properties of reinforcement.
Both the force-slip curves and bond stress distribution along the embedment length
are obtained analytically. As bond stresses are directly computed from experimenta l
results, the maximum loads sustained by embedded reinforcing bars are
approximately identical to the experimental values, as shown in Fig. 8.8.
Comparisons between the experimental and analytical force-slip relationships
demonstrate that the proposed analytical approach yields reasonably accurate
predictions of the ascending phase of load-slip curves. However, for the descending
phase due to pull-out of embedded reinforcement from surrounding concrete, only
the experimental result of N290b by Engström et al. (1998) is provided and the
analytical result agrees well with it.
Table 8.5: Material properties of embedded bars
Author Steel bar Diamter (mm)
Elastic modulus
(GPa)
Yield strength (MPa)
Hardening modulus
(MPa)
Ultimate strength (MPa)
Viwathanatepa et al. (1979) #3 25.4 201.3 468.5 2275 737.8
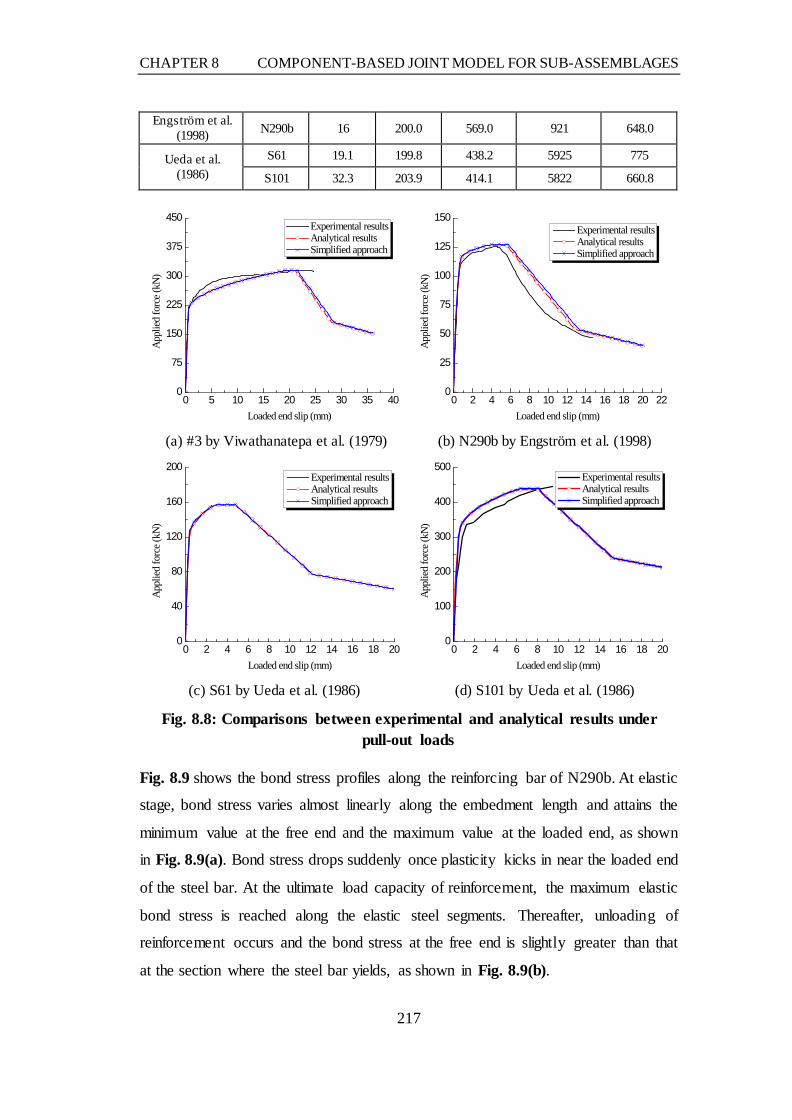
CHAPTER 8 COMPONENT-BASED JOINT MODEL FOR SUB-ASSEMBLAGES
217
Engström et al. (1998) N290b 16 200.0 569.0 921 648.0
Ueda et al. (1986)
S61 19.1 199.8 438.2 5925 775
S101 32.3 203.9 414.1 5822 660.8
0 5 10 15 20 25 30 35 400
75
150
225
300
375
450
Appl
ied fo
rce (
kN)
Loaded end slip (mm)
Experimental results Analytical results Simplified approach
(a) #3 by Viwathanatepa et al. (1979)
0 2 4 6 8 10 12 14 16 18 20 220
25
50
75
100
125
150
Appl
ied fo
rce (
kN)
Loaded end slip (mm)
Experimental results Analytical results Simplified approach
(b) N290b by Engström et al. (1998)
0 2 4 6 8 10 12 14 16 18 200
40
80
120
160
200
Appl
ied fo
rce (
kN)
Loaded end slip (mm)
Experimental results Analytical results Simplified approach
(c) S61 by Ueda et al. (1986)
0 2 4 6 8 10 12 14 16 18 200
100
200
300
400
500
Appl
ied fo
rce (
kN)
Loaded end slip (mm)
Experimental results Analytical results Simplified approach
(d) S101 by Ueda et al. (1986)
Fig. 8.8: Comparisons between experimental and analytical results under pull-out loads
Fig. 8.9 shows the bond stress profiles along the reinforcing bar of N290b. At elastic
stage, bond stress varies almost linearly along the embedment length and attains the
minimum value at the free end and the maximum value at the loaded end, as shown
in Fig. 8.9(a). Bond stress drops suddenly once plasticity kicks in near the loaded end
of the steel bar. At the ultimate load capacity of reinforcement, the maximum elastic
bond stress is reached along the elastic steel segments. Thereafter, unloading of
reinforcement occurs and the bond stress at the free end is slightly greater than that
at the section where the steel bar yields, as shown in Fig. 8.9(b).

CHAPTER 8 COMPONENT-BASED JOINT MODEL FOR SUB-ASSEMBLAGES
218
0 30 60 90 120 150 180 210 240 2700
3
6
9
12
15Bo
nd st
ress
(MPa
)
Distance from free end (mm)
Elastic stage Plastic stage
(a) At elastic and plastic stages
0 30 60 90 120 150 180 210 240 2700
3
6
9
12
15
Bond
stre
ss (M
Pa)
Distance from free end (mm)
Load capacity Descending stage
(b) At load capacity and descending stage
Fig. 8.9: Variations of bond stress along embedment length at different loading stages
8.3.2.4 Simplified approach
Bond stress distribution along the embedment length of reinforcement varies with
applied load to the steel bar, as shown in Fig. 8.9. Hence, three stages, namely, elastic
ascending stage, post-yield ascending stage and descending stage are classified so as
to simplify the analytical approach in accordance with bond stress distribution.
(a) Elastic ascending stage
Fig. 8.10: Bond stresses and slips of an embedded reinforcing bar at elastic
ascending stage
At elastic ascending stage, a linear bond stress profile is assumed along the whole
embedment length of a steel bar, as shown in Fig. 8.10. For a given slip at the loaded
end, a slip at the free end is assumed and force sustained by the steel bar can be
obtained through equilibrium, as expressed in Eq. (8-6). Bond stresses at the two ends
x
F
τ τl
τ f
s f sl
le

CHAPTER 8 COMPONENT-BASED JOINT MODEL FOR SUB-ASSEMBLAGES
219
of the steel bar can be determined through the bond-slip relationship.
Correspondingly, steel strain at the loaded end can be determined through the
constitutive model for the steel bar.
( )2
f l el dF
τ τ π+= (8-6)
( ) 22 23f l e
l fs
ls s
E dτ τ+
= + (8-7)
where fs and ls are the slips at the free end and loaded end, respectively; sE is the
elastic modulus of the steel bar; d is the diameter of the bar; fτ and lτ are the bond
stresses at the free and loaded ends, respectively; and el is the embedment length of
the steel bar.
As bond stress varies linearly along the embedment length, distribution of steel strain
is a parabolic function, with zero strain at the free end and maximum strain at the
loaded end. Accordingly, the loaded end slip can be taken as a summation of the free
end slip and the integration of steel strains along the embedment length (Shima et al.
1987). Thus, slip at the loaded end can be calculated from Eq. (8-7). Once
compatibility of the embedded reinforcement is satisfied, namely, the calculated
loaded end slip is equal to the initially assumed value, slips at the free and loaded
ends are obtained.
(b) Post-yield ascending stage
Fig. 8.11: Bond stresses and slips of an embedded reinforcing bar at plastic
ascending stage
F
x
τ
τ y
τ yeτ f
s f sl
le ly
sy

CHAPTER 8 COMPONENT-BASED JOINT MODEL FOR SUB-ASSEMBLAGES
220
Once plasticity is initiated at the loaded end, the bond stress substantially reduces at
post-yield stage of the steel bar, as depicted in Fig. 8.9(a). Hence, force equilibr ium
and compatibility have to be appropriately modified to take account of the post-yield
bond stress. In addition to the free end and loaded end slips, the length of the yielded
steel segment has to be assumed at post-yield ascending stage, as shown in Fig. 8.11.
Therefore, the force at the loaded end can be calculated from the force equilibrium of
the yielded steel segment, as expressed in Eq. (8-8). Through a bilinear constitut ive
model of reinforcement, the steel strain at the loaded end is calculated accordingly
and the slip at the yielded section can be determined from Eq. (8-9). Thereafter, the
analytical bond-slip relationship is used to determine the bond stress at the yielded
section. With respect to the elastic steel segment, the same procedure as that used for
elastic ascending stage is followed. As force at the section where the steel bar yields
is known, the calculated force from Eq. (8-10) must be equal to the yield force of the
reinforcement. Moreover, slips computed from Eqs. (8-9) and (8-11) must be equal
to one another so as to satisfy compatibility.
+y y yF F d lπ τ= (8-8)
( )2
y l yy l
ls s
ε ε+= − (8-9)
( )2
f ye ey
l dF
τ τ π+= (8-10)
( ) 22 23
f ye ey f
s
ls s
E dτ τ+
= + (8-11)
Where yF , yε , ys and yeτ are the force, strain, slip and bond stress at the section
where the steel bar attains its yield strength, respectively; fτ is the post-yield bond
stress; yl is the length of yielded steel segment; and lε is the steel strain at the loaded
end.
(c) Descending stage
Beyond the maximum load that the embedded bar is able to sustain, the applied force
starts decreasing with increasing loaded end slip, as shown in Fig. 8.8. Hence, a
different analytical procedure is proposed to take account of the descending stage.

CHAPTER 8 COMPONENT-BASED JOINT MODEL FOR SUB-ASSEMBLAGES
221
Once the descending stage commences, the strain of the embedded bar decreases with
increasing loaded end slip. The maximum strain at each section should be used to
determine the steel stress at descending stage. Based on stress state at post-yield
ascending stage, the whole embedment length of reinforcement is divided into two
segments, namely, elastic segment and debonded segment. The length of the
debonded segment can be treated as the length of yielded steel segment at post-yield
ascending stage, over which bond stress remains the same as the post-yield bond
stress. Nonetheless, a linear bond stress distribution can still be assumed along the
elastic segment, as shown in Fig. 8.12.
Fig. 8.12: Bond stresses and slips of an embedded reinforcing bar at
descending stage
As for the elastic steel segment, the analytical procedure at elastic ascending stage is
applied and slips at the free end and transition section between the elastic and
debonded segments are correlated by Eq. (8-12). It is notable that the force at the
transition section, which can be calculated from equilibrium in Eq. (8-13), should be
smaller than the yield force of the steel bar. The procedure used for the yielded steel
segment at post-yield ascending stage can be employed for the debonded segment, as
expressed in Eqs. (8-14) and (8-15).
( ) 22 23
f d dd f
s
ls s
E dτ τ+
= + (8-12)
( )2
f d ed
l dF
τ τ π+= (8-13)
( )2
d l dl d
ls s
ε ε+= + (8-14)
d y dF F d lπ τ= + (8-15)
F
x
τ
τ y
τdτ f
s f sl
le ld
sd

CHAPTER 8 COMPONENT-BASED JOINT MODEL FOR SUB-ASSEMBLAGES
222
where dF , ds and dε are the force, slip and strain at the transition section,
respectively; dl is the length of debonded segment which is the same as the yielded
length of steel bar at the load capacity; and dτ is the bond stress at the transit ion
section.
8.3.2.5 Verification of simplified approach
Experimental results listed in Table 8.4 are simulated through the simplified
approach. Comparisons between the experimental and analytical results indicate that
the simplified approach yields reasonably good predictions of the overall bond-slip
behaviour of embedded steel reinforcement, as shown in Fig. 8.8. However, the
calculated free end slip is slightly larger than that estimated by the nested iteration
procedure due to the assumption of linear bond stress distribution along the elastic
steel segment.
8.3.3 Non-zero strain with zero slip
The average bond stresses at elastic and post-yield stages of embedded steel
reinforcement with sufficient anchorage length have been quantified and calibrated
by experimental results in Section 8.3.1. Nonetheless, under axial tension loading
condition, the steel stress at the centre of the embedment length may not be zero and
its value increases with decreasing embedment length and increasing load acting on
the reinforcement. With a tensile stress sf at two ends of an embedded reinforc ing
bar, only if the embedment length is sufficient to ensure zero strain at the centre point,
the average elastic bond stress is '0.043 c sf f If the embedment length is insufficient,
the force-slip relationship of the steel bar subjected to axial tension has to be derived
in accordance with the stress state of the loaded end and mid-point of the embedment
length (Yu 2012).
Fig. 8.13 shows a steel bar under axial tension when tensile stresses at the loaded end
and mid-point of the embedment length are below the yield strength, namely, s yf f≤
and 0 sc yf f< < . Due to symmetry, the steel segment between points A and B is
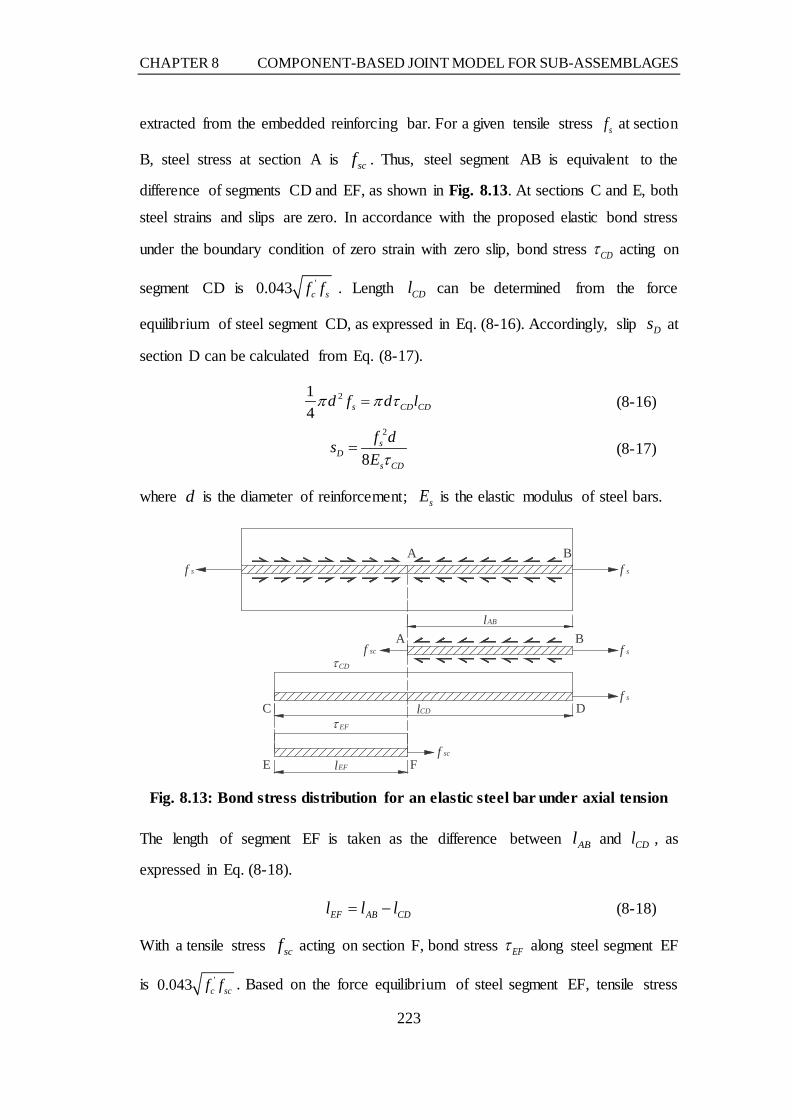
CHAPTER 8 COMPONENT-BASED JOINT MODEL FOR SUB-ASSEMBLAGES
223
extracted from the embedded reinforcing bar. For a given tensile stress sf at section
B, steel stress at section A is scf . Thus, steel segment AB is equivalent to the
difference of segments CD and EF, as shown in Fig. 8.13. At sections C and E, both
steel strains and slips are zero. In accordance with the proposed elastic bond stress
under the boundary condition of zero strain with zero slip, bond stress CDτ acting on
segment CD is '0.043 c sf f . Length CDl can be determined from the force
equilibrium of steel segment CD, as expressed in Eq. (8-16). Accordingly, slip Ds at
section D can be calculated from Eq. (8-17).
214 s CD CDd f d lπ π τ= (8-16)
2
8s
Ds CD
f dsE τ
= (8-17)
where d is the diameter of reinforcement; sE is the elastic modulus of steel bars.
Fig. 8.13: Bond stress distribution for an elastic steel bar under axial tension
The length of segment EF is taken as the difference between ABl and CDl , as
expressed in Eq. (8-18).
EF AB CDl l l= − (8-18)
With a tensile stress scf acting on section F, bond stress EFτ along steel segment EF
is '0.043 c scf f . Based on the force equilibrium of steel segment EF, tensile stress
τCD
τ EF
lAB
lCD
lEF
f sf s
f sf sc
f s
DC
f sc
A B
A B
E F

CHAPTER 8 COMPONENT-BASED JOINT MODEL FOR SUB-ASSEMBLAGES
224
scf at section F can be determined from Eq. (8-19). Slip Fs at section F can be
quantified from Eq. (8-20). After determining the slips at sections D and F, slip at
section B can be calculated as the difference between Ds and Fs , as expressed in Eq.
(8-21).
214 sc EF EFd f d lπ π τ= (8-19)
2
8sc
Fs EF
f dsE τ
= (8-20)
B D Fs s s= − (8-21)
Once the reinforcing bar enters the inelastic stage at the loaded end while the mid-
point of the embedment length is at the elastic stage, namely, s yf f> and
0 sc yf f< < , post-yield bond stress yτ along yielded steel segment GD remains at
'0.4 cf , as shown in Fig. 8.14. Accordingly, the length of steel segment GD can be
determined from force equilibrium, as expressed in Eq. (8-22).
( )4
s yGD
y
f f dl
τ−
= (8-22)
where yτ is the bond stress of steel reinforcement at the post-yield stage.
Fig. 8.14: Bond stress distribution for a yielded steel bar at loaded end
At section G, the embedded reinforcement attains its yield strength. Based on the
proposed elastic bond stress, CGτ along steel segment CG can be determined as
f sf s
f sf sc
f s
DC
f sc
A B
A B
E F
τCG
τ EF
lAB
lCG
lEF
τ y
lGDG

CHAPTER 8 COMPONENT-BASED JOINT MODEL FOR SUB-ASSEMBLAGES
225
'0.043 c yf f , and the length of steel segment CG can be calculated from Eq. (8-23).
For steel segment CD, tensile stress at section C is zero, and slip at section D can be
computed from Eq. (8-24). Based on compatibility, the length of steel segment EF
can be quantified from Eq. (8-25). Force equilibrium expressed in Eq. (8-19) can be
used to determine tensile stress scf at section F. Thus, slips at sections F and B can
be calculated from Eqs. (8-20) and (8-21), respectively.
4y
CGCG
f dl
τ= (8-23)
( ) ( )22
8 4 8s y y s yy
DCG s y s y h
f f f d f f df ds
E E Eτ τ τ
− −= + + (8-24)
EF CG GD ABl l l l= + − (8-25)
Furthermore, the mid-point of the embedded reinforcement may develop inelast ic
strain due to a short embedment length, namely, s yf f> and sc yf f> , as shown in
Fig. 8.15. At that stage, the post-yield bond stress (i.e. '0.4 cf ) is uniformed
distributed along steel segment AB. Tensile stress scf at section A can be determined
from the force equilibrium of segment AB, as expressed in Eq. (8-26). Slip at section
B can be calculated from Eq. (8-27).
4 y ABsc s
lf f
dτ
= − (8-26)
( ) ( )2
4 8s sc sc s sc
By s y h
f f f d f f ds
E Eτ τ− −
= + (8-27)
where hE is the hardening modulus of steel reinforcement.
Fig. 8.15: Bond stress distribution for a yielded steel bar at mid-point of embedment length
f sf s
f s
B
A B
lAB
τ y
Af sc

CHAPTER 8 COMPONENT-BASED JOINT MODEL FOR SUB-ASSEMBLAGES
226
Material properties and embedment length of T13 rebar given by Yu (2012) are used
for simulations through the proposed model, as listed in Table 8.6. Fig. 8.16(a) shows
the predicted force-slip curves at the elastic stage. Similar to the boundary condition
of zero strain with zero slip, the proposed model predicts considerably softer force-
slip response in comparison with Yu’s model (Yu and Tan 2010b) and Shima’s model
(Shima et al. 1987). At the post-yield stage, the proposed model gives the smalles t
ultimate slip at the loaded end, as shown in Fig. 8.16(b), due to a greater post-yield
bond stress used in the model. However, limited published experimental results on
axial tension tests prevent further calibration of the analytical model.
Table 8.6: Material properties and embedment length for T13 rebar (Yu 2012)
Item Steel properties Concrete strength
(MPa) Embedment length (mm) Diameter
(mm) Yield strength
(MPa) Elastic modulus
(GPa) T13 13 494 185.9 38.2 125
0.00 0.05 0.10 0.15 0.20 0.25 0.30 0.35 0.400
10
20
30
40
50
60
70
80
0.250.19 0.36
Appl
ied fo
rce (
kN)
Slip at the loaded end of T13 (mm)
Yu and Tan (2010b) Shima et al. (1987) Proposed model
(a) At elastic stage
0 2 4 6 8 10 12 140
20
40
60
80
100
12.089.158.12
Appl
ied
forc
e (kN
)
Slip at the loaded end of T13 (mm)
Yu and Tan (2010b) Shima et al. (1987) Proposed model
(b) At post-yield stage
Fig. 8.16: Relationship of applied force and loaded end slip for reinforcing bar T13 under axial tension
8.4 Properties of Compressive Spring
Generally, tensile strength of conventional concrete is neglected in determining the
properties of tensile spring. The force-slip relationship of bare steel bars in tension
can be used to represent the tensile spring at the joint interface, as proposed by Lowes
et al. (2004) and Yu and Tan (2010b). However, in the compressive spring, the
contribution of compressive concrete to total compression force has to be properly

CHAPTER 8 COMPONENT-BASED JOINT MODEL FOR SUB-ASSEMBLAGES
227
considered. In order to derive the force-slip relationship of the compressive spring,
compression force sustained by concrete is related to the compressive strain of
longitudinal reinforcement (Lowes et al. 2004; Yu 2012). Lowes et al. (2004)
expressed the total force in the compression zone as a function of the compressive
force in reinforcement and calculated the ratio of the total compression force to the
reinforcement force when the extreme compression fibre attained the crushing strain
of concrete. In determining the ratio, no axial compression force was considered in
reinforced concrete beams. Thus, it is not suitable for column removal scenarios
which are characterised by axial compression force in the bridging beam at
compressive arch action (CAA) stage. Yu (2012) considered a compression force in
the beam and assumed the compression force sustained by concrete to vary linear ly
with the compressive strain of reinforcement before the crushing strain of concrete
was attained at the extreme compression fibre. Equivalent rectangular concrete stress
block was employed to calculate the maximum compression force in concrete.
However, at large deformation stage, the equivalent concrete stress block is not valid
due to severe crushing of concrete in the compression zones of the beam. Thus, the
force in the compression zone has to be re-examined.
8.4.1 Determination of compression force
Under column removal scenarios, compression force develops in the bridging beam
at CAA stage and varies with increasing middle joint displacement. Therefore, in
determining the total force in the compression zone, axial compression force in the
beam has to be considered. Due to changes in the compression force, the centroid of
compressive stress sustained by concrete also varies at CAA stage. In order to derive
the force-slip relationship of compressive spring, neutral axis depths at the middle
joint and end column stub have to be determined.
For simplicity, it is assumed that the neutral axis depth at the beam end is kept
constant at CAA stage (Yu 2012). It is calculated when the beam end section attains
its moment capacity with a compression force of 0.5 crN acting on it, as shown in Fig.
8.17. crN is the axial compression force in the beam at a critical state when tensile
reinforcement attains its yield strain and compressive concrete reaches its crushing

CHAPTER 8 COMPONENT-BASED JOINT MODEL FOR SUB-ASSEMBLAGES
228
strain simultaneously. Thus, force equilibrium at the beam end is expressed in Eq. (8-
28).
' ' '0.5 0.85cr scr s c y sN f A f b c f Aβ= + − (8-28)
in which yf is the yield strength of reinforcement in tension; 'scrf is the compressive
stress of reinforcement at the critical state; sA and 'sA are the areas of reinforcement
in the tension and compression zones, respectively; b is the width of the beam; and
c is the neutral axis depth.
Fig. 8.17: Neutral axis depth at beam end
After determining the neutral axis depth at the beam ends, relationship between the
compression force in concrete and the strain of compressive reinforcement has to be
established in accordance with the plane-section assumption. Instead of the
equivalent rectangular concrete stress block in the compression zone, the constitut ive
model for concrete proposed by Mander et al. (1988) is used to calculate the
compression forces in concrete. At each strain of the compressive reinforcement, the
strain profile of concrete in the compression zone is determined and the associated
compressive stress is obtained through Mander’s concrete stress-strain model. The
compression force sustained by concrete can be calculated through integration of the
compressive stress across the compression zone. Similar to the method proposed by
Lowes et al. (2004), the ratio of total compression force to the force sustained by the
compressive reinforcement is calculated from Eq. (8-29).
c sc
s
C CC
γ += (8-29)
a sa' s εcu
εs
βcc
0.85f 'c
f 's
f y
0.5Ncr
Mu
Mid-depth axis
T
Cs
Cc

CHAPTER 8 COMPONENT-BASED JOINT MODEL FOR SUB-ASSEMBLAGES
229
in which cC and sC are the compression forces sustained by the concrete and the
compressive reinforcement, respectively.
As for beam-column sub-assemblages designed against gravity loads, the top
longitudinal reinforcement ratio in the beam is normally greater than the bottom
reinforcement ratio. Under column removal scenarios, more tensile reinforcement is
provided at the face of the end column stub in comparison with compressive
reinforcement. However, due to reversal of bending moment at the middle joint, the
compressive reinforcement ratio is significantly greater than the tensile reinforcement
ratio at the face of the middle joint. Therefore, beam sections at the faces of the middle
joint and end column stub have to be analysed separately by using the foregoing
procedure. Table 8.7 lists the material and geometric properties of beam sections
given by Yu (2012).
Table 8.7: Material and geometric properties of beam sections
Section Cross section (mm)
Concrete strength (MPa)
Tensile reinforcement
Compressive reinforcement
Area (mm2)
Strength (MPa)
Area (mm2)
Strength (MPa)
(I) Column stub face 150x250 38.1
398.2 494 265.5 494
(II) Middle joint face 265.5 494 398.2 494
0.000 0.002 0.004 0.006 0.008 0.0100
1
2
3
4
5
6
7
8
Enha
ncee
mnt
facto
r γc
Strain of compressive reinforcement
Column stub face Middle joint face
(a) Enhancement factors
0.000 0.002 0.004 0.006 0.008 0.0100
100
200
300
400
500
Com
pres
sion
forc
e (kN
)
Strain of compressive reinforcement
Column stub face Middle joint face
(b) Compression forces
Fig. 8.18: Enhancement factors and compression forces at middle joint and end column stub
Fig. 8.18 shows the variations of enhancement factor and total compression force
with the strain of compressive reinforcement. It is apparent that the enhancement
factor decreases with increasing strain of reinforcement in the compression zones, as

CHAPTER 8 COMPONENT-BASED JOINT MODEL FOR SUB-ASSEMBLAGES
230
shown in Fig. 8.18(a). Besides, the enhancement factor at the face of the end column
stub is substantially greater than the value at the face of the middle joint due to a
lower compressive reinforcement ratio at the end column stub. However, almost the
same maximum compression forces are obtained at the two faces, as shown in Fig.
8.18(b). The compression force starts decreasing after attaining its maximum value
due to softening of compressive concrete. With more compressive reinforcement at
the face of the middle joint, total compression force decreases more slowly compared
to that at the face of the end column stub.
Through the proposed method, force in the compression zone of beam sections can
be quantified. It is assumed that compressive spring is located at the centroid of the
compression zone. Thus, the total compression force has to be transformed to the
equivalent compression force in the compressive spring so that bending moment at
the beam section remains the same as the actual value. Furthermore, in order to
determine the force-slip relationship of the compressive spring, the bond stress of
reinforcement subjected to compression has to be determined and the slip of
compressive reinforcement at each load level has to be calculated in accordance with
bond-slip model.
8.4.2 Bond stress in compression
In the analytical model proposed by Eligehausen et al. (1983), it is indicated that the
same bond stress can be used for reinforcement in tension and compression. However,
it only holds at elastic stage. Once a steel bar yields, Poisson effect comes into effect
and affects the post-yield bond stress of reinforcement in tension and compression.
Therefore, the Poisson effect has to be considered in determining the bond stress of
compressive reinforcement at post-yield stage.
The post-yield bond stress of a reinforcing bar with an adequate embedment length
in tension can be determined as '0.41 cf (see Section 8.3.1), when the steel cross
section contracts due to the Poisson effect, resulting in a reduction of frictional bond
stress by 25% at inelastic stage. Likewise, expansion of the steel cross section in
compression would increase the bond stress by 25%, as discussed by Eligehausen et
al. (1983) and Viwathanatepa et al. (1979). Hence, the bond stress for yielded

CHAPTER 8 COMPONENT-BASED JOINT MODEL FOR SUB-ASSEMBLAGES
231
reinforcing bars in compression can be estimated as '0.68 cf , 1.67 times that of
yielded reinforcement in tension. If the embedment length of a steel bar is insufficient
to ensue zero slip at the free end, the post-yield bond stress of the bar in tension can
be calculated as '0.68 cf , as discussed in Section 8.3.2. The value becomes
'1.14 cf if the steel reinforcement yields in compression.
8.4.3 Force-slip relationship of compressive spring
0.0 0.3 0.6 0.9 1.2 1.50
100
200
300
400
500
Com
pres
sion
forc
e (kN
)
Reinforcement slip (mm)
Column stub face Middle joint face
Fig. 8.19: Force-slip relationships of compressive springs
The same boundary conditions as those in tension, namely, zero strain with zero slip,
zero strain with non-zero slip and non-zero strain with zero slip, are defined for
embedded reinforcement subjected to compression. Force-slip relationship of
reinforcement can be determined according to the proposed bond stresses in
compression. The slip of reinforcement is assumed to be identical to that of
compressive spring. To derive the force-slip relationship of compressive spring, the
force in the compressive spring and associated slip are correlated through the strain
of compressive reinforcement. Fig. 8.19 shows the force-slip relationships of the
compressive springs at the end column stub and middle joint. For each spring,
compression force increases with increasing slip of the compressive reinforcement
until it attains the yield strain. Following yielding of the compressive reinforcement,
total compression force drops rapidly due to crushing of compressive concrete, and
then levels off as a result of compression force sustained by steel reinforcement.
Compared to the end column stub, a greater compressive reinforcement ratio at the

CHAPTER 8 COMPONENT-BASED JOINT MODEL FOR SUB-ASSEMBLAGES
232
face of the middle joint enables the compressive spring to sustain a greater residual
force at the post-yield stage of the compressive reinforcement.
8.5 Shear Panel Spring
In previous numerical studies, modified compression field theory was used to define
the constitutive law of shear-panel component in reinforced concrete beam-column
joints under cyclic loading conditions (Lowes and Altoontash 2003). Under column
removal scenarios, Bao et al. (2008) defined two rotational springs at the pin nodes
of the joint zone to capture distortion of joints. Similarly, Yu (2012) proposed two
diagonal springs in the joint panel to represent shear distortions of beam-column
joints. However, it is observed that the deformation of the middle beam-column joint
is insignificant under column removal scenarios due to limited shear force in the joint.
For the sake of brevity, a rigid joint panel is assumed in the model. In other words,
the diagonal springs are assumed to be at linear elastic stage with infinite stiffness
values when subjected to CAA and catenary action.
8.6 Validation of Joint Model
8.6.1 Parameters of springs
Properties of the tensile and compressive springs can be determined based on the
proposed approaches. In the component-based joint model, the constitutive model of
each spring is simplified as a trilinear curve. Table 8.8 summarises the properties of
zero-length springs at the joint interfaces of sub-assemblages MJ-B-0.88/0.59R and
CMJ-B-1.19/0.59.
Bottom spring at the middle joint and top spring at the end column stub sustain
tension forces under column removal scenarios. Thus, only their tensile branch is
defined, as included in Table 8.8. MJ-B-0.88/0.59R exhibited pull-out failure of
bottom reinforcement in the middle joint. Based on the boundary condition of zero
strain with zero slip at the free end, the ultimate slip of the tensile spring at the middle
joint interface is 42.2 mm and associated load is nearly zero. In CMJ-B-1.19/0.59,
rupture of bottom bars occurred at the interface of the middle joint and the respective
slips are calculated as 17.199 mm. At the face of the end column stub, all three sub-

CHAPTER 8 COMPONENT-BASED JOINT MODEL FOR SUB-ASSEMBLAGES
233
assemblages developed rupture of beam top reinforcement. Therefore, force-slip
relationships of the top reinforcement embedded in the end column stub are
determined in accordance with the boundary condition of zero strain with zero slip at
the free end.
Table 8.8: Parameters of springs in joint model
Specimen
At the middle joint interface*
bbk btk
Tensile branch Tensile branch Compressive branch
ts (mm) tF (kN) ts (mm) tF (kN) cs (mm) cF (kN)
MJ-B-0.88/0.59R
0.800 119.65 0.454 186.00 0.300 359.00
6.400 123.25 3.431 207.00 0.462 400.00
42.200 1.00 12.600 228.00 25.000 317.00
CMJ-B-1.19/0.59
0.392 145.74 0.495 303.25 0.342 555.00
4.731 165.52 3.643 332.50 0.503 594.00
17.199 185.29 13.486 364.42 25.000 417.00
Specimen
At the end column stub interface*
btk bbk
Tensile branch Tensile branch Compressive branch
ts (mm) tF (kN) ts (mm) tF (kN) cs (mm) cF (kN)
MJ-B-0.88/0.59R
0.460 187.55 0.460 125.03 0.300 425.00
3.365 206.86 3.365 137.91 0.462 448.00
11.629 226.18 11.629 150.78 25.000 290.00
CMJ-B-1.19/0.59
0.495 303.25 0.392 145.74 0.237 524.00
3.822 333.46 4.731 165.52 0.379 545
13.285 363.68 17.199 185.29 25.000 297 *: k bt and k bb are the top and bottom springs at the face of the middle joint and end column stub.
Top sping at the middle joint and bottom spring at the end column stub are in
compression at the CAA stage and are shifted to tension with increasing vertical
displacement at the catenary action stage. Therefore, both tensile and compressive
branches are defined, as shown in Table 8.8. In the middle joint, the boundary
condition of non-zero strain with zero slip is used to determine the force-slip
relationship of the top spring. However, at the end column stub, the embedment
length of bottom reinforcement is adequate to ensure zero strain and zero slip at the
free end. Thus, properties of the bottom spring are determined in accordance with the
boundary condition of zero strain with zero slip. Once the compressive spring at CAA

CHAPTER 8 COMPONENT-BASED JOINT MODEL FOR SUB-ASSEMBLAGES
234
stage is shifted to tension at catenary action stage, the same boundary condition are
used for the tensile branch, whereas the average bond stress has to be changed
accordingly.
8.6.2 Comparisons with experimental results
0 100 200 300 400 500 600 700 8000
20
40
60
80
100
120
Verti
cal l
oad
(kN)
Middle joint displacement (mm)
Experimental results Analytical results
(a) Vertical load-middle joint displacement
curve of MJ-B-0.88/0.59R
0 100 200 300 400 500 600 700 800-300
-200
-100
0
100
200
300
Horiz
ontal
reac
tion
forc
e (kN
)
Middle joint displacement (mm)
Experimental results Analytical results
(b) Horizontal force-middle joint
displacement curve of MJ-B-0.88/0.59R
0 100 200 300 400 500 6000
30
60
90
120
150
Verti
cal l
oad
(kN)
Middle joint displacement (mm)
Experimental results Analytical results
(c) Vertical load-middle joint displacement
curve of CMJ-B-1.19/0.59
0 100 200 300 400 500 600
-300
-200
-100
0
100
200
300
Horiz
ontal
reac
tion
forc
e (kN
)
Middle joint displacement (mm)
Experimental results Analytical results
(d) Horizontal force-middle joint
displacement curve of CMJ-B-1.19/0.59
Fig. 8.20: Comparisons of experimental and numerical results of precast concrete beam-column sub-assemblages
The component model for precast concrete joints is validated by the experimenta l
results of precast concrete beam-column sub-assemblages. Fig. 8.20 shows the
comparisons between the experimental and numerical results. It indicates that the
model is able to estimate the vertical loads and horizontal forces of precast concrete
sub-assemblages MJ-B-0.88/0.59R and CMJ-B-1.19/0.59 with reasonable accuracy.
Pull-out failure and rupture of bottom reinforcement in the middle joint are

CHAPTER 8 COMPONENT-BASED JOINT MODEL FOR SUB-ASSEMBLAGES
235
successfully captured in MJ-B-0.88/0.59R and CMJ-B-1.19/0.59, respective ly.
Besides, behaviour of reinforced concrete beam-column sub-assemblages tested by
Yu (2012) is also simulated under column removal scenarios. Reasonably good
agreement is also achieved between the experimental and numerical results, as shown
in Fig. 8.21.
0 100 200 300 400 500 600 7000
20
40
60
80
100
120
Verti
cal l
oad
(kN)
Middle joint displacement (mm)
Experimental results Analytical results
(a) Vertical load-middle joint displacement
curve of S4-1.24/0.82/23
0 100 200 300 400 500 600 700-300
-200
-100
0
100
200
300
Horiz
ontal
reac
tion
forc
e (kN
)
Middle joint displacement (mm)
Experimental results Analytical results
(b) Horizontal force-middle joint
displacement curve of S4-1.24/0.82/23
0 100 200 300 400 500 600 7000
20
40
60
80
100
120
Verti
cal l
oad
(kN)
Middle joint displacement (mm)
Experimental results Analytical results
(c) Vertical load-middle joint displacement
curve of S5-1.24/1.24/23
0 100 200 300 400 500 600 700-300
-200
-100
0
100
200
300
Horiz
ontal
reac
tion
forc
e (kN
)
Middle joint displacement (mm)
Experimental results Analytical results
(d) Horizontal force-middle joint
displacement curve of S5-1.24/1.24/23
Fig. 8.21: Comparisons of experimental and numerical results of reinforced concrete sub-assemblages
8.7 Discussions
The component model for beam-column joints cannot be used for short beams
featuring shear failure, as linear elastic shear springs are assumed at the joint interface.
Besides, in deriving the force-slip relationship of tensile springs in the joint model,
different bond stresses are utilised for steel reinforcing bars with different embedment

CHAPTER 8 COMPONENT-BASED JOINT MODEL FOR SUB-ASSEMBLAGES
236
lengths. If the embedment length of reinforcement is insufficient to ensure zero slip
at the free end, bond stresses at the elastic and post-yield stages are significant ly
greater than that of steel bars with adequately long length and zero slip at the free end.
This phenomenon is also reported by FIB (2000) for short reinforcement embedded
in concrete. However, limited emphasis is placed on the fundamental mechanism for
bond-slip behaviour of short and long steel bars. Hence, experimental tests on
reinforcement with various embedment lengths are needed so that direct comparison
can be made between bond stresses at the elastic and post-yield stages of
reinforcement.
Under cyclic loading conditions, no axial force develops in the reinforced concrete
beam. The force in the compression zone of the beam can be simply assumed to be
equal to the tension force sustained by longitudinal reinforcement. However, under
column removal scenarios, the bridging beam over the damaged column develops
axial compression force when vertical displacement is less than one beam depth. In
order to achieve reasonably accurate estimation of the joint behaviour under column
removal scenarios, the compression force in the beam has to be quantified in
determining the properties of compressive spring (Yu 2012). The magnitude of the
compression force depends on the span-depth ratio and boundary condition of the
bridging beam, which increases the difficulty in deriving the force-slip relationship
of the compressive spring. In this chapter, a constant axial compression force is
considered in calculating the neutral axis depth at beam ends and it is reasonable for
beam-column sub-assemblages with moderate span-depth ratio and rigid boundary
condition. However, the value may not be suitable for sub-assemblages with weaker
restraints and smaller span-depth ratios. Therefore, further experimental and
numerical investigations are necessary to establish the relationships of axial
compression force, span-depth ratio and boundary condition under column removal
scenarios.
8.8 Conclusions
In this chapter, a component-based joint model is developed for precast concrete
beam-column joints under column removal scenarios. In the model, interactions
between the beam and joint are represented by tensile, compressive and shear springs.

CHAPTER 8 COMPONENT-BASED JOINT MODEL FOR SUB-ASSEMBLAGES
237
The tensile spring can be defined by the force-slip relationship of embedded
reinforcement. In accordance with the embedment length and loading conditions,
boundary conditions of embedded reinforcement, namely, zero strain with zero slip,
zero strain with non-zero slip and non-zero strain with zero slip, are considered in
deriving the properties of the spring. Macro-models are employed to calculate the slip
of reinforcement, in which average bond stresses of reinforcement at the elastic and
post-yield stages are re-evaluated based on experimental results. Besides fracture of
reinforcement with an adequate embedment length, pull-out failure of short
embedded reinforcement can also be predicted in the model. As for the compressive
spring, its slip is represented by the slip of compressive reinforcement, whereas total
compression force in the spring is contributed by concrete and the compressive
reinforcement. In calculating the compression force sustained by concrete, Mander’s
concrete model is used instead of equivalent concrete stress block. Therefore,
descending branch of the compression force is captured. The shear spring is assumed
to be at linear elastic stage with infinite stiffness. Finally, the joint model is calibrated
by experimental results of precast and reinforced concrete beam-column sub-
assemblages under column removal scenarios. Comparisons between the
experimental and numerical results indicate that the joint model is able to estimate
the vertical load capacity and horizontal reaction force with reasonable accuracy.

CHAPTER 8 COMPONENT-BASED JOINT MODEL FOR SUB-ASSEMBLAGES
238

CHAPTER 9 CONCLUSIONS AND FUTURE WORK
239
CHAPTER 9 CONCLUSIONS AND FUTURE WORK
9.1 Conclusions
The research programme investigated the behaviour of precast concrete beam-
column sub-assemblages and frames subject to middle column removal scenarios.
Besides, engineered cementitious composites (ECC), a strain-hardening fibre-
reinforcement concrete in tension, was utilised in cast-in-situ concrete topping and
beam-column joints to study the potential enhancement of ductile concrete to
structural resistance and deformation capacity of sub-assemblages. Thereafter, an
analytical model was proposed for estimating the compressive arch action (CAA) of
sub-assemblages and a component-based joint model was developed for precast
concrete beam-column joints under column removal scenarios.
Experimental tests on precast concrete beam-column sub-assemblages
Precast concrete structures feature weak beam-column joints and discontinuity of
longitudinal reinforcement in the beam. Under column removal scenarios, the ability
of precast concrete joints to develop alternate load paths remains questionable due to
a lack of integrity and robustness. Thus, an experimental programme was conducted
to investigate the resistance and deformation capacity of precast concrete beam-
column sub-assemblages subject to column removal scenarios.
With fairly rigid boundary conditions, precast concrete sub-assemblages developed
significant CAA and subsequent catenary action under middle column removal
scenarios, due to the presence of continuous top reinforcement in the cast-in-situ
structural topping. A higher top reinforcement ratio in the beam favoured the
development of catenary action at large deformation stage. Similar to reinforced
concrete specimens, the deformation capacity of precast concrete sub-assemblages
was considerably greater than that specified in UFC 4-023-03. In addition to plastic
hinge rotations at the beam ends, flexural deformations of the bridging beam, in
particular, formation of a partial hinge at the curtailment point of top reinforcement,
contributed a significant portion to total deformation of sub-assemblages.

CHAPTER 9 CONCLUSIONS AND FUTURE WORK
240
At CAA stage, flexural cracks were mainly concentrated on the tension side of the
beam and bottom reinforcement in the middle joint exhibited pull-out failure. Severe
crushing of concrete occurred in the compression zones of the beam. Horizonta l
cracking was observed across the interface between precast beam units and cast-in-
situ concrete topping at CAA stage, as compression force in the beam increased the
horizontal shear stress acting on the concrete interface. Following the onset of
catenary action, full-depth tension cracks were generated along the beam length, with
nearly equal spacing. Discontinuity of top reinforcement enabled the development of
a partial hinge at the curtailment point of beam top reinforcement. Final failure was
caused by rupture of top longitudinal reinforcement near the end column stub.
In the experimental programme on beam-column sub-assemblages, relatively rigid
boundary conditions were provided for the bridging beam by enlarged end column
stubs. Accordingly, the resistance of sub-assemblages was significant ly
overestimated in comparison with those with realistic boundary conditions. Moreover,
development of CAA and subsequent catenary action in the bridging beam may
induce shear failure to the joint and flexural failure to the side column. Therefore,
experimental tests were conducted on precast concrete frames with slender side
columns to evaluate the effect of boundary conditions on the behaviour of beam-
column joints.
Effect of ECC on structural resistances of sub-assemblages
Experimental results of precast concrete beam-column sub-assemblages indicate that
the embedment length of bottom steel reinforcement in the middle joint has to be
increased to prevent pull-out failure when subjected to sagging moment. An
alternative is to utilise ECC in the joint zone which increases the bond strength
between reinforcement and surrounding concrete and considerably reduces the
required embedment length. Besides, the tensile strength of ECC can be considered
in the design due to its strain-hardening behaviour and ultra-high strain capacity in
tension. However, potential applications of ECC to progressive collapse scenarios
have not been explored yet. Therefore, experimental tests were conducted on precast
ECC beam-column sub-assemblages under column removal scenarios.

CHAPTER 9 CONCLUSIONS AND FUTURE WORK
241
Under quasi-static loading conditions, sub-assemblage EMJ-B-1.19/0.59, with ECC
in structural topping and beam-column joints, was capable of developing nearly the
same CAA and catenary action as precast concrete specimen CMJ-B-1.19/0.59. Its
catenary action capacity was 21.1% greater than the CAA capacity, indicating the
effective enhancement of catenary action to structural resistance. By reducing the top
reinforcement ratio in the beam, limited catenary action was obtained as a result of
premature fracture of top reinforcement near the end column stub. The fracture of
reinforcement might result from a greater bond strength between steel reinforcement
and ECC.
In terms of the crack pattern, multiple hairline cracks developed in the ECC topping
at the initial stage. Steel reinforcement and ECC sustained tensile stresses in a
compatible manner. At large deformation stage, formation of a major crack near the
end column stub localised the ration of sub-assemblages in a limited region, which
eventually expedited fracture of top reinforcement at the crack. By reducing the
reinforcement ratio in the structural topping, more severe localisation of flexura l
deformations was recorded at the end column stub. Therefore, compared to
conventional concrete, ECC significantly increased the demand on the deformation
capacity of plastic hinges near the end column stub under progressive collapse
scenarios.
Resistance and deformation capacity of precast concrete frames
Precast concrete frames exhibited different behaviour from beam-column sub-
assemblages. Due to insufficient horizontal restraints, limited compression force
developed in the bridging beam. The enhancement of CAA to flexural action was
considerably lower than that in the beam-column sub-assemblages. When vertical
displacement was larger than one beam depth, frames IF-B-0.88-0.59 and EF-B-0.88-
0.59 exhibited premature rupture of top reinforcement as a result of the reduced
neutral axis depth at the column face. Only interior frame IF-L-0.88-0.59 was able to
mobilise significant catenary action at large deformation stage, as lap-spliced bottom
reinforcement in the beam sustained tensile stress and postponed rupture of top bars.
In exterior frame EF-L-0.88-0.59, horizontal tension force at catenary action stage
CHAPTER 9 CONCLUSIONS AND FUTURE WORK
242
resulted in flexural failure of the side column, which hindered the full development
of catenary action.
By increasing the top reinforcement ratio in the beam of exterior frames, severe
diagonal shear cracking developed in the side beam-column joint and propagated into
the column, when compression force in the beam attained the maximum value at
CAA stage. Force equilibrium of the side column indicates that at CAA stage shear
force in the joint was increased by the horizontal compression force in the beam. At
catenary action stage, the shear force in the joint decreased with increasing middle
joint displacement. Therefore, in the design of precast concrete beam-column joints
against shear failure under column removal scenarios, compression force in the beam
has to be considered at CAA stage.
Further experimental studies on exterior frames demonstrate that shear failure of the
side joint was prevented by enlarging the cross section of side columns. CAA and
subsequent catenary action developed in the bridging beam when adequate horizonta l
restraints were provided by the side columns. Eventually, flexural failure of the side
columns occurred due to substantial horizontal tension force acting on the columns.
To protect the side columns from flexural failure under column removal scenarios,
the magnitude of horizontal tension force in the beam has to be quantified and
considered in the flexural design of the side columns.
Analytical model for CAA of beam-column sub-assemblages
To investigate the potential enhancement of ECC to structural resistance, the
analytical model proposed by Park and Gamble (2000) and later modified by Yu and
Tan (2013a) was used to estimate the CAA capacity of sub-assemblages. In the model,
a new method was proposed to determine the strain of steel reinforcement and
concrete fibres, so that tensile strength and strain capacity of ECC could be
considered. Constitutive model for concrete proposed by Mander et al. (1988) was
employed instead of equivalent rectangular concrete stress block. Comparisons with
experimental results indicate that the model is able to predict the CAA capacity and
horizontal compression force with reasonably good accuracy.

CHAPTER 9 CONCLUSIONS AND FUTURE WORK
243
A series of parametric studies was conducted to study the effect of concrete models,
tensile strength and strain capacity of ECC, stiffness of horizontal restraint and
reinforcement ratios on the CAA of sub-assemblages. Analytical results indicate that
application of ECC in precast beam-column sub-assemblages enhances the CAA
capacity to a limited extent. Meanwhile, the maximum horizontal compression force
is reduced. A stiffer horizontal restraint provides a greater CAA capacity, but the
ductility of sub-assemblages is reduced. In accordance with the energy-balance
method, pseudo-static resistance of sub-assemblages was also calculated. By
increasing the stiffness of horizontal restraint, the pseudo-static resistance of sub-
assemblages does not increase significantly, whereas the associated vertical
displacement of middle joint is substantially reduced. Furthermore, more longitudina l
reinforcement has to be provided in the compression zone in order to effective ly
enhance the pseudo-static resistance of sub-assemblages under column removal
scenarios.
Several limitations exist in the analytical model. Due to the assumption of linear
strain profile along the beam length, strains of tensile reinforcement are substantia lly
underestimated at the beam ends. Correspondingly, fracture of steel reinforcement
cannot be successfully predicted in the model. Thus, component-based models need
to be developed for precast concrete beam-column joints under column removal
scenarios.
Component-based joint model for precast concrete beam-column joints
A component-based joint model was constructed for precast concrete beam-column
joints to investigate the catenary action capacity of beam-column sub-assemblages at
large deformation stage. Three zero-length springs were modelled at the interface of
beam-column joint to transfer tension, compression and shear forces between the
joint and the beam. In deriving the force-slip relationship of tensile spring, a new
method was proposed to determine the bond stress at the elastic and post-yield stages
and pull-out failure of short embedded reinforcement was considered. The
constitutive model for concrete was used in the compression zone of the beam instead
of rectangular concrete stress block to quantify the total force sustained by
compressive spring. Shear spring was assumed to be at linear elastic stage with

CHAPTER 9 CONCLUSIONS AND FUTURE WORK
244
infinite stiffness. The joint model was calibrated against experimental results of
precast and reinforced concrete beam-column sub-assemblages. Comparisons
between analytical and experimental results suggest that the joint model is capable of
estimating the catenary action of sub-assemblages with reasonable accuracy.
However, under column removal scenarios, development of CAA in the beam
requires predetermination of compression force in the bridging beam. Further
experimental and analytical studies are needed to establish the relationship of
compression force and boundary condition.
9.2 Future Works
By using ECC in the cast-in-situ structural topping and beam-column joints, the
deformation capacity of beam-column sub-assemblages was substantially reduced
compared to concrete specimens. Two possible reasons have been identified, namely,
greater bond stress between reinforcement and ECC in the joint and tension-stiffening
behaviour of the bridging beam at large deformation stage. It is not possible to figure
out the bond stress in the experimental tests on beam-column sub-assemblages, even
though strain gauges were mounted on the longitudinal reinforcement embedded in
the joint. Therefore, further pull-out tests on steel reinforcement embedded in ECC
joints have to be conducted to assess the bond-slip behaviour of steel bars. Uniaxia l
tension tests are also necessary to study the tension-stiffening behaviour of reinforced
ECC beams.
In the experimental programme on exterior precast concrete frames, severe shear
failure of the side beam-column joint indicates that horizontal compression force in
the beam increased the shear force in the side joint at CAA stage. At catenary action
stage, horizontal tension force resulted in flexural failure of the side column. Thus,
in the design of side columns against progressive collapse, the horizonta l
compression and tension forces developed in the bridging beam have to be considered
at the CAA and catenary action stages. However, the horizontal force varies with
boundary conditions, geometries of the beam and reinforcement ratios. Therefore, it
is necessary to estimate the magnitude of the horizontal force in various
circumstances through experimental and numerical studies.

CHAPTER 9 CONCLUSIONS AND FUTURE WORK
245
Present study only focuses on the behaviour of planar precast concrete specimens
under column removal scenarios. In precast concrete structures, lateral beams
connected to the removed column may develop CAA or catenary action as effective
alternate load paths to mitigate progressive collapse, depending on the locations of
column removal. Moreover, reinforced concrete slabs may redistribute vertical loads
by means of membrane action if sufficient horizontal restraints can be provided by
adjacent structural members. Thus, three-dimensional effect of lateral beams and
reinforced concrete slabs has to be incorporated in future study.
In addition to the quasi-static resistance, dynamic resistance of precast concrete
structures needs to be investigated experimentally to determine the dynamic increase
factor at various levels of vertical loads. In the tests, the influence of CAA on the
resistance and ductility of bridging beams has to be studied when horizontal restraints
with different stiffnesses are provided at the ends. Meanwhile, the calculated pseudo-
static resistance from the proposed analytical model and the energy balance method
can be verified by experimental results under dynamic column removal scenarios.

CHAPTER 9 CONCLUSIONS AND FUTURE WORK
246

REFERENCES
247
REFERENCES
ACI (2005). "Building Code Requirements for Structural Concrete." ACI 318-05,
American Concrete Institute, Farmington, MI.
Alsiwat, J. M., and Saatcioglu, M. (1992). "Reinforcement Anchorage Slip under
Monotonic Loading." Journal of Structural Engineering, 118(9), 2421-2438.
Asano, K., and Kanakubo, T. (2012). "Study on Size Effect in Bond Splitting
Behavior of ECC." High Performance Fiber Reinforced Cement Composites
6, 2(137-144).
ASCE (2006). "Minimum Design Loads for Buildings and Other Structures. "
ASCE/SEI 7-05, American Society of Civil Engineers, Reston, VA.
ASCE (2007). "Seismic Rehabilitation of Existing Buildings." ASCE/SEI 41-06,
American Society of Civil Engineers, Reston, VA.
Bandelt, M. J., and Billington, S. L. (2014). "Bond behaviour of steel reinforcement
in high-performance fiber-reinforced cementitious composite flexura l
members." Materials and Structures, 1-6.
Bao, Y., Kunnath, S. K., El-Tawil, S., and Lew, H. S. (2008). "Macromodel-based
simulation of progressive collapse: RC frame structures." Journal of
Structural Engineering, 134(7), 1079-1091.
Bao, Y., Lew, H. S., and Kunnath, S. K. (2014). "Modeling of Reinforced Concrete
Assemblies under Column-Removal Scenario." Journal of Structural
Engineering, 140(1), 04013026.
Bigaj, A. J. (1995). "Bond Behaviour of Deformed Bars in NSC and HSC-
Experimental Study." Report No. 25.5-95-11, Steven Laboratory, Faculty of
Civil Engineering, Delft University of Technology.
BSI (2004). "Eurocode 2: Design of concrete structures—Part 1-1: General rules and
rules for buildings." BS EN 1992-1-1:2004, British Standards Institution,
London, 225.

REFERENCES
248
BSI (2005). "Eurocode 3: Design of steel structures—Part 1-8: Design of joints." BS
EN 1993-1-8:2005, British Standards Institution, London.
BSI (2006). "Eurocode 1—Actions on structures—Part 1-7: General actions—
Accidental actions." BS EN 1991-1-7:2006, British Standards Institution,
London.
CAE (1999). "Guideline for the Use of Precast Concrete in Buildings." Report of a
Study Group of the New Zealand Concrete Society and the New Zealand
Society of Earthquake Engineering, Centre for Advanced Engineering,
University of Canterbury, Christchurch, New Zealand.
Choi, H., and Kim, J. (2011). "Progressive Collapse-Resisting Capacity of RC Beam-
Column Sub-assemblage." Magazine of Concrete Research, 63(4), 297-310.
Corley, W. G. (2002). "Application of seismic design in mitigating progressive
collapse." Proceedings of Workshop on Prevention of Progressive Collapse,
National Institute of Building Sciences, Washington, DC.
Corley, W. G. (2004). "Lesson learned on improving resistance of buildings to
terrorist attacks." Journal of Performance of Constructed Facilities, 18(2),
68-78.
DOD (2013). "Design of Buildings to Resist Progressive Collapse." Unified Facilities
Criteria(UFC) 4-023-03, Department of Defence, Washington, DC.
Eligehausen, R., Popov, E. P., and Betero, V. V. (1983). "Local Bond Stress-Slip
Relationships of Deformed Bars under Generalized Excitations." Report No.
UCB/EERC-83/23, College of Engineering, University of California,
Berkeley.
Ellingwood, B., and Leyendecker, E. V. (1978). "Approach for design against
progressive collapse." Journal of the Structural Division, ASCE, 104(3), 413-
423.
Engström, B., Magnusson, J., and Huang, Z. (1998). "Pull-Out Bond Behavior of
Ribbed Bars in Normal and High-Strength Concrete with Various
Confinements." In: Leon, R. Editor. Bond and Development of reinforcement:
A Tribute to Dr. Peter Gergely, ACI Special Publication, 180(10), 215-242.

REFERENCES
249
FarhangVesali, N., Valipour, H., Samali, B., and Foster, S. (2013). "Development of
arching action in longitudinally-restrained reinforced concrete beams."
Construction and Building Materials, 47, 7-19.
FIB (2000). "Bond of reinforcement in concrete." Bulletin 10, Fédération
internationale du béton, Laussane, Switzerland.
FIB (2002). "Precast Concrete in Mixed Construction." Bulletin 19, Fédération
internationale du béton, Laussane, Switzerland.
FIB (2003). "Seismic design of precast concrete building structures." Bulletin 27,
Fédération internationale du béton, Laussane, Switzerland.
FIB (2013). "fib Model Code for Concrete Structures 2010." Fédération
internationale du béton, Laussane, Switzerland.
Filippou, F. C., Popov, E. P., and Bertero, V. V. (1983). "Effect of Bond Deteriorat ion
on Hysteretic Behavior of Reinforced Concrete Joints." Report No.
UCB/EERC-83/19, College of Engineering, University of California,
Berkeley.
Fischer, G., and Li, V. C. (2002a). "Effect of Matrix Ductility on Deformation
Capacity Behavior of Steel-Reinforced ECC Flexural Members under
Reversed Cyclic Loading Conditions." ACI Structural Journal, 99(6), 781-
790.
Fischer, G., and Li, V. C. (2002b). "Influence of Matrix Ductility on Tension-
Stiffening Behavior of Steel Reinforced Engineered Cementitious
Composites (ECC)." ACI Structural Journal, 99(1), 104-111.
Fischer, G., and Li, V. C. (2003). "Deformation Behavior of Fiber-Reinforced
Polymer Reinforced Engineered Cementitious Composites (ECC) Flexura l
Members under Reversed Cyclic Loading Conditions." ACI Structural
Journal, 100(1), 25-35.
Foley, C. M., Martin, K., and Schneeman, C. (2007). "Robustness in Structural Steel
Framing Systems." Report MU-CEEN-SE-07-01, Department of Civil and
Environmental Engineering, Marquette University.

REFERENCES
250
Forum8 (2008). "Engineers' Studio http://www.forum8.co.jp/english/index.html."
Fukuyama, H., Sato, Y., Li, V. C., Matsuzaki, Y., and Mihashi, H. (2000). "Ductile
Engineered Cementitious Composite Elements for Seismic Structural
Application." Proceedings of the 12th World Conference on Earthquake
Engineering, New Zealand.
GSA (2003). "Progressive Collapse Analysis and Design Guidelines for New Federal
Office Buildings and Major Modernization Projects." General Services
Administration, Washington, DC.
Guice, L. K., and Rhomberg, E. J. (1988). "Membrane Action in Partially Restrained
Slabs." ACI Structural Journal, 85(4), 365-373.
Guice, L. K., Slawson, T. R., and Rhomberg, E. J. (1989). "Membrane Analysis of
Flat Plate Slabs." ACI Structural Journal, 86(1), 83-92.
Guisse, S., and Jaspart, J. P. (1995). "Influence of structural frame behaviour on joint
design." Proceedings of the Workshop on Connections in Steel Structures II,
Trento, Italy.
Gurley, C. (2008). "Progressive collapse and earthquake resistance." Practice
Periodical on Structural Design and Construction, 13(1), 19-23.
Hansen, E., Tennant, D., Smilowitz, R., and Weeks, J. (2006). "Numerica l
investigation of the vulnerability of flat slab reinforced concrete structures to
airblast." Proceedings of 77th Shock and Vibration Symposium, Shock and
Vibration Analysis Center.
Hayes, J. R., Woodson, S. C., Pekelnicky, R. G., Poland, C. D., Corley, W. G., and
Sozen, M. (2005a). "Can strengthening for earthquake improve blast and
progressive collapse resistance?" Journal of Structural Engineering, 131(8),
1157-1177.
Hayes, J. R., Woodson, S. C., Pekelnicky, R. G., Poland, C. D., Corley, W. G., sozen,
M., Mahoney, M., and Hanson, R. D. (2005b). "Earthquake resistance and
blast resistance: a structural comparison." 13th World Conference on
Earthquake Engineering, Vancouver, BC, Canada.
REFERENCES
251
Huang, Z., Engström, B., and Magnusson, J. (1996). "Experimental and Analytica l
Studies of the Bond Behaviour of Deformed Bars in High Strength Concrete."
Fourth International Symposium on the Utilization of High Strength/High
Performance Concrete, Paris, 1115-1124.
Izzudin, B. A., and Elghazouli, A. Y. (2004a). "Failure of lightly reinforced concrete
members under fire I: Analytical modeling." Journal of Structural
Engineering, 130(1), 3-17.
Izzudin, B. A., and Elghazouli, A. Y. (2004b). "Failure of lightly reinforced concrete
members under fire II: Parametric sduties and design considerations." Journal
of Structural Engineering, 130(1), 18-31.
Izzudin, B. A., Vlassis, A. G., Elghazouli, A. Y., and Nethercot, D. A. (2008).
"Progressive collapse of multi-storey buildings due to sudden column loss -
Part I: Simplified assessment framework." Engineering Structures, 30, 1308-
1318.
Jaspart, J. P. (2000). "General report: session on connections." Journal of
Constructional Steel Research, 55, 69-89.
JSCE (2008). "Recommendations for Design and Construction of High Performance
Fiber Reinforced Cement Composites with Multiple Fine Cracks
(HPFRCC)." Concrete Engineering Series 82, Japan Society of Civil
Engineers.
Keenan, W. A. (1969). "Strength and Behavior of Restrained Reinforced Concrete
Slabs Under Static and Dynamic Loading." Technical Report R-621, Naval
Civil Engineering Laboratory, Port Hueneme, CA.
Khandelwal, K., and El-Tawil, S. (2007). "Collapse behavior of steel special moment
resisting frame connections." Journal of Structural Engineering, 133(5), 646-
655.
Kunakubu, T., and Hosoya, H. (2015). "Bond-Splitting Strength of Reinforced Strain-
Hardening Cement Composite Elements with Small Bar Spacing." ACI
Structural Journal, 112(2), 189-198.

REFERENCES
252
Lehman, D. E., and Moehle, J. P. (2000). "Seismic Performance of Well-Confined
Concrete Bridge Columns." PEER Report 1998/01, Pacific Earthquake
Engineering Research Center, University of California, Berkeley.
Lew, H. S., Bao, Y., Pujol, S., and Sozen, M. A. (2014). "Experimental Study of
Reinforced Concrete Assemblies under Column Removal Scenarios." ACI
Structural Journal, 111(4), 881-892.
Lew, H. S., Bao, Y., Sadek, F., Main, J. A., Pujol, S., and Sozen, M. A. (2011). "An
Experimental and Computational Study of Reinforced Concrete Assemblie s
under a Column Removal Scenario." NIST Technical Note 1720, National
Institute of Standards and Technology, Gaithersburg, MD.
Li, V. C. (2003). "On Engineered Cementitious Composites (ECC)-A Review of the
Material and Its Applications " Journal of Advanced Concrete Technology,
1(3), 215-230.
Li, V. C., Wang, S., and Wu, C. (2001). "Tensile Strain-Hardening Behavior of
Polyvinyl Alcohal Engineered Cementitious Composite (PVA-ECC)." ACI
Material Journal, 98(6), 483-492.
Li, V. C., Wu, C., Wang, S., Ogawa, A., and Saito, T. (2002). "Interface Tailoring for
Strain-Hardening Polyvinyl Alcohol-Engineered Cementitious Composite
(PVA-ECC)." ACI Material Journal, 99(5), 463-472.
Lowes, L. N., and Altoontash, A. (2003). "Modeling reinforced-concrete beam-
column joints subjected to cyclic loading." Journal of Structural Engineering,
129(12), 1686-1697.
Lowes, L. N., Mitra, N., and Altoontash, A. (2004). "A Beam-Column Joint Model
for Simulating the Earthquake Response of Reinforced Concrete Frames."
PEER Report 2003/10, Pacific Earthquake Engineering Research Center,
University of California, Berkeley.
Maalej, M., and Li, V. C. (1994). "Flexural/Tensile-Strength Ratio in Enginee red
Cementitious Composites." Journal of Materials in Civil Engineering, 6(4),
513-528.

REFERENCES
253
Maekawa, K., Pimanmas, A., and Okamura, H. (2003). Nonlinear Mechanics of
Reinforced Concrete, Spon Press Taylor & Francis Group.
Main, J. A., Bao, Y., Lew, H. S., and Sadek, F. (2014). "Robustness of Precast
Concrete Frames: Experimental and Computational Studies." Structures
Congress 2014, 2210-2220.
Mander, J. B., Priestley, M. J. N., and Park, R. (1988). "Theoretical Stress-Strain
Model for Confined Concrete." Journal of Structural Engineering, 114(8),
1804-1826.
Mitra, N., and Lowes, L. N. (2007). "Evaluation, calibration, and verification of a
reinforced concrete beam-column joint model." Journal of Structural
Engineering, 133(105-120).
Monti, G., Spacone, E., and Filippou, F. (1993). "Model for Anchored Reinforc ing
Bars under Seismic Excitations." Report No. UCB/EERC-93/08, Earthquake
Engineering Research Center, University of California, Berkeley.
Moreno, D. M., Trono, W., Jen, G., Ostertag, C., and Billington, S. (2014). "Tension
Stiffening in Reinforced High Performance Fiber Reinforced Cement-Based
Composites." Cement & Concrete Composites, 50, 36-46.
Moreno, D. M., Trono, W., Jen, G., Ostertag, C., and Billington, S. L. (2012).
"Tension Stiffening in Reinforced High Performance Fiber Reinforced
Cement-Based Composites under Direct Tension." High Performance Fiber
Reinforced Cement Composites 6, 2, 255-262.
NIST (2007). "Best Practices for Reducing the Potential for Progressive Collapse in
Buildings." NISTIR 7396, National Institute of Standards and Technology,
Gaithersburg, MD.
ODPM (2004). "The Building Regulation 2000: Structure." Approved Document A3
Disproportionate Collapse, Office of Deputy Prime Minister, London, UK.
Orton, S., Jirsa, J. O., and Bayrak, O. (2009). "Carbon Fiber-Reinforced Polymer for
Continuity in Existing Reinforced Concrete Buildings Vulnerable to
Collapse." ACI Structural Journal, 106(5), 608-616.

REFERENCES
254
Orton, S. L. (2007). "Development of a CFRP System to Provide Continuity in
Existing Reinforced Concrete Buildings Vulnerable to Progressive Collapse."
PhD dissertation, University of Texas at Austin, Austin, TX.
Park, R. (1964). "The ultimate strength and long-term behaviour of uniformly loaded,
two-way concrete slabs with partial lateral restraint at all edges." Magazine of
Concrete Research, 16(48), 139-152.
Park, R., and Bull, D. K. (1986). "Seismic Resistance of Frames Incorporating Precast
Prestressed Concrete Beam Shells." PCI Journal, 31(4), 54-93.
Park, R., and Gamble, W. L. (2000). Reinforced Concrete Slabs, John Wiley & Sons,
Inc.
Patnaik, A. K. (2000). "Behavior of Composite Concrete Beams with Smooth
Interface." Journal of Structural Engineering, 127(4), 359-366.
Paulay, T., and Priestley, M. J. N. (1992). Seismic Design of Reinforced Concrete
and Masonry Buildings, John Wiley & Sons, Inc.
Pochanart, S., and Harmon, T. (1989). "Bond-Slip Model for Generalized Excitations
Including Fatigue." ACI Material Journal, 86(5), 465-474.
Qian, S., and Li, V. C. (2007). "Simplified Inverse Method for Determining the
Tensile Strain Capacity of Strain Hardening Cementitious Composites."
Journal of Advanced Concrete Technology, 5(2), 235-246.
Qian, S., and Li, V. C. (2008). "Simplified Inverse Method for Determining the
Tensile Properties of Strain Hardening Cementitious Composites (SHCC)."
Journal of Advanced Concrete Technology, 6(2), 353-363.
Sadek, F., Main, J. A., Lew, H. S., and Bao, Y. (2011). "Testing and analysis of steel
and concrete beam-column assemblies under a column removal scenario."
Journal of Structural Engineering, 137(9), 881-892.
Sasani, M., Bazan, M., and Sagiroglu, S. (2007). "Experimental and analytica l
progressive collapse evaluation of actual reinforced concrete structure." ACI
Structural Journal, 104(6), 731-739.

REFERENCES
255
Sasani, M., and Sagiroglu, S. (2008). "Progressive Collapse Resistance of Hotel San
Diego." Journal of Structural Engineering, 134(3), 478-488.
Sasani, M., and Sagiroglu, S. (2010). "Gravity Load Distribution and Progressive
Collapse Resistance of 20-Story Reinforced Concrete Structure following
Loss of Interior Column." ACI Structural Journal, 107(6), 636-644.
Scott, B. D., Park, R., and Priestley, M. J. N. (1982). "Stress-Strain Behavior of
Concrete Confined by Overlapping Hoops at Low and High Strain Rates."
ACI Journal, 79(1), 13-27.
Sezen, H., and Setzler, E. J. (2008). "Reinforcement Slip in Reinforced Concrete
Columns." ACI Structural Journal, 105(3), 280-189.
Sharma, A., Eligehausen, R., and Reddy, G. R. (2011). "A new model to simula te
joint shear behavior of poorly detailed beam-column connections in RC
structures under seismic loads Part I: Exterior joints." Engineering Structures,
33, 1034-1051.
Shima, H., Chou, L. L., and Okamura, H. (1987). "Micro and Macro Model for Bond
in Reinforced Concrete." Journal of the Faculty of Engineering, the
University of Tokyo (B), 39(2), 133-194.
Shiohara, H., and Watanabe, F. (2000). "The Japan PRESSS Precast Concrete
Connection Design." 12th World Conference on Earthquake Engineering,
Auckland, New Zealand.
Soltani, M., and Maekawa, K. (2008). "Path-Dependent Mechanical Model for
Deformed Reinforcing Bars at RC Interface under Coupled Cyclic Shear and
Pullout Tension." Engineering Structures, 30(4), 1079-1091.
Stevens, D., Crowder, B., Hall, B., and Marchand, K. (2008). "Unified progressive
collapse design requirements for DOD and GSA." Proceedings of the 2008
Structures Congress - Structures Congress 2008: Crossing the Borders,
Vancouver, BC, Canada.
Stevens, D., Crowder, B., Sunshine, D., Marchand, K., Smilowitz, R., Williamson,
E., and Waggoner, M. (2011). "DoD research and criteria for the design of

REFERENCES
256
buildings to resist progressive collapse." Journal of Structural Engineering,
137(9), 870-880.
Stevens, D., Marchand, K., and Mckay, A. (2009). "Revision of the tie force and
alternate path approaches in the DoD progressive collapse design
requirements." Proceedings of the 2009 Structures Congress, Austin, TX.
Su, Y., Tian, Y., and Song, X. (2009). "Progressive collapse resistance of axially-
restrained frame beams." ACI Structural Journal, 106(5), 600-607.
Ueda, T., Lin, I., and Hawkins, N. M. (1986). "Beam Bar Anchorage in Exterior
Column-Beam Connections." ACI Journal, 83(3), 412-422.
Van Acker, A. (2013). "Accidental Actions and Progressive Collapse." International
Seminar on Precast Concrete Structures, Department of Civil Engineer ing
Universidade Nova de Lisboa.
Vecchio, F. J., and Collins, M. P. (1986). "The Modified Compression-Field Theory
for Reinforced Concrete Elements Subjected to Shear." ACI Journal, 83(2),
219-231.
Viwathanatepa, S., Popov, E. P., and Bertero, V. V. (1979). "Effects of Generalized
Loadings on Bond of Reinforcing Bars Embedded in Confined Concrete
Blocks." Report No. UCB/EERC-79/22, College of Engineering, Univers ity
of California, Berkeley.
Welch, R. W., Hall, W. J., and Gamble, W. L. (1999). "Compressive Membrane
Capacity Estimates in Laterally Edge Restrained Reinforced Concrete One-
way Slabs." UILU-ENG-99-2009, Department of Civil and Environmenta l
Engineering, University of Illinois at Urbana-Champaign.
Yang, E., and Li, V. C. (2010). "Strain-Hardening Fibre Cement Optimization and
Component Tailoring by Means of a Micromechanical Model." Construction
and Building Materials 24(2), 130-139.
Yang, E., and Li, V. C. (2012). "Tailoring Engineered Cementitious Composites for
Impact Resistance." Cement and Concrete Research, 42(8), 1066-1071.

REFERENCES
257
Yi, W. J., He, Q. F., Xiao, Y., and Kunnath, S. K. (2008). "Experimental study on
progressive collapse-resistant behavior of reinforced concrete frame
structures." ACI Structural Journal, 105(4), 433-439.
Youssef, M., and Ghobarah, A. (1999). "Strength Deterioration due to Bond Slip and
Concrete Crushing in Modeling of Reinforced Concrete Members." ACI
Structural Journal, 96(6), 956-966.
Youssef, M., and Ghobarah, A. (2001). "Modeling of RC Beam-Column Joints and
Structural Walls." Journal of Earthquake Engineering, 5(1), 93-111.
Yu, J. (2012). "Structural Behaviour of Reinforced Concrete Frames Subjected to
Progressive Collapse." PhD thesis, Nanyang Technological University,
Singapore.
Yu, J., and Tan, K. H. (2010a). "Experimental study on catenary action of RC beam-
column sub-assemblages." Proceedings of the 3rd fib International Congress
2010, Washington, DC.
Yu, J., and Tan, K. H. (2010b). "Macromodel-based simulation of catenary action of
RC beam-column sub-assemblages." Proceedings of the 3rd fib international
congress 2010, Washington, DC.
Yu, J., and Tan, K. H. (2013a). "Analytical Model for the Capacity of Compressive
Arch Action of Reinforced Concrete Beam-Column Sub-assemblages. "
Magazine of Concrete Research, 66(3), 109-126.
Yu, J., and Tan, K. H. (2013b). "Experimental and Numerical Investigation on
Progressive Collapse Resistance of Reinforced Concrete Beam Column Sub-
assemblages." Engineering Structures, 55, 90-106.
Yu, J., and Tan, K. H. (2013c). "Structural Behavior of RC Beam-Column
Subassemblages under a Middle Column Removal Scenario." Journal of
Structural Engineering, 139(2), 233-250.
Yu, J., and Tan, K. H. (2014). "Special Detailing Techniques to Improve Structural
Resistance against Progressive Collapse." Journal of Structural Engineering,
140, 04013077.

REFERENCES
258
Yuan, F., Pan, J., and Leung, C. K. Y. (2013). "Flexural Behaviors of ECC and
Concrete/ECC Composite Beams Reinforced with Basalt Fiber-Reinforced
Polymer." Journal of Composites for Construction, 17(5), 591-602.
Zoetemeijer, P. (1983). "Summary of the Research on Bolted Beam-to-Column
Connections (period 1978-1983)." No. 6-85-M, Steven Laboratory, Delft.

PUBLICATIONS
259
PUBLICATIONS
Journal Papers
Kang, S.-B., and Tan, K. H. (2015). "Behaviour of Precast Concrete Beam-Column
Sub-assemblages Subject to Column Removal." Engineering Structures, 93,
85-96.
Kang, S.-B., Tan, K. H., and Yang, E.-H. (2015). "Progressive collapse resistance of
precast beam-column sub-assemblages with engineered cementit ious
composites." Engineering Structures, 98, 186-200.
Kang, S.-B., and Tan, K. H. (2015). "Analytical model for compressive arch action
in horizontally-restrained beam-column sub-assemblages." ACI Structural
Journal (Accepted).
Kang, S.-B., and Tan, K. H. (2015). "Bond-slip behaviour of deformed reinforc ing
bars embedded in well-confined concrete." Magazine of Concrete Research
(In press).
Kang, S.-B., and Tan, K. H. (2015). "Experimental Investigation on Progressive
Collapse Resistance of Precast Concrete Frames." Submitted to Journal of
Structural Engineering.
Kang, S.-B., and Tan, K. H. (2015). "Robustness Assessment of Exterior Precast
Concrete Frames under Column Removal Scenarios." Submitted to Journal
of Structural Engineering.
Conference Papers
Kang, S.-B., and Tan, K. H. (2014). "Experimental Study on Exterior Precast
Concrete Frames under Column Removal Scenarios." Proceedings of the 6th
International Conference on Protection of Structures against Hazards,
Tianjin, China.
Kang, S.-B., Tan, K. H., Yang, E.-H., and Ng, K. W. (2015). "Structural Behaviour
of Precast Beam-Column Sub-Assemblages with Cast-In-Situ Engineered

PUBLICATIONS
260
Cementitious Composites under Column Removal Scenarios." Proceedings
of the Fifth International Conference on Design and Analysis of Protective
Structures, Singapore.
Kang, S.-B., and Tan, K. H. (2015). "Behaviour of Exterior Precast Concrete Frames
Subject to Column Removal." Proceedings of fib symposium 2015,
Copenhagen, Denmark.
Kang, S.-B., Tan, K. H., and Yang, E.-H. (2015). "Application of Enginee red
Cementitious Composites to Precast Beam-Column Sub-assemblage under
Column Removal Scenarios." Proceedings of fib symposium 2015,
Copenhagen, Denmark.

APPENDIX A QUANTIFICATION OF BOUNDARY CONDITIONS
261
APPENDIX A QUANTIFICATION OF BOUNDARY
CONDITIONS
In the experimental tests, horizontal reaction forces on precast concrete sub-
assemblages and frames were calculated by summing up the forces in the top and
bottom horizontal load cells connected to each end column. The forces represent the
average value of horizontal forces acting on the two end column stubs. To quantify
the boundary conditions of precast concrete specimens, reaction forces in each
horizontal load cell are presented in this chapter. Besides, corresponding horizonta l
displacements were also monitored through linear variable differential transducers
(LVDTs), as shown in Fig. 3.5 and Fig. 5.4. Thus, stiffness of horizontal restraints
and connection gaps can be quantified by correlating the reaction force to the
displacement. Meanwhile, connection gaps between the end column stub and the
horizontal restraint can also be quantified from the load-displacement curve.
A.1 Precast Concrete Beam-Column Sub-Assemblages
A.1.1 Horizontal reaction forces
On each precast concrete beam-column sub-assemblage, four horizontal forces were
measured through load cells embedded in horizontal restraints, as shown in Fig. 3.3.
“Top_AF” and “Btm_AF” represent respective top and bottom load cells near the A-
frame, and “Top_RW” and “Btm_RW” are the load cells near the reaction wall. Fig.
A.1 shows the reaction forces in the horizontal load cells. It is apparent that horizonta l
compression forces were mainly transferred to the bottom restraints near the A-frame
and reaction wall at the compressive arch action (CAA) stage, whereas forces in the
top restraints were very limited. However, at the catenary action stage, top load cells
contributed a significant portion to total horizontal tension force. Eventually,
sequential fracture of beam top reinforcement near the end column stubs led to sudden
drops of tension forces in the top restraints, as shown in Fig. A.1(a). Thus, the bottom
restraints played an important role in developing CAA in the bridging beams, but the
top restraints was more critical at the catenary action stage. Besides, limited

APPENDIX A QUANTIFICATION OF BOUNDARY CONDITIONS
262
differences exist between horizontal reaction forces at the two end column stubs prior
to fracture of beam top reinforcement.
0 100 200 300 400 500-250
-200
-150
-100
-50
0
50
100
Horiz
ontal
reac
tion
forc
e (kN
)
Middle joint displacement (mm)
Top_AF Btm_AF Top_RW Btm_RW
(a) MJ-B-0.52/0.35S
0 100 200 300 400 500 600 700-200
-150
-100
-50
0
50
100
150
Horiz
ontal
reac
tion
forc
e (kN
)
Middle joint displacement (mm)
Top_AF Btm_AF Top_RW Btm_RW
(b) MJ-l-0.52/0.35S
0 100 200 300 400 500 600 700 800-300
-200
-100
0
100
200
Horiz
ontal
reac
tion
forc
e (kN
)
Middle joint displacement (mm)
Top_AF Btm_AF Top_RW Btm_RW
(c) MJ-B-0.88/0.59R
0 100 200 300 400 500 600 700-300
-200
-100
0
100
200
Horiz
ontal
reac
tion
forc
e (kN
)
Middle joint displacement (mm)
Top_AF Btm_AF Top_RW Btm_RW
(d) MJ-L-0.88/0.59R
0 100 200 300 400 500 600
-300
-200
-100
0
100
200
Horiz
ontal
reac
tion
forc
e (kN
)
Middle joint displacement (mm)
Top_AF Btm_AF Top_RW Btm_RW
(e) MJ-B-1.19/0.59R
0 100 200 300 400 500 600
-300
-200
-100
0
100
200
Horiz
ontal
reac
tion
forc
e (kN
)
Middle joint displacement (mm)
Top_AF Btm_AF Top_RW Btm_RW
(f) MJ-L-1.19/0.59R
Fig. A.1 Horizontal reaction forces of precast concrete beam-column sub-assemblages

APPENDIX A QUANTIFICATION OF BOUNDARY CONDITIONS
263
A.1.2 Stiffness of horizontal restraints
To determine the stiffness of horizontal restraints connected to the end column stubs,
relationships of horizontal reaction force and corresponding displacement are shown
in Fig. A.2 to Fig. A.7. It is found that horizontal reaction forces were nearly zero
when horizontal displacements were small (see Figs. A.2(a and b)), as a result of
connection gaps between the end column stubs and horizontal restraints. Simila r
results are also obtained for other sub-assemblages, as shown in Fig. A.3 to Fig. A.7.
Thus, connection gaps have to be quantified for beam-column sub-assemblages.
-4 -2 0 2 4 6 8-40
-20
0
20
40
60
80
Horiz
ontal
reac
tion
forc
e (kN
)
Horizontal displacement (mm)
Top_AF Top_RW
(a) Top restraints
-8 -6 -4 -2 0 2-250
-200
-150
-100
-50
0
50 Btm_AF Btm_RW
Hor
izon
tal r
eact
ion
forc
e (kN
)
Horizontal displacement (mm) (b) Bottom restraints
Fig. A.2 Horizontal force-displacement relationships of MJ-B-0.52/0.35S
-2 0 2 4 6-30
0
30
60
90
120
Horiz
onta
l rea
ctio
n fo
rce (
kN)
Horizontal displacement (mm)
Top_AF Top_RW
(a) Top restraints
-6 -4 -2 0 2 4-200
-150
-100
-50
0
50
Hor
izon
tal r
eact
ion
forc
e (kN
)
Horizontal displacement (mm)
Btm_AF Btm_RW
(b) Bottom restraints
Fig. A.3 Horizontal force-displacement relationships of MJ-L-0.52/0.35S
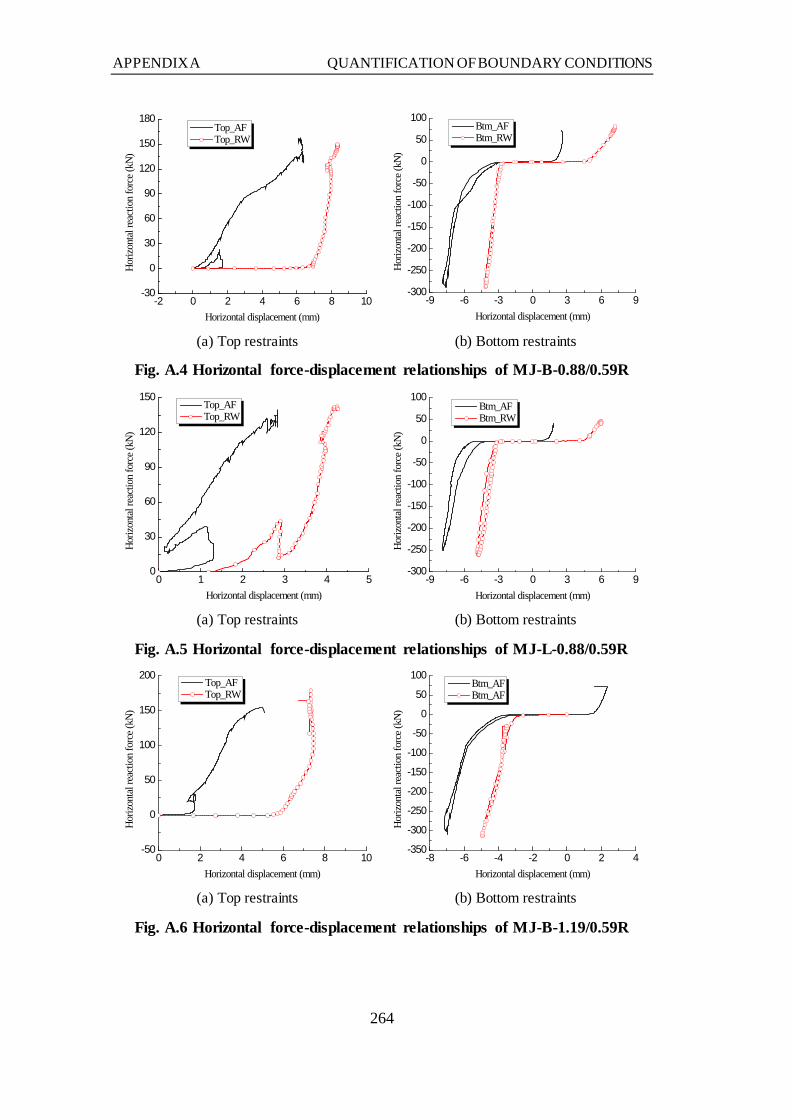
APPENDIX A QUANTIFICATION OF BOUNDARY CONDITIONS
264
-2 0 2 4 6 8 10-30
0
30
60
90
120
150
180Ho
rizon
tal r
eact
ion
forc
e (kN
)
Horizontal displacement (mm)
Top_AF Top_RW
(a) Top restraints
-9 -6 -3 0 3 6 9-300
-250
-200
-150
-100
-50
0
50
100
Hor
izon
tal r
eact
ion
forc
e (kN
)
Horizontal displacement (mm)
Btm_AF Btm_RW
(b) Bottom restraints
Fig. A.4 Horizontal force-displacement relationships of MJ-B-0.88/0.59R
0 1 2 3 4 50
30
60
90
120
150
Horiz
ontal
reac
tion
forc
e (kN
)
Horizontal displacement (mm)
Top_AF Top_RW
(a) Top restraints
-9 -6 -3 0 3 6 9-300
-250
-200
-150
-100
-50
0
50
100H
oriz
onta
l rea
ctio
n fo
rce (
kN)
Horizontal displacement (mm)
Btm_AF Btm_RW
(b) Bottom restraints
Fig. A.5 Horizontal force-displacement relationships of MJ-L-0.88/0.59R
0 2 4 6 8 10-50
0
50
100
150
200
Horiz
ontal
reac
tion
forc
e (kN
)
Horizontal displacement (mm)
Top_AF Top_RW
(a) Top restraints
-8 -6 -4 -2 0 2 4-350
-300
-250
-200
-150
-100
-50
0
50
100
Hor
izon
tal r
eact
ion
forc
e (kN
)
Horizontal displacement (mm)
Btm_AF Btm_AF
(b) Bottom restraints
Fig. A.6 Horizontal force-displacement relationships of MJ-B-1.19/0.59R

APPENDIX A QUANTIFICATION OF BOUNDARY CONDITIONS
265
0 1 2 3 4 5 6-40
0
40
80
120
160
200
Horiz
ontal
reac
tion
forc
e (kN
)
Horizontal displacement (mm)
Top_AF Top_RW
(a) Top restraints
-9 -6 -3 0 3 6 9-400
-300
-200
-100
0
100
Hor
izon
tal r
eact
ion
forc
e (kN
)
Horizontal displacement (mm)
Btm_AF Btm_RW
(b) Bottom restraints
Fig. A.7 Horizontal force-displacement relationships of MJ-L-1.19/0.59R
Based on the horizontal force-displacement curves, stiffness of horizontal restraints
and connection gaps between the end column stubs and horizontal restraints can be
calculated through linear regression. Table A.1 summarises the boundary conditions
of precast concrete beam-column sub-assemblages. Only tension stiffnesses and
associated connection gaps can be determined for top restraints Top_AF and
Top_RW, as the restraints were mainly in tension under column removal scenarios.
However, both tension and compression stiffnesses of bottom restraints (i.e. Btm_AF
and Btm_RW) are quantified for most of the sub-assemblages. It is notable that the
connections gaps are the maximum values in the top and bottom restraints and may
not be attained simultaneously during testing.
Table A.1 Horizontal stiffness of precast concrete beam-column sub-assemblages
Specimen Horizontal restraint
Tension stiffness (N/mm)
Compression stiffness (N/mm)
Tension gap (mm)
Compression gap (mm)
MJ-B-0.52/0.35S
Top_AF 10485 -- 0.8 --
Btm_AF -- 124907 -- -3.1
Top_RW 36101 -- 4.5 --
Btm_RW -- 107122 -- -1.9
MJ-L-0.52/0.35S
Top_AF 20420 -- 2.8 --
Btm_AF 34473 110037 1.9 -2.2
Top_RW 54160 -- 2.5 --
Btm_RW 34958 122812 1.6 -3.1
Top_AF 23685 -- 1.7 --

APPENDIX A QUANTIFICATION OF BOUNDARY CONDITIONS
266
MJ-B-0.88/0.59R
Btm_AF 100401 165251 2.1 -5.9
Top_RW 100198 -- 7.0 --
Btm_RW 34182 216810 5.0 -2.9
MJ-L-0.88/0.59R
Top_AF 42458 -- 1.3 --
Btm_AF 73505 118501 1.3 -5.7
Top_RW 120697 -- 1.9 --
Btm_RW 30676 156666 4.5 -3.1
MJ-B-1.19/0.59R
Top_AF 47375 -- 1.7 --
Btm_AF 85565 194781 1.6 -5.4
Top_RW 47821 -- 5.4 --
Btm_RW -- 167576 -- -2.9
MJ-L-1.19/0.59R
Top_AF 28227 -- 0.9 --
Btm_AF 90280 174168 4.4 -4.1
Top_RW 137660 -- 1.0 --
Btm_RW 21887 170410 4.2 -1.9
A.2 Precast Beam-Column Sub-Assemblages with ECC
A.2.1 Horizontal reaction forces
Similar to precast concrete beam-column sub-assemblages, reaction forces in each
horizontal load cell was measured for sub-assemblages with cast-in-situ ECC topping
and beam-column joint, as shown in Fig. A.8. Special attention has to be paid on sub-
assemblage EMJ-L-0.88/0.88, in which compression forces in the bottom restraints
(i.e. Btm_AF and Btm_RW) developed much later than tension force in the top
restraints, as shown in Fig. A.8(f). Besides, the maximum compression forces in the
bottom load cells were substantially smaller than other sub-assemblages. In the top
restraints, tension forces were considerably greater at the CAA stage compared to
other sub-assemblages. It was due to larger connection gaps between the end column
stubs and bottom horizontal restraints.

APPENDIX A QUANTIFICATION OF BOUNDARY CONDITIONS
267
0 100 200 300 400 500-400
-300
-200
-100
0
100
200
Horiz
ontal
reac
tion
forc
e (kN
)
Middle joint displacement (mm)
Top_AF Btm_AF Top_RW Btm_RW
(a) CMJ-B-1.19/0.59
0 100 200 300 400 500-400
-300
-200
-100
0
100
200
Horiz
ontal
reac
tion
forc
e (kN
)
Middle joint displacement (mm)
Top_AF Btm_AF Top_RW Btm_RW
(b) EMJ-B-1.19/0.59
0 100 200 300 400 500-400
-300
-200
-100
0
100
200
Horiz
ontal
reac
tion
forc
e (kN
)
Middle joint displacement (mm)
Top_AF Btm_AF Top_RW Btm_RW
(c) EMJ-B-0.88/0.59
0 100 200 300 400 500-400
-300
-200
-100
0
100
200
Horiz
ontal
reac
tion
forc
e (kN
)
Middle joint displacement (mm)
Top_AF Btm_AF Top_RW Btm_RW
(d) EMJ-L-1.19/0.59
0 100 200 300 400 500-400
-300
-200
-100
0
100
200
Horiz
ontal
reac
tion
forc
e (kN
)
Middle joint displacement (mm)
Top_AF Btm_AF Top_RW Btm_RW
(e) EMJ-L-0.88/0.59
0 100 200 300 400 500-200
-150
-100
-50
0
50
100
150
200
Horiz
ontal
reac
tion
forc
e (kN
)
Middle joint displacement (mm)
Top_AF Btm_AF Top_RW Btm_RW
(f) EMJ-L-0.88/0.88
Fig. A.8 Horizontal reaction forces of precast beam-column sub-assemblages with ECC
A.2.2 Stiffness of horizontal restraints
Fig. A.9 to Fig. A.14 shows the horizontal force-displacement curves of ECC sub-
assemblages. Similar horizontal reaction force-displacement curves are obtained for

APPENDIX A QUANTIFICATION OF BOUNDARY CONDITIONS
268
ECC sub-assemblages. However, compared to other sub-assemblages, EMJ-L-
0.88/0.88 developed substantially lower horizontal compression force at the CAA
stage, as a result of larger connection gaps between the end column stubs and bottom
restraints, as shown in Fig. A.14. Furthermore, stiffness of horizontal restraints and
connection gaps are also determined. Table A.2 summarises the boundary conditions
of beam-column sub-assemblages with cast-in-situ ECC topping and beam-column
joint. As mentioned before, connection gaps in the top and bottom restraints might
not be attained at the same time.
0.0 1.5 3.0 4.5 6.0 7.50
50
100
150
200
250
Horiz
onta
l rea
ctio
n fo
rce (
kN)
Horizontal displacement (mm)
Top_AF Top_RW
(a) Top restraints
-6 -4 -2 0 2 4 6
-300
-200
-100
0
100
Hor
izon
tal r
eact
ion
forc
e (kN
)
Horizontal displacement (mm)
Btm_AF Btm_RW
(b) Bottom restraints
Fig. A.9 Horizontal force-displacement relationships of CMJ-B-1.19/0.59
0 2 4 6 8 10 120
50
100
150
200
250
Horiz
ontal
reac
tion
forc
e (kN
)
Horizontal displacement (mm)
Top_AF Top_RW
(a) Top restraints
-6 -4 -2 0 2 4 6 8-350
-300
-250
-200
-150
-100
-50
0
50
Hor
izon
tal r
eact
ion
forc
e (kN
)
Horizontal displacement (mm)
Btm_AF Btm_RW
(b) Bottom restraints
Fig. A.10 Horizontal force-displacement relationships of EMJ-B-1.19/0.59

APPENDIX A QUANTIFICATION OF BOUNDARY CONDITIONS
269
0 1 2 3 4 50
30
60
90
120
150
Horiz
ontal
reac
tion
forc
e (kN
)
Horizontal displacement (mm)
Top_AF Top_RW
(a) Top restraints
-6 -5 -4 -3 -2 -1 0-350
-300
-250
-200
-150
-100
-50
0
50
Hor
izon
tal r
eact
ion
forc
e (kN
)
Horizontal displacement (mm)
Btm_AF Btm_RW
(b) Bottom restraints
Fig. A.11 Horizontal force-displacement relationships of EMJ-B-0.88/0.59
0 1 2 3 4 5 60
50
100
150
200
250
Horiz
ontal
reac
tion
forc
e (kN
)
Horizontal displacement (mm)
Top_AF Top_RW
(a) Top restraints
-6 -4 -2 0 2 4 6-400
-300
-200
-100
0
100
Hor
izon
tal r
eact
ion
forc
e (kN
)
Horizontal displacement (mm)
Btm_AF Btm_RW
(b) Bottom restraints
Fig. A.12 Horizontal force-displacement relationships of EMJ-L-1.19/0.59
0 1 2 3 4 50
30
60
90
120
150
Horiz
ontal
reac
tion
forc
e (kN
)
Horizontal displacement (mm)
Top_AF Top_RW
(a) Top restraints
-6 -5 -4 -3 -2 -1 0-350
-300
-250
-200
-150
-100
-50
0
50
Hor
izon
tal r
eact
ion
forc
e (kN
)
Horizontal displacement (mm)
Btm_AF Btm_RW
(b) Bottom restraints
Fig. A.13 Horizontal force-displacement relationships of EMJ-L-0.88/0.59

APPENDIX A QUANTIFICATION OF BOUNDARY CONDITIONS
270
0 1 2 3 4 50
30
60
90
120
150
180Ho
rizon
tal re
actio
n fo
rce (
kN)
Horizontal displacement (mm)
Top_AF Top_RW
(a) Top restraints
-10 -8 -6 -4 -2 0-200
-150
-100
-50
0
50
Horiz
ontal
reac
tion
forc
e (kN
)
Horizontal displacement (mm)
Btm_AF Btm_RW
(b) Bottom restraints
Fig. A.14 Horizontal force-displacement relationships of EMJ-L-0.88/0.88
Table A.2 Horizontal stiffness of beam-column sub-assemblages with ECC
Specimen Horizontal restraint
Tension stiffness (N/mm)
Compression stiffness (N/mm)
Tension gap (mm)
Compression gap (mm)
CMJ-B-1.19/0.59
Top_AF 35365 -- 1.0 --
Btm_AF 74044 202709 2.6 -2.8
Top_RW 32101 -- 3.3 --
Btm_RW -- 206435 -- -2.8
EMJ-B-1.19/0.59
Top_AF 34843 -- 3.0 --
Btm_AF 73587 182843 5.5 -3.9
Top_RW 13993 -- 2.2 --
Btm_RW -- 243320 -- -1.2
EMJ-B-0.88/0.59
Top_AF 35135 -- 1.0 --
Btm_AF -- 149253 -- -2.4
Top_RW 70782 -- 1.4 --
Btm_RW -- 171223 -- -3.2
EMJ-L-1.19/0.59
Top_AF 40071 -- 0.2 --
Btm_AF 109881 176716 4.6 -1.7
Top_RW 38560 -- 3.6 --
Btm_RW -- 184997 -- -2.7
EMJ-L-0.88/0.59
Top_AF 49276 -- 2.3 --
Btm_AF -- 170891 -- -0.9
Top_RW 96984 -- 1.3 --
Btm_RW -- 159386 -- -3.5
EMJ-L-0.88/0.88
Top_AF 33642 -- 0.3 --
Btm_AF -- 150977 -- -7.0

APPENDIX A QUANTIFICATION OF BOUNDARY CONDITIONS
271
Top_RW 29917 -- 1.7 --
Btm_RW -- 75900 -- -3.6
In deriving the analytical model for CAA of beam-column sub-assemblages,
equivalent gaps for the bridging beam have to be quantified. Moreover, as a result of
connection gaps in the top and bottom restraints, end column stubs also experienced
free rotation at the initial stage. Fig. A.15 shows the free rotation of end column stubs
and equivalent gap at the centroid of the bridging beam. The equivalent gap for the
bridging beam can be computed from Eq. (A-1).
2t b
eδ δδ +
= (A-1)
where eδ is the equivalent connection gap at the centroid of the beam; tδ is the gap
in the top restraint; and bδ is the gap in the bottom restraint. It is noteworthy that
negative values are for compression and positive values are for tension.
Fig. A.15 Equivalent connection gap at the beam centroid
Besides the horizontal stiffness and corresponding connection gap, rotationa l
stiffness of the bridging beam also needs to be quantified. Bending moment acting on
the end column stubs can be calculated based on the force equilibrium, as expressed
in Fig. 4.11. Meanwhile, rotation of the column stubs can be determined from the
measurements of LVDTs (see Fig. 3.5), as expressed in Eq. (A-2).
t bf
btlδ δθ −
= (A-2)
where fθ is the rotation angle of the end column stubs and btl is the distance between
the top and bottom horizontal load restraints.
lbt
δt
δb
Ht
H b
δe
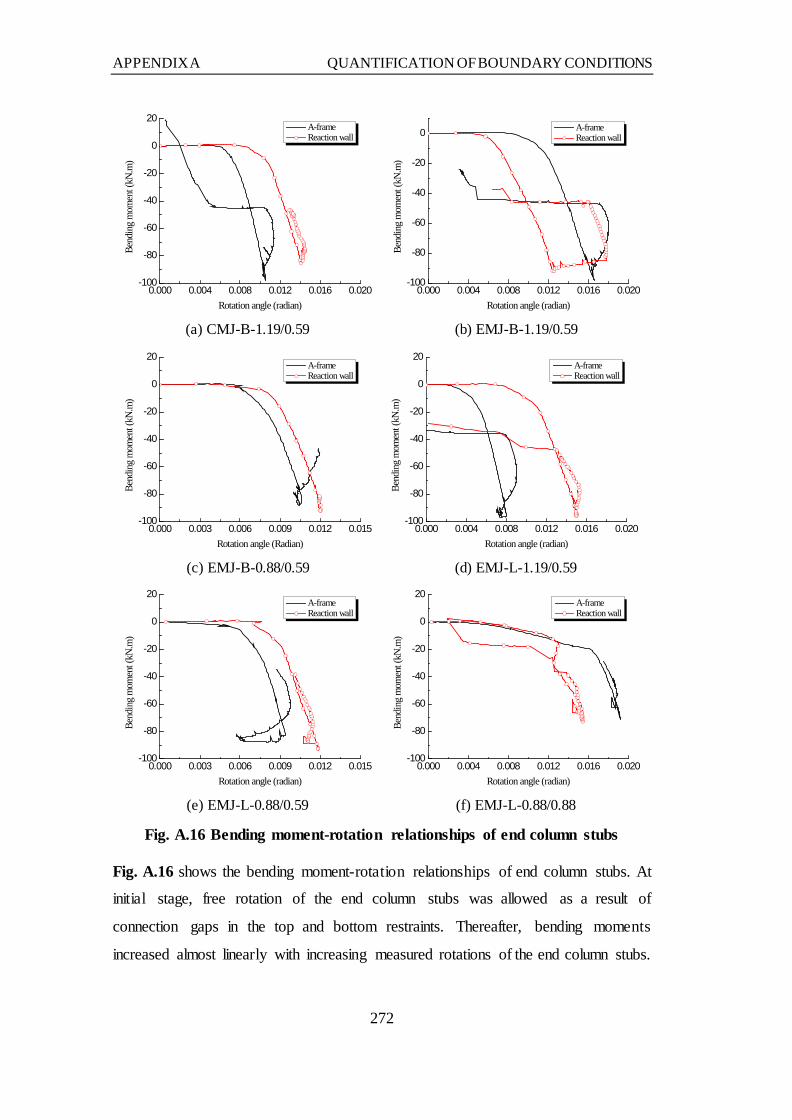
APPENDIX A QUANTIFICATION OF BOUNDARY CONDITIONS
272
0.000 0.004 0.008 0.012 0.016 0.020-100
-80
-60
-40
-20
0
20Be
ndin
g m
omen
t (kN
.m)
Rotation angle (radian)
A-frame Reaction wall
(a) CMJ-B-1.19/0.59
0.000 0.004 0.008 0.012 0.016 0.020-100
-80
-60
-40
-20
0
Bend
ing
mom
ent (
kN.m
)
Rotation angle (radian)
A-frame Reaction wall
(b) EMJ-B-1.19/0.59
0.000 0.003 0.006 0.009 0.012 0.015-100
-80
-60
-40
-20
0
20
Bend
ing
mom
ent (
kN.m
)
Rotation angle (Radian)
A-frame Reaction wall
(c) EMJ-B-0.88/0.59
0.000 0.004 0.008 0.012 0.016 0.020-100
-80
-60
-40
-20
0
20
Bend
ing
mom
ent (
kN.m
)
Rotation angle (radian)
A-frame Reaction wall
(d) EMJ-L-1.19/0.59
0.000 0.003 0.006 0.009 0.012 0.015-100
-80
-60
-40
-20
0
20
Bend
ing
mom
ent (
kN.m
)
Rotation angle (radian)
A-frame Reaction wall
(e) EMJ-L-0.88/0.59
0.000 0.004 0.008 0.012 0.016 0.020-100
-80
-60
-40
-20
0
20
Bend
ing
mom
ent (
kN.m
)
Rotation angle (radian)
A-frame Reaction wall
(f) EMJ-L-0.88/0.88
Fig. A.16 Bending moment-rotation relationships of end column stubs
Fig. A.16 shows the bending moment-rotation relationships of end column stubs. At
initial stage, free rotation of the end column stubs was allowed as a result of
connection gaps in the top and bottom restraints. Thereafter, bending moments
increased almost linearly with increasing measured rotations of the end column stubs.

APPENDIX A QUANTIFICATION OF BOUNDARY CONDITIONS
273
The free rotation angle and rotation stiffness of end column stubs can be quantified
by linear regression, as listed in Table A.3.
Table A.3 Rotational stiffness of beam-column sub-assemblages with ECC
Specimen
A-frame Reaction wall Rotational stiffness
(kN.m/rad)
Free rotation angle (radian)
Rotational stiffness
(kN.m/rad)
Free rotation angle (radian)
CMJ-B-1.19/0.59 25850 0.007 19923 0.01
EMJ-B-1.19/0.59 17564 0.011 14854 0.006
EMJ-B-0.88/0.59 20307 0.007 23004 0.008
EMJ-L-1.19/0.59 29330 0.005 17238 0.01
EMJ-L-0.88/0.59 22572 0.006 24380 0.008
EMJ-L-0.88/0.88 19433 0.015 16059 0.011
A.3 Precast Concrete Frames
As for interior precast concrete frames, horizontal restraints were connected to the
top and bottom of the side columns and beam extension, as shown in Fig. 5.2(a).
Under column removal scenarios, horizontal compression forces were transmitted to
the bottom restraint at the CAA stage, whereas tension force was sustained by the
load cell connected to the beam extension at the catenary action stage (see Figs.
5.10(a and b)). Exterior frames were only restrained by horizontal load cells at the
top and bottom ends of the side columns, as shown in Fig. 5.2(b). At the CAA stage,
similar load paths of horizontal compression forces were measured. However, tension
forces were mainly sustained by load cells at the top of the side columns following
the commencement of catenary action, as shown in Figs. 5.10(c and d).
A.3.1 Horizontal reaction forces
By increasing the top reinforcement ratio in the beams, shear failure was initiated in
the side beam-column joints of EF-B-1.19/0.59 and EF-L-1.19/0.59 at the CAA stage,
as shown in Figs. 6.7(a and b). Hence, with increasing middle joint displacement,
tension forces in the top restraints could not increase, even though beam top
reinforcement remained intact at the catenary action stage, as shown in Figs. A.17(a
and b). Furthermore, cross section of the side columns in EF-B-1.19/0.59S and EF-
L-1.19/0.59S was enlarged to prevent premature shear failure of the side beam-

APPENDIX A QUANTIFICATION OF BOUNDARY CONDITIONS
274
column joints. Compared to EF-B-1.19/0.59 and EF-L-1.19/0.59, horizonta l
compression forces in the bottom restraints of EF-B-1.19/0.59S and EF-L-1.19/0.59S
did not significantly increased at the CAA stage. However, tension forces sustained
by the top and bottom restraints were substantially greater as a result of stiffer side
columns, as shown in Figs. A.17(c and d).
0 100 200 300 400 500-90
-60
-30
0
30
60
Hor
izon
tal r
eact
ion
forc
e (kN
)
Middle joint displacement (mm)
Top_AF Btm_AF Top_RW Btm_RW
(a) EF-B-1.19-0.59
0 100 200 300 400 500-90
-60
-30
0
30
60
Hor
izon
tal r
eact
ion
forc
e (kN
)
Middle joint displacement (mm)
Top_AF Btm_AF Top_RW Btm_RW
(b) EF-L-1.19-0.59
0 100 200 300 400 500 600 700-100
-50
0
50
100
150
Horiz
ontal
reac
tion
forc
e (kN
)
Middle joint displacement (mm)
Top_AF Btm_AF Top_RW Btm_RW
(c) EF-B-1.19-0.59S
0 100 200 300 400 500 600 700-100
-50
0
50
100
150
Horiz
ontal
reac
tion
forc
e (kN
)
Middle joint displacement (mm)
Top_AF Btm_AF Top_RW Btm_RW
(d) EF-L-1.19-0.59S
Fig. A.17 Horizontal reaction forces of precast concrete frames

APPENDIX A QUANTIFICATION OF BOUNDARY CONDITIONS
275
A.3.2 Stiffness of horizontal restraints
-6 -4 -2 0 2 4 6-40
-30
-20
-10
0
10Ho
rizon
tal re
actio
n fo
rce (
kN)
Horizontal displacement (mm)
Mid_AF Mid_RW
(a) Middle restraints
-6 -4 -2 0 2 4 6 8-20
-10
0
10
20
30
40
Horiz
ontal
reac
tion
forc
e (kN
)
Horizontal displacement (mm)
Top_AF Top_RW
(b) Top restraints
Fig. A.18 Horizontal force-displacement relationships of IF-B-0.88-0.59
-8 -6 -4 -2 0 2 4-50
0
50
100
150
200
250
Horiz
ontal
reac
tion
forc
e (kN
)
Horizontal displacement (mm)
Mid_AF Mid_RW
(a) Middle restraints
0 1 2 3 4 50
10
20
30
40
50
60 Top_RW
Horiz
ontal
reac
tion
forc
e (kN
)
Horizontal displacement (mm) (b) Top restraints
Fig. A.19 Horizontal force-displacement relationships of IF-L-0.88-0.59
For interior precast concrete frames, pin supports were designed at the bottom of the
side columns and only horizontal reaction forces were measured. However, both
reaction forces and displacements were captured on the column top and at the beam
extensions. Fig. A.18 and Fig. A.19 show the horizontal force-displacement curves
of interior frames. In IF-L-0.88-0.59, LVDT placed at the top load cell near the
reaction wall failed to measure the horizontal displacement, and thus only the
horizontal force-displacement curve of the top restraint near the A-frame is shown in
Fig. A.19(b). Table A.4 summarises the horizontal stiffness and connection gap of
restraints calculated from linear regression.

APPENDIX A QUANTIFICATION OF BOUNDARY CONDITIONS
276
-2 0 2 4 6-20
0
20
40
60
80
100
Horiz
ontal
reac
tion
forc
e (kN
)
Horizontal displacement (mm)
Top_AF Top_RW
(a) EF-L-0.88-0.59
0 1 2 3 40
10
20
30
40
50
Horiz
ontal
reac
tion
forc
e (kN
)
Horizontal displacement (mm)
Top_AF Top_RW
(b) EF-B-1.19/0.59
-4 -2 0 2 4 6 8-10
0
10
20
30
40
50
60
Horiz
ontal
reac
tion
forc
e (kN
)
Horizontal displacement (mm)
Top_AF Top_RW
(c) EF-L-1.19/0.59
-6 -4 -2 0 2 4 6-30
0
30
60
90
120
150
Horiz
ontal
reac
tion
forc
e (kN
)
Horizontal displacement (mm)
Top_AF Top_RW
(d) EF-B-1.19/0.59S
-6 -4 -2 0 2 4 6-30
0
30
60
90
120
150 Top_AF
Horiz
ontal
reac
tion
forc
e (kN
)
Horizontal displacement (mm) (e) EF-L-1.19/0.59S
Fig. A.20 Horizontal force-displacement relationships of exterior frames
In exterior frames, only horizontal reaction force and corresponding displacement at
the top restraints were recorded, as shown in Fig. A.20. As limited compression
forces were sustained by the top restraints at the CAA stage, only the stiffness of
restraints in tension and associated gap are quantified, as listed in Table A.4. Special

APPENDIX A QUANTIFICATION OF BOUNDARY CONDITIONS
277
attention has to be paid to exterior frame EF-L-0.88-0.59 (see Fig. 5.10(a)).
Premature fracture of beam top reinforcement hindered the development of tension
force in the top restraints. As a result, the horizontal stiffness and connection gap
cannot be quantified.
Table A.4 Horizontal stiffness of precast concrete frames
Specimen
A-frame Reaction wall
Remark* Horizontal stiffness (N/mm)
Connection gap (mm)
Horizontal stiffness (N/mm)
Connection gap (mm)
IF-B-0.88-0.59 9055# -1.3# 65420# -2.2# Middle
-- -- 34024 5.3 Top
IF-L-0.88-0.59 205816 0.9 44466 2.7 Middle
-- -- 45983 2.4 Top
EF-L-0.88-0.59 43206 0.8 14045 1.0 Top
EF-B-1.19/0.59 8382 1.3 26884 1.0 Top
EF-L-1.19/0.59 72291 1.3 -- -- Top
EF-B-1.19/0.59S 44725 1.1 113730 0.7 Top
EF-L-1.19/0.59S 34152 0.6 -- -- Top *: “Middle” and “Top” represent the horizontal restraints connected to the beam extension and column top, respectively. #: Negative connection gaps and associated stiffness are for compression.