Embed Size (px)
Citation preview

Strategies for in vitro Transporter Testing and Alignment with FDA Guidance
Elke S. Perloff, Ph.D.BD Biosciences – Discovery Labwarewww.bdbiosciences.com/admetox
Presentation Overview
• Guidance documents and position papers
• Transporter expression and function– Role in drug-drug interactions
– In vitro models to study transporter interactions
• Focus on assessment of P-glycoprotein (P-gp) Interactions – Identification of P-gp substrates and inhibitors
– Technical considerations (cell lines, positive controls, assay conditions, parameter calculations)
– Decision trees
Guidance Documents andPosition Papers
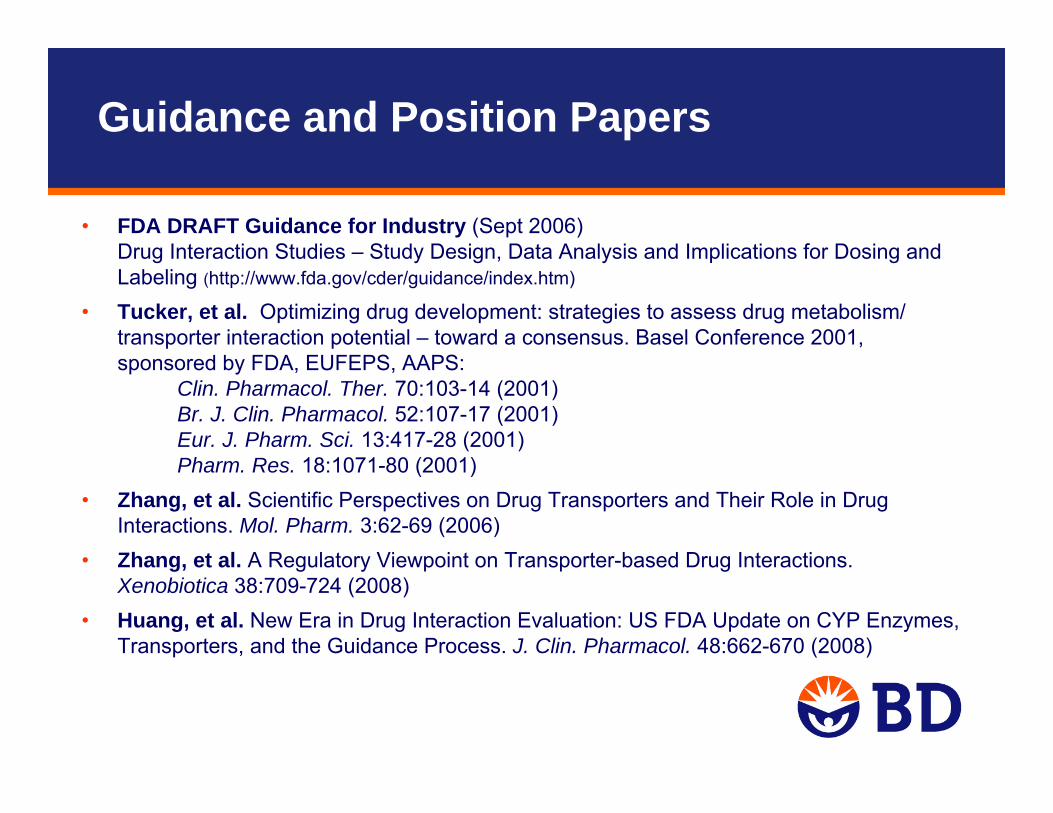
• FDA DRAFT Guidance for Industry (Sept 2006) Drug Interaction Studies – Study Design, Data Analysis and Implications for Dosing and Labeling (http://www.fda.gov/cder/guidance/index.htm)
• Tucker, et al. Optimizing drug development: strategies to assess drug metabolism/ transporter interaction potential – toward a consensus. Basel Conference 2001, sponsored by FDA, EUFEPS, AAPS:
Clin. Pharmacol. Ther. 70:103-14 (2001) Br. J. Clin. Pharmacol. 52:107-17 (2001) Eur. J. Pharm. Sci. 13:417-28 (2001) Pharm. Res. 18:1071-80 (2001)
• Zhang, et al. Scientific Perspectives on Drug Transporters and Their Role in Drug Interactions. Mol. Pharm. 3:62-69 (2006)
• Zhang, et al. A Regulatory Viewpoint on Transporter-based Drug Interactions. Xenobiotica 38:709-724 (2008)
• Huang, et al. New Era in Drug Interaction Evaluation: US FDA Update on CYP Enzymes, Transporters, and the Guidance Process. J. Clin. Pharmacol. 48:662-670 (2008)
Guidance and Position Papers
• Over 400 draft or final guidance documentshttp://www.fda.gov/cder/guidance/index.htm
• Represent the Agency's current thinking
• Do not bind the FDA or the public, but provide pharmaceutical companies with assurance– An alternative approach may be used if it satisfies requirements of any
applicable statutes, or regulations
– If in doubt, contact the originating office (e.g. CDER)
FDA Guidance Documents
Transporter Expression and FunctionRole in drug-drug interactionsIn vitro models to study transporter interactions
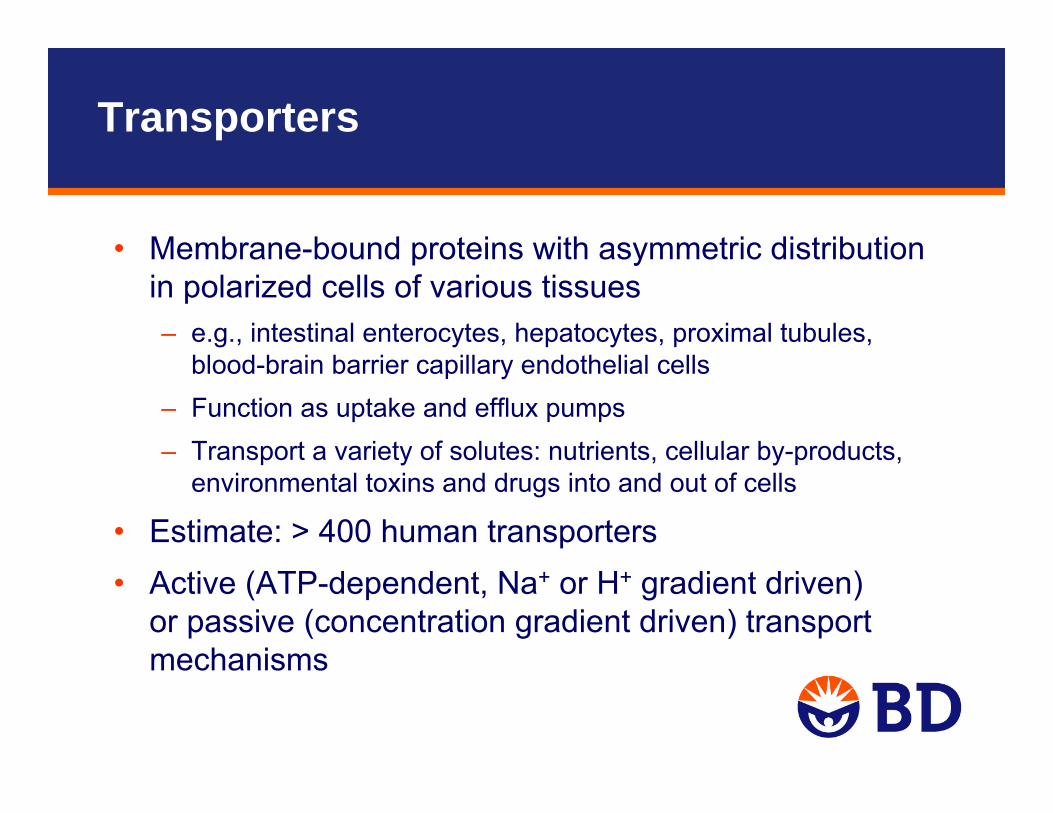
• Membrane-bound proteins with asymmetric distribution in polarized cells of various tissues– e.g., intestinal enterocytes, hepatocytes, proximal tubules,
blood-brain barrier capillary endothelial cells– Function as uptake and efflux pumps – Transport a variety of solutes: nutrients, cellular by-products,
environmental toxins and drugs into and out of cells
• Estimate: > 400 human transporters• Active (ATP-dependent, Na+ or H+ gradient driven)
or passive (concentration gradient driven) transport mechanisms
Transporters
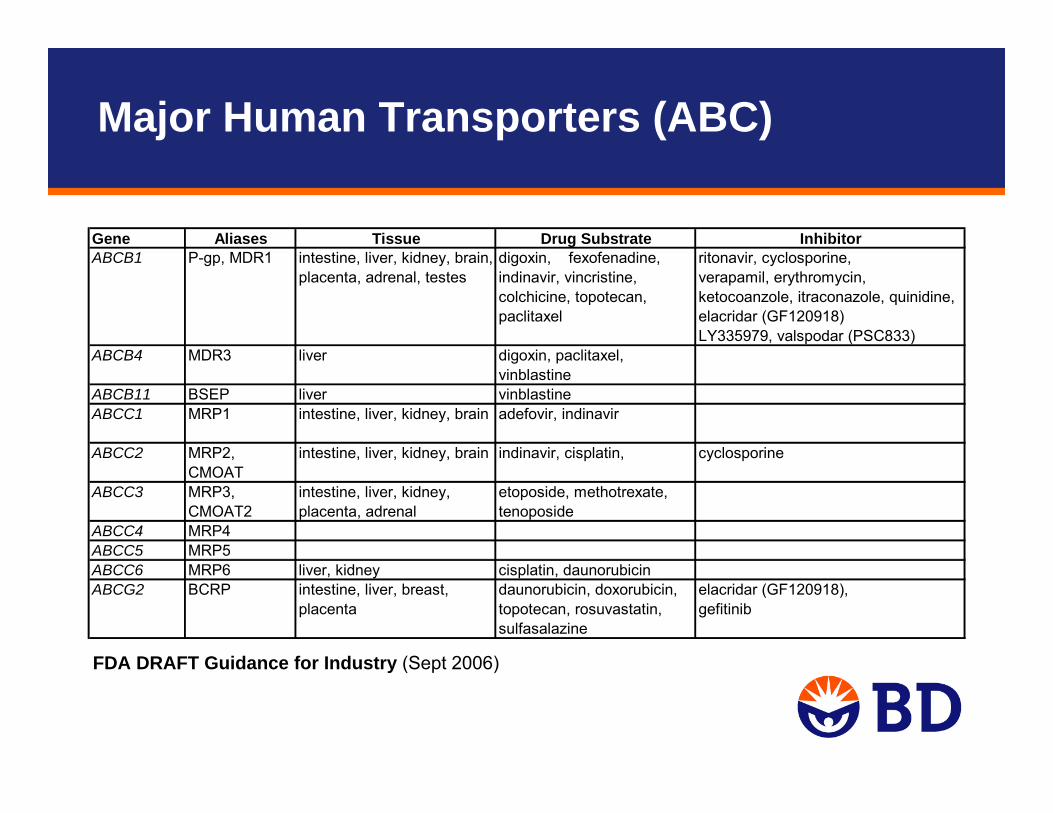
Gene Aliases Tissue Drug Substrate Inhibitorritonavir, cyclosporine,verapamil, erythromycin, ketocoanzole, itraconazole, quinidine, elacridar (GF120918)LY335979, valspodar (PSC833)
ABCB4 MDR3 liver digoxin, paclitaxel, vinblastine
ABCB11 BSEP liver vinblastineABCC1 MRP1 intestine, liver, kidney, brain adefovir, indinavir
ABCC2 MRP2, CMOAT
intestine, liver, kidney, brain indinavir, cisplatin, cyclosporine
ABCC3 MRP3, CMOAT2
intestine, liver, kidney, placenta, adrenal
etoposide, methotrexate, tenoposide
ABCC4 MRP4ABCC5 MRP5ABCC6 MRP6 liver, kidney cisplatin, daunorubicin
daunorubicin, doxorubicin, elacridar (GF120918),topotecan, rosuvastatin, sulfasalazine
gefitinibABCG2 BCRP intestine, liver, breast,
placenta
ABCB1 P-gp, MDR1 intestine, liver, kidney, brain, placenta, adrenal, testes
digoxin, fexofenadine, indinavir, vincristine, colchicine, topotecan, paclitaxel
FDA DRAFT Guidance for Industry (Sept 2006)
Major Human Transporters (ABC)
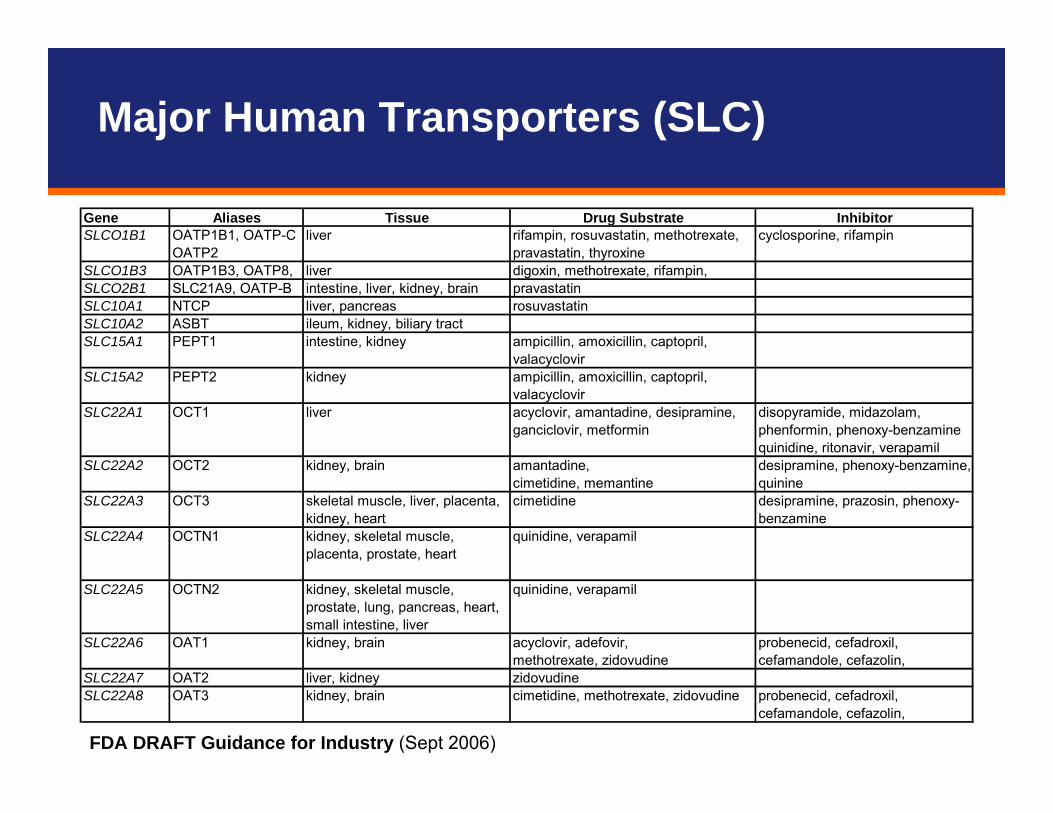
Gene Aliases Tissue Drug Substrate InhibitorOATP1B1, OATP-C cyclosporine, rifampinOATP2
SLCO1B3 OATP1B3, OATP8, liver digoxin, methotrexate, rifampin,SLCO2B1 SLC21A9, OATP-B intestine, liver, kidney, brain pravastatinSLC10A1 NTCP liver, pancreas rosuvastatinSLC10A2 ASBT ileum, kidney, biliary tractSLC15A1 PEPT1 intestine, kidney ampicillin, amoxicillin, captopril,
valacyclovirSLC15A2 PEPT2 kidney ampicillin, amoxicillin, captopril,
valacyclovirSLC22A1 OCT1 liver acyclovir, amantadine, desipramine,
ganciclovir, metformindisopyramide, midazolam, phenformin, phenoxy-benzamine quinidine, ritonavir, verapamil
amantadine,cimetidine, memantine
SLC22A3 OCT3 skeletal muscle, liver, placenta, kidney, heart
cimetidine desipramine, prazosin, phenoxy-benzamine
SLC22A4 OCTN1 kidney, skeletal muscle, placenta, prostate, heart
quinidine, verapamil
SLC22A5 OCTN2 kidney, skeletal muscle, prostate, lung, pancreas, heart, small intestine, liver
quinidine, verapamil
acyclovir, adefovir,methotrexate, zidovudine
SLC22A7 OAT2 liver, kidney zidovudineSLC22A8 OAT3 kidney, brain cimetidine, methotrexate, zidovudine probenecid, cefadroxil,
cefamandole, cefazolin,
SLCO1B1 liver rifampin, rosuvastatin, methotrexate, pravastatin, thyroxine
SLC22A2 OCT2 kidney, brain desipramine, phenoxy-benzamine, quinine
SLC22A6 OAT1 kidney, brain probenecid, cefadroxil, cefamandole, cefazolin,
FDA DRAFT Guidance for Industry (Sept 2006)
Major Human Transporters (SLC)
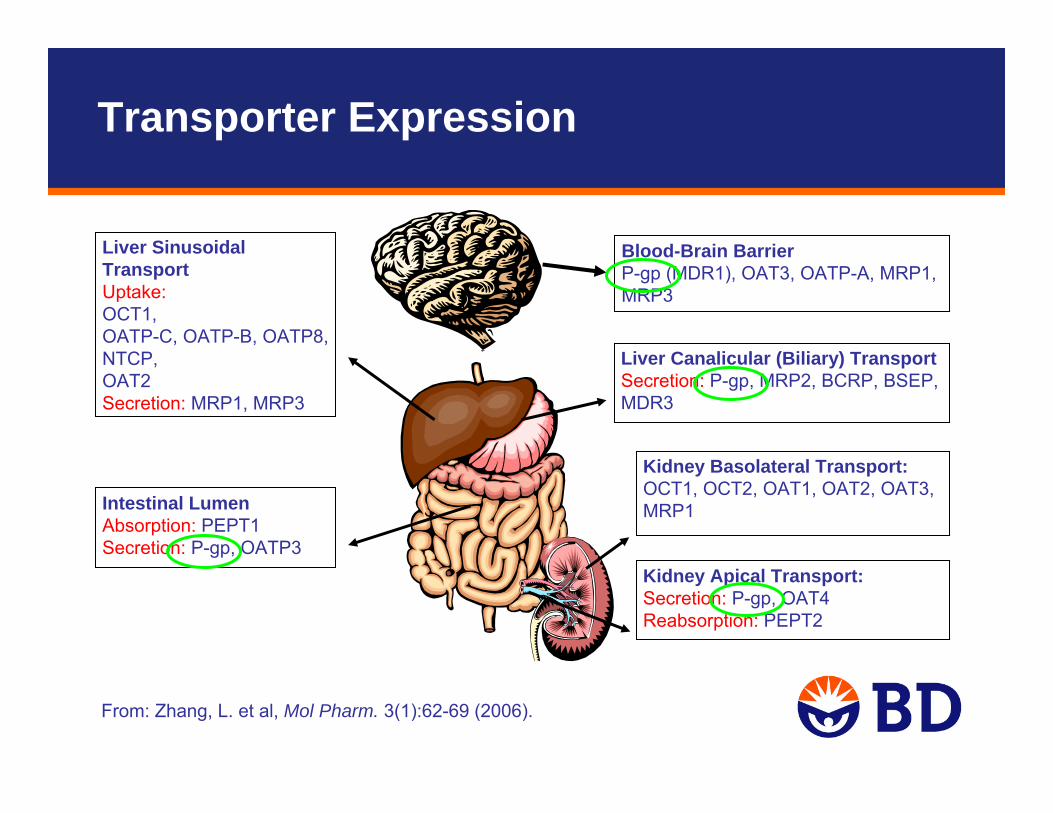
From: Zhang, L. et al, Mol Pharm. 3(1):62-69 (2006).
Kidney Basolateral Transport: OCT1, OCT2, OAT1, OAT2, OAT3, MRP1
Kidney Apical Transport: Secretion: P-gp, OAT4Reabsorption: PEPT2
Blood-Brain BarrierP-gp (MDR1), OAT3, OATP-A, MRP1, MRP3
Liver Sinusoidal Transport Uptake: OCT1, OATP-C, OATP-B, OATP8, NTCP, OAT2Secretion: MRP1, MRP3
Liver Canalicular (Biliary) TransportSecretion: P-gp, MRP2, BCRP, BSEP, MDR3
Intestinal Lumen Absorption: PEPT1Secretion: P-gp, OATP3
Transporter Expression
• Currently considered most important transporters for Drug-Drug Interactions (DDI):
– ABC: P-gp, BCRP, BSEP– SLC: OATP1B1, OATP1B3 , OATP2B1, OCT1, OCT3, OAT2
• Currently considered less important:– MRP transporters
• Most critical for drugs with a narrow therapeutic index (e.g., digoxin) where co-administration of a transporter inhibitor might require dose adjustment.
• Depending on the expression pattern of the affected transporter, DDI can result in changes to absorption, tissue distribution (CNS, tumors), or elimination of the victim drug.
Drug-Drug Interactions Due to Transporters
• Cerivastatin (HMG-CoA reductase inhibitor)– Substrate of hepatic uptake transporter OATP1B1– Increased plasma concentrations with inhibition of OATP1B1 by co-administered
cyclosporine (JPET 304:610 [2003])– (Withdrawn from market in 2001 after 52 deaths due to kidney failure)
• Digoxin (cardiac glycoside)– Substrate of efflux transporter P-glycoprotein– Elimination of unchanged digoxin is by renal and biliary excretion. – AUC increased and renal clearance decreased with co-administration of P-gp inhibitor
itraconazole (Ther. Drug Monit. 10:609 [1997])– AUC decreased with co-administration of P-gp inducer rifampin (J. Clin. Invest. 104:147
[1999]).• Cephalosporin antibiotics
– Substrates of uptake transporter OAT– Co-administration of OAT inhibitor probenecid resulted in decreased renal clearance,
increased Cmax and AUC (Clin. Pharmacokinet. 24:289 [1993]).
Clinical Examples for Transporter-Related Drug-Drug Interactions
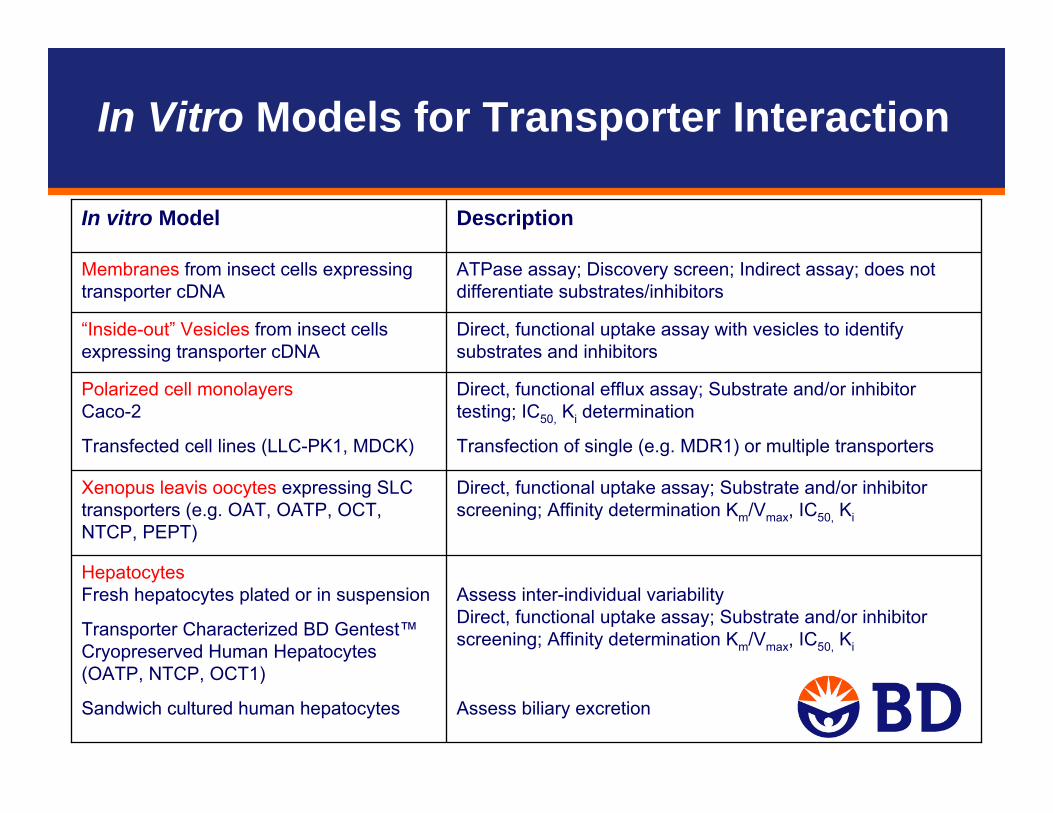
Assess inter-individual variabilityDirect, functional uptake assay; Substrate and/or inhibitor screening; Affinity determination Km/Vmax, IC50, Ki
Assess biliary excretion
Hepatocytes Fresh hepatocytes plated or in suspension
Transporter Characterized BD Gentest™Cryopreserved Human Hepatocytes (OATP, NTCP, OCT1)
Sandwich cultured human hepatocytes
Direct, functional efflux assay; Substrate and/or inhibitor testing; IC50, Ki determination
Transfection of single (e.g. MDR1) or multiple transporters
Polarized cell monolayers Caco-2
Transfected cell lines (LLC-PK1, MDCK)
Direct, functional uptake assay with vesicles to identify substrates and inhibitors
“Inside-out” Vesicles from insect cells expressing transporter cDNA
Direct, functional uptake assay; Substrate and/or inhibitor screening; Affinity determination Km/Vmax, IC50, Ki
Xenopus leavis oocytes expressing SLC transporters (e.g. OAT, OATP, OCT, NTCP, PEPT)
Membranes from insect cells expressing transporter cDNA
In vitro Model
ATPase assay; Discovery screen; Indirect assay; does not differentiate substrates/inhibitors
Description
In Vitro Models for Transporter Interaction
Assessment of P-gp InteractionsIdentification of P-gp substrates and inhibitorsTechnical considerationsDecision trees

• “…in vitro studies can frequently serve as a screening mechanism to rule out the importance of a metabolic pathway and the drug-drug interactions that occur through this pathway so that subsequent in vivo testing is unnecessary.”
• “...not every drug-drug interaction is metabolism-based, but may arise from changes in pharmacokinetics caused by absorption, distribution, and excretion interactions. Drug-drug interactions related to transporters are being documented with increasing frequency and are important to consider in drug development. “
• “Of the various transporters, P-gp is the most well understood and may be appropriate to evaluate during drug development.”
FDA DRAFT Guidance for Industry (Sept 2006)
FDA’s Current Thinking

Filaria Journal 2(Suppl 1):S8 (2003).
Apical side
(e.g. intestinal lumen)
• P-glycoprotein (P-gp) commonly refers to MDR1
– P-glycoprotein (MDR1) is encoded by the ABCB1 gene.
– MDR3 (encoded by ABCB4) is present in various human tissues, but there is little evidence of a major role in drug transport.
• 170 kDa glycoprotein
• ATP-binding cassette transporter
P-gp consists of 2 sections, each containing 6 transmembranedomains and a large cytoplasmic domain with an ATP-binding site
P-gp
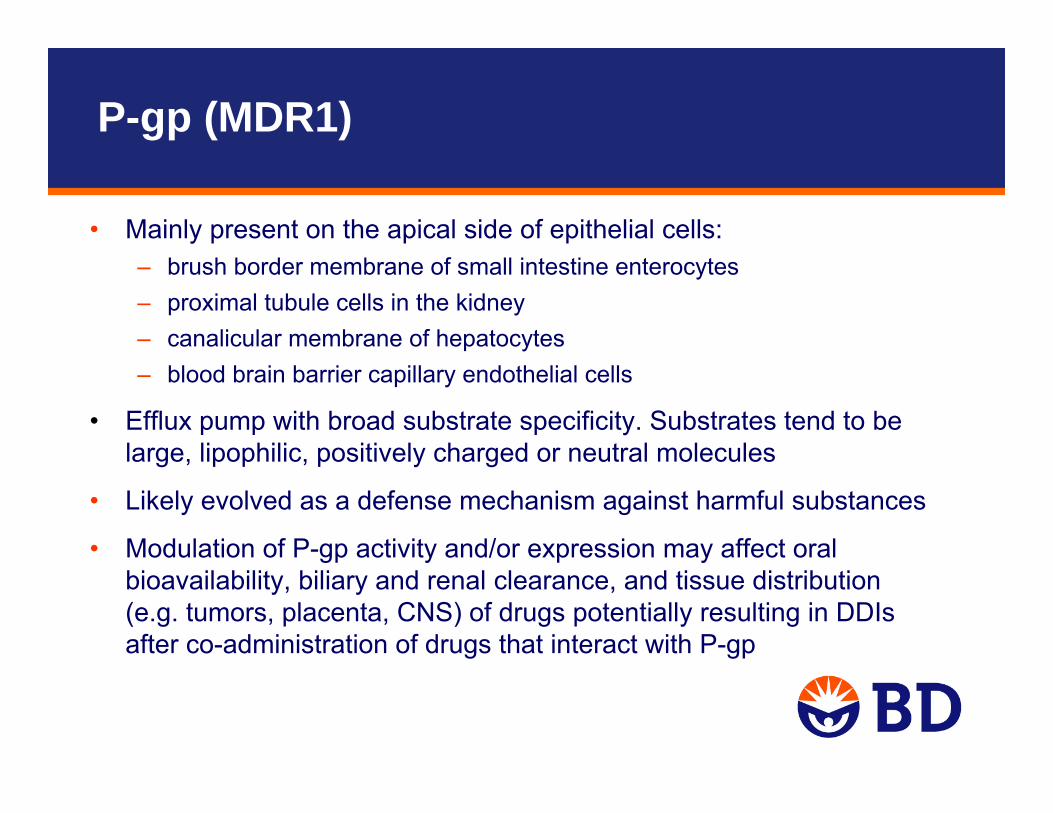
• Mainly present on the apical side of epithelial cells:– brush border membrane of small intestine enterocytes– proximal tubule cells in the kidney – canalicular membrane of hepatocytes– blood brain barrier capillary endothelial cells
• Efflux pump with broad substrate specificity. Substrates tend to be large, lipophilic, positively charged or neutral molecules
• Likely evolved as a defense mechanism against harmful substances
• Modulation of P-gp activity and/or expression may affect oral bioavailability, biliary and renal clearance, and tissue distribution(e.g. tumors, placenta, CNS) of drugs potentially resulting in DDIsafter co-administration of drugs that interact with P-gp
P-gp (MDR1)
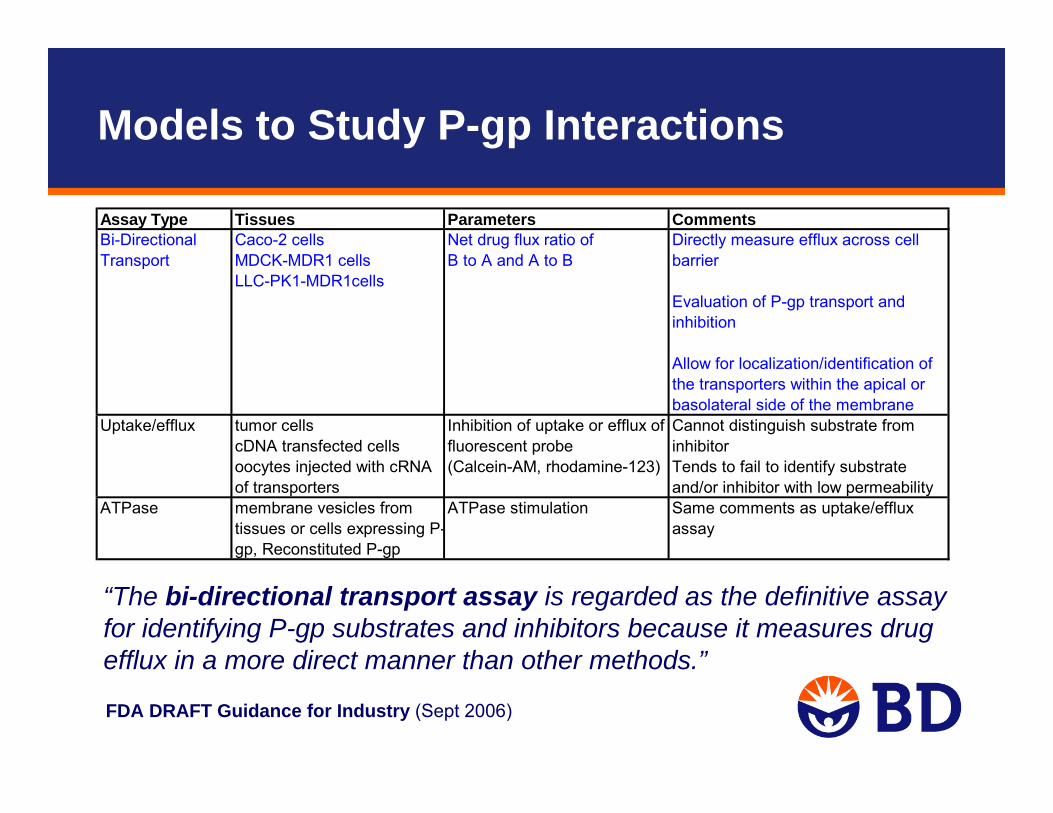
“The bi-directional transport assay is regarded as the definitive assay for identifying P-gp substrates and inhibitors because it measures drug efflux in a more direct manner than other methods.”
Models to Study P-gp Interactions
Assay Type Tissues Parameters CommentsBi-Directional Transport
Caco-2 cellsMDCK-MDR1 cellsLLC-PK1-MDR1cells
Net drug flux ratio of B to A and A to B
Directly measure efflux across cell barrier
Evaluation of P-gp transport and inhibition
Allow for localization/identification of the transporters within the apical or basolateral side of the membrane
Inhibition of uptake or efflux of fluorescent probe
Cannot distinguish substrate from inhibitor
(Calcein-AM, rhodamine-123) Tends to fail to identify substrate and/or inhibitor with low permeability
ATPase membrane vesicles from tissues or cells expressing P-gp, Reconstituted P-gp
ATPase stimulation Same comments as uptake/efflux assay
Uptake/efflux tumor cellscDNA transfected cells oocytes injected with cRNA of transporters
FDA DRAFT Guidance for Industry (Sept 2006)
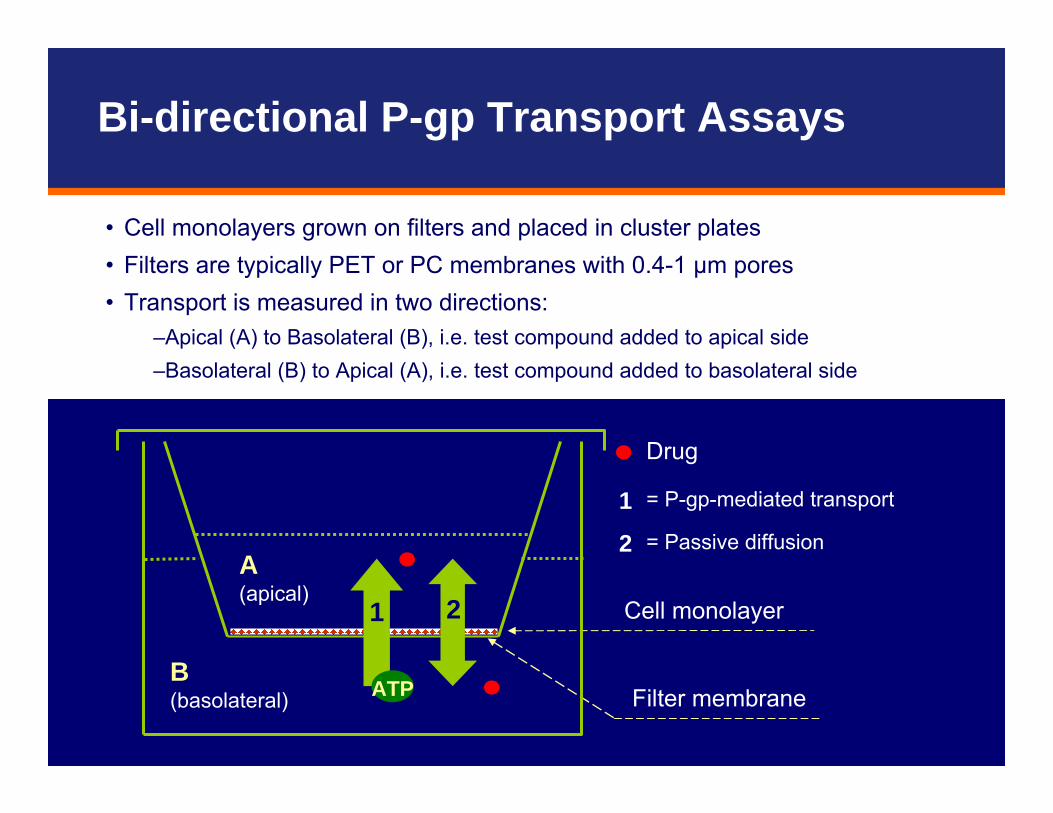
• Cell monolayers grown on filters and placed in cluster plates• Filters are typically PET or PC membranes with 0.4-1 μm pores• Transport is measured in two directions:
–Apical (A) to Basolateral (B), i.e. test compound added to apical side–Basolateral (B) to Apical (A), i.e. test compound added to basolateral side
Drug
= P-gp-mediated transport
= Passive diffusion
1
2
Filter membrane
Cell monolayer
ATP
A(apical)
B(basolateral)
1 2
Bi-directional P-gp Transport Assays
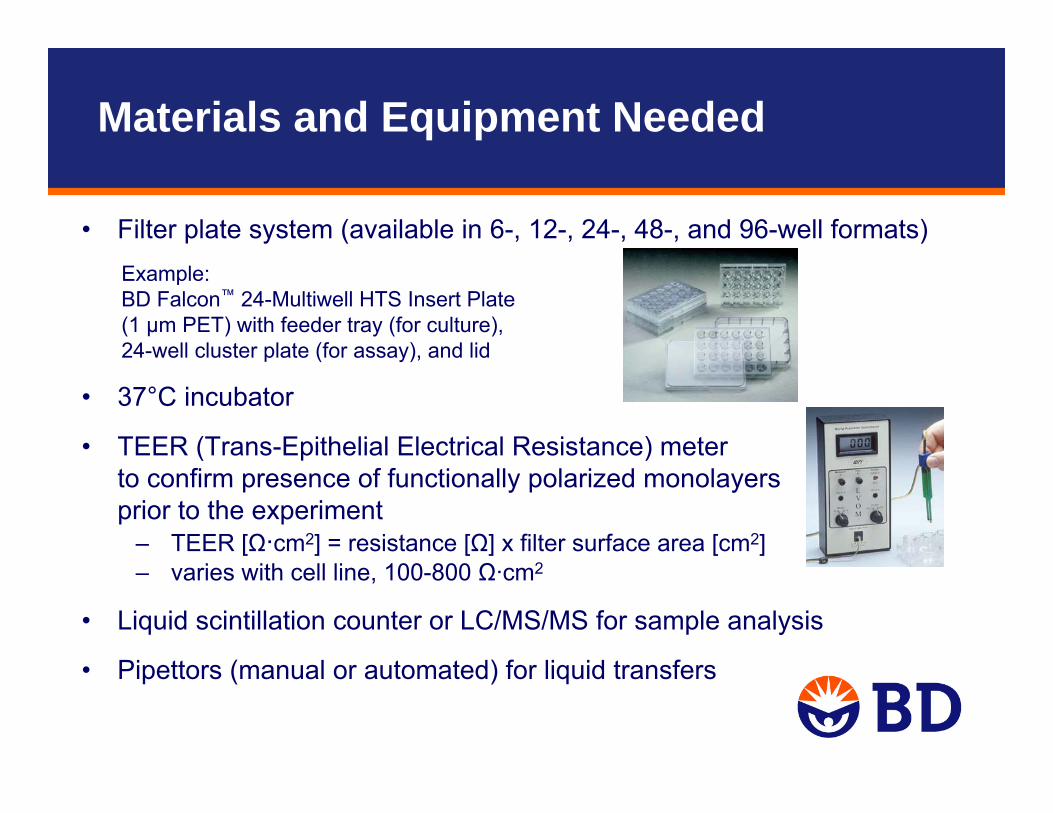
Example:BD Falcon™ 24-Multiwell HTS Insert Plate (1 µm PET) with feeder tray (for culture), 24-well cluster plate (for assay), and lid
• Filter plate system (available in 6-, 12-, 24-, 48-, and 96-well formats)
• 37°C incubator
• TEER (Trans-Epithelial Electrical Resistance) meter to confirm presence of functionally polarized monolayersprior to the experiment
– TEER [Ω·cm2] = resistance [Ω] x filter surface area [cm2]– varies with cell line, 100-800 Ω·cm2
• Liquid scintillation counter or LC/MS/MS for sample analysis
• Pipettors (manual or automated) for liquid transfers
Materials and Equipment Needed
Cell Lines for P-gp Transport Assays
• Cells used for bi-directional transport studies should form a functionally polarized cell monolayer, complete with tight junctions (verified by pre-experimental TEER of 100-800 Ω·cm2)
• At present, preferred cells lines include– Caco-2 cells
– MDR1 transfected LLC-PK1 cells
– MDR1 transfected MDCK cells
• LLC-PK1 and MDCK wild type cells should be used as negative controls
• Cells should be allowed to grow to confluence (typically 3-7 days for LLC-PK1 or MDCK, 18-21 days for Caco-2, however accelerated 3-5 day Caco-2 models are available and produce similar results)
• A paracellular marker such as [14C] mannitol may be used as an additional integrity marker (typical permeability: < 0.2-2 x 10⁻⁶ cm/sec)

Cell Lines for P-gp Transport Assays
• Caco-2 – Human colon carcinoma cell line– Morphologically similar to small intestinal epithelial cells– Most extensively characterized human cell-based model for investigating
permeability and P-gp transport of drugs– Various uptake and efflux transporters are expressed in Caco-2 cells, however,
P-gp is functionally the most predominant– No wild-type cells to run alongside
• LLC-PK1-MDR1 – Transfected porcine kidney cell line – Low transporter background, especially for P-gp
• MDCK-MDR1– Transfected canine kidney cell line– High background dog P-gp activity
Bi-Directional P-gp Transport Assays
• The transcellular transport assay should be used as a definitive method for identifying P-gp substrates and inhibitors
• Bi-directional transport assays may fail to identify highly permeable compounds as P-gp substrates, howeverfor such compounds, P-gp is not likely to be a significant barrier to cross membranes
• These experiments require the use of known P-gp probe substrates and P-gp inhibitors

• Ideally– Selective for P-gp– Low to moderate passive permeability (2-30x10-6 cm/sec) – May be used as an in vivo P-gp probe substrate (optional) – No significant metabolism of the substrate (optional) – Commercially available (optional)
• Realistically– A P-gp substrate that meets all of the above criteria has not been
identified, due to overlapping substrate selectivity between different transporters as well as transporters and enzymes
– Acceptable P-gp substrates meet the majority of the above mentioned criteria. These P-gp substrates serve as positive controls to ensure the cell systems have functional P-gp expression.
FDA DRAFT Guidance for Industry (Sept 2006)
P-gp Probe Substrate Characteristics

2630Talinolol3> 92-180.004 -10Vinblastine530.05Quinidine
3.42-51-10Loperamide444-140.01-10Digoxin
MDR1-LLCPK1MDR1-MDCKCaco-2Concentration [µM]DrugEfflux Ratio
FDA DRAFT Guidance for Industry (Sept 2006)
• Acceptable P-gp substrates are not limited to compounds listed• Selection of other compounds as probe P-gp substrates may be
appropriate based on scientific justification
Acceptable P-gp Probe Substrates
• Ideally– Selective for P-gp– Inhibit P-gp with low Ki or IC50 values (e.g., IC50 < 10 µM) – No significant metabolism of the inhibitor occurs in the cells (optional) – Commercially available (optional) – May be used as an in vivo P-gp inhibitor (optional)
• Realistically– A P-gp inhibitor that meets all of the above criteria has not been
identified, due to substantial overlap between different transporters (e.g., cyclosporine is also a potent MRP2 and OATP-C inhibitor; quinidine and verapamil also inhibits various organic cation transporters)
– Because of the lack of specificity, the use of multiple inhibitors is recommended to determine whether the efflux activity observed in vitrois related to P-gp
FDA DRAFT Guidance for Industry (Sept 2006)
P-gp Inhibitor Characteristics
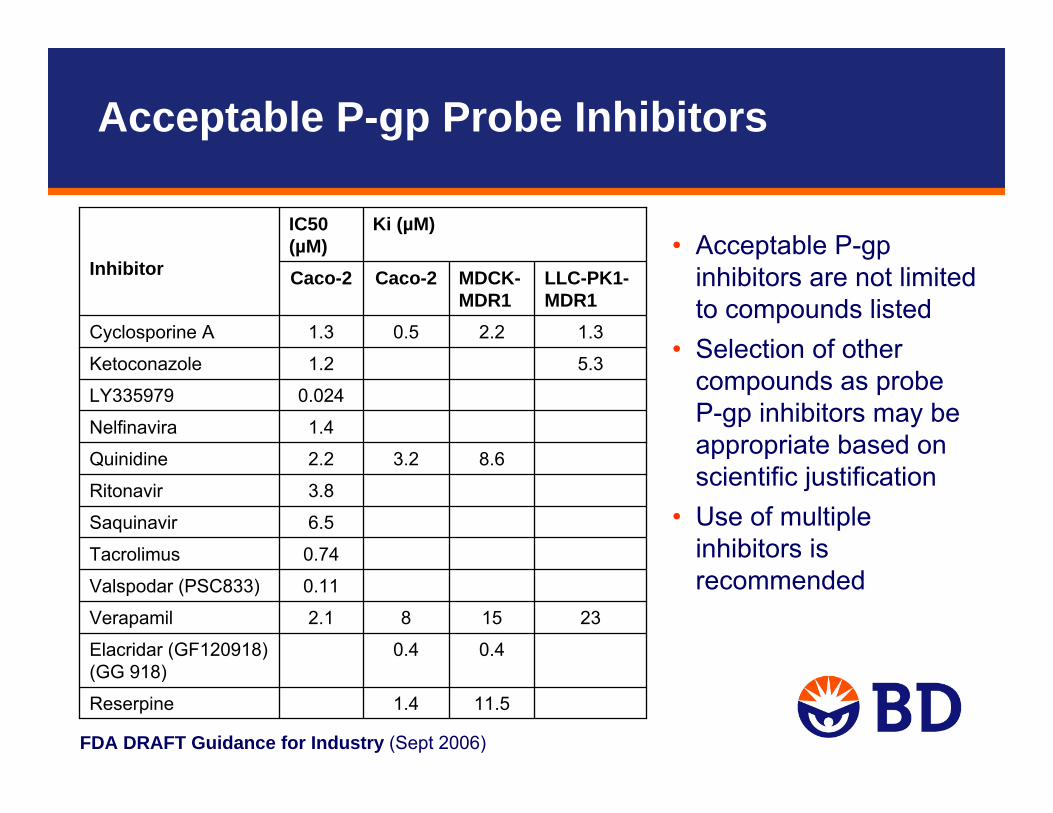
FDA DRAFT Guidance for Industry (Sept 2006)
• Acceptable P-gp inhibitors are not limited to compounds listed
• Selection of other compounds as probeP-gp inhibitors may be appropriate based on scientific justification
• Use of multiple inhibitors is recommended
11.51.4Reserpine
0.40.4Elacridar (GF120918) (GG 918)
231582.1Verapamil
0.11Valspodar (PSC833)
0.74Tacrolimus
6.5Saquinavir
3.8Ritonavir
8.63.22.2Quinidine
1.4Nelfinavira
0.024LY335979
5.31.2Ketoconazole
1.32.20.51.3Cyclosporine A
LLC-PK1-MDR1
MDCK-MDR1
Caco-2Caco-2
Ki (µM)IC50 (µM)
Inhibitor
Acceptable P-gp Probe Inhibitors
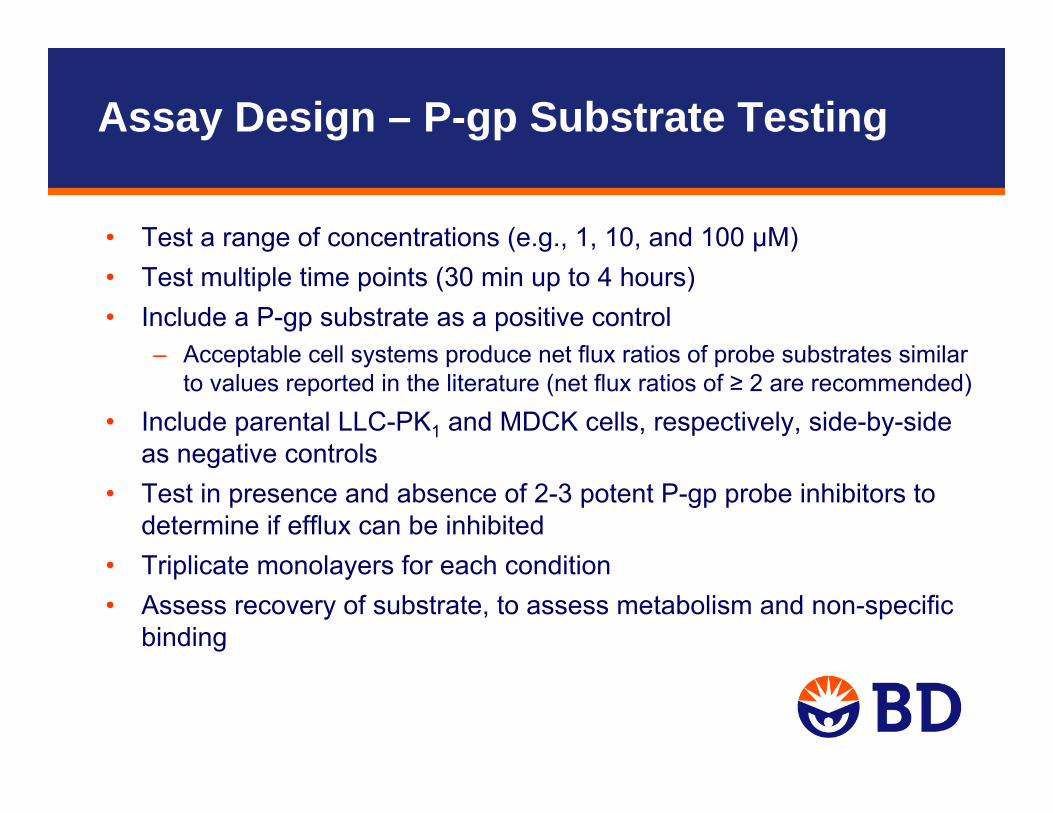
Assay Design – P-gp Substrate Testing
• Test a range of concentrations (e.g., 1, 10, and 100 µM)• Test multiple time points (30 min up to 4 hours)• Include a P-gp substrate as a positive control
– Acceptable cell systems produce net flux ratios of probe substrates similar to values reported in the literature (net flux ratios of ≥ 2 are recommended)
• Include parental LLC-PK1 and MDCK cells, respectively, side-by-side as negative controls
• Test in presence and absence of 2-3 potent P-gp probe inhibitors to determine if efflux can be inhibited
• Triplicate monolayers for each condition• Assess recovery of substrate, to assess metabolism and non-specific
binding
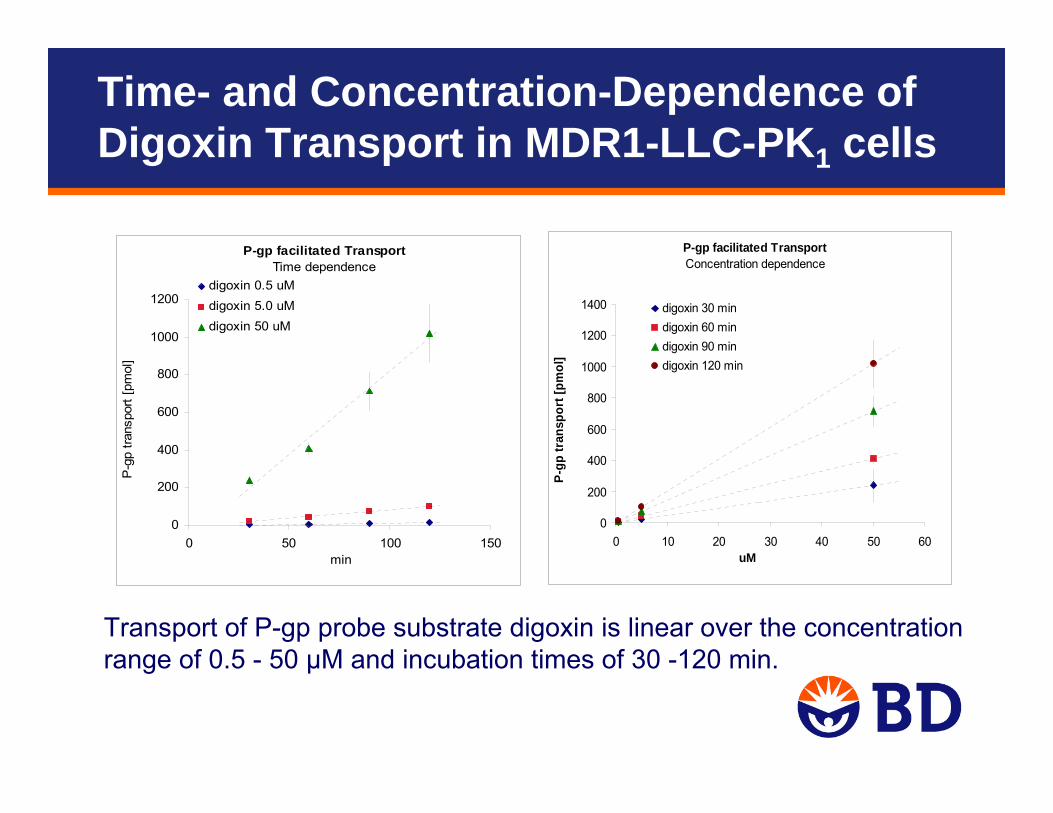
P-gp facilitated TransportTime dependence
0
200
400
600
800
1000
1200
0 50 100 150min
P-g
p tra
nspo
rt [p
mol
]
digoxin 0.5 uMdigoxin 5.0 uMdigoxin 50 uM
P-gp facilitated TransportConcentration dependence
0
200
400
600
800
1000
1200
1400
0 10 20 30 40 50 60uM
P-gp
tran
spor
t [pm
ol]
digoxin 30 mindigoxin 60 mindigoxin 90 mindigoxin 120 min
Transport of P-gp probe substrate digoxin is linear over the concentration range of 0.5 - 50 µM and incubation times of 30 -120 min.
Time- and Concentration-Dependence of Digoxin Transport in MDR1-LLC-PK1 cells
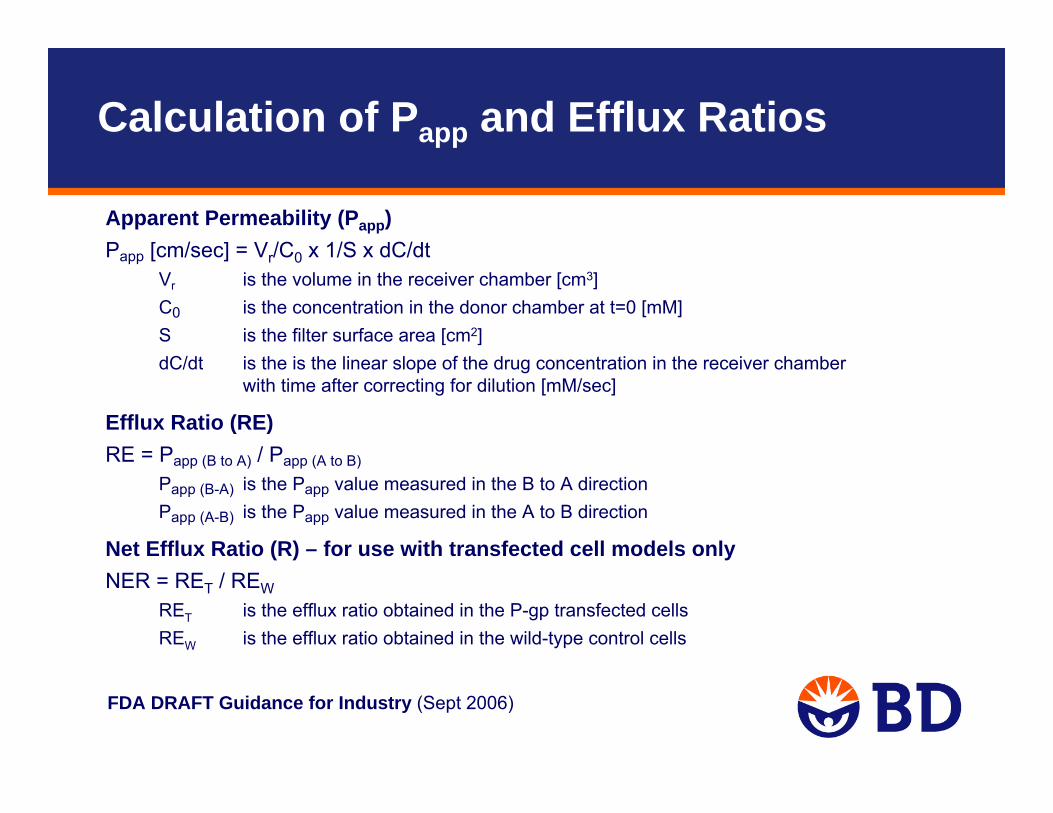
Apparent Permeability (Papp) Papp [cm/sec] = Vr/C0 x 1/S x dC/dt
Vr is the volume in the receiver chamber [cm3]C0 is the concentration in the donor chamber at t=0 [mM]S is the filter surface area [cm2]dC/dt is the is the linear slope of the drug concentration in the receiver chamber
with time after correcting for dilution [mM/sec]
Efflux Ratio (RE) RE = Papp (B to A) / Papp (A to B)
Papp (B-A) is the Papp value measured in the B to A directionPapp (A-B) is the Papp value measured in the A to B direction
Net Efflux Ratio (R) – for use with transfected cell models onlyNER = RET / REW
RET is the efflux ratio obtained in the P-gp transfected cellsREW is the efflux ratio obtained in the wild-type control cells
FDA DRAFT Guidance for Industry (Sept 2006)
Calculation of Papp and Efflux Ratios
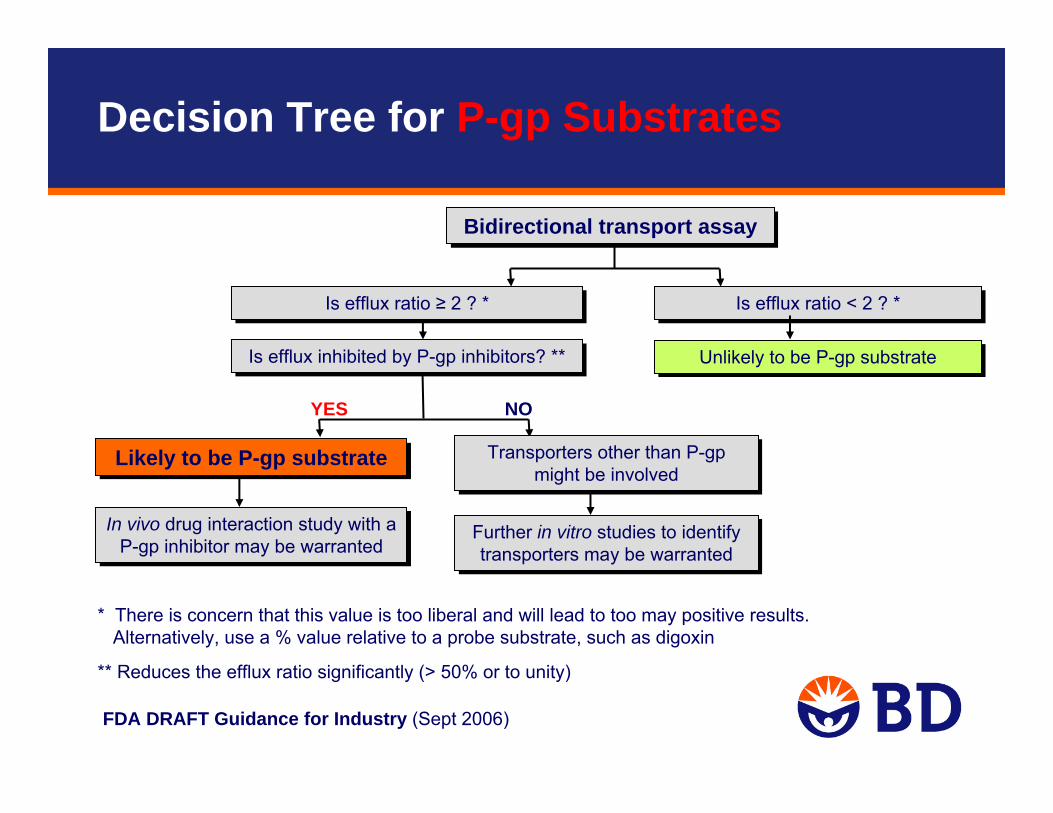
Bidirectional transport assayBidirectional transport assay
In vivo drug interaction study with a P-gp inhibitor may be warranted
In vivo drug interaction study with a P-gp inhibitor may be warranted
Is efflux ratio ≥ 2 ? *Is efflux ratio ≥ 2 ? *
Likely to be P-gp substrateLikely to be P-gp substrate
Unlikely to be P-gp substrateUnlikely to be P-gp substrate
YES NO
Is efflux inhibited by P-gp inhibitors? ** Is efflux inhibited by P-gp inhibitors? **
Is efflux ratio < 2 ? *Is efflux ratio < 2 ? *
Transporters other than P-gp might be involved
Transporters other than P-gp might be involved
Further in vitro studies to identify transporters may be warranted
Further in vitro studies to identify transporters may be warranted
FDA DRAFT Guidance for Industry (Sept 2006)
* There is concern that this value is too liberal and will lead to too may positive results.Alternatively, use a % value relative to a probe substrate, such as digoxin
** Reduces the efflux ratio significantly (> 50% or to unity)
Decision Tree for P-gp Substrates
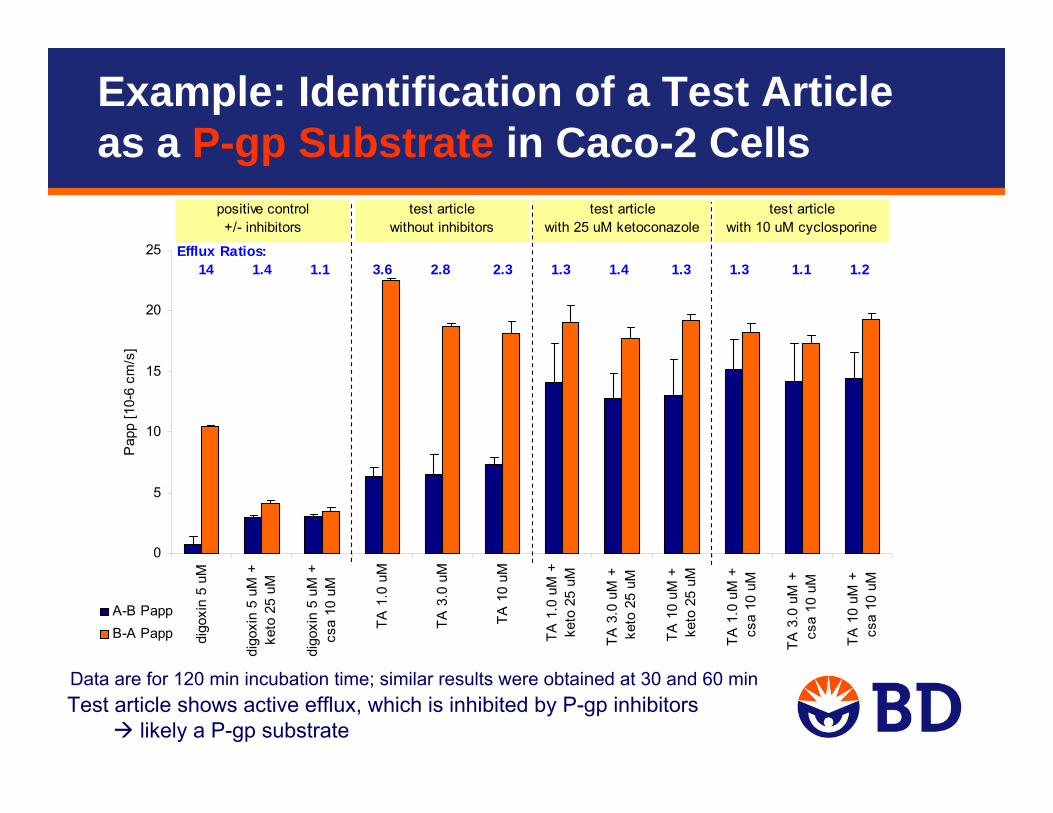
Test article shows active efflux, which is inhibited by P-gp inhibitorslikely a P-gp substrate
Data are for 120 min incubation time; similar results were obtained at 30 and 60 min
0
5
10
15
20
25
digo
xin
5 uM
digo
xin
5 uM
+ke
to 2
5 uM
digo
xin
5 uM
+cs
a 10
uM
TA 1
.0 u
M
TA 3
.0 u
M
TA 1
0 uM
TA 1
.0 u
M +
keto
25
uM
TA 3
.0 u
M +
ke
to 2
5 uM
TA 1
0 uM
+
keto
25
uM
TA 1
.0 u
M +
cs
a 10
uM
TA 3
.0 u
M +
cs
a 10
uM
TA 1
0 uM
+
csa
10 u
M
Pap
p [1
0-6
cm/s
]
A-B PappB-A Papp
positive control+/- inhibitors
test articlewithout inhibitors
test articlewith 25 uM ketoconazole
test articlewith 10 uM cyclosporine
Efflux Ratios: 14 1.4 1.1 3.6 2.8 2.3 1.3 1.4 1.3 1.3 1.1 1.2
Example: Identification of a Test Article as a P-gp Substrate in Caco-2 Cells

Assay Design – P-gp Inhibition Testing
• Use a P-gp probe substrate that has been confirmed as a positive control in the test system– Acceptable cell systems produce net flux ratios of probe substrates
similar to values reported in the literature (net flux ratios of ≥ 2 are recommended)
• Initially, test a high concentration (e.g. >100 µM, solubility permitting) of the compound– If inhibition is observed, follow up with an IC50 determination
• Include parental LLC-PK1 and MDCK cells, respectively, side-by-side as negative controls
• Use 2-3 potent P-gp probe inhibitors as positive controls• Triplicate monolayers for each condition
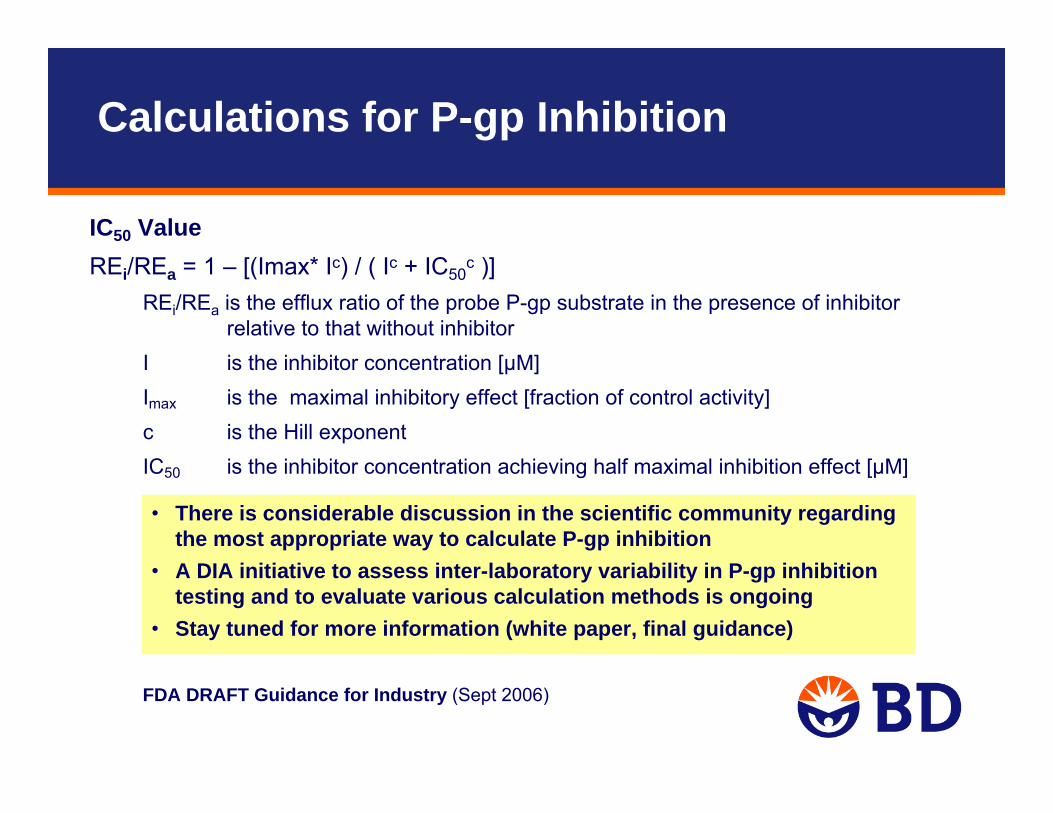
IC50 Value REi/REa = 1 – [(Imax* Ic) / ( Ic + IC50
c )] REi/REa is the efflux ratio of the probe P-gp substrate in the presence of inhibitor
relative to that without inhibitor I is the inhibitor concentration [µM]Imax is the maximal inhibitory effect [fraction of control activity]c is the Hill exponent IC50 is the inhibitor concentration achieving half maximal inhibition effect [µM]
FDA DRAFT Guidance for Industry (Sept 2006)
• There is considerable discussion in the scientific community regardingthe most appropriate way to calculate P-gp inhibition
• A DIA initiative to assess inter-laboratory variability in P-gp inhibitiontesting and to evaluate various calculation methods is ongoing
• Stay tuned for more information (white paper, final guidance)
Calculations for P-gp Inhibition
FDA DRAFT Guidance for Industry (Sept 2006)
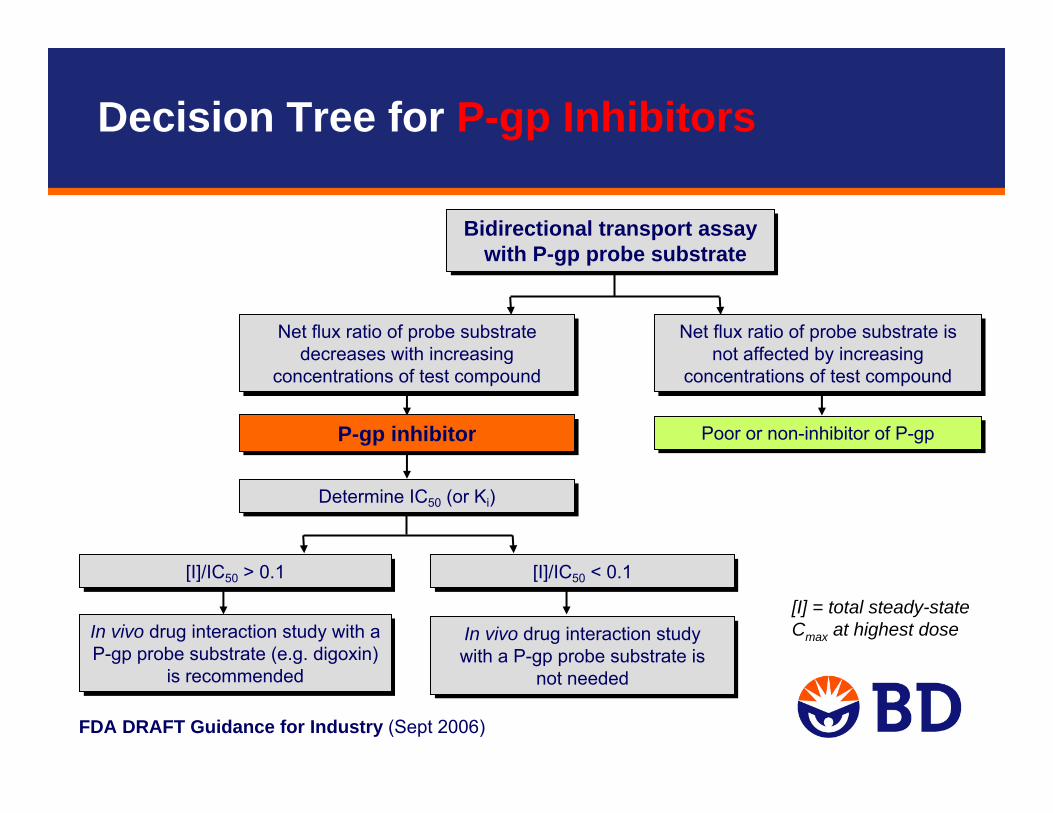
Bidirectional transport assay with P-gp probe substrate
Bidirectional transport assay with P-gp probe substrate
In vivo drug interaction study with a P-gp probe substrate (e.g. digoxin)
is recommended
In vivo drug interaction study with a P-gp probe substrate (e.g. digoxin)
is recommended
Net flux ratio of probe substrate decreases with increasing
concentrations of test compound
Net flux ratio of probe substrate decreases with increasing
concentrations of test compound
[I]/IC50 > 0.1[I]/IC50 > 0.1
Poor or non-inhibitor of P-gpPoor or non-inhibitor of P-gp
Determine IC50 (or Ki) Determine IC50 (or Ki)
Net flux ratio of probe substrate is not affected by increasing
concentrations of test compound
Net flux ratio of probe substrate is not affected by increasing
concentrations of test compound
[I]/IC50 < 0.1[I]/IC50 < 0.1
In vivo drug interaction study with a P-gp probe substrate is
not needed
In vivo drug interaction study with a P-gp probe substrate is
not needed
P-gp inhibitorP-gp inhibitor
[I] = total steady-state Cmax at highest dose
Decision Tree for P-gp Inhibitors
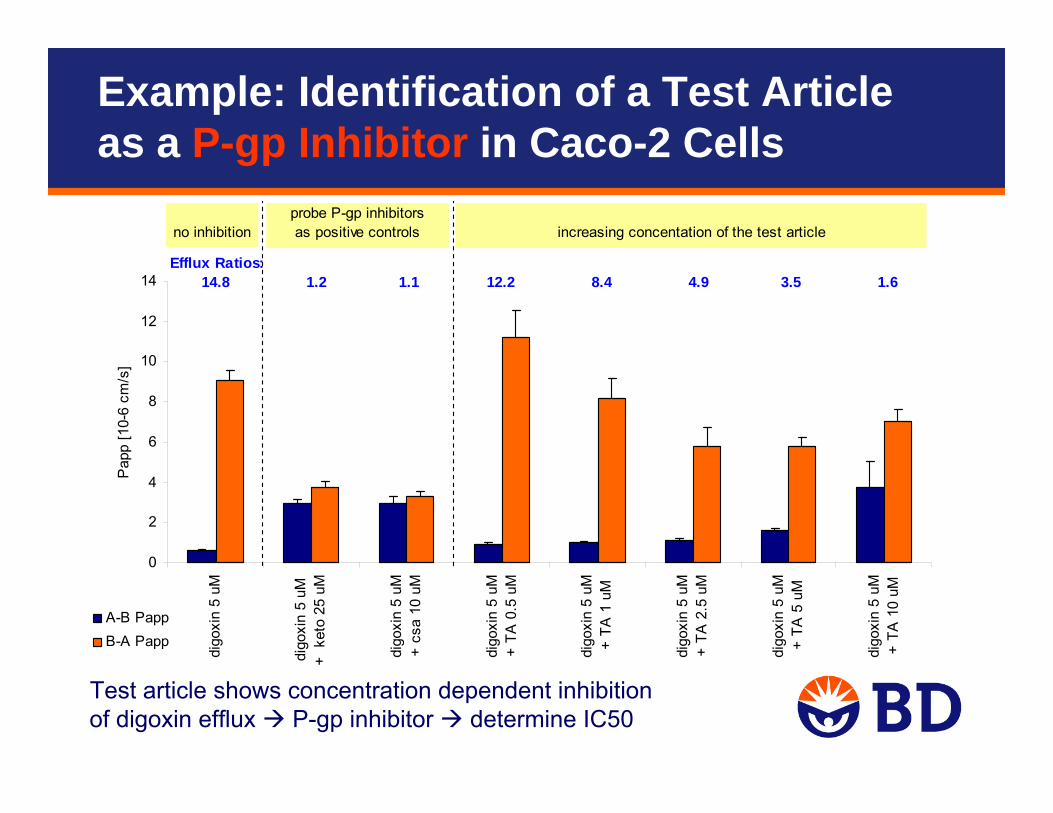
Test article shows concentration dependent inhibition of digoxin efflux P-gp inhibitor determine IC50
0
2
4
6
8
10
12
14
digo
xin
5 uM
digo
xin
5 uM
+ k
eto
25 u
M
digo
xin
5 uM
+ cs
a 10
uM
digo
xin
5 uM
+ TA
0.5
uM
digo
xin
5 uM
+ TA
1 u
M
digo
xin
5 uM
+ TA
2.5
uM
digo
xin
5 uM
+ TA
5 u
M
digo
xin
5 uM
+ TA
10
uM
Pap
p [1
0-6
cm/s
]
A-B PappB-A Papp
no inhibitionprobe P-gp inhibitorsas positive controls increasing concentation of the test article
Efflux Ratios: 14.8 1.2 1.1 12.2 8.4 4.9 3.5 1.6
Example: Identification of a Test Article as a P-gp Inhibitor in Caco-2 Cells
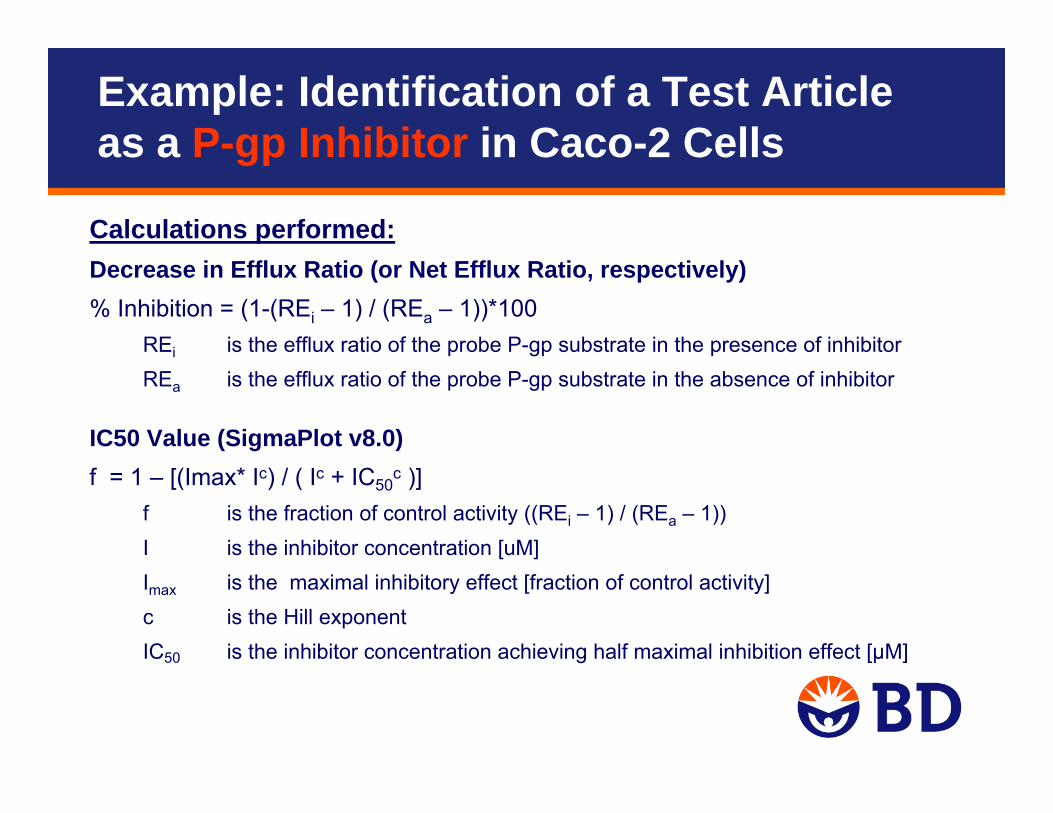
Calculations performed:Decrease in Efflux Ratio (or Net Efflux Ratio, respectively)% Inhibition = (1-(REi – 1) / (REa – 1))*100
REi is the efflux ratio of the probe P-gp substrate in the presence of inhibitorREa is the efflux ratio of the probe P-gp substrate in the absence of inhibitor
IC50 Value (SigmaPlot v8.0)f = 1 – [(Imax* Ic) / ( Ic + IC50
c )] f is the fraction of control activity ((REi – 1) / (REa – 1))I is the inhibitor concentration [uM]Imax is the maximal inhibitory effect [fraction of control activity]c is the Hill exponent IC50 is the inhibitor concentration achieving half maximal inhibition effect [µM]
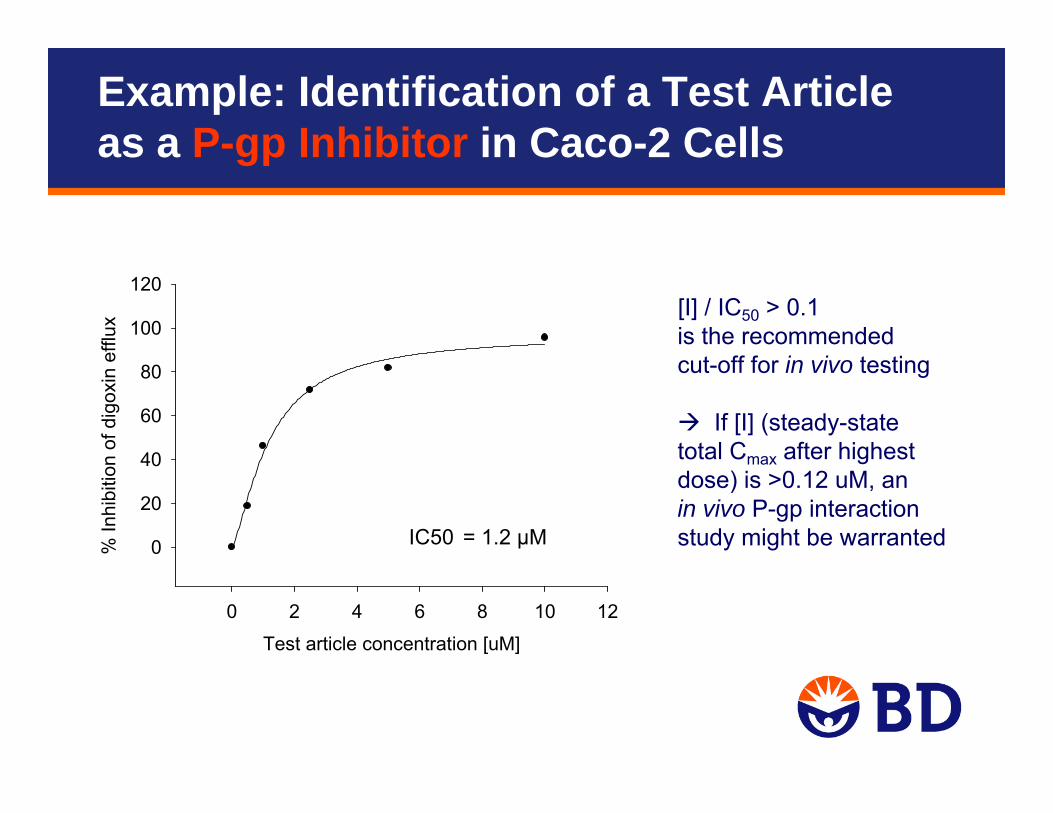
Example: Identification of a Test Article as a P-gp Inhibitor in Caco-2 Cells
Test article concentration [uM]
0 2 4 6 8 10 12
% In
hibi
tion
of d
igox
in e
fflux
0
20
40
60
80
100
120[I] / IC50 > 0.1 is the recommended cut-off for in vivo testing
If [I] (steady-state total Cmax after highest dose) is >0.12 uM, an in vivo P-gp interaction study might be warrantedIC50 = 1.2 µM
Example: Identification of a Test Article as a P-gp Inhibitor in Caco-2 Cells
Ketoconazole [uM]0 20 40 60 80 100 120
% In
hibi
tion
of d
igox
in n
et e
fflux
0
20
40
60
80
100
120
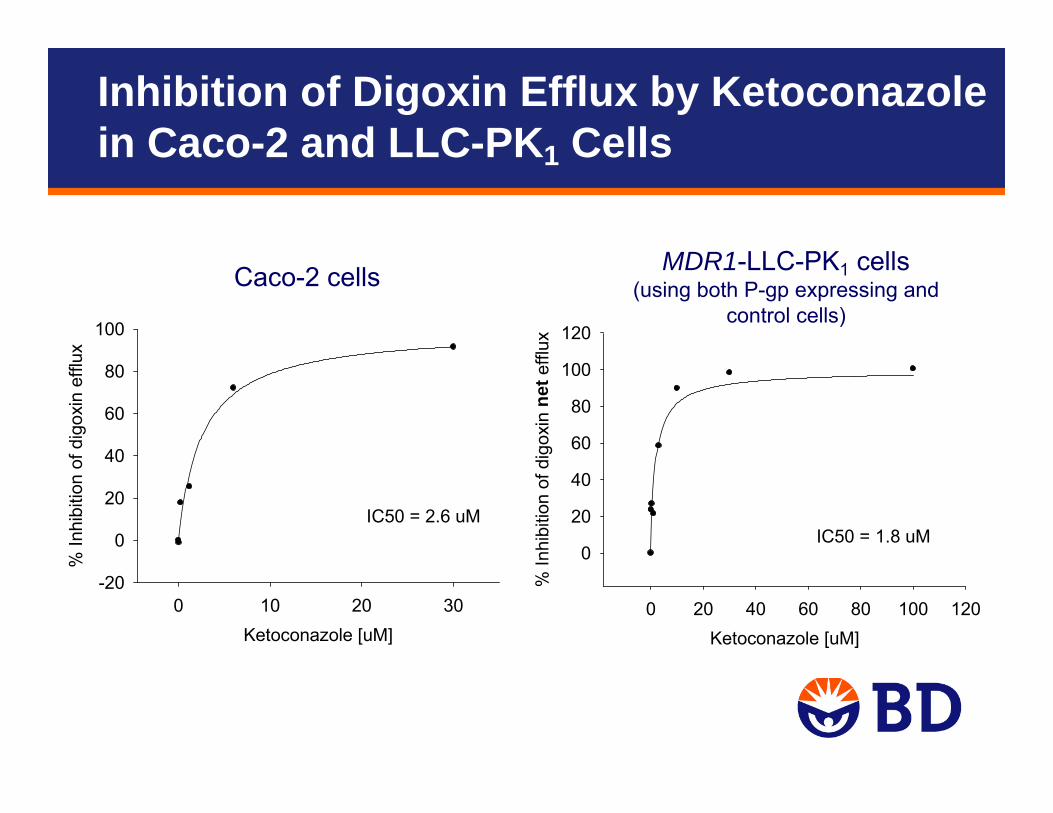
IC50 = 1.8 uM
Ketoconazole [uM]0 10 20 30
% In
hibi
tion
of d
igox
in e
fflux
-20
0
20
40
60
80
100
IC50 = 2.6 uM
Caco-2 cells MDR1-LLC-PK1 cells(using both P-gp expressing and
control cells)
Inhibition of Digoxin Efflux by Ketoconazole in Caco-2 and LLC-PK1 Cells
• Amount of compound recovered in the donor and receiver chambers at the end of the assay relative to the amount added to the donor chamber at t=0
• Low recovery may significantly underestimate Papp values– Always consider recovery when interpreting Papp values and efflux ratios– Typical cut-offs used in the industry are 50-80%, depending on the stage of the
compound in the development process
• Factors contributing to low recovery include:– Non-specific binding to the outside of the cells– Uptake into the cells – Non-specific binding to the plastic plate– Metabolism or non-metabolic instability
• Addition of protein may improve recovery, however, the impact on Papp and efflux ratios is not fully understood
Non-Specific Binding / Recovery
Evaluation of P-gp Induction
• Expression of P-gp is inducible (e.g. by rifampin, hypericin, ritonavir)• Methods for in vitro evaluation of P-gp induction are not well established
– Caco-2 cells are not suitable for P-gp induction testing (lack of PXR expression)– As for CYPs, species differences in inductive response limit the use of animal
models– Models that have been used successfully include:
• Human hepatocytes (mRNA induction)• Human colon adenocarcinoma cells (LS180), and their adriamycin or vinblastine
resistant sublines (mRNA, protein, activity assessment)
• Co-induction of P-gp and CYP3A (both are regulated by PXR)– Because of similar mechanisms of CYP3A and P-gp induction, data on CYP3A
inducibility can inform decisions about P-gp• If no CYP3A induction is observed in vitro,
no further tests of CYP3A and P-gp induction in vivo are necessary• If CYP3A induction is observed in vitro, but not in vivo,
no further tests of P-gp induction in vivo is necessary• If CYP3A induction is observed in vitro and in vivo,
an additional study of the drug’s effect on a P-gp probe substratein vivo is recommended
• Draft guidance has been commented on extensively, especially thetransporter section:http://www.fda.gov/ohrms/dockets/dockets/06d0344/06d0344.htm
• Main issues raised:
– Degree of experimental detail prescribed
– Use of control cells with transfected cell lines
– Efflux ratio >2 as criteria for P-gp substrates
– Method of calculating inhibition and IC50 values
– Trigger for in vivo study and definition of [I]
Comments on Draft Guidance Document
• Our expectations:
– Experimental detail for P-gp interaction testing may come into line with other sections
– Clarification on calculation methods for P-gp inhibition
– More detail around triggers for in vivo studies, and requirements for those
– Number of transporters which require testing expected to increase (e.g. BCRP, BSEP, OAPT2, NTCP)
• Recommendation on experimental systems and probes for transporters other than P-gp
• Decision trees for other transporters
– Standardized language for labeling regarding transporter interactions
Expectations for Future Guidance
• Try to generally follow recommendations in the draft FDA guidance – Until document is final, consider the docket comments
– Use your scientific judgment to decide how to approach controversial issues
– Consider “consensus” documents / White Papers published by representatives from industry and/or government
• In vitro transport studies are not required to be GLP compliant– However, using validated methods and test systems, positive control
tracking processes, SOPs, etc. are good practice
• Use well-accepted reagents from reputable suppliers– Radiochemical purity of probe substrates and test compounds is critical
Recommendations