Embed Size (px)
Citation preview

Strategic Adaptive Management (SAM)
guidelines for effective conservation of freshwater ecosystems

These guidelines were prepared by Richard T. Kingsford and Harry C. Biggs and other members of the Freshwater Task Force of the IUCN World Commission on Protected Areas, freshwater scientists and managers interested in the long-term adequate protection of freshwater protected areas and other freshwater ecosystems.
The original idea for this publication came from a meeting of about twenty ecologists in Skukuza, Kruger National Park, South Africa in 2006. Many of these participants soon formed the membership of the new IUCN WCPA Freshwater Task Force under the IUCN World Commission on Protected Areas. The content was then actively developed by members. Harry Biggs and Richard Kingsford wrote and revised the original document, circulating drafts to members and other peers for review and revision. Although this product emanated from the Task Force and subsequent reviews, any errors, omissions or inappropriate emphases are the responsibility of Richard Kingsford and Harry Biggs.
Much of this material is also part of a peer-reviewed publication: Kingsford, R.T., Biggs, H.C. and Pollard, S.R. (2010). Strategic Adaptive Management in freshwater protected areas and their rivers. Biological Conservation 144, 1194-1203. doi:10.1016/j.biocon.2010.09.022.
We thank Stuart McVicar for designing the publication and James Tremain for his constructive editorial comments. We also thank David Keith, Libby Rumpff, Tony Varcoe and Brian Walker for their helpful comments. We also thank staff from the NSW Office of Environment and Heritage for stimulating input.
Preparation of the guidelines was funded by the Australian Wetlands and Rivers Centre, South African National Parks and Murray-Darling Basin Authority.
Citation: Kingsford, R.T. and Biggs, H.C. (2012). Strategic adaptive management guidelines for effective conservation of freshwater ecosystems in and around protected areas of the world. IUCN WCPA Freshwater Taskforce, Australian Wetlands and Rivers Centre, Sydney.
ISBN 978-0-7334-3061-9
Cover photograph: Sabie River, Kruger National Park, South Africa (Photo. R.T. Kingsford)
Goal 1: Expand practical contributions which support application of IUCN freshwater Protected Area guidelines (e.g. annotated bibliography and other guidelines).Goal 2: Support programme of work on Biological Diversity of Inland Water Ecosystems under the Convention on Biological Diversity (CBD), recognising the role of the Ramsar Bureau. This includes recommendations in the face of climate change, promoting appreciation of environmental flows by Protected Area communities, and identification and designation of a representative network of Protected Areas, including their freshwater components.Goal 3: Endorse and promote the Global Freshwater Conservation Assessment Project led by the Freshwater Working Group (FWWG) of the Society for Conservation Biology.Goal 4: Promote integration of information with respect to freshwater components of Protected Areas.
This includes working towards mapping of wetlands at different scales, and towards comprehensive Wiki-type catchment-scale information layers. Goal 5: Remain involved with ongoing development of adaptive management and adaptive governance guidelines as released (e.g. CBD, Australian Wetlands and Rivers Centre, Sydney).Goal 6: Produce guidelines and publications promoting connectivity in freshwater systems.Goal 7: Promote increasingly representative and effective collaboration between people involved in management and policy of freshwater Protected Areas.Goal 8: Distribute outputs from the Taskforce effectively within IUCN and more broadly.Goal 9: Function as emergent expert/specialist panel on freshwater problems and solutions.
Goals of IUCN WCPA Freshwater Task Force

Guidelines for effective conservation of
freshwater ecosystems
3
Introduction . . . . . . . . . . . . . . . . . . . . . . . . . . . . . . . . . . . . . . . . . . . . . . . . . . . . 5
What is Strategic Adaptive Management? . . . . . . . . . . . . . . . . . . . . . . . . . . . . . . . . 9
How to implement the Strategic Adaptive Management framework . . . . . . . . . . . . . 15
Context . . . . . . . . . . . . . . . . . . . . . . . . . . . . . . . . . . . . . . . . . . . . . . . . . 15
Engagement . . . . . . . . . . . . . . . . . . . . . . . . . . . . . . . . . . . . . . . . . . . . . . . 18
Implementation detail . . . . . . . . . . . . . . . . . . . . . . . . . . . . . . . . . . . . . . . . . . . . 21
Step 1. Setting the desired future ecological condition . . . . . . . . . . . . . . . . . . 21
Step 2 - Management options . . . . . . . . . . . . . . . . . . . . . . . . . . . . . . . . . . . 27
Step 3 - Operationalisation . . . . . . . . . . . . . . . . . . . . . . . . . . . . . . . . . . . . 31
Step 4 - Evaluation and learning . . . . . . . . . . . . . . . . . . . . . . . . . . . . . . . . . 36
Documentation . . . . . . . . . . . . . . . . . . . . . . . . . . . . . . . . . . . . . . . . . . . . . . . . . 39
Conclusions . . . . . . . . . . . . . . . . . . . . . . . . . . . . . . . . . . . . . . . . . . . . . . . . . . . 41
References . . . . . . . . . . . . . . . . . . . . . . . . . . . . . . . . . . . . . . . . . . . . . . . . . . . . 42
Further reading on adaptive management . . . . . . . . . . . . . . . . . . . . . . . . . . . . . . . 43
Contents
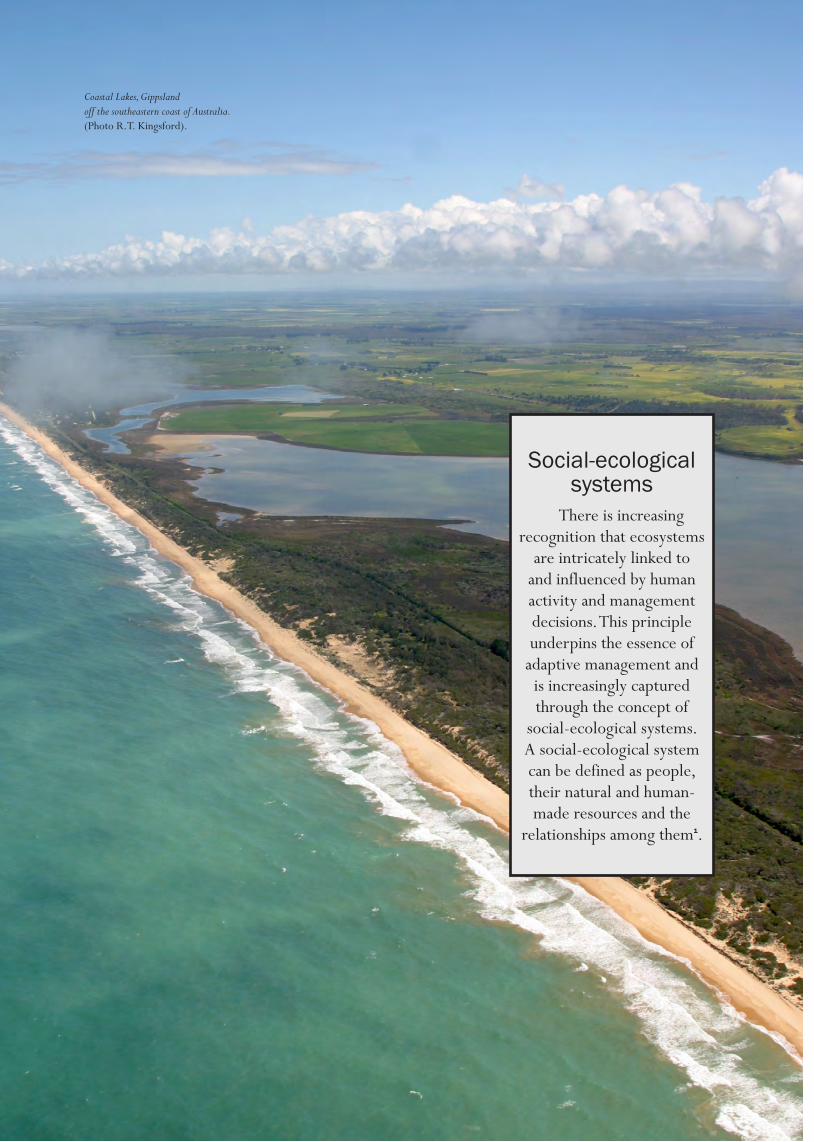
Coastal Lakes, Gippsland off the southeastern coast of Australia. (Photo R.T. Kingsford).
Social-ecological systems
There is increasing recognition that ecosystems
are intricately linked to and influenced by human activity and management decisions. This principle underpins the essence of
adaptive management and is increasingly captured through the concept of
social-ecological systems. A social-ecological system can be defined as people, their natural and human-made resources and the
relationships among them1.

Guidelines for effective conservation of
freshwater ecosystems
5
Much of the world’s biodiversity, including genes, species, populations and ecosystems, is in decline because of habitat loss and degradation, invasive species, pollution, overharvesting and climate change. Conservation of biodiversity is a key goal for the world’s ecosystems but one that is increasingly difficult to achieve because of the many interacting threats. Of all the biomes, freshwater ecosystems, including inland saline and estuarine, are under the most degradation pressure, mainly through river regulation, invasive species, pollution and climate change.
One of the more effective means of conserving biodiversity is to establish reserves where many threatening activities are not permitted. This can be combined with mitigation of key threats within and outside reserves. Most countries adopt this broad approach in their commitment to conservation2-5, to mitigate ongoing loss of biodiversity and degradation of ecosystems. The 187 nations who are signatories to the Seventh Conference of Parties (COP7) of the Convention on Biological Diversity committed to designating a minimum of 10% of their lands and waters to protected area status5. More recently, there was recognition that biodiversity strategic plans should conserve 17% of areas by 20106. Many of the Earth’s 100,000 or so protected areas (12% of land surface)7 include freshwater ecosystems, sometimes the main focus of reservation.
Freshwater ecosystems depend on processes (e.g. flow, sediment regimes) that have many interactions, many of which are only partly predictable, with mediation over considerable distances (i.e. length of a river system, >1,000km). Technically this type of system, with all its feedbacks, is known as ‘complex’. There is a clear conservation responsibility to manage freshwater systems but this is difficult because water
resources are often affected by threats outside the boundaries of the protected area. Management tends to be ad hoc and lack transparency, with little demonstration of effectiveness. Instead, it should be reflective, transparent and accountable.
This publication lays out the basic steps required by a catchment or protected area manager to begin the Strategic Adaptive Management (SAM) process. We provide the series of steps to help deal with the complex task facing the freshwater manager. The publication does not explore in any detail the associated importance of governance, relying on the manager on the ground to develop an initial understanding and practice of adaptive processes, rather than relying predominantly on, or waiting for, say seniors and others to act. Although governance processes are highly desirable, they more easily come with opportunity, time and experience and when the value of SAM is already partly demonstrated.
SAM offers considerable promise as an effective, rigorous framework for managing reserves, or even whole river catchments, for biodiversity conservation (Fig. 1). There is growing scientific and practical support for such an approach. It should help managers compile the key management information and processes for long-term conservation of aquatic reserves, and implement a robust management cycle. The amount of detail will depend on the resources available but these guidelines can be implemented on any freshwater protected area, whatever resources are available. There is considerable opportunity to use the approach at different spatial scales: local wetland, system to even basin or landscape scale. The journey should begin as soon as possible (Fig. 1) and will be an informative and rigorous basis for management. Even a simple compilation will guide management and progress transparency and promote rigour.
Introduction
Strategic Adaptive Management
6
The stimulus for this guide came from within the protected area management community (e.g., national parks, conservation management areas, world heritage areas) but it can be applied directly to any catchment, even those with limited or even no protected areas. The guide provides a framework for managing the maintenance of flow regimes and water quality to support healthy ecosystem services desired by stakeholders. The approach follows a structured path adapted for any reserve, whatever the configuration, threat or resources available. We have developed these guidelines to help managers and policy makers operating in heterogeneous land-use mosaics that are heavily influenced by a fast-changing world and complex ecosystem dynamics8-10, including adaptation to climate change. The lessons contained here should also help managers charged with the management of environmental flows, which are increasingly important for degraded river systems11, but also managers of free-flowing rivers whose flow regimes remain largely intact.
Why do we need Strategic Adaptive Management?
As focus on conservation of aquatic ecosystems has grown, including through protected area networks and environmental flow management, so too has the
realisation that these conservation measures may not effectively maintain and protect the array of biodiversity that they were designed to conserve12.This is largely because of uncertainty about the most effective way to manage these ecosystems. Managing freshwater ecosystems successfully for conservation in a catchment is challenging9, given that the control or influence of the supply of water and its quality is critical. Aquatic freshwater reserves depend on water, the volume and quality of which often depends on processes outside the boundaries of the protected area (Figs 2 and 3). This means management must be directed as much on processes outside as within the boundaries of the protected area. In addition, increasing effects of climate change exacerbate this problem for biodiversity13, with rapid rates of change requiring increased focus on climate adaptation. Effective protection demands a holistic approach to the management of entire aquatic ecosystems - from a basin, catchment or watershed perspective - because most species living in rivers, lakes and wetlands depend on flow, temperature, sediment and nutrient regimes that originate or operate at the scale of the entire river. For example many freshwater organisms live their lives through long distance connections within a river.
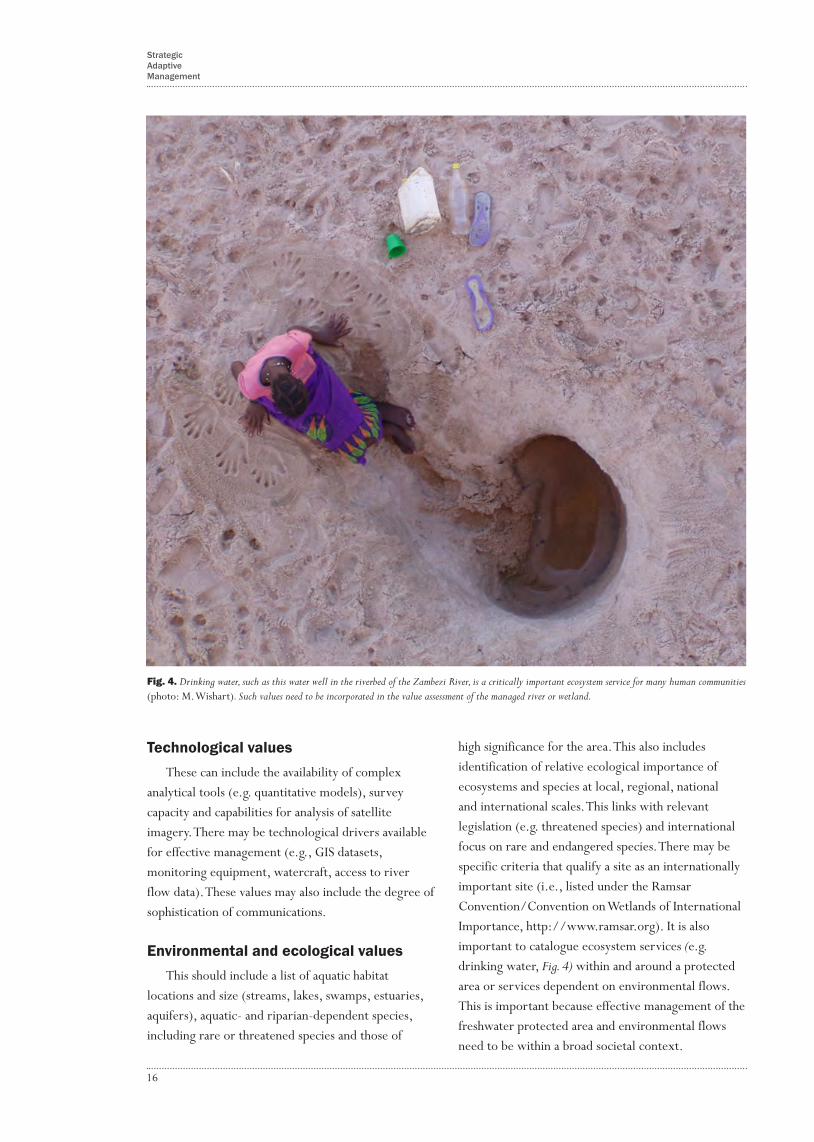
Fig. 1. This diagram shows the main elements of these guidelines and the structure of this document, from why implementation is necessary, what constitutes Strategic Adaptive Management and how it can be implemented. The process can be started immediately (when) and followed, before refining iteratively over time.
When?
Why? What? How?
Loss of biodiversity & degraded ecosystems
Scale (spatial & temporal)
Strategic Adaptive
Management
Immediately. Follow steps and refine -
never take a short-term view
Managing complexity
Conservation responsibility
Desired condition
Managementoptions Operationalisation Evaluation
F e e d b a c k & l e a r n i n g

Guidelines for effective conservation of
freshwater ecosystems
7
Existing management of freshwater protected areas can simply adopt a laissez faire approach, allowing the system to manage itself, but this is often failing in the increasing number of altered systems that have to be managed. There is a common assumption that once a protected area is set aside or an environmental flow specified to be managed for conservation, it will look after itself. However, as we are often seeking to conserve or restore altered ecosystems, this past assumption has failed to achieve the goal of biodiversity conservation. An adaptive management approach provides a structured and logical process to test a range of management interventions. Also, unfortunately, most current management of freshwater ecosystems focuses on threats within protected borders. This emphasis, often due to existing management and political constraints, requires redirection to an approach where ecosystem managers are clear about their priority ecological assets and processes and their threats. Also, effectiveness of management in achieving biodiversity conservation, often a primary objective, is seldom defined and measured. This is a problem given high uncertainty about the best management options. To improve management decisions, we need to resolve this uncertainty by testing management options, monitoring and evaluation (i.e. learning).There is a fundamental need to link management of threats to achieving biodiversity conservation through a rigorous management framework. Such a system needs to be cognisant of the complexity of constantly changing ecosystems, where uncertainty is inevitable. Management needs to embrace this complexity but also commit to ‘learning by doing’14. Adaptive Management is often coined as ‘learning by doing’, which is the process of resolving uncertainty in management through monitoring, while implementing (or doing) management. The aim is to make better management decisions.
Freshwater management needs to recognise the existence of dual (and often competing) social and biological objectives. Management plans thus need to treat the protected area or environmental flow management as a social-ecological system by attempting to understand the relationships between social, biotic and abiotic drivers (see Fig. 3). There is also increasing demand from the public and government to demonstrate the cost-effectiveness of management15. This usually takes place against a reality of (financial)
constraints and physical and social change in landscapes and society. Increasingly, governments are investing in the improved management, sometimes even direct purchase, of water for environmental flows for protected areas. Accountability for this water becomes critical, as does the ability to demonstrate that it is delivering outcomes.
Given this context, most protected area managers or catchment management organisations find freshwater challenges difficult or even insurmountable. A more targeted and comprehensive approach is needed to allow those managers to frame the responsibilities and challenges within this large context. A Strategic Adaptive Management (SAM) framework can improve freshwater, indeed all conservation, within and around protected areas. It can highlight gaps in management and guide actions and strategies to achieve goals. While SAM may be daunting, the uncertainty and challenge keep offering opportunities for influence and progress. The adaptive manager should never be overwhelmed by such a system, but rather develop a flair for navigating the complexity constructively. It is better to chart a course of structured learning to resolve uncertainty in management decisions than simply practice ad hoc management.
Fig. 2. Schematic of a river and its landscape components within a catchment or watershed (dashed line) showing a protected area that includes aquatic areas (shaded) and terrestrial areas (clear). This protected area may often be near the estuary. We specifically include all categories of protected area in our consideration of management (e.g. national parks, conservation areas, wilderness areas, protected management areas, nature reserves).
River channel
Floodplain
Lake or swamp
Estuary
Sea
Protected Area

Tributary of the Snowy River in Australia’s Snowy Mountains, flowing into a storage. (Photo R.T. Kingsford).

Guidelines for effective conservation of
freshwater ecosystems
9
Strategic Adaptive Management (SAM) is a process that recognises the inherent uncertainties of dynamic and unpredictable ecosystems but tests these uncertainties, progressively improving management. SAM brings together the disciplines of management and decision science so that management interventions are designed to elicit scientifically measurable results that are analysed to inform future management decisions. SAM acknowledges that many factors influence the condition of an ecosystem outside the manager’s jurisdiction, requiring a broad, holistic or strategic approach. SAM is a rigorous step-by-step process that defines the desired condition (i.e. objective/goal) of the protected area and develops management options that are then implemented and evaluated in relation to progress toward that goal (Fig. 1). It provides an improved opportunity to define and attain goals for freshwater ecosystems in and around protected areas around the world, following the International Union for the Conservation of Nature (IUCN) generic process for assessing management effectiveness of protected areas16. SAM was pioneered on South African river systems. While the genesis of this adaptive management framework was aquatic, it has been successfully applied to terrestrial ecosystems and species management8,9, exemplified in the plan for Kruger National Park17. It requires active consideration of the temporal and spatial scale of management (Fig. 1), ultimately determined by the factors requiring management influence. Similar logical steps are embraced through the development of the Open Source Standards for the Practice of Conservation (www.
conservationmeasures.org), increasingly adopted by non-government conservation (e.g., The Nature Conservancy, U.S Fish and Wildlife, Bush Heritage Australia) and government organisations.
SAM needs to be recorded as a series of four steps that will ultimately form a plan for the protected area or river system in question: setting the ‘desired future condition’; identifying management options; operationalising these (doing the management) and evaluation and learning.
Often a SAM process will need to have a catchment focus to reflect the many influences on the desired ecological outcomes of a protected area or environmental flow management. It may begin with a broad conceptual plan within a formal document with high-level objectives, supported by detailed operational plans. To start, managers must define the parts of the landscape or river basin that will form the basis for the SAM planning (Fig. 2). Often freshwater ecosystems that are protected areas or targets for environmental flows form a part of a river or wetland ecosystem (Fig. 2), usually with the inclusion of terrestrial and riparian regions. We include all categories of freshwater
aquatic ecoystems (i.e. national parks, conservation areas, wilderness areas, protected management areas, nature reserves) and environmental flows mentioned in this guide that are managed for conservation.
Hydrologic regimes, energy dynamics, water chemistry, physical habitat, biotic interactions and connectivity are key themes that must be addressed when seeking to conserve freshwater ecosystems values and
What is Strategic Adaptive
Management?
Freshwater features we
aim to conserve are invariably part of a large landscape and are dependent
on water and processes from outside
park boundaries (see Fig. 2).

Strategic Adaptive Management
10
The Macquarie Marshes in the Murray-Darling Basin of southeastern Australia have only about 10% of their area protected in a nature reserve but all of the area is highly dependent on river flows from upstream which are affected by the building of dams and diversion of water. (Photo. R.T. Kingsford).
Strategic Adaptive
Management (SAM) is a
good method for framing the responsibilities and challenges for managing
these landscapes
(see Fig. 7).

Guidelines for effective conservation of
freshwater ecosystems
11
Fig. 3. A broad understanding is important of the interactions among the chemical, physical and biological components and processes of a protected area or other freshwater ecosystem, with some examples of different attributes that may be particularly relevant to such a reserve or environmental flows Note that this complexity is only part of the even wider complexity the manager must handle, including the social and economic domains, which are shown here but not unpacked.
e.g.Water qualityNutrient levelSoil characteristicsCarbonNitrogen...
Chemicale.g.HydrologyGeomorphologyFireInundationClimateGeomorphologySedimentationConnectivity...
Physical
e.g.WaterbirdsInvertebratesFishVegetationBiotic interactionsFood webRecruitment...
Biological
Biophysical
Social
Economic
processes, preferably by developing an understanding of the way a system works (Fig. 3). These processes must be considered within the context of the entire basin and by definition, within SAM. It may be that jurisdiction is limited to the aquatic protected area or managing an environmental flow but the landscape, including dependencies on water and catchment processes, need to be incorporated. There are also many social and legal constraints and opportunities for management of freshwater protected areas and environmental flows.
The SAM framework is sufficiently generic to deal with terrestrial, freshwater, estuarine and marine protected areas, or combinations of these, as well as providing opportunity for management of environmental flows. SAM provides a clear method for more effective conservation management (Fig. 1). It sounds intuitively appealing and logical, and is sometimes effectively practised by certain flexible individuals who can afford to operate in relative isolation when making decisions about small systems that are not usually subject to

Strategic Adaptive Management
12
external drivers beyond their control (e.g. some hunter-gatherers and some farmers)8,9. Such systems tend to be highly dependent on the knowledge of key individuals; this knowledge can be easily lost if not passed on. The strongest argument for adopting a structured approach is to make sound management decisions, informed by objectivity and evidence (including local knowledge), rather than old assumptions, opinion or history, given limited resources.
Difficulty arises during implementation of adaptive management in big agencies and/or across large heterogeneous stretches, such as freshwater ecosystems supplied by rivers, yet it is exactly these settings where most gains are required and possible. The challenges relate to maintaining sufficient flexibility in spite of the rigid protocols that tend to evolve, ensuring buy-in and co-learning, and managing the inevitable power shifts that arise as the system changes. As a result, adaptive management in the activities of agencies is seldom effective. It is often espoused but not realised. The process seems simple and intuitive, but often requires years to master. Adept practitioners may contend that on the surface it can appear to be little different from traditional management approaches.
However, at a deeper level it is clearly novel and provides records of management, transparency and the chance for the continuous learning needed to navigate changing systems.
A common concern is the potential resourcing of SAM (see Box 1) but it is important to start and adjust the management to the resources available. It may not be possible to afford comprehensive science-based adaptive management everywhere. One way is to adopt a two-tiered approach. For the sub-set of management issues and sites with highest ecological or social risk, there is implementation of
‘active’ adaptive management with rigorous design, monitoring and analysis. To ensure this happens immediately for sites or issues (e.g. environmental flows) of high risk, SAM is adopted with systematic qualitative evaluation unless or until resources are available for quantitative analyses. It needs to take into account the key management principles for connectedness of freshwater ecosystems (see Box 2). Indeed, sites or themes judged as less at risk might even prove adequately covered by less costly or even less rigorous techniques, while always using the same broad principles.
The complex range of
stakeholders and their demands,
and the multiple spatial and temporal
scales involved in seeing the challenges realistically,
provide serious challenges and
exceptional opportunities.
Remember to adjust the level of detail of implementation of each part of this generic framework appropriately (Fig. 1), taking into account data availability and resources. As the manager feels their way through the beginning, they may choose to run a lengthy, comprehensive exercise, an intermediate one, or simply an initial short effective process with limited resources. It is far better to adopt the
latter approach than do nothing. Do not wait long to begin. The second iteration can always be done in more detail built on the strengths and experiences of the first prototype. Whatever level is chosen, it is important not to rush through by skipping any steps. It is equally important to start as soon as possible. It is feasible, rewarding and transparent, and the manager will learn with each repeat cycle.
Degree of managementBox 1

Guidelines for effective conservation of
freshwater ecosystems
13
• Rainfall, geomorphology and evapotranspiration influence the hydrologic cycle in a soil-plant-atmosphere continuum, producing the dominant features of aquatic ecosystems.
• Rivers are predominantly linear features with longitudinal, lateral (e.g. floodplains and wetlands) and vertical connections (groundwater), thus forming three-dimensional linkages across the landscape.
• Continental waters are linked via estuaries and coastlines to marine systems, forming an integrated system which should be viewed holistically.
• The drainage network, watershed or catchment integrates the terrestrial landscape through overland flow and sediment movement. Many terrestrial systems could equally be described as a matrix between lakes and the perennial, seasonal and ephemeral flow channels.
• Groundwater is inextricably linked to surface systems, with several ecosystems directly or indirectly dependent on aquifers.
• Wetlands (marshes, swamps, floodplains) provide ecosystem functions such as sediment trapping, slow release of flows and nutrient buffering, as well as habitat for many dependent biota.
• Rivers, wetlands, drainage channels and riparian areas make up and underlie the bulk of biodiversity in many protected areas, although this is not widely recognised.
• Freshwater and terrestrial biodiversity depend on the complex interactions of biological, chemical and physical processes at different temporal and spatial scales.
• Freshwater ecosystems are affected by everything that occurs within their catchments, so all activities beneficial and detrimental ultimately impact on freshwater environments.
• Freshwater ecology is severely affected by changes to connectivity caused by fragmentation (dams, abstraction, structures on the floodplain or river) or artificial hyper-connectivity (e.g. canalisation, inter-basin transfers can remove natural barriers, affecting endemism).
• Freshwater areas can also be severely affected by pollution carried from areas outside the protected area (e.g. from mining).
• Environmental flow management is increasingly important for rehabilitating connectivity of degraded freshwater ecosystems.
Management-relevant principles for connectedness of freshwater ecosystems
Box 2

Rivers and floodplains in the Pantanal in Brazil make up one of the world’s most important wetland systems (Photo. R.T. Kingsford)

Guidelines for effective conservation of
freshwater ecosystems
15
To begin with, there are two key processes influencing the four generic steps of SAM: determination of context and engagement (Fig. 7). The generic framework has four major steps (Fig. 7) that cover general adaptive management schemas: adaptive governance (not explicitly dealt with here, except briefly), adaptive planning (Step 1, four interrelated sub-steps (a-d)), adaptive management (Steps 2-3), and adaptive evaluation (Step 4) (Fig. 7). Then throughout, there are feedbacks, iterative planning and evaluation which are essential for successful implementation.
ContextAt the beginning, it is
important to set the context and define the degree of management (Box 1). This encompasses the spatial and temporal scales of responsibility for management.
The context allows the value setting to proceed with all available information for the system. It progresses through a process of outlining social values of stakeholders. For example, there may be two main stakeholder groups, an irrigation lobby transforming land use through their utilitarian values and a recreational lobby influenced by environmental values wanting nature-based tourism in a relatively untransformed system. There may also be a critical resource for the community such as drinking water (Fig. 4). Such key values are essential for effective management
planning and form the foundation of mental models influencing outcomes. They will invariably reflect underlying societal or organisational values. Values should be recognised for organisations, including the values underlying their planning and implementation. This provides the basis or rationale for the adaptive management process. This process can be achieved by identifying social, technological, environmental and ecological, economic, socio-economic values and
political values (V-STEEP, Fig. 7).
Social valuesRecognise the cultural values
(e.g., use of particular pools for baptism, a riparian forest where spirits of forefathers reside, sites of spiritual importance, or historical and contemporary places important to society). Social values are underlain by various beliefs that should be acknowledged and considered. This may also include recognition of the values necessary for SAM, including managing for complexity (multiple drivers, feedbacks, and surprises); custodianship; sustainability and resilience (rather than maximising productivity or profit); integrity;
intergenerational equity; learning (designing everything one does to promote responsible ongoing learning); modesty (admitting we do not know all the answers, but being enthusiastic about permanently working towards them) and; adopting a proactive rather than reactive approach.
How to implement the SAM framework
Context is all important. An excellent way to improve the chance
that stakeholders have a satisfactory joint
picture of the context is to use the acronym
V-STEEP (values - social, technological, environmental and
ecological, economic and political, see Fig. 7)19. Different values, such as water access, can be
incorporated.
Strategic Adaptive Management
16
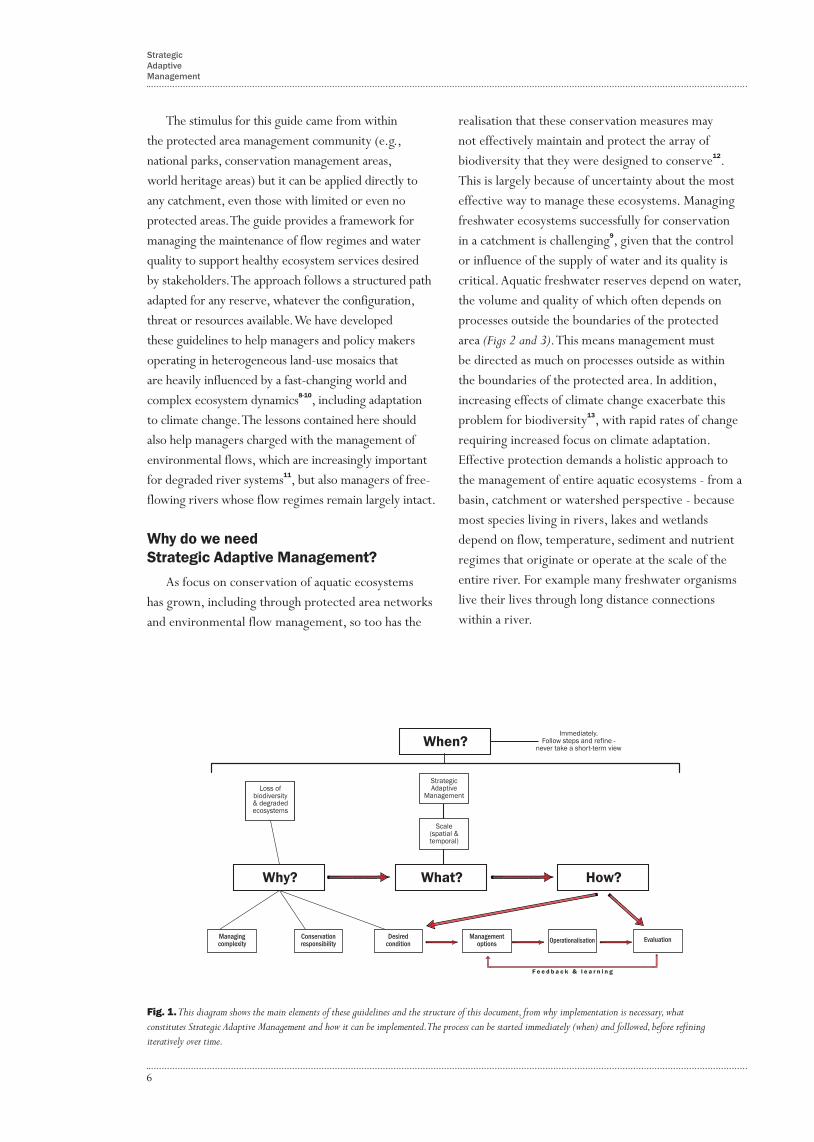
Fig. 4. Drinking water, such as this water well in the riverbed of the Zambezi River, is a critically important ecosystem service for many human communities (photo: M. Wishart). Such values need to be incorporated in the value assessment of the managed river or wetland.
Technological valuesThese can include the availability of complex
analytical tools (e.g. quantitative models), survey capacity and capabilities for analysis of satellite imagery. There may be technological drivers available for effective management (e.g., GIS datasets, monitoring equipment, watercraft, access to river flow data). These values may also include the degree of sophistication of communications.
Environmental and ecological valuesThis should include a list of aquatic habitat
locations and size (streams, lakes, swamps, estuaries, aquifers), aquatic- and riparian-dependent species, including rare or threatened species and those of
high significance for the area. This also includes identification of relative ecological importance of ecosystems and species at local, regional, national and international scales. This links with relevant legislation (e.g. threatened species) and international focus on rare and endangered species. There may be specific criteria that qualify a site as an internationally important site (i.e., listed under the Ramsar Convention/Convention on Wetlands of International Importance, http://www.ramsar.org). It is also important to catalogue ecosystem services (e.g. drinking water, Fig. 4) within and around a protected area or services dependent on environmental flows. This is important because effective management of the freshwater protected area and environmental flows need to be within a broad societal context.

Guidelines for effective conservation of
freshwater ecosystems
17
Economic valuesA range of economic values can benefit from
protected areas of aquatic ecosystems and management of environmental flows including fishing, tourism and increased livestock production. This could be based on an initial subjective opinion or a detailed resource economic and social study, (e.g. importance as a tourist area). There may also be non-use economic values. For example, a wetland may be deemed valuable to a nation, even though many people do not use the wetland.
Political and legal issuesThere may be a list of relevant legislative, policy
frameworks and overlapping mandates (mandates where win-wins are expected, or even competitive friction) which are relevant to the conservation of aquatic ecosystems. There are many different organisations representing different stakeholders (see Fig. 5). These can include national and international obligations (e.g., Ramsar Convention for listed wetlands). Social supporting processes need to be identified: governance processes (upstream, protected areas, downstream), plans (e.g., water quantity and quality), stakeholders, and societal values of the various sectors (see values above).
Fig. 5. There is often a bewildering stakeholder map of different lobbies in the debate over rivers and wetlands and their long-term ecological health. This diagram summarises the set of divergent values but application of Strategic Adaptive Management Planning can help order and structure input effectively.
Minister
Basin Authority
Wetland and riverprotected areas
Irrigationsupply
Media
Environmentnon-governmentorganisations
Regionalgovernment
Public
Huntinggroups
Sustainable-useorganisations
Science
Ramsarlisting
Nationalgovernmentenvironmentalagency
Migratory birdagreements
Species andecosystem
conservation
Catchmentmanagement
authority
Governmentresourceagency
(e.g. agriculture)
Localgovernment
State, territoryor provincegovernmentconservation
agency
Threatenedspecies
Drinkingwatersupply
Indigenoususe
Wateragency

Strategic Adaptive Management
18
EngagementQuality of engagement is critical for influencing
the first step of SAM, to ensure establishment of institutional, cooperative and good governance processes. This will also inform all four steps of the adaptive management framework. There are many ways of engaging internally and externally in the process of SAM. Often, a key facilitator is critical to the process (see Fig. 6). Critically, it is important to identify champions that can influence the process, internal and external to institutions. There may be considerable challenges in implementation of such a complex process, particularly when an institution already has established planning and management processes, some of which may be statutory. Workshops and discussion are critical to communicating the aim of SAM and its potential power. Often, established planning and management processes can lack some of the critical aspects of SAM, making them ineffectual.
There should be sufficient support and understanding within an institution on the process and enough high level detail to engage outside stakeholders. Outside stakeholders are critical to the development of a vision and high level objectives. It is ownership of affected parties that will ultimately build the capital and momentum for success.
Fig. 6. Processes such as those described in these guidelines require facilitation. Professor Kevin Rogers (shown here) has helped forge agreement of broad values and objectives for more than a decade by eliciting multiple points of view about a catchment from a meeting of diverse stakeholders during workshops on Strategic Adaptive Management (photo: University of the Witwatersrand Centre for Water in the Environment).

Guidelines for effective conservation of
freshwater ecosystems
19
Fig. 7. Generic Strategic Adaptive Management (SAM) framework3,8,9, 17, 20
applied in these guidelines to the freshwater management of protected areas and other aquatic ecosystems and their surrounds, including management of environmental flows. V-STEEP (context box) refers to the context, specified by the array of values plus social, technological, environmental and ecological, economic and political drivers19
.
Feed
back
s - i
nteg
ral t
o pr
oces
s (s
ee F
ig. 1
4)
1. Setting the ‘desired future condition’ a. Vision and Missionb. Key attributesc. Hierarchy of objectivesd. Establish key thresholds/targets and indicators
EngagementEstablishmentof institutional, cooperativeand governanceprocesses
2. Management optionsa. System model (determinants, threats, constraints)b. Predict outcomes (scenarios, modelling, including surprises)c. Test acceptabilityd. Select option or combination
3. Operationalisationa. Prioritising objectivesb. Plan management option(s)c. Implement management option(s)d. Measure identified indicators
4. Evaluation and learninga. Review all steps & change if requiredb. Outputsc. Outcomesd. Communicatione. Review and change in steps 1-3 above
:ContextValuesSocialTechnologicalEconomicEnvironmental/ecologicalPolitical

Adaptive management sounds appealing but
difficulties arise in its implementation, especially when the
intention is to practise it across an agency or over
a heterogeneous area (as for most protected
areas) or for management of environmental
flows, where it is most needed. While building in feedbacks seems like an obvious approach, and often there are
assurances that adaptive management is operating,
closer scrutiny usually reveals these are simply
not happening or that key steps are missing.
Chinese water wheel for moving water from rivers. (Photo. R.T. Kingsford)

Guidelines for effective conservation of
freshwater ecosystems
21
Step 1 - Setting the desired future ecological condition
The first step of the main framework is to identify the desired future condition, representing varying conditions or a desired future trajectory for the protected area. This consists of several sub-steps (Step 1, a-d, Fig. 7).
This part deals with the central question: where do you want to be? Future-building exercises can reduce conflict by encouraging differing stakeholders to focus on common quality-of-life goals. When a desired future state has been articulated, it often turns out that some of the so-called problems of the present fade away because they are not important in reaching this state.
There are four sub-steps to be achieved as part of the setting of the desired condition: a) deriving the vision and/or mission; b) specifying the key attributes; c) setting the hierarchy of objectives; and d) establishing the key thresholds/targets for rehabilitation and their indicators for all objectives (Fig. 7). It is critically important to realise that this is not a simple progression but should involve testing the rigour and acceptability of previous steps and sometimes revising previous steps. For example, as a result of developing the hierarchy of objectives, it may be necessary to revise the mission and/or vision.
a) Vision and MissionThe words mission and vision are sometimes
interchanged or the concepts even amalgamated.
Vision is normally the goal in 20 to 50 years. The mission deals with how to achieve this vision. For South African National Parks, the mission is: “To develop and manage a system of National Parks that represents the biodiversity, landscapes, and associated heritage assets of South Africa for the sustainable use and benefit of all”.
At the level of the protected area, we examine the example of Kruger National Park (see Box 3). In the process of generating a vision and mission, there may be emphasis on pre-existing vision or mission elements. At other times, understanding the context may provide the initial launch pad to help construct the first or an entirely new vision and mission. In either case, the context, and especially values, will always interact with the newly-forming vision and/or mission to quickly improve versions.
Implementation detail
The following pages set out the process of working through the four steps
and identifying what needs to be done at each step.
‘In keeping with the South African National Parks Mission, to maintain biodiversity in all its natural facets and fluxes, to provide human benefits and build a strong constituency and to preserve as far as possible the wilderness qualities and cultural resources associated with the Park’17. The park administrators chose not to have a separate vision and so this is often also called their vision.
Kruger National Park, South Africa - Mission
Box 3

Strategic Adaptive Management
22
It is usually not constructive to spend much time debating differences between perceptions of what constitutes a vision and what constitutes a mission, as long as all the relevant intentions are captured; they form the beginning of sub-steps to follow (Step 1a, Fig. 7). It is useful to set a vision for the desired condition for the ecosystem: where you would like to be at a specified time in the future. This is best achieved with stakeholders involved and should reflect the broad aims and responsibilities for protected areas. The mission should be the first articulation of an immediate goal, which helps develop the next stages. A vision or mission often needs to be refined after stepping through the context, key attributes, determinants, threats and constraints that underpin the hierarchy of objectives (Fig. 7).
b) Key attributesFrom biophysical, cultural and other values,
between five and 15 key attributes (unique, special or essential) should be chosen that characterise the intrinsic nature of the protected area. For example, there are five key attributes identified for the Macquarie Marshes (Box 4). Often these attributes can synthesise the essence of the system and act as powerful filters for establishing objectives (Step 1. c, Fig. 7).
A long list of key attributes can be counterproductive, reducing focus and effectiveness. If possible choose the 20% of attributes responsible for 80% of the essence of the system – requisite simplicity21. There is often high integration and correlation among all attributes.
c) Objectives hierarchyObjectives should be prioritised, with high-order
objectives capturing the general intent and low-order objectives providing increasing detail (Figs 8 and 9). Ultimately, the vision specifies the fundamental long-term objective, but it is a broad statement which encompasses multiple social, economic and ecological goals. As such, it must be broken down into the relevant multiple objectives. These objectives provide a means of achieving the vision, and are derived from the previous step of eliciting the key attributes (Fig. 7), realising that some factors improve while others threaten each key attribute. Various factors are considered in the development of an objectives hierarchy: current condition, projections for future climate change, social, political and cultural objectives and realistic expectations of what can be achieved over different time frames. You should develop an explicit hierarchy of objectives, creating an inverted tree of objectives, from a few general ones at the top to many specific ones below, related to the protected area and its natural aquatic features (e.g. Kruger National Park, Fig. 8). These ultimately lead to a series of actions that can be tracked and recorded. There are important considerations in the development of an objectives hierarchy.
i. Objectives must relate to aquatic assets and should strengthen desirable processes (determinants) and offset threats.
ii. Objectives should also be cross-linked wherever sensible or obvious by making a note at the respective points in the objectives tree (Figs 8 and 9). This helps with integration. For example, there are critical connections between environmental flow allocations for Kruger National Park and river rehabilitation and hydrological regimes (see dashed lines, Fig. 8). The Kruger Strategic Adaptive Management Plan had multiple cross links (mandatory reminders that objectives require consideration together) but now has a separate
• Among the most important sites in Australia for waterbird feeding and breeding, in terms of population sizes, colony sizes, number of species and frequency of breeding.
• The complex, extensive and diverse vegetation communities (e.g. red gums, reedbeds, water couch, lignum, coolibah/blackbox).
• Large numbers and diverse communities of plants, animals and microorganisms.
• Complexity (temporal and spatial) of ecological processes and patterns that form one of Australia’s larger wetland systems.
• Important cultural and heritage values for indigenous (including significant indigenous sites) and non-indigenous people.
Key attributes for Macquarie Marshes, Australia
Box 4

Guidelines for effective conservation of
freshwater ecosystems
23
internal document showing them in a less visually-cluttered way (Fig. 8).
We provide two examples of how a hierarchy of objectives might work. The best developed is for Kruger National Park, South Africa, and the less well developed is for Macquarie Marshes, Australia (Figs 8 and 9). For Kruger National Park, the links between the primary objectives and finer scale objectives (biodiversity>ecosystem objective>water>functional processes>river health>long-term variability>large infrequent disturbance objectives/geomorphological template objective/hydrological regimes) are shown
for a particular part of the objectives hierarchy, down to monitoring thresholds of potential concern (TPCs) (Fig. 8).
d) Establishment of key thresholds/targets and indicators
To effectively meet objectives, indicators that are monitored are essential. Thus we require our objectives to be measurable. Examples of different indicators may include salinity, native biota (e.g. condition of floodplain trees, fish), biological processes (e.g. nutrient cycling; waterbird breeding).
Fig. 8. Part of the hierarchy of objectives established for Kruger National Park, South Africa, leading to key aspects for effective freshwater conservation of the protected area
8,9. More comprehensive listing of objectives is available at http://wwww.sanparks.org/parks/kruger/conservation/scientific/documents/.
Connectors (continuous lines) show the hierarchy of objectives. Some cross links are indicated by dashed lines.
Long term variability
Geomorphological Template Objective
Large Infrequent Disturbances
Objectives
Hydrological regimes
Atmoshepheric Effects
Terrestrial Ecosystem
Water in the Landscape
Alien Impact
Threatened Biota
Succession Migration River rehabilitation
Integrated catchment
management
Ecological Reserve
(environmental allocation)
Ecosystem Objectives
Legal and Statutory Objectives
Balancing Objectives
Biodiversity Objectives
People Objectives
Kruger National Park Mission
Enabling Objectives
Composition, Structure & Pattern
Functional Processes Awareness
Groundwater Recycling
River Health
Non-riverine surface water
Terrestrial-AquaticLinkages

Strategic Adaptive Management
24
For the example of the Lower Lakes of the River Murray, a measureable indicator might be the percentage of Murray turtles with encrusted shells (Fig. 10), sampled at regular intervals or changes in salinity. Indicators need to be sensitive to the change measured. A measurable objective which highlights a particular threshold might be the percentage of floodplain trees in good health in a wetland system.
There are some key principles for identifying the appropriate suite of indicators and their thresholds.
i. Specific indicators need to relate to key attributes and their conservation and management. For example, a cultural site will need to have an indicator of how its values are maintained.
ii. Indicators need to be sensitive to change. It is usually of little use if the indicator tells you after
the damage is done, although this can still help set the process of identifying targets for rehabilitation.
iii. Monitoring should include attributes that reflect the flow regime, if this is the main determinant.
iv. Key aquatic biota need to be monitored, if possible, not just surrogates. For surrogates such as habitats, it is important to check they are useful: they indeed operate as surrogates and be sensitive to change.
Thresholds are also a critical part of this discussion. Social-ecological systems are generally resistant to disturbance, natural or anthropogenic. Such resilience or capacity defines the identity of social-ecological systems which are able to absorb disturbance and reorganize while undergoing change but still retaining essentially the same function, structure and feedbacks22,23. In this context, a threshold defines a
Vision
Ecosystemprocesses
Waterbirds Native fish Terrestrial ecosystems and biota
Flooddependentvegetation
Native aquatic mammals,
reptiles, amphibians & invertebrates
Balancing Objectives
Ecosystem Objectives
People Objectives
Enabling Objectives
Flow andinundation Biodiversity
Alienspecies
Geomorphology,functioning
Fig. 9. Part of the hierarchy of objectives established for Macquarie Marshes Nature Reserve (Murray-Darling Basin, Australia), leading to key aspects for effective freshwater conservation of the protected area
9. Connectors (continuous lines) show the hierarchy of objectives. Cross links are indicated by dashed
lines.

Guidelines for effective conservation of
freshwater ecosystems
25
particular level or amount of a controlling variable which drives a change causing the system to follow a trajectory towards a different ecosystem state24. This critical ecological threshold is important to define and avoid if the aim is to manage an ecosystem in its current state because, once one of these critical ecological thresholds is exceeded, it may be very difficult or impossible to return to the original ecosystem state. This is because it has shifted into a new regime of the social-ecological system23. There is some scientific uncertainty about the nature and shape of such thresholds but they essentially set the ‘safe operating space’ for managing the system. Understanding the irreversibility of such thresholds is critical22,24. Given such uncertainty, it is practical to define some ‘working thresholds’
or ‘thresholds of potential concern’ which guide management.
These can be defined as the upper and lower limits of a variable of interest in the social-ecological system19. In reality, they lie within real thresholds that cause a regime shift, or even transformative change; they are also known as ‘decision thresholds’25. Their value and placement below real ecological thresholds potentially allows management time to respond before the real expected ecosystem threshold is crossed. In essence, there is a hierarchy with real ecological thresholds to be avoided at all costs and thresholds of potential concerns below these,
providing sufficient manoeuverability for effective management.
Fine scale objectives are the actions that you
decide to take to: a)underscore the
determinants of key attributes and/or;
b)offset the threats and risks to the key attributes
(see Figs. 8 and 9).
Fig. 10. As a result of increasing salinisation resulting from reduced freshwater inflows to the Lower Lakes of the Murray-Darling Basin in southeastern Australia, the shells of freshwater Murray turtles Emydura macquarii are colonised by the marine tubeworm Ficopotamus enigmaticus. These build calcareous tubules on the shells of the turtles. Eventually the encrusted turtle may drown because it cannot surface to breathe because of the weight of the tubeworms26
. A likely objective, once the objectives tree is built for this system, could be to ensure a percentage of the turtles are free of such encrustations (photo: Keith Walker).

Strategic Adaptive Management
26
The thresholds of potential concern (TPC), referred after this as thresholds, should be identified. These thresholds represent points at which the indicators trigger a change in management decisions. Thresholds and indicators may involve sophisticated modelling and/or sensible heuristics (‘rules of thumb’), based on experience or even educated guesses. Uncertainty in thresholds may also be resolved over time. Thresholds are operational goals that define natural spatial and temporal variability, within certain confidence intervals, relative to a potentially natural level. For some systems where there is a rehabilitation phase, these may be best described as the inverse, namely targets for rehabilitation. Diagrammatically, this captures the notion of resilience of ecosystems within a two-dimensional ‘tent’ where indicators and their thresholds identify when a particular ecosystem moves to an undesirable condition (Fig. 11). So for example where the condition of a floodplain forest is in decline, a trigger for concerted rehabilitation management may be when there is mortality of 20% of all trees.
Each threshold should represent an achievable environmental goal and not designed to be overwhelming or too rigid. They also need to be firm enough to meet essential criteria of transparency should they be exceeded. Thresholds may also inform the objectives by potentially establishing targets for rehabilitation. They then become targets to work ‘back towards’ the desirable condition (Fig. 11), as often thresholds may have already been exceeded. The threshold themselves are open to ongoing scrutiny, but not when exceedence is reported, given likely contentiousness. At this time, it is far better to act and learn. Further, allowing sudden recalibration undermines the whole adaptive management system and means the status quo will likely never be found wanting. This underscores the importance of buy-in, or co-creation by researchers, managers and key stakeholders of the rationale for thresholds and their levels. Identification of indicators and thresholds is an iterative process and it may be necessary to alter or add to the list of indicators and thresholds after testing the suitability of different management options (see Step 2).
U n d e s i r e a b l e
D e s i r e a b l e
De s i r e a b l e
Un d e s i r e a b l e
De s i r
e a b l eU
n d e s i re a b l e
If system condition is outside the ‘tent’, then the boundary is seen as a ‘target’
to aim towards to reach inside
If system condition is inside the ‘tent’, then the boundary is seen
as delineated by thresholds which we
strive to exceed (i.e. to stay within
the “tent”)
Various system condition
positions and movement
between them, necessary for
resilience
Tent edge formed by various Thresholds of
Potential Concern (TPCs)
Inside = Desired
Ecological Condition
Fig. 11. Adapted two dimensional ‘tent’27
describing the natural variation in the desirable condition of an ecosystem, within boundaries determined by thresholds (TPCs) of various ecosystem indicators. For instance, if the ecosystem moves outside this ‘tent’, it moves into an undesirable state or condition, demanding management to move it back into a desirable state or condition.

Guidelines for effective conservation of
freshwater ecosystems
27
Step 2 - Management options
There are a series of substeps that can assist in identifying the potential management options. A good system model is critical as it allows for testing of different management options against a common understanding of the way the system works.
a. A system model The explicit model includes the component
habitats and species and how the system functions. A useful first step is to identify the range of threats that may affect a system (Fig. 12), although this needs to be developed considerably to identifiy the major drivers that underpin understanding of cause and effect. Then try to draw a relatively simple cause-and-effect diagram, incorporating key processes at the catchment scale (Fig. 13). Without this model, stakeholders may have different undeclared models28.
This step identifies the status of the system and its derivation, underpinned by knowledge of the system’s
parts and how they function. It involves describing the social-ecological system components and developing a system model of how it works (Fig. 13), starting with a broad conceptual model of the ecosystem (Fig. 12). Ideally, it should involve development of a process model where different states are identified and the drivers that push transition into these states. This can be then quantitatively developed using probabilities dependent on the key factors that drive the system28. This step ranges from a simple assessment (even an intelligent guess (Fig. 12)) to a complicated model based on detailed information that can provide a basis for a causal or process model. It will depend on the resources and background available. Derivation of process models, utilising research and development studies, should be an ultimate objective. This involves identifying the key ecological processes that support the ecosystem: hydrology, energy dynamics, chemistry, biotic interactions, connectivity, disturbance, and geomorphology.
Identifying determinants or drivers of each key attribute provides a useful way of articulating
Priority values
Threatening processThreat agent
Management response
Drivers
Resulting habitat structure
Past landuse: logging & grazing native understory largely cleared or modified Ecosystem productivity:
Moderate
Soil: Alluvial loams & clays
Inundation Regime: subject to periodic flooding (desirable intervalbetween floods varies 5-10 yrs).Fire regime:
Min. low severity: 10 yrsMin. high severity: 30 yrs Max. infiniteFlammable only occasionally (after extensive rains or floods). Fire usually rapid, low severity & patchy. Floods are main regeneration event.
Management of human activities
Grazing management (incl. control of access)
Restoration (e.g. re-snagging, rehabilitate fringing vegetation,
stabilise streams). Also reinstating flow regime (environmental flows)
Predator control
Weed management
Fire Management Program
Community Education (II&E)
Environmental water delivery Ex-situ Catchment
management
Control of introduced fish
Ecological thinning
Recreational activities
Weed propagules
Climate change
Introduced predators
Illegal activities Past clearing (agriculture,urban development)
Grazing/browsing by over-abundant native herbivores (kangaroos)
Surrounding landuse (including irrigation)
Inappropriate water regime (flood frequency, duration, timing, maximum interval) Barriers (longitudinal: dams
and weirs, lateral: levees)
Introduced fish
Inappropriate fire regime
Fire wood collection
De-snagging &Channelization
Grazing by introduced spp(rabbits, goats, pigs, horses)
Rogue cattle?
Increased drought
Habitat loss
Level of predationWeed invasion
Overgrazing
Fire too frequent
Reduced water availability
Fragmentation
Dieback (lack of flooding,nutrient enrich., salinity)
Reducedconnectivity
Algal blooms
Channel modification
Sedimentation(In-stream)
Overly denseregrowth stands
Increased water temperature
Soil degradation/disturbance, bare ground
Salinity
Nutrient enrichment(In-stream)
Number & size of hollows(form ~120 yrs after fire) Habitat: in-channel
Coarse woody debris (maximum >120 yrs after fire)
Riverine woodland / forest indicators:* Species and age mosaic. * Organic litter (can be too
little or too much - risk causing blackwater events).* Weed abundance. * Periodic flooding (recruitment
events for tree spp, breeding events for colonial waterbirds). * Number and size of hollows (for arboreal mammals,
roosting / breeding sites for avifauna). * Instream habitat condition, water quality.
Tree Layer: Open forest to woodland River Red-Gum (E. camalkdulensis). Co-dominants: north-west: Black Box
(E. largiflorens), Wimmera & north-central: Grey Box (E. microcarpa), west-central: Yellow Box (E. melliodora).
Associated with drainage lines that may flood for extended periods.
Understorey: open, highly variable (dependant on water depth, time since flooding). Shrubs, or
summer-growing grasses & herbs Acacia dealbata, A. salicina, A. stenophylla. NW: chenopods & other
succulents. Southern: grasses, sedges, rushes, shrubs Themeda triandra common (also Austrostipa,
Austrodanthonia, Poa, Atriplex, lignum).
Endangered Avifauna (e.g. Black-eared Miner,
Regent Parrot)
Colonial waterbirdbreeding events
Aquatic invertebrates
Rare/restricted/depletedEVCs and veg spp.
Native fish spp.
Aquatic & semi-aquatic herpetofaunaWater Quality
Flood mitigation
Fig. 12. Example of a conceptual model derived for riverine wetland forests in southeastern Australia, showing drivers, threats and threatening processes, potential management responses, resulting habitat structure and values to be managed for (reproduced, permission of Parks Victoria
29).

Strategic Adaptive Management
28
Fig. 13. Example of the social-ecological system for a hydrologically influential area adjacent to Kruger National Park, South Africa, showing the social and ecological factors affecting aquatic ecosystem function
30. The Rs in circles represent “reinforcing loops” that tend to be self-perpetuating and keep the
system in a desirable or, in this case, undesirable state. Analysis shows that it is taking far longer than anticipated after the removal of apartheid policies and practices for reinforcing loops to take on other forms, an example of “lag effects” in social-ecological systems.
Decreased biodiversity
Decreased riverine integrity
Increased river sedimentation
Increased land clearing
Decreased ecosystem services from wetlands, river
and riparia
Streamflow reduction & increased
abstraction from rivers
Particular land-use policy incentives at that time - forestry
and irrigated agriculture
Sharp population increase due to
forced relocation during aparteid years
R
Decreased social capital in community
Migrant labour incentives during
aparteid
Increased emigration of household heads
Decreased livelihood security for those
dependent on natural products
R
and identifying factors or processes that ensure the persistence of the ecosystem. Sometimes these determinants may apply to more than one attribute. These can be ecological (abiotic, biotic) or sociological (political, social). A model of the social-ecological system can be a useful way of depicting the various determinants or drivers on the protected area and its management (e.g., Kruger National Park, South Africa, and its surroundings, Fig. 13). They obviously include factors such as flow but also potentially fire (see Fig. 12) or even tourist impacts. The determinants should be functional (e.g. flows,
water quality, landscape heterogeneity and positive societal attitudes). It is essential to also consider any constraints or threats to the key attributes.
Once the determinants or drivers are identified, these should guide the identification of threats which influence direction and effectiveness of management. Some threats may be influenced but others may not and therefore become constraints. Managers can do something about threats but constraints cannot usually be managed. It is important to differentiate between variables that drive system responses but can be altered via management from those that cannot.

Guidelines for effective conservation of
freshwater ecosystems
29
Sometimes variables that were considered difficult to alter via management may become amenable to management due to technological or political changes. Success can often be the consequence of being brave enough to somehow turn a constraint into a threat. In practice, threats can often turn out to be the inverse of determinants (strengths).
i. Identify the types and sources of current and future threats. This is often done in a short group session to elicit as many ideas as possible.
ii. Assess the severity, scope and likelihood of each of the threats impacting on aquatic biodiversity and whether they are increasing or decreasing. Ultimately this can be done quantitatively.
iii. Evaluate each key threat at multiple scales: in-stream, in-lake, in-wetland, riparian, regional and catchment scales. These threats can include river flow regulation and abstraction; pollution; sedimentation; climate change; invasive species (e.g. exotic fish and weeds); altered fire regimes; over-harvesting (e.g. sand mining); road fragmentation; and tourism disturbance of aquatic resources.
iv. Identify constraints to management (i.e. threats or processes that cannot be managed or changed).
v. Consider carefully whether lateral thinking can turn a constraint into an opportunity.
Drawing a systems diagram and understanding the determinants and threats can sometimes take longer than several of the other steps described in this document, but it is necessary and fruitful to spend this time. It is often regarded as ‘abstract’ by practitioners and rushed through, producing a poor foundation. The model of a system can be used to represent the belief of how the system works and responds to management. It can be used as a tool to explore critical uncertainties which, if resolved, will change management decisions (i.e., not all uncertainty requires resolution). Importantly, if a model is quantitative, it can be used to to resolve critical uncertainties by updating the models with monitoring data28. This can be highly appropriate as long as the effort involved does not mean that other parts of the solution are ignored because this part is well understood. The critical objective is to derive requisite simplicity21. Models can thus be used as a basis for a targeted monitoring strategy. The following
is a checklist of the key issues that can be addressed in the context. There needs to be a good foundation for subsequent steps, which are based on this context-enriching step. It may not be possible to assemble all of the information in the beginning but there should be a long-term focus on gathering this information.
The next step is to develop and test the best management option(s) that line up with specific objectives (Figs 8 and 9). This deals with the question ‘how do we go about it?’ This amounts to direct preparation for, and implementation on the ground. To take effect, commonly used tools are task and duty lists, standard operating procedures and result chains.
Freshwater management must link to the established objectives and must deal within the identified reality of the dominant ecological and social processes (Fig. 3), addressing the specific aquatic objectives or threats identified. Management must help achieve the desired future state and be as resilient as possible under scenarios constructed. It must be underpinned by the explicit relationship to the catchment, including other activities and areas. Management should also incorporate reserve design and management issues (e.g., proportions of wetlands within or rivers as a boundary of protected areas or incorporating connectivity, environmental flows). There are various useful forms of management plans for ecosystems and most depend conceptually on a structure akin to the hierarchy of objectives (Figs 8 and 9).
The scale of management option should also be appropriate to the problem, with appropriate testing. For instance, it will be of limited use if many erosion control structures are erected but only a few are checked for efficacy. Another example of scale mismatch might be when macro-flows of a river are released to rehabilitate habitat, but fine-scale hydrology where the sensitive organisms live is not understood, and the releases fail to have the desired effect. Or, fine-scale habitat manipulation (e.g., removal of aliens at one point) fails to correct the broad-scale water-use imbalances in the downstream catchment. Similarly management of fire and pest species may be required across neighbouring areas, not just the protected area with due attention to sources and pathways of movement.

Strategic Adaptive Management
30
b. Predict outcomes (scenarios, modelling)
The system model can then be used to predict potential outcomes of management. It is possible to test acceptability of management and opportunity costs of short-term versus long-term management options. For example, environmental flows could be released every year or stored and released less frequently but producing a larger flood than annual releases. This process can range from the simple to comprehensive and often depends on the resources available. Predict (even at an intuitive level) possible responses of the system (including societal acceptability) to a range of potential interventions that will work towards goals of the protected area. This should also explicitly include the “no intervention” option.
This step needs to also consider rare events (Fig. 7), usually considered through thinking or modelling scenarios or plausible alternative futures, under particular assumptions (Box 5). These can be used as a systematic method for thinking creatively about complex, uncertain futures. They help in making choices and highlight current developments. Scenarios can help ‘create’ one of the (better) visualised futures (the desired future condition mentioned above is far closer to that), but also buffer bad uncertain futures or take advantage of unique ‘surprise’ opportunities. Scenarios are relatively easy to develop and can engage stakeholders meaningfully in thinking about futures and the system’s resilience to shock (e.g. climate change, fire, floods, droughts, results of political actions). They need not necessarily involve sophisticated modelling tools. When faced with such a surprise, or when thinking about it in the abstract, it is essential to capitalise on learning opportunities, building understanding of recovery mechanisms and potential new directions.
c. Test acceptabilityThe possible actions considered by management
will affect stakeholders differently, influencing the acceptability of the outcome. For example, directing flows to a particular wetland by building structures or some other active management is likely to affect downstream environments and potentially stakeholders, demanding some testing of acceptability. Initial wide participation and involvement in the process should have by now helped focus on what was agreed on as a joint picture to work towards, and generated
understanding of elements that might have otherwise been seen as unacceptable by some. In considering actions, it is important to re-engage with directly-affected stakeholders and check that links between actions and goals are agreed. There will still probably be some measure of unacceptability, given unpredictability, but the important step is to try to realistically assess this and decide. Thinking as explicitly about acceptability improves the quality of decision-making.
At an organisational level, it is also important to ensure collaboration and engagement on trans-boundary (boundaries between the protected area and outside, within a large bioregion or catchment, or even across international boundaries) locations. This accounts for key ecological and sociological factors that influence an aquatic protected area or managed aquatic ecosystem, from upstream and downstream. There are also forms of organisational plans for management that should be the vehicle for good adaptive management planning, recognising the essential elements of the framework (Fig. 7). A particular issue that comes up under acceptability is the trade-off that is chosen between short-term and long-term goals or competing goals, trade-offs that can be helpfully informed, inter alia, by comparative risk assessment (see above).
d. Select option or combination of options
On the basis of predicted outcomes and testing of acceptability, the manager can then choose the appropriate options to deliver on acceptable objectives. To work towards delivery on acceptable options, there may have emerged along the way a need for some supplementary targets or thresholds and these may need to be added without making the system too cumbersome (see indicators and thresholds). It is important to use management to resolve uncertainty and learn from the intervention, employing the ‘best’ overall strategy at that time.

Guidelines for effective conservation of
freshwater ecosystems
31
Planning the future demands some assessment of future risks to social-ecological systems. With increasing understanding of interactions among different parts of the social-ecological system, there is more and more opportunity to develop and run models that allow for more credible detail to be placed in certain scenarios. However, do not limit scenario-setting processes only to those for which there is established scientific backing. Sometimes those without any current scientific backing turn out in the long run as important or even more important. Even if there is strong support for one scientific model, feel free to explore other ‘surprise scenarios‘, as possibilities. The nature of scenario planning also allows such informed guesses or even suppositions. In total, the scenarios can help inform actions that promote the likely survival of components and processes of ecosystems
and address likely or possible events causing challenges for managers. The following process should be followed.i. Develop scenario plans (extreme events,
floods, droughts and pollution impacts from management of other habitats, and biodiversity).
ii. Engage and build acceptance by downstream and upstream stakeholders using scenarios. Emphasise the interdependence of freshwater ecosystems.
iii. Identify contingency socio-political plans and mechanisms to best lever favourable change for these events.
iv. Identify strategies for limiting extreme human-induced effects of such events.
v. Build adaptive processes for learning both from preparation for such events, and from their management, should they occur.
Scenario setting Box 5
Step 3 - Operationalisation a. Prioritisation of objectives
Once the endpoint of the objectives hierarchy is reached, there will be a wide array of different fine-scale objectives for which resources may not be available. A comparative risk assessment can be used to help decide which objectives should be addressed first30 and the resources allocated to them (Fig. 7). It involves asking what effect there would be (usually on the overall mission) if a particular objective failed, and the likelihood of failure, given various scenarios. This happens soon after objectives are determined and accepted. None of the objectives, if derived through key attributes, is eliminated in this process, as the key attributes ensure their necessity. Usually, only some necessary information is available and so there is always a mixture of hard evidence, expert evidence and plausible speculation. This prioritisation can be nuanced and intelligent and allows comparison across the range of different objectives (i.e. successfully compares “apples with pears”).
It is often possible for a multi-stakeholder group to deliver a near-consensus assessment of the likelihood of a list of risks materialising and their seriousness, whether relating to conservation or to other issues,
such as tourism or human health. If these assessments are coupled to the costs in time, skills and money of current risk abatement, and the prospect of future abatement, there is a basis for prioritising objectives.
Prioritisation can help determine if additional effort or funding is required for particular objectives, while resourcing of other objectives is maintained or downscaled, with acceptable risk. Without such a process, all objectives can have their champions arguing for equity and urgency in attention and funding. Prioritisation allows group participation in a transparent process that builds a shared rationale. The assessment used in this guide relies on determining what happens if an objective fails, and its impact on the vision and mission. Failure of each objective needs to be articulated as a risk, with a discussion of consequence, usually within a 15-20 year time horizon (Table 1). The base case is the business-as-usual scenario (i.e. current conditions), but the worst case and other possible scenarios need to be articulated as well. The process can be outlined in a matrix, derived by the responsible managers and stakeholders (Table 1).
In our example (Table 1), the highest raw risk score of 16 for floodplain forest is not well mitigated but can be brought down to a more acceptable level at medium cost. In contrast sometimes high raw scores for

Strategic Adaptive Management
32
Objectives
Chance that risk realises in next 15 years (low-high:
rated 1-4)
Impact on protected area vision and mission (low-high:
rated 1-4)
Raw Score = Chance x Impact (low-high:
rated 1-16)
a) How effective are current actions in controlling this risk?
b) What level of resourcing is needed to do so? (very high/ high/medium/low/none)
Is this level of risk control deemed acceptable? Is it within manager’s risk appetite?
(yes / no)
a) How effective could risk abatement be if improved?
b) What would this take in resourcing?
(very high/ high/medium/low/none)
To ensure floodplain forest area and condition are maintained
4 4 16 a) low b) very low No a) very high
b) medium
To control unnatural fire regimes in reedbed vegetation
2 2 4 a) very high b) medium Yes a) none
b) very high
To reduce colonisation and establishment by alien fish
3 3 9 a) low b) none Yes a) medium
b) medium
To establish education and accessibility programs for tourism
2 1 2 a) high b) medium Yes a) very high
b) very high
To ensure connectivity of floodplain to river
1 2 2 a) medium b) low No a) high
b) very high
Table 1. Prioritisation risk framework for resourcing a short list of objectives, using a risk assessment framework developed for a hypothetical freshwater aquatic ecosystem, where water supply is regulated by a large upstream dam. We assume the agreed mission/vision for the area reads “to sustain freshwater ecosystem attributes in as natural a state as possible for the benefit of biodiversity and recreational stakeholders”. This prioritisation risk framework has been adapted from a similar framework in use by South African National Parks30
.
objectives are mitigated sufficiently to justify allocating additional money and staff into other objectives with lower risks but higher anticipated benefits. The next highest-scoring objectives (scores 9 and 4) are deemed acceptably mitigated (Table 1), sufficient to maintain the status quo for their management. If increased risk abatement is required, then effectiveness (compare far-right column) could assist in evaluating cost-benefits of actions. More likely, managers may question the amount of effort being put in, and wonder whether the fire regime, consuming medium resources, cannot be reduced without increasing risk. This could be done more objectively through further detailed or quantitative assessment of effectiveness with reduced activity. Risks to the last two objectives are less serious (raw score = 2) and yet risk to the connectivity objective is unacceptably mitigated but improved abatement status will incur considerable cost and so may not be practicable (Table 1). Clearly, different comparative risk assessments can lead to different arrays of such results, sometimes suggesting many changes, but sometimes mostly justifying current profiles of action. Risk assessment is instructive, potentially identifying
objectives where most effort is currently directed but does not deliver on overall goals. This is because of clear insight offered by assessments of current effectiveness, acceptable risk and effective abatement (Table 1).
Evaluation can be done quickly by protected area managers or a wider stakeholder group. Often, it is remarkable how similar such subjective scores (in the chance and impact columns) turn out to be from persons with different viewpoints or tasks in organisations. If detailed data are available on some questions, analyses or monitoring can improve intuitive evaluations and resources should be devoted to increasing the evidence base. However, there should not only be emphasis on those categories or themes with strong numerical data, nor should there be an aversion to dealing with the less quantified or quantifiable aspects. Such biases can cloud good judgement. There is opportunity in this process to group or split objectives to ensure meaningful assessment. Also the vision and mission elements may need to be dissociated or viewed together in the assessment of an objective. Overall, risk becomes a

Guidelines for effective conservation of
freshwater ecosystems
33
common currency for allocation of resources between widely different objectives such as refurbishment of tourist infrastructure, upgrades of IT equipment, a research project, and works for the protection of endangered biota.
b. Plan management option(s)This step identifies what is needed to implement the
management option(s) (Fig. 7). It involves identifying the capacity (human and financial) within the management organisation (without being under or over ambitious) and tailoring the process accordingly (Box 6). Often a start needs to be made on a ‘do-able’ portion of the overall challenge and plans made to build up capacity over time to deal more fully with the range of issues. Ongoing learning and experience will be valuable and usually motivational to achieve at least part of the goal and in solving problems associated with implementation. This will also vary according to the resources available for a particular protected aquatic area, among many priorities.
Operationalisation involves ensuring sufficient money and people exist to achieve identified objectives (Fig. 7). Protected areas will have differing amounts of input depending on the resources available but this framework should still be followed. It is invariably possible to implement a worthwhile part of SAM with limited support and resources. This may require the commitment of key individuals with capacity to
engage in the process and carry it through. At this point, institutional responsibility for adaptive management planning needs to be identified within the management organisation. Existing business or organisational processes (e.g. financial planning or work programs) will need to be interlinked with the strategic approach to ensure resources (financial and human) are most efficiently used to deliver on objectives. Staff attitudes can vary from positive and constructive to antagonistic in the face of changed routines. Energy often needs to go into building an interface that links the strategic adaptive approach and project planning tools in use within an organisation. Some of the tools are non-adaptive and require altering cultures of work and programs, where possible, to ones that are more responsive (e.g. budget allocation). There is often opportunity to integrate old systems with SAM. Implementation can be challenging so it is important to remain positive in response to resistance to change and manage this sensibly. During operationalisation, there are three key steps: planning management options, implementing the options and measuring identified indicators. Measurements should begin before the management so that effectiveness can be tested. Ideally these measurements should be on different systems; some subject to management and others not. Scientists and operational staff need to be engaged throughout the process to ensure rigour of data collection so that subsequent analyses can be done.
There are ecosystem targeted plans and also organisational plans that should be developed based on the hierarchy of objectives, and include likely management options for each objective. These can include:i. Water quality and quantity plans (including
emergency provisions or contingency plan).ii. An environmental flow plan, describing what
flows should be expected at what times of the year and under what differing (say rainfall) circumstances.
iii. Plans and targets for habitats (refuges,
wetlands, estuaries, rivers).iv. Plans for and targets for aquatic biota
(endemic species transfer issues, barrier issues, e.g. fish ladders).
v. Organisational plans (e.g., park management plan, the annual plan of operations, agency’s financial or human resources plan, risk plan).
vi. There may be alignment tools (e.g. balanced scorecard, benchmarking, control charts) that are part of evaluation and learning, but these need to be aligned with objectives. This can be difficult in some settings.
Different types of management plans and score cards for management
Box 6

Strategic Adaptive Management
34
There are some key processes that need to be considered.
i. Ensure adequate capacity in staffing. For example, internal and external aquatic expertise (aquatic biologist, hydrologist) and technical expertise (geographic information systems, scenario planning).
ii. Ensure equipment is available that relates to specific indicators reflecting objectives and thresholds of potential concern (e.g. gauging, electro-fishing, macroinvertebrate sampling, waterbird surveys, water quality meters, remote sensing).
iii. Ensure that data management supports objectives. As in the case of monitoring programs, this should not become isolated and self-serving.
iv. There should be a logical and useful decision support system based on common understanding
among stakeholders and using ongoing adaptive feedbacks. Decision support systems will not release managers from tough thinking and decision making where human discretion is needed, nor from the essential business of innovating. Decision support systems are often based on modelling that provides a rough approximation of the real world, usually dealing in detail with one technical subcomponent of the overall system that the manager is actually dealing with.
c. Implement management option(s)Ensure there are clear plans and resources (time,
money, people) for management. This requires careful identification of how management options will be done.
i. Perform the management operation required (e.g. environmental flow release, control of pest species, amelioration of in-stream barriers) and record the timing, location and mechanism of
Table 2. Example of a summary table reporting status of a limited suite of all thresholds of potential concern (TPC) in a hypothetical freshwater protected area supplied by a river. The indicators are updated and reported on, providing an overall summary of progress in management and the ecosystem. This list evolves over time but all versions should be kept for a full understanding of the development of the system.
Theme IndicatorThreshold of potential concern (TPC)
Space and time scales for collection and evaluation
Status and development of TPC Comments
Vegetation
Floodplain trees
80% of all trees in healthy condition
Annual surveys of floodplain tree plots reporting on condition across protected area
Available. Credibility rests on fact that lowest condition dependent on long-term drought
Possible future refinements: an upper limit determined by influence of flooding, rainfall and groundwater Influence of fire possibly also important
Macrophytes Complete diversity complement
Surveys during wet periods on set plots
Not yet available – under development
Diversity indices could be used
Inundation Patterns
Area and distribution of flooding
80% inundation at least every five years, relative to natural flooding of different parts of the protected area
Annual evaluation using remotely sensed imagery
Well-established technology, linked to modelling of flow and inundation patterns
Improved linking with vegetation health and condition
Animals
Invertebrates Density of aquatic invertebrates
Event-based monitoring
Thresholds to be established for different flooded areas
Time-consuming but possible to automate processing
FishEnsure all indigenous species present, with recruitment
Monthly monitoring along river reaches
Modelling of communities over time indicate invasion of alien species - successful recruitment needs to be defined per species
Further analysis of movements and use of different habitats to determine priorities for different species
Waterbirds
Breeding occurrence for particular defined species at least every two years. Diversity maintained
Annual surveys on river reaches and colony sites
Well establishedGood indication of links with flow quantity
Measurement of reproductive success in relation to flow and critical timing of flow and potential risk of nest desertion
Further themes (e.g. fire, alien species, rare species, earthworks, etc., dealt with similarly)

Guidelines for effective conservation of
freshwater ecosystems
35
the management intervention, and any other potentially relevant information.
ii. Ensure sufficient resources to carry out the management intervention including the monitoring of appropriate indicators.
d. Measure identified indicatorsEach of the identified indicators derived from
objectives needs to be monitored and measured. This requires investment in monitoring and science that specifically addresses the objectives identified at the appropriate temporal and spatial scale. There should be sufficient resources available (funding and appropriate technical expertise). The monitoring needs to be tied especially to current objectives, plans and thresholds. As difficult as it is to get monitoring programs established, it can sometimes be even more difficult to stop ones which were either never designed with the correct goals in mind or that are no longer meaningful for current plans.
It is important to regularly assess the thresholds of potential concern for which indicator data are being collected, to determine whether there are priorities for management action. If a threshold of potential concern is exceeded, or if an indicator is clearly heading in a direction of concern, implement the agreed management to return the variable into boundaries of acceptable variation. Critically, understanding the underlying processes and interactions is fundamental to resolving uncertainty.
To ensure that this process is adequately managed, the following should be considered.
i. Build up of a summary list of all of the thresholds of potential concern and their indicators. These are updated over time by establishing a practical documentation system to keep record of the versions as they develop, highlighting the current one, within a summary table (Table 2).
ii. In addition to a full list of all thresholds in use, it is useful to develop a ‘running-sheet’ of indicators and thresholds of potential concern (Table 3) that are exceeded or explicitly recognised as heading that way. These demand management intervention. These are all brought formally to the attention of decision makers (e.g. science-management committee). If a particular variable that has exceeded a threshold returns to within acceptable limits, it is marked as inactive or ‘solved’ on the running sheet.
iii. The threshold assessment system allows periodic assessment of trajectories of potential change. A person championing a particular threshold or thresholds can in this way keep a watchful eye on developments and has a better chance of achieving the more proactive option of ‘tabling’ a threshold, before it is exceeded.
Table 3. Hypothetical running sheet for thresholds of potential concern (TPCs) that have been exceeded or predicted to be exceeded for the system. TPCs not in this table have not yet been exceeded or are not predicted to be exceeded.
Indicator Date reported and date exceeded Comments Action taken What happened Next
checkpoint
Floodplain trees (80% in good condition)
Exceeded March 2009 (75%) and again in February 2010 (77%)
Evidence that this was predisposed to by drought condition plus abstraction patterns
Management requested additional flows released from dam-operating agency on both occasions
Inundation of 60% of floodplain trees, showed good growth (detailed in report)
March 2011
Area and distribution of flooding (80% of natural)
2010 season at 55%
Catchment agency informed and requested to consider making available 40,000ML in two surges in July and September in 2011 if flows by June are below 3000 ML/day
Satellite image analysis showed only 70% of floodplain inundated (detailed in report)
Annually and after releases
Waterbirds (breeding events at least every 2nd year)
No breeding occurred for three species of ibis and egrets in either the 2009 or 2010 season
These particular species known to be indicators of breeding activity of all water birds
As above, and awareness campaign launched
Breeding event of 60,000 waterbirds occurred
Annually and after releases

Strategic Adaptive Management
36
Step 4 - Evaluation and learning
The evaluation process should occur for each step of the flow diagram (Fig. 14), but perhaps more comprehensively as each cycle of implementation begins. This step, evaluation and learning, is the most neglected step of the adaptive cycle but needs to be done. Evaluation needs to test the appropriateness of the intervention and monitoring,
the predictive capacity, the societal acceptability, and accomplishment of broad goals related to the mission for the protected area.
a. Review all steps and changeEvaluation and learning (Step 4) can be framed
as a clear series of questions for each of the other three steps in the process (Fig. 14). It is one of the most frequently skipped actions, and then usually effectively renders the management non-adaptive.
Is underlying trust and co-learning deficient?
Are the vision and mission actually being achieved?
Were objectives achieved or do they need to be adjusted?
Was monitoring adequate, cost effective and feasible?
1.Setting the ‘desired future condition’
Were predicted outcomes correct?
Were outcomes acceptable?
Were selected options appropriate?
2.Management options
Did the operation materialise?3.Operationalisation
4.Evaluation and learning
Fig. 14. Feedback questions essential for the adaptive learning are embedded in the generic SAM framework for freshwater management of protected areas and surrounds
32132 and environmental flows, relating to the four essential steps (see Fig. 7).

Guidelines for effective conservation of
freshwater ecosystems
37
Evaluation, which includes carefully thinking through the experience and checking whether all important feedbacks are being used is essential. If omitted, nothing is learnt. Comparisons between management options is a key basis for learning (see Fig. 16 example). Processes need to be fully adaptive in the complex changing world. Ongoing learning is the hallmark of all versions of adaptive management that set a desired future condition, such as Strategic Adaptive Management (see example, Fig. 15).
The evaluation and learning step explicitly reviews results of the processes with the aim of adjusting models, goals and management (Fig. 7). As a result of questions (Fig. 14), management adjustments invariably need to be made, or with continued failure then objectives and vision need to be changed, reflecting an inability to reach a desired condition. Such feedback is essential for ongoing learning. It is important that this learning takes place not only for outputs but also for actual biodiversity and other outcomes (see below).
Learning has three nested scales with different time periods33: triple loop learning and evaluation (Fig. 16). This includes the single learning and evaluation loop where there is alteration of management to achieve a specific goal based on whether a threshold of potential concern is exceeded. The double learning and evaluation loop demands assessment of whether the model underlying processes within the system needs to be changed. Finally the triple learning and evaluation loop tests the appropriateness of changing the overall mission and desired state (Fig. 16). The actual sequence and depiction of these relationships may require re-organisation by adept practitioners in the light of their experiences as they implement and learn. Thinking through the extent of single-, double- and triple-loop learning within a particular management context, may require changes to the process of evaluation and learning (Fig. 16).
Management practices require explicit feedback loops from data to planning, with checks that management interventions have desired effects32,33 (Fig. 14). For freshwater, it is challenging in that many of the important links have to work across agencies to be successful. Trust, a partly-shared rationale among stakeholders and co-learning will underpin success in SAM.
During evaluation and learning, the tough question needs to be asked about what was actually achieved. This can be answered with measured outputs and outcomes, but has to also take into account the evolving context (‘shifting goalposts’) that invariably occurs in complex dynamic systems. There can be a continuum between outputs and outcomes, often influenced by the way in which objectives are framed. Outputs are generally the on-ground measurement of management (e.g., kilometres of riparian fencing, amount of effort on feral animal or weed control, number of surveys), while outcomes are measures of the biodiversity success of management. For example, this may be the populations of indigenous animals affected by feral or invasive native animals or improved condition of floodplain forests.
b. OutputsThis process provides an opportunity for
reporting and reflection on the performance of
Fig. 15. Elephants damage and often destroy trees, and managers need to decide, based on appropriate values, what is acceptable in freshwater riparian areas. Historically, management in Kruger National Park was focused on family herds but bulls appear to be predominantly responsible. Active adaptive management experiments (exclusion of elephants) will help clarify biophysical trends, and build an overall understanding of how to manage a contentious issue (Photo. R. Grant).
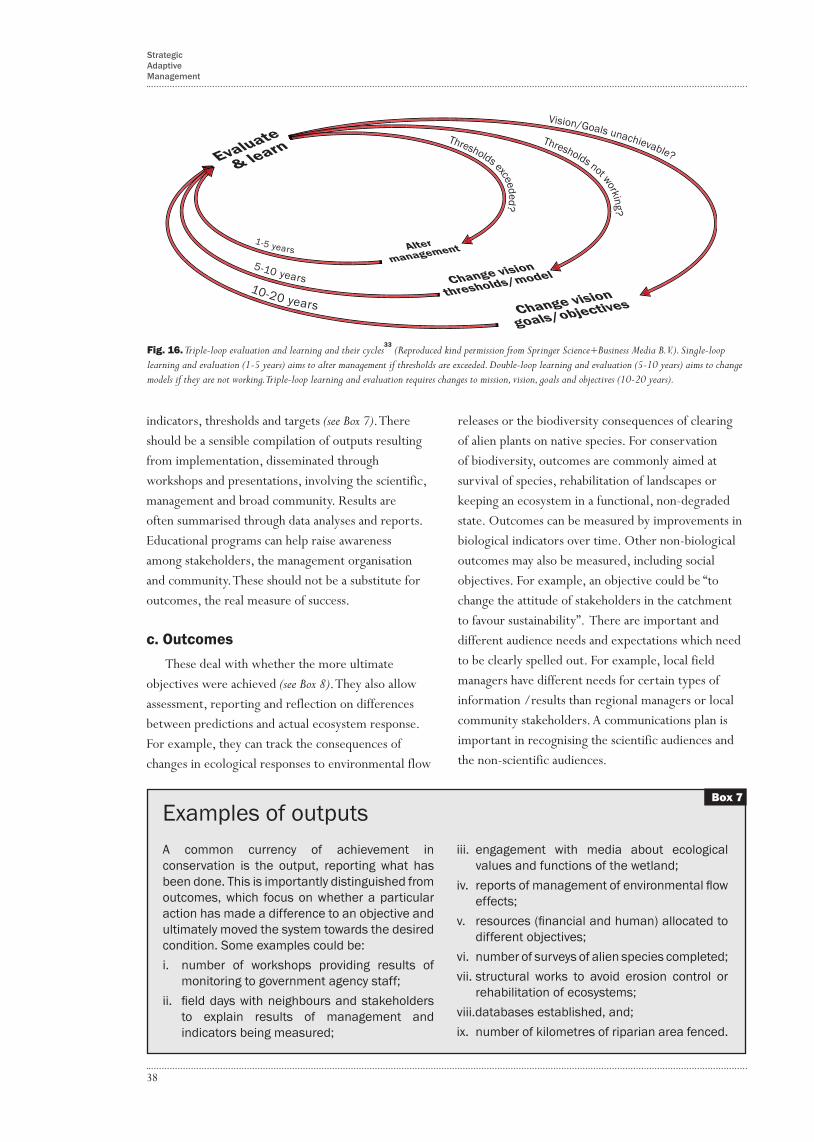
Strategic Adaptive Management
38
indicators, thresholds and targets (see Box 7). There should be a sensible compilation of outputs resulting from implementation, disseminated through workshops and presentations, involving the scientific, management and broad community. Results are often summarised through data analyses and reports. Educational programs can help raise awareness among stakeholders, the management organisation and community. These should not be a substitute for outcomes, the real measure of success.
c. OutcomesThese deal with whether the more ultimate
objectives were achieved (see Box 8). They also allow assessment, reporting and reflection on differences between predictions and actual ecosystem response. For example, they can track the consequences of changes in ecological responses to environmental flow
releases or the biodiversity consequences of clearing of alien plants on native species. For conservation of biodiversity, outcomes are commonly aimed at survival of species, rehabilitation of landscapes or keeping an ecosystem in a functional, non-degraded state. Outcomes can be measured by improvements in biological indicators over time. Other non-biological outcomes may also be measured, including social objectives. For example, an objective could be “to change the attitude of stakeholders in the catchment to favour sustainability”. There are important and different audience needs and expectations which need to be clearly spelled out. For example, local field managers have different needs for certain types of information /results than regional managers or local community stakeholders. A communications plan is important in recognising the scientific audiences and the non-scientific audiences.
A common currency of achievement in conservation is the output, reporting what has been done. This is importantly distinguished from outcomes, which focus on whether a particular action has made a difference to an objective and ultimately moved the system towards the desired condition. Some examples could be:i. number of workshops providing results of
monitoring to government agency staff;ii. field days with neighbours and stakeholders
to explain results of management and indicators being measured;
iii. engagement with media about ecological values and functions of the wetland;
iv. reports of management of environmental flow effects;
v. resources (financial and human) allocated to different objectives;
vi. number of surveys of alien species completed;vii. structural works to avoid erosion control or
rehabilitation of ecosystems;viii.databases established, and;ix. number of kilometres of riparian area fenced.
Examples of outputsBox 7
Altermanagement
Change vision
goals/objectives
Evaluate
& learn
Change vision
thresholds/model
1-5 years
5-10 years10-20 years
Vision/Goals unachievable?Thresholds not working?
Thresholds exceeded?
Fig. 16. Triple-loop evaluation and learning and their cycles33
(Reproduced kind permission from Springer Science+Business Media B.V.). Single-loop learning and evaluation (1-5 years) aims to alter management if thresholds are exceeded. Double-loop learning and evaluation (5-10 years) aims to change models if they are not working. Triple-loop learning and evaluation requires changes to mission, vision, goals and objectives (10-20 years).

Guidelines for effective conservation of
freshwater ecosystems
39
Plans must include achievable, meaningful targets, but not necessarily with the expectation that they will be reached. This respects the reality of a changing world with many drivers, some outside our control. It is far better to plan than to not plan, but it is also important to be adaptable when the target moves. The key is to have a plan that works and to use it as a living document.
In any non-trivial adaptive management system, clear documentation is required. Without this, it will be difficult to understand who did what and for what reasons, and there will be a lack of transparency. We have presented a set of basic guidelines to start practitioners on a viable path. All steps outlined (Fig. 7) need to be documented because systems can become complex, depending on the number of objectives and the management regime. Documentation is also critical for assessment and reflection and is ultimately a catalyst for learning. Also, accountability is critical in ensuring that learning occurs rigorously as management is implemented. All the information in setting the desired condition (Step 1) needs to be clearly captured in a Strategic Adaptive Management Plan, showing the
explicit exposition of the steps for easy review and revision. This may be done with two documents: a broad outline and a detailed operational plan.
Management decisions, indicators and thresholds of potential concern can be best documented with a series of tables that detail how information is acted upon and
critical time periods when decisions have to be made. There is also opportunity to integrate with organisational management plans, human and financial resource management, as long as these are explicitly linked. The Strategic Adaptive Management Plan, through an operational plan, should document all the steps as the prime source of guidance for thoughtful decision makers and their management. This may also require the shifting of resources and staff to better meet the requirements of the plan and its objectives, often with the help of comparative risk analysis. Finally, as experience builds, scientific effort and analyses need to be incorporated into documentation to guide future development and also ensure that
predictions of scenarios and modelling of indicators is informative for management. This may also require systems to manage data and outputs of scientific effort.
Outcomes describe whether or not you are actually achieving the objectives of your management. They track the success of long-term management and are the most critical aspect to measure. Often there is little information on such outcomes with most reporting resources devoted to outputs. Outcomes need to have a carefully designed monitoring system that provides rigorous data. Examples of outcomes include improved:
i. native fish populations, after controlling alien fish;ii. resilience of native biota from control of feral
animals;iii. condition of floodplain forests;iv. water quality; v. flow regime and connectivity;vi. stakeholder benefits (i.e. ecosystem services)
and;vii. awareness.
Examples of outcomesBox 8
Ongoing learning
is the hallmark
of all aspirational versions of Strategic Adaptive
Management.
Documentation

The Camargue in France is a complex social-ecological wetland system with different wetland types providing ecosystem services and habitats for organisms such as waterbirds. (Photo. R.T. Kingsford)

Guidelines for effective conservation of
freshwater ecosystems
41
This generic Strategic Adaptive Management framework, with its four essential steps, provides a way forward for rigorous implementation of adaptive management in aquatic protected areas and for management of environmental flows. Adaptive management is rewarding and challenging but it requires time, energy and trust. It is possible to relatively quickly produce a valuable first prototype, but continued development of adaptive management requires fresh energy. Trust, empathy and convergent understanding of how an ecosystem operates (congruency of mental models) among stakeholders are critical for improving success, over time. It is no accident that few places around the world have managed to effectively implement adaptive management. The good news is that applicability of Strategic Adaptive Management could span the gamut from the highly regulated river systems with considerable water resource development to free-flowing rivers and their protected areas. Most importantly, this process can increase in its scale of management, from a focus on the management of a freshwater protected area to environmental flows and the river and its basin.
The first step, to define the desired future condition or state, is relatively easy and workable. This allows an assessment of the attributes and threats to a protected area or ecosystem and a clear management focus, which is the solid foundation for progress. A key component is the development of a hierarchy of objectives, which ultimately leads to the search for appropriate management options. These can then be planned and effectively resourced, operationalised and evaluated. This is difficult because so many of the issues occur in a complex reality where even “good enough” solutions should be praised. The aim is to develop an optimal solution which trades-off against the various objectives and does not
necessarily favour one over another (e.g. tourism revenue, fish productivity). As all parts of ecosystems are linked, achievement of any particular objective may increase risk of not achieving other objectives. Adaptive management of ecosystems strives to deal with sustainable, changing whole systems that have resilience. Indicators can provide the evidence for reporting on management effectiveness and should always be based on what is required to support the objectives. We should measure what we need to measure, not what we necessarily know how to or like measuring. Of all steps, evaluation and learning are generally the most poorly executed. Success can only be measured by evaluation where there is assessment of the objectives. This should not deteriorate into a routine assessment procedure that does not adequately recognise the complexity of the ecosystem. The importance of triple-loop learning and evaluation is critical. It is important that conservation management demonstrate its professionalism within the context of high ecological complexity. Otherwise, there will increasingly be scrutiny of whether resources spent on conservation are actually achieving conservation outcomes.
It is incumbent on all managers of complex ecosystems to strive for success. In the reality of such a complex world, this often means staying afloat by achieving reasonable agreement and sustainability, amid turbulance and uncertainty. As with many human endeavours, this requires rigorous measurement of progress to enable ongoing improvement, and transparency to allow others to assess the approach. Management of freshwater ecosystems is difficult because of the threats to attributes from the catchment. Strategic Adaptive Management offers considerable promise as a way of managing this difficult exercise.
Conclusions

Strategic Adaptive Management
42
1. Anderies, J. M., Janssen, M. A. and Ostrom, E. (2004). A framework to analyze the robustness of social-ecological systems from an institutional perspective. Ecology and Society 9 18. [online] URL: http://www.ecologyandsociety.org/vol9/iss1/art18
2. McKibben, B. (1999). Continental conservation: Scientific foundations of regional reserve networks. New York Review of Books, 46, 44-46.
3. Margules, C. R. and Pressey, R. L. (2000). Systematic conservation planning. Nature 405, 243–253.
4. Lovejoy, T. E. (2006). Protected areas: a prism for a changing world. Trends in Ecology and Evolution 21, 329-333.
5. Secretariat of the Convention on Biological Diversity (SCBD) (2004). Decisions adopted by the Conference of the Parties to the Convention on Biological Diversity at its Seventh Meeting. UNEP/CBD/COP/7/21. Montreal: SCBD.
6. CBD COP10 (2010). Strategic Plan for Biodiversity, 2011-2020. Nagoya, Japan, Conference of the Parties to the Convention on Biological Diversity.
7. Chape, S., Harrison, J., Spalding, M. and Lysenko, I. (2005). Measuring the extent and effectiveness of protected areas as an indicator for meeting global biodiversity targets. Philosophical Transactions of the Royal Society B-Biological Sciences 360, 443-455.
8. Biggs, H., and Rogers. K.H. (2003). An adaptive system to link science, monitoring and management in practice. In The Kruger Experience: Ecology and Management of Savanna Heterogeneity. Du Toit, J.T., Rogers, K.H., Biggs, H.C. (Eds.), pp. 59-80. Island Press, Washington DC.
9. Kingsford, R.T., Biggs, H.C. and Pollard, S.R. (2011). Strategic Adaptive Management in freshwater protected areas and their rivers. Biological Conservation 144, 1194-1203. doi:10.1016/j.biocon.2010.09.022.
10. Rogers, K.H. (2005). Biodiversity custodianship in SANParks: a protected area management planning framework. Report to South African National Parks, Pretoria.
11. Arthington, A. H., Bunn, S. E., Poff, N. L. and Naiman, R. J. (2006). The challenge of providing environmental flow rules to sustain river ecosystems. Ecological Applications 16, 1311-1318.
12. Ervin, J. (2003). Protected area assessments in perspective. Bioscience 53, 819-822.
13. Root, T.L., Price, J.T., Hall, K.R., Schneider, S.H., Rosenzweig, C. and Pounds, J.A. (2003). Fingerprints of global warming on wild animals and plants. Nature, 421, 57-60.
14. Walters, C. J., and C. S. Holling. 1990. Large-scale management experiments and learning by doing. Ecology 71, 2060–2068. [doi:10.2307/1938620]
15. Australian National Audit Office (1998). Regional delivery model for the Natural Heritage Trust and the National Action Plan for salinity and water quality. Department of the Environment, Water, Heritage and the Arts and Department of Agriculture, Fisheries and Forestry. National Audit Report No. 21 2007-2008, Canberra. http://www.anao.gov.au/~/media/Uploads/Documents/2007%2008_audit_report_21.pdf
16. Hockings, M. (2003). Systems for assessing the effectiveness of management in protected areas. BioScience 53, 823-832.
17. SANParks (2008). Kruger Strategic Adaptive Management Plan. http://www.sanparks.org/assets/docs/conservation/park_man/knp-management-plan1.pdf
18. Karr, J.R. and Dudley, D.R. (1981). Ecological perspectives on water quality goals. Environmental Management 5, 55-68.
19. Rogers, K. and Biggs, H.C. (1999). Integrating indicators, endpoints and value systems in strategic management of the Kruger National Park. Freshwater Biology 41, 439-451.
20. Pollard, S. R., Biggs, H.C. and Du Toit, D. (2008). Towards a socio-ecological systems view of the Sand River Catchment, South Africa: An exploratory resilience analysis. WRC Project No. K8/591.
References

Guidelines for effective conservation of
freshwater ecosystems
43
21. Stirzaker, R., Biggs, H., Roux, D. and Cilliers, P. (2010). Requisite simplicities to help negotiate complex problems. Ambio 39, 600-607. DOI 10.1007/s13280-010-0075-7
22. Carpenter, S., Walker, B., Anderies, J.M. and Abel, N. (2001). From metaphor to measurement: resilience of what to what? Ecosystems 4, 765-781.
23. Walker, B., C. S. Holling, S. R. Carpenter, and Kinzig, A. (2004). Resilience, adaptability and transformability in social–ecological systems. Ecology and Society 9(2): 5. [online] URL: http://www.ecologyandsociety.org/vol9/iss2/art5
24. Folke, C., S. R. Carpenter, B. Walker, M. Scheffer, T. Chapin, and Rockström, J. (2010). Resilience thinking: integrating resilience, adaptability and transformability. Ecology and Society 15(4): 20. [online] URL: http://www.ecologyandsociety.org/vol15/iss4/art20/
25. Martin, J., Runge, M.C., Nichols, J.D., Lubow, B.C., (2009). Structured decision making as a conceptual framework to identify thresholds for conservation and management. Ecological Applications 19, 1079–1090.
26. Kingsford, R. T., Walker, K. F., Lester, R. E., Young, W. J., Fairweather, P. G., Sammut, J. and Geddes, M. (2011). A Ramsar wetland in crisis – the Coorong, Lower Lakes and Murray Mouth, Australia. Marine and Freshwater Research 62, 255-265.
27. Biggs, H., Ferreira, S., Freitag-Ronaldson, S. and Grant-Biggs, R. (2011). Taking stock after a decade: Does the ‘thresholds of potential concern’ concept need a socio-ecological revamp? Koedoe 53(2) DOI: 10.4102/ koedoe.v53i2.1002
28. Rumpff, L. Duncan, D.H., Vesk, P.A., Keith, D.A. and Wintle, B.A. (2011). State-and-transition modelling for adaptive management of native woodlands. Biological Conservation 144, 1224-1236
29. White, A.K. (2010). Ecosystem conceptual models for Victorian ecosystems. Report to Parks Victoria, Melbourne.
30. Gaylard, A. and Ferreira, S. (2011). Advances and challenges in the implementation of strategic adaptive management beyond the Kruger National Park – Making linkages between science and biodiversity management. Koedoe 53(1), DOI: 10.4102/koedoe.v53i1.1005
31. Pollard, S.R. & Du Toit, D.R. (2005). Recognizing heterogeneity and variability as key characteristics of savannah systems: the use of Strategic Adaptive Management as an approach to river management within the Kruger National Park, South Africa. Report of UNEP/GEF Project No. GF/2713-03-4679, Ecosystems, Protected Areas and People Project. IUCN, Gland.
32. Pollard, S. and du Toit, D. (2007). Ecosystems, Protected Areas and People (EPP) Project. UNEP GEF No. GF/27-13-03-4679. The Regional Protected Areas Programme of IUCN-The World Conservation Union in Asia. IUCN, Bangkok.
33. Stafford-Smith, D.M., Abel, N. Walker, B.H. and Chapin III, F.S. (2009). Drylands: Coping with uncertainty, thresholds and changes in state. In Principles of Resource Stewardship: Resilience-based Natural Resource Management in a Changing World. F.S. Chapin III, G.P. Kofinas, and D. Folke (Eds), pp. 171-195. Springer, New York.
1. Koedoe – African protected area conservation and science – Strategic Adaptive Management within South African National Parks http://www.koedoe.co.za/index.php/koedoe/issue/view/82
2. Biological Conservation – Adaptive management for biodiversity conservation in an uncertain world http://www.sciencedirect.com/science/journal/00063207/144/4
Further reading on adaptive management


![AT07175: SAM-BA Bootloader for SAM D21ww1.microchip.com/downloads/en/DeviceDoc/Atmel-42366-SAM... · 2016-12-10 · AT07175: SAM-BA Bootloader for SAM D21 [APPLICATION NOTE] Atmel-42366A-SAM-BA-Bootloader-for-SAM-D21-ApplicationNote_082014](https://img.dokumen.tips/doc/110x75/5f38185f0481442629236b2e/at07175-sam-ba-bootloader-for-sam-2016-12-10-at07175-sam-ba-bootloader-for-sam.jpg)