Embed Size (px)
Citation preview

Stitt River Mixing Zone Assessment
TASWATER
For Rosebery STP DPEMP
Final
3 March 2014
Stitt River Mixing Zone Assessment
PAGE i
Stitt River Mixing Zone
Project no: VT30538
Document title: Stitt River Mixing Zone Assessment
Document no: Final
Revision: R01
Date: 03 March 2014
Client name: TasWater
Client no: PO323635
Project manager: Elspeth Moroni
Author: Dr Bonnie Bonneville
File name: C:\Users\bbonneville\Documents\Organice\bbonneville\http\dmca-
apac.skmconsulting.com\80\sites\vt30538\DmcaConsult\Stitt River Mixing Zone
Assessment.docx
Sinclair Knight Merz
ABN 37 001 024 095
Floor 11, 452 Flinders Street
Melbourne VIC 3000
PO Box 312, Flinders Lane
T +61 3 8668 3000
F +61 3 8668 3001
www.globalskm.com
COPYRIGHT: The concepts and information contained in this document are the property of Sinclair Knight Merz Pty Ltd (SKM). Use or copying of
this document in whole or in part without the written permission of SKM constitutes an infringement of copyright.
Document history and status
Revision Date Description By Review Approved
R01 04/02/14 Review of draft S Treadwell 04/02/14 B Bonneville
Stitt River Mixing Zone Assessment
PAGE ii
Contents
1. Introduction ................................................................................................................................................................................... 1
1.1 Mixing zones ................................................................................................................................................................................... 1
2. Discharge quality and quantity.................................................................................................................................................... 2
3. Water quality objectives for Stitt River ....................................................................................................................................... 3
3.1 EPA water quality objectives........................................................................................................................................................... 3
3.2 Ambient water quality data.............................................................................................................................................................. 3
3.3 Australian Water Quality Guidelines ............................................................................................................................................... 4
4. Stitt River flows ............................................................................................................................................................................. 5
4.1 7Q10 Flow in Stitt River .................................................................................................................................................................. 5
5. Mixing zone assessment .............................................................................................................................................................. 6
5.1 Dilution of effluent ........................................................................................................................................................................... 6
5.2 Dilutions of pollutant concentrations ............................................................................................................................................... 6
6. Conclusion .................................................................................................................................................................................... 8
7. References..................................................................................................................................................................................... 9
Stitt River Mixing Zone Assessment
Final
1. Introduction
TasWater proposes to position an outfall for the new Rosebery Sewage Treatment Plant (STP) on the Stitt River
downstream of Rosebery. The new Rosebery STP will receive and treat sewage from the Rosebery Township to
Accepted Modern Technology (AMT) standard and discharge treated effluent to Stitt River via the outfall. The
treated effluent will have elevated nutrient concentrations and will form an area in the river where water quality
conditions are outside the natural background variability. This area is defined as the mixing zone. The objective
of this study is to determine the size of the mixing zone in Stitt River from the Rosebery STP outfall.
1.1 Mixing zones
If the water quality of the effluent does not comply with the water quality objectives (WQOs) for the receiving
waters, then a mixing zone may be designated around the point of discharge (Figure 1-1). The water quality
within the mixing zone is permitted to be outside of the normal range for the receiving environment, provided it
does not detract from the values or uses of the waters. The size of the mixing zone is calculated under the
7Q10 dry condition flows (i.e. lowest 7 day flow rate which can be expected to occur in a 10 year period) using
the 90th percentile effluent discharge pollutant concentrations (EPA Tas 2013). The result is a conservative
estimate of the mixing zone.
Figure 1-1 Mixing zone illustration
Mixing zones will not be designated in areas that (State Policy on Water Quality Management 1997; Clause
20.3 (d)):
receive significant and regular use for primary contact recreation;
are recognised areas of significant value as spawning or nursery areas;
are close to areas used for aquaculture;
are close to potable water supply intakes;
are of outstanding ecological or scientific importance; or
for which the protected environmental values include protection of pristine aquatic ecosystems.

Stitt River Mixing Zone Assessment
Final PAGE 2
2. Discharge quality and quantity
The proposed outfall location (55G 377875E, 5373831N) is on the Stitt River downstream of the Stitt River falls,
about 2 km upstream of the confluence with Lake Pieman. The location is downstream of the township of
Rosebery and the Rosebery Cabin and Tourist Park. It is also downstream of the MMG Rosebery mine. The
proposed outfall location and the Stitt River downstream are situated in a forested gully, which is not easily
accessed by the general public.
The quality and quantity of the Rosebery STP effluent has not yet been finalised. However, the quality will meet
the AMT standard as described by the Emission Limit Guidelines for Sewage Treatment Plants that discharge
pollutants into fresh and marine waters (DPIWE 2001). These performance parameters are presented in Table
2-1. These guidelines are applicable to all new and existing sewage treatment plants that discharge into fresh or
marine waters with wastewater flows of less than 500 kL/day average dry weather flow (ADWF). The mixing
zone is calculated using the 90th percentile limits.
Table 2-1 AMT effluent quality limits. Highlighted cells are the numbers used to determine the mixing zone
Parameter Median 90%ile Maximum
BOD (mg/L) 5 10 15
Non-Filterable Residue (mg/L) 10 15 20
Thermotolerant Coliforms (cfu/ 100mL) - - 200
Oil and Grease (mg/L) 2 5 10
Total Nitrogen (mgN/ L) 7 10 15
Ammonia (mg N/L) 1 2 5
Total Phosphorus (mgP/L) 0.5 1 3
pH - - 6.5 – 8.5
An average daily flow (ADF) of approximately 0.41 ML/d and an ADWF of approximately 0.24 ML/day is
expected from the Rosebery STP outfall, based on inflow volumes (Table 2-2). Dry weather flows only occur for
four to five weeks per year as the system is significantly impacted by infiltration during frequent wet weather
(CMW 2013, p.5). The mixing zone is calculated using the ADWF of 0.24 ML/day as the effluent volume, as this
would be the outfall volume expected under the 7Q10 flow conditions in Stitt River.
Table 2-2 Existing Rosebery influent data (from the DRAFT Rosebery STP DPEMP). Highlighted cells are the flow used to
determine the mixing zone
Description Rate ML/day How Determined Comments
ADWF 0.24 Calculated Tenement based excluding infiltration into the
network
Wet Weather Flow from SPS 1.6 Estimated This equated to 18.5 l/s over 24 hours
ADF 0.41 Estimated This equated to 4.7 l/s over 24 hours
Minimum ADF 0.13 Observed Measured once on site during summer dry
weather.
Current maximum pump deliverable
capacity
3.2 Estimated This equated to 37.0 l/s over 24 hours
Stitt River Mixing Zone Assessment
Final PAGE 3
3. Water quality objectives for Stitt River
According to EPA Tas (2013), the preferred WQOs for assessing outfall impacts to slightly to moderately
disturbed ecosystems are the EPA published WQOs (EPA Tas, nd). Alternative, but less desirable, WQOs are
the 80th percentile of site-specific data (CMW 2013) or the default Australian Water Quality Guidelines
(ANZECC & ARMCANZ 2000). These WQO options are outlined in this section.
3.1 EPA water quality objectives
Site specific water quality and biological condition objectives have been developed for the monitoring sites at
Stitt River at Rosebery (site code: PIEM22) (EPA Tas nd). The WQOs were set based on the 80th percentile
values of ambient data collected between 2004 and 2009 (EPA Tas nd). However, regional values were used to
set WQOs for nutrients because there was no background nutrient data available for this site (Table 3-1). The
annual WQOs will be used to define the boundary of the mixing zone.
Table 3-1 Site specific WQOs for Stitt River at Rosebery (PIEM22) (EPA Tasmania, nd). Highlighted cells are those used to
determine the mixing zone
Water Quality Indicator Annual WQ obj Summer Winter Autumn Spring
Percentile 20th 80th 20th 80th 20th 80th 20th 80th 20th 80th
Ammonia as N mg/L* 0.012 0.012 0.014 0.011 0.012
Total N as N mg/L* 0.381 0.370 0.485 0.340 0.376
Total P mg/L* 0.021 0.021 0.025 0.017 0.020
Total Suspended Solids mg/L 5.00 5.00 10.00 5.00 5.00
pH 5.9 6.7 6.2 6.7 5.7 6.4 5.9 6.9 6.2 6.6
*based on regional values, ~ based on statewide values
3.2 Ambient water quality data
Water quality data has been collected at the proposed outfall site (downstream) on Stitt River as part of the
ambient water quality monitoring program for the Rosebery STP (CMW 2013) from January to August 2013
(Table 3-2). This data shows that ammonia and total nitrogen levels are higher than the EPA WQOs, whereas
total phosphorus and total suspended solids levels are lower than the EPA WQOs (Table 3-2). As there are only
eight months of data within one year, it cannot be assumed that the data is representative of the background
variability of Stitt River. However, as the data is specific to Stitt River at the outfall location, the 80th percentile
concentration is likely to be a more suitable objective than the regional-based nutrient objectives. Therefore, the
80th percentile concentration from Stitt River will also be modelled to compare with the results from using the
WQOs to define the extent of the mixing zone.
Table 3-2 Ambient data for Stitt River downstream of Rosebery (CMW 2013). Highlighted cells are used for the mixing zone
WQ indicator Median of ambient data
collected Jan-Aug 2013 (15
samples)
80th
percentile of ambient data
collected Jan-Aug 2013 (15
samples)
EPA WQO for comparison
*based on regional values
Ammonia (mg/L) 0.010 0.025 0.012*
Total N (mg/L) 0.350 0.480 0.381*
Total P (mg/L) 0.008 0.010 0.021*
Total Suspended Solids (mg/L) 1 2.4 5.00
pH 6.4 6.6 6.7
Stitt River Mixing Zone Assessment
Final PAGE 4
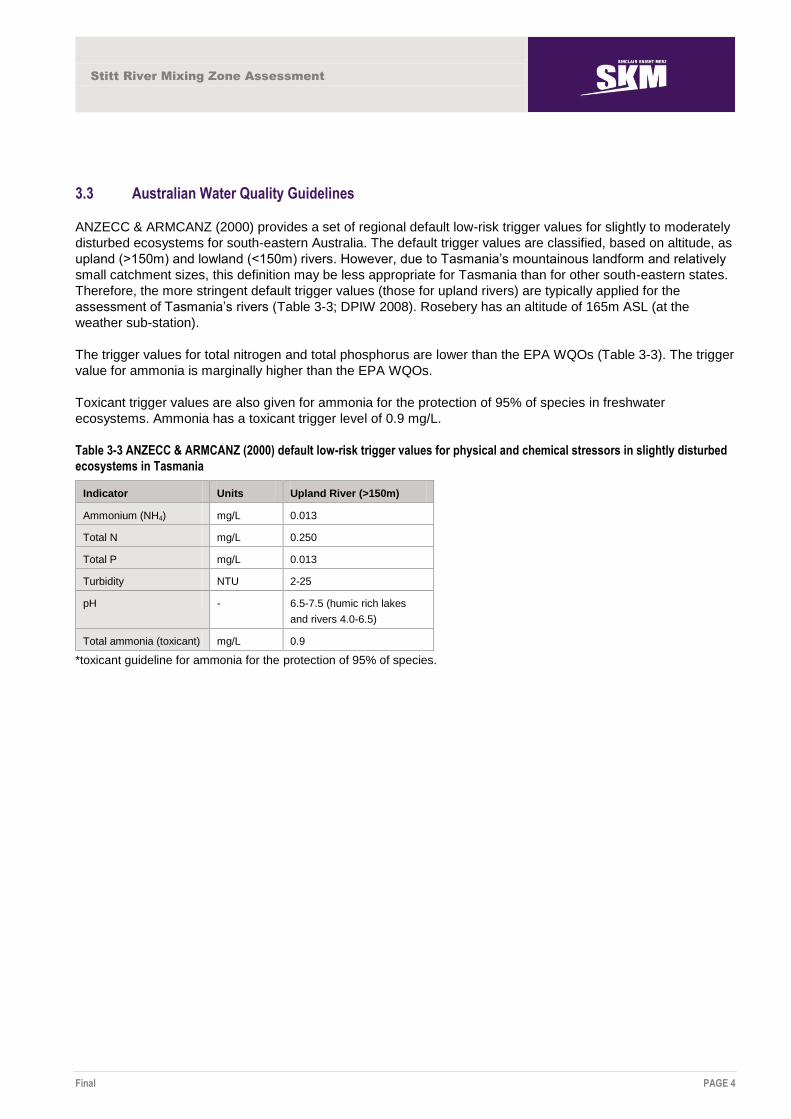
3.3 Australian Water Quality Guidelines
ANZECC & ARMCANZ (2000) provides a set of regional default low-risk trigger values for slightly to moderately
disturbed ecosystems for south-eastern Australia. The default trigger values are classified, based on altitude, as
upland (>150m) and lowland (<150m) rivers. However, due to Tasmania’s mountainous landform and relatively
small catchment sizes, this definition may be less appropriate for Tasmania than for other south-eastern states.
Therefore, the more stringent default trigger values (those for upland rivers) are typically applied for the
assessment of Tasmania’s rivers (Table 3-3; DPIW 2008). Rosebery has an altitude of 165m ASL (at the
weather sub-station).
The trigger values for total nitrogen and total phosphorus are lower than the EPA WQOs (Table 3-3). The trigger
value for ammonia is marginally higher than the EPA WQOs.
Toxicant trigger values are also given for ammonia for the protection of 95% of species in freshwater
ecosystems. Ammonia has a toxicant trigger level of 0.9 mg/L.
Table 3-3 ANZECC & ARMCANZ (2000) default low-risk trigger values for physical and chemical stressors in slightly disturbed
ecosystems in Tasmania
Indicator Units Upland River (>150m)
Ammonium (NH4) mg/L 0.013
Total N mg/L 0.250
Total P mg/L 0.013
Turbidity NTU 2-25
pH - 6.5-7.5 (humic rich lakes
and rivers 4.0-6.5)
Total ammonia (toxicant) mg/L 0.9
*toxicant guideline for ammonia for the protection of 95% of species.
Stitt River Mixing Zone Assessment
Final PAGE 5
4. Stitt River flows
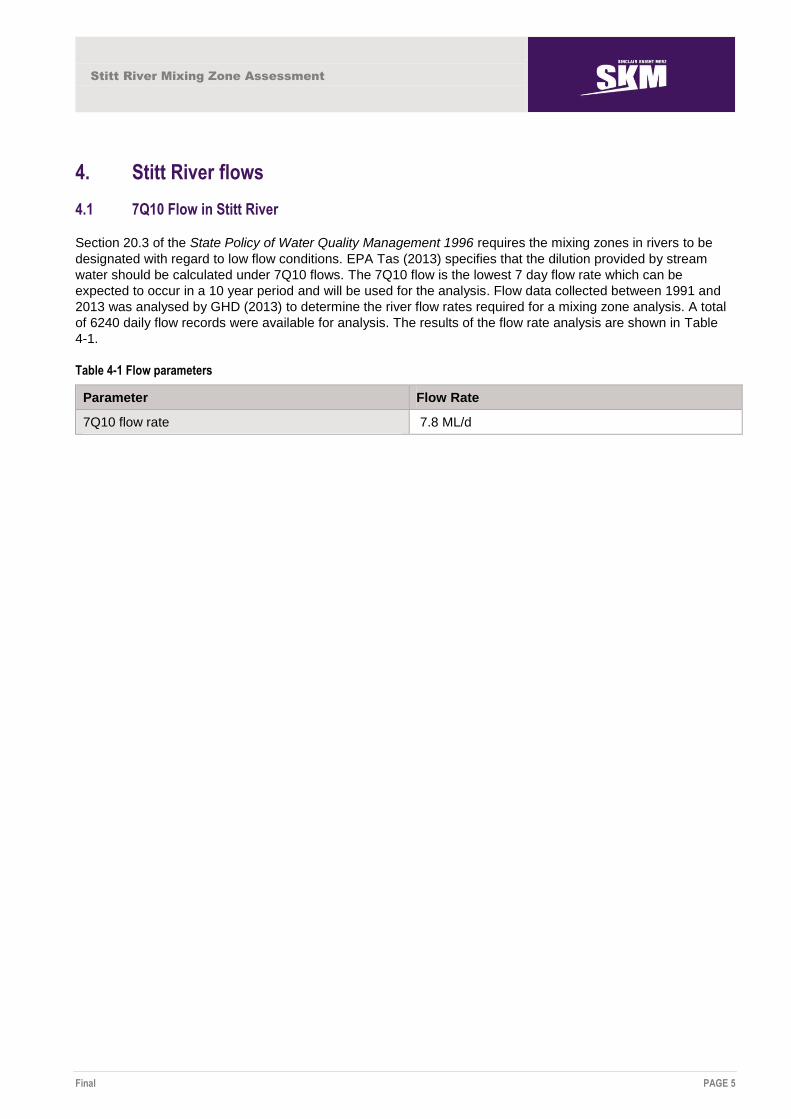
4.1 7Q10 Flow in Stitt River
Section 20.3 of the State Policy of Water Quality Management 1996 requires the mixing zones in rivers to be
designated with regard to low flow conditions. EPA Tas (2013) specifies that the dilution provided by stream
water should be calculated under 7Q10 flows. The 7Q10 flow is the lowest 7 day flow rate which can be
expected to occur in a 10 year period and will be used for the analysis. Flow data collected between 1991 and
2013 was analysed by GHD (2013) to determine the river flow rates required for a mixing zone analysis. A total
of 6240 daily flow records were available for analysis. The results of the flow rate analysis are shown in Table
4-1.
Table 4-1 Flow parameters
Parameter Flow Rate
7Q10 flow rate 7.8 ML/d
Stitt River Mixing Zone Assessment
Final PAGE 6
5. Mixing zone assessment
5.1 Dilution of effluent
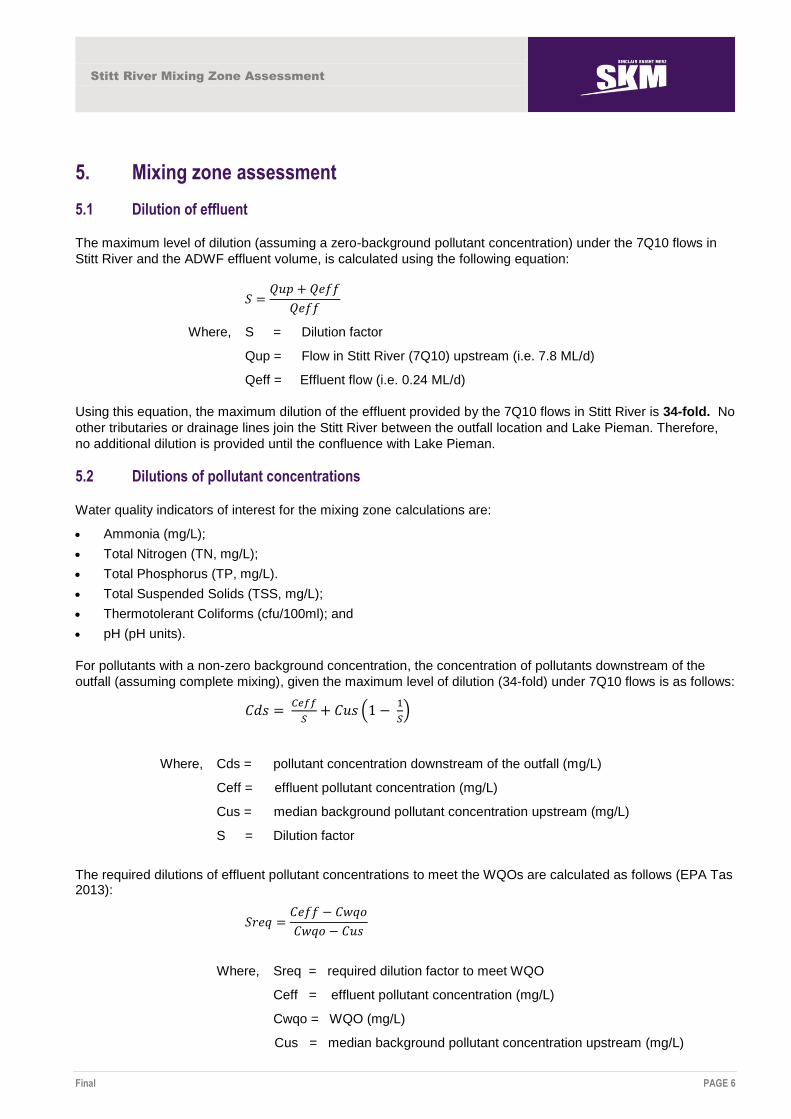
The maximum level of dilution (assuming a zero-background pollutant concentration) under the 7Q10 flows in
Stitt River and the ADWF effluent volume, is calculated using the following equation:
Where, S = Dilution factor
Qup = Flow in Stitt River (7Q10) upstream (i.e. 7.8 ML/d)
Qeff = Effluent flow (i.e. 0.24 ML/d)
Using this equation, the maximum dilution of the effluent provided by the 7Q10 flows in Stitt River is 34-fold. No
other tributaries or drainage lines join the Stitt River between the outfall location and Lake Pieman. Therefore,
no additional dilution is provided until the confluence with Lake Pieman.
5.2 Dilutions of pollutant concentrations
Water quality indicators of interest for the mixing zone calculations are:
Ammonia (mg/L);
Total Nitrogen (TN, mg/L);
Total Phosphorus (TP, mg/L).
Total Suspended Solids (TSS, mg/L);
Thermotolerant Coliforms (cfu/100ml); and
pH (pH units).
For pollutants with a non-zero background concentration, the concentration of pollutants downstream of the
outfall (assuming complete mixing), given the maximum level of dilution (34-fold) under 7Q10 flows is as follows:
Where, Cds = pollutant concentration downstream of the outfall (mg/L)
Ceff = effluent pollutant concentration (mg/L)
Cus = median background pollutant concentration upstream (mg/L)
S = Dilution factor
The required dilutions of effluent pollutant concentrations to meet the WQOs are calculated as follows (EPA Tas 2013):
Where, Sreq = required dilution factor to meet WQO
Ceff = effluent pollutant concentration (mg/L)
Cwqo = WQO (mg/L)
Cus = median background pollutant concentration upstream (mg/L)
Stitt River Mixing Zone Assessment
Final PAGE 7
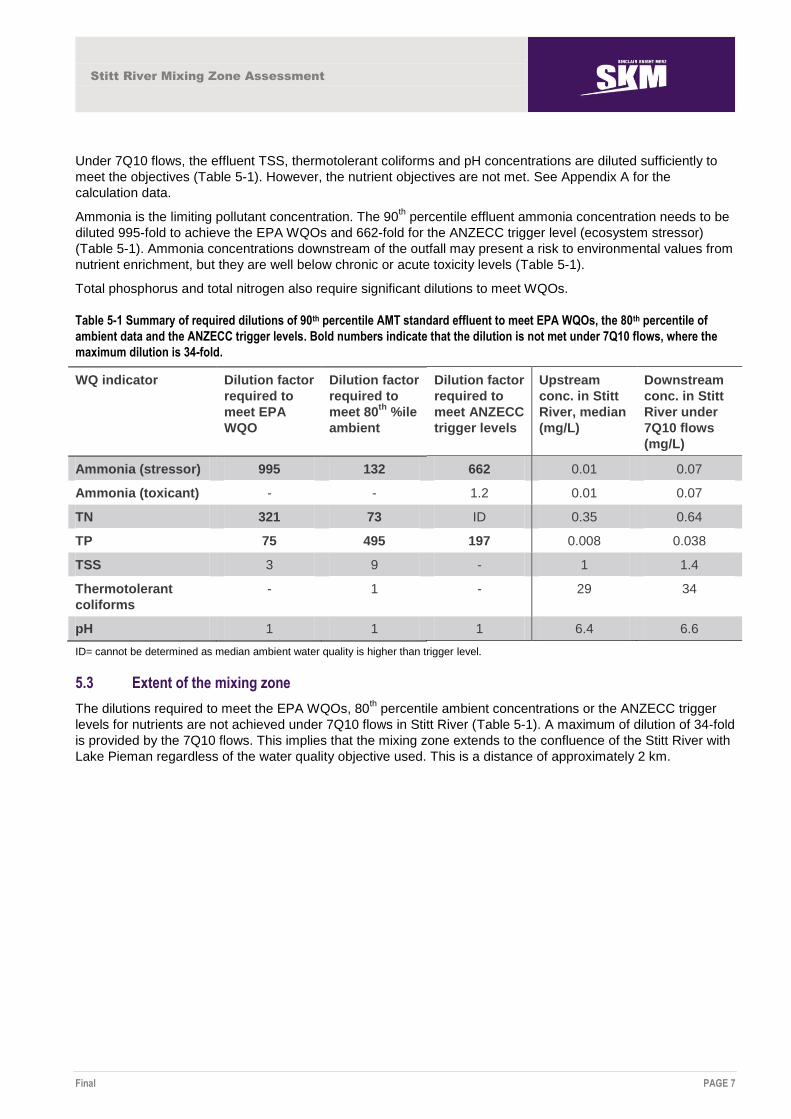
Under 7Q10 flows, the effluent TSS, thermotolerant coliforms and pH concentrations are diluted sufficiently to
meet the objectives (Table 5-1). However, the nutrient objectives are not met. See Appendix A for the
calculation data.
Ammonia is the limiting pollutant concentration. The 90th percentile effluent ammonia concentration needs to be
diluted 995-fold to achieve the EPA WQOs and 662-fold for the ANZECC trigger level (ecosystem stressor)
(Table 5-1). Ammonia concentrations downstream of the outfall may present a risk to environmental values from
nutrient enrichment, but they are well below chronic or acute toxicity levels (Table 5-1).
Total phosphorus and total nitrogen also require significant dilutions to meet WQOs.
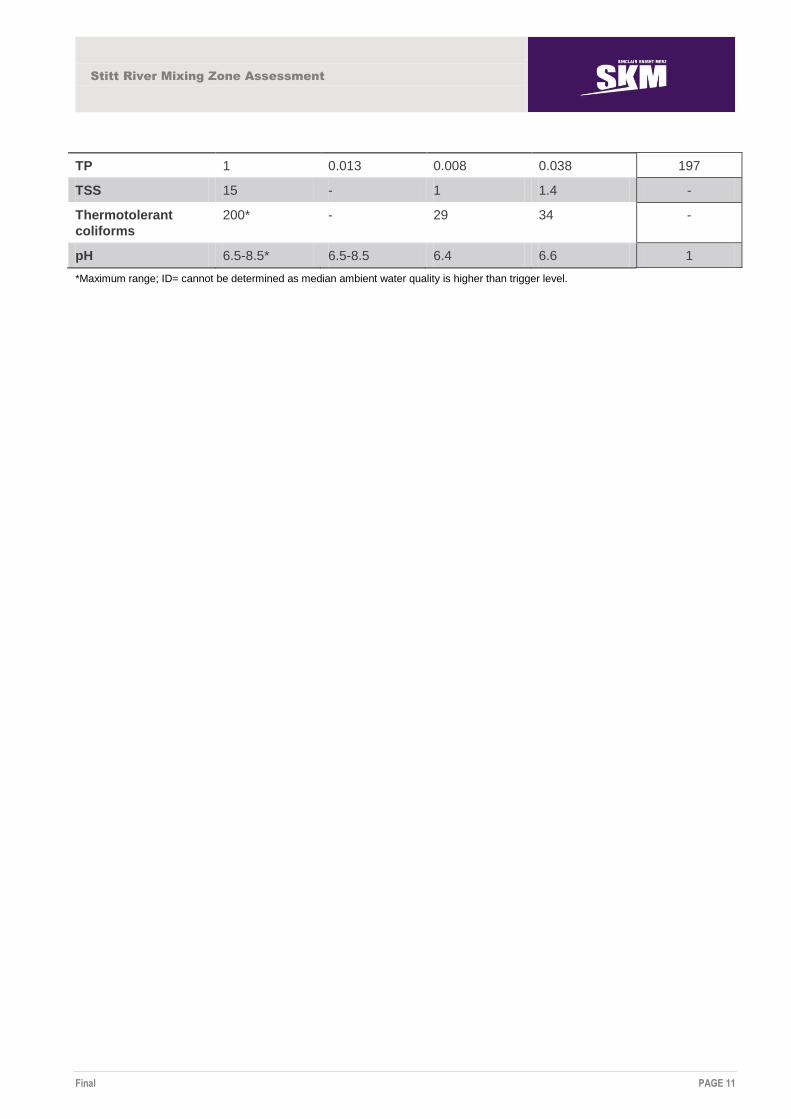
Table 5-1 Summary of required dilutions of 90th percentile AMT standard effluent to meet EPA WQOs, the 80th percentile of
ambient data and the ANZECC trigger levels. Bold numbers indicate that the dilution is not met under 7Q10 flows, where the
maximum dilution is 34-fold.
WQ indicator Dilution factor
required to
meet EPA
WQO
Dilution factor
required to
meet 80th
%ile
ambient
Dilution factor
required to
meet ANZECC
trigger levels
Upstream
conc. in Stitt
River, median
(mg/L)
Downstream
conc. in Stitt
River under
7Q10 flows
(mg/L)
Ammonia (stressor) 995 132 662 0.01 0.07
Ammonia (toxicant) - - 1.2 0.01 0.07
TN 321 73 ID 0.35 0.64
TP 75 495 197 0.008 0.038
TSS 3 9 - 1 1.4
Thermotolerant
coliforms
- 1 - 29 34
pH 1 1 1 6.4 6.6
ID= cannot be determined as median ambient water quality is higher than trigger level.
5.3 Extent of the mixing zone
The dilutions required to meet the EPA WQOs, 80th percentile ambient concentrations or the ANZECC trigger
levels for nutrients are not achieved under 7Q10 flows in Stitt River (Table 5-1). A maximum of dilution of 34-fold
is provided by the 7Q10 flows. This implies that the mixing zone extends to the confluence of the Stitt River with
Lake Pieman regardless of the water quality objective used. This is a distance of approximately 2 km.
Stitt River Mixing Zone Assessment
Final PAGE 8
6. Conclusion
An analysis of the 90th percentile Rosebery STP effluent and background pollutant concentrations in Stitt River
(and regionally where data was insufficient) indicates that the effluent will need to be diluted approximately 995-
fold to attain the preferred EPA WQOs at the edge of the mixing zone. A maximum dilution of 34-fold is provided
by 7Q10 flows in Stitt River. Therefore, the size of the mixing zone extends about 2 km downstream of the
outfall to the confluence with Lake Pieman.
The nutrient concentrations in the mixing zone may present a risk to environmental values from nutrient
enrichment, but are well below chronic or acute toxicity levels.

Stitt River Mixing Zone Assessment
Final PAGE 9
7. References
ANZECC & ARMCANZ (2000). Australian and New Zealand Guidelines for Fresh and Marine Water Quality,
National Water Quality Management Strategy Paper No. 4, Australian and New Zealand Environment and
Conservation Council (ANZECC) and Agriculture and Resource Management Council of Australia and New
Zealand (ARMCANZ).
DPIWE (2001). Emission limit guidelines: Sewage treatment plants that discharge pollutants into fresh and
marine waters. Tasmanian Department of Primary Industries, Water and Environment
EPA Tas (nd). Stitt River at Rosebery. Water quality and biological condition objectives. EPA Tasmania.
EPA Tas (2013). Wastewater ambient monitoring program - key parameters for assessing outfall impacts. EPA
Tasmania.
GHD (2013). Rosebery STP DPEMP Stitt River mixing assessment. A report to TasWater by GHD.
Tasmanian Government (1997). State policy on water quality management 1997.

Stitt River Mixing Zone Assessment
Final PAGE 10
Appendix A. Mixing zone calculations
Table 7-1 Dilutions required for the EPA WQOs for Stitt River (PIEM22; EPA tas, nd), where nutrient objectives are based on
regional values. ADWF (0.24 ML/d) from Rosebery STP in 7Q10 flows (7.8 ML/d) in Stitt River.
WQ indicator Ceff
90th
percentile
effluent quality
(mg/L)
Cwqo
EPA WQO
(annual) (mg/L)
Cus
50th
percentile
ambient conc.
(mg/L)
Cds
Diluted conc.
under 7Q10
flows (mg/L)
Sreq
Dilution factor
required to
meet WQO
Ammonia 2 0.012 0.01 0.069 995
TN 10 0.38 0.35 0.64 321
TP 1 0.021 0.008 0.038 75
TSS 15 5 1 1.4 3
Thermotolerant
coliforms
200* ND 29 34 -
pH 6.5-8.5* 6.7 6.4 6.6 1
*Maximum range
Table 7-2 Dilutions required to meet the 80th percentile of Stitt River data, sampled from January to August 2013 at the
proposed outfall location as part of the ambient monitoring program for the Rosebery STP for receiving waters (CMW 2013).
ADWF (0.24 ML/d) from Rosebery STP in 7Q10 flows (7.8 ML/d).
WQ indicator Ceff
90th
percentile
effluent quality
(mg/L)
Cwqo
80th
percentile
ambient conc.
(mg/L)
Cus
50th
percentile
ambient conc.
(mg/L)
Cds
Diluted conc.
under 7Q10
flows (mg/L)
Sreq
Dilution factor
required to
meet 80th
%ile
Ammonia 2 0.025 0.01 0.069 132
TN 10 0.48 0.35 0.64 73
TP 1 0.01 0.008 0.038 495
TSS 15 2.4 1 1.4 9
Thermotolerant
coliforms
200* 132 29 34 1
pH 6.5-8.5* 6.6 6.4 6.6 1
*Maximum range
Table 7-3 Dilutions required to meet the ANZECC WQ trigger levels. ADWF (0.24 ML/d) from Rosebery STP in 7Q10 flows (7.8
ML/d)
WQ indicator Ceff
90th
percentile
effluent
quality (mg/L)
Cwqo
ANZECC
trigger level
(mg/L)
Cus
50th
percentile
ambient conc.
(mg/L)
Cds
Diluted conc.
under 7Q10
flows (mg/L)
Sreq
Dilution factor
required to
meet ANZECC
Ammonia (stressor) 2 0.013 0.01 0.069 662
Ammonia (toxicant) 2 0.9 0.01 0.069 1.2
TN 10 0.25 0.35 0.64 ID
Stitt River Mixing Zone Assessment
Final PAGE 11
TP 1 0.013 0.008 0.038 197
TSS 15 - 1 1.4 -
Thermotolerant
coliforms
200* - 29 34 -
pH 6.5-8.5* 6.5-8.5 6.4 6.6 1
*Maximum range; ID= cannot be determined as median ambient water quality is higher than trigger level.