Embed Size (px)
Citation preview
Measures of AcademicProgress® l MAP®
Northwest Evaluation Association™121 NW Everett Street, Portland, OR 97209
503.624.1951 | NWEA.org | Rev 6/13 | ©2013 Northwest Evaluation Association | MAPXX_PRDV20055
Stepping Stones to Using Data Workbook

Copyright©2013 Northwest Evaluation Association™
All rights reserved. No part of this manual may be reproduced or utilized in any form or by any means, electronic or mechanical, including photocopying, recording, or by any information storage and retrieval system, without written permission from NWEA.
TrademarksMeasures of Academic Progress, MAP, DesCartes: A Continuum of Learning, Partnering to help all kids learn, Power of Instructional Design, Power of Teaching, Power of Coaching, Keeping Learning on Track, and Learning Plans on Demand are registered trademarks of NWEA in the U.S. and in other countries. Northwest Evaluation Association, NWEA, GRD, KLT, Skills Pointer, Children’s Progress Academic Assessment, and CPAA are trademarks of NWEA in the U.S. and in other countries.
Lexile® is a trademark of MetaMetrics, Inc., and is registered in the United States and abroad.
The names of other companies and their products mentioned are the trademarks of their respective owners.
REPORTS ACTIVITIES
MAP
® FOR PRIM
ARY GRAD
ESRESO
URCES:
CLIENT-SERVER U
SERS
MAP
® FOR PRIM
ARY GRAD
ESRESO
URCES:
WEB-BASED
USERS
STEPPING STONES TO USING DATA
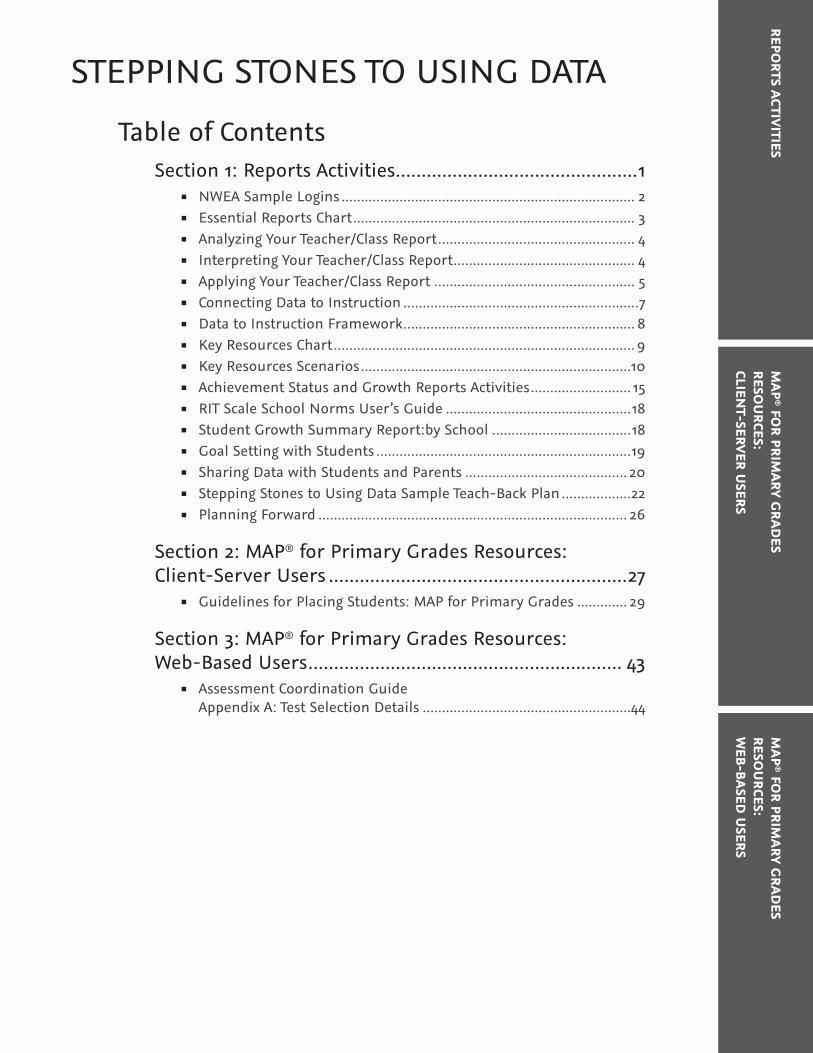
Table of ContentsSection 1: Reports Activities ...............................................1
�� NWEA Sample Logins ............................................................................ 2�� Essential Reports Chart ......................................................................... 3�� Analyzing Your Teacher/Class Report ................................................... 4�� Interpreting Your Teacher/Class Report ............................................... 4�� Applying Your Teacher/Class Report .................................................... 5�� Connecting Data to Instruction .............................................................7�� Data to Instruction Framework ............................................................ 8�� Key Resources Chart .............................................................................. 9�� Key Resources Scenarios ......................................................................10�� Achievement Status and Growth Reports Activities .......................... 15�� RIT Scale School Norms User’s Guide ................................................18�� Student Growth Summary Report:by School ....................................18�� Goal Setting with Students ..................................................................19�� Sharing Data with Students and Parents .......................................... 20�� Stepping Stones to Using Data Sample Teach-Back Plan ..................22�� Planning Forward ................................................................................ 26
Section 2: MAP® for Primary Grades Resources: Client-Server Users ..........................................................27
�� Guidelines for Placing Students: MAP for Primary Grades ............. 29
Section 3: MAP® for Primary Grades Resources: Web-Based Users ............................................................. 43
�� Assessment Coordination Guide Appendix A: Test Selection Details ......................................................44


Stepping Stones to Using Data Workbook | NWEA™ 1
REPORTS ACTIVITIES
SECTION 1 Reports Activities
2 Stepping Stones to Using Data Workbook | NWEA™
REPO
RTS
ACTI
VITI
ES
NWEA Sample LoginsFor Client-Server MAP® UsersNWEA Report Site: http://reports.nwea.org
Standard MAP Teacher
Login: ____________________________________Password: ____________________________________Term: Previous fall term
Primary Teacher
Login: ____________________________________Password: ____________________________________
Term: Previous fall term
School Administrator
Login: ____________________________________Password: ____________________________________Term: Previous fall term
For Web-Based MAP® UsersMARC: https://nweapd01-admin.mapnwea.org/admin
Standard MAP Teacher
Login: ____________________________________ Password: ____________________________________
Term: Previous fall term
Primary Teacher
Login: ____________________________________ Password: ____________________________________
Term: Previous fall term
School Administrator
Login: ____________________________________Password: ____________________________________
Term: Previous fall term
3Stepping Stones to Using Data Workbook | NWEA™
REPORTS ACTIVITIES
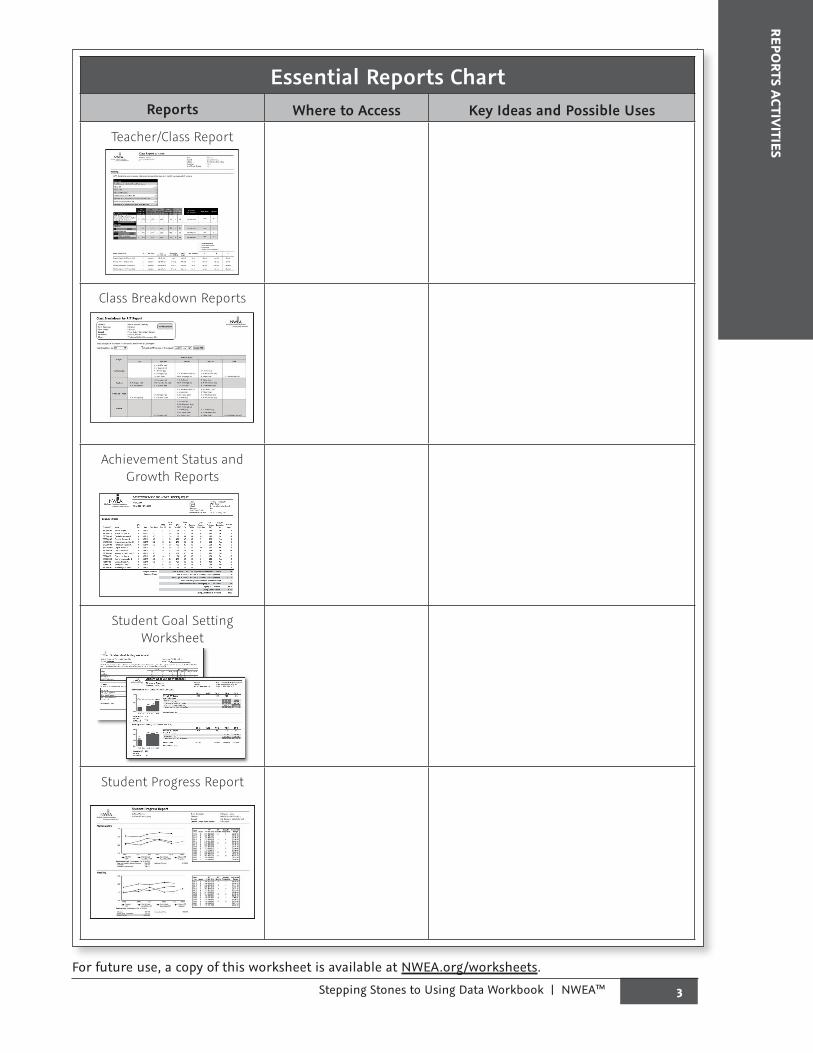
Essential Reports ChartReports Where to Access Key Ideas and Possible Uses
Teacher/Class Report
Class Breakdown Reports
Achievement Status and Growth Reports
Student Goal Setting Worksheet
Student Progress Report
For future use, a copy of this worksheet is available at NWEA.org/worksheets.

4 Stepping Stones to Using Data Workbook | NWEA™
REPO
RTS
ACTI
VITI
ES
Analyzing Your Teacher/Class ReportFor this activity, use the annotated Teacher/Class Report in the Reports Portfolio, your own Teacher/Class Report, the Normative Data document, and your State Proficiency Tables (if available).
Data Exploration and Predictions1. Explore the annotated Teacher/Class
Report. What questions and new learning do you have about this report? __________________________________________ __________________________________________ __________________________________________
2. Discuss your questions and confirm your understanding with a partner.
3. Predict what you think you will see in your own data. What do you hope to see? ___________________________________________ ___________________________________________
4. Explore your own report. Observe your data and check your predictions. What patterns do you see? ___________________________________________ ___________________________________________
Interpreting Your Teacher/Class ReportCompare your class mean and median to the Normative Data document.
RIT Score
My Class Mean
My Class Median
Normative Data Mean
1. Is the mean or median for your class above or below the typical norm score for the grade level? ___________________________________________
2. How might this impact instruction in your classroom? _______________________________ ___________________________________________
3. Consider how well your grade-level text-book and materials match your students’ instructional readiness.
4. Have any of your students scored below the 10th percentile? What instructional strategies will be most effective with these students? ___________________________________________ ___________________________________________
5. Have any of your students scored at the 95th percentile or above? What in-structional strategies will you use with these students? ___________________________________________ ___________________________________________ ___________________________________________
6. The standard deviation indicates the range of instructional levels for a group of stu-dents. The higher the standard deviation, the more diverse the instructional levels are within your group; the lower the stan-dard deviation, the more your students are instructionally alike.
�� Which goal area has the highest stan-dard deviation? ______________________________________ ______________________________________
�� How might this impact instruction in your classroom? ______________________________________ ______________________________________ ______________________________________

5Stepping Stones to Using Data Workbook | NWEA™
REPORTS ACTIVITIES
Applying Your Teacher/Class Report
Goal Performance AreasLook at the mean score for each goal performance area.
1. Which goal areas are a mean 3 or more RIT points higher than the class overall mean? ________________________________________
2. Which goal areas are a mean 3 or more RIT points lower than the class overall mean? ________________________________________
3. How might this information help long-range planning? ________________________________________ ________________________________________
Look at the Teacher/Class Report in the Goal Descriptors View.
Notice how students performed in specific goal areas.
4. Which students need significantly more assistance? On which specific goal areas? ________________________________________ ________________________________________ ________________________________________
Lexile® Measures
Look at the Lexile® Range on your Reading Teacher/Class Report.
Explore Lexile.com.
1. How do these equate to grade-level approximations? ______________________ _______________________________________ _______________________________________
2. How can you expose your students to their Lexile range while maintaining the grade-level concepts and standards? _______________________________________ _______________________________________ _______________________________________ _______________________________________
For Grades Administering Standard MAP®
If available, review the State Proficiency Tables for your state. Note the cut scores for reading and/or mathematics for your grade level.
1. On average, at what percentile do stu-dents have to score on MAP to be profi-cient (to meet the standard) on the state assessment in math? _________________________________________ In reading? _________________________________________
2. Notice which students are above or be-low this score.
3. Select a student who is above or below. How will you work with this particular student to increase his/her score? Which goal area needs the most attention? ________________________________________ ________________________________________ ________________________________________
6 Stepping Stones to Using Data Workbook | NWEA™
REPO
RTS
ACTI
VITI
ES
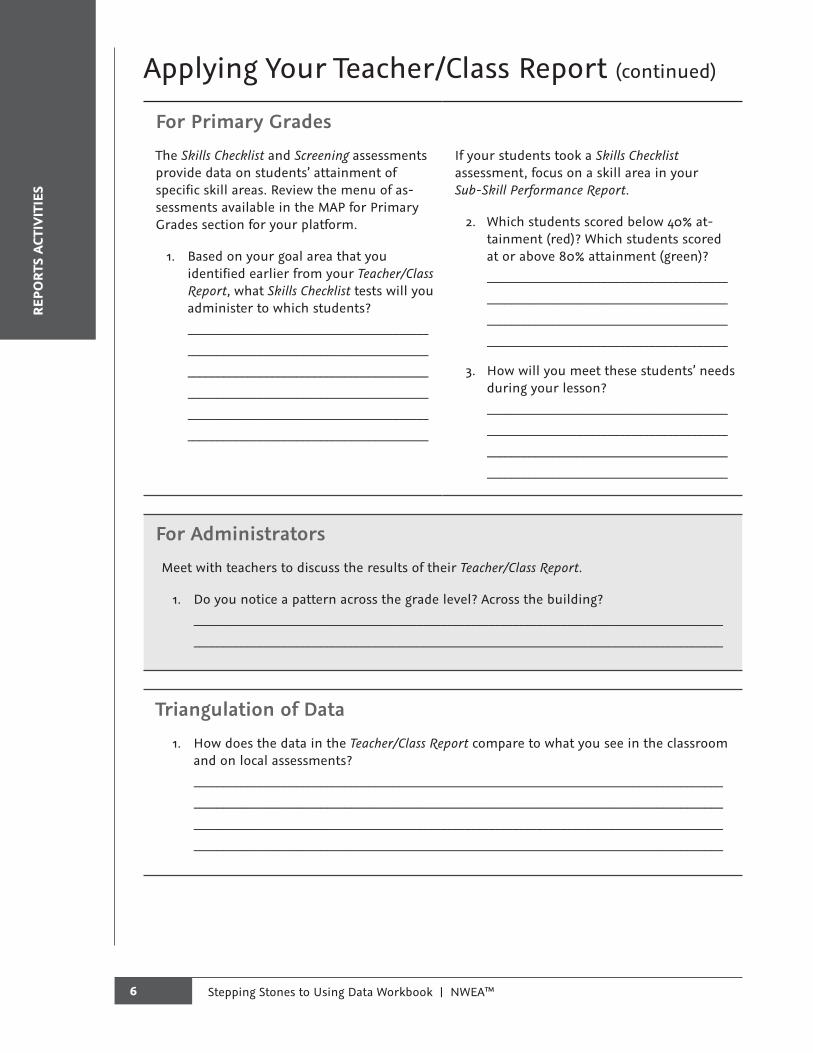
Applying Your Teacher/Class Report (continued)
For Primary Grades The Skills Checklist and Screening assessments provide data on students’ attainment of specific skill areas. Review the menu of as-sessments available in the MAP for Primary Grades section for your platform.
1. Based on your goal area that you identified earlier from your Teacher/Class Report, what Skills Checklist tests will you administer to which students? ________________________________________ ________________________________________ ________________________________________ ________________________________________ ________________________________________ ________________________________________
If your students took a Skills Checklist assessment, focus on a skill area in your Sub-Skill Performance Report.
2. Which students scored below 40% at-tainment (red)? Which students scored at or above 80% attainment (green)? ________________________________________ ________________________________________ ________________________________________ ________________________________________
3. How will you meet these students’ needs during your lesson? ________________________________________ ________________________________________ ________________________________________ ________________________________________
For AdministratorsMeet with teachers to discuss the results of their Teacher/Class Report.
1. Do you notice a pattern across the grade level? Across the building? ________________________________________________________________________________________ ________________________________________________________________________________________
Triangulation of Data 1. How does the data in the Teacher/Class Report compare to what you see in the classroom
and on local assessments? ________________________________________________________________________________________ ________________________________________________________________________________________ ________________________________________________________________________________________ ________________________________________________________________________________________
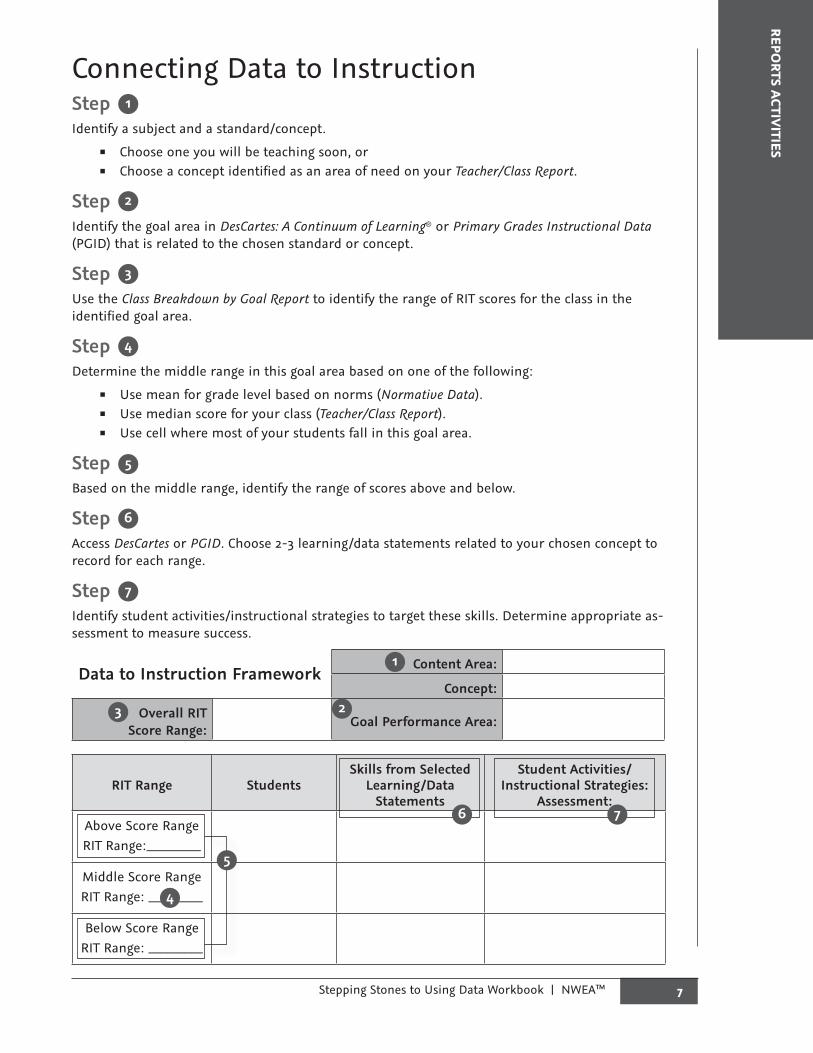
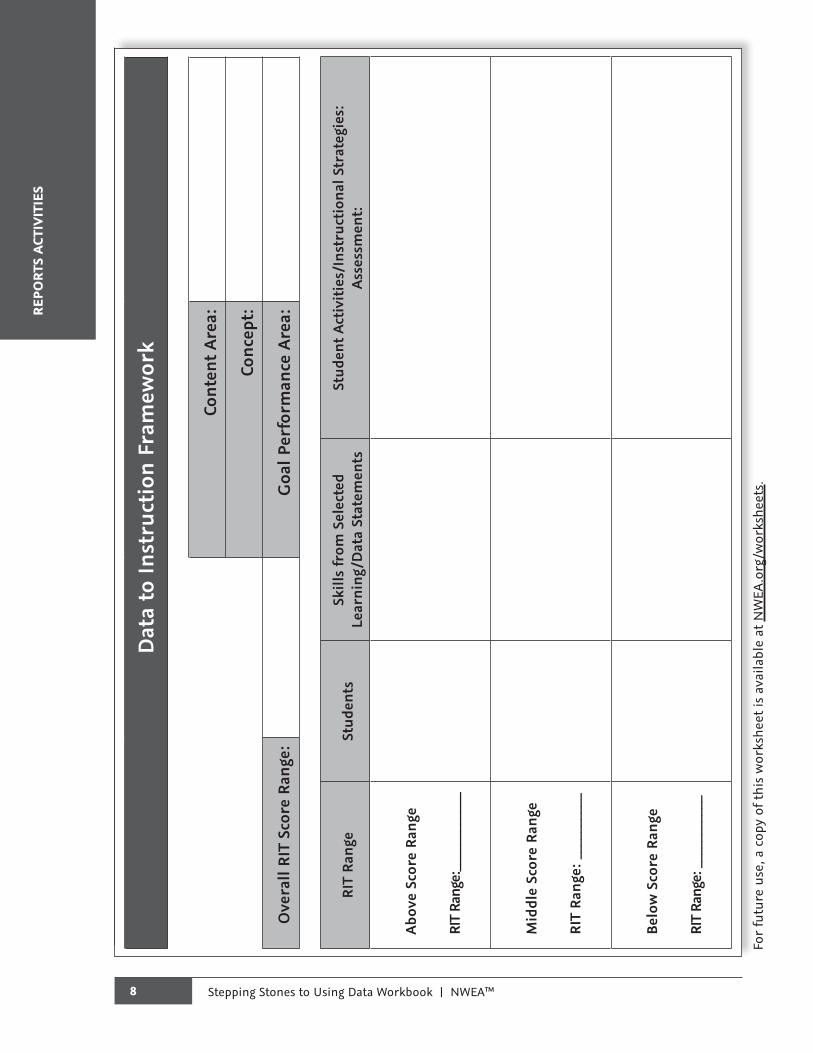
Connecting Data to InstructionStep Identify a subject and a standard/concept.
�� Choose one you will be teaching soon, or�� Choose a concept identified as an area of need on your Teacher/Class Report.
StepIdentify the goal area in DesCartes: A Continuum of Learning® or Primary Grades Instructional Data (PGID) that is related to the chosen standard or concept.
StepUse the Class Breakdown by Goal Report to identify the range of RIT scores for the class in the identified goal area.
StepDetermine the middle range in this goal area based on one of the following:
�� Use mean for grade level based on norms (Normative Data).�� Use median score for your class (Teacher/Class Report).�� Use cell where most of your students fall in this goal area.
StepBased on the middle range, identify the range of scores above and below.
StepAccess DesCartes or PGID. Choose 2-3 learning/data statements related to your chosen concept to record for each range.
StepIdentify student activities/instructional strategies to target these skills. Determine appropriate as-sessment to measure success.
Data to Instruction Framework Content Area:
Concept:
Overall RIT Score Range: Goal Performance Area:
RIT Range StudentsSkills from Selected
Learning/Data Statements
Student Activities/Instructional Strategies:
Assessment:
Above Score RangeRIT Range:_________
Middle Score RangeRIT Range: _________
Below Score RangeRIT Range: _________
4
4
1
1
2
2
3
3
5
5
6 7
6
7
7Stepping Stones to Using Data Workbook | NWEA™
REPORTS ACTIVITIES
Applying Your Teacher/Class Report (continued)
For Primary Grades The Skills Checklist and Screening assessments provide data on students’ attainment of specific skill areas. Review the menu of as-sessments available in the MAP for Primary Grades section for your platform.
1. Based on your goal area that you identified earlier from your Teacher/Class Report, what Skills Checklist tests will you administer to which students? ________________________________________ ________________________________________ ________________________________________ ________________________________________ ________________________________________ ________________________________________
If your students took a Skills Checklist assessment, focus on a skill area in your Sub-Skill Performance Report.
2. Which students scored below 40% at-tainment (red)? Which students scored at or above 80% attainment (green)? ________________________________________ ________________________________________ ________________________________________ ________________________________________
3. How will you meet these students’ needs during your lesson? ________________________________________ ________________________________________ ________________________________________ ________________________________________
For AdministratorsMeet with teachers to discuss the results of their Teacher/Class Report.
1. Do you notice a pattern across the grade level? Across the building? ________________________________________________________________________________________ ________________________________________________________________________________________
Triangulation of Data 1. How does the data in the Teacher/Class Report compare to what you see in the classroom
and on local assessments? ________________________________________________________________________________________ ________________________________________________________________________________________ ________________________________________________________________________________________ ________________________________________________________________________________________
Connecting Data to InstructionStep Identify a subject and a standard/concept.
�� Choose one you will be teaching soon, or�� Choose a concept identified as an area of need on your Teacher/Class Report.
StepIdentify the goal area in DesCartes: A Continuum of Learning® or Primary Grades Instructional Data (PGID) that is related to the chosen standard or concept.
StepUse the Class Breakdown by Goal Report to identify the range of RIT scores for the class in the identified goal area.
StepDetermine the middle range in this goal area based on one of the following:
�� Use mean for grade level based on norms (Normative Data).�� Use median score for your class (Teacher/Class Report).�� Use cell where most of your students fall in this goal area.
StepBased on the middle range, identify the range of scores above and below.
StepAccess DesCartes or PGID. Choose 2-3 learning/data statements related to your chosen concept to record for each range.
StepIdentify student activities/instructional strategies to target these skills. Determine appropriate as-sessment to measure success.
Data to Instruction Framework Content Area:
Concept:
Overall RIT Score Range: Goal Performance Area:
RIT Range StudentsSkills from Selected
Learning/Data Statements
Student Activities/Instructional Strategies:
Assessment:
Above Score RangeRIT Range:_________
Middle Score RangeRIT Range: _________
Below Score RangeRIT Range: _________
4
4
1
1
2
2
3
3
5
5
6 7
6
7
8 Stepping Stones to Using Data Workbook | NWEA™
REPO
RTS
ACTI
VITI
ES
Dat
a to
Inst
ruct
ion
Fram
ewor
k
Cont
ent A
rea:
Conc
ept:
Ove
rall
RIT
Scor
e Ra
nge:
Goa
l Per
form
ance
Are
a:
RIT
Rang
eSt
uden
tsSk
ills
from
Sel
ecte
dLe
arni
ng/D
ata
Stat
emen
tsSt
uden
t Act
ivit
ies/
Inst
ruct
iona
l Str
ateg
ies:
Asse
ssm
ent:
Abov
e Sc
ore
Rang
e
RIT
Rang
e:__
____
____
__
Mid
dle
Scor
e Ra
nge
RIT
Rang
e: _
____
____
_
Belo
w S
core
Ran
ge
RIT
Rang
e: _
____
____
__
For
futu
re u
se, a
cop
y of
this
wor
kshe
et is
ava
ilabl
e at
NW
EA.o
rg/w
orks
heet
s.
Stepping Stones to Using Data Workbook | NWEA™ 9
REPORTS ACTIVITIES
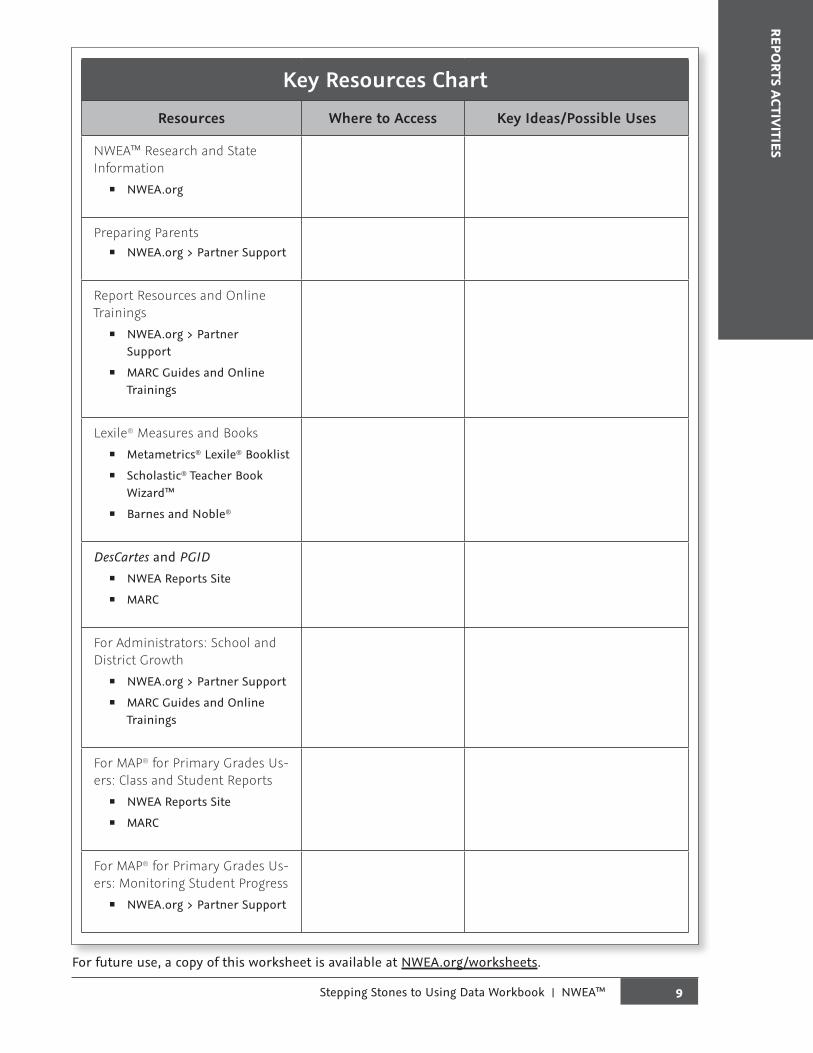
Key Resources ChartResources Where to Access Key Ideas/Possible Uses
NWEA™ Research and State Information
�� NWEA.org
Preparing Parents�� NWEA.org > Partner Support
Report Resources and Online Trainings
�� NWEA.org > Partner Support
�� MARC Guides and Online Trainings
Lexile® Measures and Books �� Metametrics® Lexile® Booklist�� Scholastic® Teacher Book
Wizard™�� Barnes and Noble®
DesCartes and PGID�� NWEA Reports Site�� MARC
For Administrators: School and District Growth
�� NWEA.org > Partner Support�� MARC Guides and Online
Trainings
For MAP® for Primary Grades Us-ers: Class and Student Reports
�� NWEA Reports Site�� MARC
For MAP® for Primary Grades Us-ers: Monitoring Student Progress
�� NWEA.org > Partner Support
For future use, a copy of this worksheet is available at NWEA.org/worksheets.
10 Stepping Stones to Using Data Workbook | NWEA™
REPO
RTS
ACTI
VITI
ES
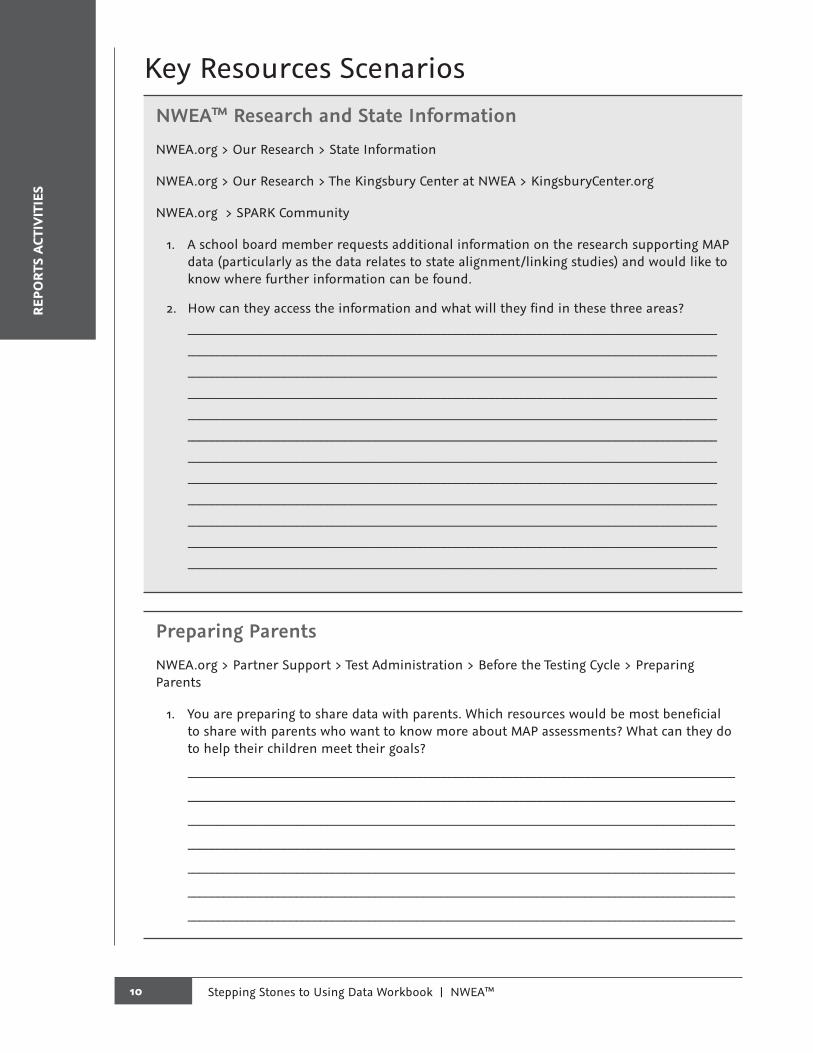
Key Resources ScenariosNWEA™ Research and State InformationNWEA.org > Our Research > State Information
NWEA.org > Our Research > The Kingsbury Center at NWEA > KingsburyCenter.org
NWEA.org > SPARK Community
1. A school board member requests additional information on the research supporting MAP data (particularly as the data relates to state alignment/linking studies) and would like to know where further information can be found.
2. How can they access the information and what will they find in these three areas? ________________________________________________________________________________________ ________________________________________________________________________________________ ________________________________________________________________________________________ ________________________________________________________________________________________ ________________________________________________________________________________________ ________________________________________________________________________________________ ________________________________________________________________________________________ ________________________________________________________________________________________ ________________________________________________________________________________________ ________________________________________________________________________________________ ________________________________________________________________________________________ ________________________________________________________________________________________
Preparing ParentsNWEA.org > Partner Support > Test Administration > Before the Testing Cycle > Preparing Parents
1. You are preparing to share data with parents. Which resources would be most beneficial to share with parents who want to know more about MAP assessments? What can they do to help their children meet their goals?
___________________________________________________________________________________________
___________________________________________________________________________________________
___________________________________________________________________________________________
___________________________________________________________________________________________
___________________________________________________________________________________________
___________________________________________________________________________________________
___________________________________________________________________________________________
11Stepping Stones to Using Data Workbook | NWEA™
REPORTS ACTIVITIES
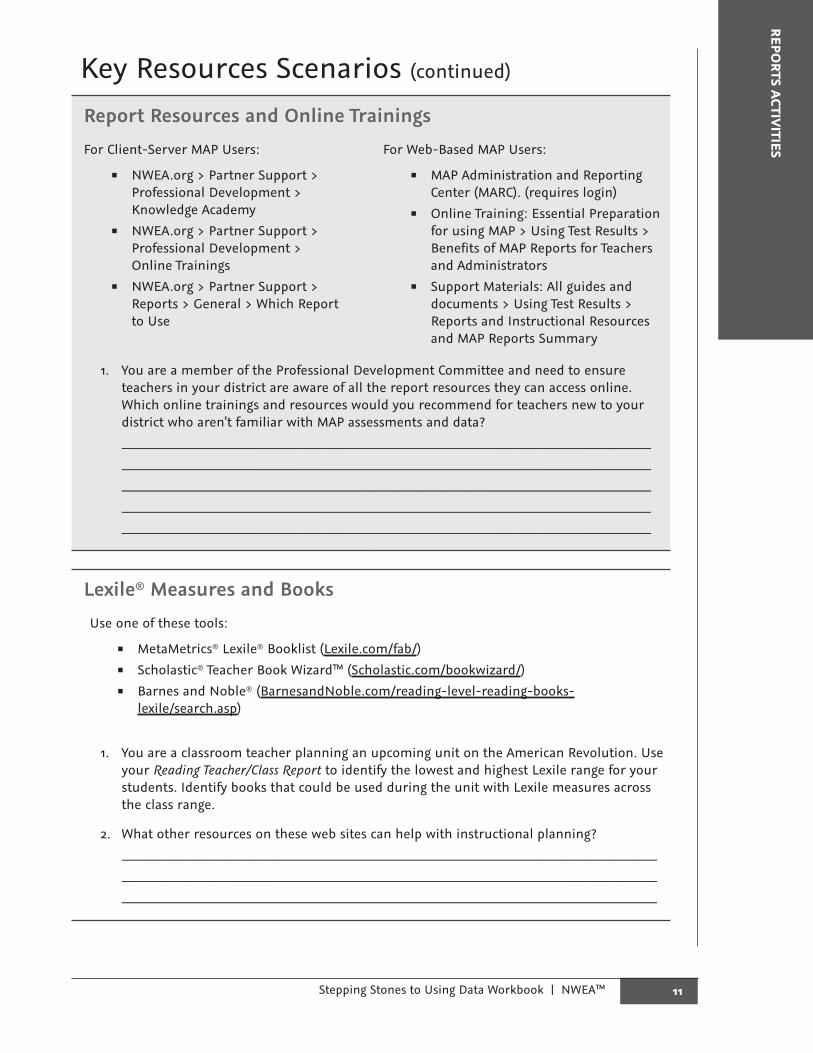
Key Resources Scenarios (continued)
Report Resources and Online TrainingsFor Client-Server MAP Users:
�� NWEA.org > Partner Support > Professional Development > Knowledge Academy
�� NWEA.org > Partner Support > Professional Development > Online Trainings
�� NWEA.org > Partner Support > Reports > General > Which Report to Use
For Web-Based MAP Users:
�� MAP Administration and Reporting Center (MARC). (requires login)
�� Online Training: Essential Preparation for using MAP > Using Test Results > Benefits of MAP Reports for Teachers and Administrators
�� Support Materials: All guides and documents > Using Test Results > Reports and Instructional Resources and MAP Reports Summary
1. You are a member of the Professional Development Committee and need to ensure teachers in your district are aware of all the report resources they can access online. Which online trainings and resources would you recommend for teachers new to your district who aren’t familiar with MAP assessments and data? ________________________________________________________________________________________ ________________________________________________________________________________________ ________________________________________________________________________________________ ________________________________________________________________________________________ ________________________________________________________________________________________
Lexile® Measures and BooksUse one of these tools:
�� MetaMetrics® Lexile® Booklist (Lexile.com/fab/) �� Scholastic® Teacher Book Wizard™ (Scholastic.com/bookwizard/)�� Barnes and Noble® (BarnesandNoble.com/reading-level-reading-books-
lexile/search.asp)
1. You are a classroom teacher planning an upcoming unit on the American Revolution. Use your Reading Teacher/Class Report to identify the lowest and highest Lexile range for your students. Identify books that could be used during the unit with Lexile measures across the class range.
2. What other resources on these web sites can help with instructional planning? _________________________________________________________________________________________ _________________________________________________________________________________________ _________________________________________________________________________________________
12 Stepping Stones to Using Data Workbook | NWEA™
REPO
RTS
ACTI
VITI
ES
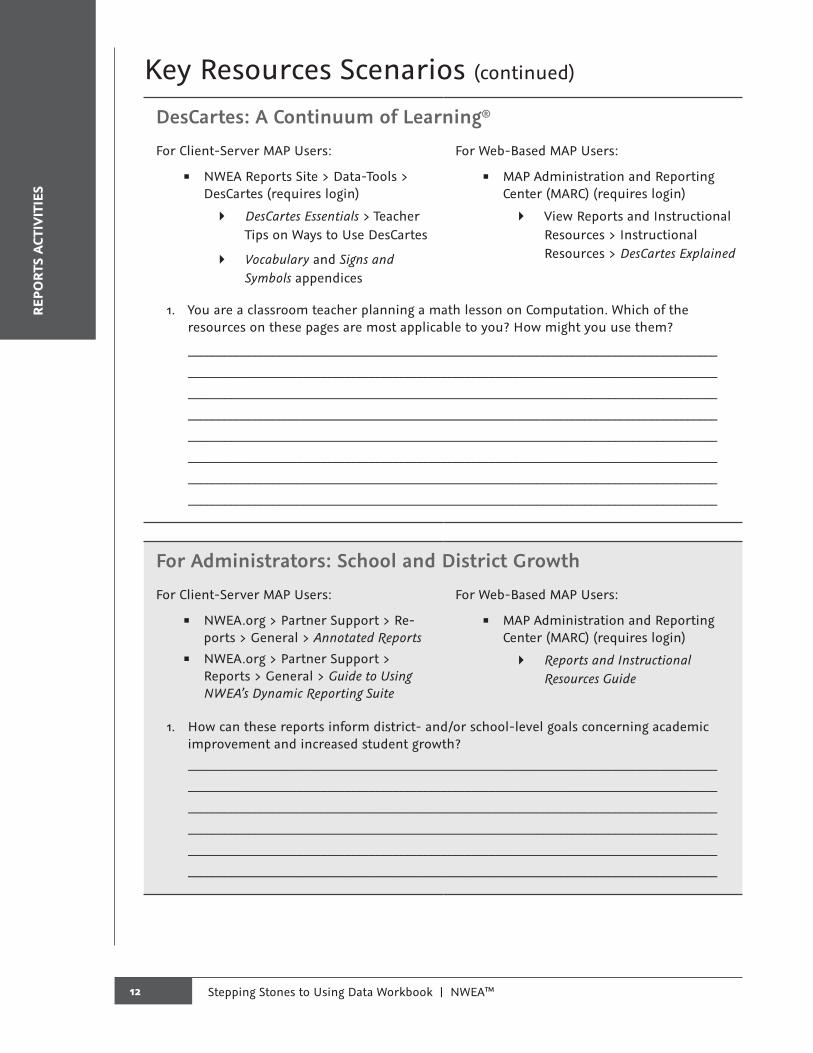
Key Resources Scenarios (continued) DesCartes: A Continuum of Learning®
For Client-Server MAP Users:
�� NWEA Reports Site > Data-Tools > DesCartes (requires login)
� DesCartes Essentials > Teacher Tips on Ways to Use DesCartes
� Vocabulary and Signs and Symbols appendices
For Web-Based MAP Users:
�� MAP Administration and Reporting Center (MARC) (requires login)
� View Reports and Instructional Resources > Instructional Resources > DesCartes Explained
1. You are a classroom teacher planning a math lesson on Computation. Which of the resources on these pages are most applicable to you? How might you use them?
________________________________________________________________________________________ ________________________________________________________________________________________ ________________________________________________________________________________________ ________________________________________________________________________________________ ________________________________________________________________________________________ ________________________________________________________________________________________ ________________________________________________________________________________________ ________________________________________________________________________________________
For Administrators: School and District GrowthFor Client-Server MAP Users:
�� NWEA.org > Partner Support > Re-ports > General > Annotated Reports
�� NWEA.org > Partner Support > Reports > General > Guide to Using NWEA’s Dynamic Reporting Suite
For Web-Based MAP Users:
�� MAP Administration and Reporting Center (MARC) (requires login)
� Reports and Instructional Resources Guide
1. How can these reports inform district- and/or school-level goals concerning academic improvement and increased student growth? ________________________________________________________________________________________ ________________________________________________________________________________________ ________________________________________________________________________________________ ________________________________________________________________________________________ ________________________________________________________________________________________ ________________________________________________________________________________________
13Stepping Stones to Using Data Workbook | NWEA™
REPORTS ACTIVITIES
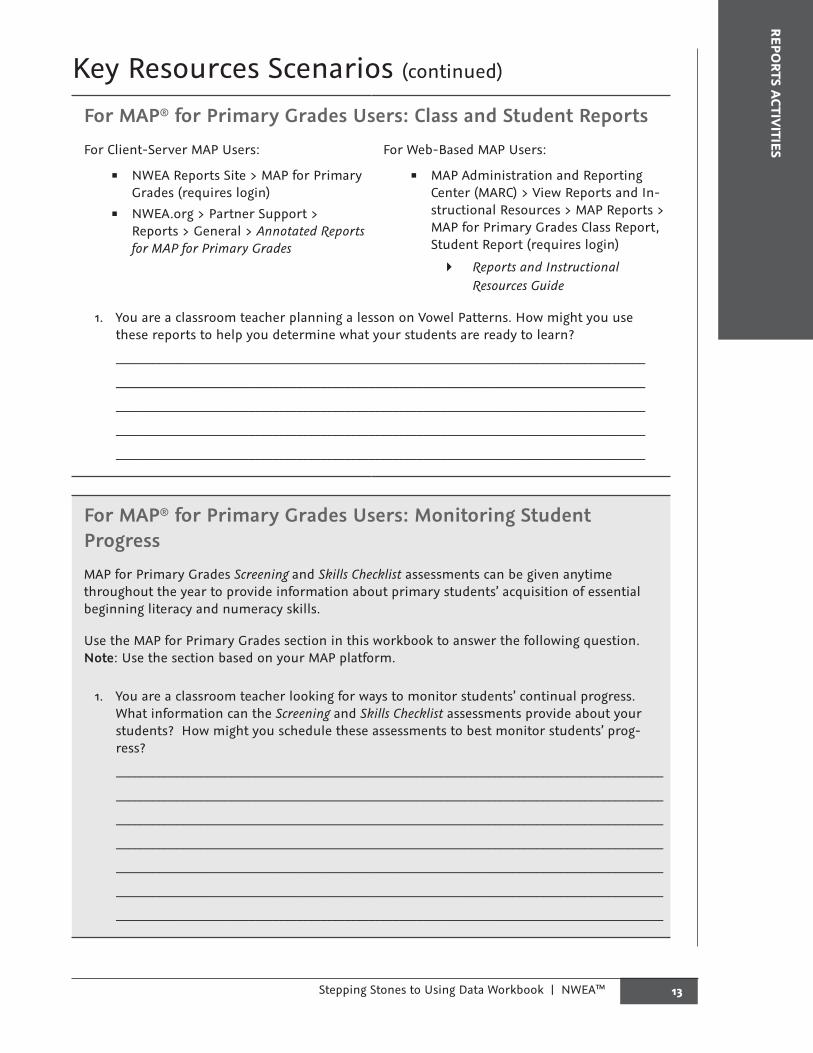
Key Resources Scenarios (continued)
For MAP® for Primary Grades Users: Class and Student ReportsFor Client-Server MAP Users:
�� NWEA Reports Site > MAP for Primary Grades (requires login)
�� NWEA.org > Partner Support > Reports > General > Annotated Reports for MAP for Primary Grades
For Web-Based MAP Users:
�� MAP Administration and Reporting Center (MARC) > View Reports and In-structional Resources > MAP Reports > MAP for Primary Grades Class Report, Student Report (requires login)
� Reports and Instructional Resources Guide
1. You are a classroom teacher planning a lesson on Vowel Patterns. How might you use these reports to help you determine what your students are ready to learn?
________________________________________________________________________________________
________________________________________________________________________________________
________________________________________________________________________________________
________________________________________________________________________________________
________________________________________________________________________________________
For MAP® for Primary Grades Users: Monitoring Student ProgressMAP for Primary Grades Screening and Skills Checklist assessments can be given anytime throughout the year to provide information about primary students’ acquisition of essential beginning literacy and numeracy skills.
Use the MAP for Primary Grades section in this workbook to answer the following question. Note: Use the section based on your MAP platform.
1. You are a classroom teacher looking for ways to monitor students’ continual progress. What information can the Screening and Skills Checklist assessments provide about your students? How might you schedule these assessments to best monitor students’ prog-ress?
___________________________________________________________________________________________
___________________________________________________________________________________________
___________________________________________________________________________________________
___________________________________________________________________________________________
___________________________________________________________________________________________
___________________________________________________________________________________________
___________________________________________________________________________________________
14 Stepping Stones to Using Data Workbook | NWEA™
REPO
RTS
ACTI
VITI
ES
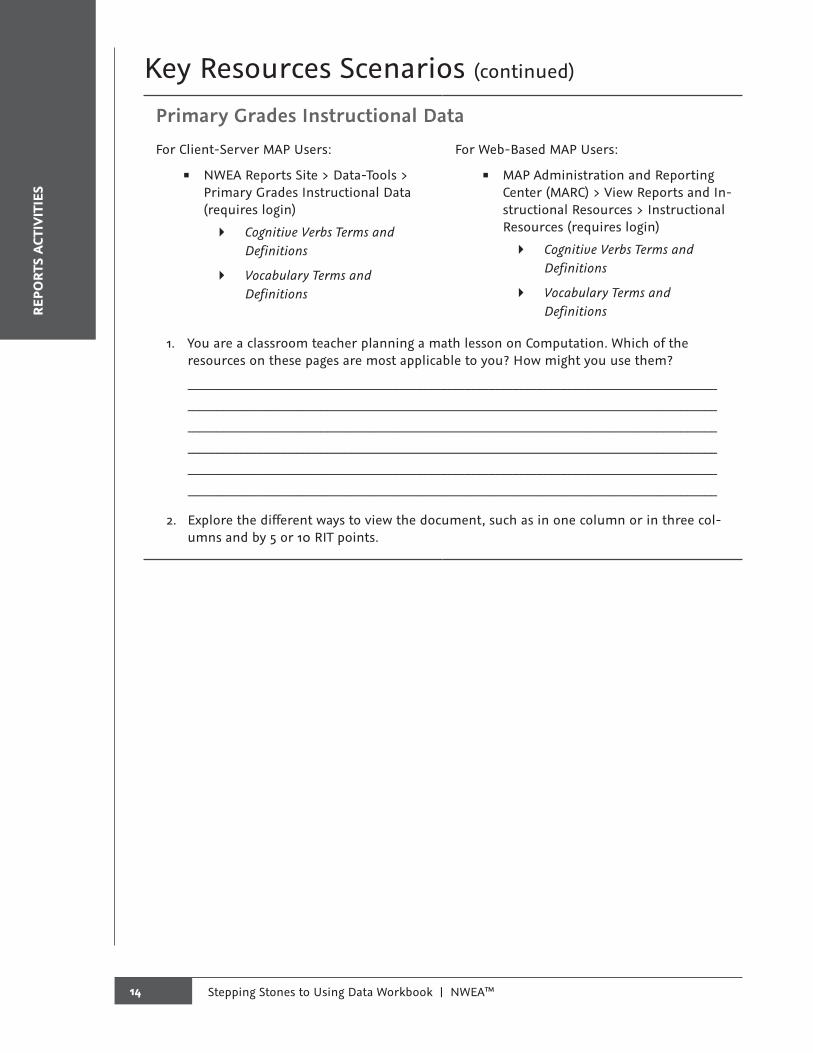
Key Resources Scenarios (continued)
Primary Grades Instructional DataFor Client-Server MAP Users:
�� NWEA Reports Site > Data-Tools > Primary Grades Instructional Data (requires login)
� Cognitive Verbs Terms and Definitions
� Vocabulary Terms and Definitions
For Web-Based MAP Users:
�� MAP Administration and Reporting Center (MARC) > View Reports and In-structional Resources > Instructional Resources (requires login)
� Cognitive Verbs Terms and Definitions
� Vocabulary Terms and Definitions
1. You are a classroom teacher planning a math lesson on Computation. Which of the resources on these pages are most applicable to you? How might you use them?
________________________________________________________________________________________ ________________________________________________________________________________________ ________________________________________________________________________________________ ________________________________________________________________________________________ ________________________________________________________________________________________ ________________________________________________________________________________________
2. Explore the different ways to view the document, such as in one column or in three col-umns and by 5 or 10 RIT points.
15Stepping Stones to Using Data Workbook | NWEA™
REPORTS ACTIVITIES
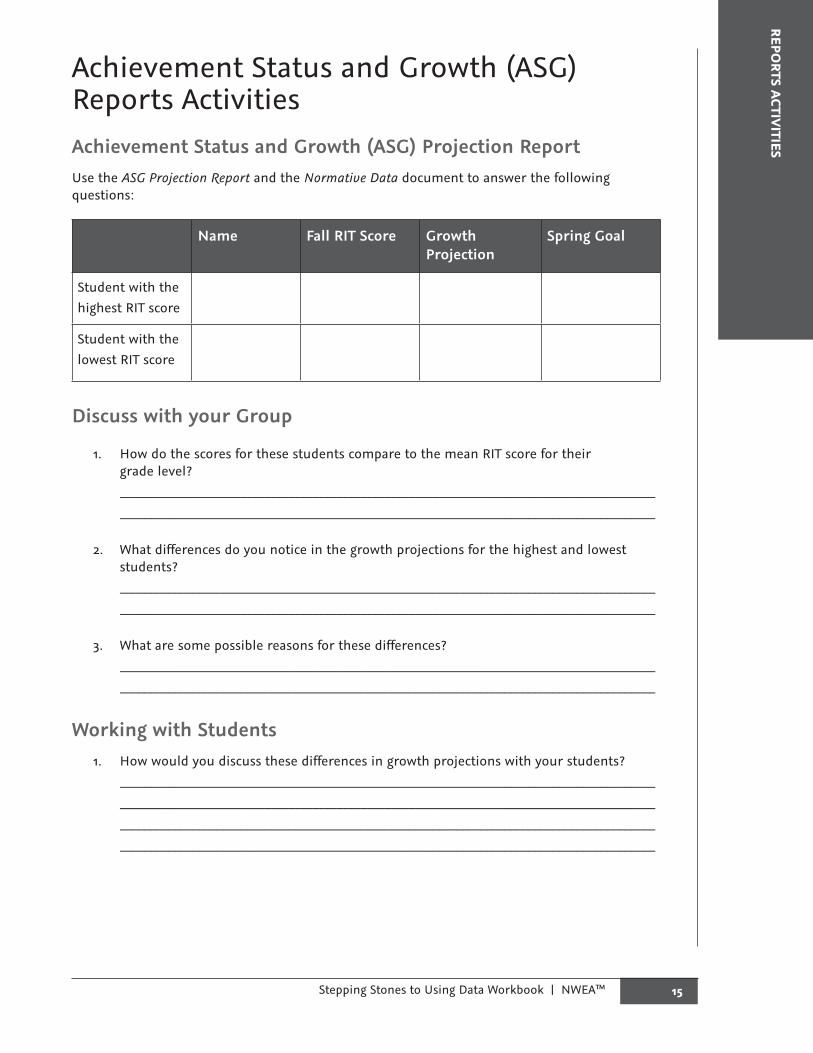
Achievement Status and Growth (ASG) Reports ActivitiesAchievement Status and Growth (ASG) Projection ReportUse the ASG Projection Report and the Normative Data document to answer the following questions:
Name Fall RIT Score Growth Projection
Spring Goal
Student with the highest RIT score
Student with the lowest RIT score
Discuss with your Group
1. How do the scores for these students compare to the mean RIT score for their grade level? _________________________________________________________________________________________ _________________________________________________________________________________________
2. What differences do you notice in the growth projections for the highest and lowest students? _________________________________________________________________________________________ _________________________________________________________________________________________
3. What are some possible reasons for these differences? _________________________________________________________________________________________ _________________________________________________________________________________________
Working with Students1. How would you discuss these differences in growth projections with your students?
_________________________________________________________________________________________ _________________________________________________________________________________________ _________________________________________________________________________________________ _________________________________________________________________________________________

16 Stepping Stones to Using Data Workbook | NWEA™
REPO
RTS
ACTI
VITI
ES
Achievement Status and Growth (ASG) Reports Activities (continued)
2. What conversations would you have with these two students related to goal setting? How might you involve the student in the goal-setting and monitoring process? ___________________________________________________________________________________________ ___________________________________________________________________________________________ ___________________________________________________________________________________________ ___________________________________________________________________________________________
3. What are some approaches you might take when addressing these growth differences in your classroom? ___________________________________________________________________________________________ ___________________________________________________________________________________________ ___________________________________________________________________________________________ ___________________________________________________________________________________________
4. How will these differences impact your instruction? ___________________________________________________________________________________________ ___________________________________________________________________________________________ ___________________________________________________________________________________________ ___________________________________________________________________________________________
5. What analogies might you use to explain academic growth to students and parents? ___________________________________________________________________________________________ ___________________________________________________________________________________________ ___________________________________________________________________________________________ ___________________________________________________________________________________________
Achievement Status and Growth (ASG) Summary ReportUse the ASG Summary Report to answer the following questions. Use the same students as above.
Name Spring RIT Score
Growth Projection Met?
Growth Index: ( + or - )
Student with the highest RIT score
Yes No
Student with the lowest RIT score Yes No
17Stepping Stones to Using Data Workbook | NWEA™
REPORTS ACTIVITIES
Achievement Status and Growth (ASG) Reports Activities (continued)
Summary Information1. What percentage of students met or exceeded their projected RIT? ______________________
2. What is the median RIT spring score for the class? ______________________________________
3. What is the average end-of-year RIT score for this grade? _______________________________
Discuss with Your Group1. Did the selected students meet their projections? ______________________________________
2. How would you discuss this with each student? _________________________________________________________________________________________ _________________________________________________________________________________________ _________________________________________________________________________________________ _________________________________________________________________________________________
3. What observations can you make regarding the growth and achievement levels for the class? _________________________________________________________________________________________ _________________________________________________________________________________________ _________________________________________________________________________________________ _________________________________________________________________________________________
4. What percentage of students should meet or exceed their projected RIT? What percentage would be a reasonable goal for a class or grade level? _________________________________________________________________________________________ _________________________________________________________________________________________ _________________________________________________________________________________________ _________________________________________________________________________________________
18 Stepping Stones to Using Data Workbook | NWEA™
REPO
RTS
ACTI
VITI
ES
RIT Scale School Norms User’s Guide�� The NWEA Research Team has enhanced the RIT Scale School Norms User’s Guide, which has
more depth than the School Growth Study.
� The guide presents data related to status and typical growth for schools within the NWEA Growth Research Database.
� Based on the most recent norms, the data show typical school growth by percentile rank for the primary purpose of offering parameters to interpret growth for schools using the growth index statistic.
�� The RIT Scale School Norms User’s Guide looks at district-level RIT scores and distributions. This added informative data for school and grade-levels will help you compare your per-formance to other schools around the country.
� This will allow you to make more informed, reliable judgments about the effective-ness of your schools and set more refined goals for improvement.
�� In addition to the RIT Scale School Norms User’s Guide, a calculator for accessing searchable data points within the tables and a short instructional video are available for your use. To access these resources, go to NWEA.org/schoolnormsstudy, and click on the following links:
� 2012 School Norms User’s Guide
� 2012 School Norms Calculator
� 2012 School Norms Calculator Training
Student Growth Summary Report: by School 1. Look at the Student Growth Summary Report. How well did our school meet growth
projections for the year? __________________________________________________________________________________________
2. What percent of students met their growth projections for Grade 4?_____________________
For Grade 5?_____________________
3. Which grade level had the highest percent of students meeting their growth projections? __________________________________________________________________________________________ __________________________________________________________________________________________
4. Discuss possible reasons for the difference in growth between grades. __________________________________________________________________________________________ __________________________________________________________________________________________
5. Administrators: What discussion might you have with grade-level teachers regarding growth? ________________________________________________________________________________________ ________________________________________________________________________________________ ________________________________________________________________________________________
19Stepping Stones to Using Data Workbook | NWEA™
REPORTS ACTIVITIES
Goal Setting with StudentsDiscuss with Your GroupLook at the annotated Student Goal Setting Worksheet. Discuss the following questions with your table group:
1. What do you notice? ________________________________________________________________________________________ ________________________________________________________________________________________
2. What can you do with this report? ________________________________________________________________________________________ ________________________________________________________________________________________
Goal Setting for One StudentAccess and print the Student Goal Setting Worksheet for one student in your class.
1. What are some areas of strength for this student? _________________________________________________________________________________________ _________________________________________________________________________________________
2. What are some areas of need? _________________________________________________________________________________________ _________________________________________________________________________________________
3. Consider how you might explain these to a student in a way he or she could understand.
Student Subject
RIT Range
What skills should the student be working on now?
(List 1-2 skills from DesCartes or Primary Grades
Instructional Data)
How might you explain these skills to students in a way they
would understand?
Highest Goal Area
Lowest Goal Area
20 Stepping Stones to Using Data Workbook | NWEA™
REPO
RTS
ACTI
VITI
ES
Goal Setting with Students (continued)4. How might the goal areas help you set goals with your students?
_________________________________________________________________________________________ _________________________________________________________________________________________ _________________________________________________________________________________________
_________________________________________________________________________________________
5. How might you determine which goal area would be appropriate for a class goal? _________________________________________________________________________________________ _________________________________________________________________________________________ _________________________________________________________________________________________ _________________________________________________________________________________________
6. How might you determine which goal area would be appropriate for a grade-level or school goal? _________________________________________________________________________________________ _________________________________________________________________________________________ _________________________________________________________________________________________ _________________________________________________________________________________________
Sharing Data with Students and Parents Student Progress ReportView the Student Progress Report or a Primary Grades Screening/Skills Checklist Individual Report for one of your students. The Normative Data document and your State Proficiency Tables might also be helpful.
Sharing Data with StudentsIndividual Students: Identify three points you would discuss with a student regarding his/her results.
__________________________________________________________________________________________________ __________________________________________________________________________________________________ __________________________________________________________________________________________________ __________________________________________________________________________________________________ __________________________________________________________________________________________________
21Stepping Stones to Using Data Workbook | NWEA™
REPORTS ACTIVITIES
Sharing Data with ParentsUsing the same student report, how might you answer these questions from the student’s parents?
�� Has my child’s score gone up?____________________________________________________________
�� Is my child performing at grade level?____________________________________________________
�� Based on these scores, how and what will you teach my child in class? ___________________________________________________________________________________________ ___________________________________________________________________________________________ ___________________________________________________________________________________________ ___________________________________________________________________________________________
�� What do the percentiles mean? ___________________________________________________________________________________________ ___________________________________________________________________________________________
�� Note any difficult questions that you could not answer and/or questions you want to bring to the group’s attention. ___________________________________________________________________________________________ ___________________________________________________________________________________________ ______________________________________________________________________________________________________________________________________________________________________________________
Administrators
Consider the school’s expectations for goal setting with students. In order to facilitate this expectation, what resources will be needed? What are some potential obstacles for meeting this expectation? ___________________________________________________________________________________________________ ___________________________________________________________________________________________________ ___________________________________________________________________________________________________ ______________________________________________________________________________________________________________________________________________________________________________________________________ ___________________________________________________________________________________________________ ___________________________________________________________________________________________________ ___________________________________________________________________________________________________
22 Stepping Stones to Using Data Workbook | NWEA™
REPO
RTS
ACTI
VITI
ES
Step
ping
Sto
nes
to U
sing
Dat
a Sa
mpl
e Te
ach-
Back
Pla
n
Task
Pers
on(s
) Re
spon
sibl
eRe
sour
ces
Poss
ible
Ro
adbl
ocks
/
Stra
tegi
es to
O
verc
ome
Tim
e
Nee
ded
Dat
e of
Co
mpl
etio
n
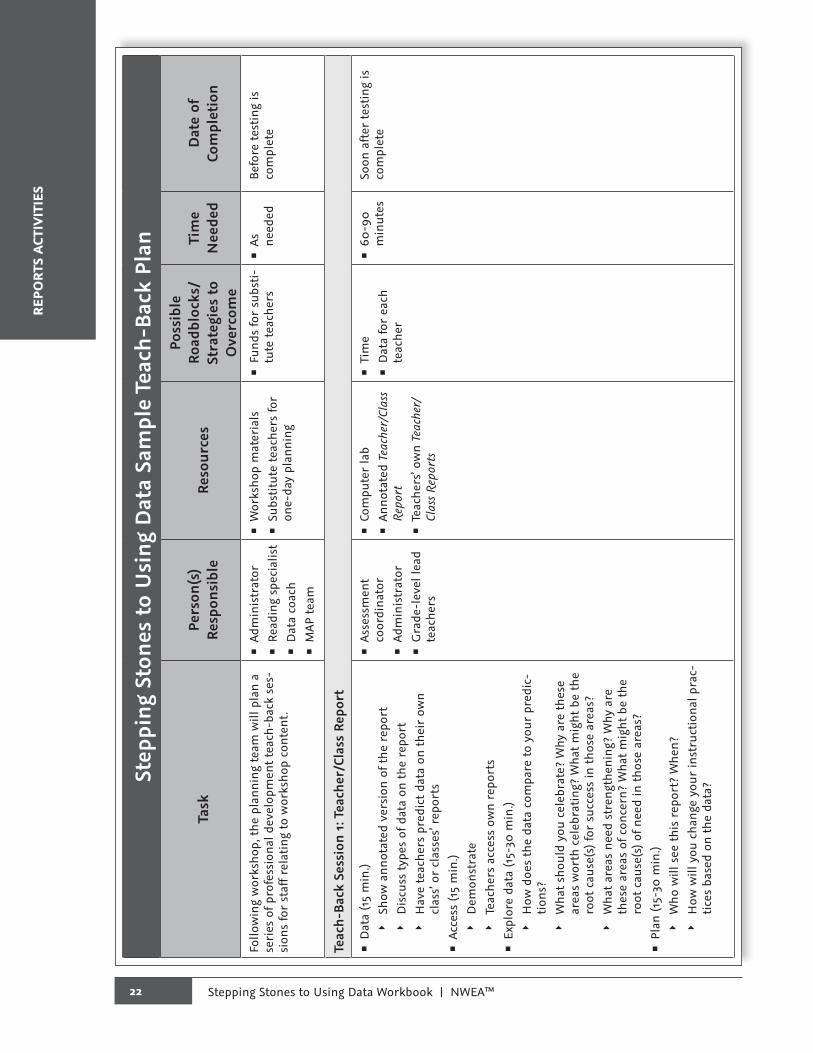
Follo
win
g w
orks
hop,
the
plan
ning
team
will
pla
n a
seri
es o
f pro
fess
iona
l dev
elop
men
t tea
ch-b
ack
ses-
sion
s fo
r st
aff r
elat
ing
to w
orks
hop
cont
ent.
��
Adm
inis
trat
or��
Read
ing
spec
ialis
t��
Dat
a co
ach
��
MAP
team
��
Wor
ksho
p m
ater
ials
��
Subs
titut
e te
ache
rs fo
r
one-
day
plan
ning
��
Fund
s fo
r su
bsti-
tute
teac
hers
��
As
need
edBe
fore
test
ing
is
com
plet
e
Teac
h-Ba
ck S
essi
on 1
: Tea
cher
/Cla
ss R
epor
t
��
Dat
a (1
5 m
in.)
��
Show
ann
otat
ed v
ersi
on o
f the
rep
ort
��
Dis
cuss
typ
es o
f dat
a on
the
repo
rt��
Hav
e te
ache
rs p
redi
ct d
ata
on th
eir
own
clas
s’ or
cla
sses
’ rep
orts
��
Acce
ss (1
5 m
in.)
��
Dem
onst
rate
��
Teac
hers
acc
ess
own
repo
rts
��
Expl
ore
data
(15-
30 m
in.)
��
How
doe
s th
e da
ta c
ompa
re to
you
r pr
edic
-tio
ns?
��
Wha
t sho
uld
you
cele
brat
e? W
hy a
re th
ese
area
s w
orth
cel
ebra
ting?
Wha
t mig
ht b
e th
e ro
ot c
ause
(s) f
or s
ucce
ss in
thos
e ar
eas?
��
Wha
t are
as n
eed
stre
ngth
enin
g? W
hy a
re
thes
e ar
eas
of c
once
rn?
Wha
t mig
ht b
e th
e ro
ot c
ause
(s) o
f nee
d in
thos
e ar
eas?
��
Plan
(15-
30 m
in.)
��
Who
will
see
this
rep
ort?
Whe
n?
��
How
will
you
cha
nge
your
inst
ruct
iona
l pra
c-tic
es b
ased
on
the
data
?
��
Asse
ssm
ent
coor
dina
tor
��
Adm
inis
trat
or��
Gra
de-l
evel
lead
te
ache
rs
��
Com
pute
r la
b��
Anno
tate
d Te
ache
r/Cl
ass
Repo
rt
��
Teac
hers
’ ow
n Te
ache
r/Cl
ass R
epor
ts
��
Tim
e��
Dat
a fo
r ea
ch
teac
her
��
60-9
0 m
inut
esSo
on a
fter
test
ing
is
com
plet
e
23Stepping Stones to Using Data Workbook | NWEA™
REPORTS ACTIVITIES
Task
Pers
on(s
) Re
spon
sibl
eRe
sour
ces
Poss
ible
Ro
adbl
ocks
/
Stra
tegi
es to
O
verc
ome
Tim
e
Nee
ded
Dat
e of
Co
mpl
etio
n
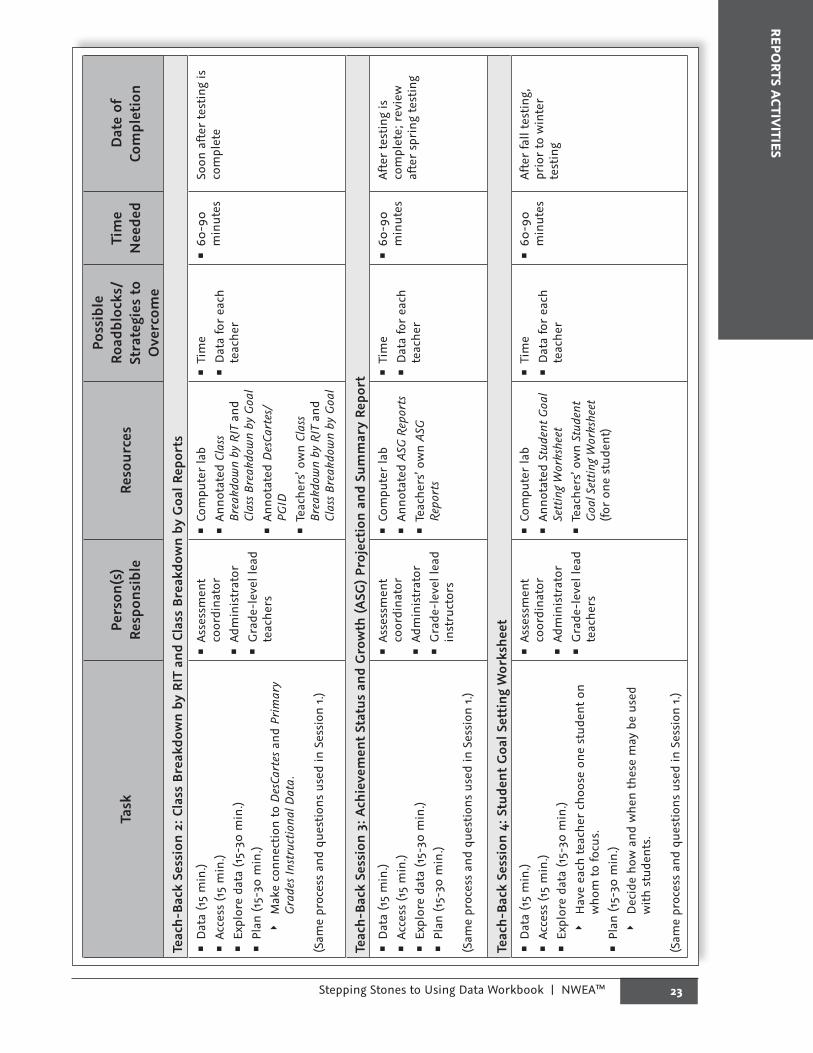
Teac
h-Ba
ck S
essi
on 2
: Cla
ss B
reak
dow
n by
RIT
and
Cla
ss B
reak
dow
n by
Goa
l Rep
orts
��
Dat
a (1
5 m
in.)
��
Acce
ss (1
5 m
in.)
��
Expl
ore
data
(15-
30 m
in.)
��
Plan
(15-
30 m
in.)
��
Mak
e co
nnec
tion
to D
esCa
rtes
and
Prim
ary
Grad
es In
stru
ctio
nal D
ata.
(Sam
e pr
oces
s an
d qu
estio
ns u
sed
in S
essi
on 1
.)
��
Asse
ssm
ent
coor
dina
tor
��
Adm
inis
trat
or��
Gra
de-l
evel
lead
te
ache
rs
��
Com
pute
r la
b��
Anno
tate
d Cl
ass
Brea
kdow
n by
RIT
and
Cl
ass B
reak
dow
n by
Goa
l��
Anno
tate
d D
esCa
rtes
/PG
ID��
Teac
hers
’ ow
n Cl
ass
Brea
kdow
n by
RIT
and
Cl
ass B
reak
dow
n by
Goa
l
��
Tim
e��
Dat
a fo
r ea
ch
teac
her
��
60-9
0 m
inut
esSo
on a
fter
test
ing
is
com
plet
e
Teac
h-Ba
ck S
essi
on 3
: Ach
ieve
men
t Sta
tus
and
Gro
wth
(ASG
) Pro
ject
ion
and
Sum
mar
y Re
port
��
Dat
a (1
5 m
in.)
��
Acce
ss (1
5 m
in.)
��
Expl
ore
data
(15-
30 m
in.)
��
Plan
(15-
30 m
in.)
(Sam
e pr
oces
s an
d qu
estio
ns u
sed
in S
essi
on 1
.)
��
Asse
ssm
ent
coor
dina
tor
��
Adm
inis
trat
or��
Gra
de-l
evel
lead
in
stru
ctor
s
��
Com
pute
r la
b��
Anno
tate
d AS
G Re
port
s��
Teac
hers
’ ow
n AS
G
Repo
rts
��
Tim
e��
Dat
a fo
r ea
ch
teac
her
��
60-9
0 m
inut
esAf
ter
test
ing
is
com
plet
e; r
evie
w
afte
r sp
ring
test
ing
Teac
h-Ba
ck S
essi
on 4
: Stu
dent
Goa
l Set
ting
Wor
kshe
et��
Dat
a (1
5 m
in.)
��
Acce
ss (1
5 m
in.)
��
Expl
ore
data
(15-
30 m
in.)
��
Hav
e ea
ch te
ache
r ch
oose
one
stu
dent
on
who
m to
focu
s.��
Plan
(15-
30 m
in.)
��
Dec
ide
how
and
whe
n th
ese
may
be
used
w
ith s
tude
nts.
(Sam
e pr
oces
s an
d qu
estio
ns u
sed
in S
essi
on 1
.)
��
Asse
ssm
ent
coor
dina
tor
��
Adm
inis
trat
or��
Gra
de-l
evel
lead
te
ache
rs
��
Com
pute
r la
b��
Anno
tate
d St
uden
t Goa
l Se
ttin
g W
orks
heet
��
Teac
hers
’ ow
n St
uden
t Go
al S
ettin
g W
orks
heet
(fo
r on
e st
uden
t)
��
Tim
e��
Dat
a fo
r ea
ch
teac
her
��
60-9
0 m
inut
esAf
ter
fall
test
ing,
pr
ior
to w
inte
r
test
ing
24 Stepping Stones to Using Data Workbook | NWEA™
REPO
RTS
ACTI
VITI
ES
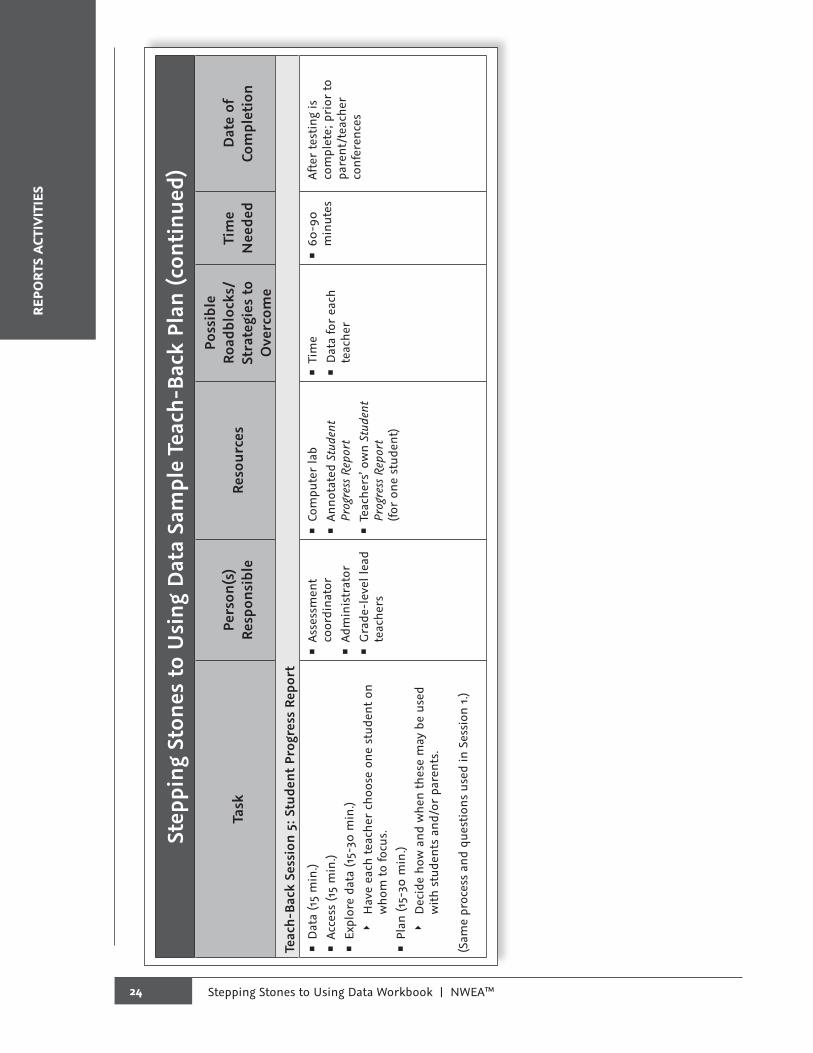
Step
ping
Sto
nes
to U
sing
Dat
a Sa
mpl
e Te
ach-
Back
Pla
n (c
onti
nued
)
Task
Pers
on(s
) Re
spon
sibl
eRe
sour
ces
Poss
ible
Ro
adbl
ocks
/
Stra
tegi
es to
O
verc
ome
Tim
e
Nee
ded
Dat
e of
Co
mpl
etio
n
Teac
h-Ba
ck S
essi
on 5
: Stu
dent
Pro
gres
s Re
port
��
Dat
a (1
5 m
in.)
��
Acce
ss (1
5 m
in.)
��
Expl
ore
data
(15-
30 m
in.)
��
Hav
e ea
ch te
ache
r ch
oose
one
stu
dent
on
who
m to
focu
s.��
Plan
(15-
30 m
in.)
��
Dec
ide
how
and
whe
n th
ese
may
be
used
w
ith s
tude
nts
and/
or p
aren
ts.
(Sam
e pr
oces
s an
d qu
estio
ns u
sed
in S
essi
on 1
.)
��
Asse
ssm
ent
coor
dina
tor
��
Adm
inis
trat
or��
Gra
de-l
evel
lead
te
ache
rs
��
Com
pute
r la
b��
Anno
tate
d St
uden
t Pr
ogre
ss R
epor
t ��
Teac
hers
’ ow
n St
uden
t Pr
ogre
ss R
epor
t (fo
r on
e st
uden
t)
��
Tim
e��
Dat
a fo
r ea
ch
teac
her
��
60-9
0 m
inut
esAf
ter
test
ing
is
com
plet
e; p
rior
to
pare
nt/t
each
er
conf
eren
ces

25Stepping Stones to Using Data Workbook | NWEA™
REPORTS ACTIVITIES
Step
ping
Sto
nes
to U
sing
Dat
a Te
ach-
Back
Sug
gest
ed T
imef
ram
esW
hole
Day
Tea
ch-B
ack
Hal
f-D
ay T
each
-Bac
k: D
ay O
neH
alf-
Day
Tea
ch-B
ack:
Day
Tw
o
Sess
ion
1: 6
0 m
inut
esSe
ssio
n 2:
60
min
utes
Sess
ion
3: 6
0 m
inut
esLu
nch
Sess
ion
4: 6
0 m
inut
esSe
ssio
n 5:
60
min
utes
Addi
tiona
l pla
nnin
g: 6
0 m
inut
es
Sess
ion
1: 6
0 m
inut
esSe
ssio
n 2:
60-
90 m
inut
esSe
ssio
n 3:
60
min
utes
Sess
ion
4: 6
0 m
inut
esSe
ssio
n 5:
60
min
utes
Addi
tiona
l pla
nnin
g: 6
0-90
min
utes
Incr
emen
tal T
each
-Bac
ks: C
hoos
e on
e re
port
(one
ses
sion
) to
focu
s on
at a
tim
e; 6
0-90
min
utes
eac
h.
Sess
ions
pro
vide
d ba
sed
on sc
hool
reso
urce
s: lu
nch
or a
fter s
choo
l, re
leas
e tim
e, e
tc.
Ong
oing
coac
hing
and
dat
a se
ssio
ns co
uld
be p
lann
ed fo
r tea
cher
s to
disc
uss h
ow to
acc
ess a
nd a
naly
ze d
ata
durin
g co
mm
on p
lann
ing
times
, re
leas
e da
ys, e
tc.
26 Stepping Stones to Using Data Workbook | NWEA™
REPO
RTS
ACTI
VITI
ES
For
futu
re u
se, a
cop
y of
this
wor
kshe
et is
ava
ilabl
e at
NW
EA.o
rg/w
orks
heet
s.
Plan
ning
For
war
d
Wha
t will
you
do
wit
h th
e
info
rmat
ion
you
lear
ned
toda
y?H
ow w
ill y
ou a
ppro
ach
im
plem
enta
tion
?W
ho w
ill b
e in
volv
ed?
Whe
n w
ill y
ou tr
y it
?
27Stepping Stones to Using Data Workbook | NWEA™
MAP
® FOR PRIM
ARY GRAD
ESRESO
URCES:
CLIENT-SERVER U
SERS
SECTION 2 MAP® for Primary Grades Resources: Client-Server Users
The information in this section is for use with the Reports Activities section of this workbook only. Please access the NWEA web site for the most up-to-date version of the Guidelines for Placing Students document.
28 Stepping Stones to Using Data Workbook | NWEA™
MAP
® F
OR
PRIM
ARY
GRA
DES
RESO
URC
ES:
CLIE
NT-
SERV
ER U
SERS
29Stepping Stones to Using Data Workbook | NWEA™
MAP
® FOR PRIM
ARY GRAD
ESRESO
URCES:
CLIENT-SERVER U
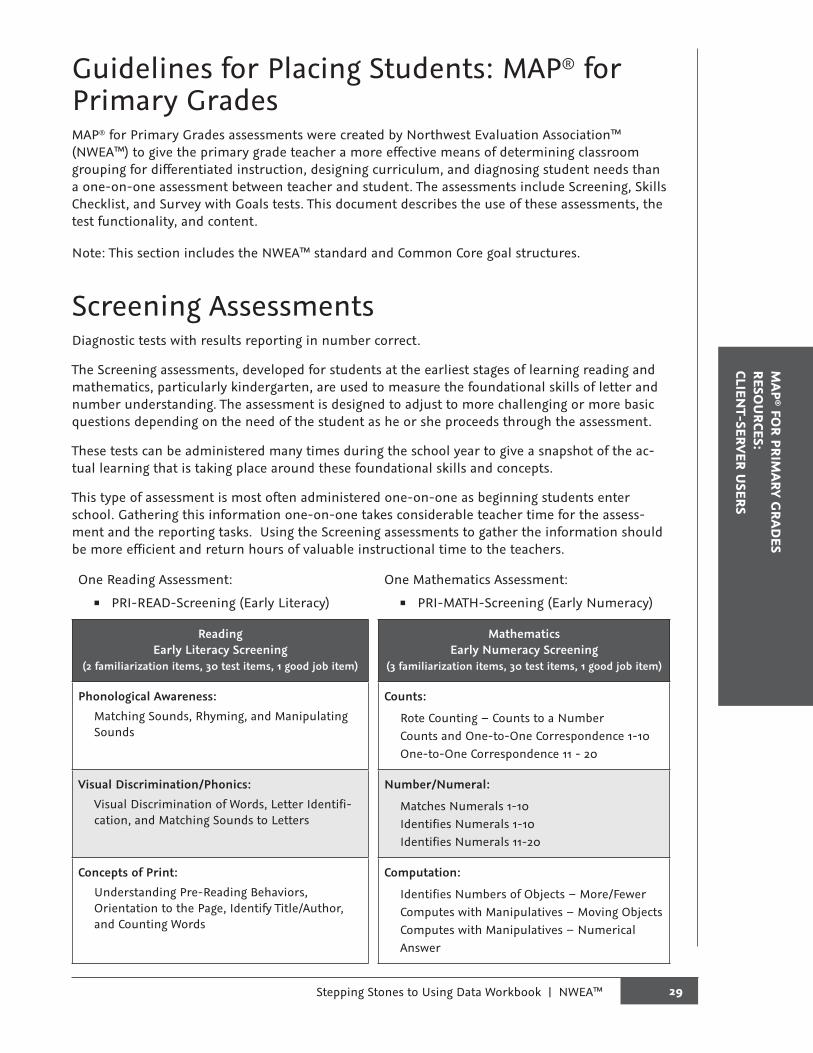
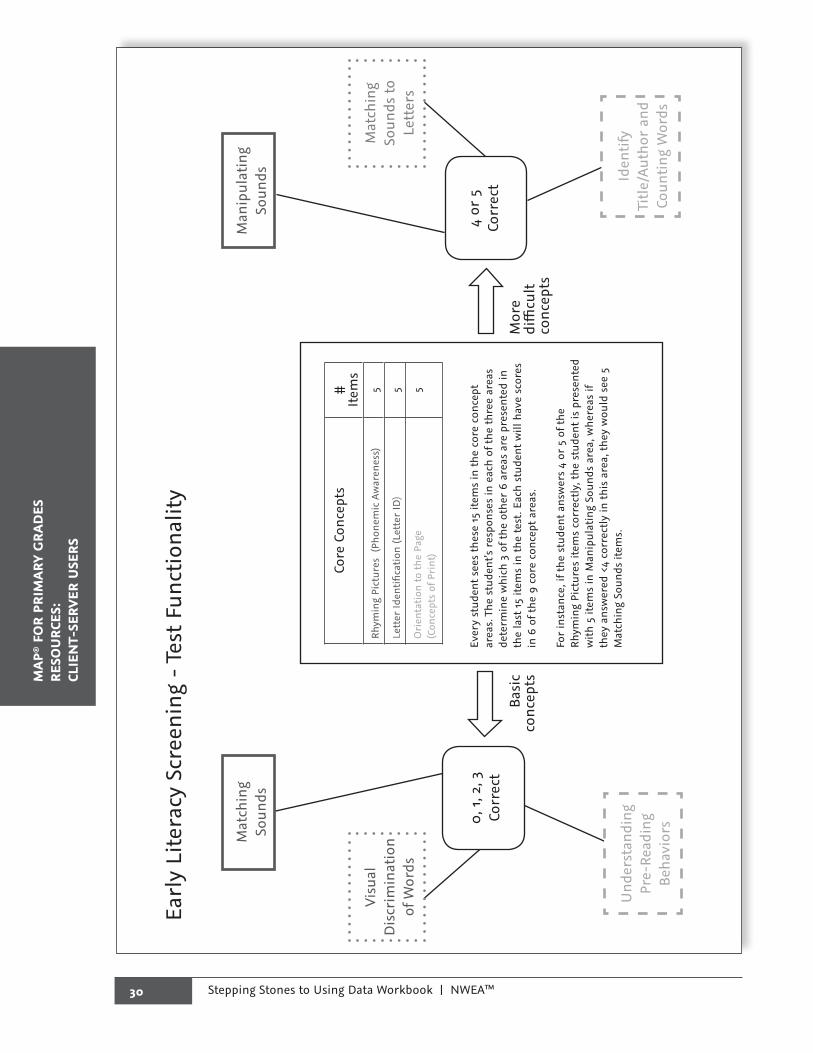
SERSGuidelines for Placing Students: MAP® for Primary GradesMAP® for Primary Grades assessments were created by Northwest Evaluation Association™ (NWEA™) to give the primary grade teacher a more effective means of determining classroom grouping for differentiated instruction, designing curriculum, and diagnosing student needs than a one-on-one assessment between teacher and student. The assessments include Screening, Skills Checklist, and Survey with Goals tests. This document describes the use of these assessments, the test functionality, and content.
Note: This section includes the NWEA™ standard and Common Core goal structures.
Screening AssessmentsDiagnostic tests with results reporting in number correct.
The Screening assessments, developed for students at the earliest stages of learning reading and mathematics, particularly kindergarten, are used to measure the foundational skills of letter and number understanding. The assessment is designed to adjust to more challenging or more basic questions depending on the need of the student as he or she proceeds through the assessment.
These tests can be administered many times during the school year to give a snapshot of the ac-tual learning that is taking place around these foundational skills and concepts.
This type of assessment is most often administered one-on-one as beginning students enter school. Gathering this information one-on-one takes considerable teacher time for the assess-ment and the reporting tasks. Using the Screening assessments to gather the information should be more efficient and return hours of valuable instructional time to the teachers.
One Reading Assessment:�� PRI-READ-Screening (Early Literacy)
One Mathematics Assessment:�� PRI-MATH-Screening (Early Numeracy)
ReadingEarly Literacy Screening
(2 familiarization items, 30 test items, 1 good job item)
MathematicsEarly Numeracy Screening
(3 familiarization items, 30 test items, 1 good job item)
Phonological Awareness: Matching Sounds, Rhyming, and Manipulating Sounds
Counts:
Rote Counting – Counts to a NumberCounts and One-to-One Correspondence 1-10One-to-One Correspondence 11 - 20
Visual Discrimination/Phonics: Visual Discrimination of Words, Letter Identifi-cation, and Matching Sounds to Letters
Number/Numeral:
Matches Numerals 1-10Identifies Numerals 1-10Identifies Numerals 11-20
Concepts of Print: Understanding Pre-Reading Behaviors, Orientation to the Page, Identify Title/Author, and Counting Words
Computation:
Identifies Numbers of Objects – More/FewerComputes with Manipulatives – Moving ObjectsComputes with Manipulatives – NumericalAnswer
30 Stepping Stones to Using Data Workbook | NWEA™
MAP
® F
OR
PRIM
ARY
GRA
DES
RESO
URC
ES:
CLIE
NT-
SERV
ER U
SERS
Core
Con
cept
s#
It
ems
Rhym
ing
Pict
ures
(Ph
onem
ic A
war
enes
s)5
Lett
er Id
entifi
catio
n (L
ette
r ID
)5
Ori
enta
tion
to th
e Pa
ge
(Con
cept
s of
Pri
nt)
5
Ever
y st
uden
t see
s th
ese
15 it
ems
in th
e co
re c
once
pt
area
s. T
he s
tude
nt’s
resp
onse
s in
eac
h of
the
thre
e ar
eas
dete
rmin
e w
hich
3 o
f the
oth
er 6
are
as a
re p
rese
nted
in
the
last
15
item
s in
the
test
. Eac
h st
uden
t will
hav
e sc
ores
in
6 o
f the
9 c
ore
conc
ept a
reas
.
For
inst
ance
, if t
he s
tude
nt a
nsw
ers
4 or
5 o
f the
Rh
ymin
g Pi
ctur
es it
ems
corr
ectl
y, th
e st
uden
t is
pres
ente
d w
ith 5
item
s in
Man
ipul
atin
g So
unds
are
a, w
here
as if
th
ey a
nsw
ered
<4
corr
ectl
y in
this
are
a, th
ey w
ould
see
5
Mat
chin
g So
unds
item
s.
4 or
5Co
rrec
t
Earl
y Li
tera
cy S
cree
ning
- T
est F
unct
iona
lity
Basi
c co
ncep
tsM
ore
diffi
cult
co
ncep
ts
Mat
chin
g
Soun
dsM
anip
ulat
ing
Soun
ds
Mat
chin
g
Soun
ds to
Le
tter
s
Visu
al
Dis
crim
inat
ion
of
Wor
ds
0, 1
, 2, 3
Co
rrec
t
Iden
tify
Ti
tle/
Auth
or a
nd
Coun
ting
Wor
ds
Und
erst
andi
ng
Pre-
Read
ing
Be
havi
ors

31Stepping Stones to Using Data Workbook | NWEA™
MAP
® FOR PRIM
ARY GRAD
ESRESO
URCES:
CLIENT-SERVER U
SERS
Core
Con
cept
s#
It
ems
Coun
ts 1
– 1
0 O
ne –
to –
One
Cor
resp
onde
nce
1 4
Num
ber/
Num
eral
1
- 1
05
Com
puta
tion
w/M
anip
ulat
ives
5
Ever
y st
uden
t see
s th
ese
15 it
ems
in th
e co
re c
once
pt
area
s. T
he s
tude
nt’s
resp
onse
s in
eac
h of
the
thre
e ar
eas
dete
rmin
e w
hich
3 o
f the
oth
er 6
are
as a
re p
rese
nted
in
the
last
15
item
s in
the
test
. Eac
h st
uden
t will
hav
e sc
ores
in
6 o
f the
9 c
ore
conc
ept a
reas
.
For
inst
ance
, if t
he s
tude
nt a
nsw
ers
4 or
5 o
f the
Num
ber/
N
umer
al 1
-10
item
s co
rrec
tly,
the
stud
ent i
s pr
esen
ted
with
5 it
ems
in N
umbe
r/N
umer
al 1
1-20
are
a, w
here
as if
th
ey a
nsw
ered
<4
corr
ectl
y, th
ey w
ould
see
5 M
atch
ing
item
s.
4 or
5Co
rrec
t
Earl
y N
umer
acy
Scre
enin
g –
Test
Fun
ctio
nalit
y
Basi
c co
ncep
tsM
ore
diffi
cult
co
ncep
ts
One
– to
– O
ne
Corr
espo
nden
ce
11-2
0
Rote
Co
untin
g
Num
ber/
Num
eral
11
-20
Mat
chin
g
Com
puta
tion
w/
Man
ipul
ativ
esM
ore/
Less
0, 1
, 2, 3
Co
rrec
t
32 Stepping Stones to Using Data Workbook | NWEA™
MAP
® F
OR
PRIM
ARY
GRA
DES
RESO
URC
ES:
CLIE
NT-
SERV
ER U
SERS
Skills Checklist AssessmentsDiagnostic tests with results reported in both percent and number correct.
The Skills Checklist assessments extend student assessment beyond the Screening assessments and are used to inform instruction relative to the skills of phonological awareness, phonemic awareness, letter identification, phonics, number sense and computation in reading and math-ematics, respectively.
Test functionality in the Reading Skills Checklist tests will randomly present all the test items in the assessment to each student.
Test functionality in the Mathematics Computation Skills Checklist tests will randomly present items and automatically stop after the first 10 items, if the student is not scoring at least 60% at that point in the test. Students who answer 60% or more of the first 10 items correctly will then see all the remaining items in the test. This should give the teacher the maximum amount of information about which Mathematics concept the student does and does not understand in the various subgoals without frustrating the lower performing students.
Ten Reading Assessments:�� PRI-READ-Skills (ConsonantBlends/Digraphs)
�� PRI-READ-Skills (Decode:Multi-SyllableWords)
�� PRI-READ-Skills (Decode:Patterns/WordFamilies)
�� PRI-READ-Skills (LetterIdentification)
�� PRI-READ-Skills (Manipulation of Sounds)
�� PRI-READ-Skills (Matching Letters to Sounds)
�� PRI-READ-Skills (PhonemeIdentification)
�� PRI-READ-Skills (PhonologicalAwareness)
�� PRI-READ-Skills (SyllableTypes:CVC,CVCe,R-Control)
�� PRI-READ-Skills (VowelDigraphs/Diphthongs)
33Stepping Stones to Using Data Workbook | NWEA™
MAP
® FOR PRIM
ARY GRAD
ESRESO
URCES:
CLIENT-SERVER U
SERSSkills Checklist Assessments (continued)
Twenty-eight Mathematics Assessments:�� PRI-MATH-Skills (Comp:10-UsingManipulatives)
�� PRI-MATH-Skills (Comp:10-UsingNumbers)
�� PRI-MATH-Skills (Comp:10-ProblemSolving)
�� PRI-MATH-Skills (Comp:20-UsingManipulatives)
�� PRI-MATH-Skills (Comp:20-UsingNumbers)
�� PRI-MATH-Skills (Comp:20-ProblemSolving)
�� PRI-MATH-Skills (Comp:100-NoRegroup-UsingManip)
�� PRI-MATH-Skills (Comp:100-NoRegroup-UsingNumbers)
�� PRI-MATH-Skills (Comp:100-NoRegroup-ProbSolving)
�� PRI-MATH-Skills (Comp:100-w/Regroup-UsingManip)
�� PRI-MATH-Skills (Comp:100-w/Regroup-UsingNumbers)
�� PRI-MATH-Skills (Comp:100-w/Regroup-ProbSolv/Estim)
�� PRI-MATH-Skills (Comp:1000-UsingManipulatives)
�� PRI-MATH-Skills (Comp:1000-UsingNumbers)
�� PRI-MATH-Skills (Comp:1000-ProbSolv/Estim)
�� PRI-MATH-Skills (NumSense:10-Count, Order, PlaceVal)
�� PRI-MATH-Skills (NumSense:10-Representation)
�� PRI-MATH-Skills (NumSense:20-Count, PlaceValue)
�� PRI-MATH-Skills (NumSense:20-Representation)
�� PRI-MATH-Skills (NumSense:20-Ordering)
�� PRI-MATH-Skills (NumSense:100-Count)
�� PRI-MATH-Skills (NumSense:100-Representation)
�� PRI-MATH-Skills (NumSense:100-Ordering)
�� PRI-MATH-Skills (NumSense:100-PlaceValue)
�� PRI-MATH-Skills (NumSense:1000-Count)
�� PRI-MATH-Skills (NumSense:1000-Representation)
�� PRI-MATH-Skills (NumSense:1000-Ordering)
�� PRI-MATH-Skills (NumSense:1000-Place Value)
This type of assessment is most often administered one-on-one teacher to student to gather in-formation about attainment of skills before and/or after instruction. Gathering this information one-on-one takes considerable teacher time for the assessment and the reporting tasks. Using the Skills Checklist assessments to gather the information should be more efficient and return hours of valuable instructional time to the teacher.
34 Stepping Stones to Using Data Workbook | NWEA™
MAP
® F
OR
PRIM
ARY
GRA
DES
RESO
URC
ES:
CLIE
NT-
SERV
ER U
SERS
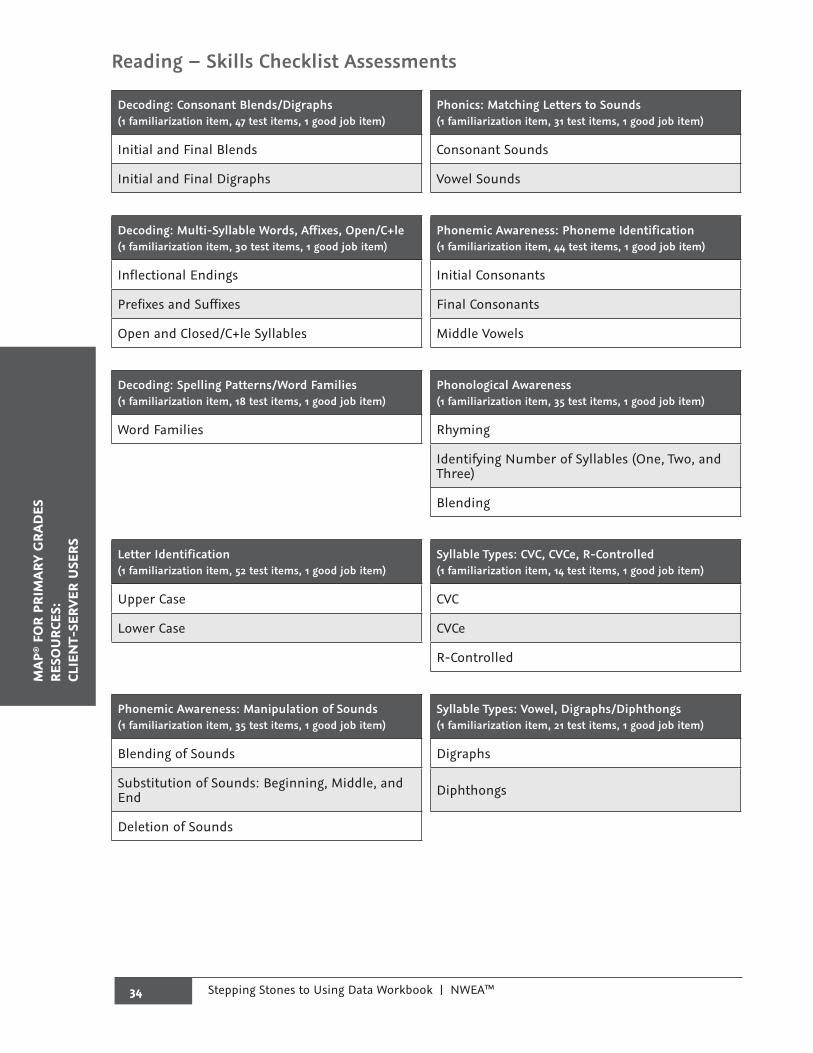
Reading – Skills Checklist Assessments
Decoding: Consonant Blends/Digraphs (1 familiarization item, 47 test items, 1 good job item)
Phonics: Matching Letters to Sounds (1 familiarization item, 31 test items, 1 good job item)
Initial and Final Blends Consonant Sounds
Initial and Final Digraphs Vowel Sounds
Decoding: Multi-Syllable Words, Affixes, Open/C+le(1 familiarization item, 30 test items, 1 good job item)
Phonemic Awareness: Phoneme Identification(1 familiarization item, 44 test items, 1 good job item)
Inflectional Endings Initial Consonants
Prefixes and Suffixes Final Consonants
Open and Closed/C+le Syllables Middle Vowels
Decoding: Spelling Patterns/Word Families (1 familiarization item, 18 test items, 1 good job item)
Phonological Awareness (1 familiarization item, 35 test items, 1 good job item)
Word Families Rhyming
Identifying Number of Syllables (One, Two, and Three)
Blending
Letter Identification(1 familiarization item, 52 test items, 1 good job item)
Syllable Types: CVC, CVCe, R-Controlled(1 familiarization item, 14 test items, 1 good job item)
Upper Case CVC
Lower Case CVCe
R-Controlled
Phonemic Awareness: Manipulation of Sounds (1 familiarization item, 35 test items, 1 good job item)
Syllable Types: Vowel, Digraphs/Diphthongs (1 familiarization item, 21 test items, 1 good job item)
Blending of Sounds Digraphs
Substitution of Sounds: Beginning, Middle, and End Diphthongs
Deletion of Sounds
35Stepping Stones to Using Data Workbook | NWEA™
MAP
® FOR PRIM
ARY GRAD
ESRESO
URCES:
CLIENT-SERVER U
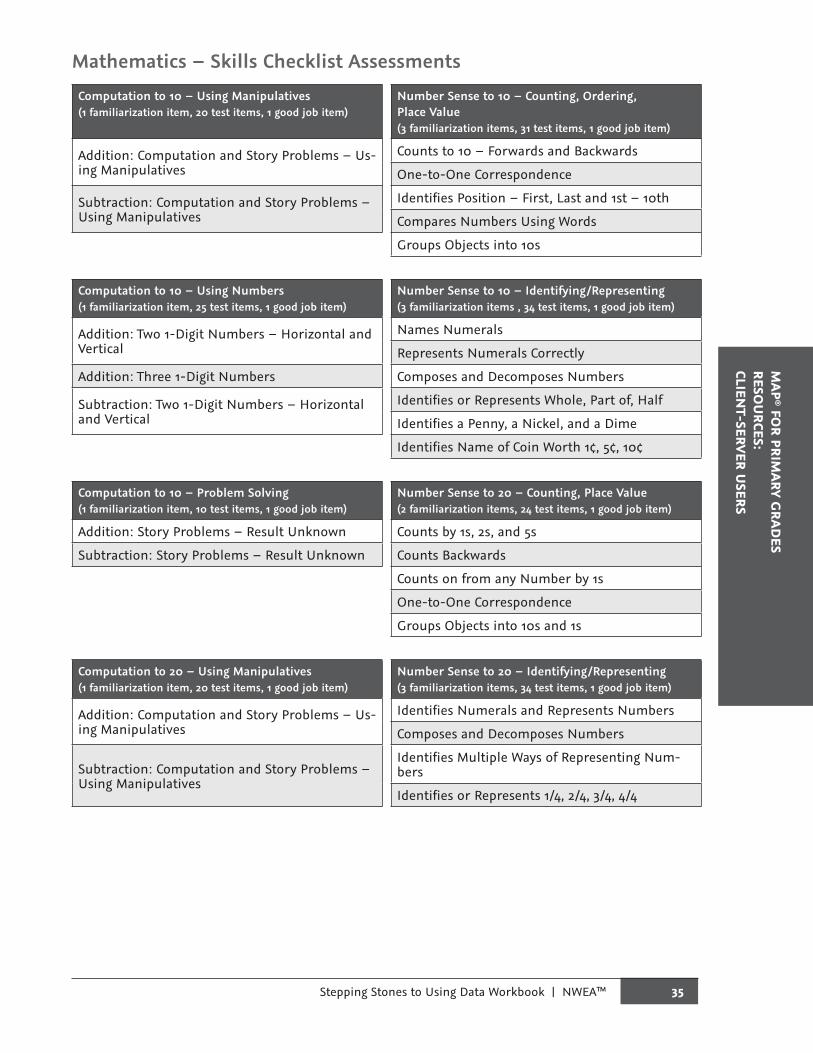
SERSMathematics – Skills Checklist Assessments
Computation to 10 – Using Manipulatives(1 familiarization item, 20 test items, 1 good job item)
Number Sense to 10 – Counting, Ordering, Place Value(3 familiarization items, 31 test items, 1 good job item)
Addition: Computation and Story Problems – Us-ing Manipulatives
Counts to 10 – Forwards and Backwards
One-to-One Correspondence
Subtraction: Computation and Story Problems – Using Manipulatives
Identifies Position – First, Last and 1st – 10th
Compares Numbers Using Words
Groups Objects into 10s
Computation to 10 – Using Numbers(1 familiarization item, 25 test items, 1 good job item)
Number Sense to 10 – Identifying/Representing(3 familiarization items , 34 test items, 1 good job item)
Addition: Two 1-Digit Numbers – Horizontal and Vertical
Names Numerals
Represents Numerals Correctly
Addition: Three 1-Digit Numbers Composes and Decomposes Numbers
Subtraction: Two 1-Digit Numbers – Horizontal and Vertical
Identifies or Represents Whole, Part of, Half
Identifies a Penny, a Nickel, and a Dime
Identifies Name of Coin Worth 1¢, 5¢, 10¢
Computation to 10 – Problem Solving(1 familiarization item, 10 test items, 1 good job item)
Number Sense to 20 – Counting, Place Value(2 familiarization items, 24 test items, 1 good job item)
Addition: Story Problems – Result Unknown Counts by 1s, 2s, and 5s
Subtraction: Story Problems – Result Unknown Counts Backwards
Counts on from any Number by 1s
One-to-One Correspondence
Groups Objects into 10s and 1s
Computation to 20 – Using Manipulatives(1 familiarization item, 20 test items, 1 good job item)
Number Sense to 20 – Identifying/Representing(3 familiarization items, 34 test items, 1 good job item)
Addition: Computation and Story Problems – Us-ing Manipulatives
Identifies Numerals and Represents Numbers
Composes and Decomposes Numbers
Subtraction: Computation and Story Problems – Using Manipulatives
Identifies Multiple Ways of Representing Num-bers
Identifies or Represents 1/4, 2/4, 3/4, 4/4
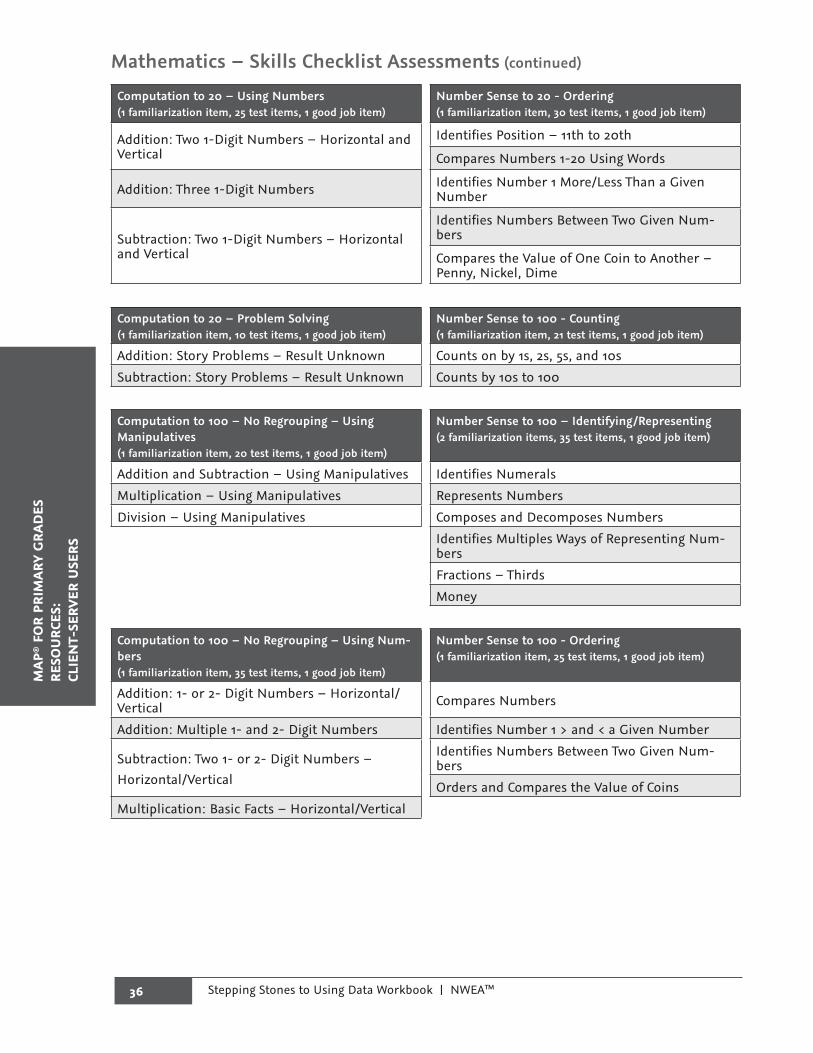
36 Stepping Stones to Using Data Workbook | NWEA™
MAP
® F
OR
PRIM
ARY
GRA
DES
RESO
URC
ES:
CLIE
NT-
SERV
ER U
SERS
Mathematics – Skills Checklist Assessments (continued)
Computation to 20 – Using Numbers(1 familiarization item, 25 test items, 1 good job item)
Number Sense to 20 - Ordering(1 familiarization item, 30 test items, 1 good job item)
Addition: Two 1-Digit Numbers – Horizontal and Vertical
Identifies Position – 11th to 20th
Compares Numbers 1-20 Using Words
Addition: Three 1-Digit Numbers Identifies Number 1 More/Less Than a Given Number
Subtraction: Two 1-Digit Numbers – Horizontal and Vertical
Identifies Numbers Between Two Given Num-bers
Compares the Value of One Coin to Another – Penny, Nickel, Dime
Computation to 20 – Problem Solving(1 familiarization item, 10 test items, 1 good job item)
Number Sense to 100 - Counting(1 familiarization item, 21 test items, 1 good job item)
Addition: Story Problems – Result Unknown Counts on by 1s, 2s, 5s, and 10s
Subtraction: Story Problems – Result Unknown Counts by 10s to 100
Computation to 100 – No Regrouping – Using Manipulatives(1 familiarization item, 20 test items, 1 good job item)
Number Sense to 100 – Identifying/Representing(2 familiarization items, 35 test items, 1 good job item)
Addition and Subtraction – Using Manipulatives Identifies Numerals
Multiplication – Using Manipulatives Represents Numbers
Division – Using Manipulatives Composes and Decomposes Numbers
Identifies Multiples Ways of Representing Num-bers
Fractions – Thirds
Money
Computation to 100 – No Regrouping – Using Num-bers(1 familiarization item, 35 test items, 1 good job item)
Number Sense to 100 - Ordering (1 familiarization item, 25 test items, 1 good job item)
Addition: 1- or 2- Digit Numbers – Horizontal/Vertical Compares Numbers
Addition: Multiple 1- and 2- Digit Numbers Identifies Number 1 > and < a Given Number
Subtraction: Two 1- or 2- Digit Numbers – Horizontal/Vertical
Identifies Numbers Between Two Given Num-bers
Orders and Compares the Value of Coins
Multiplication: Basic Facts – Horizontal/Vertical
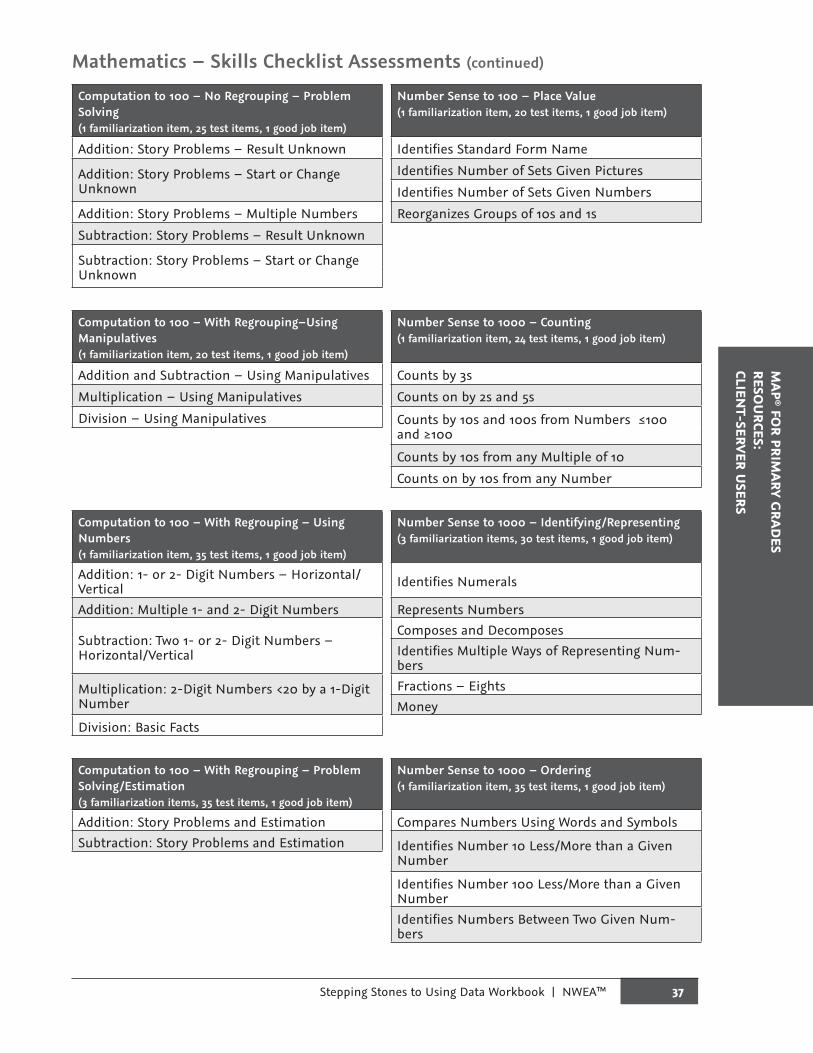
37Stepping Stones to Using Data Workbook | NWEA™
MAP
® FOR PRIM
ARY GRAD
ESRESO
URCES:
CLIENT-SERVER U
SERSMathematics – Skills Checklist Assessments (continued)
Computation to 100 – No Regrouping – Problem Solving(1 familiarization item, 25 test items, 1 good job item)
Number Sense to 100 – Place Value(1 familiarization item, 20 test items, 1 good job item)
Addition: Story Problems – Result Unknown Identifies Standard Form Name
Addition: Story Problems – Start or Change Unknown
Identifies Number of Sets Given Pictures
Identifies Number of Sets Given Numbers
Addition: Story Problems – Multiple Numbers Reorganizes Groups of 10s and 1s
Subtraction: Story Problems – Result Unknown
Subtraction: Story Problems – Start or Change Unknown
Computation to 100 – With Regrouping–Using Manipulatives(1 familiarization item, 20 test items, 1 good job item)
Number Sense to 1000 – Counting(1 familiarization item, 24 test items, 1 good job item)
Addition and Subtraction – Using Manipulatives Counts by 3s
Multiplication – Using Manipulatives Counts on by 2s and 5s
Division – Using Manipulatives Counts by 10s and 100s from Numbers ≤100 and ≥100
Counts by 10s from any Multiple of 10
Counts on by 10s from any Number
Computation to 100 – With Regrouping – Using Numbers(1 familiarization item, 35 test items, 1 good job item)
Number Sense to 1000 – Identifying/Representing(3 familiarization items, 30 test items, 1 good job item)
Addition: 1- or 2- Digit Numbers – Horizontal/Vertical Identifies Numerals
Addition: Multiple 1- and 2- Digit Numbers Represents Numbers
Subtraction: Two 1- or 2- Digit Numbers – Horizontal/Vertical
Composes and DecomposesIdentifies Multiple Ways of Representing Num-bers
Multiplication: 2-Digit Numbers <20 by a 1-Digit Number
Fractions – EightsMoney
Division: Basic Facts
Computation to 100 – With Regrouping – Problem Solving/Estimation(3 familiarization items, 35 test items, 1 good job item)
Number Sense to 1000 – Ordering(1 familiarization item, 35 test items, 1 good job item)
Addition: Story Problems and Estimation Compares Numbers Using Words and SymbolsSubtraction: Story Problems and Estimation Identifies Number 10 Less/More than a Given
Number
Identifies Number 100 Less/More than a Given NumberIdentifies Numbers Between Two Given Num-bers
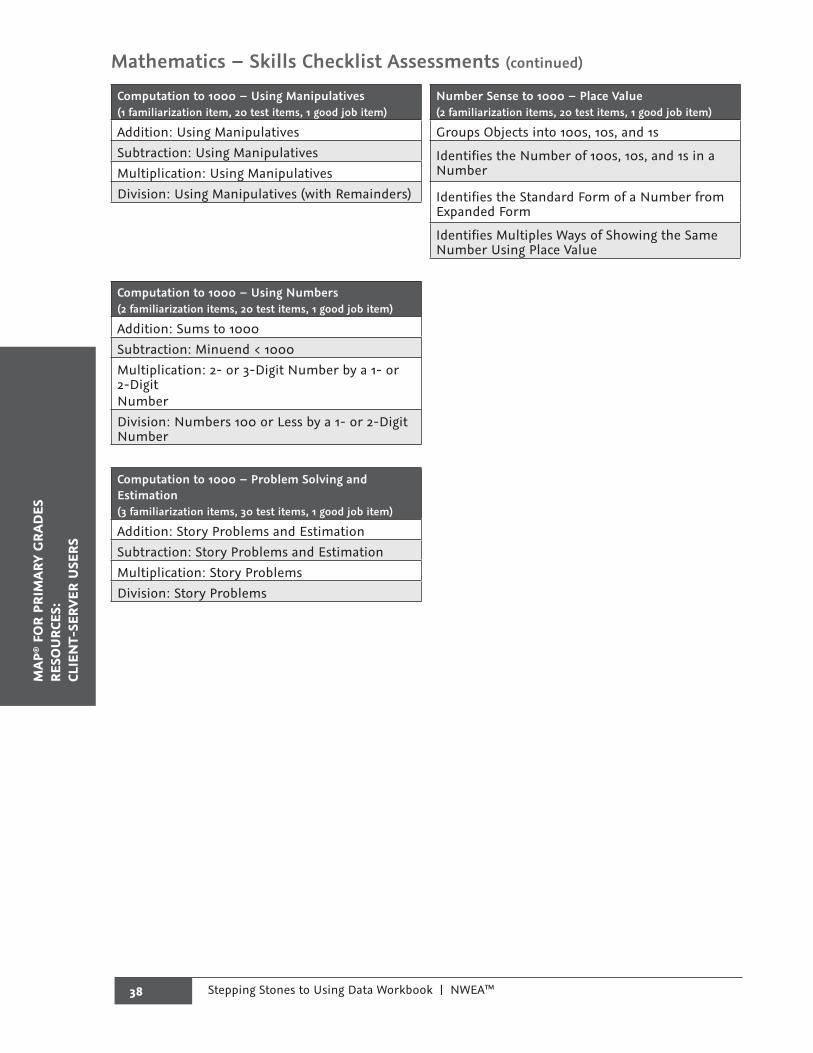
38 Stepping Stones to Using Data Workbook | NWEA™
MAP
® F
OR
PRIM
ARY
GRA
DES
RESO
URC
ES:
CLIE
NT-
SERV
ER U
SERS
Mathematics – Skills Checklist Assessments (continued)
Computation to 1000 – Using Manipulatives(1 familiarization item, 20 test items, 1 good job item)
Number Sense to 1000 – Place Value (2 familiarization items, 20 test items, 1 good job item)
Addition: Using Manipulatives Groups Objects into 100s, 10s, and 1sSubtraction: Using Manipulatives Identifies the Number of 100s, 10s, and 1s in a
NumberMultiplication: Using ManipulativesDivision: Using Manipulatives (with Remainders) Identifies the Standard Form of a Number from
Expanded Form
Identifies Multiples Ways of Showing the Same Number Using Place Value
Computation to 1000 – Using Numbers(2 familiarization items, 20 test items, 1 good job item)
Addition: Sums to 1000Subtraction: Minuend < 1000Multiplication: 2- or 3-Digit Number by a 1- or 2-Digit NumberDivision: Numbers 100 or Less by a 1- or 2-Digit Number
Computation to 1000 – Problem Solving and Estimation(3 familiarization items, 30 test items, 1 good job item)
Addition: Story Problems and EstimationSubtraction: Story Problems and EstimationMultiplication: Story ProblemsDivision: Story Problems
39Stepping Stones to Using Data Workbook | NWEA™
MAP
® FOR PRIM
ARY GRAD
ESRESO
URCES:
CLIENT-SERVER U
SERSSurvey w/ Goals AssessmentsAdaptive tests with results reported in RIT scores.
The Survey w/ Goals segment tests adapt to the level of difficulty appropriate for the student, and when combined, provide RIT scores which may be used to measure growth from fall-to-spring and year-to-year. If a student takes both test segments in a subject area within 28 days, they will be automatically combined.
The RIT scores assist teachers in identifying skills that are most appropriate for instruction based on the student’s individual performance regardless of whether the student is at, above, or below grade level.
By presenting only three goal areas in each test segment, this limits the number of items pre-sented to the primary grades student. The two Reading test segment scores and two Mathematics test segment scores, respectively, are combined to give a single RIT score in each measurement scale for the student. This RIT score can then be used with the Primary Grades Instructional Data to group students for differentiated instruction, develop curriculum and diagnose individual student instructional needs.
The reading comprehension test segment includes items that assess listening comprehension, items that provide audio support with text, items that have audio to be used at the discretion of the student, and items that include no audio at all. Cognitive complexity and the comprehension skill being assessed are factors that contribute to where the items fall on the RIT scale. In other words, there are items at all difficulty levels with and without audio.
The Lexile® Range is calculated based on the Vocabulary, Word Structure, and Comprehension test.
40 Stepping Stones to Using Data Workbook | NWEA™
MAP
® F
OR
PRIM
ARY
GRA
DES
RESO
URC
ES:
CLIE
NT-
SERV
ER U
SERS
NWEA™ Standard Goal StructuresTwo Reading Assessments:
�� PRI-READ-Survey w/Goals (PhonAware,Phonic,ConPrnt)�� PRI-READ-Survey w/Goals (Vocab,Comprehen,Writing)
Phonological Awareness, Phonics, Concepts of Print(4 familiarization items, 30 test items, 1 good job item)
Vocabulary and Word Structure, Comprehension, & Writing(4 familiarization items, 30 test items, 1 good job item)
Phonological Awareness
�� Phoneme Identification�� Blending�� Rhyming�� Phonemic Manipulation of Sounds and
Syllabication
Vocabulary and Word Structure
�� Sight Words�� Content Vocabulary and Context Clues�� Synonyms, Antonyms, Homonyms, Homo-
graphs, Homophones�� Base Words, Prefixes, Suffixes�� Compound Words, Contractions
Phonics
�� Consonants�� Vowel Patterns�� Spelling Patterns and Rhyming�� Sound Manipulation and Syllabication
Comprehension
�� Literal Comprehension�� Interpretive Comprehension�� Evaluative Comprehension
Concepts of Print
�� Developmental Reading Skills�� Developmental Writing Skills�� Environmental Print
Writing
�� Writing Process �� Conventions of Language�� Language Structure, Phrase, Sentence, Paragraph�� Grammatical Patterns
Two Mathematics Assessments:�� PRI-MATH-Survey w/Goals (PrSolv,NumSense,Comp)�� PRI-MATH-Survey w/Goals (Meas/Geo,Stat/Prob,Alg)
Problem Solving, Number Sense, Computation(4 familiarization items, 30 test items, 1 good job item)
Measurement/Geometry, Statistics/Probability, Algebra(4 familiarization items, 30 test items, 1 good job item)
Problem Solving
�� Understand and Represent Word Problems�� Solutions Strategies and Verification of An-
swers�� Logic, Reasoning, Conjectures, and Proof
Measurement and Geometry
�� Attributes, Compare, Order, Tools, Units�� Measure and Estimate �� Identify, Attributes: Lines, 2-D, 3-D�� Spatial, Transformations, Symmetry,
CongruenceNumber Sense
�� Count�� Identify, Represent: Whole Numbers, Frac-
tions�� Relative Position and Magnitude�� Place Value and Base-Ten System
Statistics and Probability
�� Data Collection, Organization, and Display�� Data Analysis�� Probability and Predictions
Computation
�� Addition�� Subtraction�� Readiness for Multiplication and Division
Algebra�� Attributes, Patterns, and Functions�� Understand Algebraic Concepts�� Application of Algebraic Concepts
41Stepping Stones to Using Data Workbook | NWEA™
MAP
® FOR PRIM
ARY GRAD
ESRESO
URCES:
CLIENT-SERVER U
SERSCommon Core Goal StructuresTwo Reading Assessments:
�� PRI-READ-Survey w/Goals Common Core(Found Skills,Lit/Info)V1 (TestTaker Name)�� PRI-READ-Survey w/Goals Common Core(Vocab,Lang/Writing)V1 (TestTaker Name)
Foundational Skills, Literature and Informational (4 familiarization items, 28 test items, 1 good job item)
Vocabulary Use and Functions, Language and Writing (4 familiarization items, 28 test items, 1 good job item)
Foundational Skills�� Phonics and Word Recognition�� Phonological Awareness�� Print Concepts
Vocabulary Use and Functions�� Language: Context Clues and References�� Vocabulary Acquisition and Use
Literature and Informational�� Informational Text: Key Ideas, Details, Craft
Structure�� Literature: Key Ideas, Craft Structure
Language and Writing�� Capitalize, Spell, Punctuate�� Language: Grammar, Usage�� Writing: Purposes: Plan, Develop, Edit
Two Mathematics Assessments:
�� PRI-MATH-Survey w/Goals Common Core(Algebra,Num/Operations)V1 (TestTaker Name)�� PRI-MATH-Survey w/Goals Common Core(Meas/Data,Geometry)V1 (TestTaker Name)
Operations and Algebraic Thinking, Number and Operations in Base Ten (4 familiarization items, 28 test items, 1 good job item)
Measurement and Data, Geometry (4 familiarization items, 28 test items, 1 good job item)
Operations and Algebraic Thinking�� Represent and Solve Problems�� Properties of Operations
Measurement and Data�� Solve Problems Involving Measurement�� Represent and Interpret Data
Number and Operations�� Understand Place Value, Counting, and
Cardinality�� Number and Operations: Base Ten and
Fractions
Geometry�� Reason with Shapes and Their Attributes

42 Stepping Stones to Using Data Workbook | NWEA™
MAP
® F
OR
PRIM
ARY
GRA
DES
RESO
URC
ES:
CLIE
NT-
SERV
ER U
SERS
NOTES
43Stepping Stones to Using Data Workbook | NWEA™
MAP
® FOR PRIM
ARY GRAD
ESRESO
URCES:
WEB-BASED
USERS
SECTION 3 MAP® for Primary Grades Resources: Web-Based Users
The information in this section is for use with the Reports Activities section of this workbook only. Please access MARC for the most up-to-date version of the Assessment Coordination Guide - Appendix A: Test Selection Details.

44 Stepping Stones to Using Data Workbook | NWEA™
MAP
® F
OR
PRIM
ARY
GRA
DES
RESO
URC
ES:
WEB
-BAS
ED U
SERS

45Stepping Stones to Using Data Workbook | NWEA™
MAP
® FOR PRIM
ARY GRAD
ESRESO
URCES:
WEB-BASED
USERS
Assessment Coordination Guide Appendix A: Test Selection DetailsMPG TestsMAP for Primary Grades assessments were created to give primary grade instructors a more ef-ficient means than a one-on-one assessment between instructor and student for:
�� Determining classroom grouping for differentiated instruction
�� Identifying appropriate curriculum
�� Identifying student needs
MPG assessments measure achievement in reading and mathematics for students in the kinder-garten to the end of second grade. MPG tests include multiple-choice questions and other ques-tion types that allow the system to measure a broad range of student capabilities.
All MPG test questions include audio in their presentation to allow measurement of a variety of language skills. Audio presentation also prevents differences in students’ reading skills from de-creasing the validity of mathematics test results.
The MPG test types are:
�� Screening
�� Skills Checklist
�� Survey with Goals
All MPG tests are defined by NWEA and are not aligned with specific state standards.
MPG Screening TestsThe MPG Screening tests, developed for students at the earliest stages of learning reading and mathematics—particularly kindergarten—are used to measure the foundational skills of letter and number understanding. These foundational skills are needed for successful development of read-ing and mathematics proficiency. Results of MPG Screening tests are reported in percent correct.
The Screening tests are designed to adjust to more challenging or more basic questions depending on the need of the students as they proceed through the test. Screening tests are sometimes used for students who may not be ready for the Survey with Goals tests.
The Screening tests can replace many one-on-one manual assessment sessions between students and instructors, restoring valuable hours of instructional time. Screening tests can be adminis-tered many times during the school year to give a snapshot of the actual learning that is taking place around these foundational skills and concepts.
NWEA offers the following MPG Screening tests:
�� Mathematics Early Numeracy, with 35 questions
�� Reading Early Literacy, with 33 questions

46 Stepping Stones to Using Data Workbook | NWEA™
MAP
® F
OR
PRIM
ARY
GRA
DES
RESO
URC
ES:
WEB
-BAS
ED U
SERSQuestion Selection for MPG Screening TestsScreening tests are fixed tests with a very limited pool of questions. A Screening test presents questions in random order. The test adapts after the first half of the questions to select the more difficult or less difficult set of questions, based on the student’s performance to that point.
Each Screening test presents 2 or 4 familiarization questions, 30 test questions, and 1 reward item. Each Screening test is divided into 3 skill areas. Each skill area contains 3 sub-skills of varying dif-ficulties, for a total of 9 sub-skills. Each student receives scores in only 6 of the 9 sub-skill areas, as explained below.
Test questions are selected for each student from the skill areas in the following manner:
1. The student begins with 5 questions from each skill area (for a total of 15). These questions are from the intermediate difficulty sub-skill within each skill area. Example: From the reading test’s Phonological Awareness skill area, the student receives 5 questions from the Rhyming Words sub-skill (the intermediate difficulty sub-skill shown in Table 17: Reading Early Literacy Screening Skill Areas).
2. The number of questions answered correctly in each skill area determines the sub-skill within each skill area to be tested next.
�� If the student answers 4 or 5 questions from a skill area correctly, the next 5 ques-tions are selected from the more difficult sub-skill within the skill area.
�� Example: The student answers 4 questions correctly from the Rhyming Words sub-skill. The next 5 questions for the Phonological Awareness skill are from the Manip-ulating Sounds sub-skill (the more difficult sub-skill).
�� If less than 4 answers are correct, the next 5 questions are from the less difficult sub-skill.
This selection process occurs independently for each of the 3 skill areas, for a total of 15 additional questions.
Each student receives scores in 6 of the 9 sub-skill areas, as shown in the following figure.
Skill Area 1(Phonological Awareness)
Less Difficult Sub-Skill(Matching Sounds)
5 questions
Intermediate DifficultySub-Skill
(Rhyming Words)5 questions
More Difficult Sub-Skill(Manipulating Sounds)
5 questions
Start
If 1 to 3correct
10 questionstotal
If 4 to 5correct
Scores in2 out of 3Sub-Skills
Figure 7: Selection Process for Questions in MPG Screening Test

47Stepping Stones to Using Data Workbook | NWEA™
MAP
® FOR PRIM
ARY GRAD
ESRESO
URCES:
WEB-BASED
USERS
Within each skill area, the sub-skills are listed in order of increasing difficulty, as described in the following tables.
Table 16: Mathematics Early Numeracy Screening Skill Areas
SKILL AREA SUB-SKILL
Counts �� Rote Counting: Counts to a Number�� Counts 1 to 10 and One-to-One Correspondence for 1 to 10�� One-to-One Correspondence for 11 to 20
Number/Numeral �� Matches Numerals 1 to 10�� Identifies Numerals 1 to 10�� Identifies Numerals 11 to 20
Computation �� Identifies Numbers of Objects: More/Fewer�� Computes with Manipulatives: Moving Objects�� Computes with Manipulatives: Numerical Answer
Table 17: Reading Early Literacy Screening Skill Areas
SKILL AREA SUB-SKILL
Phonological Awareness
�� Matching Sounds�� Rhyming Words�� Manipulating Sounds
Visual Discrimination/Phonics
�� Visual Discrimination of Words�� Letter Identification�� Matching Sounds to Letters
Concepts of Print �� Understanding Pre-Reading Behaviors�� Orienation to the Page�� Identify Title/Author and Counting Words
48 Stepping Stones to Using Data Workbook | NWEA™
MAP
® F
OR
PRIM
ARY
GRA
DES
RESO
URC
ES:
WEB
-BAS
ED U
SERSMPG Skills Checklist TestsMPG Skills Checklist tests provide educators with data on specific content. The Skills Checklist tests go beyond the Screening tests and are used to inform instruction relative to the following skills:
�� Reading: Phonological awareness, phonemic awareness, letter identification, and phonics
�� Mathematics: Number sense and computation
Instructors can use Skills Checklist tests:
�� To determine student performance relative to many reading and mathematics skills
�� For instructional planning
�� To measure instructional effectiveness
The Skills Checklist tests can replace many one-on-one manual assessment sessions between stu-dents and instructors, restoring valuable hours of instructional time. These tests may be adminis-tered as often as is useful for the instructor.
Results of MPG Skills Checklist tests are reported in percent correct. NWEA offers both Reading and Mathematics MPG Skills Checklist tests.
Question Selection for MPG Skills Checklist TestsThe Reading Skills Checklist tests randomly present all questions in the test to each student.
The Mathematics Computation Skills Checklist tests randomly present questions and automatically stop after the first 10 questions, if the student is not scoring at least 60% at that point in the test. Students who answer 60% or more of the first 10 questions correctly will then see all the remain-ing questions in the test. This should give the instructor the maximum amount of information about which Mathematics concept the student does and does not understand in the various sub-skills without frustrating the lower performing students.
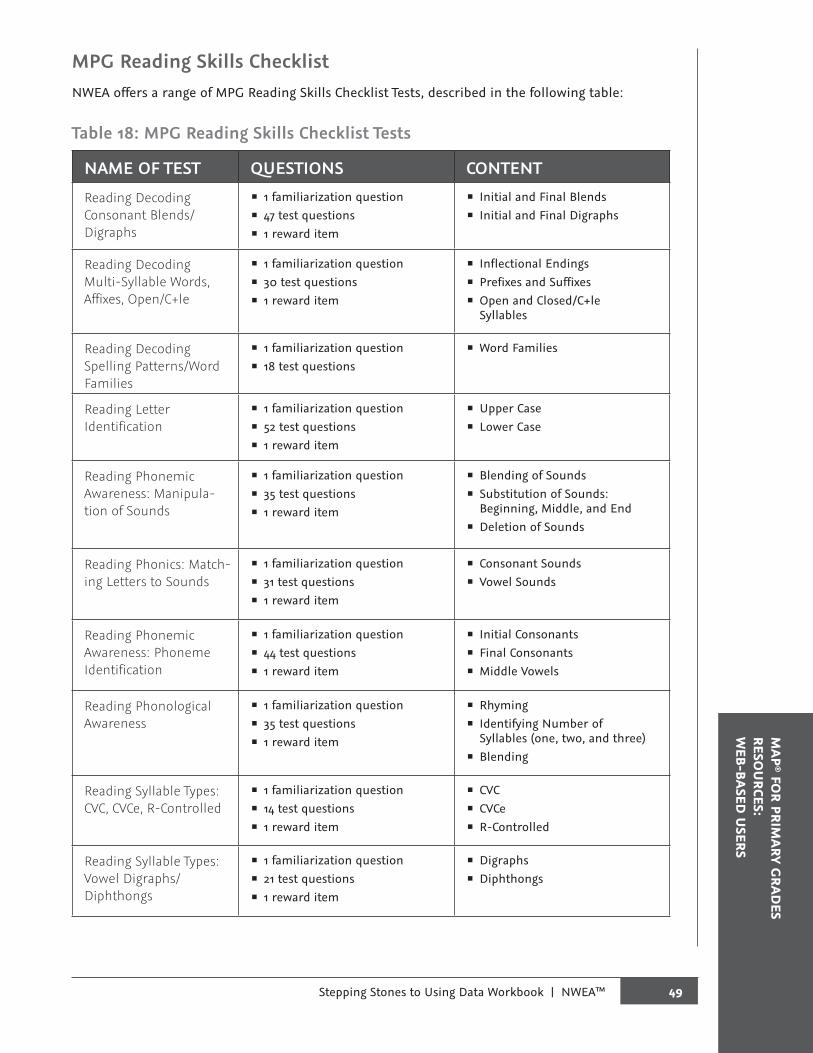
49Stepping Stones to Using Data Workbook | NWEA™
MAP
® FOR PRIM
ARY GRAD
ESRESO
URCES:
WEB-BASED
USERS
MPG Reading Skills Checklist NWEA offers a range of MPG Reading Skills Checklist Tests, described in the following table:
Table 18: MPG Reading Skills Checklist Tests
NAME OF TEST QUESTIONS CONTENT
Reading Decoding Consonant Blends/ Digraphs
�� 1 familiarization question�� 47 test questions�� 1 reward item
�� Initial and Final Blends�� Initial and Final Digraphs
Reading Decoding Multi-Syllable Words, Affixes, Open/C+le
�� 1 familiarization question�� 30 test questions�� 1 reward item
�� Inflectional Endings�� Prefixes and Suffixes�� Open and Closed/C+le Syllables
Reading Decoding Spelling Patterns/Word Families
�� 1 familiarization question�� 18 test questions
�� Word Families
Reading Letter Identification
�� 1 familiarization question�� 52 test questions�� 1 reward item
�� Upper Case�� Lower Case
Reading Phonemic Awareness: Manipula-tion of Sounds
�� 1 familiarization question�� 35 test questions�� 1 reward item
�� Blending of Sounds�� Substitution of Sounds: Beginning, Middle, and End�� Deletion of Sounds
Reading Phonics: Match-ing Letters to Sounds
�� 1 familiarization question�� 31 test questions�� 1 reward item
�� Consonant Sounds�� Vowel Sounds
Reading Phonemic Awareness: Phoneme Identification
�� 1 familiarization question�� 44 test questions�� 1 reward item
�� Initial Consonants�� Final Consonants�� Middle Vowels
Reading Phonological Awareness
�� 1 familiarization question�� 35 test questions�� 1 reward item
�� Rhyming�� Identifying Number of Syllables (one, two, and three)�� Blending
Reading Syllable Types: CVC, CVCe, R-Controlled
�� 1 familiarization question�� 14 test questions�� 1 reward item
�� CVC�� CVCe�� R-Controlled
Reading Syllable Types: Vowel Digraphs/ Diphthongs
�� 1 familiarization question�� 21 test questions�� 1 reward item
�� Digraphs�� Diphthongs
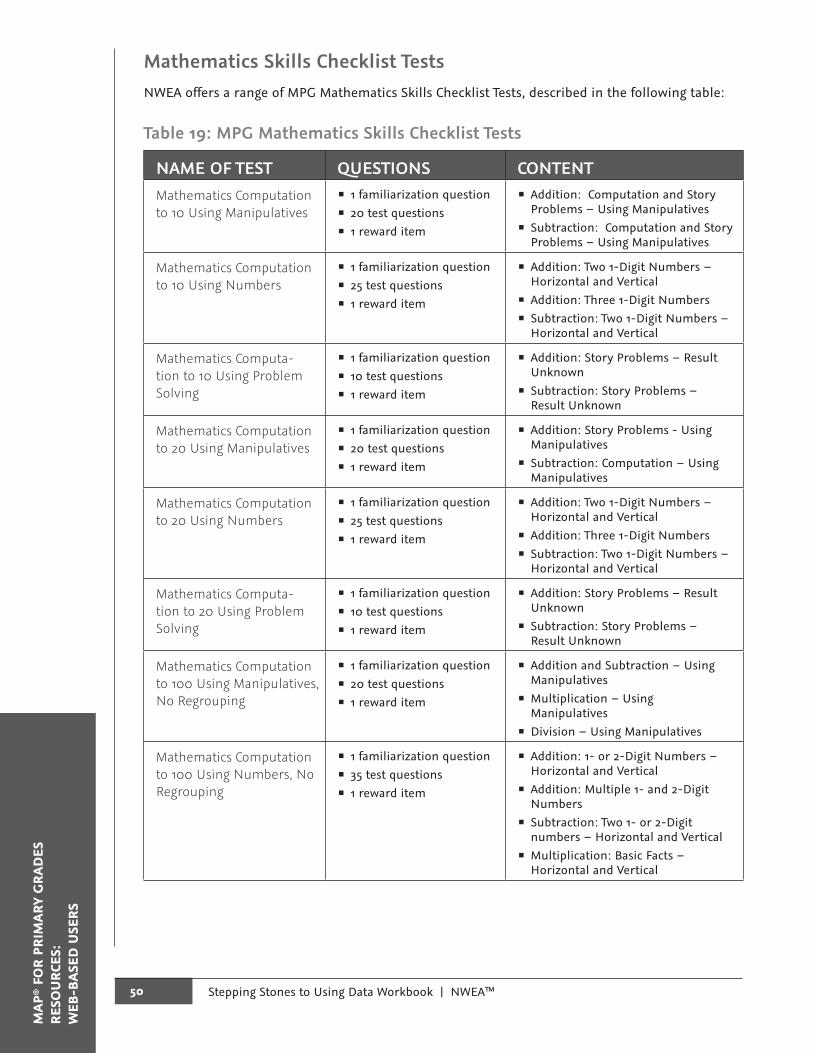
50 Stepping Stones to Using Data Workbook | NWEA™
MAP
® F
OR
PRIM
ARY
GRA
DES
RESO
URC
ES:
WEB
-BAS
ED U
SERSMathematics Skills Checklist TestsNWEA offers a range of MPG Mathematics Skills Checklist Tests, described in the following table:
Table 19: MPG Mathematics Skills Checklist Tests
NAME OF TEST QUESTIONS CONTENTMathematics Computation to 10 Using Manipulatives
�� 1 familiarization question�� 20 test questions�� 1 reward item
�� Addition: Computation and Story Problems – Using Manipulatives�� Subtraction: Computation and Story Problems – Using Manipulatives
Mathematics Computation to 10 Using Numbers
�� 1 familiarization question�� 25 test questions�� 1 reward item
�� Addition: Two 1-Digit Numbers – Horizontal and Vertical�� Addition: Three 1-Digit Numbers�� Subtraction: Two 1-Digit Numbers – Horizontal and Vertical
Mathematics Computa-tion to 10 Using Problem Solving
�� 1 familiarization question�� 10 test questions�� 1 reward item
�� Addition: Story Problems – Result Unknown�� Subtraction: Story Problems – Result Unknown
Mathematics Computation to 20 Using Manipulatives
�� 1 familiarization question�� 20 test questions�� 1 reward item
�� Addition: Story Problems - Using Manipulatives�� Subtraction: Computation – Using Manipulatives
Mathematics Computation to 20 Using Numbers
�� 1 familiarization question�� 25 test questions�� 1 reward item
�� Addition: Two 1-Digit Numbers – Horizontal and Vertical�� Addition: Three 1-Digit Numbers�� Subtraction: Two 1-Digit Numbers – Horizontal and Vertical
Mathematics Computa-tion to 20 Using Problem Solving
�� 1 familiarization question�� 10 test questions�� 1 reward item
�� Addition: Story Problems – Result Unknown�� Subtraction: Story Problems – Result Unknown
Mathematics Computation to 100 Using Manipulatives, No Regrouping
�� 1 familiarization question�� 20 test questions�� 1 reward item
�� Addition and Subtraction – Using Manipulatives�� Multiplication – Using Manipulatives�� Division – Using Manipulatives
Mathematics Computation to 100 Using Numbers, No Regrouping
�� 1 familiarization question�� 35 test questions�� 1 reward item
�� Addition: 1- or 2-Digit Numbers – Horizontal and Vertical�� Addition: Multiple 1- and 2-Digit Numbers�� Subtraction: Two 1- or 2-Digit numbers – Horizontal and Vertical�� Multiplication: Basic Facts – Horizontal and Vertical
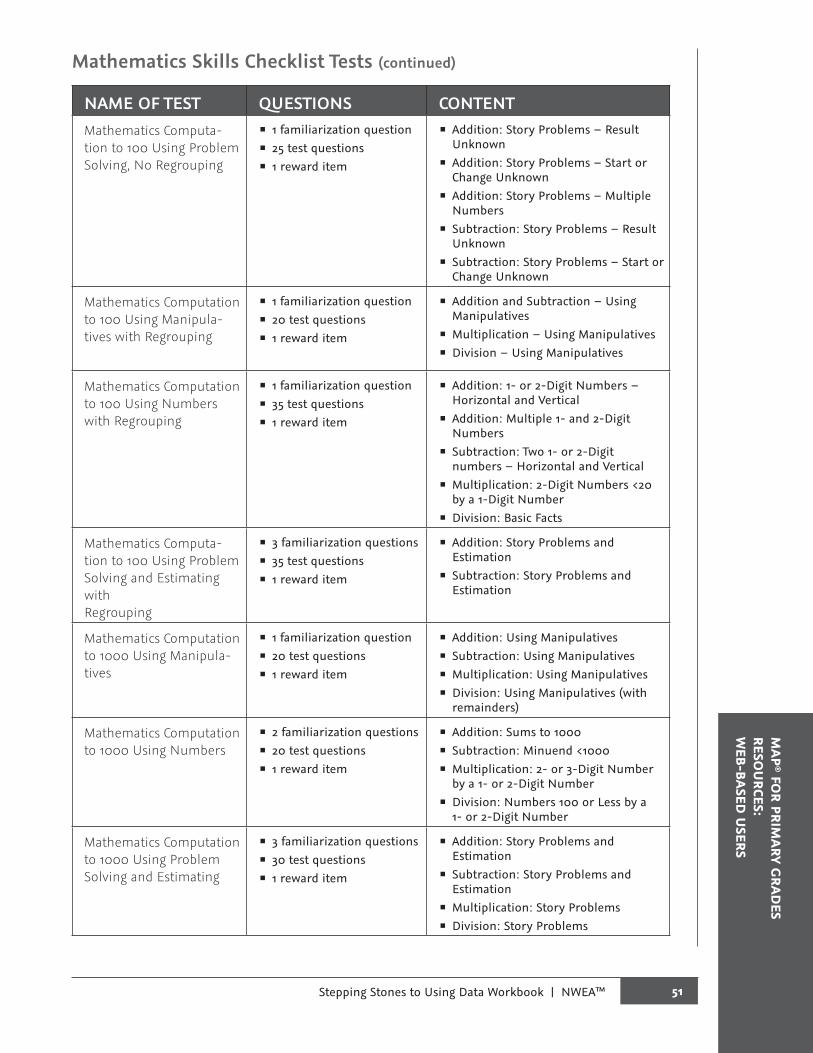
51Stepping Stones to Using Data Workbook | NWEA™
MAP
® FOR PRIM
ARY GRAD
ESRESO
URCES:
WEB-BASED
USERS
Mathematics Skills Checklist Tests (continued)
NAME OF TEST QUESTIONS CONTENTMathematics Computa-tion to 100 Using Problem Solving, No Regrouping
�� 1 familiarization question�� 25 test questions�� 1 reward item
�� Addition: Story Problems – Result Unknown�� Addition: Story Problems – Start or Change Unknown�� Addition: Story Problems – Multiple Numbers�� Subtraction: Story Problems – Result Unknown�� Subtraction: Story Problems – Start or Change Unknown
Mathematics Computation to 100 Using Manipula-tives with Regrouping
�� 1 familiarization question�� 20 test questions�� 1 reward item
�� Addition and Subtraction – Using Manipulatives�� Multiplication – Using Manipulatives�� Division – Using Manipulatives
Mathematics Computation to 100 Using Numbers with Regrouping
�� 1 familiarization question�� 35 test questions�� 1 reward item
�� Addition: 1- or 2-Digit Numbers – Horizontal and Vertical�� Addition: Multiple 1- and 2-Digit Numbers�� Subtraction: Two 1- or 2-Digit numbers – Horizontal and Vertical�� Multiplication: 2-Digit Numbers <20 by a 1-Digit Number�� Division: Basic Facts
Mathematics Computa-tion to 100 Using Problem Solving and Estimating with Regrouping
�� 3 familiarization questions�� 35 test questions�� 1 reward item
�� Addition: Story Problems and Estimation�� Subtraction: Story Problems and Estimation
Mathematics Computation to 1000 Using Manipula-tives
�� 1 familiarization question�� 20 test questions�� 1 reward item
�� Addition: Using Manipulatives�� Subtraction: Using Manipulatives�� Multiplication: Using Manipulatives�� Division: Using Manipulatives (with remainders)
Mathematics Computation to 1000 Using Numbers
�� 2 familiarization questions�� 20 test questions�� 1 reward item
�� Addition: Sums to 1000�� Subtraction: Minuend <1000�� Multiplication: 2- or 3-Digit Number by a 1- or 2-Digit Number�� Division: Numbers 100 or Less by a 1- or 2-Digit Number
Mathematics Computation to 1000 Using Problem Solving and Estimating
�� 3 familiarization questions�� 30 test questions�� 1 reward item
�� Addition: Story Problems and Estimation�� Subtraction: Story Problems and Estimation�� Multiplication: Story Problems�� Division: Story Problems

52 Stepping Stones to Using Data Workbook | NWEA™
MAP
® F
OR
PRIM
ARY
GRA
DES
RESO
URC
ES:
WEB
-BAS
ED U
SERSMathematics Skills Checklist Tests (continued)
NAME OF TEST QUESTIONS CONTENTMathematics Number Sense to 10: Counting, Ordering, Place Value
�� 3 familiarization questions�� 31 test questions�� 1 reward item
�� Counts to 10 – Forwards and Backwards�� One-to-One Correspondence�� Identifies position – First, Last and 1st – 10th�� Compares Numbers Using Words�� Groups Objects into 10s
Mathematics Number Sense to 10: Identifying and Representing
�� 3 familiarization questions�� 34 test questions�� 1 reward item
�� Names Numerals�� Represents Numerals Correctly�� Composes and Decomposes Numbers�� Identifies or Represents Whole, Part of, Half�� Identifies a Penny, a Nickel, and a Dime�� Identifies Name of Coin Worth 1¢, 5¢, 10¢
Mathematics Number Sense to 20: Counting, Place Value
�� 2 familiarization questions�� 24 test questions�� 1 reward item
�� Counts by 1s, 2s, and 5s�� Counts Backwards�� Counts on from Any Number by 1s�� One-to-One Correspondence�� Groups Objects into 10s and 1s
Mathematics Number Sense to 20: Ordering
�� 1 familiarization question�� 30 test questions�� 1 reward item
�� Identifies Position: 11th to 20th�� Compares Numbers 1 to 20 Using Words�� Identifies Number 1 More or Less Than a Given Number�� Identifies Numbers Between Two Given Numbers�� Compares the Value of One Coin to Another: Penny, Nickel, Dime
Mathematics Number Sense to 20: Identifying and Representing
�� 3 familiarization questions�� 34 test questions�� 1 reward item
�� Identifies Numerals and Represents Numbers�� Composes and Decomposes Numbers�� Identifies Multiple Ways of Representing Numbers�� Identifies or Represents Fractions: Fourths
Mathematics Number Sense to 100: Counting
�� 1 familiarization question�� 21 test questions�� 1 reward item
�� Counts on by 1s, 2s, 5s, and 10s�� Counts by 10s to 100
Mathematics Number Sense to 100: Ordering
�� 1 familiarization question�� 25 test questions�� 1 reward item
�� Compares Numbers�� Identifies Numbers 1 Greater Than and Less Than a Given Number�� Identifies Numbers Between Two Given Numbers�� Orders and Compares the Value of Coins
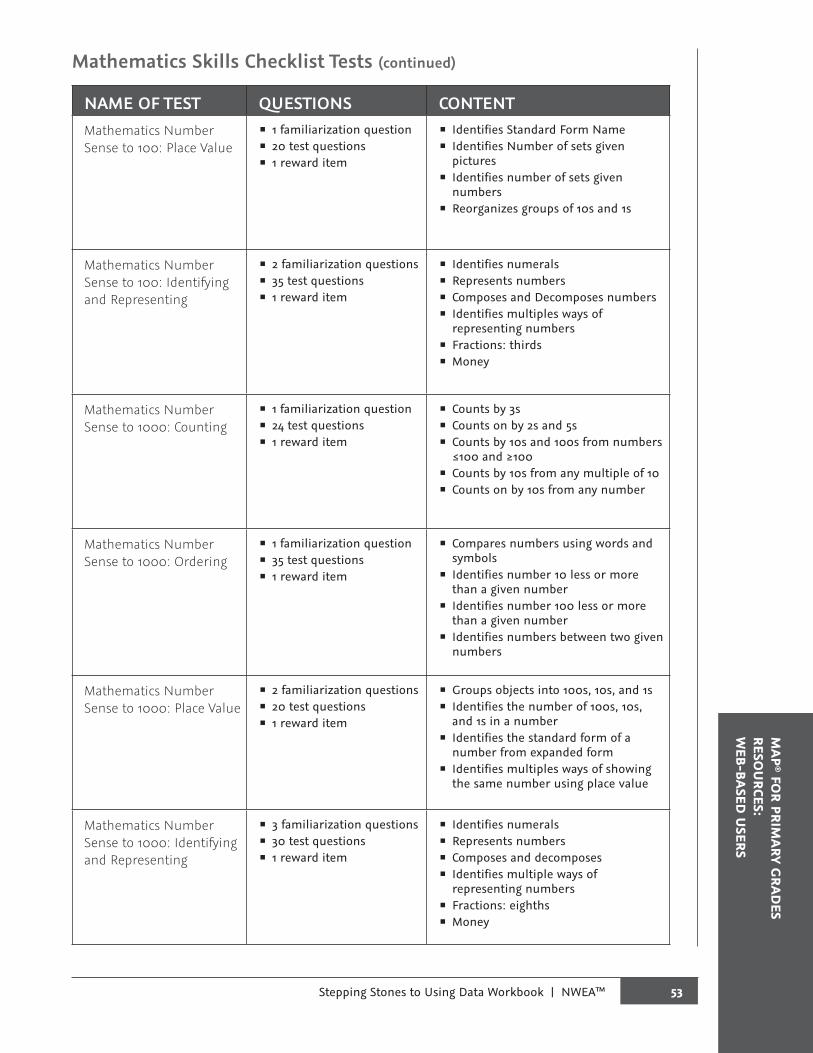
53Stepping Stones to Using Data Workbook | NWEA™
MAP
® FOR PRIM
ARY GRAD
ESRESO
URCES:
WEB-BASED
USERS
Mathematics Skills Checklist Tests (continued)
NAME OF TEST QUESTIONS CONTENTMathematics Number Sense to 100: Place Value
�� 1 familiarization question�� 20 test questions�� 1 reward item
�� Identifies Standard Form Name�� Identifies Number of sets given pictures�� Identifies number of sets given numbers�� Reorganizes groups of 10s and 1s
Mathematics Number Sense to 100: Identifying and Representing
�� 2 familiarization questions�� 35 test questions�� 1 reward item
�� Identifies numerals�� Represents numbers�� Composes and Decomposes numbers�� Identifies multiples ways of representing numbers �� Fractions: thirds�� Money
Mathematics Number Sense to 1000: Counting
�� 1 familiarization question�� 24 test questions�� 1 reward item
�� Counts by 3s�� Counts on by 2s and 5s�� Counts by 10s and 100s from numbers ≤100 and ≥100�� Counts by 10s from any multiple of 10�� Counts on by 10s from any number
Mathematics Number Sense to 1000: Ordering
�� 1 familiarization question�� 35 test questions�� 1 reward item
�� Compares numbers using words and symbols�� Identifies number 10 less or more than a given number�� Identifies number 100 less or more than a given number�� Identifies numbers between two given numbers
Mathematics Number Sense to 1000: Place Value
�� 2 familiarization questions�� 20 test questions�� 1 reward item
�� Groups objects into 100s, 10s, and 1s�� Identifies the number of 100s, 10s, and 1s in a number�� Identifies the standard form of a number from expanded form�� Identifies multiples ways of showing the same number using place value
Mathematics Number Sense to 1000: Identifying and Representing
�� 3 familiarization questions�� 30 test questions�� 1 reward item
�� Identifies numerals�� Represents numbers�� Composes and decomposes�� Identifies multiple ways of representing numbers�� Fractions: eighths�� Money
54 Stepping Stones to Using Data Workbook | NWEA™
MAP
® F
OR
PRIM
ARY
GRA
DES
RESO
URC
ES:
WEB
-BAS
ED U
SERSMPG Survey with Goals TestsMPG Survey with Goals tests measure achievement of students who may still be learning founda-tional skills.
These fully adaptive tests adapt to the level of difficulty appropriate for the student, selecting each question based on all the previous responses. The number of questions available allows these tests to be administered up to three times per academic year without presenting the same ques-tion to a student in a two-year period.
MPG Survey with Goals tests provide RIT Scores that can be used to measure growth from term-to-term and year-to-year. Results of MPG Survey with Goals tests are reported in RIT scores.
The RIT scores assist instructors in identifying skills that are most appropriate for instruction based on the student’s individual performance regardless of whether the student is at, above, or below grade level. The RIT score can be used with the Primary Grades Instructional Data to group students for differentiated instruction, select appropriate curriculum, and identify individual stu-dent instructional needs.
NWEA offers the following MPG Survey with Goals tests:
�� Primary Grades Mathematics
�� Primary Grades Reading
Administering the TestsNWEA recommends administering an MPG Survey with Goals test in two testing periods. This can help students stay engaged during the test. Student attention span and fatigue can vary, so it is best for proctors to pause the test for all students after a maximum of 25 minutes. Students can return at a later time to complete the test.
NWEA does not recommend giving students a test warm-up again when beginning the second testing period.
For more detailed information, see the section about administering MAP for Primary Grades Sur-vey with Goals Tests in the Testing Session Guide.
Note: Plan according to licensing, which allows you to administer the Survey with Goals test up to four times a year. NWEA also recommends nine weeks of instruction between Survey with Goals assessments.
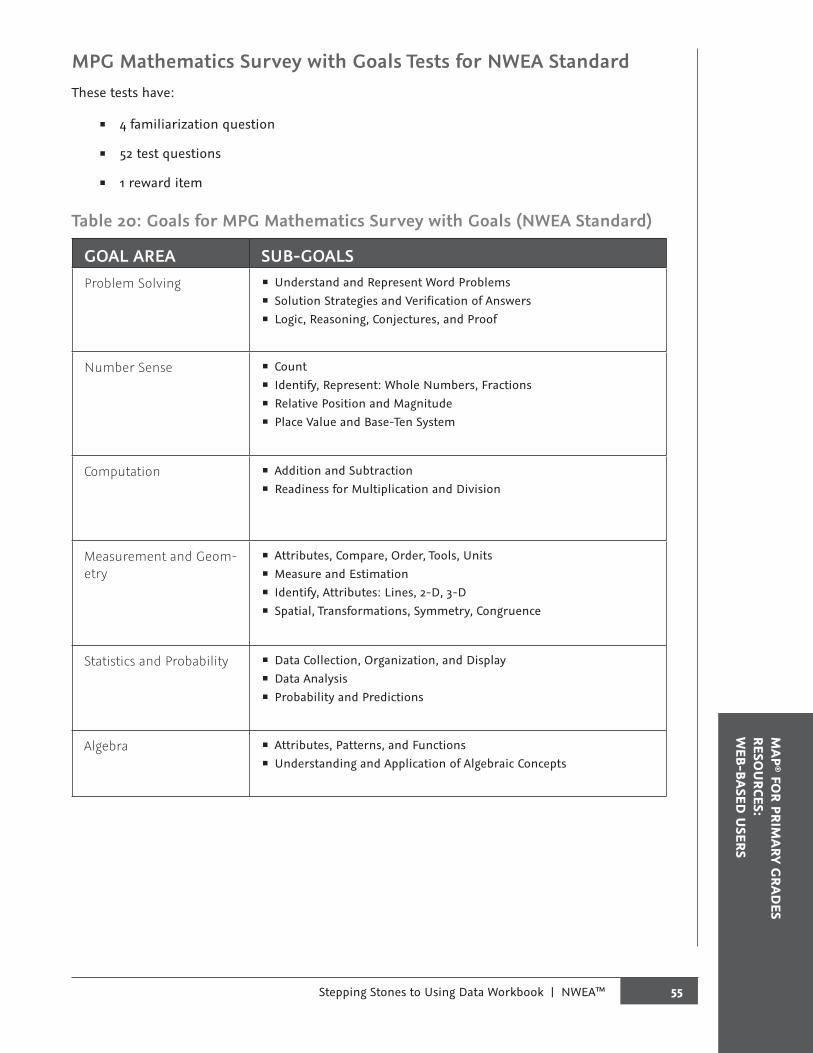
55Stepping Stones to Using Data Workbook | NWEA™
MAP
® FOR PRIM
ARY GRAD
ESRESO
URCES:
WEB-BASED
USERS
MPG Mathematics Survey with Goals Tests for NWEA StandardThese tests have:
�� 4 familiarization question
�� 52 test questions
�� 1 reward item
Table 20: Goals for MPG Mathematics Survey with Goals (NWEA Standard)
GOAL AREA SUB-GOALSProblem Solving �� Understand and Represent Word Problems
�� Solution Strategies and Verification of Answers�� Logic, Reasoning, Conjectures, and Proof
Number Sense �� Count�� Identify, Represent: Whole Numbers, Fractions�� Relative Position and Magnitude�� Place Value and Base-Ten System
Computation �� Addition and Subtraction�� Readiness for Multiplication and Division
Measurement and Geom-etry
�� Attributes, Compare, Order, Tools, Units�� Measure and Estimation �� Identify, Attributes: Lines, 2-D, 3-D�� Spatial, Transformations, Symmetry, Congruence
Statistics and Probability �� Data Collection, Organization, and Display�� Data Analysis�� Probability and Predictions
Algebra �� Attributes, Patterns, and Functions�� Understanding and Application of Algebraic Concepts
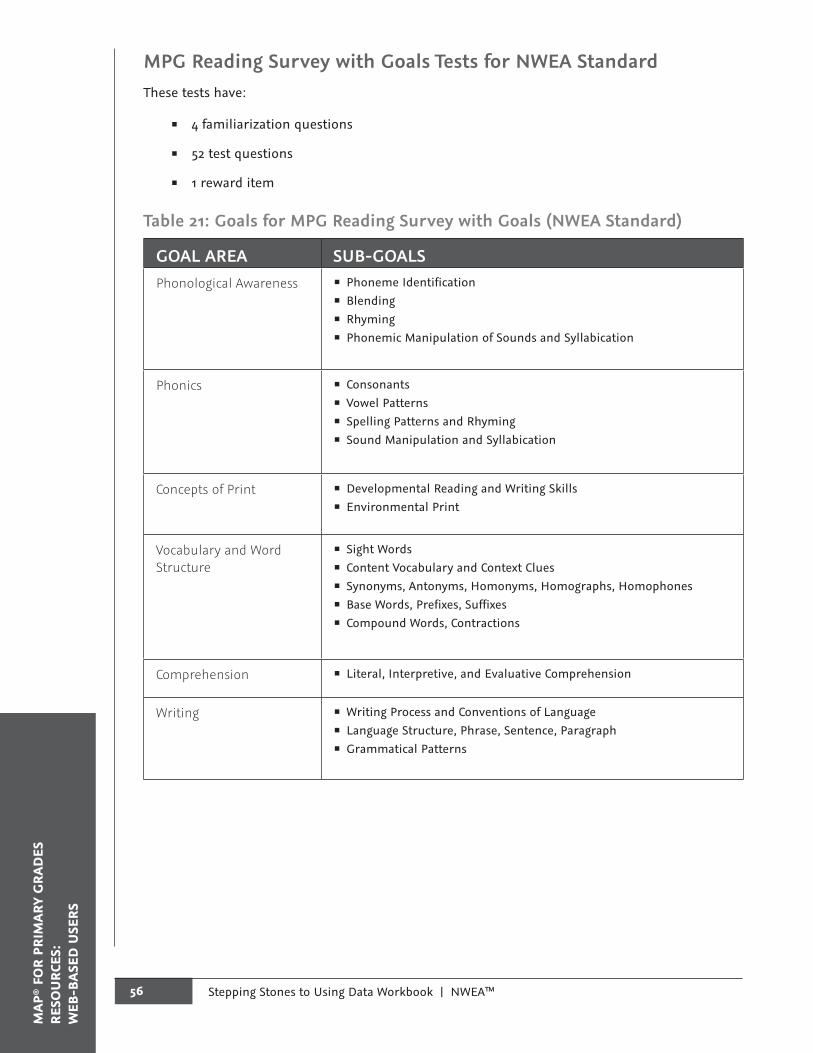
56 Stepping Stones to Using Data Workbook | NWEA™
MAP
® F
OR
PRIM
ARY
GRA
DES
RESO
URC
ES:
WEB
-BAS
ED U
SERSMPG Reading Survey with Goals Tests for NWEA StandardThese tests have:
�� 4 familiarization questions
�� 52 test questions
�� 1 reward item
Table 21: Goals for MPG Reading Survey with Goals (NWEA Standard)
GOAL AREA SUB-GOALSPhonological Awareness �� Phoneme Identification
�� Blending�� Rhyming�� Phonemic Manipulation of Sounds and Syllabication
Phonics �� Consonants�� Vowel Patterns�� Spelling Patterns and Rhyming�� Sound Manipulation and Syllabication
Concepts of Print �� Developmental Reading and Writing Skills�� Environmental Print
Vocabulary and Word Structure
�� Sight Words�� Content Vocabulary and Context Clues�� Synonyms, Antonyms, Homonyms, Homographs, Homophones�� Base Words, Prefixes, Suffixes�� Compound Words, Contractions
Comprehension �� Literal, Interpretive, and Evaluative Comprehension
Writing �� Writing Process and Conventions of Language�� Language Structure, Phrase, Sentence, Paragraph�� Grammatical Patterns

57Stepping Stones to Using Data Workbook | NWEA™
MAP
® FOR PRIM
ARY GRAD
ESRESO
URCES:
WEB-BASED
USERS
MPG Mathematics Survey with Goals Tests for Common CoreThese tests have:
�� 4 familiarization questions
�� 48 test questions
�� 1 reward item
Table 22: Goals for MPG Mathematics Survey with Goals (Common Core)
GOAL AREA SUB-GOALSOperations and Algebraic Thinking
�� Represent and Solve Problems�� Properties of Operations
Number and Operations �� Understand Place Value, Counting, and Cardinality�� Number and Operations: Base Ten and Fractions
Measurement and Data �� Solve Problems Involving Measurement�� Represent and Interpret Data
Geometry �� Reason with Shapes and Their Attributes
MPG Reading Survey with Goals Tests for Common CoreThese tests have:
�� 4 familiarization questions
�� 48 test questions
�� 1 reward item
Table 23: Goals for MPG Reading Survey with Goals (Common Core)
GOAL AREA SUB-GOALSFoundational Skills �� Phonics and Word Recognition
�� Phonological Awareness�� Print Concepts
Language and Writing �� Capitalize, Spell, Punctuate�� Language: Grammar, Usage�� Writing: Purposes: Plan, Develop, Edit
Literature and Informa-tional
�� Informational Text: Key Ideas, Details, Craft, Structure�� Literature: Key Ideas, Craft, Structure
Vocabulary Use and Func-tions
�� Language: Context Clues and References�� Vocabulary Acquisition and Use

58 Stepping Stones to Using Data Workbook | NWEA™
MAP
® F
OR
PRIM
ARY
GRA
DES
RESO
URC
ES:
WEB
-BAS
ED U
SERSNOTES

Northwest Evaluation Association™121 NW Everett Street, Portland, OR 97209
503.624.1951 | NWEA.org | Rev 6/13 | ©2013 Northwest Evaluation Association | MAPXX_PRDV20055