Embed Size (px)
Citation preview

Seediscussions,stats,andauthorprofilesforthispublicationat:https://www.researchgate.net/publication/309220704
Statisticalfingerprint-basedintrusiondetectionsystem(SF-IDS)
ArticleinInternationalJournalofCommunicationSystems·October2016
DOI:10.1002/dac.3225
CITATION
1
READS
129
6authors,including:
MarcoCello
NokiaBellLabs,Dublin,Ireland
42PUBLICATIONS138CITATIONS
SEEPROFILE
MarioMarchese
UniversitàdegliStudidiGenova
361PUBLICATIONS1,838CITATIONS
SEEPROFILE
TalhaNaqash
UniversitàdegliStudidiGenova
8PUBLICATIONS6CITATIONS
SEEPROFILE
SandroZappatore
UniversitàdegliStudidiGenova
71PUBLICATIONS217CITATIONS
SEEPROFILE
AllcontentfollowingthispagewasuploadedbyMarioMarcheseon19October2016.
Theuserhasrequestedenhancementofthedownloadedfile.
Received: 10 November 2015 Revised: 25 May 2016 Accepted: 5 August 2016
DOI 10.1002/dac.3225
R E S E A R C H A R T I C L E
Statistical fingerprint-based intrusion detection system (SF-IDS)
Luca Boero1 Marco Cello1,2 Mario Marchese1* Enrico Mariconti3
Talha Naqash1 Sandro Zappatore1
1Department of Telecommunications, Electronic,
Electric and Naval Engineering (DITEN),
University of Genoa, Italy2Nokia Bell Labs, Blanchardstown Business &
Technology Park, Snugborough Road Dublin 15,
Ireland3Department of Security and Crime Science,
University College London, United Kingdom
CorrespondenceMario Marchese, Via all’Opera Pia 13, Genoa, Italy.
Email: [email protected]
SummaryIntrusion detection systems (IDS) are systems aimed at analyzing and detecting secu-
rity problems. The IDS may be structured into misuse and anomaly detection. The
former are often signature/rule IDS that detect malicious software by inspecting
the content of packets or files looking for a “signature” labeling malware. They are
often very efficient, but their drawback stands in the weakness of the information
to check (eg, the signature), which may be quickly dated, and in the computation
time because each packet or file needs to be inspected. The IDS based on anomaly
detection and, in particular, on statistical analysis have been originated to bypass
the mentioned problems. Instead of inspecting packets, each traffic flow is observed
so getting a statistical characterization, which represents the fingerprint of the flow.
This paper introduces a statistical analysis based intrusion detection system, which,
after extracting the statistical fingerprint, uses machine learning classifiers to decide
whether a flow is affected by malware or not. A large set of tests is presented. The
obtained results allow selecting the best classifiers and show the performance of a
decision maker that exploits the decisions of a bank of classifiers acting in parallel.
KEYWORDS
intrusion detection system, IP, machine learning, networking, statistical analysis
1 INTRODUCTION
Important applications such as e-business, e-banking, pub-
lic health service, and defense system control are dependent
on computer networks. For this motivation they are often
object of attacks by malicious software (malware). Malware
is software designed to intrude a computer system without the
consent of the owner through the use of viruses, backdoors,
spywares, trojans, keyloggers, botnets, and worms.1 In this
context accurate malware detection is a necessity.2 Counter-
measures may be dedicated to specific devices, as happens in
the context of mobile devices3–5 and FM radios,6 to specific
applications such as Internet chats,7 to operating systems such
as Android,8 and to given environments such as delay tolerant
networks (DTNs)9 and Ad hoc On-Demand Distance Vector
(AODV)-based MANETs.10
In general intrusion detection systems (IDS) may help
tackle malicious intrusions. An IDS is a hardware/software
designed to automatically alert when someone or some-
thing is trying or has tried to compromise information
systems through malicious actions. In the work of Sabahi and
Movaghar,11 it contains a detailed and interesting classifica-
tion of IDS depending on the following: the location of the
IDS (host based, network based, and hybrid); the detection
time (online and offline); the environment (wireless, wired,
and heterogeneous); the architecture (centralized/distributed);
and the reaction (active/passive). As far as this paper is con-
cerned, the most important IDS classification proposed in
the work of Sabahi and Movaghar11 regards the processing
method adopted to detect possible intrusions: misuse detec-
tion (MD) and anomaly detection. Misuse detection defines
an abnormal behavior and considers all the other behaviors
as normal. Anomaly detection fixes the normal behavior and
considers all the other behaviors as abnormal. From the oper-
ative viewpoint the former contains signature based, rule
based, state transition algorithms, and data mining. The lat-
ter includes statistical, distance, profile, and model-based
schemes. Misuse detection needs to open and inspect the con-
Int J Commun Syst 2016; 1–11 wileyonlinelibrary.com/journal/dac Copyright © 2016 John Wiley & Sons, Ltd. 1

2 BOERO ET AL.
tent of the packets or files traversing the IDS either to collect
and compare signatures with the available signatures in a mal-
ware database or to apply a given set of rules. The MD is often
very efficient, its drawback stands in the weakness of signa-
tures/rules, which may be referred to dated attacks, and in the
required computation time because each single packet needs
to be inspected. Anomaly detection, and, in particular, con-
cerning this paper, statistical analysis based intrusion detec-
tion (SABID) would like to avoid these drawbacks also at the
cost of a lower detection accuracy. Packets are not opened
and inspected, but each traffic flow is monitored over time by
measuring the statistics of a set of variables (called features)
to distinguish between anomalies (possible malware) and
normal behaviors (normal, not infected, and traffic). Some
more detail about these aspects will be provided in the next
section. In the framework of SABID systems, this paper pro-
poses a novel network-based IDS, called SF-IDS (statistical
fingerprint-IDS). The SF-IDS uses the typical flow definition
at IP (Internet protocol) layer and is aimed at deciding whether
an IP flow is malware affected or not. It is structured into a
training phase developed by using a ground truth of known
flows and an operative classification and decision phase. Both
training and classification/decision phases are based on the
definition and extraction of a group of statistical parame-
ters related to each IP flow, which represent the statistical
fingerprint of the flow and on machine learning-based clas-
sifiers devoted to distinguish normal from malicious traffic.
The rest of the paper is organized as follows. The next section
contains the state of the art about machine learning-based
classifiers and misuse and SABID systems. Section 3 presents
the architecture of SF-IDS, the flow definition, and the pro-
posed fingerprint. Section 4 describes the training and clas-
sification/decision phases of SF-IDS. Section 5 contains the
obtained results, and Section 6 contains the conclusions.
2 STATE OF THE ART
2.1 Machine learning-based classifiers
Machine learning-based classifiers are aimed at identifying
to which set of categories a new sample belongs on the
basis of a training set composed by data whose category is
known. In our case classifiers are used to discriminate nor-
mal from malicious traffic as explained in Section 3. Machine
learning-based classifiers may be structured into 2 families:
supervised and unsupervised. Supervised classifiers require
a training phase during which a number of samples whose
classification is known are used to carve N decision regions
in the features space, being N the number of the classes to
be identified. All the samples whose vectors lie in the same
decision region belong to the same class. A sample whose
classification is unknown is classified by determining the
decision region where the feature vector of the sample falls.
The methodology to carve the decision region depends on the
chosen algorithm.
Naive Bayes,12–14 among many others, belongs to the group
of Bayesian classifier15 and requires the independence of the
features. Support vector machine (SVM)13 is a family of meth-
ods that, given a set of training samples, each marked as
belonging to one of 2 classes, build a model that assigns new
samples to 1 class or to the other. An SVM model is a rep-
resentation of the samples as points in space. The 2 classes
must be divided by a gap that should be as wide as possible.
New samples whose classification is unknown are assigned
to a class depending on which side of the frontier they fall
in. The gap may be created in different ways so giving origin
to linear, quadratic, cubic, and radial basis functions (RBFs)
SVM. The K-nearest neighbors (K-NN)12 input consists of
the K closest training samples in the feature space. A sam-
ple is classified by a majority vote of its neighbors, with the
object being assigned to the most common class among its Knearest neighbors. The K-NN uses a reference cell such as an
hyper-sphere. The cell is expanded up to include K training
samples. In the hyper-sphere case they are the K samples with
minimum Euclidean distance. The sample under examination
is assigned to the class whose training samples among the
K samples are more numerous than the samples of the other
classes. The DTNB16 is a simple Bayesian ranking method
that combines naive Bayes with induction of decision tables.
Ridor17 models large data sets, which result in rule sets having
minimal inter-rule interactions and simple to be maintained.
The SMO implements the sequential minimal optimization
algorithm18 to train a support vector classifier: training an
SVM requires the solution of a very large quadratic program-
ming (QP) optimization problem. The SMO divides the QP
problem into a series of smallest possible QP problems that
are solved analytically. The J48 is a decision-tree algorithm
that generates a pruned or unpruned decision tree by using
C4.5 algorithm19: decision-tree algorithms begin with a set of
cases, or examples, and create a tree data structure that can
be used to classify new cases. Each case is described by a
set of attributes (or features) that can have numeric or sym-
bolic values. There is a label representing the name of a class
associated with each training case. Each internal node of a
decision tree contains a test, the result of which is used to
decide what branch to follow from that node. The leaf nodes
contain class labels instead of tests. In classification mode,
when a test case (which has no label) reaches a leaf node, C4.5
classifies it using the label stored there. The JRIP implements
the propositional rule learner repeated incremental pruning to
produce error reduction (RIPPER), proposed in the work of
Cohen.20 Mentioned C4.5 and RIPPER operate in 2 stages.
First they induce an initial rule set and then they refine it using
a rather complex optimization stage that discards (C4.5) or
adjusts (RIPPER) individual rules to make them work better
together. The PART21 exploits rule sets can be learned 1 rule
at a time, without any global optimization, and infers rules
by repeatedly generating partial decision trees. Random tree,
authored by Eibe Frank and Richard Kirkby, builds a tree that
considers K randomly chosen attributes at each node. It does

BOERO ET AL. 3
not perform any pruning, and it has an option to allow an esti-
mation of class probabilities (or target mean in the regression
case) based on a hold-out set (backfitting). Again authored
by Eibe Frank, RBF network22 is a fully supervised machine
learning scheme that uses gaussian RBF networks. Random
forests23 is an ensemble learning method for classification,
regression, and other tasks. It operates through a multitude of
decision trees at the training time. Each user is assumed to
know about the construction of single classification trees. To
classify a new object from an input vector, the input vector is
put down each of the trees in the forest. Each tree gives a clas-
sification and the tree “votes” for a class. The forest chooses
the classification having the most votes over all the trees in
the forest. “Random forests” is a trademark of Leo Breiman
and Adele Cutler.
Unsupervised classifiers are aimed at framing the flows
under examination within clusters without any “a priori”
information about the samples. They are not efficient for our
goals and are not considered in this paper.
2.2 Misuse and statistical analysis based intrusiondetection systems
A rough comparison about processing method, accuracy,
complexity, speed, and limitations between MD and SABID
(considered representative of the entire class of anomaly
detection for the aim of this paper) methods is reported in
Table 1. In practice the comparison is between IDS that
require the inspection of packets/files/codes and systems
based on the analysis of statistical profiles.
Concerning the large and heterogeneous family of misuse
based IDS, recent research includes the following papers,
among many others. In the work of Blount et al,24 it is a
paper whose experimental results show the detection ability
of the system to learn effective rules from repeated pre-
sentations of a tagged training set. Best system accuracy is
close to 90%. Zhuang et al25 develop an automatic catego-
rization system to automatically group phishing websites or
malware samples by using a cluster ensemble. Malware cat-
egorization results range between 86% and 91%. Shan and
Wang26 propose a host-rule behavior-based detection method,
TABLE 1 Misuse based intrusion detection versus statistical analysisbased intrusion detection systems
Misuse Based Statistical AnalysisIntrusion Detection Based Intrusion Detection
Processing method It examines the It examines samples
whole packet for of traffic statistically
signatures/rules
Accuracy High Low
Complexity High Low
Speed Slow Fast
Limitations It cannot detect new A training data set
virus or encrypted flow is involved
TABLE 2 Evaluation Parameters
Evaluation Parameter Meaning
True negative (TN) A flow is normal traffic, ie, it is
not malware affected and it is correctly
classified as normal traffic.
False positive (FP) A flow is normal traffic, ie, it is
not malware affected but it is wrongly
classified as malware. This case is also
called false alarm.
True positive (TP) A flow is malware affected and it is
correctly classified as malware.
False negative (FN) A flow is malware affected but it is
wrongly classified as normal traffic.
This case is also called Missed Detection.
composed of a clustering engine that groups the objects
(eg, processes and files) of a suspicious program together
into a cluster. Obtained results vary depending on the fixed
threshold of false positives (see Table 2 for a definition): if
you want no false positives, then the system can assume 71%true positives but if you relax the threshold you can get true
positives rates above 90%: 93.2% with 9.8% false positives
and up to about 97% with 22.5% false positives. The authors
show that their results are more satisfying than the ones
got by commercial antivirus software. Concerning the search
and analysis of opcodes (from operation code, a portion of
a machine language instruction that specifies the operation
to be performed), we can mention the literature.27,28 In the
work of O’Kane,27 it is aimed at individuating a subset of
opcodes suitable for malware detection through SVM. Using
opcode sequences typically needs to label a large amount
of both malicious and benign code. Santos et al28 propose a
method that uses single-class learning to detect unknown mal-
ware families. Specific results vary if labeling is performed
through malicious or benign software but in general: labeling
60% of the legitimate software assures about 85% accuracy.
Among signature-based approaches: the work of Cesare et al29
classifie packed and polymorphic malware through a fast
application-level emulator; the effectiveness is validated by
showing that malware is detected as a variant of existing mal-
ware in 88% of cases. Classification is also quite quick: 1.3
[s] for a sample set. Alhomoud et al30 compare the perfor-
mance of the IDS Suricata and Snort. The percentage of alerts
detected is close to 100% for Snort while the one for Suri-
cata heavily varies on the operating network speed: 98% at
1 Gbps, 91.8% at 1.5 Gbps, and 66.8% at 2.0 Gbps. Cha et al31
select the possible signatures and use only a subset of the
necessary ones.
Concerning the systems that use anomaly detection (or also
hybrid statistical analysis/MD): Aydin et al32 propose a hybrid
IDS combining packet header anomaly detection and net-
work traffic anomaly detection. The combined action seems
to work even if it is difficult to detect precise percentages from
the reported results. Om et al33 introduce a hybrid IDS that
4 BOERO ET AL.
combines k-Means and 2 classifiers: K-nearest neighbor and
Naive Bayes for anomaly detection. The goal by Om et al33 is
to decrease the false alarm rate when intrusions are detected
and classified in 4 categories: denial of service, user to root
(U2R), remote to local (R2L), and Probe. The accuracy varies
depending on the attack: from 92% of U2R to more then 98%for Probe. Karthick et al34 describe a 2-stage architecture to
tackle intrusions. In the first stage a probabilistic classifier is
used to detect potential anomalies in the traffic. In the second
stage, a hybrid Markov model traffic model is used to narrow
down the number of IP addresses carrying the attack. The per-
formance depends on the number of states used for the Hidden
Markov Model HMM and on other used features: the best con-
figuration provides an accuracy close to 97% and a false alarm
rate below 3%. Elbasiony et al35 introduce a hybrid detection
framework combining MD, which uses a random forest clas-
sification algorithm, and anomaly detection, which exploits
the weighted k-Means scheme. The detection rate of the com-
bined approach is about 98% with a false positive rate of
about 1%.
As far as statistical analysis based detection, 2 papers are
particularly meaningful for the topic of this paper, even if
they are not strictly related to malware detection: the works
of Dusi et al36 and Aiello et al.37 Both contributions are aimed
at detecting application-layer tunnels throughout statistical
fingerprints. Dusi et al36 presents a statistical classification
mechanism called Tunnel Hunter devoted to recognize a
generic application protocol tunneled on top of HTTP or of
SSH. The accuracy is 100% for HTTP tunnels and above 99%for SSH ones. Aiello et al37 aim at detecting DNS tunnels. The
accuracy for a mix of applications is close to 99%. Another
important paper concerning the approach followed in this
paper is the work of Nakayama et al,38 where streaming con-
tent changes are detected only through traffic patterns built
from the traffic volume achieved by routers. Other papers
must be mentioned as relevant for this paper. Mohammad
et al39 introduce a scheme for intrusion detection operating in
Waikato environment for knowledge analysis (WEKA), used
also in this paper. Zamani et al40 propose to structure machine
learning–based IDS into artificial intelligence based and com-
putational intelligence based ones. The former refer to the
methods from domains such as statistical modeling (as done
in this paper), whereas the latter include methodologies such
as genetic algorithms, artificial neural network, fuzzy logic,
and artificial immune systems. Nadiammai et al41 extract a
long list of features from the used dataset42 and compare, as
done in the first part of this paper (Table 3), different classi-
fiers such as, among the others, DTNB, JRIP, PART, RIDOR,
all providing about 95% accuracy, and SMO, assuring an
accuracy above 97%. Saravanan et al43 compare J48, Random
Forest, and Random Tree in the same operating environment
by using the same dataset and list of features presented in the
work of Nadiammai et al41 and propose to use a combination
of classifiers to enhance the performance, which is above the
99% in the best cases. The obtained results of these classifiers
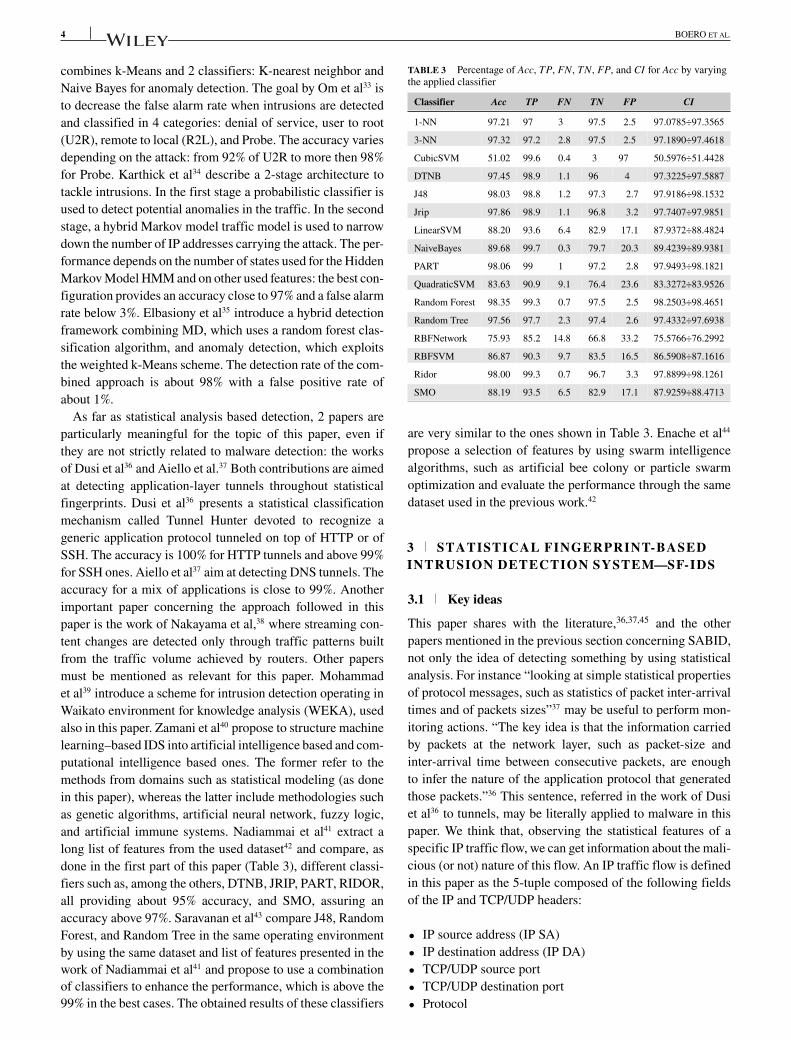
TABLE 3 Percentage of Acc, TP, FN, TN, FP, and CI for Acc by varyingthe applied classifier
Classifier Acc TP FN TN FP CI
1-NN 97.21 97 3 97.5 2.5 97.0785÷97.3565
3-NN 97.32 97.2 2.8 97.5 2.5 97.1890÷97.4618
CubicSVM 51.02 99.6 0.4 3 97 50.5976÷51.4428
DTNB 97.45 98.9 1.1 96 4 97.3225÷97.5887
J48 98.03 98.8 1.2 97.3 2.7 97.9186÷98.1532
Jrip 97.86 98.9 1.1 96.8 3.2 97.7407÷97.9851
LinearSVM 88.20 93.6 6.4 82.9 17.1 87.9372÷88.4824
NaiveBayes 89.68 99.7 0.3 79.7 20.3 89.4239÷89.9381
PART 98.06 99 1 97.2 2.8 97.9493÷98.1821
QuadraticSVM 83.63 90.9 9.1 76.4 23.6 83.3272÷83.9526
Random Forest 98.35 99.3 0.7 97.5 2.5 98.2503÷98.4651
Random Tree 97.56 97.7 2.3 97.4 2.6 97.4332÷97.6938
RBFNetwork 75.93 85.2 14.8 66.8 33.2 75.5766÷76.2992
RBFSVM 86.87 90.3 9.7 83.5 16.5 86.5908÷87.1616
Ridor 98.00 99.3 0.7 96.7 3.3 97.8899÷98.1261
SMO 88.19 93.5 6.5 82.9 17.1 87.9259÷88.4713
are very similar to the ones shown in Table 3. Enache et al44
propose a selection of features by using swarm intelligence
algorithms, such as artificial bee colony or particle swarm
optimization and evaluate the performance through the same
dataset used in the previous work.42
3 STATISTICAL FINGERPRINT-BASEDINTRUSION DETECTION SYSTEM—SF-IDS
3.1 Key ideas
This paper shares with the literature,36,37,45 and the other
papers mentioned in the previous section concerning SABID,
not only the idea of detecting something by using statistical
analysis. For instance “looking at simple statistical properties
of protocol messages, such as statistics of packet inter-arrival
times and of packets sizes”37 may be useful to perform mon-
itoring actions. “The key idea is that the information carried
by packets at the network layer, such as packet-size and
inter-arrival time between consecutive packets, are enough
to infer the nature of the application protocol that generated
those packets.”36 This sentence, referred in the work of Dusi
et al36 to tunnels, may be literally applied to malware in this
paper. We think that, observing the statistical features of a
specific IP traffic flow, we can get information about the mali-
cious (or not) nature of this flow. An IP traffic flow is defined
in this paper as the 5-tuple composed of the following fields
of the IP and TCP/UDP headers:
• IP source address (IP SA)
• IP destination address (IP DA)
• TCP/UDP source port
• TCP/UDP destination port
• Protocol

BOERO ET AL. 5
FIGURE 1 Statistical fingerprint-based intrusion detection system overall architecture
These fields are considered as 2-way (the inversion of
source and destination ports and addresses is considered as
1 single flow) in the tests in Section 5. This choice reduces
the number of flows per each trace recorded from the net-
work, and allows creating longer flows that are more robust
to the noise than default short flows created automatically by
hosts connected to the Internet. The field protocol defines the
protocol used in the data portion of the IP datagram. In prac-
tice it specifies the content of the IP packet information field.
The Internet assigned numbers authority maintains a list of
IP protocol numbers that was originally defined in the work
of Postel46 and is now defined through an online database
specified in the work of Reynolds.47
3.2 SF-IDS architecture
The overall architecture of the proposed IDS is depicted in
Figure 1. Figure 1 refers to a general-purpose architecture to
analyze traffic flows whose operative steps are detailed in the
following. Such architecture has not been implemented and
used to perform experiments for which we have applied a sub-
set of the components appearing in Figure 1 and, in particular,
the “packet analyzer” (object of Section of 3.3), “Malware
DB” (used for the training phase), and “Syslogger” (output
of the packet analyzer). The practical implementation of the
overall architecture in Figure 1 is one of the next steps of this
research activity.
Packets from/to the Internet traverse the external inter-
face (typically an ADSL/ATM interface) of the system and
are processed by a router to be properly forwarded. At this
level, if needed, some virtual interfaces may be attached
to allow sending/receiving packets through tunneling proto-
cols and/or traffic encryption. This allows establishing virtual
point-to-point (secure) connections with the aim of creating
virtual private networks (VPNs). Thus, different user sites
may appear to be part of a unique wide network. User appli-
cations, running in different locations, are enabled to commu-
nicate with each other and, possibly, share common resources
in the same way applications are hosted on co-located com-
puters. However, it is worth noting that the adoption of VPNs
only partially reduces the hazard to be victim of malware.
Whether a PC in the user LAN is infected by a malware, the
PC may easily infect other systems present in the LANs and
belonging to same VPN infrastructure. The IDS mechanisms
need to be adopted even in presence of secure and encrypted
links (tunnels) connecting different sites of the same enter-
prise. Furthermore, some malicious tunnels may represent the
media through which infected packets may be conveyed, as
mentioned in the previous section through the proper refer-
ences. The IP packets traversing the router are inspected by
a “packet analyzer (PA)” to detect possible harmful flows.
The PA exploits the features of a set of malwares stored in
the so called malware database. Whenever a malicious flow
is detected, its features are logged in the Syslogger subsys-
tem and, correspondingly, a new rule is compiled by the filter
builder and then added to the filter list (firewall filter list) of
the firewall. The new rule aims at blocking the just detected
malicious flow, thus preventing the related malware to access
the LAN through the Internal interface (commonly, an Ether-
net interface). It should be highlighted that, if the system has
more than one internal interface, each interface has its own
firewall filter list.
3.3 SF-IDS packet analyzer
The packet analyzer represents the most original part of our
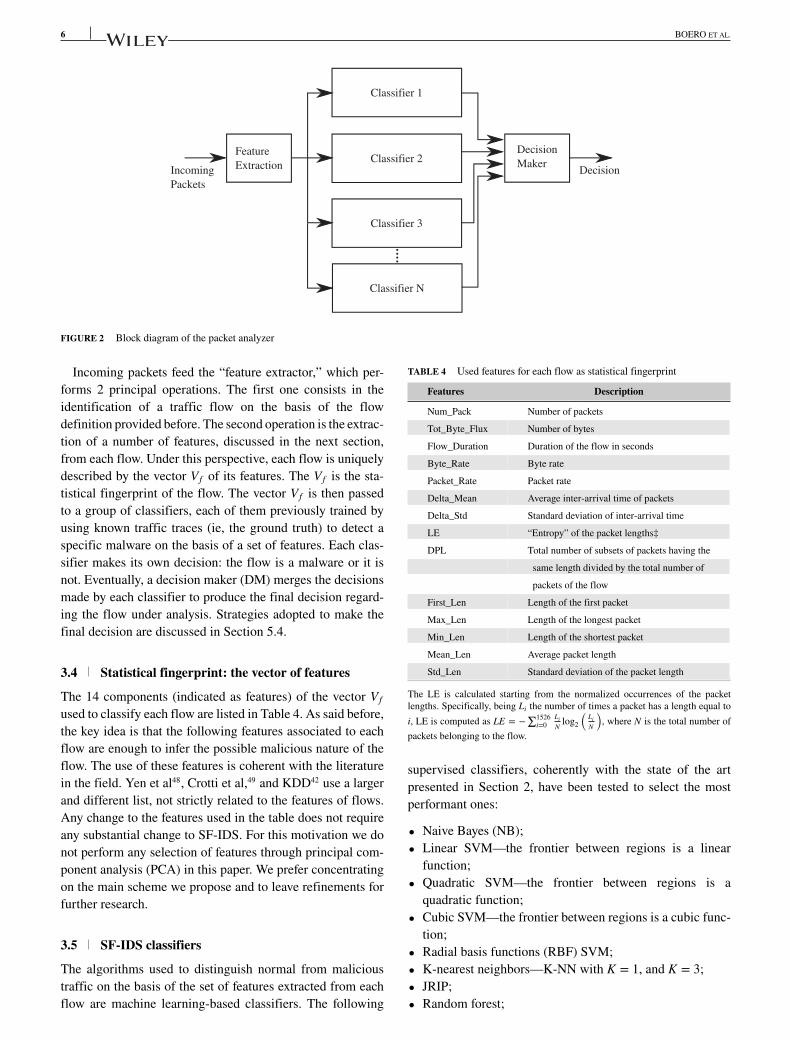
work and the object of the performance evaluation. Figure 2
sketches its main components.
6 BOERO ET AL.
FIGURE 2 Block diagram of the packet analyzer
Incoming packets feed the “feature extractor,” which per-
forms 2 principal operations. The first one consists in the
identification of a traffic flow on the basis of the flow
definition provided before. The second operation is the extrac-
tion of a number of features, discussed in the next section,
from each flow. Under this perspective, each flow is uniquely
described by the vector Vf of its features. The Vf is the sta-
tistical fingerprint of the flow. The vector Vf is then passed
to a group of classifiers, each of them previously trained by
using known traffic traces (ie, the ground truth) to detect a
specific malware on the basis of a set of features. Each clas-
sifier makes its own decision: the flow is a malware or it is
not. Eventually, a decision maker (DM) merges the decisions
made by each classifier to produce the final decision regard-
ing the flow under analysis. Strategies adopted to make the
final decision are discussed in Section 5.4.
3.4 Statistical fingerprint: the vector of features
The 14 components (indicated as features) of the vector Vfused to classify each flow are listed in Table 4. As said before,
the key idea is that the following features associated to each
flow are enough to infer the possible malicious nature of the
flow. The use of these features is coherent with the literature
in the field. Yen et al48, Crotti et al,49 and KDD42 use a larger
and different list, not strictly related to the features of flows.
Any change to the features used in the table does not require
any substantial change to SF-IDS. For this motivation we do
not perform any selection of features through principal com-
ponent analysis (PCA) in this paper. We prefer concentrating
on the main scheme we propose and to leave refinements for
further research.
3.5 SF-IDS classifiers
The algorithms used to distinguish normal from malicious
traffic on the basis of the set of features extracted from each
flow are machine learning-based classifiers. The following
TABLE 4 Used features for each flow as statistical fingerprint
Features Description
Num_Pack Number of packets
Tot_Byte_Flux Number of bytes
Flow_Duration Duration of the flow in seconds
Byte_Rate Byte rate
Packet_Rate Packet rate
Delta_Mean Average inter-arrival time of packets
Delta_Std Standard deviation of inter-arrival time
LE “Entropy” of the packet lengths‡
DPL Total number of subsets of packets having the
same length divided by the total number of
packets of the flow
First_Len Length of the first packet
Max_Len Length of the longest packet
Min_Len Length of the shortest packet
Mean_Len Average packet length
Std_Len Standard deviation of the packet length
The LE is calculated starting from the normalized occurrences of the packet
lengths. Specifically, being Li the number of times a packet has a length equal to
i, LE is computed as LE = −∑1526
i=0
LiN
log2
(LiN
), where N is the total number of
packets belonging to the flow.
supervised classifiers, coherently with the state of the art
presented in Section 2, have been tested to select the most
performant ones:
• Naive Bayes (NB);
• Linear SVM—the frontier between regions is a linear
function;
• Quadratic SVM—the frontier between regions is a
quadratic function;
• Cubic SVM—the frontier between regions is a cubic func-
tion;
• Radial basis functions (RBF) SVM;
• K-nearest neighbors—K-NN with K = 1, and K = 3;
• JRIP;
• Random forest;

BOERO ET AL. 7
• DTNB;
• PART;
• Ridor;
• SMO;
• J48;
• Random tree; and
• RBF network.
4 USED TRAFFIC AND PERFORMANCEPARAMETERS
4.1 Used malware and normal traffic
The tests reported in the performance evaluation have been
performed by downloading traffic samples.50 Table 5 contains
the list of used malwares together with the overall number of
analyzed flows and packets. Each flow appearing in Table 5
under the label malware is not exclusively composed of mal-
ware affected packets, but it contains also not affected traffic.
Obviously the 2 components can be distinguished to allow
a correct performance evaluation. Table 5 includes also the
same quantities for the traffic that is not affected by malware
and is called normal traffic. In this case these traces are totally
malware free. Each malware has different features.
Cutwail is a botnet aimed at spamming.
Purple Haze is a botnet that records user activities. In
practice, it is a keylogger acting at kernel level.
Ramnit is a worm that has been used to get Facebook
passwords.
Tbot is a botnet used for DDoS attacks, bank frauds, and
cheats by using e-money (bitcoins).
Zeus is a botnet that widespreads a Trojan to infect com-
puters through phishing or false download actions
unconsciously performed by users. Its main func-
tion is online banking File Transfer Protocol (FTP)
account violation.
ZeroAccess is a Trojan that affects Microsoft Windows
operating systems. It is used to download other mal-
ware on the infected machine and is mostly involved in
bitcoin mining and click fraud. It may remain hidden
on a system by using several techniques.
AlienspyRAT is a Trojan that gives attackers the abil-
ity to gain complete remote control of a compro-
mised system. It can be used to collect a range of
system-specific data, including operating system ver-
sion, memory and RAM data, Java version number,
and other details, such as passwords and private infor-
mation.
Kuluoz is a Trojan that tries to steal passwords and sensi-
tive information. It can also download other malware
onto the infected PC.
Sality is a polymorphic file infector. It infects executable
files on local, removable, and remote shared drives. It
can communicate over a peer-to-peer (P2P) network
TABLE 5 Used malware and normal traffic
Malware Flows Packets
Cutwail 2347 35674
Purple Haze 7349 324709
Ramnit 25141 155973
Tbot 223 13048
Zeus 202 7443
ZeroAccess 350 2535
AlienspyRAT 1214 9010
Kuluoz 16894 179607
Sality 12939 250784
Normal Traffic
Normal Traffic 1 4969 833368
Normal Traffic 2 12552 3533925
Normal Traffic 3 23351 4428188
and has the purpose of relaying spam, compromising
web servers, and extruding data.
Normal traffic used in the tests has been captured by using
the tcpdump utility.
4.2 Performance evaluation parameters
The performance of the each classifier itemized in Section 3.5
has been evaluated by comparing the results of the classifica-
tion with the actual class of the flow. Under this perspective,
4 cases, listed in Table 2, can occur.
Corresponding quantities in percentage may be defined as
TN = NTN
NN· 100, FP = NFP
NN· 100, TP = NTP
NM· 100, FN =
NFN
NM· 100, being NN the overall number of analyzed normal
flows, NM the overall number of analyzed malware affected
flows, and NTN , NFP, NTP, and NFN the overall number of true
negatives, false positives, true positives, and false negatives,
respectively.
True positives and true negatives are the correct detec-
tion cases. False positives (false alarms) and false negatives
(missed detections) are the cases where the system fails,
although the impact of FPs and FNs on the overall per-
formance is very different. Consequently, the percentage of
correct decisions may be evaluated through the parameter
accuracy (Acc) defined as
Acc = NTN + NTP
NTOT· 100 (1)
where NTOT = NN + NM is the overall number of flows.
5 PERFORMANCE EVALUATION
5.1 Tools
The tests have been performed by using a free machine learn-
ing software called WEKA,51–53 introduced in 1997 at the
University of Waikato, New Zealand. We have used ver-
sion 3.6.10. The WEKA is written in Java, supports standard
algorithms for data preprocessing, clustering, classification,

8 BOERO ET AL.
regression, visualization, and feature selection, and uses .Arff
file format. All data have to be available in this format to
be analyzed. Detailed WEKA characteristics are reported.53
All SF-IDS Classifiers listed in Section 3.5 are supported by
this tool.
5.2 Evaluation of single classifiers
The analysis has been performed taking into account the
entire set of flows in Table 5. Each single trace, both mal-
ware and normal, has been divided into 2 parts (50% of the
trace each). The first part of each trace has been used to com-
pose the file for the training phase, the second part to build
the file employed for the tests. The goal is to distinguish mal-
ware affected flows and normal traffic. Table 3 shows, for
each classifier in Section 3.5, the obtained accuracy and the
percentage of true positives, false negatives, true negatives,
and false positives. The last column of Table 3 contains also
the 95% confidence interval (CI) of the accuracy values, com-
puted through the known formula Acc±1.96 ·√
Acc(1−Acc)N
,
where N is the overall number of flows used for testing, taking
the values from Table 5, as indicated above. The confidence
interval may be simply computed in the same way also for
TP, FN, TN, and FP. A good number of classifiers is close
to 99% concerning the percentage of true positives (and, in
consequence, close to 1% concerning the percentage of false
negatives), but not all of them provide also satisfying results
of true negatives and false positives. In this view, from the
results reported in Table 3, it is possible to individuate the
most performant classifiers. To this goal we use the metric in
Equation 2 that minimizes the sum of the percentage of false
positives and false negatives.
min(FP + FN) (2)
The resulting 3 best classifiers are Random Forest, J48,
and PART.
5.3 Classifier performance to distinguish singlemalware affected flows and normal traffic
The ability of the selected classifiers to correctly detect each
single malware has been also checked. Given the training
phase operated to get the results in Table 3, we have tested
the 3 classifiers by using the 50% of the traces of each mal-
ware (which contains, as said before, both affected and not
affected packets) not used for training. The performance of
Acc, TP, FN, TN, and FP (as well as the 95% confidence inter-
val of the accuracy) is shown in Tables 6, 7, and 8, respectively
for J48, PART, and Random Forest. All selected classifiers
offer excellent performance even if Random Forest is slightly
more efficient. It perfectly distinguishes Kuluoz, Tbot, and
ZeroAccess from normal traffic (100% accuracy) and, in par-
ticular, provides an accuracy of 97.78% for Cutwail. The J48
and PART get for the same malware an accuracy of 91.48%and 90.46%, respectively. The performance of Random For-
est is again the best for Purplehaze: 99.95% against 98.53%
TABLE 6 Percentage of Acc, TP, FN, TN, FP, and CI for Acc using J48classifier
J48Malware Acc TP FN TN FP CI
AlienspyRAT 99.83 100 0 75 25 99.5127÷100
Cutwail 91.48 100 0 81.7 18.3 89.8853÷93.0789
Kuluoz 99.98 100 0 99.5 0.5 99.965÷100
Purplehaze 98.53 98.9 1.1 88 12 98.1416÷98.9196
Ramnit 96.74 100 0 68.8 31.2 96.4364÷97.0566
Sality 99.56 99.6 0.4 99.6 0.4 99.4072÷99.7272
Tbot 99.10 100 0 99.1 0.9 97.3649÷100
ZeroAccess 98.28 98.2 1.8 100 0 96.3625÷100
Zeus 99.00 100 0 98.5 1.5 97.0789÷100
TABLE 7 Percentage of Acc, TP, FN, TN, FP, and CI for Acc usingPART classifier
PARTMalware Acc TP FN TN FP CI
AlienspyRAT 99.83 100 0 75 25 99.5127÷100
Cutwail 90.46 97.8 2.2 82.1 17.9 88.7796÷92.1404
Kuluoz 99.94 99.9 0.1 100 0 99.8889÷99.9927
Purplehaze 93.41 93.4 6.6 94 6 92.6131÷94.2169
Ramnit 96.74 100 0 68.8 31.2 96.4364÷97.0566
Sality 99.35 98.7 1.3 99.7 0.3 99.1552÷99.5466
Tbot 99.10 80 20 100 0 97.3649÷100
ZeroAccess 98.85 98.8 1.2 100 0 97.2822÷100
Zeus 94.05 94.1 5.9 94 6 89.4493÷98.6695
TABLE 8 Percentage of Acc, TP, FN, TN, FP, and CI for Acc usingRandom Forest classifier
Random ForestMalware Acc TP FN TN FP CI
AlienspyRAT 99.83 100 0 75 25 99.5127÷100
Cutwail 97.78 99.5 0.5 95.8 4.2 96.9435÷98.6271
Kuluoz 100 100 0 100 0 100÷100
Purplehaze 99.94 99.9 0.1 100 0 99.8702÷100
Ramnit 96.73 100 0 68.8 31.2 96.428÷97.049
Sality 99.79 99.8 0.2 99.8 0.2 99.69÷99.9082
Tbot 100 100 0 100 0 100÷100
ZeroAccess 100 100 0 100 0 100÷100
Zeus 99.00 100 0 98.5 1.5 97.0789÷100
of J48 and 93.42% of PART. Concerning Zeus, Random For-
est and J48 allow getting an accuracy of 99%, PART of about
94%. The performance for AlienspyRAT and Ramnit is the
same for all the considered classifiers as well as, substantially,
for Sality.
5.4 Classifiers acting in parallel
A possible alternative to the use of a single classifier is the
exploitation of a bank of classifiers as shown in the packet
analyzer in Figure 2. Specifically, a group of different classi-
fiers act in parallel and communicate their decisions to 1 DM
block.

BOERO ET AL. 9
TABLE 9 Percentage of Acc, TP, FN, TN, FP, and CI for Acc obtained atthe output of the 3 decision makers (DMs)
DM Strategy Acc TP FN TN FP CI
Dominant 98.28 99.68 0.32 96.89 3.11 98.1735÷98.3931
Majority 98.28 99.25 0.75 97.33 2.67 98.1754÷98.3949
Unanimity 97.88 98.04 1.96 97.73 2.27 97.7637÷98.0069
The DM block can make the final decision about malware
affection or not in different ways. It can state that a flow is
malware affected either if at least 1 single classifier has taken
this decision (dominant), or following most decisions of the
single classifiers (majority), or if all single classifiers have
taken this decision (unanimity). The 3 classifiers selected
before (J48, PART, and Random Forest) have been used to
compose the mentioned bank of classifiers acting in parallel.
The results about accuracy, TP, FN, TN, and FP are reported
in Table 9 together with the 95% confidence interval of the
accuracy. Training and testing files are the same as in Section
5.2. Even if the reported percentage are very similar for all
the DMs, some remarks may be made. The “dominant” DM
maximizes the percentage of true positives (and consequently
minimizes the percentage of false negatives) with respect to
both the other 2 DMs (and this is expected) and the most per-
formant classifier Random Forest (see Table 3) that assures
TP and FN equal to 99.3% and 0.7%, respectively. The same
quantities for the “dominant” DM are 99.69% and 0.31%.
Even if the difference is not evident, the very slight improve-
ment means that there is an intervention of J48 and PART that
detect malware affection when Random Forest (rarely) fails.
The improvement of TP and FN is paid by a worst perfor-
mance concerning TN and FP. The decrease of TN happens
both with respect to the other DMs (again expected) and with
respect to the values got by Random Forest in Table 3.
Increasing the necessary number of malware decisions
made by single classifiers to assign a flow to the malware
class allows reducing the percentage of false positives (2.67%for “majority” and 2.27% for “unanimity”) and, consequently,
increasing the percentage of true negatives (97.33% and
97.73%, respectively, for “majority” and “unanimity”) at cost
of FN and TP. Similarly as happens for “dominant” about TPand FN, “unanimity” allows getting TN and FP values bet-
ter than the ones got by Random Forest in Table 3, again for
the intervention of J48 and PART, which mitigate the rare
erroneous decisions of Random Forest.
6 CONCLUSIONS
The paper proposes a network-based IDS called SF-IDS (sta-
tistical fingerprint-IDS) devoted to decide whether an IP flow
is malware affected or not. The SF-IDS is structured into
a training phase and a classification/decision phase. Both
phases are based on the definition and extraction of a group
of IP flows statistical parameters that represent the statistical
fingerprint. The key idea of the paper is that the statistical
fingerprint may help detecting the nature (malicious or not)
of each flow. The classification/decision phase consists of
a “feature extractor,” a bank of classifiers, and a DM that
merges the decisions of the classifiers. The performance eval-
uation traces a possible streamline in view of a future practical
implementation and it is structured as follows.
1. Evaluation of the single classifiers and choice of the best
ones. To perform this choice we have adopted as a metric
the sum of false alarms and missed detections, and we have
selected the schemes providing the minimum values. Ran-
dom Forest is the best one and also J48 and PART provide
excellent results. The selected schemes are very efficient
even if applied to each single malware. In particular, Ran-
dom Forest assures a null percentage of false negatives
and false positives for Kuluoz, Tbot, and ZeroAccess, and
a very close to null percentage for Sality and Zeus. Ran-
dom Forest also assures satisfying results for Cutwail. It
is very efficient to recognize AlienspyRAT and Ramnit
(100%TP - 0%FN), but it has some difficulties to iden-
tify normal traffic, often interpreted as these malwares
(75%TN-25%FP for AlienspyRAT and 68.8%TN-31.2%for Ramnit).
2. Evaluation of the scheme including 3 classifiers (Ran-
dom Forest, J48, and PART acting in parallel) and a DM
that makes decisions on the basis of 3 different strategies:
“dominant”, “majority,” and “unanimity.” The choice
among the 3 DMs depends on a possibly adopted risk
function/performance tuning. For example, in this case,
the balance between missed detections and false alarms
we want to get: the “dominant” DM allows minimizing
missed detections at cost of false alarms; increasing the
number of classifiers necessary to classify a flow as a mal-
ware allows achieving better results of false alarms but
implies a performance decrease as concerns missed detec-
tions. The minimum percentage of false alarms is got by
“unanimity” DM.
The obtained results open the door to an actual development
of the software needed to implement the overall architecture
proposed in this paper.
ACKNOWLEDGEMENTS
The authors want to thank Dr Roberto Surlinelli, Chief Tech-
nical Director, and Mr Augusto Ottaviano, Chief Assistant, of
the Polizia di Stato, Italy, for their precious suggestions.
REFERENCES
1. Ye Y, Li T, Jiang Q, Wang Y. Cimds: adapting postprocessing techniques
of associative classification for malware detection. IEEE Trans Syst, Man,Cybern, C: Appl Rev. 2010;40(3):298–307.
2. Cerf VG. Defense against the dark arts. IEEE Internet Comput. 2012;16(1):
96–97 .
3. Kim H, Shin KG, Pillai P. Modelz: monitoring, detection, and analysis of
energy-greedy anomalies in mobile handsets. IEEE Trans Mobile Comput.2011;10(7):968–981.
10 BOERO ET AL.
4. Chandramohan M, Tan HBK. Detection of mobile malware in the wild.
Computer. 2012;45(9):65–71.
5. La Polla M, Martinelli F, Sgandurra D. A survey on security for mobile
devices. IEEE Commun Surveys Tuts. 2013;15(1):446–471.
6. Fernandes E, Crispo B, Conti M. Fm 99.9, radio virus: exploiting fm radio
broadcasts for malware deployment. IEEE Trans Inf Forensics Security.
2013;8(6):1027–1037.
7. Gianvecchio S, Xie M, Wu Z, Wang H. Humans and bots in Internet chat:
measurement, analysis, and automated classification. IEEE/ACM Trans Netw.
2011;19(5):1557–1571.
8. Yerima SY, Sezer S, McWilliams G. Analysis of Bayesian
classification-based approaches for android malware detection. IET InformSecur. 2014;8(1):25–36.
9. Peng W, Li F, Zou X, Wu J. Behavioral malware detection in delay tolerant
networks. IEEE Trans Parallel Distrib Syst. 2014;25(1):53–63.
10. Nakayama H, Kurosawa S, Jamalipour A, Nemoto Y, Kato N. A dynamic
anomaly detection scheme for AODV-based mobile ad hoc networks. IEEETrans Veh Technol. 2009;58(5):2471–2481.
11. Sabahi F, Movaghar A. Intrusion detection: a survey. 3rd International Con-ference on Systems and Networks Communications, 2008. ICSNC’08, IEEE,
Sliema, Malta; 2008:23–26.
12. Fukunaga K. Introduction to Statistical Pattern Recognition. 2nd ed. San
Diego, CA, USA: Academic Press Professional, Inc.; 1990.
13. Duda RO, Hart PE, Stork DG. Pattern Classification. (2nd Edition).
Chichester, West Sussex, England: Wiley-Interscience; 2000.
14. McCallum A, Nigam K. A comparison of event models for naive bayes
text classification. AAAI-98 Workshop on Learning for Text Categorization,
vol. 752, Citeseer, Madison, Wisconsin; 1998:41–48.
15. Langley P, Iba W, Thompson K. An analysis of Bayesian classifiers. AAAI,
vol. 90, San Jose, California; 1992:223–228.
16. Hall MA, Frank E. Combining naive bayes and decision tables. FLAIRSConference, vol. 2118, Coconut Grove, Florida, USA; 2008:318–319.
17. Gaines BR, Compton P. Induction of ripple-down rules applied to modeling
large databases. J Intell Inf Syst. 1995;5(3):211–228.
18. Platt JC. Fast training of support vector machines using sequential mini-
mal optimization. Advances in Kernel Methods - Support Vector Learning.
Cambridge, MA, USA: MIT Press; 1998:41–65. http://research.microsoft.
com/apps/pubs/default.aspx?id=68391.
19. Quinlan JR. C4.5: Programs for Machine Learning. San Francisco, CA,
USA: Morgan Kaufmann Publishers Inc.; 1993.
20. Cohen WW. Fast effective rule induction. Proceedings of the Twelfth Inter-national Conference on Machine Learning, Tahoe City, California, USA;
1995:115–123.
21. Frank E, Witten IH. Generating accurate rule sets without global optimiza-
tion. ICML, vol. 98, Madison, Wisconsin, USA; 1998:144–151.
22. Frank E. Fully supervised training of gaussian radial basis function net-
works in WEKA. Technical Report, vol. 4, Department of Computer Science,
University of Waikato, Waikato 0800, New Zeland; 2014.
23. Breiman L. Random forests. Mach Learn. 2001;45(1):5–32.
24. Blount JJ, Tauritz DR, Mulder SA. Adaptive rule-based malware detec-
tion employing learning classifier systems: a proof of concept. 2011 IEEE35th Annual Computer Software and Applications Conference Workshops(COMPSACW), IEEE, Munich, Germany; 2011:110–115.
25. Zhuang W, Ye Y, Chen Y, Li T. Ensemble clustering for internet
security applications. IEEE Trans Syst, Man, Cybern, C: Appl Rev.
2012;42(6):1784–1796.
26. Shan Z, Wang X. Growing grapes in your computer to defend against
malware. IEEE Trans Inf Forensics Security. 2014;9(2):196–207.
27. O’Kane P, Sezer S, McLaughlin K, Im EG. SVM training phase reduc-
tion using dataset feature filtering for malware detection. IEEE Trans InfForensics Security. 2013;8(3):500–509.
28. Santos I, Brezo F, Sanz B, Laorden C, Bringas PG. Using opcode sequences
in single-class learning to detect unknown malware. IET Inform Secur.
2011;5(4):220–227.
29. Cesare S, Xiang Y, Zhou W. Malwise – an effective and efficient classifi-
cation system for packed and polymorphic malware. IEEE Trans Comput.2013;62(6):1193–1206.
30. Alhomoud A, Munir R, Disso JP, Awan I, Al-Dhelaan A. Perfor-
mance evaluation study of intrusion detection systems. The 2nd Inter-national Conference on Ambient Systems, Networks and Technologies(ANT-2011) / The 8th International Conference on MobileWeb Informa-tion Systems (MobiWIS 2011). Procedia Comput Sci.. 2011;5:173–180.
http://www.sciencedirect.com/science/article/pii/S1877050911003498.
doi:10.1016/j.procs.2011.07.024.
31. Cha SK, Moraru I, Jang J, Truelove J, Brumley D, Andersen DG.
Splitscreen: enabling efficient, distributed malware detection. J CommunNetw. 2011;13(2):187–200.
32. Aydın MA, Zaim AH, Ceylan KG. A hybrid intrusion detection system design
for computer network security. Comput Electr Eng. 2009;35(3):517–526.
33. Om H, Kundu A. A hybrid system for reducing the false alarm rate of
anomaly intrusion detection system. 2012 1st International Conference onRecent Advances in Information Technology (RAIT), IEEE, Dhanbad, India;
2012:131–136.
34. Karthick RR, Hattiwale VP, Ravindran B. Adaptive network intrusion detec-
tion system using a hybrid approach. 2012 Fourth International Conferenceon Communication Systems and Networks (COMSNETS), IEEE, bangalore,
India; 2012:1–7.
35. Elbasiony RM, Sallam EA, Eltobely TE, Fahmy MM. A hybrid net-
work intrusion detection framework based on random forests and weighted
k-means. Ain Shams Eng J. 2013;4(4):753–762.
36. Dusi M, Crotti M, Gringoli F, Salgarelli L. Tunnel hunter: detect-
ing application-layer tunnels with statistical fingerprinting. Comput Netw.
2009;53(1):81–97.
37. Aiello M, Mongelli M, Papaleo G. DNS tunneling detection through statis-
tical fingerprints of protocol messages and machine learning. Int J CommunSyst. 2015;28(14):1987–2002.
38. Nakayama H, Jamalipour A, Kato N. Network-based traitor-tracing technique
using traffic pattern. IEEE Trans Inf Forensics Security. 2010;5(2):300–313.
39. Mohammad MN, Sulaiman N, Muhsin OA. A novel intrusion detection
system by using intelligent data mining in WEKA environment. ProcediaComput Sci. 2011;3:1237–1242.
40. Zamani M, Movahedi M. Machine learning techniques for intrusion detec-
tion. arXiv preprint arXiv:1312.2177; 2013.
41. Nadiammai GV, Hemalatha M. Perspective analysis of machine learning
algorithms for detecting network intrusions. 2012 Third International Con-ference on Computing Communication Networking Technologies (ICCCNT),Tamilnadu, India; 2012:1–7.
42. Kdd cup 1999 data. http://kdd.ics.uci.edu/databases/kddcup99/kddcup99.
html. Accessed September 21, 2015
43. Saravanan S, Vijay Bhanu S, Chandrasekaran R. Study on classifi-
cation algorithms for network intrusion systems. J Commun Comput.2012;9(11):1242–1246.
44. Enache AC, Patriciu VV. Intrusions detection based on support vector
machine optimized with swarm intelligence. 2014 IEEE 9th InternationalSymposium on Applied Computational Intelligence and Informatics (SACI),Timisoara, Romania; 2014:153–158.
45. Nakayama H, Jamalipour A, Kato N. Network-based traitor-tracing technique
using traffic pattern. IEEE Trans Inf Forensics Security. 2010;5(2):300–313.
46. Postel J. Rfc 790assigned numbers; 1981.
47. Reynolds J. Assigned numbers: Rfc 1700 is replaced by an on-line database;
2002.
48. Yen TF, Huang X, Monrose F, Reiter MK. Browser fingerprinting from
coarse traffic summaries: techniques and implications. Proceedings of the6th International Conference on Detection of Intrusions and Malware, andVulnerability Assessment, DIMVA ’09. Springer-Verlag, Berlin, Heidelberg;
2009:157–175.
49. Crotti M, Dusi M, Gringoli F, Salgarelli L. Traffic classification
through simple statistical fingerprinting. SIGCOMM Comput Commun Rev.
2007;37(1):5–16. http://doi.acm.org/10.1145/1198255.1198257. Accessed
September 21, 2015

BOERO ET AL. 11
50. www.mediafire.com/?a49l965nlayad. Accessed September 20, 2015
51. WEKA data mining machine learning software. http://www.cs.waikato.ac.
nz/ml/weka/.
52. Dash RK. Selection of the best classifier from different datasets using
WEKA. International Journal of Engineering Research and Technology.
2013;2(3) (March-2013). ESRSA Publications, 2013, Louvian-la-Neuve,
Begium.
53. Nguyen HA, Choi D. Application of data mining to network intru-
sion detection: classifier selection model. Challenges for Next GenerationNetwork Operations and Service Management. Springer, Beijin, China;
2008:399–408.
How to cite this article: Boero, L., Cello, M.,
Marchese, M., Mariconti, E., Naqash, T., and
Zappatore, S. (2016), Statistical fingerprint-based
intrusion detection system (SF-IDS). Int. J. Commun.Syst., doi: 10.1002/dac.3225
View publication statsView publication stats