Embed Size (px)
Citation preview

Wildlife Management Report, ADF&G/DWC/WMR-2015-1
Statewide Small Game Hunter Survey, 2014 Richard A. Merizon Steve J. Carson Leigh S. Honig
©2014 ADF&G, photo by Richard Merizon.
Alaska Department of Fish and Game Division of Wildlife Conservation February 2015


Wildlife Management Report, ADF&G/DWC/WMR-2015-1
Statewide Small Game Hunter Survey, 2014
Richard A. Merizon Small Game Biologist Alaska Department of Fish and Game 1800 Glenn Highway, Suite 2 Palmer, AK. 99645 [email protected] (907) 746-6333 Steve J. Carson Analyst Programmer Alaska Department of Fish and Game 1255 W. 8th Street Juneau, AK. 99801 [email protected] (907) 465-8417 and Leigh S. Honig Project Assistant Alaska Department of Fish and Game 1800 Glenn Highway, Suite 2 Palmer, AK. 99645 [email protected] (907) 861-2106 ©2015 Alaska Department of Fish and Game Alaska Department of Fish and Game Division of Wildlife Conservation, Region IV Office 1800 Glenn Highway Palmer, AK. 99645

Wildlife Management Reports are used to document general wildlife management issues or information.They typically summarize information related to a specific management issue, review management activities, and/or provide information about why a particular management approach has been taken or is recommended. They may be produced primarily for general or technical audiences. These reports are professionally reviewed by staff in the Division of Wildlife Conservation.
This Wildlife Management Report was approved for publication by Richard Merizon, program coordinator for the Alaska Department of Fish and Game’s Small Game Program.
Wildlife Management Reports are available from the Alaska Department of Fish and Game’s Division of Wildlife Conservation, PO Box 115526, Juneau, Alaska 99811-5526; phone (907) 465-4190; email: [email protected]; website: www.adfg.alaska.gov. The report may also be accessed through most libraries, via interlibrary loan from the Alaska State Library or the Alaska Resources Library and Information Service (www.arlis.org).
This document was published electronically only. Please cite it as follows: Merizon, R. A., S. J. Carson, and L. S. Honig. 2015. Statewide Small Game Hunter Survey, 2014. Alaska Department of Fish and Game, Wildlife Management Report, ADF&G/DWC/WMR-2015-1, Palmer, Alaska.
The Alaska Department of Fish and Game (DWC) administers all programs and activities free from discrimination based on race, color, national origin, age, sex, religion, marital status, pregnancy, parenthood, or disability. The department administers all programs and activities in compliance with Title VI of the Civil Rights Act of 1964, Section 504 of the Rehabilitation Act of 1973, Title II of the Americans with Disabilities Act (ADA) of 1990, the Age Discrimination Act of 1975, and Title IX of the Education Amendments of 1972.
If you believe you have been discriminated against in any program, activity, or facility please write: • DWC ADA Coordinator, P.O. Box 115526, Juneau, AK, 99811-5526 • U.S. Fish and Wildlife Service, 4401 N. Fairfax Drive, MS 2042, Arlington, VA, 22203 • Office of Equal Opportunity, U.S. Department of the Interior, 1849 C Street, NW MS 5230,
Washington D.C., 20240
The department’s ADA Coordinator can be reached via telephone at the following numbers: • (VOICE) 907-465-6077 • (Statewide Telecommunication Device for the Deaf) 1-800-478-3648 • (Juneau TDD) 907-465-3646, or (FAX) 907-465-6078
For information on alternative formats and questions on this publication, please contact: Division of Wildlife Conservation Small Game Program, 1800 Glenn Highway, Suite 2, Palmer, Alaska 99645; E-mail: [email protected]; Phone: 907-746-6300.
Cover Photo: Harvested willow ptarmigan Lagopus lagopus in Southcentral Alaska. ©2014 ADF&G, photo by Richard Merizon.

Table of Contents List of Figures ................................................................................................................................. ii List of Tables .................................................................................................................................. ii List of Appendix Figures ................................................................................................................ ii Abstract .......................................................................................................................................... iv
Introduction ..................................................................................................................................... 1
Methods........................................................................................................................................... 4
Survey Design ............................................................................................................................. 4
Results ............................................................................................................................................. 7
Survey Response ......................................................................................................................... 7
Small Game Hunting................................................................................................................... 7
Discussion ..................................................................................................................................... 13
Survey Medium ......................................................................................................................... 13
Interpreting Hunter Responses .................................................................................................. 13
Acknowledgments......................................................................................................................... 15
Literature Cited ............................................................................................................................. 15
Appendix A: Number of days hunted reported by small game survey respondents, by species and geographic area. ..................................................................................................... 17
Appendix B: Reported number of days using various transportation methods used to hunt small game, by species. .................................................................................................... 29
Wildlife Management Report ADF&G/DWC/WMR 2015-1 i

List of Figures Figure 1. State of Alaska game management units. ........................................................................ 3
Figure 2. Survey form mailed to each recipient. ............................................................................. 5
Figure 3. Geographic areas used to better describe small game hunting effort, transportation methods, and location. ............................................................................................................. 6
Figure 4. Percent of total hunters that reported hunting all small game in RY13 by game management unit. ................................................................................................................... 11
List of Tables Table 1. Statewide small game hunter survey response rate by license type. ................................ 8
Table 2. Survey response rate among all geographic areas and nonresidents. ............................... 9
Table 3. Mean and estimated number of small game hunters by age and household. .................... 9
Table 4. Number of respondents who targeted and/or opportunistically hunted small game. ........ 9
Table 5. Average number of days hunted per species by those that reported hunting small game within a geographic area. ................................................................................................ 10
Table 6. Percentage of respondents that utilize specific transportation methods for hunting small game in Alaska by geographic area. ............................................................................... 12
Table 7. Population abundance trend observed by hunters during RY13 based on percent of total responses. ..................................................................................................................... 12
Table 8. Estimated statewide harvest by species during regulatory year 2013. ........................... 12
List of Appendix Figures Figure A1. Total effort (hunting days) reported from residents within the Kenai geographic
area by species, RY13. .............................................................................................................. 18
Figure A2. Total effort (hunting days) reported from residents within the Anchorage geographic area by species, RY13. ........................................................................................... 19
Figure A3. Total effort (hunting days) reported from residents within the Mat-Su geographic area by species, RY13. .............................................................................................................. 20
Figure A4. Total effort (hunting days) reported from residents within the Fairbanks geographic area by species, RY13. ........................................................................................... 21
Figure A5. Total effort (hunting days) reported from residents within the Alaska Peninsula geographic area by species, RY13. ........................................................................................... 22
Figure A6. Total effort (hunting days) reported from residents within the Interior Road System geographic area by species, RY13. .............................................................................. 23
ii Wildlife Management Report ADF&G/DWC/WMR 2015-1

Figure A7. Total effort (hunting days) reported from residents within the Interior Rural geographic area by species, RY13. ........................................................................................... 24
Figure A8. Total effort (hunting days) reported from residents within the Southcentral Rural geographic area by species, RY13. ........................................................................................... 25
Figure A9. Total effort (hunting days) reported from residents within the Southeast geographic area by species, RY13. ........................................................................................... 26
Figure A10. Total effort (hunting days) reported from residents within the Western Rural geographic area by species, RY13. ........................................................................................... 27
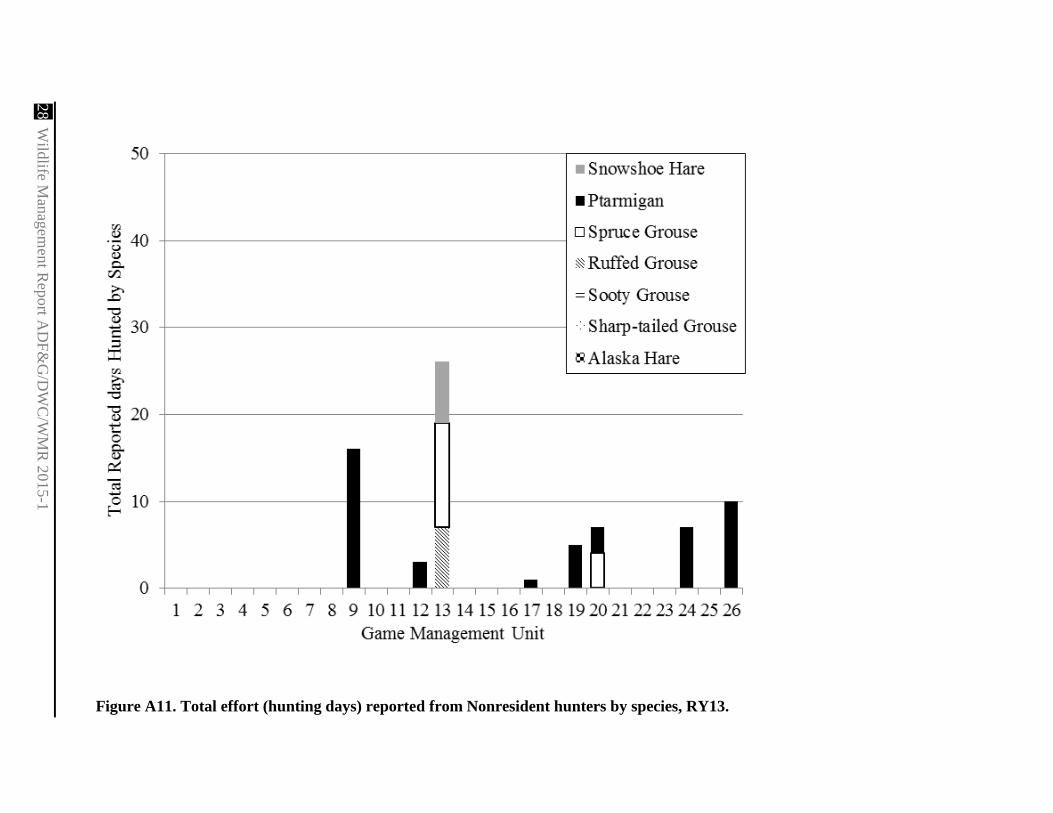
Figure A11. Total effort (hunting days) reported from Nonresident hunters by species, RY13. . 28
Figure B1. Total effort (hunting days) by transportation method used to hunt ptarmigan, RY13. ........................................................................................................................................ 30
Figure B2. Total effort (hunting days) by transportation method used to hunt spruce grouse, RY13. ........................................................................................................................................ 31
Figure B3. Total effort (hunting days) by transportation method used to hunt snowshoe hare, RY13. ........................................................................................................................................ 32
Figure B4. Total effort (hunting days) by transportation method used to hunt ruffed grouse, RY13. ........................................................................................................................................ 33
Figure B5. Total effort (hunting days) by transportation method used to hunt sharp-tailed grouse, RY13. ........................................................................................................................... 34
Wildlife Management Report ADF&G/DWC/WMR 2015-1 iii

Abstract Alaska’s small game populations (species of grouse, ptarmigan, and hare) have long been popular subsistence and recreational resources for residents and nonresidents alike. Since statehood in 1959, the Alaska Department of Fish and Game (ADF&G) has made attempts to understand harvest, location, and hunter effort relative to small game hunting. The ADF&G completed the first statewide small game hunter survey in April 2012, and in May 2014 followed up with the second such effort. Survey forms were mailed out to 9,552 individual households on 1 May 2014. Respondents were asked to complete either the paper survey form or visit a secure online portal through which the survey could be completed. Survey recipients were asked to report on their household’s involvement hunting small game during regulatory year 2013 (RY13; 1 July 2013– 30 June 2014). Respondents were asked questions about species hunted, numbers harvested, hunt locations, hunting effort, number of small game hunters in the household that were under 16 years of age, and whether or not they harvested small game opportunistically. A 30% response rate was received. Alaska hunters used paper survey forms much more than anticipated. An estimated 40,239 individuals hunted small game in Alaska during RY13. An estimated 6,846 hunters were under the age of 16. Approximately 3% of respondents also participated in a federal subsistence hunt for small game; most effort was focused on ptarmigan. Highway vehicles, all-terrain vehicles (ATVs), and walking were the primary means of transportation for small game hunters along the road system. However, snowmachines, ATVs, and boats were the primary means of transportation in the areas distant from the road system. Spruce grouse (Falcipennis canadensis) and ptarmigan (Lagopus spp.) were the most hunted and harvested species during RY13. Key words: small game, grouse, ptarmigan, hare, hunter, survey, household, recipient.
iv Wildlife Management Report ADF&G/DWC/WMR 2015-1

Introduction Alaska is fortunate to have many small game species, including grouse, ptarmigan, and hare. There are 4 species of grouse: ruffed (Bonasa umbellus), sharp-tailed (Tympanuchus phasianellus), sooty (Dendragapus fuliginosus), and spruce grouse (Falcipennis canadensis). Alaska is home to rock (Lagopus muta), white-tailed (L. leucurus), and willow ptarmigan (L. lagopus). There are 2 species of hare, Alaska (Lepus othus) and snowshoe hare (L. americanus). Typically, Alaska small game hunters can pursue at least one of these species wherever they hunt in the state. In regulatory year 2013 (RY13; 1 July 2013–30 June 2014), all 9 of these species could be legally harvested under state hunting regulations throughout all of the game management units (GMUs; Fig. 1) where they occur. Despite its reputation as a big game hunting mecca, Alaska has a long and storied history as an excellent location to pursue small game. The abundance and diversity of small game populations in Alaska compare favorably with other states. Resident and nonresident hunters in Alaska have enjoyed pursuing small game for many decades. Subsistence hunters have long supplemented their diets with seasonally abundant species of small game. In addition, recreational hunting of small game continues to remain very popular for many hunters that reside along the road system and rural residents that hunt in areas not accessible by the primary road system. Alaska’s human population has undergone significant change over the last 35 years. Since 1980, the human population has grown from 400,000 to over 736,000 (U.S. Census Bureau 2014). The road infrastructure and trail systems where hunters can easily access the field has remained largely unchanged, and pursuing big game has become more competitive and expensive; thus placing more pressure on less competitive and more affordable small game hunting opportunities. Alaska’s small game populations have become exposed to this demographic and social shift, but only recently has evidence been available to assess its effect (Carroll and Merizon 2014). Despite the popularity of small game, few attempts have been made to estimate statewide small game hunter participation, harvest, and effort (Merizon and Carson 2013). However, several localized or regional small game hunting surveys have been completed beginning as far back as the 1950s (Buckley 1954) and continuing periodically since the 1960s (Weeden 1965; McGowan and Weeden 1968; Ernest 1976, 1978, McGowan 1980, 1985, 1986, Taylor 1992, 1994, 2000). However a statewide survey that provides a broader perspective on small game hunting was first attempted after RY11 (Merizon and Carson 2013). It was difficult to focus the survey on known small game hunters as there was no resident small game license category available to which a questionnaire could be focused; as a result, a total of 9,539 license holders were questioned. Despite a low response rate (11%) much was learned about hunter effort, participation, species of greatest interest, transportation methods used, and harvest. In May 2014, the second statewide small game hunter survey was created and mailed to similar numbers of households of residents and nonresidents as in RY11. Goals included trying to further document and understand the statewide trends in harvest patterns and hunter participation.
Wildlife Management Report ADF&G/DWC/WMR 2015-1 1

The objectives of this survey were as follows:
1. Estimate the total number of small game hunters statewide.
2. Estimate the number of small game hunters under the age of 16.
3. Estimate the proportion of hunters who pursue small game opportunistically versus those who target small game.
4. Estimate small game hunting participation among the various license types.
5. Estimate the most frequently used transportation method in each of 10 discrete geographic areas of the state.
6. Estimate the most frequently targeted species in each of 10 discrete geographic areas of the state.
Additional small game hunter surveys will be needed for managers to adequately address regulatory proposals, hunters to be well informed on the status of various small game populations, and the state to thoroughly understand the contributions small game hunters make to regional and local economies.
2 Wildlife Management Report ADF&G/DWC/WMR 2015-1

Wildlife M
anagement R
eport AD
F&G
/DW
C/W
MR
-2015-1 3
Figure 1. State of Alaska game management units.

Methods SURVEY DESIGN
A stratified, random sample household survey was conducted to estimate small game hunter participation, harvest, effort, targeted and harvested species, and location of effort for the time period from 1 August 2013 through the end of the RY13 hunting season. A single page survey form (Fig. 2) was mailed to survey recipients who were asked to complete the form and mail it back or respond through a secure online website portal. Survey recipients were provided a unique questionnaire ID number on the paper survey form mailed to each recipient. The questionnaire ID allowed entrance to the online portal, thus keeping multiple household residents from double reporting. Recipients were asked to describe the hunting activities of all members of the household, including hunters under the age of 16. The online application was created using Microsoft (MS) SQL Server and Microsoft.NET. In Alaska there is no easy way to query the resident small game hunter population due to the lack of a resident small game license category (only nonresidents can purchase a specific small game license). Therefore, to develop a survey pool, individual survey recipients were selected from the RY12 license database using MS SQL Server. This was the most recent complete list of resident and nonresident hunters from which to create our list of RY13 survey recipients. Recipients were selected according to the following characteristics: 1) at least one member of the household had purchased a resident hunting, trapping, or combination license during RY12, 2) a nonresident purchased a small game, hunting, or combination license during RY12, 3) a nonresident purchased a military license during RY12, or 4) at least one individual of a household held a permanent identification (PID) card during RY12. If multiple license holders were selected with the same address, the first license holder with that address was selected to receive the survey. Five percent (5%) of Alaska resident license holders (including military and PID) were selected randomly from this pool. Recipients were then stratified by all Alaska communities with a minimum sample size of 10 individual license holders per city. If a stratum had less than 10 members, all of them were selected. Five percent (5%) of all nonresident license holders were randomly selected and not stratified by city. A total of 512 location strata were created due to the city/license combinations. On 1 May 2014 a single page survey form was mailed to survey recipients. For those that had not completed the survey by 20 June, a reminder survey was mailed on 30 June 2014. All surveys received after 18 August 2014 were not used in the final tabulation and analysis for this report. In order to more effectively interpret the responses to transportation methods, effort, and hunting location, 10 geographic areas of the state were identified and responses linked to those areas (Fig. 3). These regions were selected based on population size and access to the primary road system in Alaska. Microsoft SQL Server and MS Excel were used to summarize data and produce estimates.
4 Wildlife Management Report ADF&G/DWC/WMR 2015-1

Figure 2. Survey form mailed to each recipient.
Wildlife Management Report ADF&G/DWC/WMR 2015-1 5

6 Wildlife M
anagement R
eport AD
F&G
/DW
C/W
MR
2015-1
Figure 3. Geographic areas used to better describe small game hunting effort, transportation methods, and location.
Southeast
Alaska Peninsula
Western Rural
Interior Rural
AnchorageKenai
SouthcentralRural
Mat-Su
Fairbanks
Interior Road System
Interior Rural
Interior Rural

Results
SURVEY RESPONSE
During RY12, 182,132 total license holders (resident, PID, and nonresident) lived in 131,928 unique households (Table 1). A random sample of 9,552 was taken of these households and stratified by license type and city. From 9,552 survey requests we received 2,850 completed surveys (online and returned paper responses), for a response rate of 30% (Table 1). A total of 483 respondents (17%) reported hunting small game and 3% reported participating in a federal subsistence hunt for small game. The majority of reported federal subsistence hunting occurred in GMU 13, 17, 18, 22, and 23 and was directed towards ptarmigan.
The highest survey response rate was among nonresidents with licenses other than small game (41%), followed by resident PID (33%), and resident trapping license holders (31%; Table 1). The response rate for rural residents (residents living outside the large urban centers of Anchorage, Mat-Su and Fairbanks) was lower than urban residents (Table 2). Residents in the Interior Rural (17%) and Western Rural (17%) areas had the lowest response rate.
As of 15 December, 2014 a total of 89 surveys (3% of the total) had been received since the 18 August cut-off date and not included in summary results. Of those 21% reported hunting small game during RY13.
SMALL GAME HUNTING
Statewide, an estimated 40,239 (95% CI = 36,057 - 44,420) individuals hunted small game in Alaska (Table 3). Of these, 6,846 (95% CI = 5,585 – 8,164) hunters were under the age of 16 and 33,393 were age 16 and older. Similarly, an estimated total of 23,483 households (22,331 resident and 1,152 nonresident) hunted small game in Alaska during the reporting period.
An estimated 28% of all respondents hunted small game specifically and 22% hunted small game only opportunistically while pursuing other hunting or outdoor activities (Table 4). The majority (50%) of small game hunters in Alaska responded that they enjoyed both pursuing small game specifically as well as opportunistically while enjoying other outdoor recreational activities.
Survey respondents reported spending more days hunting spruce grouse and ptarmigan than any other species (Table 5). The greatest number of reported hunter days spent hunting ptarmigan by geographic area occurred in the Western Rural area although the greatest total reported effort by GMU occurred in GMU 13. The greatest effort spent hunting spruce and ruffed grouse was by residents living in the Interior (Road System and Rural) and the Mat-Su geographic areas.
Species identification may have had an unknown influence on survey results. For example, Southeast respondents reported 54% of their overall effort was spent hunting spruce grouse despite this species having a very limited range (Prince of Wales Island group) and overall low abundance in this geographic area. Sooty grouse are the predominant grouse species throughout Southeast and harvest is much higher than spruce grouse.
Wildlife Management Report ADF&G/DWC/WMR 2015-1 7

8 Wildlife M
anagement R
eport AD
F&G
/DW
C/W
MR
2015-1
Table 1. Statewide small game hunter survey response rate by license type. Households that Total Number of Sample Surveys Returned Hunted Small Game
License Type Status License Holders Households Size Number Percent Number Percent
Nonresident Hunting Nonresident 7,027 6,531 307 124 40% 3 2% Nonresident Hunting & Sport Fishing Nonresident 596 528 33 12 36% 0 0% Nonresident Hunting & Trapping Nonresident 101 85 2 0 0% 0 0% Nonresident Hunting/1 Day Sport Fishing Nonresident 13 12 0 0 0% 0 0% Nonresident Hunting/3 Day Sport Fishing Nonresident 29 27 1 1 100% 0 0% Nonresident Hunting/7 Day Sport Fishing Nonresident 860 786 44 22 50% 1 5% Nonresident Hunting/14 Day Sport Fishing Nonresident 262 244 9 3 33% 0 0% Total Nonresident 8,888 8,213 396 162 41% 4 2%
Nonresident Small Game Hunting Nonresident Small Game 1,647 1,423 71 15 21% 10 67%
Total Nonresident Small Game 1,647 1,423 71 15 21% 10 67% Nonresident Military Hunting Resident 546 461 29 5 17% 2 40% Nonresident Military Sport Fishing & Hunting Resident 1,232 994 58 3 5% 2 67% Res ANG/Mil Reserves Sport Fishing & Hunting Resident 1,545 1,275 69 25 36% 6 24% Resident Hunting Resident 16,606 11,981 982 197 20% 51 26% Resident Low Income Sport Fishing, Hunting & Trapping Resident 15,718 10,550 1,031 146 14% 29 20% Resident Sport Fishing & Hunting Resident 40,197 29,612 1,841 645 35% 154 24%
Total Resident 75,844 54,873 4,010 1,021 25% 244 24% Resident Hunting & Trapping Resident - Trapping 793 570 77 11 14% 7 64% Resident Sport Fishing, Hunting & Trapping Resident - Trapping 7,391 5,336 381 131 34% 54 41% Total Resident - Trapping 8,184 5,906 458 142 31% 61 43%
Resident Permanent Resident -Permanent ID 87,569 61,513 4,617 1,510 33% 164 11% Total Resident - Permanent ID 87,569 61,513 4,617 1,510 33% 164 11%
Survey Total 182,132 131,928 9,552 2,850 30% 483 17%

Table 2. Survey response rate among all geographic areas and nonresidents. Surveys Response Geographic Area Sent Returned Rate Southeast 1,046 396 38% Nonresident 572 199 35% Anchorage 2,069 716 35% Mat-Su 903 311 34% Kenai 864 294 34% Interior Road System 501 151 30% Fairbanks 791 234 30% Southcentral Rural 438 119 27% Alaska Peninsula 452 109 24% Interior Rural 731 126 17% Western Rural 1,185 195 16% Total 9,552 2,850 30%
Table 3. Mean and estimated number of small game hunters by age and household.
Estimated Number of Mean Number of
Small Game Estimated Number of
Households that Hunters per Household
Statewide Small Game Hunters
Status Hunted Small Game Total Age 10-16 Total Age 10-16 Total Nonresident 203 1.75 0.00 355 - Total Nonresident-small game 949 1.30 0.10 1,233 95 Total Resident 13,114 1.74 0.36 22,841 4,783 Total Resident and Trapping 2,537 1.62 0.25 4,118 624 Total Permanent ID 6,681 1.75 0.20 11,692 1,344 Survey Total 23,484 40,239 6,846
Table 4. Number of respondents who targeted and/or opportunistically hunted small game. Number of Method Responses Percent Specifically targeted small game 137 28% Hunted small game opportunistically 107 22% Both of the above 239 50% Total 483 100.0%
Wildlife Management Report ADF&G/DWC/WMR 2015-1 9

10 Wildlife M
anagement R
eport AD
F&G
/DW
C/W
MR
2015-1
Table 5. Average number of days hunted per species by those that reported hunting small game within a geographic area. Number of Grouse Hare Average Geographic Area Respondents Ruffed Spruce Sharp-tailed Sooty Ptarmigan Snowshoe Alaska Total Alaska Peninsula 33 1.5 6.4 0.0 0.0 7.5 2.3 2.5 20 Anchorage 93 1.5 3.5 0.1 0.1 2.7 1.4 0.7 10 Fairbanks 45 3.3 2.9 2.0 0.1 2.6 1.4 0.8 13 Interior Road System 42 4.5 9.8 3.8 0.1 4.5 6.5 2.6 32 Interior Rural 30 7.0 12.2 0.4 0.0 8.3 5.4 1.3 34 Kenai 30 0.1 5.7 0.0 0.0 3.1 6.2 0.1 15 Mat-Su 61 3.2 8.5 0.2 0.0 5.9 3.9 1.0 23 Southcentral Rural 24 0.0 3.2 0.0 0.0 4.0 5.7 1.5 14 Southeast 30 0.0 3.5 0.0 2.3 0.2 0.2 0.2 6 Western Rural 60 0.5 0.8 0.0 0.1 7.2 2.9 2.5 14 Non-resident 11 0.6 1.5 0.0 0.0 4.1 0.6 0.0 7

Of the Alaska resident respondents that reported hunting small game, most hunters spent the majority of their time pursuing small game within the geographic area in which they lived (Appendix A). For example, 95% of Kenai resident effort was from within GMUs 7 and 15, 66% of Mat-Su resident effort within GMUs 14 and 16, 86% of Fairbanks resident effort within GMU 20, and 100% of effort from Southeast residents in GMUs 1–5. Overall, 50% of hunters statewide reported hunting in GMUs 13, 14, and 20 during RY13 (Fig. 4).
Figure 4. Percent of total hunters that reported hunting all small game in RY13 by game management unit.
The primary transportation methods used to hunt small game statewide reported by respondents included walking (28%), all-terrain vehicle (ATV; 24%), and highway vehicle (21%; Table 6). However, this varied by geographic area; hunters in the Western Rural area reported using primarily snowmachine (67%) versus other means of transportation. Statewide, ptarmigan were hunted primarily using snowmachine (39%; Appendix B); however, in GMUs 17 and 18 that percentage was higher (91% and 73%, respectively). Snowshoe hare, spruce, ruffed, and sharp-tailed grouse were hunted primarily using highway vehicles, walking, and ATVs. Too few data were collected to estimate transportation methods used for Alaska are and sooty grouse.
Overall, respondents reported lower abundance of virtually all small game species statewide during RY13 than during the previous year. Of particular notice were snowshoe and Alaska hare (Table 7).
Wildlife Management Report ADF&G/DWC/WMR 2015-1 11

Table 6. Percentage of respondents that utilize specific transportation methods for hunting small game in Alaska by geographic area. Highway Geographic Area Vehicle Snowmachine ATV Airplane Boat Foot Other Alaska Peninsula 19% 4% 33% 0% 2% 41% 0% Anchorage 28% 3% 27% 2% 8% 31% 1% Fairbanks 47% 7% 12% 2% 0% 32% 0% Interior Road System 14% 5% 36% 0% 0% 43% 0% Interior Rural 10% 38% 14% 2% 12% 22% 2% Kenai 27% 9% 13% 0% 1% 29% 21% Mat-Su 28% 22% 31% 1% 4% 14% 0% Southcentral Rural 8% 1% 24% 2% 0% 66% 0% Southeast 35% 11% 5% 0% 31% 18% 0% Western Rural 2% 67% 16% 0% 4% 10% 0% Non-resident 71% 0% 11% 8% 0% 11% 0% Total 21% 19% 24% 1% 5% 28% 2%
Table 7. Population abundance trend observed by hunters during RY13 based on percent of total responses.
Overall Abundance Grouse Hare Compared to Last Year Ruffed Spruce Sharp-tailed Sooty Ptarmigan Snowshoe Alaska
Less 53% 46% 43% 33% 43% 61% 59% More 11% 14% 30% 42% 14% 10% 12% Same 36% 40% 26% 25% 43% 29% 29%
Total Responses 83 188 23 12 188 112 41
An attempt was made to estimate total harvest. Estimates were calculated by multiplying the total number of households that reported hunting small game in Alaska during RY13 (23,483) by the percent of households that targeted each species and then by the mean household harvest of each species. During the RY13, statewide small game hunting season, an estimated 114,000 ptarmigan, 73,000 spruce grouse, 23,000 snowshoe hare, 16,000 ruffed grouse, 5,000 sharp-tailed grouse, 5,000 sooty grouse, and 7,500 Alaska hare were harvested under state regulations (Table 8). However, these statewide harvest estimates should be interpreted cautiously.
Table 8. Estimated statewide harvest by species during regulatory year 2013. Percent of 95% Confidence Interval Species Harvest Total Lower Upper Ptarmigan 114,206 47% 84,213 144,200 Spruce Grouse 72,734 30% 59,921 85,547 Snowshoe Hare 23,434 10% 16,489 30,380 Ruffed Grouse 15,947 7% 10,161 21,733 Alaska Hare 7,536 3% 4,059 11,013 Sharp-tailed Grouse 5,397 2% 3,029 7,765 Sooty Grouse 4,813 2% 1,573 8,054 Total 244,067 100% 179,445 308,692
12 Wildlife Management Report ADF&G/DWC/WMR 2015-1

Discussion
SURVEY MEDIUM
During the first statewide small game hunter survey in May 2012 all recipients had to provide their responses online; no paper survey forms were provided. It was believed that a vast majority of resident and nonresident hunters had convenient and frequent access to the Internet, therefore making an online response easy and efficient. A very low response rate (11%) was received. The reason for the low response rate is unknown and may have been caused by one of several issues:
1. The online portal was constructed using Adobe Flash which was not supported by AppleTM products. Due to Apple’s market share in the United States (60% of digital devices in 2012; Business Insider 2014) this may have affected a significant portion of the survey recipients.
2. Internet access in certain portions of Alaska may be limited therefore affecting responses.
3. For hunters that did not hunt small game it may have been more inconvenient than filling out and mailing a paper form to go online, log in through the portal, and complete the survey. Therefore, responses may have been biased towards those that actually hunted small game.
All of these reasons contributed to the creation of the dual medium used for this most recent survey.
In May 2014, recipients received a paper survey form that could be completed and returned or they had the option of providing their responses online as in 2012. Over 50% of participants completed the paper survey form. We plan to continue sending paper survey forms to hunters in the future as it was clear that Alaskan hunters strongly support this survey medium. The PID license category showed the highest increase in survey response between the 2012 and 2014 surveys.
The proportion of recipient households that reported hunting small game in RY13 was much lower (17%) than the RY11 small game survey (33%). There are several possible explanations:
1. Fewer resident and nonresident households hunted small game during RY13.
2. It was easier for survey respondents to check one box on a paper form than it was to go online to complete the same response.
3. There could have been a difference in geographic area response rates.
INTERPRETING HUNTER RESPONSES
We felt a single household questionnaire was the best way to capture the hunting activities of the license holder within the household, other hunters in the household, and young hunters (age 10–15) in the household. Young hunters, 10–15 years of age, are not required to purchase a hunting license; therefore documenting their effort and harvest presents unique challenges this survey hoped to overcome. By asking for household small game hunting information, data could be summarized by individual respondent or household.
Wildlife Management Report ADF&G/DWC/WMR 2015-1 13

Small game hunters residing in the urban geographic areas (Anchorage, Mat-Su, and Fairbanks) used transportation methods differently than residents living in more remote locations both on and away from the primary road system (Interior Rural, Southcentral Rural, and Western Rural). Urban area hunters predominantly used highway vehicles, walking, and ATVs in order of importance. Non-urban residents used ATVs, boats, and snowmachines more than urban residents. Ptarmigan hunters statewide tended to use snowmachines more than any other mode of transportation (39% of the time) whereas grouse hunters (ruffed, sharp-tailed, and spruce) tended to use highway vehicles, ATVs, and walking most commonly.
With 9 species of small game in Alaska, species identification can be a potential source of error for hunters recalling the species they hunted or harvested. There are several examples of this that should be considered when interpreting these data. For example, hunters reported hunting and harvesting species outside the known range of each species in Alaska, for instance harvesting sooty grouse outside the Southeast area or sharp-tailed grouse in the Kenai area. An attempt was made to correct for some of these errors. Hunter effort and harvest of species that are known to be absent from specific GMUs were disregarded.
Small game harvest estimates were made for animals harvested under state regulations despite potential biases based on response rates and data quality. Despite potential bias the estimates do reveal the overall pattern that was reflected throughout the survey. Spruce grouse, ptarmigan, and snowshoe hare are the most popular small game species statewide based on hunting effort and harvest. Ruffed and sharp-tailed grouse are hunted proportionately less perhaps because they are not as widespread and thus less accessible to hunters statewide. Since sooty grouse are restricted to Southeast Alaska relatively few hunters pursue this species as is reflected in the harvest data.
Overall hunters reported seeing a lower abundance of virtually every species of small game during RY13 than the previous year. This was particularly evident from responses regarding snowshoe and Alaska hare. The likely explanation for snowshoe hare is its documented low in the 8-10 year population cycle statewide (Carroll and Merizon 2014). Overall, Alaska hare appears to be at low yet stable densities throughout its range in Alaska. It remains uncertain whether this has been a long-term decline or a midcentury crash with a continued low but stable population in recent years (Carroll and Merizon 2014).
The popularity of spruce grouse, ptarmigan, and snowshoe hare indicated in this survey is similar to what was found in the hunter survey in 2012 (Merizon and Carson 2013) and earlier by McGowan (1980, 1985, and 1986). McGowan suggested that spruce grouse were the most popular small game species in the early to mid-1980s in the Interior. The increased interest in ptarmigan could be explained by various factors, including technological improvements in off-road vehicles (ATVs and snowmachines) over the past 25 years. These improvements have allowed hunters to more easily pursue ptarmigan at greater distances from the road corridor.
The importance of ptarmigan to statewide small game hunters was strongly underscored through this survey effort. Although neither state regulations nor this survey allowed us to distinguish between willow, white-tailed, and rock ptarmigan in terms of numbers harvested or hunter effort, willow ptarmigan were likely the predominant species harvested. This is the most abundant ptarmigan species in Alaska and occurs throughout the entire state with the exception of the Aleutian Islands (Carroll and Merizon 2014). This species is facing unique challenges as the
14 Wildlife Management Report ADF&G/DWC/WMR 2015-1

state’s human population continues to grow. Increased wintertime recreation and increasing interest in pursuing easy and affordable small game hunting opportunities will continue to put pressures on all of Alaska’s small game species, particularly ptarmigan.
This survey clearly demonstrated both the recreational and subsistence value of Alaska’s small game resources. However, ADF&G has only just begun to understand small game harvest, hunter participation, and effort throughout the state. Regular surveys are needed in the future for managers to make recommendations and evaluate proposed regulations. Information from these surveys can also be used to inform hunters on the status of small game populations. In addition, data gathered from these surveys can be used to highlight and understand the contributions small game hunters make to regional and local economies. Future surveys will take into account experience from these first surveys in order to refine our approach to better assess hunter effort, harvests and population trend of small game species at finer geographic scales.
Acknowledgments We’d like to thank all the respondents to the survey; your time and effort is greatly appreciated. Thank you to all who assisted in entering survey data including C. Anderson, C. Bue, B. Fitzgerald, and W. Newberry. Thank you to B. Dale, T. Paragi, S. Brainerd, C. Carroll, and P. Harper for reviewing this report and providing a thorough review.
This project was funded in part by Federal Aid in Wildlife Restoration W-33-12, Project 35.0: Status, public use, and management of small game populations in Alaska FY2014.
Literature Cited Buckley, J. 1954. Animal population fluctuations in Alaska: a history. Transactions of the North
American Wildlife and Natural Resources Conference, 19:338-357. Business Insider. Jay Yarow. 13 March 2012. Chart of the day: This chart tells the real story of
Android and iOS. http://www.businessinsider.com/chart-of-the-day-this-chart-tells-the-real-story-of-android-versus-ios-2012-3.
Carroll, C. J. and R. A. Merizon. 2014. Status of grouse, ptarmigan, and hare in Alaska, 2014.
Alaska Department of Fish and Game, Wildlife Management Report ADF&G/DWC/WMR-2014-1, Palmer, Alaska.
Ernest, J. R. 1976. Upland game abundance; survey-inventory progress report-1974. Alaska
Department of Fish and Game, Division of Game. Federal Aid in Wildlife Restoration Project W-17-7.
___. 1978. Upland game abundance; survey-inventory progress report. Alaska Department of
Fish and Game, Division of Game, Federal Aid in Wildlife Restoration Project W-17-9. McGowan, J. D. and R. B. Weeden. 1968. Abundance and distribution of upland game. Alaska
Department of Fish and Game, Division of Game. Federal Aid in Wildlife Restoration Project W-13-R-3 and W-17-1.
Wildlife Management Report ADF&G/DWC/WMR 2015-1 15

McGowan, J. 1980. Grouse; survey-inventory progress report 1978-1979. Alaska Department of
Fish and Game, Division of Game. Federal Aid in Wildlife Restoration Project W-17-11. ___. 1985. Small game; survey-inventory progress report. Alaska Department of Fish and
Game, Division of Game. Federal Aid in Wildlife Restoration Project W-22-3. ___. 1986. Small game abundance; survey-inventory progress report. Alaska Department of Fish
and Game, Division of Game. Federal Aid in Wildlife Restoration Project W-22-4. Merizon, R. A. and S. J. Carson. 2013. Statewide Small Game Hunter Survey, 2012. Alaska
Department of Fish and Game, Division of Wildlife Conservation, Wildlife Management report ADF&G/DWC/WMR-2013-2, Anchorage, Alaska.
Taylor, W. P. 1992. Report on 1992 ptarmigan hunter questionnaire. Alaska Department of Fish
and Game, Unpublished report, Palmer. ____. 1994. Game management unit 13 ptarmigan hunter and harvest report, 1992-94. Alaska
Department of Fish and Game. Unpublished report, Palmer. ____. 2000. Game management unit 13 ptarmigan population studies. Alaska Department of Fish
and Game, Division of Wildlife Conservation. Final research performance report, 1 August 1997–30 June 1999. Federal Aid in Wildlife Restoration Study 10.70. Juneau.
Weeden, R. B. 1965, Grouse and ptarmigan in Alaska, their ecology and management. Alaska
Department of Fish and Game, Division of Game. Federal Aid in Wildlife Restoration Project W-6-R-5.
United States Census Bureau. 1 July, 2014. State Totals.
http://www.census.gov/popest/data/state/totals/2014/index.html
16 Wildlife Management Report ADF&G/DWC/WMR 2015-1

Appendix A: Number of days hunted reported by small game survey respondents, by species and geographic area.
Wildlife Management Report ADF&G/DWC/WMR 2015-1 17

18 Wildlife M
anagement R
eport AD
F&G
/DW
C/W
MR
2015-1
Figure A1. Total effort (hunting days) reported from residents within the Kenai geographic area by species, RY13.

Wildlife M
anagement R
eport AD
F&G
/DW
C/W
MR
-2015-1 19
Figure A2. Total effort (hunting days) reported from residents within the Anchorage geographic area by species, RY13.

20 Wildlife M
anagement R
eport AD
F&G
/DW
C/W
MR
2015-1
Figure A3. Total effort (hunting days) reported from residents within the Mat-Su geographic area by species, RY13.

Wildlife M
anagement R
eport AD
F&G
/DW
C/W
MR
-2015-1 21
Figure A4. Total effort (hunting days) reported from residents within the Fairbanks geographic area by species, RY13.

22 Wildlife M
anagement R
eport AD
F&G
/DW
C/W
MR
2015-1
Figure A5. Total effort (hunting days) reported from residents within the Alaska Peninsula geographic area by species, RY13.

Wildlife M
anagement R
eport AD
F&G
/DW
C/W
MR
-2015-1 23
Figure A6. Total effort (hunting days) reported from residents within the Interior Road System geographic area by species, RY13.

24 Wildlife M
anagement R
eport AD
F&G
/DW
C/W
MR
2015-1
Figure A7. Total effort (hunting days) reported from residents within the Interior Rural geographic area by species, RY13.

Wildlife M
anagement R
eport AD
F&G
/DW
C/W
MR
-2015-1 25
Figure A8. Total effort (hunting days) reported from residents within the Southcentral Rural geographic area by species, RY13.

26 Wildlife M
anagement R
eport AD
F&G
/DW
C/W
MR
2015-1
Figure A9. Total effort (hunting days) reported from residents within the Southeast geographic area by species, RY13.

Wildlife M
anagement R
eport AD
F&G
/DW
C/W
MR
-2015-1 27
Figure A10. Total effort (hunting days) reported from residents within the Western Rural geographic area by species, RY13.
28 Wildlife M
anagement R
eport AD
F&G
/DW
C/W
MR
2015-1
Figure A11. Total effort (hunting days) reported from Nonresident hunters by species, RY13.

Appendix B: Reported number of days using various transportation methods used to hunt small game, by species.
Wildlife Management Report ADF&G/DWC/WMR 2015-1 29

30 Wildlife M
anagement R
eport AD
F&G
/DW
C/W
MR
2015-1
Figure B1. Total effort (hunting days) by transportation method used to hunt ptarmigan, RY13.

Wildlife M
anagement R
eport AD
F&G
/DW
C/W
MR
-2015-1 31
Figure B2. Total effort (hunting days) by transportation method used to hunt spruce grouse, RY13.

32 Wildlife M
anagement R
eport AD
F&G
/DW
C/W
MR
2015-1
Figure B3. Total effort (hunting days) by transportation method used to hunt snowshoe hare, RY13.

Wildlife M
anagement R
eport AD
F&G
/DW
C/W
MR
-2015-1 33
Figure B4. Total effort (hunting days) by transportation method used to hunt ruffed grouse, RY13.

34 Wildlife M
anagement R
eport AD
F&G
/DW
C/W
MR
2015-1
Figure B5. Total effort (hunting days) by transportation method used to hunt sharp-tailed grouse, RY13.


Alaska Department of Fish and Game Division of Wildlife Conservation