Embed Size (px)
Citation preview
STATE OF THE CHEMICAL INDUSTRY
Chemical Processing WebinarJune 2021
Dr. Thomas Kevin SwiftChief Economist & Managing Director
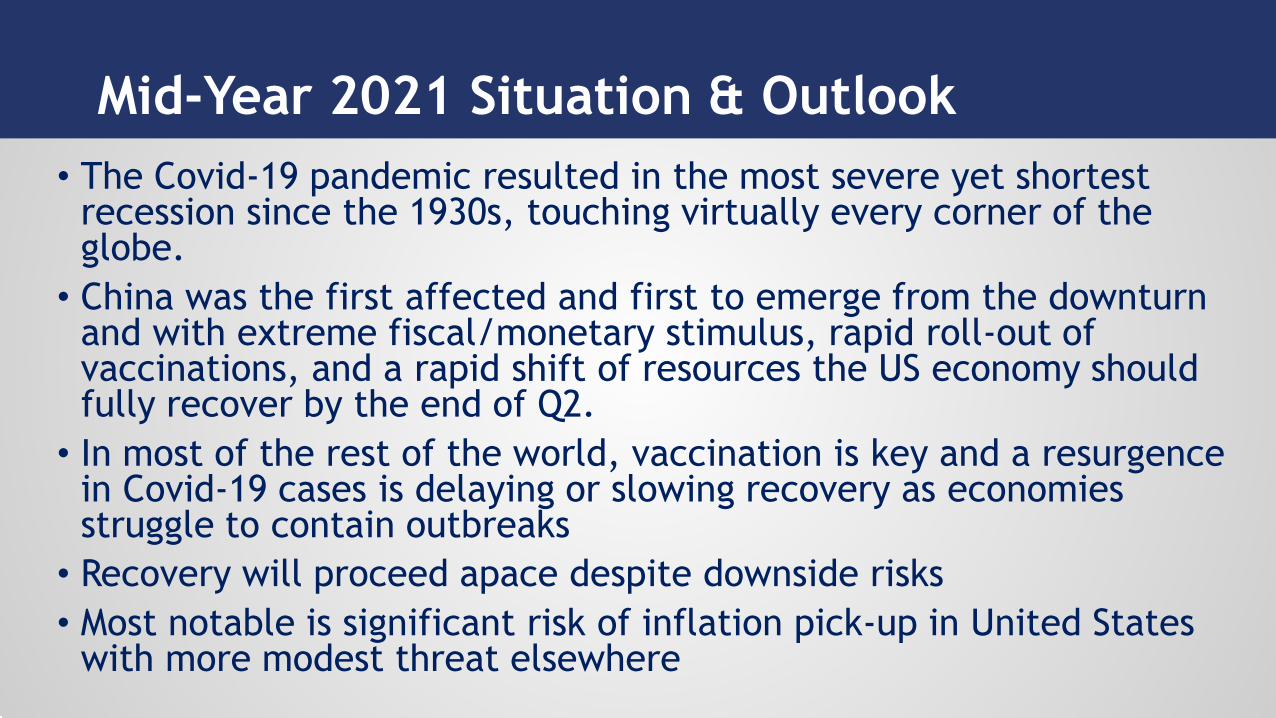
• The Covid-19 pandemic resulted in the most severe yet shortest recession since the 1930s, touching virtually every corner of the globe.
• China was the first affected and first to emerge from the downturn and with extreme fiscal/monetary stimulus, rapid roll-out of vaccinations, and a rapid shift of resources the US economy should fully recover by the end of Q2.
• In most of the rest of the world, vaccination is key and a resurgence in Covid-19 cases is delaying or slowing recovery as economies struggle to contain outbreaks
• Recovery will proceed apace despite downside risks • Most notable is significant risk of inflation pick-up in United States
with more modest threat elsewhere
Mid-Year 2021 Situation & Outlook
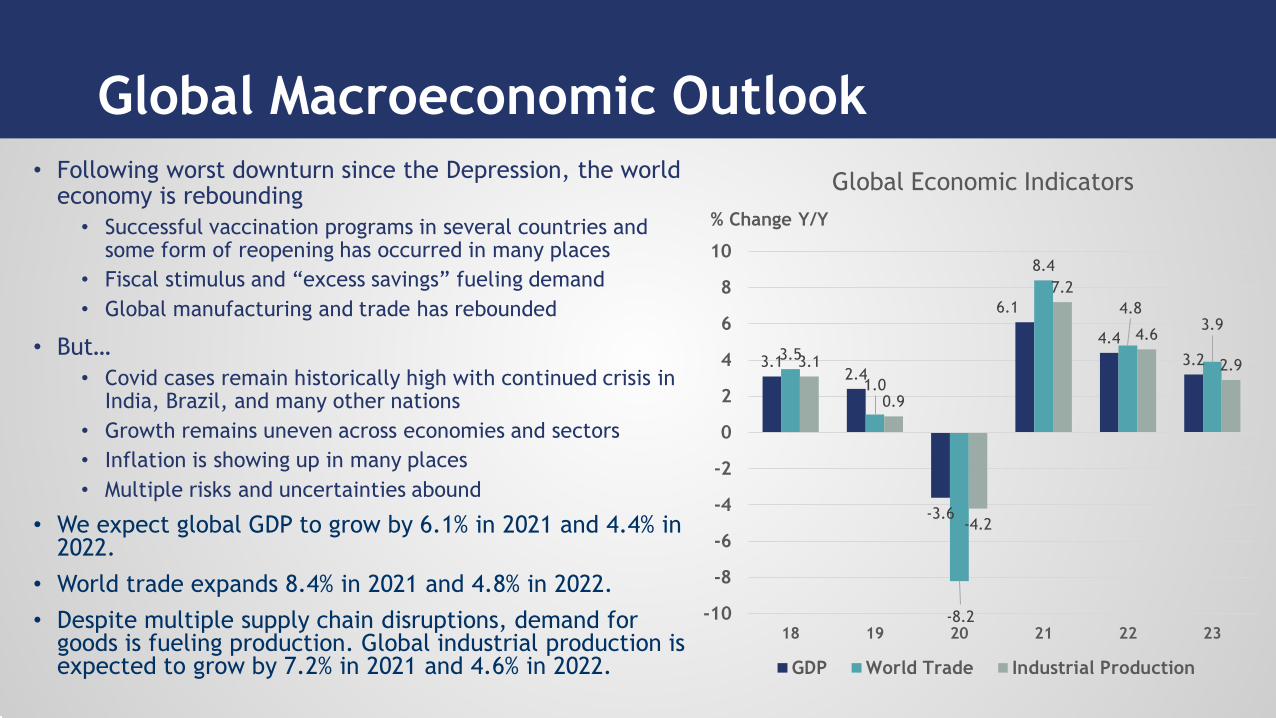
• Following worst downturn since the Depression, the world economy is rebounding
• Successful vaccination programs in several countries and some form of reopening has occurred in many places
• Fiscal stimulus and “excess savings” fueling demand• Global manufacturing and trade has rebounded
• But…• Covid cases remain historically high with continued crisis in
India, Brazil, and many other nations• Growth remains uneven across economies and sectors• Inflation is showing up in many places• Multiple risks and uncertainties abound
• We expect global GDP to grow by 6.1% in 2021 and 4.4% in 2022.
• World trade expands 8.4% in 2021 and 4.8% in 2022.• Despite multiple supply chain disruptions, demand for
goods is fueling production. Global industrial production is expected to grow by 7.2% in 2021 and 4.6% in 2022.
Global Macroeconomic Outlook
3.12.4
-3.6
6.1
4.43.23.5
1.0
-8.2
8.4
4.83.9
3.1
0.9
-4.2
7.2
4.6
2.9
-10
-8
-6
-4
-2
0
2
4
6
8
10
18 19 20 21 22 23
Global Economic Indicators
GDP World Trade Industrial Production
% Change Y/Y
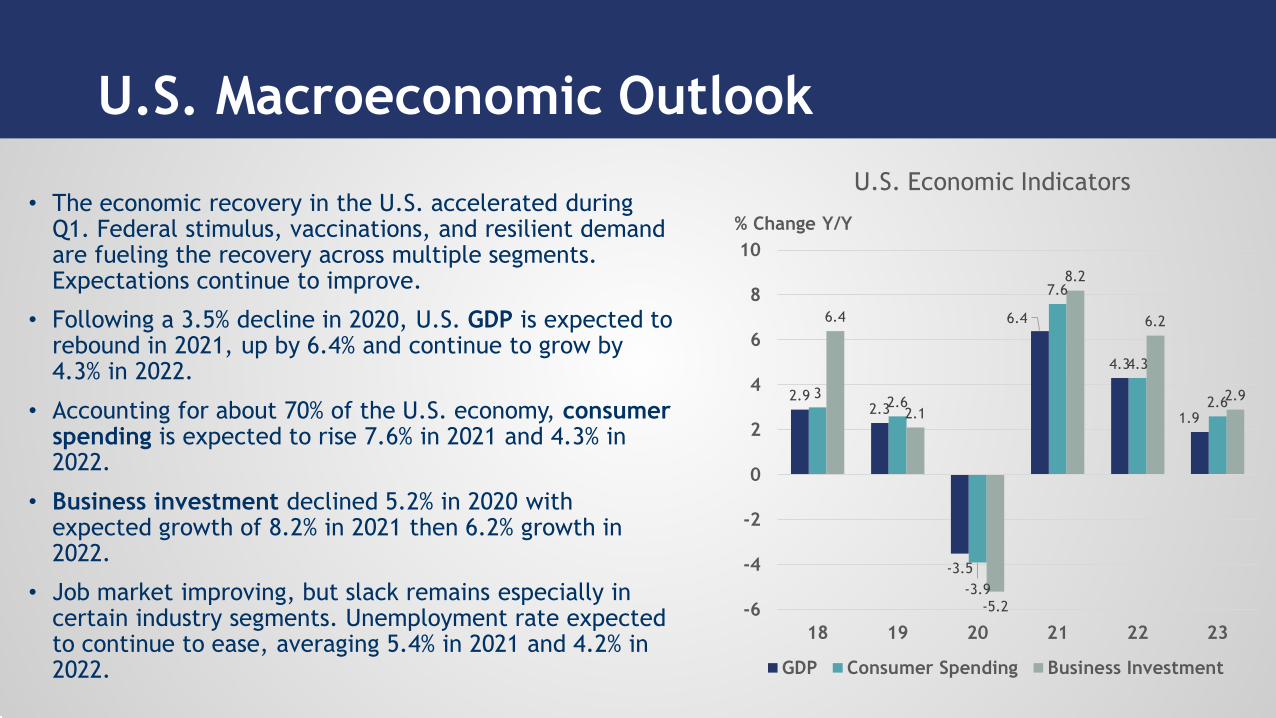
• The economic recovery in the U.S. accelerated during Q1. Federal stimulus, vaccinations, and resilient demand are fueling the recovery across multiple segments.Expectations continue to improve.
• Following a 3.5% decline in 2020, U.S. GDP is expected to rebound in 2021, up by 6.4% and continue to grow by 4.3% in 2022.
• Accounting for about 70% of the U.S. economy, consumer spending is expected to rise 7.6% in 2021 and 4.3% in 2022.
• Business investment declined 5.2% in 2020 with expected growth of 8.2% in 2021 then 6.2% growth in 2022.
• Job market improving, but slack remains especially in certain industry segments. Unemployment rate expected to continue to ease, averaging 5.4% in 2021 and 4.2% in 2022.
U.S. Macroeconomic Outlook
2.92.3
-3.5
6.4
4.3
1.9
3 2.6
-3.9
7.6
4.3
2.6
6.4
2.1
-5.2
8.2
6.2
2.9
-6
-4
-2
0
2
4
6
8
10
18 19 20 21 22 23
U.S. Economic Indicators
GDP Consumer Spending Business Investment
% Change Y/Y
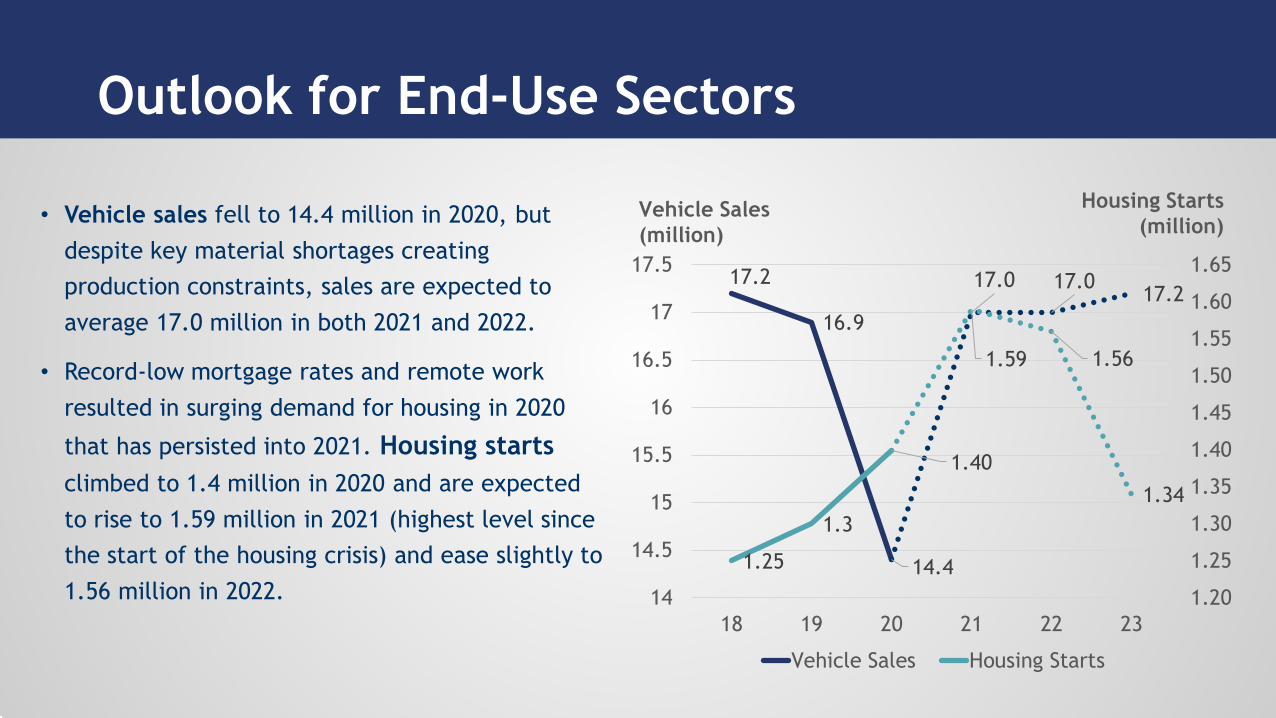
• Vehicle sales fell to 14.4 million in 2020, but despite key material shortages creating production constraints, sales are expected to average 17.0 million in both 2021 and 2022.
• Record-low mortgage rates and remote work resulted in surging demand for housing in 2020
that has persisted into 2021. Housing starts climbed to 1.4 million in 2020 and are expected to rise to 1.59 million in 2021 (highest level since the start of the housing crisis) and ease slightly to 1.56 million in 2022.
Outlook for End-Use Sectors
17.2
16.9
14.4
17.0 17.0 17.2
1.25
1.3
1.40
1.59 1.56
1.34
1.20
1.25
1.30
1.35
1.40
1.45
1.50
1.55
1.60
1.65
14
14.5
15
15.5
16
16.5
17
17.5
18 19 20 21 22 23
Vehicle Sales Housing Starts
Vehicle Sales (million)
Housing Starts(million)
Outlook for U.S. End-Use Industries
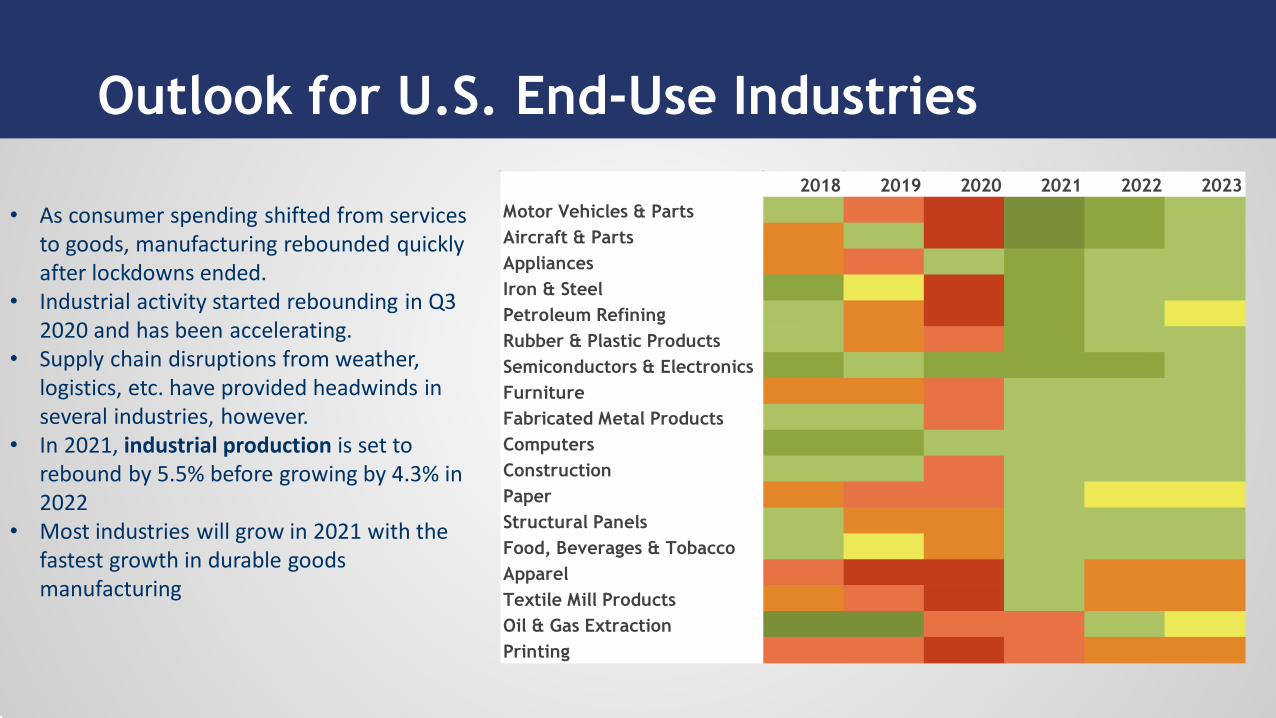
• As consumer spending shifted from services to goods, manufacturing rebounded quickly after lockdowns ended.
• Industrial activity started rebounding in Q3 2020 and has been accelerating.
• Supply chain disruptions from weather, logistics, etc. have provided headwinds in several industries, however.
• In 2021, industrial production is set to rebound by 5.5% before growing by 4.3% in 2022
• Most industries will grow in 2021 with the fastest growth in durable goods manufacturing
2018 2019 2020 2021 2022 2023Motor Vehicles & Parts 4.3 -2.4 -24.3 19.7 5.2 3.7
Aircraft & Parts -1.7 2.3 -19.2 12.2 5.4 4.0
Appliances -0.6 -3.5 1.9 9.4 1.8 2.2
Iron & Steel 6.0 0.2 -15.6 8.4 3.4 1.5
Petroleum Refining 1.7 -1.8 -15.9 7.5 1.4 0.4
Rubber & Plastic Products 1.9 -1.7 -7.8 7.0 3.6 3.0
Semiconductors & Electronics 9.1 4.2 5.8 5.9 5.4 3.4
Furniture -0.1 -0.2 -9.9 5.0 1.8 2.2
Fabricated Metal Products 5.0 1.1 -7.5 4.9 1.6 1.6
Computers 5.3 5.2 1.9 4.7 2.9 2.5
Construction 3.1 1.4 -3.1 4.2 1.7 1.5
Paper -1.1 -3.1 -2.1 3.9 0.9 0.6
Structural Panels 3.1 -1.0 -1.2 3.6 1.1 1.5
Food, Beverages & Tobacco 1.9 0.0 -1.6 2.7 1.5 1.6
Apparel -3.5 -12.2 -14.6 2.3 -1.4 -1.4
Textile Mill Products -0.9 -7.9 -10.8 2.2 -1.7 -1.5
Oil & Gas Extraction 16.8 10.8 -3.4 -2.2 1.4 0.7
Printing -2.5 -4.0 -10.9 -2.3 -0.3 -0.4
Natural Gas Based Petrochemicals Remain Competitive
0
5
10
15
20
25
30
35
40
45
94 96 98 00 02 04 06 08 10 12 14 16 18 20 22 24
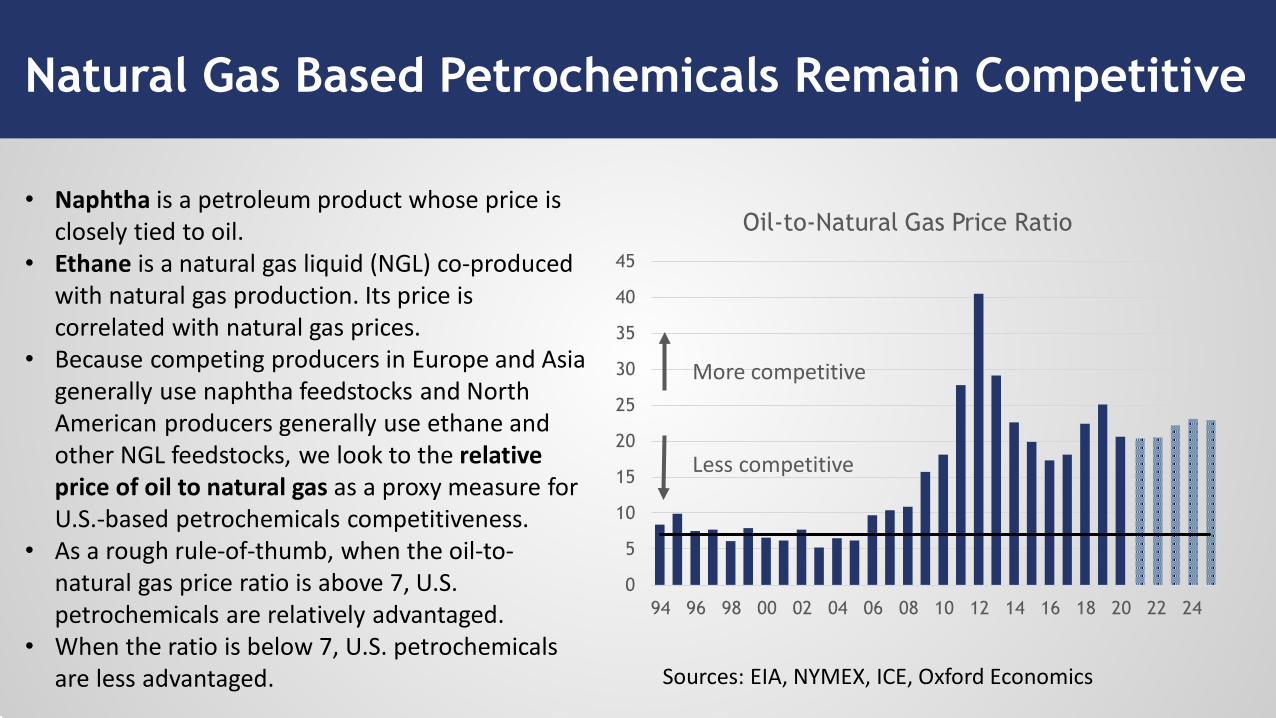
Oil-to-Natural Gas Price Ratio
Less competitive
Sources: EIA, NYMEX, ICE, Oxford Economics
• Naphtha is a petroleum product whose price is closely tied to oil.
• Ethane is a natural gas liquid (NGL) co-produced with natural gas production. Its price is correlated with natural gas prices.
• Because competing producers in Europe and Asia generally use naphtha feedstocks and North American producers generally use ethane and other NGL feedstocks, we look to the relative price of oil to natural gas as a proxy measure for U.S.-based petrochemicals competitiveness.
• As a rough rule-of-thumb, when the oil-to-natural gas price ratio is above 7, U.S. petrochemicals are relatively advantaged.
• When the ratio is below 7, U.S. petrochemicals are less advantaged.
More competitive
-12-10-8-6-4-202468
2018 2019 2020 2021 2022 2023 2024 2025
Chemicals (exc. pharm) Basic Chemicals Specialties Agricultural Chemicals Consumer Products
% change
U.S. Chemistry Rebounds from Pandemic Recession
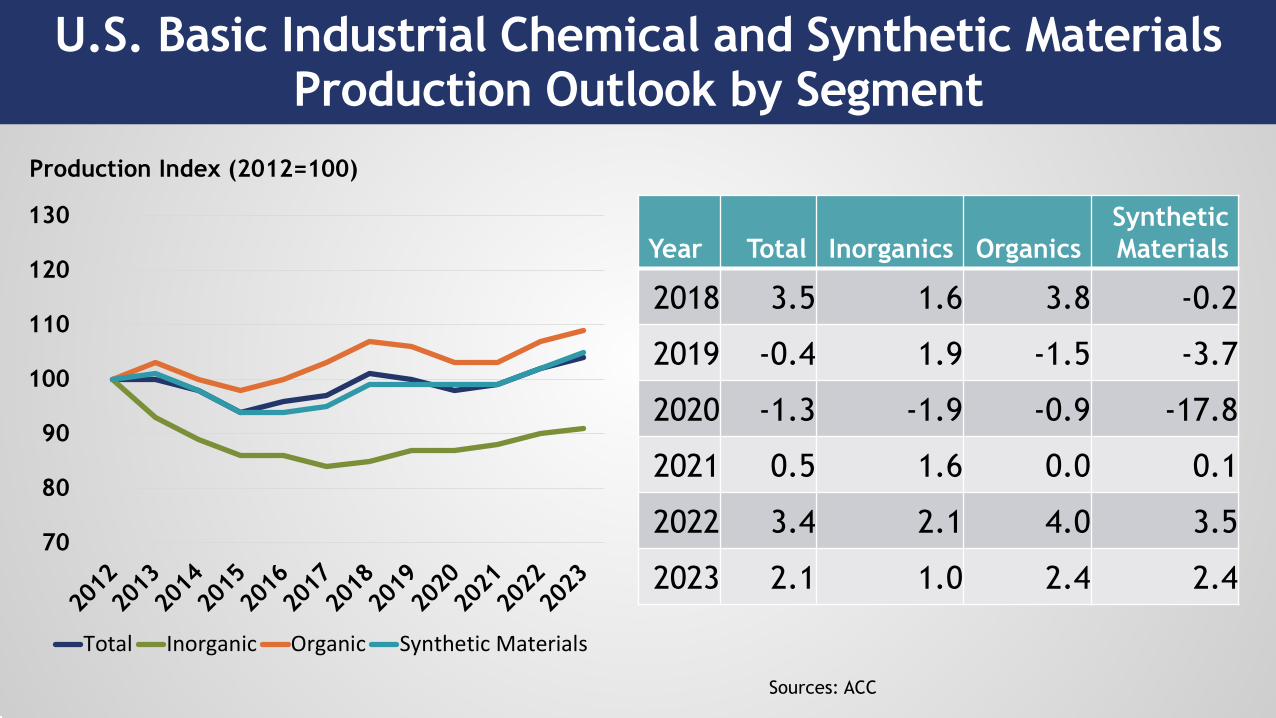
U.S. Basic Industrial Chemical and Synthetic Materials Production Outlook by Segment
Sources: ACC
Year Total Inorganics OrganicsSyntheticMaterials
2018 3.5 1.6 3.8 -0.2
2019 -0.4 1.9 -1.5 -3.7
2020 -1.3 -1.9 -0.9 -17.8
2021 0.5 1.6 0.0 0.1
2022 3.4 2.1 4.0 3.5
2023 2.1 1.0 2.4 2.470
80
90
100
110
120
130
Total Inorganic Organic Synthetic Materials
Production Index (2012=100)
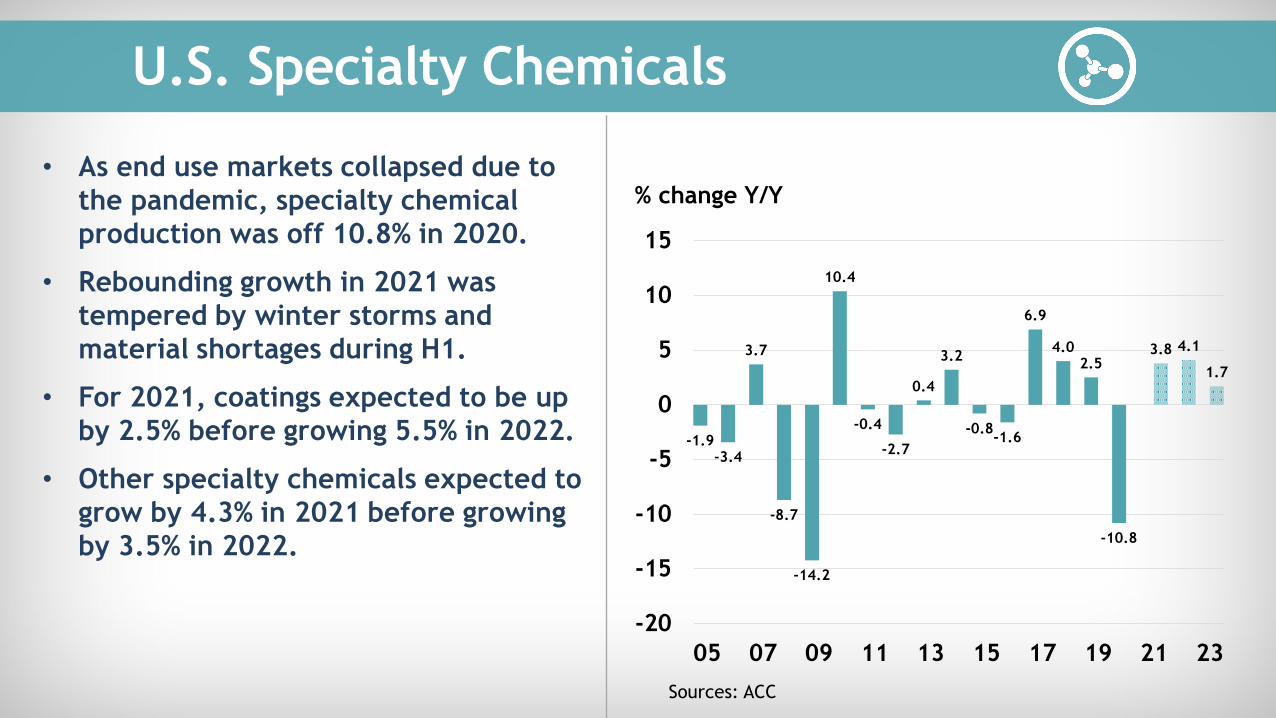
U.S. Specialty Chemicals
• As end use markets collapsed due to the pandemic, specialty chemical production was off 10.8% in 2020.
• Rebounding growth in 2021 was tempered by winter storms and material shortages during H1.
• For 2021, coatings expected to be up by 2.5% before growing 5.5% in 2022.
• Other specialty chemicals expected to grow by 4.3% in 2021 before growing by 3.5% in 2022.
-1.9-3.4
3.7
-8.7
-14.2
10.4
-0.4
-2.7
0.4
3.2
-0.8-1.6
6.9
4.02.5
-10.8
3.8 4.1
1.7
-20
-15
-10
-5
0
5
10
15
05 07 09 11 13 15 17 19 21 23
% change Y/Y
Sources: ACC
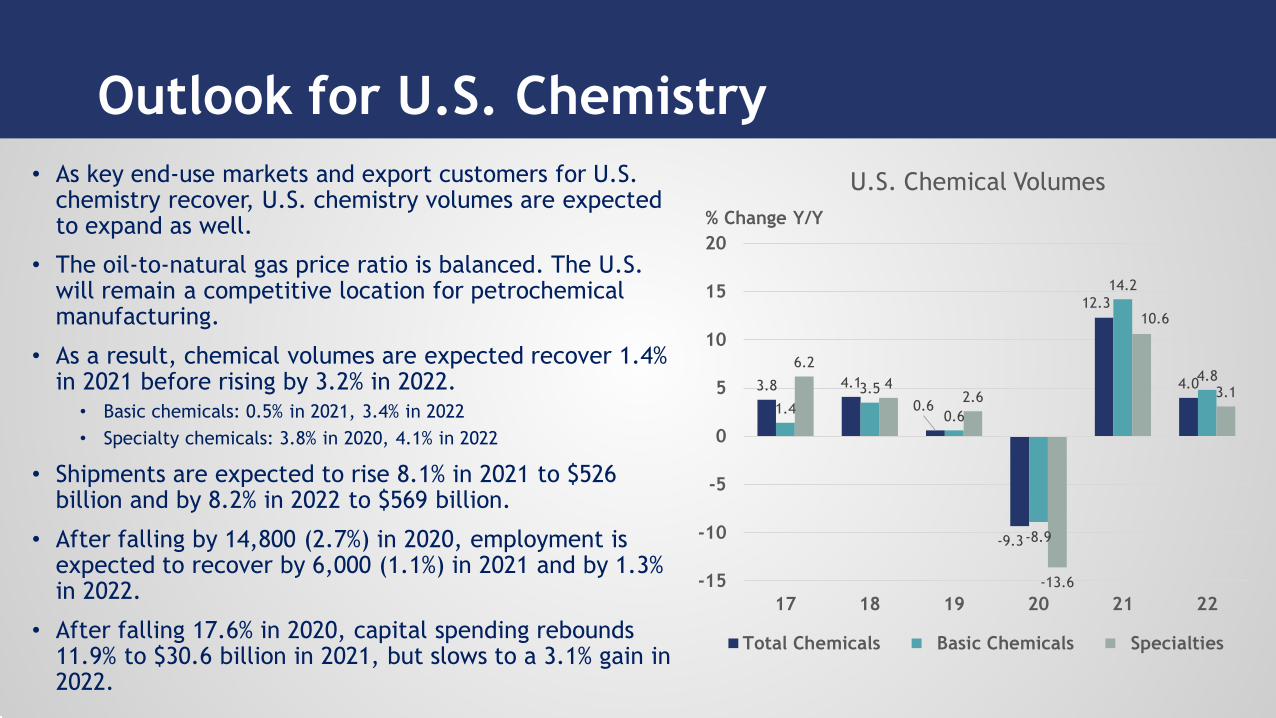
• As key end-use markets and export customers for U.S. chemistry recover, U.S. chemistry volumes are expected to expand as well.
• The oil-to-natural gas price ratio is balanced. The U.S. will remain a competitive location for petrochemical manufacturing.
• As a result, chemical volumes are expected recover 1.4% in 2021 before rising by 3.2% in 2022.
• Basic chemicals: 0.5% in 2021, 3.4% in 2022• Specialty chemicals: 3.8% in 2020, 4.1% in 2022
• Shipments are expected to rise 8.1% in 2021 to $526 billion and by 8.2% in 2022 to $569 billion.
• After falling by 14,800 (2.7%) in 2020, employment is expected to recover by 6,000 (1.1%) in 2021 and by 1.3% in 2022.
• After falling 17.6% in 2020, capital spending rebounds 11.9% to $30.6 billion in 2021, but slows to a 3.1% gain in 2022.
Outlook for U.S. Chemistry
3.8 4.1
0.6
-9.3
12.3
4.0
1.43.5
0.6
-8.9
14.2
4.86.2
42.6
-13.6
10.6
3.1
-15
-10
-5
0
5
10
15
20
17 18 19 20 21 22
U.S. Chemical Volumes
Total Chemicals Basic Chemicals Specialties
% Change Y/Y
-20-15-10-505
10152025
17 18 19 20 21 22 23 24 25Total Chemicals (ex. pharma) Agricultural Chemicals
Consumer Products Basic Chemicals
Specialties
% change Y/Y
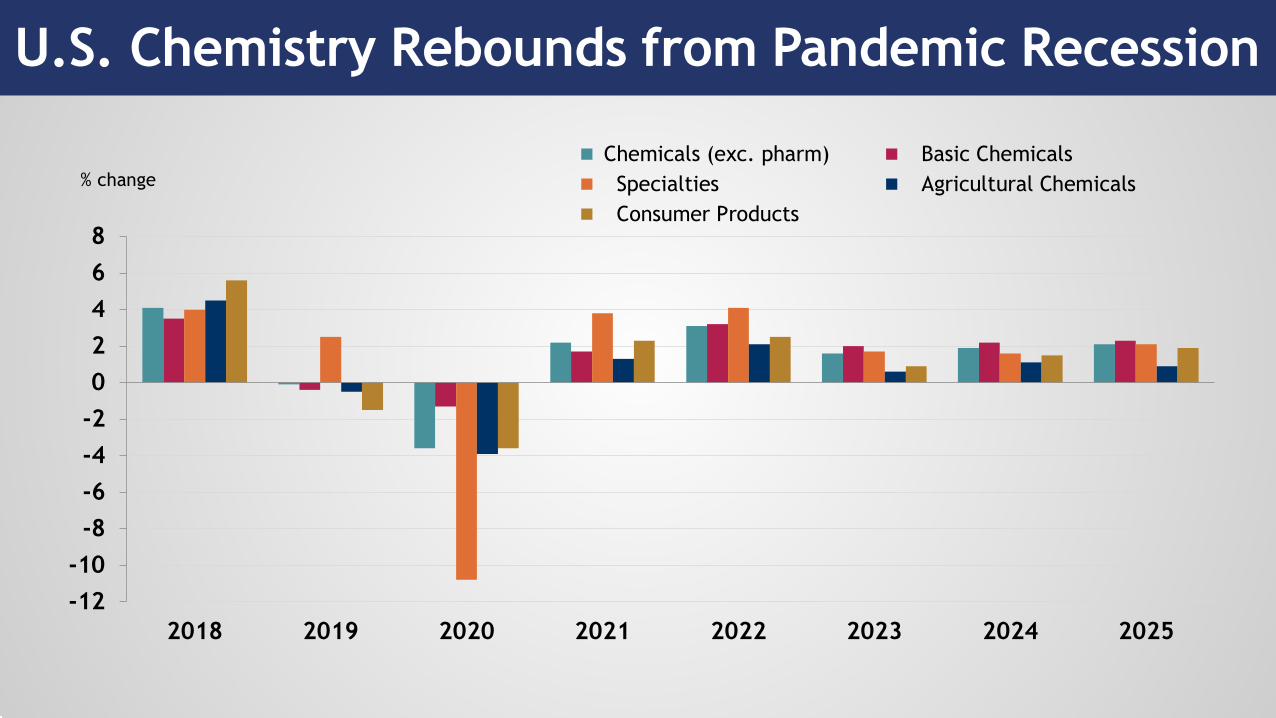
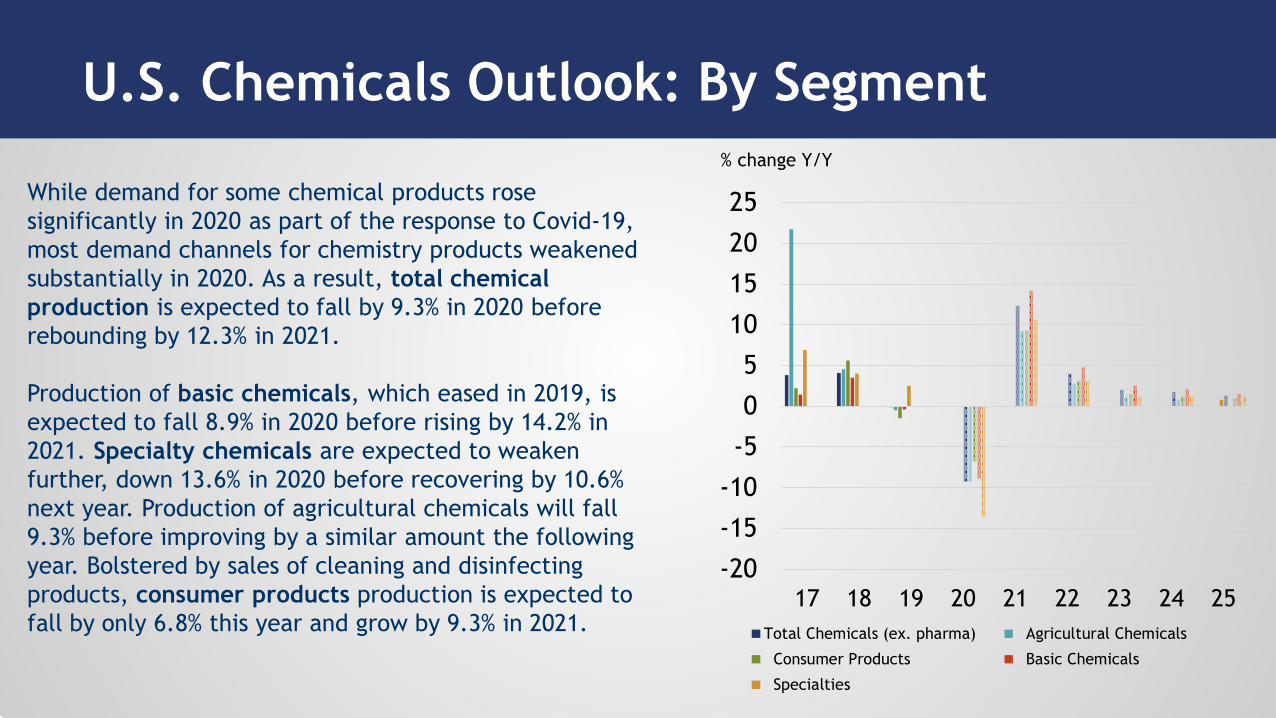
U.S. Chemicals Outlook: By Segment
While demand for some chemical products rose significantly in 2020 as part of the response to Covid-19, most demand channels for chemistry products weakened substantially in 2020. As a result, total chemical production is expected to fall by 9.3% in 2020 before rebounding by 12.3% in 2021.
Production of basic chemicals, which eased in 2019, is expected to fall 8.9% in 2020 before rising by 14.2% in 2021. Specialty chemicals are expected to weaken further, down 13.6% in 2020 before recovering by 10.6% next year. Production of agricultural chemicals will fall 9.3% before improving by a similar amount the following year. Bolstered by sales of cleaning and disinfecting products, consumer products production is expected to fall by only 6.8% this year and grow by 9.3% in 2021.
-20
-15
-10
-5
0
5
10
15
20
17 18 19 20 21 22 23 24 25Inorganics Bulk Petrochemicals & Organics
Plastic Resins Synthetic Rubber
Manufactured Fibers
% change Y/Y
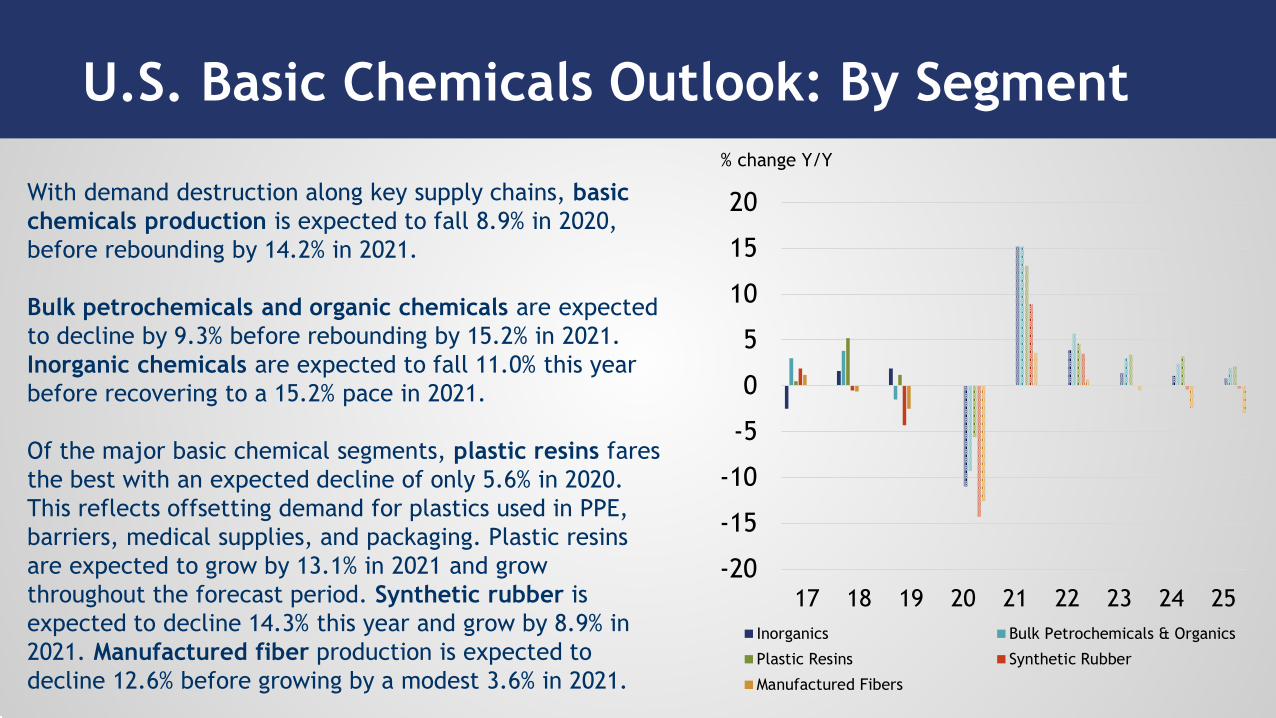
U.S. Basic Chemicals Outlook: By Segment
With demand destruction along key supply chains, basic chemicals production is expected to fall 8.9% in 2020, before rebounding by 14.2% in 2021.
Bulk petrochemicals and organic chemicals are expected to decline by 9.3% before rebounding by 15.2% in 2021. Inorganic chemicals are expected to fall 11.0% this year before recovering to a 15.2% pace in 2021.
Of the major basic chemical segments, plastic resins fares the best with an expected decline of only 5.6% in 2020. This reflects offsetting demand for plastics used in PPE, barriers, medical supplies, and packaging. Plastic resins are expected to grow by 13.1% in 2021 and grow throughout the forecast period. Synthetic rubber is expected to decline 14.3% this year and grow by 8.9% in 2021. Manufactured fiber production is expected to decline 12.6% before growing by a modest 3.6% in 2021.
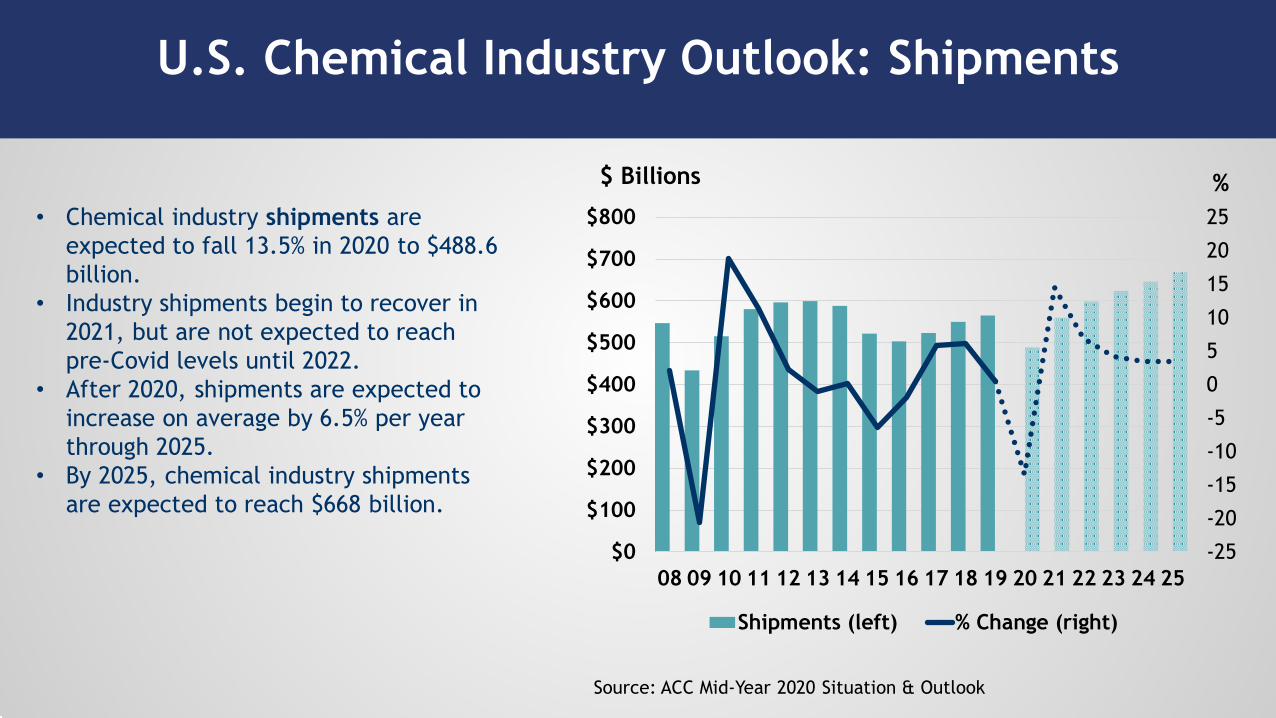
U.S. Chemical Industry Outlook: Shipments
-25
-20
-15
-10
-5
0
5
10
15
20
25
08 09 10 11 12 13 14 15 16 17 18 19 20 21 22 23 24 25$0
$100
$200
$300
$400
$500
$600
$700
$800
Shipments (left) % Change (right)
$ Billions %
Source: ACC Mid-Year 2020 Situation & Outlook
• Chemical industry shipments are expected to fall 13.5% in 2020 to $488.6 billion.
• Industry shipments begin to recover in 2021, but are not expected to reach pre-Covid levels until 2022.
• After 2020, shipments are expected to increase on average by 6.5% per year through 2025.
• By 2025, chemical industry shipments are expected to reach $668 billion.
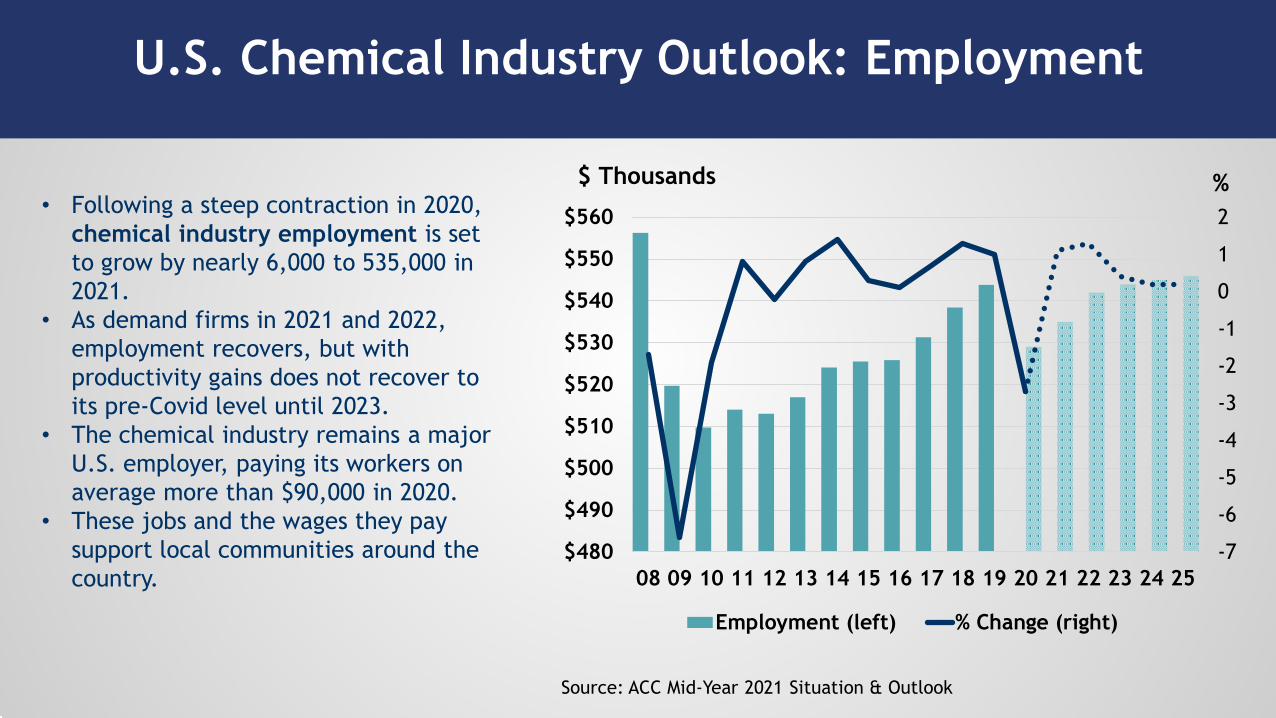
U.S. Chemical Industry Outlook: Employment
-7
-6
-5
-4
-3
-2
-1
0
1
2
08 09 10 11 12 13 14 15 16 17 18 19 20 21 22 23 24 25$480
$490
$500
$510
$520
$530
$540
$550
$560
Employment (left) % Change (right)
$ Thousands %
Source: ACC Mid-Year 2021 Situation & Outlook
• Following a steep contraction in 2020, chemical industry employment is set to grow by nearly 6,000 to 535,000 in 2021.
• As demand firms in 2021 and 2022, employment recovers, but with productivity gains does not recover to its pre-Covid level until 2023.
• The chemical industry remains a major U.S. employer, paying its workers on average more than $90,000 in 2020.
• These jobs and the wages they pay support local communities around the country.
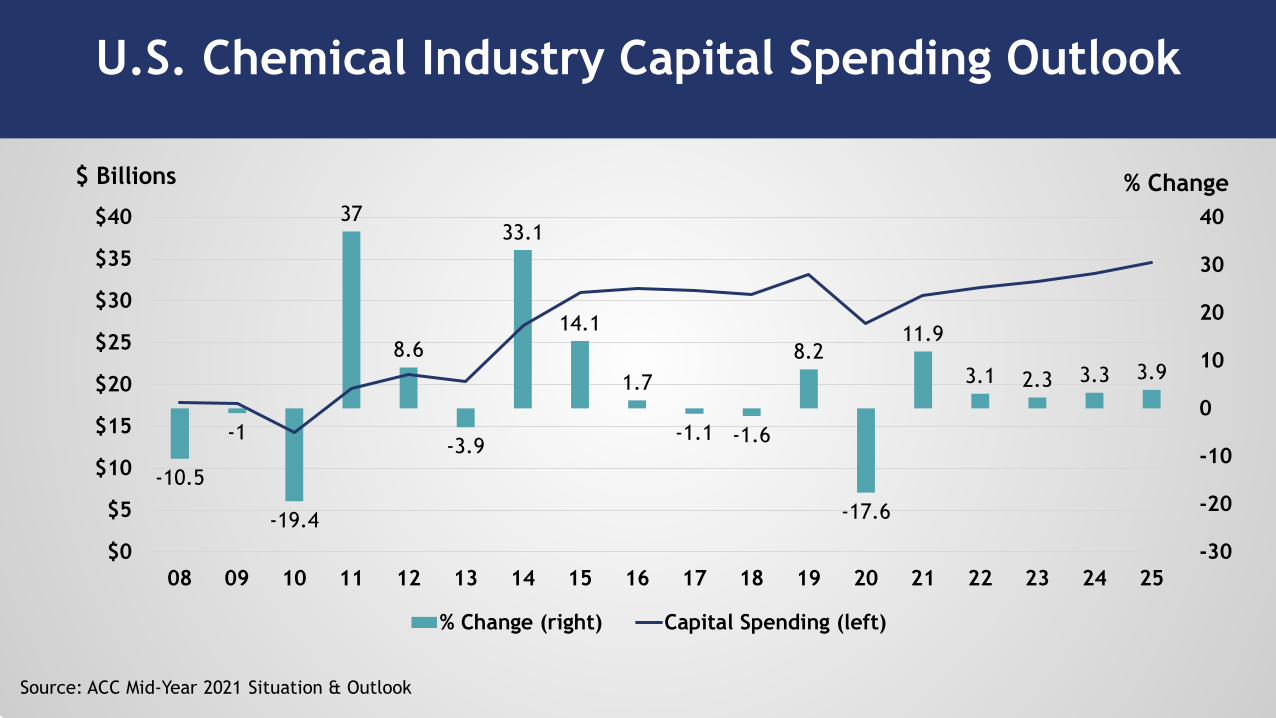
U.S. Chemical Industry Capital Spending Outlook
-10.5
-1
-19.4
37
8.6
-3.9
33.1
14.1
1.7
-1.1 -1.6
8.2
-17.6
11.9
3.1 2.3 3.3 3.9
-30
-20
-10
0
10
20
30
40
08 09 10 11 12 13 14 15 16 17 18 19 20 21 22 23 24 25$0
$5
$10
$15
$20
$25
$30
$35
$40
% Change (right) Capital Spending (left)
$ Billions % Change
Source: ACC Mid-Year 2021 Situation & Outlook
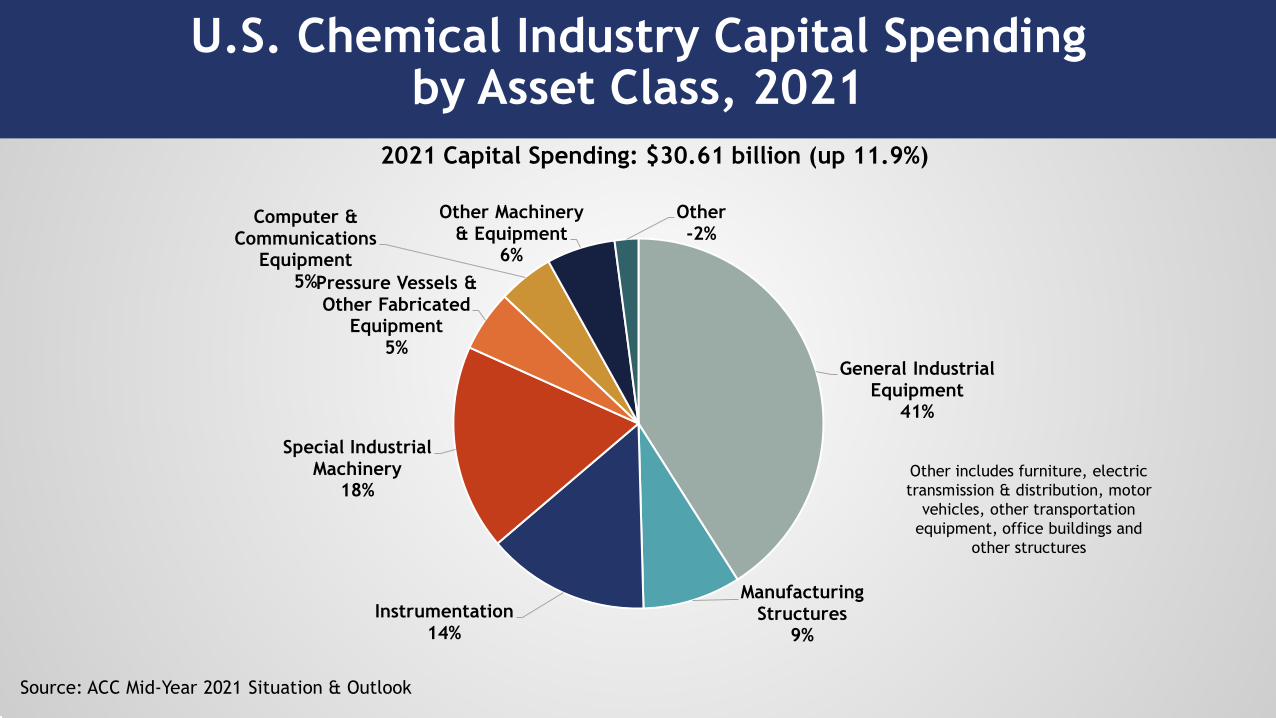
U.S. Chemical Industry Capital Spending by Asset Class, 2021
General Industrial Equipment
41%
Manufacturing Structures
9%Instrumentation
14%
Special Industrial Machinery
18%
Pressure Vessels & Other Fabricated
Equipment5%
Computer & Communications
Equipment5%
Other Machinery & Equipment
6%
Other-2%
Other includes furniture, electric transmission & distribution, motor
vehicles, other transportation equipment, office buildings and
other structures
Source: ACC Mid-Year 2021 Situation & Outlook
2021 Capital Spending: $30.61 billion (up 11.9%)
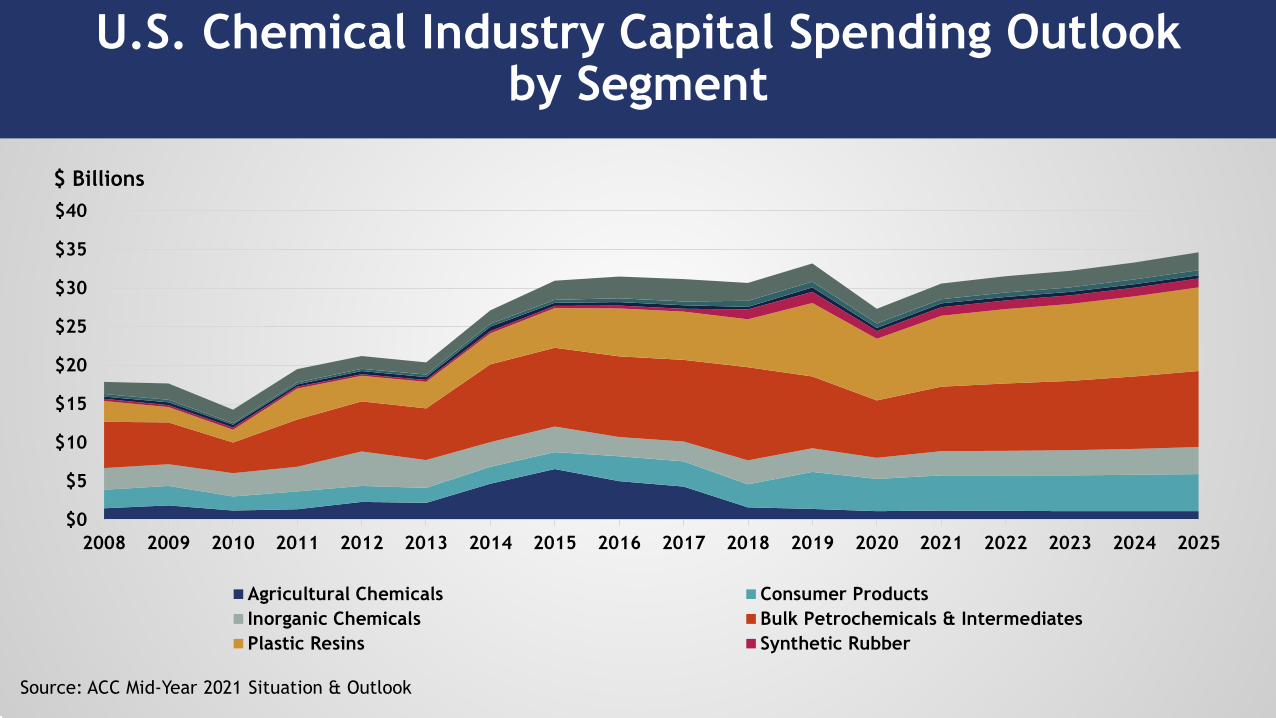
U.S. Chemical Industry Capital Spending Outlook by Segment
2008 2009 2010 2011 2012 2013 2014 2015 2016 2017 2018 2019 2020 2021 2022 2023 2024 2025$0
$5
$10
$15
$20
$25
$30
$35
$40
Agricultural Chemicals Consumer ProductsInorganic Chemicals Bulk Petrochemicals & IntermediatesPlastic Resins Synthetic Rubber
$ Billions
Source: ACC Mid-Year 2021 Situation & Outlook
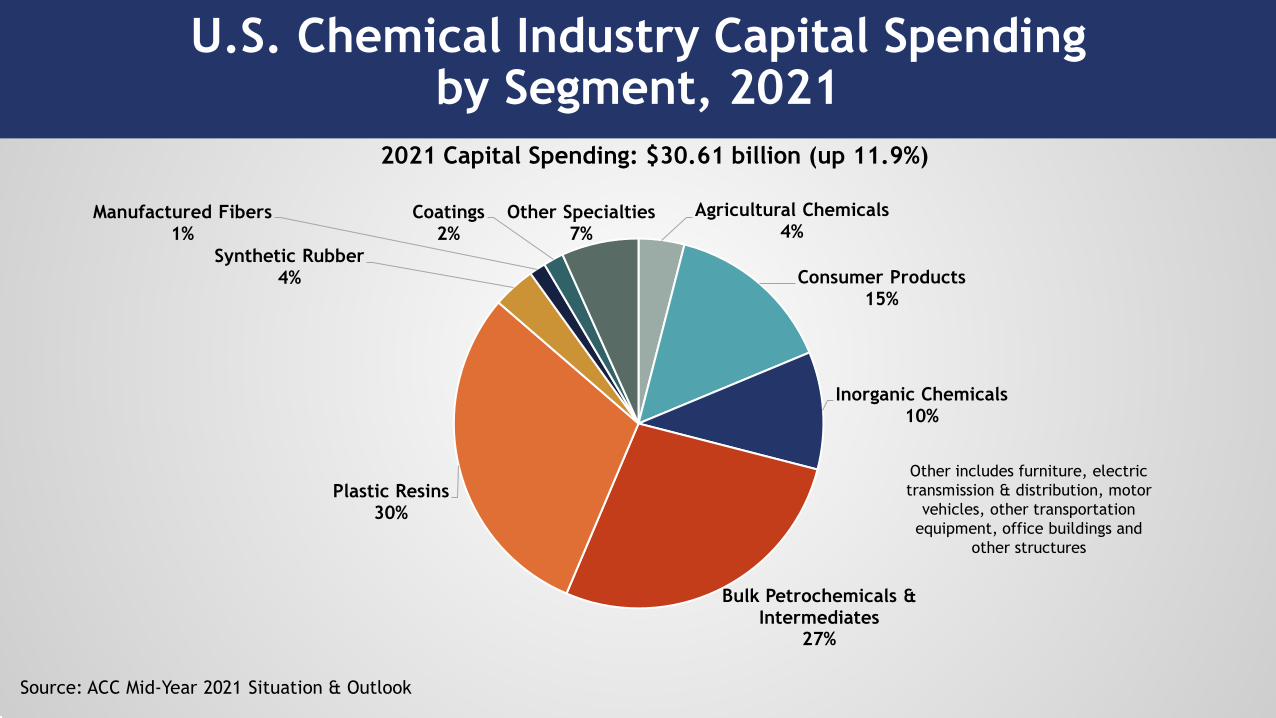
U.S. Chemical Industry Capital Spending by Segment, 2021
Agricultural Chemicals4%
Consumer Products15%
Inorganic Chemicals10%
Bulk Petrochemicals & Intermediates
27%
Plastic Resins30%
Synthetic Rubber4%
Manufactured Fibers1%
Coatings2%
Other Specialties7%
Other includes furniture, electric transmission & distribution, motor
vehicles, other transportation equipment, office buildings and
other structures
Source: ACC Mid-Year 2021 Situation & Outlook
2021 Capital Spending: $30.61 billion (up 11.9%)
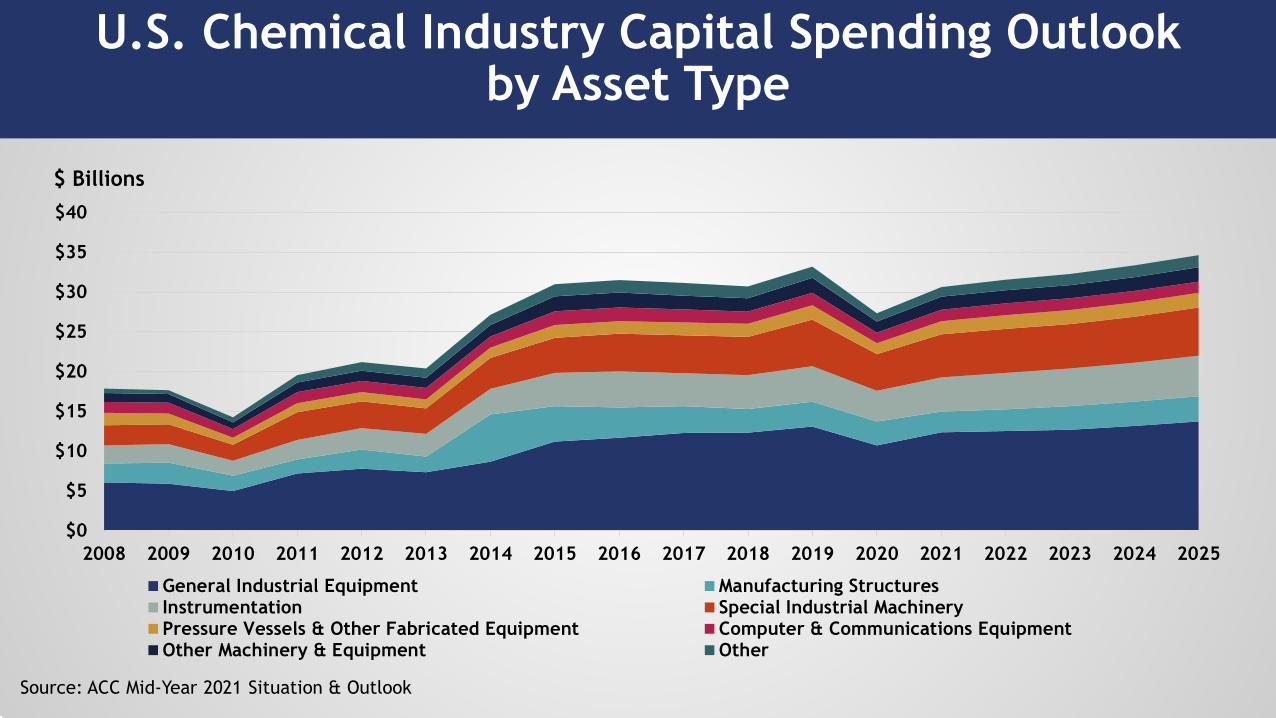
U.S. Chemical Industry Capital Spending Outlook by Asset Type
2008 2009 2010 2011 2012 2013 2014 2015 2016 2017 2018 2019 2020 2021 2022 2023 2024 2025$0
$5
$10
$15
$20
$25
$30
$35
$40
General Industrial Equipment Manufacturing StructuresInstrumentation Special Industrial MachineryPressure Vessels & Other Fabricated Equipment Computer & Communications EquipmentOther Machinery & Equipment Other
$ Billions
Source: ACC Mid-Year 2021 Situation & Outlook
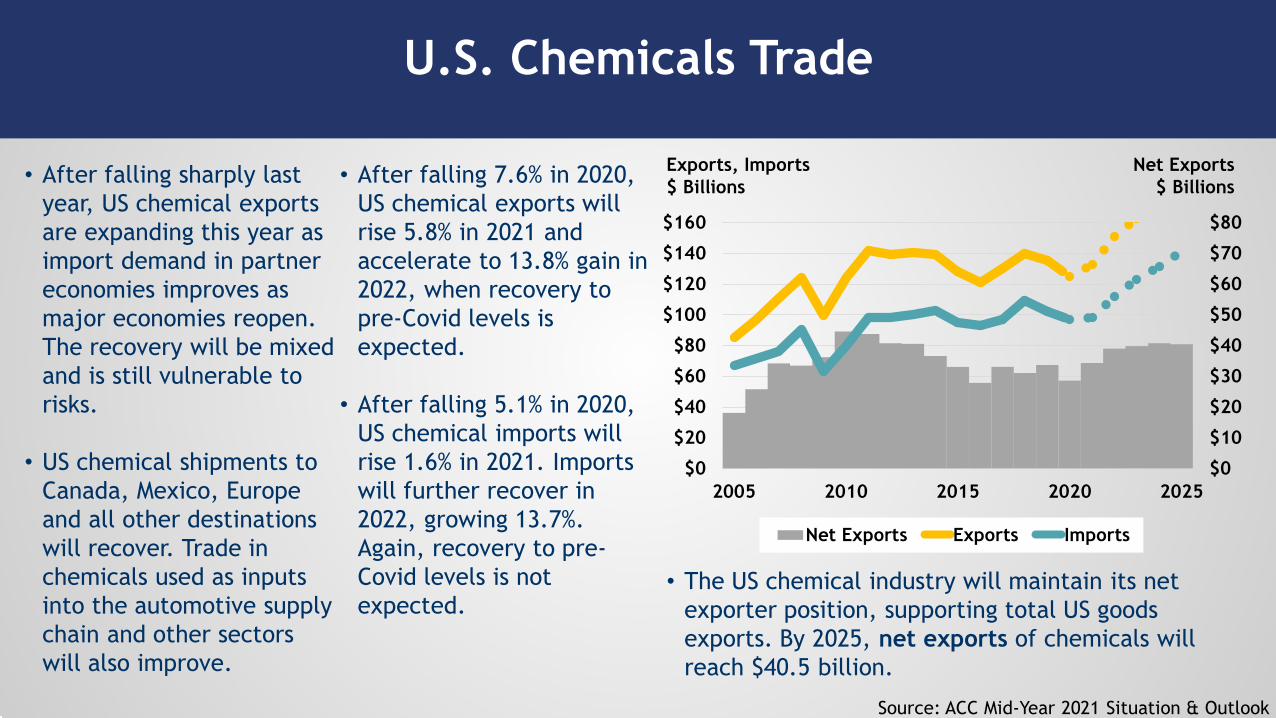
U.S. Chemicals Trade
Source: ACC Mid-Year 2021 Situation & Outlook
• After falling sharply last year, US chemical exports are expanding this year as import demand in partner economies improves as major economies reopen. The recovery will be mixed and is still vulnerable to risks.
• US chemical shipments to Canada, Mexico, Europe and all other destinations will recover. Trade in chemicals used as inputs into the automotive supply chain and other sectors will also improve.
• After falling 7.6% in 2020, US chemical exports will rise 5.8% in 2021 and accelerate to 13.8% gain in 2022, when recovery to pre-Covid levels is expected.
• After falling 5.1% in 2020, US chemical imports will rise 1.6% in 2021. Imports will further recover in 2022, growing 13.7%. Again, recovery to pre-Covid levels is not expected.
$0
$10
$20
$30
$40
$50
$60
$70
$80
$0
$20
$40
$60
$80
$100
$120
$140
$160
2005 2010 2015 2020 2025
Net Exports Exports Imports
Exports, Imports$ Billions
Net Exports$ Billions
• The US chemical industry will maintain its net exporter position, supporting total US goods exports. By 2025, net exports of chemicals will reach $40.5 billion.
Risks to Consider
• Vaccine distribution & efficacy issues, resurgence of pandemic (with new strain), or new virus
• Supply chain constraints along with increased demand as economies reopen, and loose monetary policy result in systemic inflation
• Trade tensions• Weather events, cybersecurity and similar shocks• Financial volatility• Credit cycle turn with pressure on riskier financial assets (high-yield
corporate debt, etc.) • Public sector debt in advanced nations and private sector debt
everywhere• Fed and other central bank policy errors • Geopolitical risks (South China Sea, Baltics/Other Eastern Europe,
Middle East, Korea, etc.) • That said, there are many risks to the upside risks…
For Further Information
Please feel free to address questions to:
Dr. Thomas Kevin SwiftChief Economist & Managing Director
American Chemistry CouncilEmail: [email protected]
Follow me on Twitter @DrTKSwift