Embed Size (px)
Citation preview


State of Rhode Island Highway Safety Performance Plan Federal Fiscal Year 2010
prepared for
U.S. Department of Transportation National Highway Traffic Safety Administration
developed and presented by
The Rhode Island Department of Transportation Office on Highway Safety Two Capitol Hill, Suite 106 Providence, Rhode Island 02903-1111
August 2009


State of Rhode Island Highway Safety Performance Plan FFY 2010
Office on Highway Safety i 7862.002
Table of Contents
1.0 Introduction to the Rhode Island Highway Safety Planning Process................ 1 1.1 Executive Summary .............................................................................................. 1 1.2 Mission Statement ................................................................................................. 3 1.3 Timeline and Process ............................................................................................ 4 1.4 Organization .......................................................................................................... 7
2.0 Highway Safety Performance Plan ........................................................................... 9 2.1 Highway Safety Problem Identification Process .............................................. 9 2.2 Rhode Island Highway Safety Problem Areas.................................................. 29 2.3 Rhode Island Highway Safety Goals.................................................................. 30
3.0 Highway Safety Plan: Program Areas for FFY 2010 .............................................. 37 3.1 Impaired Driving .................................................................................................. 37 3.2 Occupant Protection ............................................................................................. 49 3.3 Speed....................................................................................................................... 57 3.4 Young Drivers........................................................................................................ 62 3.5 Motorcycles ............................................................................................................ 70 3.6 Other Road Users .................................................................................................. 77 3.7 Traffic Records....................................................................................................... 84 3.8 Racial Profiling ...................................................................................................... 90 3.9 Planning and Administration.............................................................................. 95
4.0 State Certifications and Assurances.......................................................................... 99 4.1 Certifications and Assurances ............................................................................. 99 4.2 The Drug-free Workplace Act of 1988 (49 CFR Part 29 Subpart F) ................ 101 4.3 Buy America Act ................................................................................................... 102 4.4 Political Activity (Hatch Act) .............................................................................. 103 4.5 Certification Regarding Federal Lobbying ........................................................ 103 4.6 Restriction on State Lobbying.............................................................................. 104 4.7 Certification Regarding Debarment and Suspension ...................................... 104 4.8 Certification Regarding Debarment, Suspension, and Other Responsibility
Matters – Primary Covered Transactions .......................................................... 106 4.9 Instructions for Lower-Tier Certification........................................................... 106 4.10 Certification Regarding Debarment, Suspension, Ineligibility, and
Voluntary Exclusion – Lower-Tier Covered Transactions .............................. 108 4.11 Environmental Impact.......................................................................................... 108
5.0 Cost Summary............................................................................................................... 109

State of Rhode Island Highway Safety Performance Plan FFY 2010
Office on Highway Safety iii
List of Tables
1.1 Rhode Island Office on Highway Safety Annual Safety Planning Calendar ....... 4
2.1 Population of Rhode Island by County and Town 2008 ......................................... 11
2.2 Rhode Island Drivers, Vehicles, and Population 2003 to 2008................................ 13
2.3 Number of Rhode Island Drivers by Age and Gender in 2008 .............................. 14
2.4 Traffic Safety Trends in Rhode Island 1999 to 2009.................................................. 17
2.5 Rhode Island and New England Crash Conditions as Percent of Total Fatalities in 2007 ............................................................................................................ 24
2.6 Additional Traffic Safety Trends in Rhode Island 2002 to 2009 ............................. 25
2.7 Goals and Performance Measures .............................................................................. 31
3.1 BAC Test Results and Sex for Drivers or Motorcycle Operators Involved in Fatal Crashes 2008......................................................................................................... 40
3.2 Motor Vehicle Fatalities by Restraint System Use and Nonuse 2008 .................... 50
3.3 Speed-Related Fatalities by Posted Speed Limit ...................................................... 58
3.4 Drivers Involved in Fatal Crashes with Previous Speeding Convictions by Age Group and Gender (2003 to 2007) ...................................................................... 59
3.5 Young Drivers (Age 16 to 20) Involved in Fatal Crashes in Rhode Island, New England, and U.S. ................................................................................................ 62
3.6 Fatalities in Young Driver-Related Crashes: Young Drivers, Passengers of Young Drivers, and Other Road Users ...................................................................... 62
3.7 Fatalities and Licensed Drivers by Age 2008 ............................................................ 63
3.8 Top Five Cities/Towns for Motorcycle Crashes 2003 to 2007................................. 71
3.9 Top Five Cities/Towns by Pedestrian Crashes 2003 to 2007 .................................. 78
3.10 Pedestrian Fatalities by Age Group with BAC Test of .08 or Greater 2003 to 2007 ................................................................................................................................. 79
3.11 Top Five Cities/Towns for Bicycle Crashes 2003 to 2007 ........................................ 81
3.12 Fatalities and Serious Injuries Involving School Buses ........................................... 81


State of Rhode Island Highway Safety Performance Plan FFY 2010
Office on Highway Safety v
List of Figures
1.1 Rhode Island Department of Transportation Office on Highway Safety Organization ...................................................................................................... 8
2.1 Rhode Island Population Estimate 2008 .................................................................... 10
2.2 Rhode Island Drivers, Vehicles, and Population 2003 to 2008 (In Thousands) ...... 13
2.3 Percent of Rhode Island Fatal Crashes by Month-of-Year 2008 ............................. 15
2.4 Percent of Rhode Island Fatal Crashes by Day-of-Week 2008................................ 16
2.5 Percent of Rhode Island Fatal Crashes by Time-of-Day 2008................................. 16
2.6 Fatalities Actual.............................................................................................................. 18
2.7 Fatality Rate Per 100 Million VMT .............................................................................. 18
2.8 Serious Injuries Actual .................................................................................................. 19
2.9 Fatalities Involving Driver or Motorcycle Operator w/ ≥ .08 BAC Actual ........... 19
2.10 Unrestrained Passenger Vehicle Occupant Fatalities Actual .................................. 20
2.11 Speeding-Related Fatalities Actual ............................................................................. 20
2.12 Number of Motorcyclist Fatalities Actual .................................................................. 21
2.13 Unhelmeted Motorcycle Fatalities Actual .................................................................. 21
2.14 Drivers Age 20 or Younger Involved in Fatal Crashes Actual ................................ 22
2.15 Pedestrian Fatalities Actual .......................................................................................... 22
2.16 Percent Observed Belt Use for Passenger Vehicles – Front Seat Outboard Occupants....................................................................................................................... 23
2.17 Rhode Island, New England, and United States Fatality Rate Per 100 Million VMT...................................................................................................... 24
2.18 Rhode Island Traffic Deaths 2003 to 2008 .................................................................. 29
State of Rhode Island Highway Safety Performance Plan FFY 2010
vi Office on Highway Safety
List of Figures (continued)
3.1 Driving Fatalities Involving Known BAC ≥ .08 Rhode Island Compared to the United States .................................................................. 37
3.2 Alcohol-Related Fatalities (BAC ≥ .01)....................................................................... 38
3.3 Persons Killed in Alcohol-Related Crashes Involving Known BAC ≥ .08 2008 ... 38
3.4 Observed Seat Belt Use Rate Rhode Island and Nationwide ....................................... 49
3.5 Restraint Nonuse for Rhode Island Motor Vehicle Fatalities and Serious Injuries ............................................................................................................................ 50
3.6 Number of Restraint Nonuse Fatalities by Age Group 2007 .................................. 51
3.7 Number of Restraint Nonuse Fatalities by Age Group 2008 .................................. 51
3.8 Percent of Fatalities Resulting from Crashes Involving Speeding Rhode Island, New England, and U.S. ............................................................................ 58
3.9 Age Group as Percent of Fatalities and Percent of Licensed Drivers 2008 ........... 64
3.10 Motorcyclist Fatalities as Percent of Total Fatalities Rhode Island, New England, and U.S. ............................................................................ 71
3.11 Age of Fatally Injured Motorcycle Operators with Restraint Nonuse 2007 ......... 72
3.12 Total Crashes and Serious Injuries Involving Pedestrians...................................... 77
3.13 Pedestrian Fatalities as a Percent of Total Fatalities Rhode Island Compared to United States ................................................................................................................... 78
3.14 Total Crashes and Serious Injuries Involving Bicyclists.......................................... 80
3.15 Bicyclist Involved Fatalities as Percent of Total Fatalities Rhode Island Compared to United States ........................................................................ 80
State of Rhode Island Highway Safety Performance Plan FFY 2010
Office on Highway Safety vii
Acronym Guide
American Automobile Association, Southern New England (AAASNE)
Blood Alcohol Concentration (BAC)
Child Passenger Safety (CPS)
Click It or Ticket (CIOT)
Commercial Drivers License (CDL)
Community College of Rhode Island (CCRI)
Connecting for Children and Families, Inc. (CCF)
Corrective Action Plan (CAP)
Cranston Child Opportunity Zone (COZ)
Crash Outcome Data Evaluation System (CODES)
Critical Analysis Reporting Environment (CARE)
Driving Under the Influence (DUI)
Driving While Intoxicated (DWI)
Drug Recognition Expert (DRE)
Electronic Accident Reporting System (EARS)
Enforcing the Underage Drinking Laws (EUDL)
Fatality Analysis Reporting System (FARS)
Federal Fiscal Year (FFY)
Federal Highway Administration (FHWA)
Federal Motor Carrier Safety Administration (FMCSA)
Graduated Drivers License (GDL)
State of Rhode Island Highway Safety Performance Plan FFY 2010
viii Office on Highway Safety
Acronym Guide (continued)
High Visibility Enforcement (HVE)
Highway Safety Grant application (HS-1)
Highway Safety Performance Plan (HSPP)
Information Management Corporation (IMC)
Institute for Labor Studies and Research (ILSR)
Law Enforcement Highway Safety Training Coordinator (LEHSTC)
Law Enforcement Liaison (LEL)
Memorandum of Understanding (MOU)
Mothers Against Drunk Driving (MADD)
National Highway Traffic Safety Administration (NHTSA)
National Occupant Protection Use Survey (NOPUS)
Office on Highway Safety (OHS)
Performance Enhancement Plan (PEP)
Public Relations Society of America (PRSA)
Request for Proposals (RFP)
Rhode Island Department of Corrections (DOC)
Rhode Island Department of Mental Health, Retardation, and Hospitals (MHRH)
Rhode Island Department of Transportation (RIDOT)
Rhode Island Division of Motor Vehicles (DMV)
Rhode Island Interscholastic League (RIIL)
Rhode Island State Police (RISP)
Safe, Accountable, Flexible, and Efficient Transportation Equity Act: A Legacy for Users (SAFETEA-LU)

State of Rhode Island Highway Safety Performance Plan FFY 2010
Office on Highway Safety ix
Acronym Guide (continued)
Standardized Field Sobriety Testing (SFST)
Strategic Highway Safety Plan (SHSP)
Students Against Destructive Decisions (SADD)
Traffic Occupant Protection Strategies (TOPS)
Traffic Records Coordinating Committee (TRCC)
Traffic Safety Resource Prosecutor (TSRP)
University of Rhode Island (URI)
Variable Message Sign (VMS)
Vehicle Miles Traveled (VMT)

State of Rhode Island Highway Safety Performance Plan FFY 2010
Office on Highway Safety 1
1.0 Introduction to the Rhode Island Highway Safety Planning Process
1.1 Executive Summary
This Rhode Island Highway Safety Performance Plan (HSPP) for Federal Fiscal Year (FFY) 2010 serves as the State of Rhode Island’s application to the National Highway Traffic Safety Administration (NHTSA) for Federal funds available under Section 402 of the Safe, Accountable, Flexible, and Efficient Transportation Equity Act: A Legacy for Users (SAFETEA-LU). The Rhode Island Department of Transportation (RIDOT) Office on Highway Safety’s (OHS) goals, performance measures, and strategies related to the program areas are described in this plan.
To identify the issues to be addressed in the FFY 2010 highway safety program, OHS relied primarily on 2003 to 2007 trend data, and, whenever possible, also provided 2008 data points. Note all 2008 data provided in this report is preliminary and subject to change.
When assessing safety needs and programming potential, it is important to understand how Rhode Island differs from the nation. The state population and annual number of fatalities in Rhode Island are relatively low compared to the nation. As such, one fatality can significantly impact a percentage. Interpretation of increases and decreases in percentages, particularly from one year to the next, must be carefully examined. Therefore, whenever possible, raw numbers, percentages, and rates as well as fatality and serious injury (defined for the purposes of this plan as “incapacitating injuries”) data (when available) are presented. Based on this analysis, the following problem areas will be addressed through the HSPP:
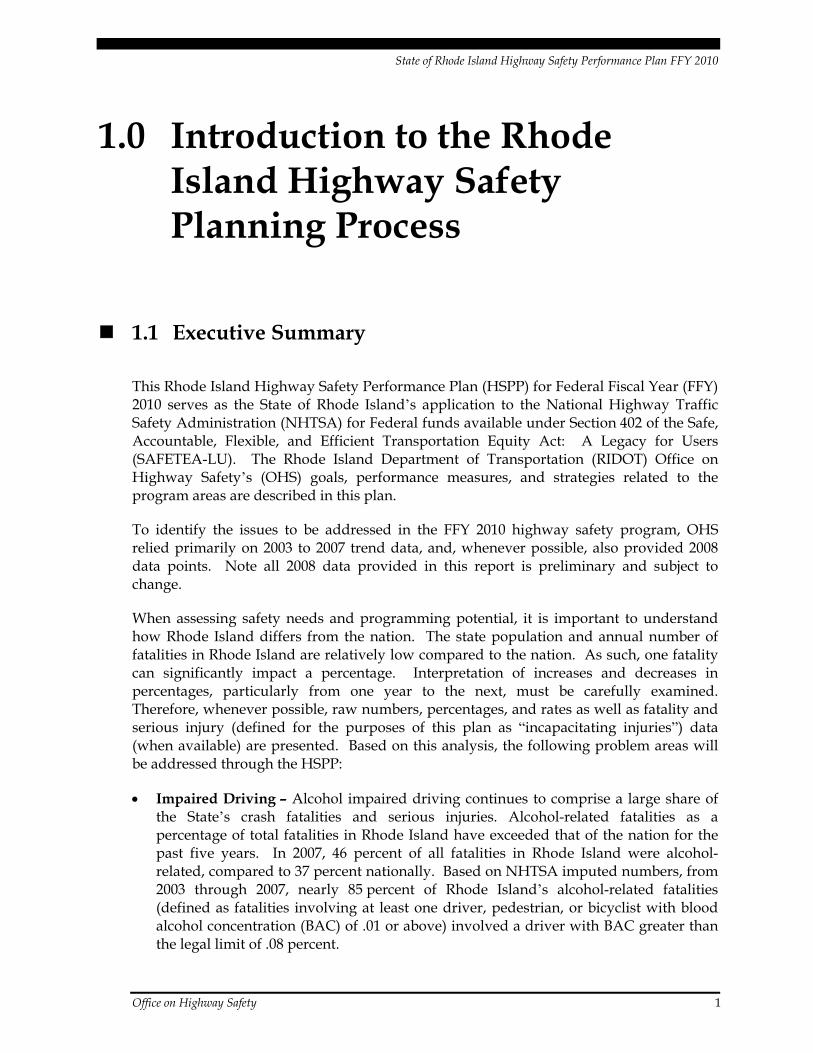
• Impaired Driving – Alcohol impaired driving continues to comprise a large share of the State’s crash fatalities and serious injuries. Alcohol-related fatalities as a percentage of total fatalities in Rhode Island have exceeded that of the nation for the past five years. In 2007, 46 percent of all fatalities in Rhode Island were alcohol-related, compared to 37 percent nationally. Based on NHTSA imputed numbers, from 2003 through 2007, nearly 85 percent of Rhode Island’s alcohol-related fatalities (defined as fatalities involving at least one driver, pedestrian, or bicyclist with blood alcohol concentration (BAC) of .01 or above) involved a driver with BAC greater than the legal limit of .08 percent.
State of Rhode Island Highway Safety Performance Plan FFY 2010
2 Office on Highway Safety
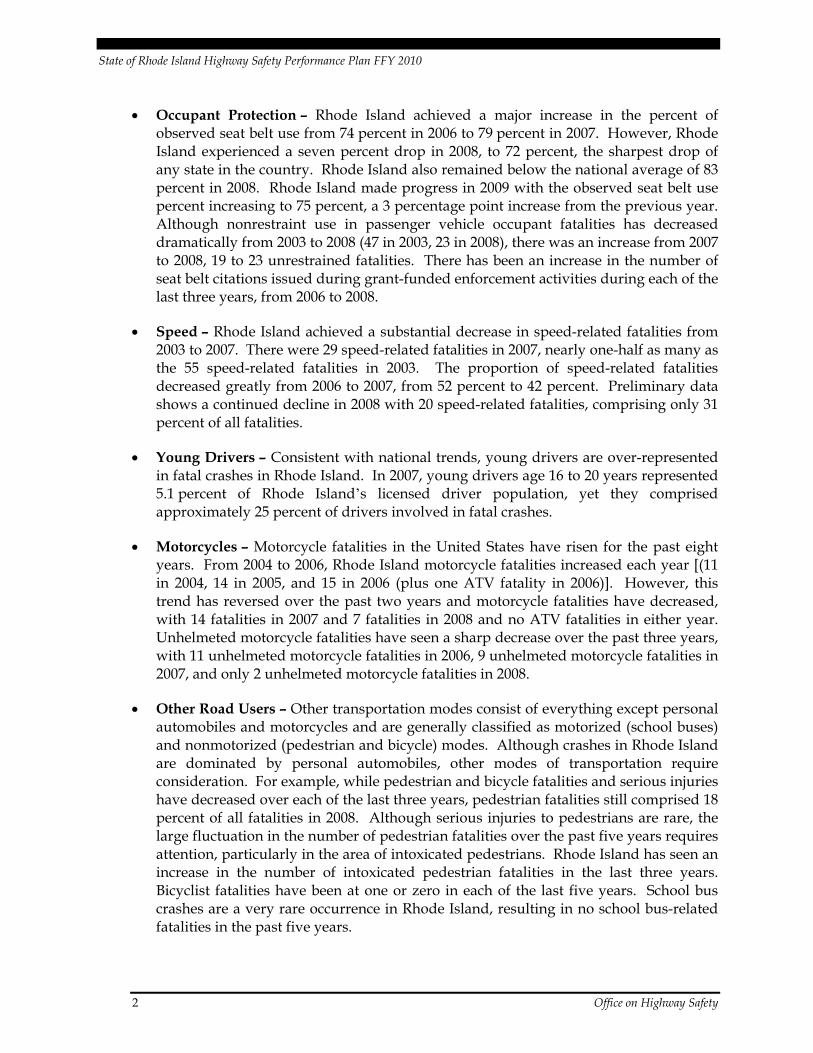
• Occupant Protection – Rhode Island achieved a major increase in the percent of observed seat belt use from 74 percent in 2006 to 79 percent in 2007. However, Rhode Island experienced a seven percent drop in 2008, to 72 percent, the sharpest drop of any state in the country. Rhode Island also remained below the national average of 83 percent in 2008. Rhode Island made progress in 2009 with the observed seat belt use percent increasing to 75 percent, a 3 percentage point increase from the previous year. Although nonrestraint use in passenger vehicle occupant fatalities has decreased dramatically from 2003 to 2008 (47 in 2003, 23 in 2008), there was an increase from 2007 to 2008, 19 to 23 unrestrained fatalities. There has been an increase in the number of seat belt citations issued during grant-funded enforcement activities during each of the last three years, from 2006 to 2008.
• Speed – Rhode Island achieved a substantial decrease in speed-related fatalities from 2003 to 2007. There were 29 speed-related fatalities in 2007, nearly one-half as many as the 55 speed-related fatalities in 2003. The proportion of speed-related fatalities decreased greatly from 2006 to 2007, from 52 percent to 42 percent. Preliminary data shows a continued decline in 2008 with 20 speed-related fatalities, comprising only 31 percent of all fatalities.
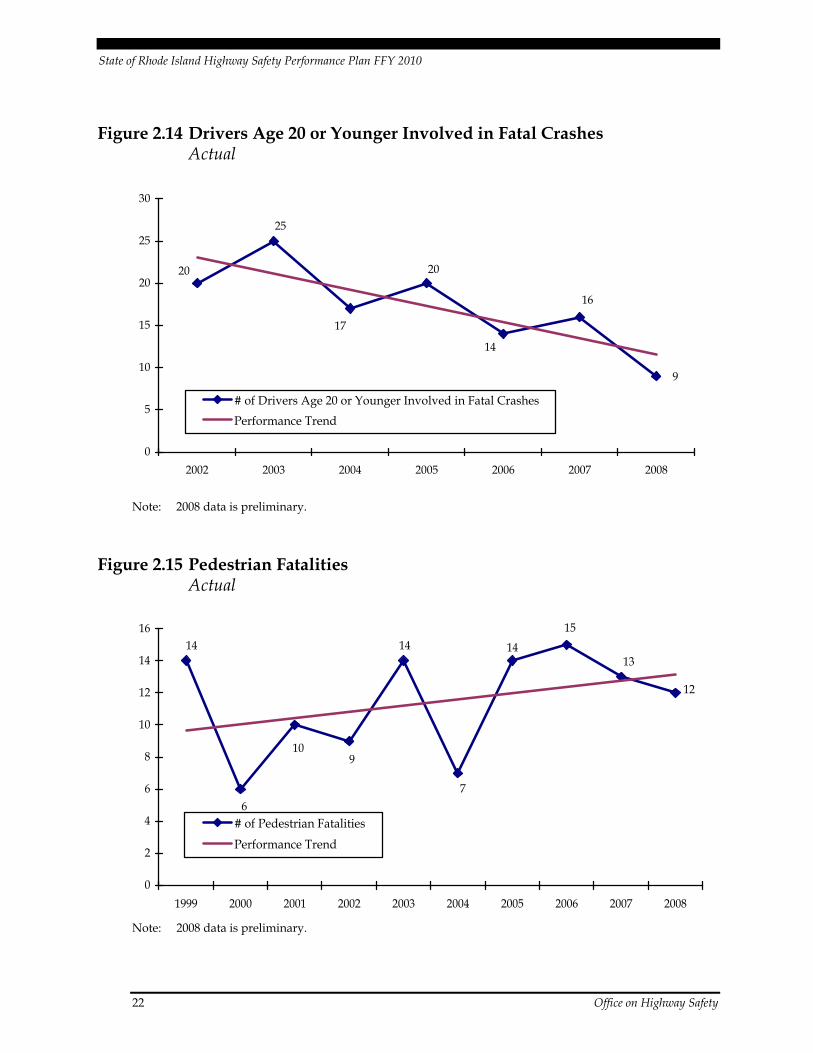
• Young Drivers – Consistent with national trends, young drivers are over-represented in fatal crashes in Rhode Island. In 2007, young drivers age 16 to 20 years represented 5.1 percent of Rhode Island’s licensed driver population, yet they comprised approximately 25 percent of drivers involved in fatal crashes.
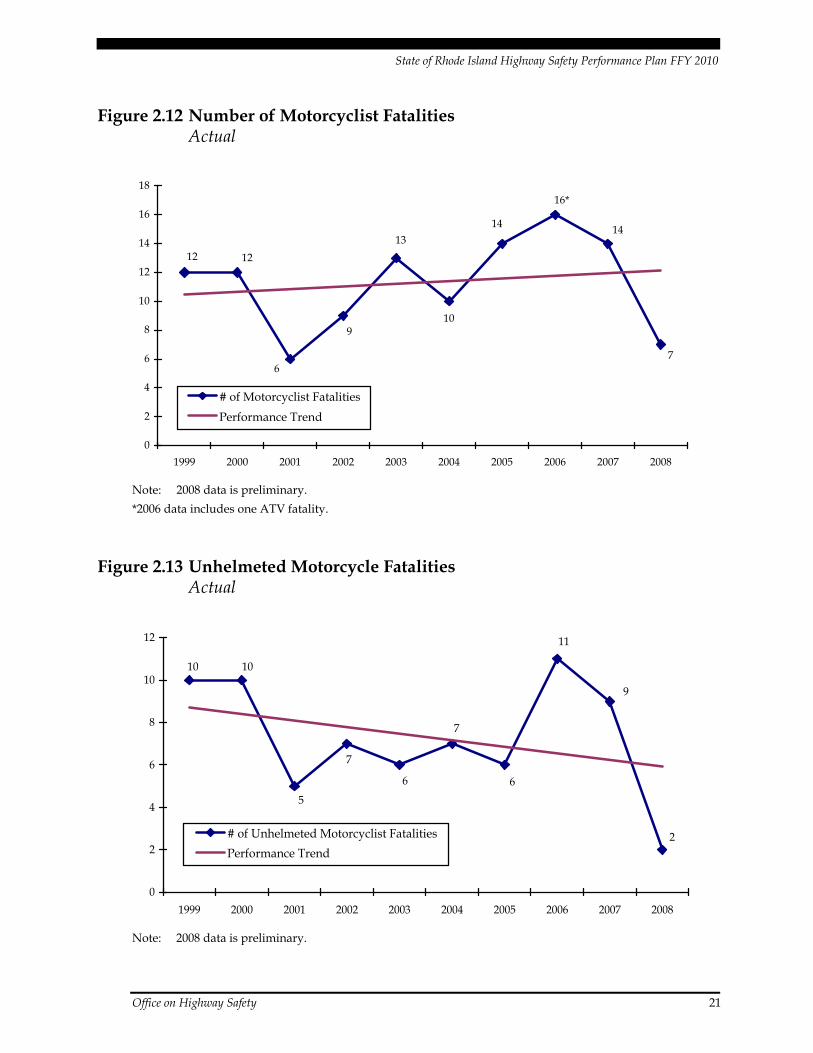
• Motorcycles – Motorcycle fatalities in the United States have risen for the past eight years. From 2004 to 2006, Rhode Island motorcycle fatalities increased each year [(11 in 2004, 14 in 2005, and 15 in 2006 (plus one ATV fatality in 2006)]. However, this trend has reversed over the past two years and motorcycle fatalities have decreased, with 14 fatalities in 2007 and 7 fatalities in 2008 and no ATV fatalities in either year. Unhelmeted motorcycle fatalities have seen a sharp decrease over the past three years, with 11 unhelmeted motorcycle fatalities in 2006, 9 unhelmeted motorcycle fatalities in 2007, and only 2 unhelmeted motorcycle fatalities in 2008.
• Other Road Users – Other transportation modes consist of everything except personal automobiles and motorcycles and are generally classified as motorized (school buses) and nonmotorized (pedestrian and bicycle) modes. Although crashes in Rhode Island are dominated by personal automobiles, other modes of transportation require consideration. For example, while pedestrian and bicycle fatalities and serious injuries have decreased over each of the last three years, pedestrian fatalities still comprised 18 percent of all fatalities in 2008. Although serious injuries to pedestrians are rare, the large fluctuation in the number of pedestrian fatalities over the past five years requires attention, particularly in the area of intoxicated pedestrians. Rhode Island has seen an increase in the number of intoxicated pedestrian fatalities in the last three years. Bicyclist fatalities have been at one or zero in each of the last five years. School bus crashes are a very rare occurrence in Rhode Island, resulting in no school bus-related fatalities in the past five years.

State of Rhode Island Highway Safety Performance Plan FFY 2010
Office on Highway Safety 3
• Traffic Records – A Highway Safety and Traffic Records Coordinating Committee (TRCC) has been working on the multiyear Highway Safety Data and Traffic Records System Improvement Plan. This is technically the last year of the Section 408 grant. Congress will provide the State with further direction for continuation of this program.
• Racial Profiling – The act of racial profiling affects both law enforcement and the community at large by undermining the civil rights of everyone; this creates mistrust with the majority of law enforcement personnel who are enforcing the law in an equitable manner. The State of Rhode Island has received racial profiling monies (Section 1906) as an assurance state for two years under the SAFETEA-LU legislation. OHS is utilizing these funds to revise the traffic stop form to include a passenger eth-nicity module; equip law enforcement vehicles with computers and printers to assist in collecting this data, in conjunction with implementation of the e-citation program; hire an accredited public or private college/university/research institution to collect, analyze and report the data from all the law enforcement agencies and make recommendations from the results; conduct Professional Traffic Stop Trainings; generate programs to enhance law enforcement and minority community involvement and communication and continue outreach to minority populations for all major OHS campaigns.
• Planning and Administration – The OHS will serve as the primary agency responsible for insuring that highway safety concerns for Rhode Island are identified and addressed through the development and implementation of appropriate programs.
1.2 Mission Statement
The OHS is the agency responsible for implementing Federally funded highway safety projects in Rhode Island. As a fundamental component of improving the quality of life for the citizens and visitors of the State, the mission of the OHS consists of two goals:
1. To reduce the number of fatalities and serious injuries on Rhode Island’s roadways; and
2. To reduce the number of traffic crashes and the severity of their consequences.
The OHS provides the required resources to plan and carry out activities to fulfill this mission. To ensure effectiveness, relationships are developed and maintained with advocacy groups, citizens, community safety groups, complementary state and Federal agencies, and local and state police departments. The OHS also conducts data analysis to monitor crash trends in the State and to ensure that state and Federal resources target the areas of greatest need. The
(Left to right) James Barden, Despina Metakos, Janis Loiselle, Sharon Bazor, Kathy Smith, and Dan
DiBiasio of OHS
State of Rhode Island Highway Safety Performance Plan FFY 2010
4 Office on Highway Safety
OHS also is an active participant in the implementation of the State’s Strategic Highway Safety Plan (SHSP), providing expertise related to driver behavioral issues, education, and enforcement-related countermeasures. The OHS will work closely within RIDOT to ensure coordination between the HSPP and the SHSP, ideally resulting in one comprehensive and strategic highway safety program for the State.
The OHS establishes and implements a comprehensive program to accomplish its goals effectively. The Highway Safety Performance Plan for Federal Fiscal Year 2010 outlines the process used to identify specific highway safety problem areas, including the development of countermeasures to correct those problems, and processes to monitor the performance of those countermeasures. Section 3.0 presents the priority focus areas, including proposed strategies and programming to meet the Office’s safety goals.
1.3 Timeline and Process
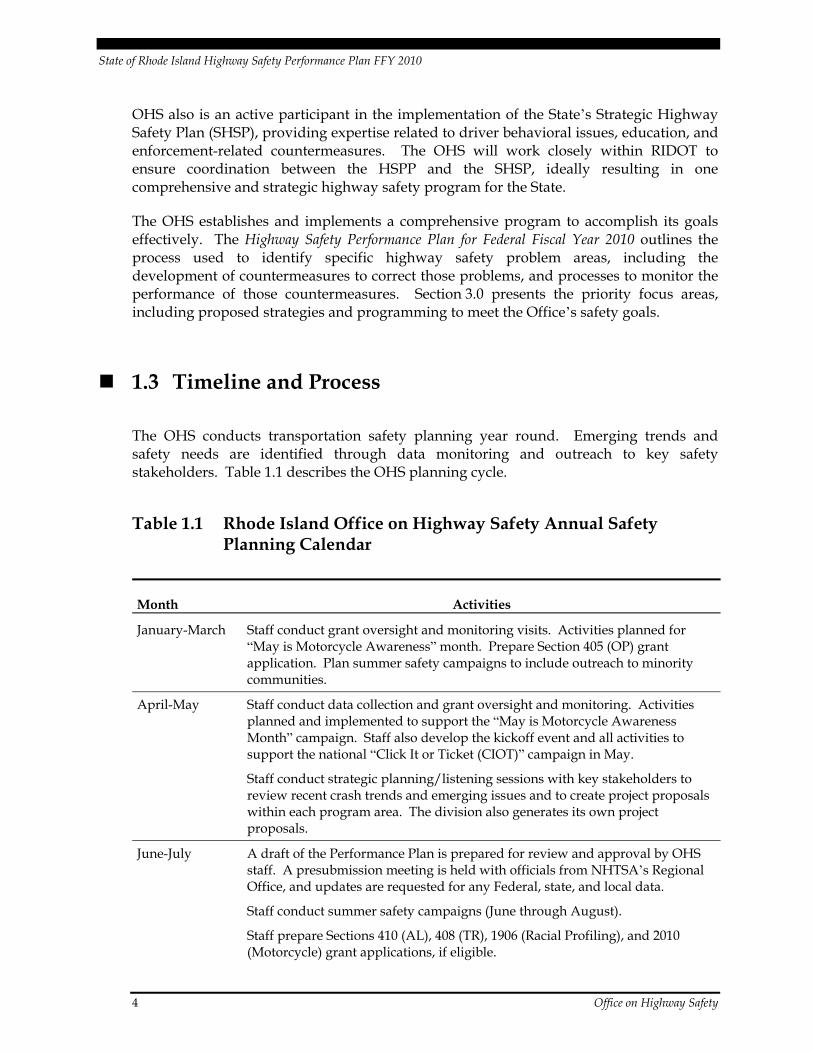
The OHS conducts transportation safety planning year round. Emerging trends and safety needs are identified through data monitoring and outreach to key safety stakeholders. Table 1.1 describes the OHS planning cycle.
Table 1.1 Rhode Island Office on Highway Safety Annual Safety Planning Calendar
Month Activities
January-March Staff conduct grant oversight and monitoring visits. Activities planned for “May is Motorcycle Awareness” month. Prepare Section 405 (OP) grant application. Plan summer safety campaigns to include outreach to minority communities.
April-May Staff conduct data collection and grant oversight and monitoring. Activities planned and implemented to support the “May is Motorcycle Awareness Month” campaign. Staff also develop the kickoff event and all activities to support the national “Click It or Ticket (CIOT)” campaign in May.
Staff conduct strategic planning/listening sessions with key stakeholders to review recent crash trends and emerging issues and to create project proposals within each program area. The division also generates its own project proposals.
June-July A draft of the Performance Plan is prepared for review and approval by OHS staff. A presubmission meeting is held with officials from NHTSA’s Regional Office, and updates are requested for any Federal, state, and local data.
Staff conduct summer safety campaigns (June through August).
Staff prepare Sections 410 (AL), 408 (TR), 1906 (Racial Profiling), and 2010 (Motorcycle) grant applications, if eligible.

State of Rhode Island Highway Safety Performance Plan FFY 2010
Office on Highway Safety 5
Table 1.1 Rhode Island Office on Highway Safety Annual Safety Planning Calendar (continued)
Month Activities June-July (continued)
Staff develops the kickoff event and all activities to support the national “Over the Limit, Under Arrest” campaign, conducted in late August through Labor Day.
August The final Performance Plan is submitted to NHTSA and the Federal Highway Administration (FHWA). Meetings are held with potential grantees.
Summer safety campaigns are concluded.
September Request for Proposals (RFP) and applications for Grant Funding (HS-1) are issued/received based on availability of Federal funding. FFY 2010 grants and contracts are finalized.
October Work is begun on the FFY 2009 Annual Report.
November-December
The FFY 2009 Annual Report is finalized. The OHS administers closeout of the prior fiscal year. OHS collects and reviews reports from its grantees. Occasionally, OHS revises grant applications and awards with its grantees based on the availability/timeliness of Federal funding.
Strategic Partners
During this planning cycle OHS conducted a safety stakeholder listening session to gather input on safety problems and effective countermeasures being implemented by other agencies. Opportunities to enhance partnerships and collaboration also were identified. The list of invited stakeholders is provided below.
• American Automobile Association, Southern New England (AAASNE); • Community College of Rhode Island (CCRI); • Connecting for Children and Families, Inc. – Woonsocket Safe Communities (CCF); • Cranston Child Opportunity Zone (COZ); • Institute for Labor Studies and Research (ILSR); • Mothers Against Drunk Driving (MADD); • Progreso Latino, Inc.; • Rhode Island Department of Administration, Division of Motor Vehicles (DMV); • Rhode Island Department of Health – Prevention & Control; • Rhode Island Department of Mental Health, Retardation, and Hospitals (MHRH); • Rhode Island Hospital Injury Prevention Center; • Rhode Island Hospitality & Tourism Association – RI Hospitality Association
Education Foundation;
State of Rhode Island Highway Safety Performance Plan FFY 2010
6 Office on Highway Safety
• Rhode Island Motorcycle Association; • Rhode Island Municipal Police Academy; • Rhode Island Office of the Attorney General; • Rhode Island Police Chiefs Association (RIPCA); • Rhode Island State Police (RISP); and • Urban League of Rhode Island.
In addition to these stakeholders, the OHS works with numerous other agencies and organizations throughout the year. These partners are noted below and in Section 3.0.
• 38 local police departments; • Enforcing the Underage Drinking Laws (EUDL) Advisory Committee; • Federal Highway Administration (FHWA); • Federal Motor Carrier Safety Administration (FMCSA); • Judiciary of Rhode Island; • Motorcycle retail and repair representatives; • National Highway Traffic Safety Administration (NHTSA); • Rhode Island Association of Independent Insurers; • Rhode Island Department of Corrections (DOC); • Rhode Island Interscholastic League (RIIL); • Rhode Island Safe Kids Coalition; • Rhode Island Traffic Tribunal; • Statewide Substance Abuse Task Forces; • Students Against Destructive Decisions (SADD); and • University of Rhode Island (URI).
Grant Funding Process
Currently, there are two methods for awarding a grantee funding for projects that support OHS efforts to reduce the number of fatalities and serious injuries on Rhode Island’s roadways: either through a Highway Safety Grant application (HS-1) or response to an RFP.
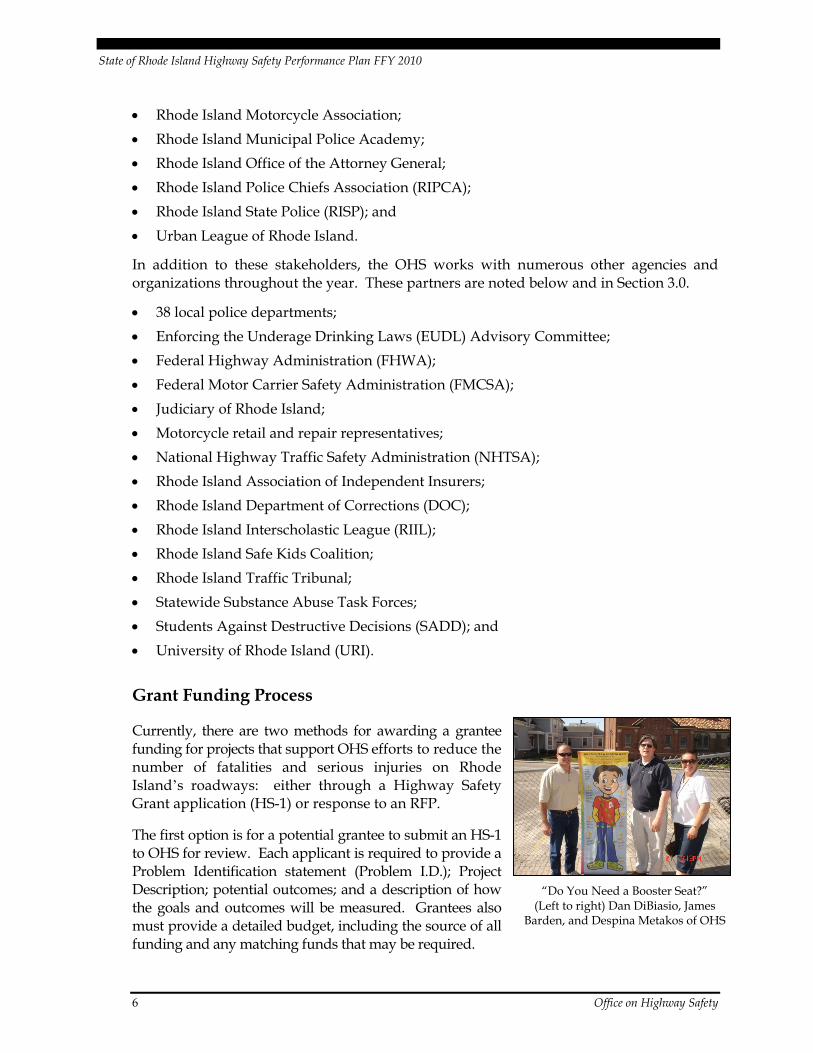
The first option is for a potential grantee to submit an HS-1 to OHS for review. Each applicant is required to provide a Problem Identification statement (Problem I.D.); Project Description; potential outcomes; and a description of how the goals and outcomes will be measured. Grantees also must provide a detailed budget, including the source of all funding and any matching funds that may be required.
“Do You Need a Booster Seat?” (Left to right) Dan DiBiasio, James
Barden, and Despina Metakos of OHS
State of Rhode Island Highway Safety Performance Plan FFY 2010
Office on Highway Safety 7
Applications are reviewed for approval/rejection by the OHS Administrator and the appropriate Program Manager. OHS has managers for the following programs: Impaired Driving; Occupant Protection; Young Drivers; Motorcycles; Speed; Other Road Users; and Traffic Records. The Minority Outreach Program Manager position is currently vacant.
When the Problem I.D./budget has been approved, the next step is to determine if the goods or services can be provided by any other entity. If these services cannot be provided by others (excluding state agencies), then a grant can be issued after a Grants and Assurances document has been signed by the grantee. If the goods or services can be provided by others, OHS must submit a RFP to RIDOT Contracts and Specifications and the Department of Administration Division of Purchases that must be advertised to potential service providers to ensure a quality product is being provided at a competitive price. This process takes approximately three to six months.
All grantees are required to provide quarterly reports to their Program Manager, including invoices, timesheets, and any other documentation necessary for monitoring, reporting, and oversight of program areas. Field visits also may be required for evaluation of the effectiveness of the program and to ensure that the appropriate state and Federal procedures/guidelines are being followed.
The OHS grant partners are an essential component of the success of any program as they implement the programs that address the highlighted issues of concern included within the Highway Safety Performance Plan.
1.4 Organization
OHS experienced multiple staff changes during FFY 2008 and FFY 2009. The Fatality Analysis Reporting System (FARS) Analyst position, vacated in July 2007, was temporarily consolidated as a collateral responsibility with an existing position in February of 2008. Final determination on addressing the FARS responsibilities has not yet been made. The Law Enforcement Liaison (LEL) position also was eliminated due to statewide staff reductions in late 2007. The Minority Outreach Program Coordinator position became vacant in April 2008 and it remains vacant. In FFY 2009, the Municipal Police Academy contracted a position for a Law Enforcement Highway Safety Training Coordinator (LEHSTC) and that addition has been particularly beneficial to OHS outreach and coordination with law enforcement agencies, both for enforcement and training programs. Figure 1.1 illustrates the current OHS organizational structure.

State of Rhode Island Highway Safety Performance Plan FFY 2010
8 Office on Highway Safety
Figure 1.1 Rhode Island Department of TransportationOffice on Highway Safety Organization
Highway Safety Program Managers
James E. BardenDaniel T. DiBiasioDespina Metakos
Vacant
Executive Assistant
Kathy Smith
Administrator, Office on Highway Safety
Senior Accountant
Sharon Bazor
Director of TransportationMichael P. Lewis
Janis E. Loiselle
Deputy Director of Transportation
William “Chuck” Alves
Assistant Director,Administrative Services
Phillip Kydd
FARS ProgramManager
Vacant
In addition to operational and administrative tasks, each OHS Program Manager is responsible for developing, implementing, and/or overseeing specific programs. The program areas addressed by OHS are assigned to the Program Managers based on their individual safety expertise, as noted below.
• James Barden – Occupant Protection, Impaired Driving, Operation BLUE RIPTIDE. • Daniel DiBiasio – Traffic Records, Young Drivers. • Despina Metakos – Speed, Motorcycles, Pedestrians, Bicycles, Other Roadway Users. • Vacant – Minority Outreach, Racial Profiling.
In 2009, OHS funded two-thirds of the salary of a Traffic Safety Resource Prosecutor (TSRP), Jay Sullivan, within the Attorney General’s Office. The TSRP implements training programs for prosecutors and law enforcement to improve prosecution rates in driving under the influence (DUI) cases and assists OHS in evaluating the impact of Rhode Island’s new chemical test refusal law on impaired driving arrest rates.
As noted previously, OHS is funding the LEHSTC, Col. Richard Sullivan (ret.), through the Municipal Police Academy. Col. Sullivan works with the law enforcement agencies for all enforcement campaigns and essential training programs. He has coauthored and now also assists in the instruction for the Professional Traffic Stop Training.

State of Rhode Island Highway Safety Performance Plan FFY 2010
Office on Highway Safety 9
2.0 Highway Safety Performance Plan
2.1 Highway Safety Problem Identification Process1
The OHS emphasizes activities that use available resources most effectively to save lives, reduce injuries, and improve highway safety. Specific goals, strategies, and performance measures are determined by:
• Using data, highway safety research, and prior experience to identify problem areas;
• Soliciting input and project proposals from local and regional organizations that have expertise in areas relevant to highway safety; and
• Analyzing trends in serious injury and fatality rates and comparing them to regional and national trends.
Sources of highway safety data and research used by the OHS include the following:
• Crash Outcome Data Evaluation System (CODES);
• Fatality Analysis Reporting System (FARS);
• National Highway Traffic Safety Administration (NHTSA);
• National Occupant Protection Use Survey (NOPUS);
• RIDOT Office on Highway Safety (OHS);
• Rhode Island Division of Motor Vehicles (DMV);
• Rhode Island Department of Health;
• Rhode Island Police Chiefs Association;
• Rhode Island State Police;
• Rhode Island Statewide Planning Program;
1 Whenever possible, OHS has provided preliminary 2008 data from the Fatality Analysis
Reporting Systems (FARS). This data, however, is preliminary and not complete for all metrics previously reported due to the Office’s staff restraints in 2008 and 2009. It is anticipated that all data will be updated in future versions of this plan.

State of Rhode Island Highway Safety Performance Plan FFY 2010
10 Office on Highway Safety
• RIDOT’s Electronic Accident Reporting System (EARS);
• Rhode Island Attorney General’s Office; and
• Rhode Island Courts.
Unless otherwise noted, the primary data source used in this report is provided by RIDOT EARS.
Demographic Trends
Rhode Island (officially “The State of Rhode Island and Providence Plantations”) is the smallest state in the nation (1,045 square miles, bisected by Narragansett Bay), with 8 cities and 31 towns. The State contains 6,510 total miles of certified public roadway, including 72 miles of Interstate Highway (51 urban and 21 rural).
Nearly one-quarter of all Rhode Island inhabitants are under 18 years of age; 6 percent are under the age of five. About 90 percent reside in urban areas, the largest of which is Providence, the state capital. Rhode Island has one of the fastest growing Hispanic and Southeast Asian communities in the nation. Since 1980, the Hispanic population of Rhode Island has more than doubled and this ethnicity makes up 11.6 percent of Rhode Island’s population. As shown in Figure 2.1, African Americans, Asian Americans, and Native Americans now comprise nearly 10 percent of the State’s population.
Figure 2.1 Rhode Island Population Estimate 2008
88.5%
2.8%6.4% 0.6%
0.1%1.6%
African American
American Indian and Alaska Native
Asian
Native Hawaiian and Other Pacific Islander
Persons reporting two or more races
White
Source: U.S. Census Bureau.
State of Rhode Island Highway Safety Performance Plan FFY 2010
Office on Highway Safety 11
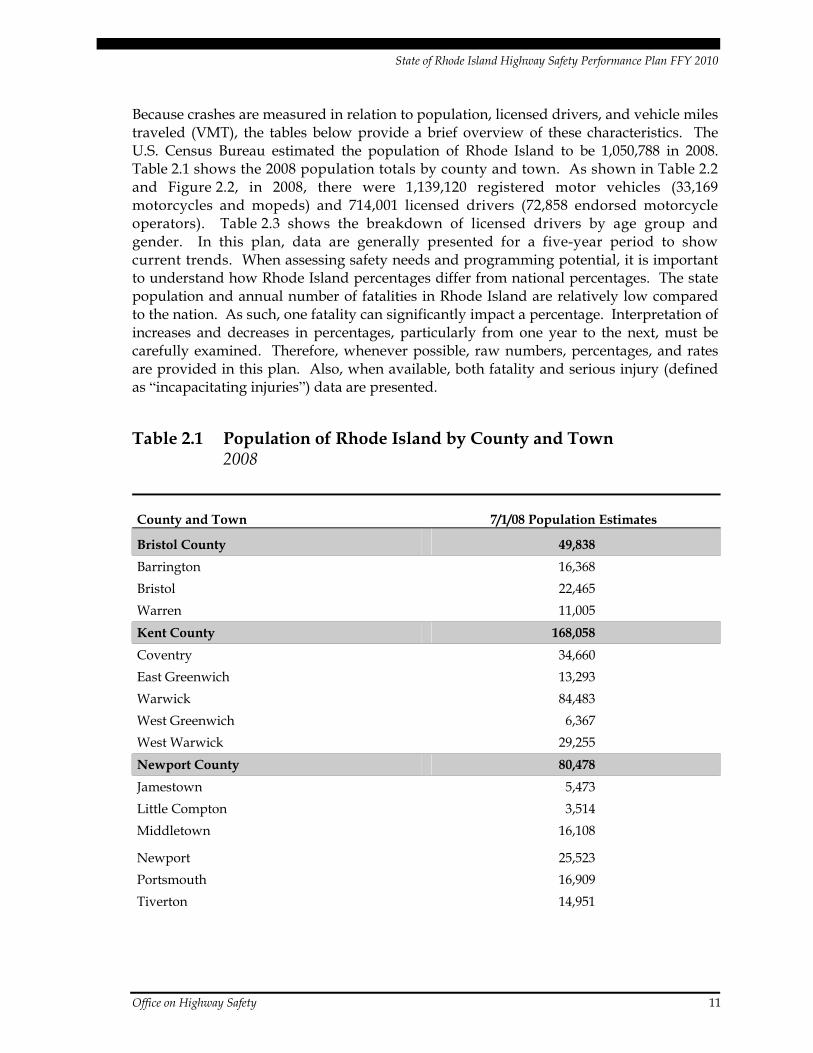
Because crashes are measured in relation to population, licensed drivers, and vehicle miles traveled (VMT), the tables below provide a brief overview of these characteristics. The U.S. Census Bureau estimated the population of Rhode Island to be 1,050,788 in 2008. Table 2.1 shows the 2008 population totals by county and town. As shown in Table 2.2 and Figure 2.2, in 2008, there were 1,139,120 registered motor vehicles (33,169 motorcycles and mopeds) and 714,001 licensed drivers (72,858 endorsed motorcycle operators). Table 2.3 shows the breakdown of licensed drivers by age group and gender. In this plan, data are generally presented for a five-year period to show current trends. When assessing safety needs and programming potential, it is important to understand how Rhode Island percentages differ from national percentages. The state population and annual number of fatalities in Rhode Island are relatively low compared to the nation. As such, one fatality can significantly impact a percentage. Interpretation of increases and decreases in percentages, particularly from one year to the next, must be carefully examined. Therefore, whenever possible, raw numbers, percentages, and rates are provided in this plan. Also, when available, both fatality and serious injury (defined as “incapacitating injuries”) data are presented.
Table 2.1 Population of Rhode Island by County and Town 2008
County and Town 7/1/08 Population Estimates
Bristol County 49,838 Barrington 16,368 Bristol 22,465 Warren 11,005 Kent County 168,058 Coventry 34,660 East Greenwich 13,293 Warwick 84,483 West Greenwich 6,367 West Warwick 29,255 Newport County 80,478 Jamestown 5,473 Little Compton 3,514 Middletown 16,108
Newport 25,523 Portsmouth 16,909 Tiverton 14,951

State of Rhode Island Highway Safety Performance Plan FFY 2010
12 Office on Highway Safety
Table 2.1 Population of Rhode Island by County and Town (continued) 2008
County and Town 7/1/08 Population Estimates Providence County 626,150 Burrillville 16,480 Central Falls 18,683 Cranston 79,980 Cumberland 34,209 East Providence 48,480 Foster 4,503 Glocester 10,499 Johnston 28,524 Lincoln 21,996 North Providence 32,695 North Smithfield 11,513 Pawtucket 71,765 Providence 171,557 Scituate 10,817 Smithfield 21,181 Woonsocket 43,268 Washington County 126,264 Charlestown 8,034 Exeter 6,204 Hopkinton 7,959 Narragansett 16,436 New Shoreham 1,032 North Kingstown 26,539 Richmond 7,601 South Kingstown 29,082 Westerly 23,377 Total State Population 1,050,788
Source: U.S. Census Bureau.

State of Rhode Island Highway Safety Performance Plan FFY 2010
Office on Highway Safety 13
Table 2.2 Rhode Island Drivers, Vehicles, and Population 2003 to 2008
2003 2004 2005 2006 2007 2008
Change (2003-2008)
Licensed Drivers 686,491 746,465 707,617 743,793 715,080 714,001 4.0%
Endorsed Motorcycle Operators
– – – 70,282 71,641 72,858 3.7%a
Registered Vehicles 874,168 918,865 1,102,207 1,128,142 1,129,250 1,139,120 30.3%
Registered Motorcycles (including Mopeds)
27,685 24,244 28,137 27,868 29,144 33,169 19.8%
Total Population of Rhode Island
1,075,729 1,079,916 1,076,189 1,067,610 1,057,832 1,050,788 -2.3%
VMT (in millions) 8,365 8,473 8,300 8,301 8,636 U/A 0.0%b
a Change from 2006 to 2008. b Change from 2003 to 2007.
Figure 2.2 Rhode Island Drivers, Vehicles, and Population 2003 to 2008 (In Thousands)
0
200
400
600
800
1,000
1,200
2003 2004 2005 2006 2007 2008
In Thousands
Licensed Drivers Registered Vehicles Population of Rhode Island
State of Rhode Island Highway Safety Performance Plan FFY 2010
14 Office on Highway Safety
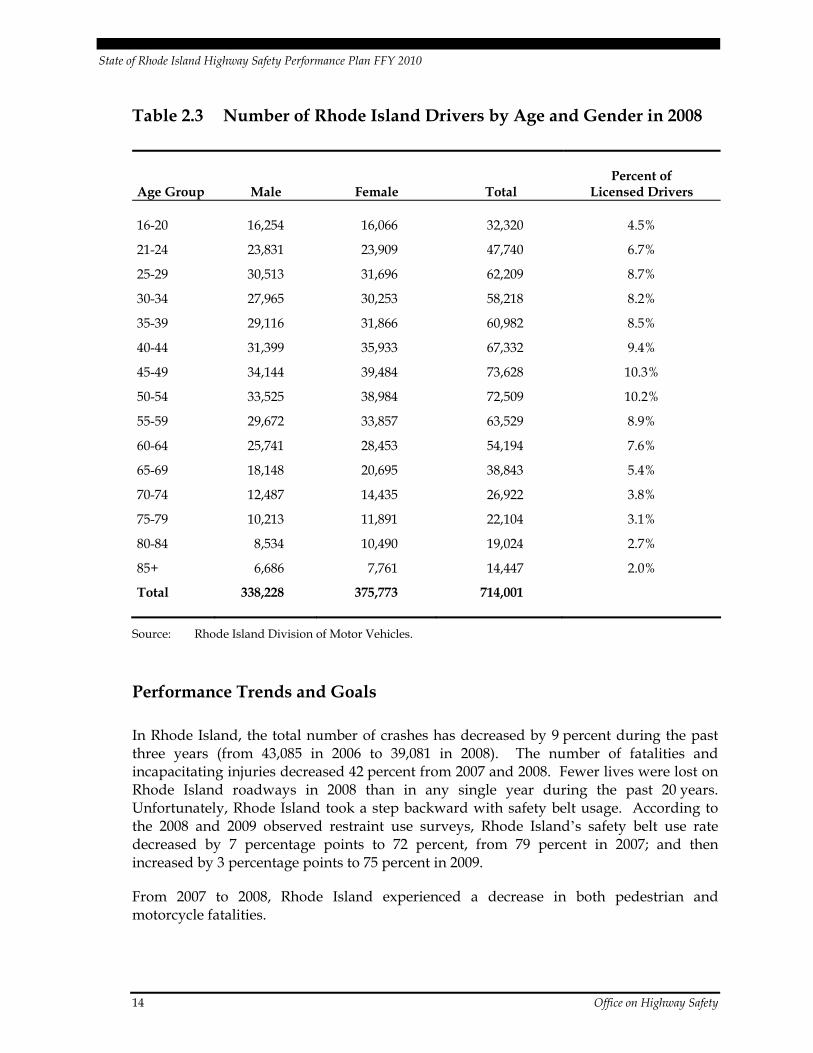
Table 2.3 Number of Rhode Island Drivers by Age and Gender in 2008
Age Group Male Female Total Percent of
Licensed Drivers
16-20 16,254 16,066 32,320 4.5%
21-24 23,831 23,909 47,740 6.7%
25-29 30,513 31,696 62,209 8.7%
30-34 27,965 30,253 58,218 8.2%
35-39 29,116 31,866 60,982 8.5%
40-44 31,399 35,933 67,332 9.4%
45-49 34,144 39,484 73,628 10.3%
50-54 33,525 38,984 72,509 10.2%
55-59 29,672 33,857 63,529 8.9%
60-64 25,741 28,453 54,194 7.6%
65-69 18,148 20,695 38,843 5.4%
70-74 12,487 14,435 26,922 3.8%
75-79 10,213 11,891 22,104 3.1%
80-84 8,534 10,490 19,024 2.7%
85+ 6,686 7,761 14,447 2.0%
Total 338,228 375,773 714,001
Source: Rhode Island Division of Motor Vehicles.
Performance Trends and Goals
In Rhode Island, the total number of crashes has decreased by 9 percent during the past three years (from 43,085 in 2006 to 39,081 in 2008). The number of fatalities and incapacitating injuries decreased 42 percent from 2007 and 2008. Fewer lives were lost on Rhode Island roadways in 2008 than in any single year during the past 20 years. Unfortunately, Rhode Island took a step backward with safety belt usage. According to the 2008 and 2009 observed restraint use surveys, Rhode Island’s safety belt use rate decreased by 7 percentage points to 72 percent, from 79 percent in 2007; and then increased by 3 percentage points to 75 percent in 2009.
From 2007 to 2008, Rhode Island experienced a decrease in both pedestrian and motorcycle fatalities.

State of Rhode Island Highway Safety Performance Plan FFY 2010
Office on Highway Safety 15
As shown in Figures 2.3 and 2.4, in 2008 the greatest percentage of crashes occurred in the month of October and on Sundays. Fatal crashes occurred most frequently between the hours of 10:00 p.m. and 4:00 a.m., as shown in Figure 2.5. Table 2.4 and Figures 2.6 through 2.36 provide additional details on Rhode Island’s highway safety trends.
Figure 2.3 Percent of Rhode Island Fatal Crashes by Month-of-Year 2008
7.81%
3.13%
10.94%
7.81%
6.25%
4.69%
9.38%
10.94%
9.38%
12.50%
9.38%
6.25%
0.0%
2.0%
4.0%
6.0%
8.0%
10.0%
12.0%
14.0%
Janu
ary
Febr
uary
Mar
ch
Apr
il
May
June
July
Aug
ust
Sept
embe
r
Oct
ober
Nov
embe
r
Dec
embe
r
Source: FARS.

State of Rhode Island Highway Safety Performance Plan FFY 2010
16 Office on Highway Safety
Figure 2.4 Percent of Rhode Island Fatal Crashes by Day-of-Week 2008
21.88%
14.06%
4.69%
12.50%10.94%
15.63%
18.75%
0.0%
5.0%
10.0%
15.0%
20.0%
25.0%
Sunday Monday Tuesday Wednesday Thursday Friday Saturday
Source: FARS.
Figure 2.5 Percent of Rhode Island Fatal Crashes by Time-of-Day 2008
21.88%
6.25% 6.25%
3.13%
14.06%
10.94%
14.06%
21.88%
0.0%
5.0%
10.0%
15.0%
20.0%
25.0%
1-3:59 AM 4-6:59 AM 7-9:59 AM 10 AM-12:59PM
1-3:59 PM 4-6:59 PM 7-9:59 PM 10 PM-12:59AM
Source: FARS.
Key Rhode Island crash data and trends are provided in Table 2.4.
State of Rhode Island Highway Safety Performance Plan FFY 2010
Office on Highway Safety 17
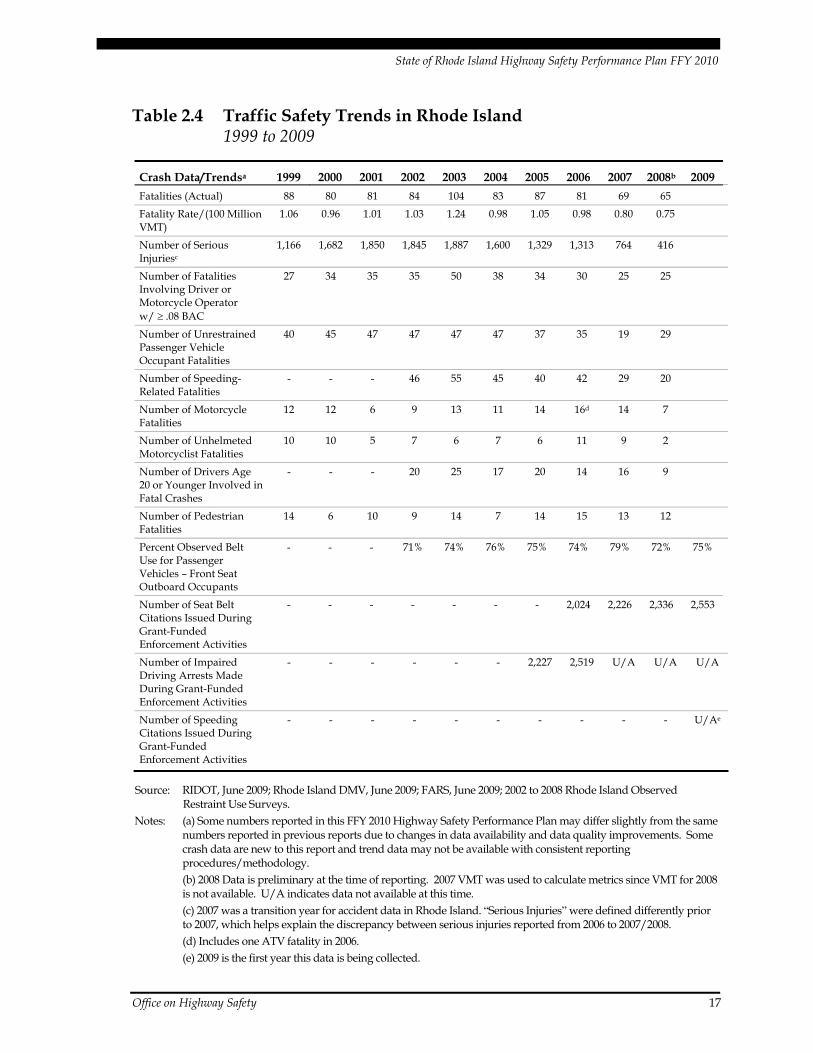
Table 2.4 Traffic Safety Trends in Rhode Island 1999 to 2009
Crash Data/Trendsa 1999 2000 2001 2002 2003 2004 2005 2006 2007 2008b 2009 Fatalities (Actual) 88 80 81 84 104 83 87 81 69 65 Fatality Rate/(100 Million VMT)
1.06 0.96 1.01 1.03 1.24 0.98 1.05 0.98 0.80 0.75
Number of Serious Injuriesc
1,166 1,682 1,850 1,845 1,887 1,600 1,329 1,313 764 416
Number of Fatalities Involving Driver or Motorcycle Operator w/ ≥ .08 BAC
27 34 35 35 50 38 34 30 25 25
Number of Unrestrained Passenger Vehicle Occupant Fatalities
40 45 47 47 47 47 37 35 19 29
Number of Speeding-Related Fatalities
- - - 46 55 45 40 42 29 20
Number of Motorcycle Fatalities
12 12 6 9 13 11 14 16d 14 7
Number of Unhelmeted Motorcyclist Fatalities
10 10 5 7 6 7 6 11 9 2
Number of Drivers Age 20 or Younger Involved in Fatal Crashes
- - - 20 25 17 20 14 16 9
Number of Pedestrian Fatalities
14 6 10 9 14 7 14 15 13 12
Percent Observed Belt Use for Passenger Vehicles – Front Seat Outboard Occupants
- - - 71% 74% 76% 75% 74% 79% 72% 75%
Number of Seat Belt Citations Issued During Grant-Funded Enforcement Activities
- - - - - - - 2,024 2,226 2,336 2,553
Number of Impaired Driving Arrests Made During Grant-Funded Enforcement Activities
- - - - - - 2,227 2,519 U/A U/A U/A
Number of Speeding Citations Issued During Grant-Funded Enforcement Activities
- - - - - - - - - - U/Ae
Source: RIDOT, June 2009; Rhode Island DMV, June 2009; FARS, June 2009; 2002 to 2008 Rhode Island Observed Restraint Use Surveys.
Notes: (a) Some numbers reported in this FFY 2010 Highway Safety Performance Plan may differ slightly from the same numbers reported in previous reports due to changes in data availability and data quality improvements. Some crash data are new to this report and trend data may not be available with consistent reporting procedures/methodology.
(b) 2008 Data is preliminary at the time of reporting. 2007 VMT was used to calculate metrics since VMT for 2008 is not available. U/A indicates data not available at this time.
(c) 2007 was a transition year for accident data in Rhode Island. “Serious Injuries” were defined differently prior to 2007, which helps explain the discrepancy between serious injuries reported from 2006 to 2007/2008.
(d) Includes one ATV fatality in 2006. (e) 2009 is the first year this data is being collected.
State of Rhode Island Highway Safety Performance Plan FFY 2010
18 Office on Highway Safety
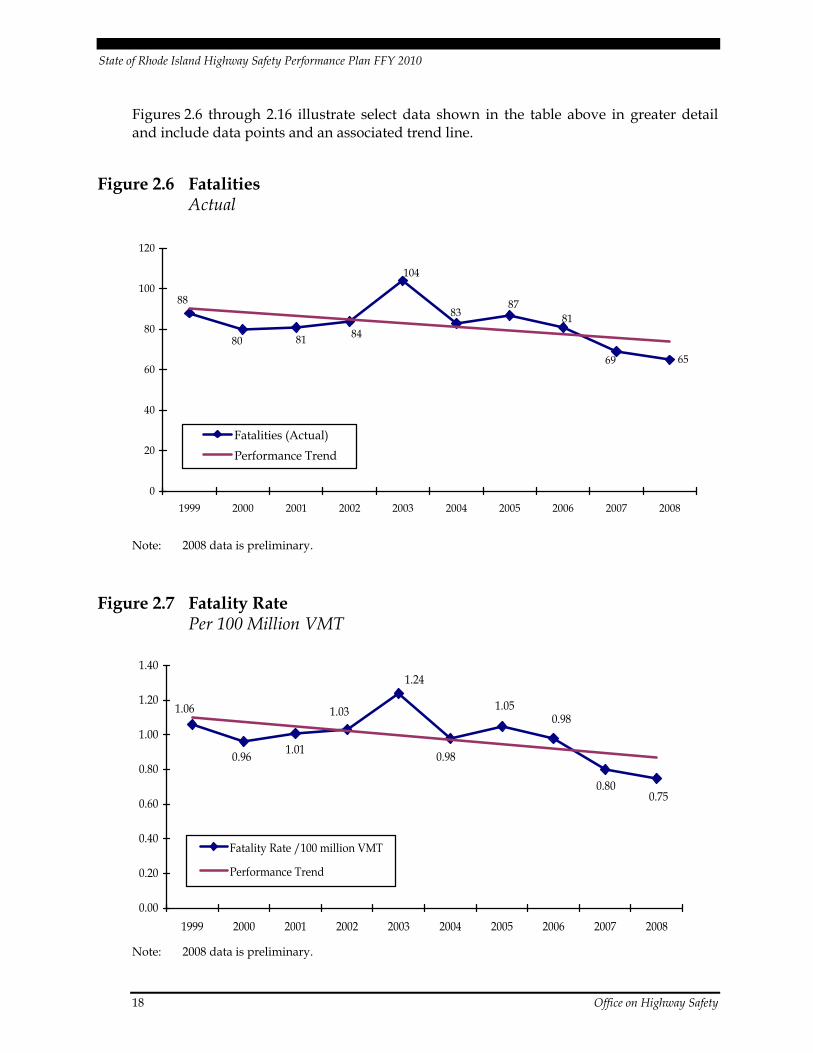
Figures 2.6 through 2.16 illustrate select data shown in the table above in greater detail and include data points and an associated trend line.
Figure 2.6 Fatalities Actual
65
83
104
848180
88 8781
69
0
20
40
60
80
100
120
1999 2000 2001 2002 2003 2004 2005 2006 2007 2008
Fatalities (Actual)Performance Trend
Note: 2008 data is preliminary.
Figure 2.7 Fatality Rate Per 100 Million VMT
0.98
1.24
1.03
1.010.96
1.06 1.050.98
0.800.75
0.00
0.20
0.40
0.60
0.80
1.00
1.20
1.40
1999 2000 2001 2002 2003 2004 2005 2006 2007 2008
Fatality Rate /100 million VMT
Performance Trend
Note: 2008 data is preliminary.

State of Rhode Island Highway Safety Performance Plan FFY 2010
Office on Highway Safety 19
Figure 2.8 Serious Injuries Actual
1,166
1,3131,329
1,600
1,8871,8451,850
764
1,682
416
0
200
400
600
800
1,000
1,200
1,400
1,600
1,800
2,000
1999 2000 2001 2002 2003 2004 2005 2006 2007 2008
# of Serious InjuriesPerformance Trend
Note: 2008 data is preliminary. 2007 was a transition year for accident data in Rhode Island. “Serious
Injuries” were defined differently prior to 2007, which helps explain the discrepancy between serious injuries reported from 2006 to 2007/2008.
Figure 2.9 Fatalities Involving Driver or Motorcycle Operator w/ ≥ .08 BAC Actual
25
38
50
27
34
35 35 34
3025
0
10
20
30
40
50
60
1999 2000 2001 2002 2003 2004 2005 2006 2007 2008
# of Fatalities Involving Driver or Motorcycle Operator w/ > .08 BAC
Performance Trend
Note: 2008 data is preliminary.

State of Rhode Island Highway Safety Performance Plan FFY 2010
20 Office on Highway Safety
Figure 2.10 Unrestrained Passenger Vehicle Occupant Fatalities Actual
29
47
4747
47
45
4037 35
19
0
10
20
30
40
50
60
1999 2000 2001 2002 2003 2004 2005 2006 2007 2008
# of Unrestrained Passenger Vehicle Occupant Fatalities
Performance Trend
Note: 2008 data is preliminary.
Figure 2.11 Speeding-Related Fatalities Actual
20
46
55
45
40
42
29
0
10
20
30
40
50
60
2002 2003 2004 2005 2006 2007 2008
# of Speeding-Related FatalitiesPerformance Trend
Note: 2008 data is preliminary.
State of Rhode Island Highway Safety Performance Plan FFY 2010
Office on Highway Safety 21
Figure 2.12 Number of Motorcyclist Fatalities Actual
7
10
13
9
6
1212
14
16*
14
0
2
4
6
8
10
12
14
16
18
1999 2000 2001 2002 2003 2004 2005 2006 2007 2008
# of Motorcyclist Fatalities
Performance Trend
Note: 2008 data is preliminary. *2006 data includes one ATV fatality.
Figure 2.13 Unhelmeted Motorcycle Fatalities Actual
9
11
7
6
7
5
1010
6
2
0
2
4
6
8
10
12
1999 2000 2001 2002 2003 2004 2005 2006 2007 2008
# of Unhelmeted Motorcyclist FatalitiesPerformance Trend
Note: 2008 data is preliminary.
State of Rhode Island Highway Safety Performance Plan FFY 2010
22 Office on Highway Safety
Figure 2.14 Drivers Age 20 or Younger Involved in Fatal Crashes Actual
9
16
20
25
17
20
14
0
5
10
15
20
25
30
2002 2003 2004 2005 2006 2007 2008
# of Drivers Age 20 or Younger Involved in Fatal CrashesPerformance Trend
Note: 2008 data is preliminary.
Figure 2.15 Pedestrian Fatalities Actual
12
6
109
14
7
141415
13
0
2
4
6
8
10
12
14
16
1999 2000 2001 2002 2003 2004 2005 2006 2007 2008
# of Pedestrian FatalitiesPerformance Trend
Note: 2008 data is preliminary.

State of Rhode Island Highway Safety Performance Plan FFY 2010
Office on Highway Safety 23
Figure 2.16 Percent Observed Belt Use for Passenger Vehicles – Front Seat Outboard Occupants
75%
74%
75%
76%
74%
71%
79%
72%
66%
68%
70%
72%
74%
76%
78%
80%
2002 2003 2004 2005 2006 2007 2008 2009
% Observed Belt Use for Passenger Vehicles - Front Seat Outboard Occupants
Performance Trend
Note: 2009 seat belt use rate is awaiting NHTSA certification.
Rhode Island Comparison to New England and United States
As shown in Figure 2.17, Rhode Island has consistently had a lower fatality rate (per 100 million VMT) than the national average. Rhode Island’s fatality rate also has been lower than the New England region fatality rate at various times throughout the period from 2003 to 2007. As reported by NHTSA (Table 2.5), Rhode Island exceeds the New England region for percentage of crashes involving alcohol and motorcycles; however, Rhode Island has a lower percentage of unrestrained and speed-related fatalities. Preusser Research Group, Inc.’s Analysis of Fatal Crash Data Rhode Island 2003 to 2007 report includes additional information regarding state, regional, and national comparisons.

State of Rhode Island Highway Safety Performance Plan FFY 2010
24 Office on Highway Safety
Figure 2.17 Rhode Island, New England, and United States Fatality Rate Per 100 Million VMT
1.24
0.981.05
0.98
0.80
0.98 1.000.92 0.92
0.86
1.48 1.44 1.45 1.421.36
0.00
0.20
0.40
0.60
0.80
1.00
1.20
1.40
1.60
2003 2004 2005 2006 2007
Rhode Island New England United States
Source: Preusser Research Group, Inc., Analysis of Fatal Crash Data Rhode Island 2003-2007.
Table 2.5 Rhode Island and New England Crash Conditions as Percent of Total Fatalities in 2007
Unbelted Passenger Vehicle
Occupant Fatalities Alcohol-
Impaireda Speed- Related Motorcycle
Rhode Island 28% 36% 20% 19%
New England 35% 35% 35% 15%
a NHTSA imputed numbers (versus state reported).
Source: Preusser Research Group, Inc., Analysis of Fatal Crash Data Rhode Island 2003 to 2007.
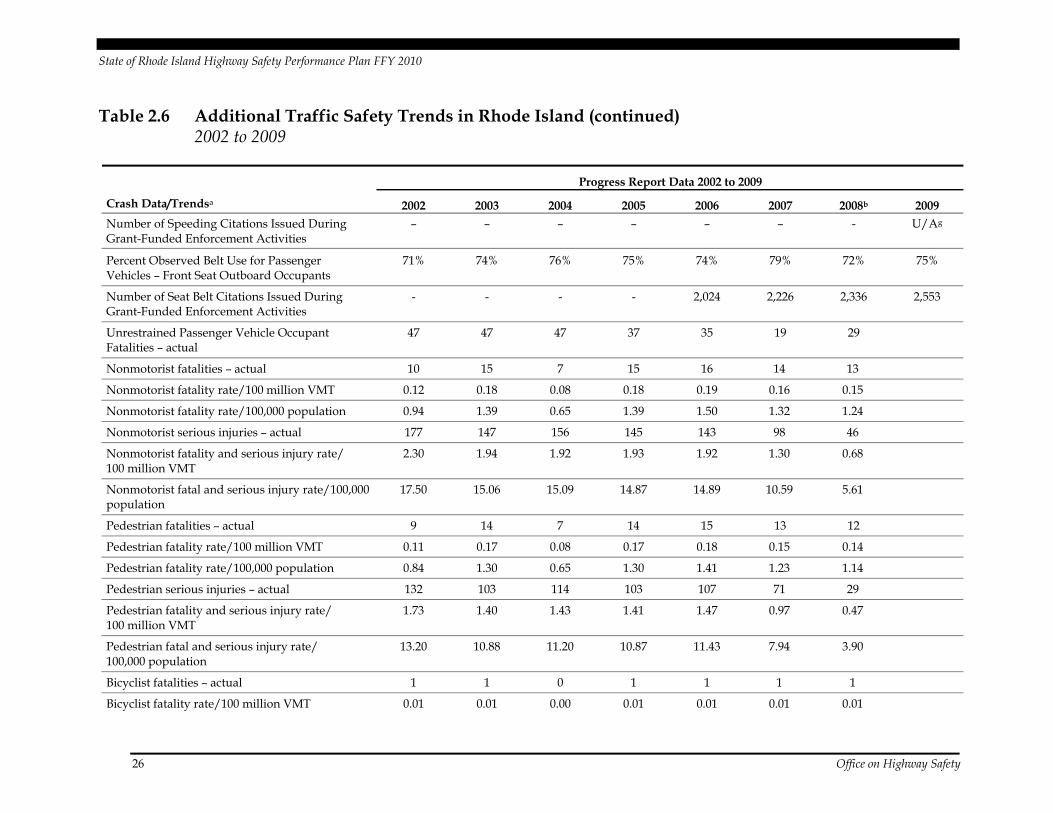
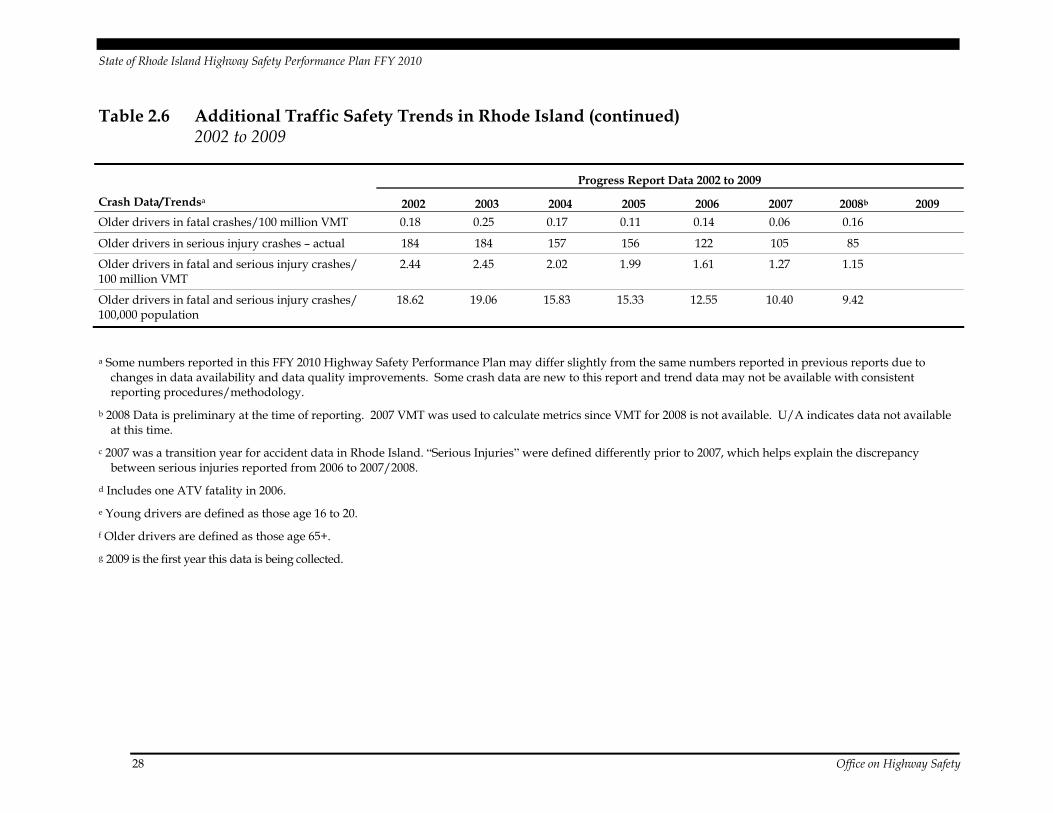
Table 2.6 provides additional detail on recent highway safety trends in Rhode Island.

State of Rhode Island Highway Safety Performance Plan FFY 2010
Office on Highway Safety 25
Table 2.6 Additional Traffic Safety Trends in Rhode Island 2002 to 2009
Progress Report Data 2002 to 2009
Crash Data/Trendsa 2002 2003 2004 2005 2006 2007 2008b 2009
Fatalities – actual 84 104 83 87 81 69 65
Fatal crashes – actual 81 96 78 80 72 64 64
Fatality Rate/(100 Million VMT) 1.03 1.24 0.98 1.05 0.98 0.80 0.75
Fatality rate/100,000 population 7.86 9.67 7.69 8.08 7.59 6.52 6.19
Number of Serious Injuriesc 1,845 1,887 1,600 1,329 1,313 764 416
Fatality and serious injury rate/100 million VMT 23.69 23.80 19.86 17.06 16.79 9.65 5.57
Fatal and serious injury rate/100,000 population 180.53 185.08 155.85 131.58 130.57 78.75 45.78
Month of most fatal crashes Jul/Aug Mar Jun Jul Aug Mar/Oct Oct
Day of most fatal crashes Sat Sun Sat Sat Sun Fri Sun
Time of most fatal crashes 1-4 a.m. 10 p.m.-1 a.m.
10 p.m.- 4 a.m.
7-10 p.m. 1-4 a.m./ 1-4 p.m.
10 p.m.-3 a.m.
10 p.m.- 4 a.m.
Alcohol-Impaired fatalities (Involving Driver or Motorcycle Operator w/ ≥ .08 BAC)
35 50 38 34 30 25 25
Number of Impaired Driving Arrests Made During Grant-Funded Enforcement Activities
– – – 2,227 2,519 U/A U/A U/A
Alcohol-related fatalities (BAC greater than or equal to 0.01)
42 55 40 44 38 32 35
Proportion of alcohol-related fatalities 0.50 0.53 0.48 0.51 0.47 0.46 0.54
Alcohol-related fatality rate/100 million VMT 0.52 0.66 0.47 0.53 0.46 0.37 0.41
Alcohol-related fatality rate/100,000 population 3.93 5.11 3.70 4.09 3.56 3.03 3.33
Proportion of speed-related fatalities 0.55 0.53 0.54 0.46 0.52 0.42 0.31
Speeding-related fatalities – actual 46 55 45 40 42 29 20
Speed fatality rate/100 million VMT 0.56 0.66 0.53 0.48 0.51 0.34 0.23
Speed fatality rate/100,000 population 4.30 5.11 4.17 3.72 3.93 2.74 1.90
State of Rhode Island Highway Safety Performance Plan FFY 2010
26 Office on Highway Safety
Table 2.6 Additional Traffic Safety Trends in Rhode Island (continued) 2002 to 2009
Progress Report Data 2002 to 2009
Crash Data/Trendsa 2002 2003 2004 2005 2006 2007 2008b 2009 Number of Speeding Citations Issued During Grant-Funded Enforcement Activities
– – – – – – - U/Ag
Percent Observed Belt Use for Passenger Vehicles – Front Seat Outboard Occupants
71% 74% 76% 75% 74% 79% 72% 75%
Number of Seat Belt Citations Issued During Grant-Funded Enforcement Activities
- - - - 2,024 2,226 2,336 2,553
Unrestrained Passenger Vehicle Occupant Fatalities – actual
47 47 47 37 35 19 29
Nonmotorist fatalities – actual 10 15 7 15 16 14 13
Nonmotorist fatality rate/100 million VMT 0.12 0.18 0.08 0.18 0.19 0.16 0.15
Nonmotorist fatality rate/100,000 population 0.94 1.39 0.65 1.39 1.50 1.32 1.24
Nonmotorist serious injuries – actual 177 147 156 145 143 98 46
Nonmotorist fatality and serious injury rate/100 million VMT
2.30 1.94 1.92 1.93 1.92 1.30 0.68
Nonmotorist fatal and serious injury rate/100,000 population
17.50 15.06 15.09 14.87 14.89 10.59 5.61
Pedestrian fatalities – actual 9 14 7 14 15 13 12
Pedestrian fatality rate/100 million VMT 0.11 0.17 0.08 0.17 0.18 0.15 0.14
Pedestrian fatality rate/100,000 population 0.84 1.30 0.65 1.30 1.41 1.23 1.14
Pedestrian serious injuries – actual 132 103 114 103 107 71 29
Pedestrian fatality and serious injury rate/100 million VMT
1.73 1.40 1.43 1.41 1.47 0.97 0.47
Pedestrian fatal and serious injury rate/100,000 population
13.20 10.88 11.20 10.87 11.43 7.94 3.90
Bicyclist fatalities – actual 1 1 0 1 1 1 1
Bicyclist fatality rate/100 million VMT 0.01 0.01 0.00 0.01 0.01 0.01 0.01
State of Rhode Island Highway Safety Performance Plan FFY 2010
Office on Highway Safety 27
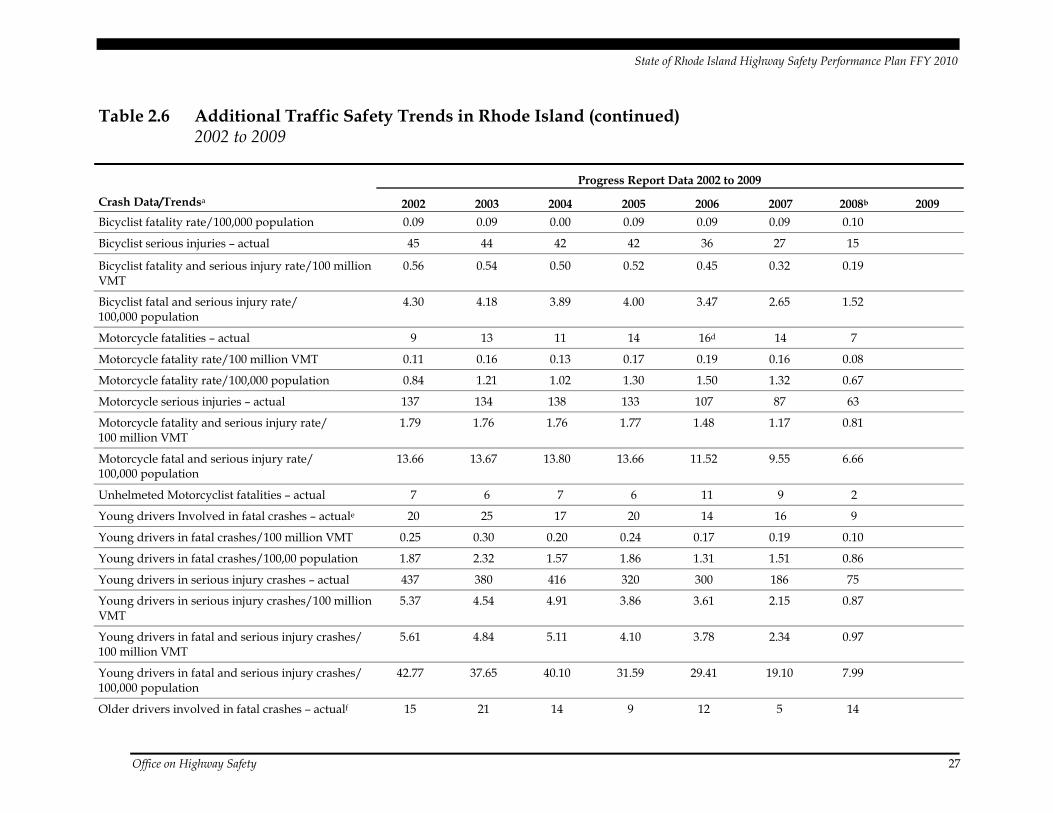
Table 2.6 Additional Traffic Safety Trends in Rhode Island (continued) 2002 to 2009
Progress Report Data 2002 to 2009
Crash Data/Trendsa 2002 2003 2004 2005 2006 2007 2008b 2009 Bicyclist fatality rate/100,000 population 0.09 0.09 0.00 0.09 0.09 0.09 0.10
Bicyclist serious injuries – actual 45 44 42 42 36 27 15
Bicyclist fatality and serious injury rate/100 million VMT
0.56 0.54 0.50 0.52 0.45 0.32 0.19
Bicyclist fatal and serious injury rate/100,000 population
4.30 4.18 3.89 4.00 3.47 2.65 1.52
Motorcycle fatalities – actual 9 13 11 14 16d 14 7
Motorcycle fatality rate/100 million VMT 0.11 0.16 0.13 0.17 0.19 0.16 0.08
Motorcycle fatality rate/100,000 population 0.84 1.21 1.02 1.30 1.50 1.32 0.67
Motorcycle serious injuries – actual 137 134 138 133 107 87 63
Motorcycle fatality and serious injury rate/100 million VMT
1.79 1.76 1.76 1.77 1.48 1.17 0.81
Motorcycle fatal and serious injury rate/100,000 population
13.66 13.67 13.80 13.66 11.52 9.55 6.66
Unhelmeted Motorcyclist fatalities – actual 7 6 7 6 11 9 2
Young drivers Involved in fatal crashes – actuale 20 25 17 20 14 16 9
Young drivers in fatal crashes/100 million VMT 0.25 0.30 0.20 0.24 0.17 0.19 0.10
Young drivers in fatal crashes/100,00 population 1.87 2.32 1.57 1.86 1.31 1.51 0.86
Young drivers in serious injury crashes – actual 437 380 416 320 300 186 75
Young drivers in serious injury crashes/100 million VMT
5.37 4.54 4.91 3.86 3.61 2.15 0.87
Young drivers in fatal and serious injury crashes/100 million VMT
5.61 4.84 5.11 4.10 3.78 2.34 0.97
Young drivers in fatal and serious injury crashes/100,000 population
42.77 37.65 40.10 31.59 29.41 19.10 7.99
Older drivers involved in fatal crashes – actualf 15 21 14 9 12 5 14
State of Rhode Island Highway Safety Performance Plan FFY 2010
28 Office on Highway Safety
Table 2.6 Additional Traffic Safety Trends in Rhode Island (continued) 2002 to 2009
Progress Report Data 2002 to 2009
Crash Data/Trendsa 2002 2003 2004 2005 2006 2007 2008b 2009 Older drivers in fatal crashes/100 million VMT 0.18 0.25 0.17 0.11 0.14 0.06 0.16
Older drivers in serious injury crashes – actual 184 184 157 156 122 105 85
Older drivers in fatal and serious injury crashes/100 million VMT
2.44 2.45 2.02 1.99 1.61 1.27 1.15
Older drivers in fatal and serious injury crashes/100,000 population
18.62 19.06 15.83 15.33 12.55 10.40 9.42
a Some numbers reported in this FFY 2010 Highway Safety Performance Plan may differ slightly from the same numbers reported in previous reports due to changes in data availability and data quality improvements. Some crash data are new to this report and trend data may not be available with consistent reporting procedures/methodology.
b 2008 Data is preliminary at the time of reporting. 2007 VMT was used to calculate metrics since VMT for 2008 is not available. U/A indicates data not available at this time.
c 2007 was a transition year for accident data in Rhode Island. “Serious Injuries” were defined differently prior to 2007, which helps explain the discrepancy between serious injuries reported from 2006 to 2007/2008.
d Includes one ATV fatality in 2006.
e Young drivers are defined as those age 16 to 20.
f Older drivers are defined as those age 65+.
g 2009 is the first year this data is being collected.
State of Rhode Island Highway Safety Performance Plan FFY 2010
Office on Highway Safety 29
2.2 Rhode Island Highway Safety Problem Areas
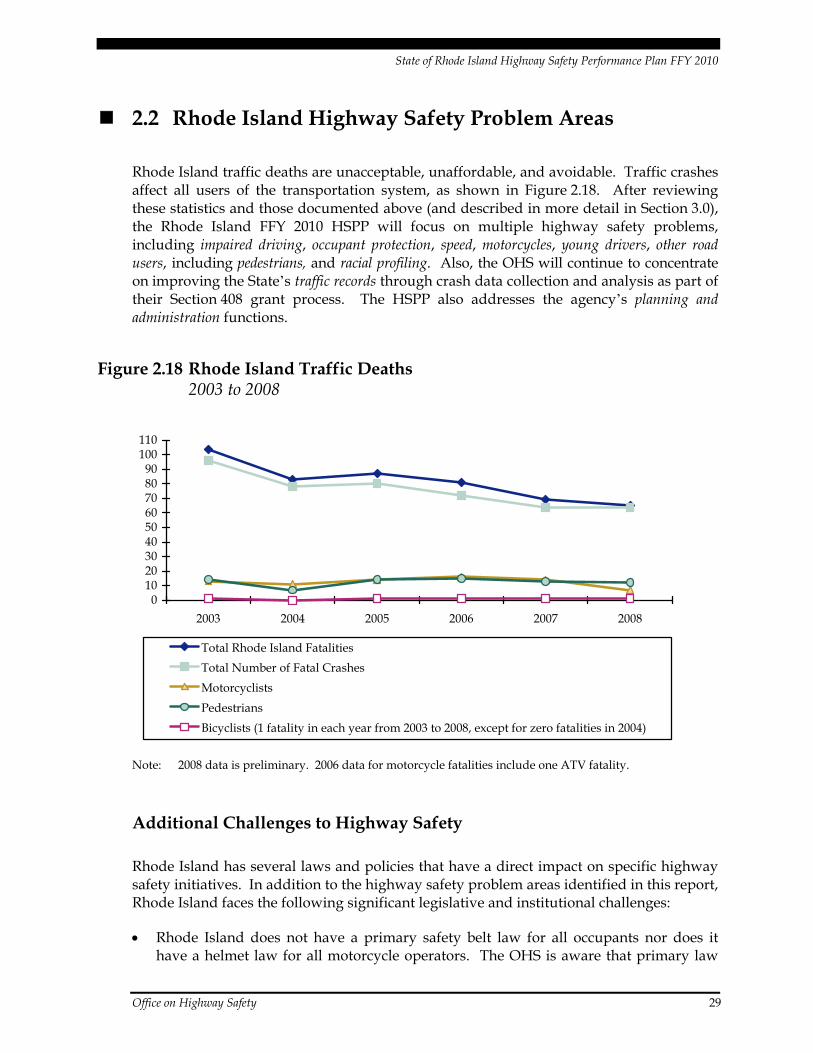
Rhode Island traffic deaths are unacceptable, unaffordable, and avoidable. Traffic crashes affect all users of the transportation system, as shown in Figure 2.18. After reviewing these statistics and those documented above (and described in more detail in Section 3.0), the Rhode Island FFY 2010 HSPP will focus on multiple highway safety problems, including impaired driving, occupant protection, speed, motorcycles, young drivers, other road users, including pedestrians, and racial profiling. Also, the OHS will continue to concentrate on improving the State’s traffic records through crash data collection and analysis as part of their Section 408 grant process. The HSPP also addresses the agency’s planning and administration functions.
Figure 2.18 Rhode Island Traffic Deaths 2003 to 2008
0102030405060708090
100110
2003 2004 2005 2006 2007 2008
Total Rhode Island FatalitiesTotal Number of Fatal CrashesMotorcyclistsPedestriansBicyclists (1 fatality in each year from 2003 to 2008, except for zero fatalities in 2004)
Note: 2008 data is preliminary. 2006 data for motorcycle fatalities include one ATV fatality.
Additional Challenges to Highway Safety
Rhode Island has several laws and policies that have a direct impact on specific highway safety initiatives. In addition to the highway safety problem areas identified in this report, Rhode Island faces the following significant legislative and institutional challenges:
• Rhode Island does not have a primary safety belt law for all occupants nor does it have a helmet law for all motorcycle operators. The OHS is aware that primary law
State of Rhode Island Highway Safety Performance Plan FFY 2010
30 Office on Highway Safety
states routinely have higher usage rates than secondary law states; and when secondary states strengthen their laws to primary enforcement, they often see an increase in usage rates by as much as 10 to 15 percent. Changes in the adult safety belt law have been consistently proposed but unsuccessful to date.
• Sobriety checkpoints are banned by judicial ruling in Rhode Island.
• There is no requirement for behind-the-wheel training for novice drivers (only classroom instruction).
Rhode Island, however, has achieved several highway safety legislative and policy-related milestones in recent years:
• A cell phone use prohibition for drivers under the age of 18 was added to the Graduated License requirements in 2006.
• Rhode Island has a medical fitness provision that allows doctors and other health care personnel to inform the Registry of a medical concern, which then triggers a hearing. In 2008, the Rhode Island legislature revised the license renewal procedures for elder drivers by changing the age to 75 (as opposed to 70) for a shorter time period between license renewals (two years rather than five years).
• Also in 2008, the Rhode Island legislature eliminated a loophole in the State’s “social host” law so that an adult may be charged with a crime if minors are found with alcohol anywhere on a property under the control of that adult. The law previously provided for commission of a crime only if the minor was found with alcohol inside a structure.
• Legislation approved by the General Assembly and signed into law by the governor in 2008 allows motorcycle training to be offered by independent companies. The State’s training arm, CCRI, will certify motorcycle dealers engaged in selling motorcycles or an association engaged in motorcycle safety to provide motorcycle driver education courses in Rhode Island. Independent training facilities will be required to offer a course that is certified by the Motorcycle Safety Foundation, or other programs approved by CCRI and/or the Board of Governors for Higher Education.
• In 2009, the state revised the Child Passenger Safety Law to include children up to the age of 8, or thirty-seven inches or 80 pounds. (The previous provisions covered children up to age 7, thirty- four inches or 80 pounds.)
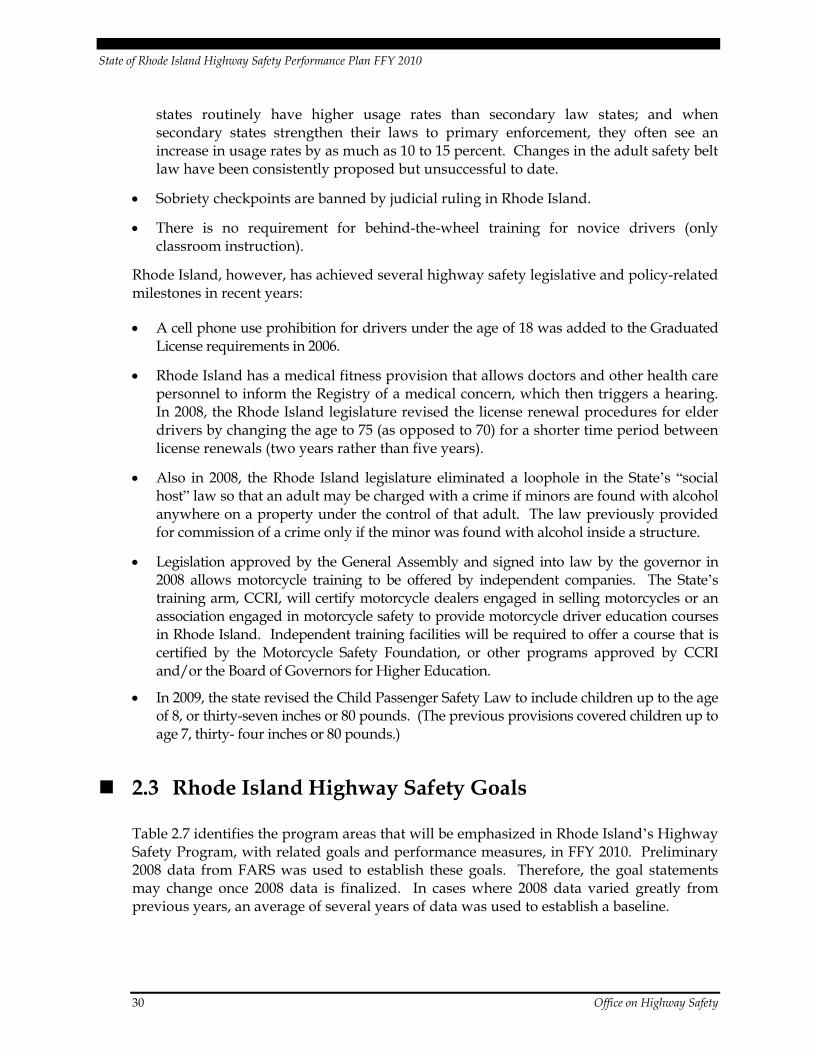
2.3 Rhode Island Highway Safety Goals
Table 2.7 identifies the program areas that will be emphasized in Rhode Island’s Highway Safety Program, with related goals and performance measures, in FFY 2010. Preliminary 2008 data from FARS was used to establish these goals. Therefore, the goal statements may change once 2008 data is finalized. In cases where 2008 data varied greatly from previous years, an average of several years of data was used to establish a baseline.
State of Rhode Island Highway Safety Performance Plan FFY 2010
Office on Highway Safety 31
Table 2.7 Goals and Performance Measures
Program Area Goals Performance Measures • To decrease traffic fatalities by 1.5 percent, from 65 in 2008 to
64 in 2010. • Number of traffic fatalities.
• To maintain the low number of serious injuries in 2008 of 416 in 2010.
• Number of serious injuries.
Overall OHS Program Area Goals
• To reduce the fatality rate of 0.75 per 100 million VMT in 2008 to 0.73 per 100 million VMT in 2010.
• Fatality rate per 100 million VMT.
Impaired Driving • To decrease alcohol-impaired driving fatalities (those involving a legally intoxicated driver or motorcycle operator with a BAC of .08 or greater) 4 percent, from 25 in 2008 (NHTSA imputed data) to 24 in 2010.
• Number of fatalities involving a driver or motorcycle operator with a BAC of .08 or greater.
• To collect and report data on the number of impaired driving arrests made during grant-funded enforcement activities in FFY 2010.
• Number of impaired driving arrests made during grant-funded enforcement activities.
• To decrease by 11.4 percent the number of crash fatalities with a known BAC of .01 or higher, from a three year average (2006-2008) of 35 to 31 in 2010.
• Number of crash fatalities with a known BAC of .01 or higher.
• To decrease by 5.9 percent the number of drivers involved in fatal crashes with a known BAC of .01 or higher, from 17 in 2007 to 16 in 2010.
• Number of drivers involved in fatal crashes with a known BAC of .01 or higher.
• To increase the percent of survey participants responding “Very Likely” or “Somewhat Likely” in regard to their perceived likelihood of being stopped after drinking to excess and driving from 57.6 percent.
• Percent of survey participants responding “Very Likely” or “Somewhat Likely” in regards to their perceived likelihood of being stopped after drinking to excess and driving.
• To increase the recognition of the slogan used by OHS to support high visibility impaired driving enforcement. (In 2008, 50.4 percent recognition of YD&DYL slogan).
• Percent of survey respondents reporting slogan recognition.
State of Rhode Island Highway Safety Performance Plan FFY 2010
32 Office on Highway Safety
Table 2.7 Goals and Performance Measures (continued)
Program Area Goals Performance Measures
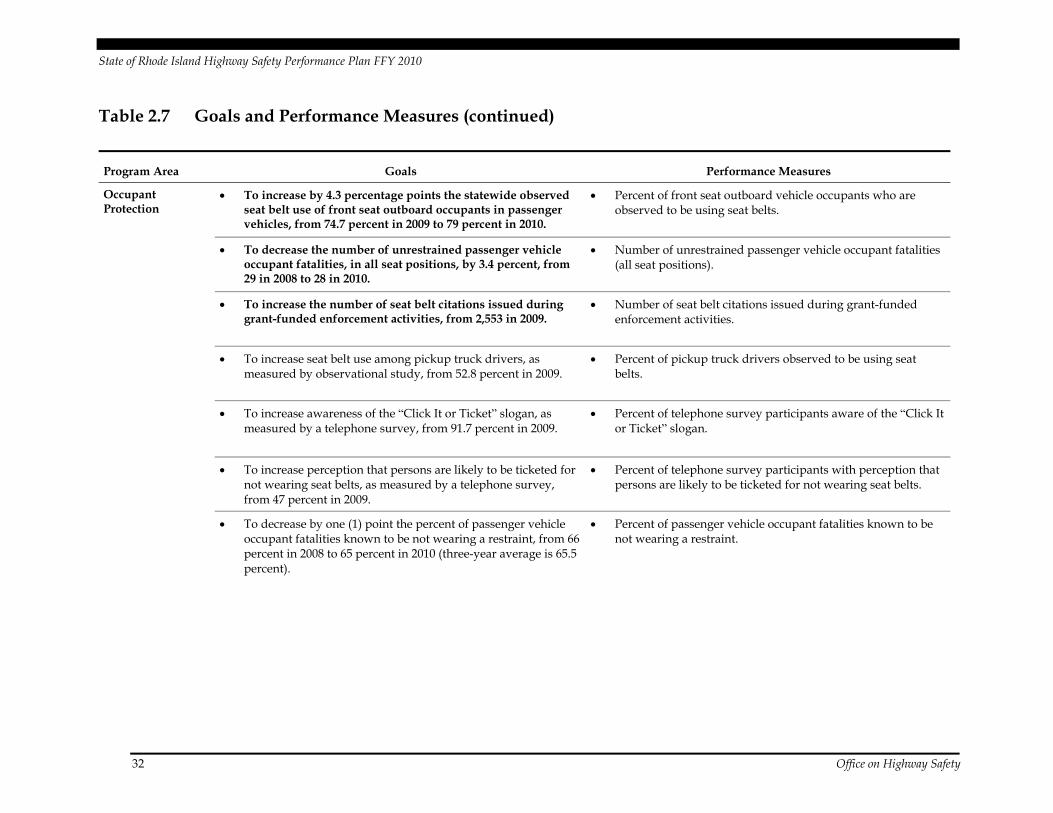
Occupant Protection
• To increase by 4.3 percentage points the statewide observed seat belt use of front seat outboard occupants in passenger vehicles, from 74.7 percent in 2009 to 79 percent in 2010.
• Percent of front seat outboard vehicle occupants who are observed to be using seat belts.
• To decrease the number of unrestrained passenger vehicle occupant fatalities, in all seat positions, by 3.4 percent, from 29 in 2008 to 28 in 2010.
• Number of unrestrained passenger vehicle occupant fatalities (all seat positions).
• To increase the number of seat belt citations issued during grant-funded enforcement activities, from 2,553 in 2009.
• Number of seat belt citations issued during grant-funded enforcement activities.
• To increase seat belt use among pickup truck drivers, as measured by observational study, from 52.8 percent in 2009.
• Percent of pickup truck drivers observed to be using seat belts.
• To increase awareness of the “Click It or Ticket” slogan, as measured by a telephone survey, from 91.7 percent in 2009.
• Percent of telephone survey participants aware of the “Click It or Ticket” slogan.
• To increase perception that persons are likely to be ticketed for not wearing seat belts, as measured by a telephone survey, from 47 percent in 2009.
• Percent of telephone survey participants with perception that persons are likely to be ticketed for not wearing seat belts.
• To decrease by one (1) point the percent of passenger vehicle occupant fatalities known to be not wearing a restraint, from 66 percent in 2008 to 65 percent in 2010 (three-year average is 65.5 percent).
• Percent of passenger vehicle occupant fatalities known to be not wearing a restraint.
State of Rhode Island Highway Safety Performance Plan FFY 2010
Office on Highway Safety 33
Table 2.7 Goals and Performance Measures (continued)
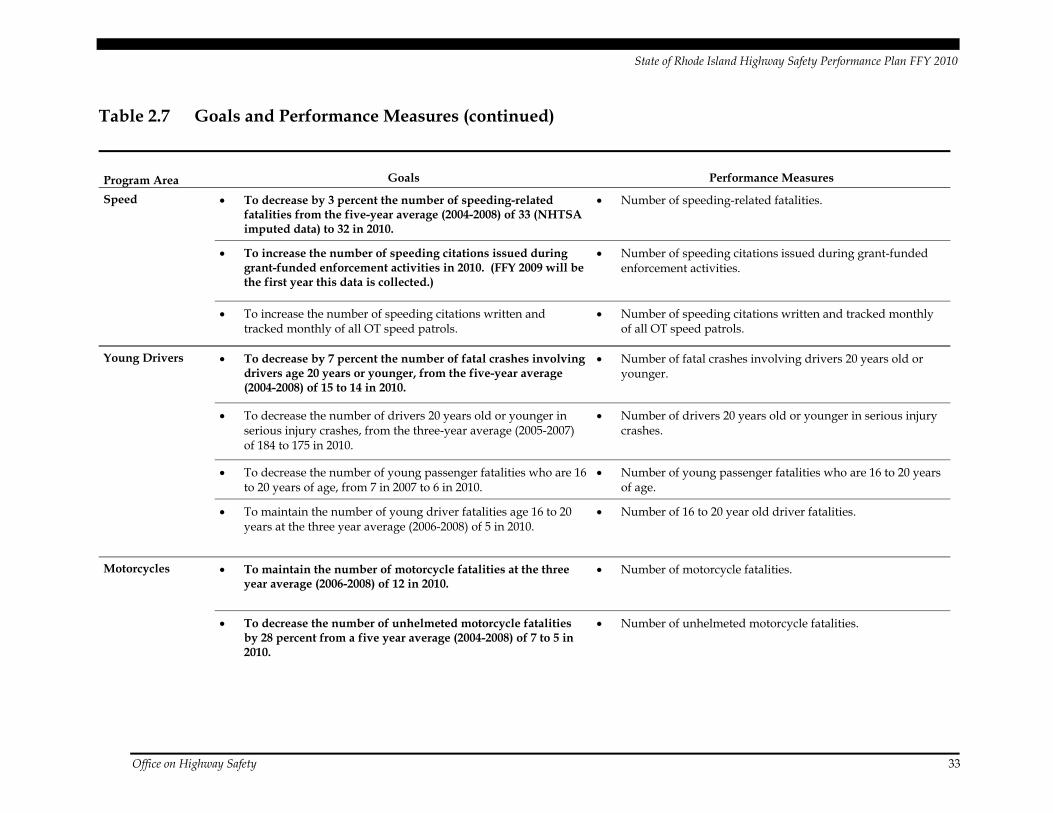
Program Area Goals Performance Measures
Speed • To decrease by 3 percent the number of speeding-related fatalities from the five-year average (2004-2008) of 33 (NHTSA imputed data) to 32 in 2010.
• Number of speeding-related fatalities.
• To increase the number of speeding citations issued during grant-funded enforcement activities in 2010. (FFY 2009 will be the first year this data is collected.)
• Number of speeding citations issued during grant-funded enforcement activities.
• To increase the number of speeding citations written and tracked monthly of all OT speed patrols.
• Number of speeding citations written and tracked monthly of all OT speed patrols.
Young Drivers • To decrease by 7 percent the number of fatal crashes involving drivers age 20 years or younger, from the five-year average (2004-2008) of 15 to 14 in 2010.
• Number of fatal crashes involving drivers 20 years old or younger.
• To decrease the number of drivers 20 years old or younger in serious injury crashes, from the three-year average (2005-2007) of 184 to 175 in 2010.
• Number of drivers 20 years old or younger in serious injury crashes.
• To decrease the number of young passenger fatalities who are 16 to 20 years of age, from 7 in 2007 to 6 in 2010.
• Number of young passenger fatalities who are 16 to 20 years of age.
• To maintain the number of young driver fatalities age 16 to 20 years at the three year average (2006-2008) of 5 in 2010.
• Number of 16 to 20 year old driver fatalities.
Motorcycles • To maintain the number of motorcycle fatalities at the three year average (2006-2008) of 12 in 2010.
• Number of motorcycle fatalities.
• To decrease the number of unhelmeted motorcycle fatalities by 28 percent from a five year average (2004-2008) of 7 to 5 in 2010.
• Number of unhelmeted motorcycle fatalities.

State of Rhode Island Highway Safety Performance Plan FFY 2010
34 Office on Highway Safety
Table 2.7 Goals and Performance Measures (continued)
Program Area Goals Performance Measures Motorcycles (continued)
• To decrease by two (2) percentage points all motorcycle operator crash fatalities with a known BAC of .01 or higher, from the five-year average (2003 to 2007) of 50 percent to 48 percent in 2010.
• Percent of all motorcycle operator crash fatalities with a known BAC of .01 or higher.
• To decrease by 5 percentage points motorcycle operator fatalities who were legally intoxicated, from the five year average of 50 percent (2004-2008) (NHTSA imputed) to 45 percent in 2010.
• Percent of motorcycle operator fatalities who were legally intoxicated.
Other Road Users • To maintain the number of crash fatalities among pedestrians at or below its five-year average (2004-2008) of 12 in 2010.
• Number of pedestrian fatalities.
• To maintain zero crash fatalities among school bus occupants in 2010.
• Number of crash fatalities among school bus occupants.
• To reduce crash fatalities among bicyclists from 1 in 2008 to zero in 2010.
• Number of bicyclist fatalities.
• To decrease by 25 percent the number of pedestrian fatalities with a BAC of .08 or greater, from the five-year average (2004-2008) (NHTSA imputed) of 4 to 3 in 2010.
• Number of pedestrian fatalities with a known BAC or .08 or greater.
Traffic Records • To increase the timeliness of E-citation data from police and state and Municipal Courts being posted into the system, from monthly in 2009 to daily in 2010.
• Number of days necessary for E-citation data from police and state and Municipal Courts to be posted into the system.
• To increase by 19 the number of Law Enforcement Agencies backfilling data into citations, from 6 in 2009 to 25 in 2010.
• Number of Law Enforcement Agencies backfilling data into citations.

State of Rhode Island Highway Safety Performance Plan FFY 2010
Office on Highway Safety 35
Table 2.7 Goals and Performance Measures (continued)
Program Area Goals Performance Measures Racial Profiling • To establish a process and secure the infrastructure needed to
determine if racial profiling is occurring and to identify appropriate program recommendations if necessary.
• To produce by means of data collection and analysis by an appropriate entity at least one quarterly comprehensive report, including passenger and driver ethnicity information, summarizing the traffic stop information from all police departments who have received computer equipment.
• Finalize installation of computers and printers in all law enforcement vehicles to collect traffic stop information.
• Have IMC complete module change to include ethnicity of passengers on the traffic stop form and provide mechanism to transmit information from police departments to the designated data collection entity.
• Begin work on developing independent software program that would allow all police departments to transmit required information regardless of their software service provider.
• Implement contract with the college/university or research institution that is chosen in the RFP process to collect, analyze, and distribute traffic stop data and to make programmatic recommendations.
Planning and Administration
• To administer a fiscally responsible, effective highway safety program that is data driven, includes stakeholders, and addresses the State’s specific safety characteristics.
• Integrate recommendations from NHTSA’s Special Management Review (PEP) within specified timeframe.
• Conduct a Stakeholders’ meeting to receive input for development of the FFY 2011 Highway Safety Performance Plan.
• Deliver the FFY 2009 Annual Report by December 31, 2009.
• Deliver the Federal Fiscal Year 2011 Highway Safety Performance Plan by September 1, 2010.

State of Rhode Island Highway Safety Performance Plan FFY 2010
Office on Highway Safety 37
3.0 Highway Safety Plan: Program Areas for FFY 2010
3.1 Impaired Driving
Problem Identification and Analysis
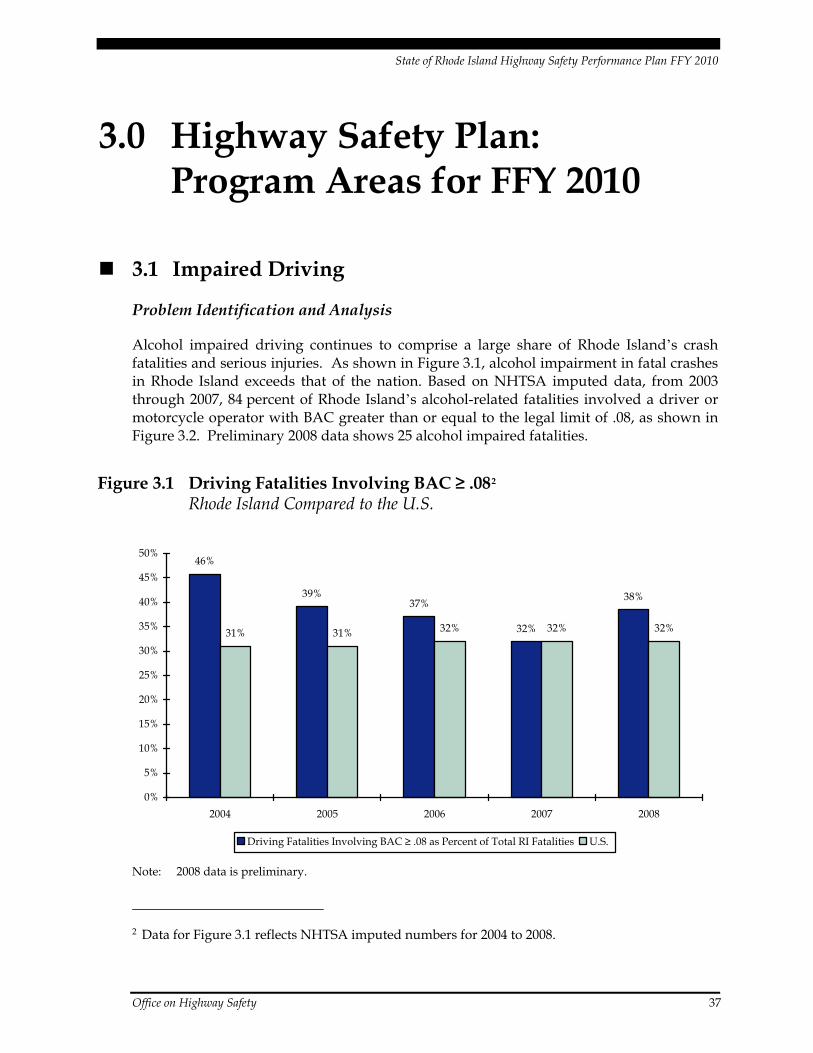
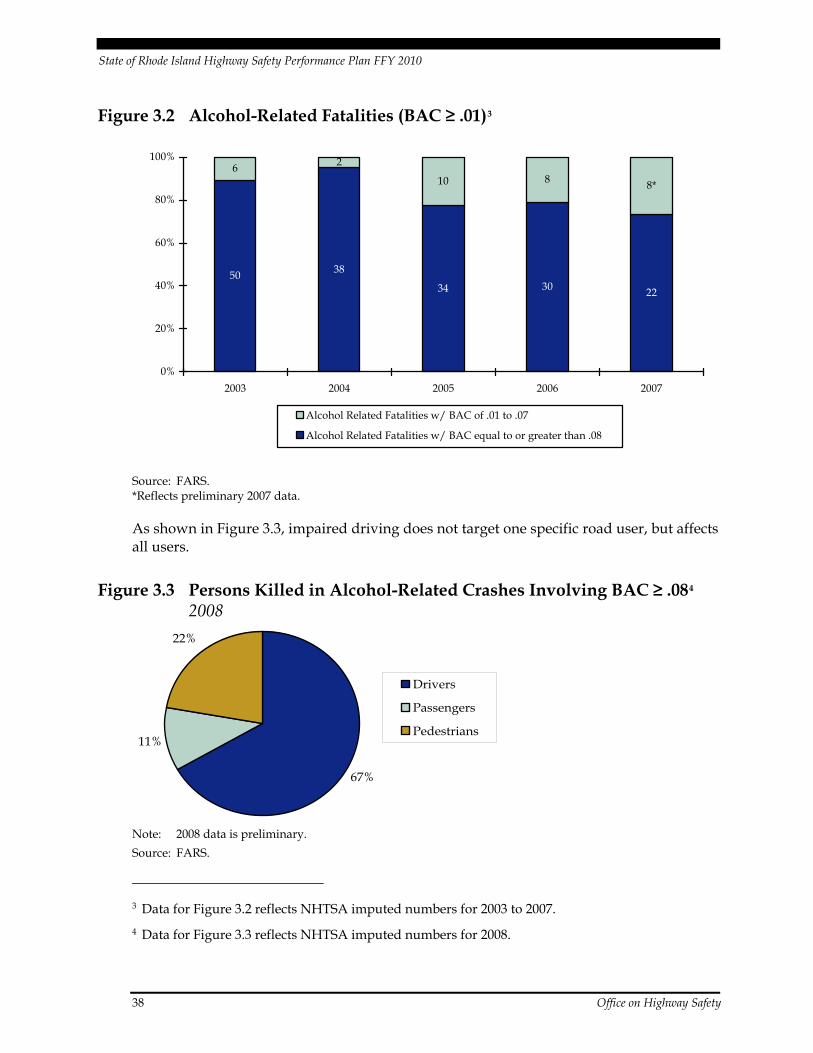
Alcohol impaired driving continues to comprise a large share of Rhode Island’s crash fatalities and serious injuries. As shown in Figure 3.1, alcohol impairment in fatal crashes in Rhode Island exceeds that of the nation. Based on NHTSA imputed data, from 2003 through 2007, 84 percent of Rhode Island’s alcohol-related fatalities involved a driver or motorcycle operator with BAC greater than or equal to the legal limit of .08, as shown in Figure 3.2. Preliminary 2008 data shows 25 alcohol impaired fatalities.
Figure 3.1 Driving Fatalities Involving BAC ≥ .082 Rhode Island Compared to the U.S.
46%
39%37%
32%
38%
31% 31% 32% 32% 32%
0%
5%
10%
15%
20%
25%
30%
35%
40%
45%
50%
2004 2005 2006 2007 2008
Driving Fatalities Involving BAC ≥ .08 as Percent of Total RI Fatalities U.S.
Note: 2008 data is preliminary.
2 Data for Figure 3.1 reflects NHTSA imputed numbers for 2004 to 2008.
State of Rhode Island Highway Safety Performance Plan FFY 2010
38 Office on Highway Safety
Figure 3.2 Alcohol-Related Fatalities (BAC ≥ .01)3
50 38
34 30
2
10 8
22
68*
0%
20%
40%
60%
80%
100%
2003 2004 2005 2006 2007
Alcohol Related Fatalities w/ BAC of .01 to .07
Alcohol Related Fatalities w/ BAC equal to or greater than .08
Source: FARS. *Reflects preliminary 2007 data.
As shown in Figure 3.3, impaired driving does not target one specific road user, but affects all users.
Figure 3.3 Persons Killed in Alcohol-Related Crashes Involving BAC ≥ .084 2008
67%
11%
22%
Drivers
Passengers
Pedestrians
Note: 2008 data is preliminary. Source: FARS.
3 Data for Figure 3.2 reflects NHTSA imputed numbers for 2003 to 2007. 4 Data for Figure 3.3 reflects NHTSA imputed numbers for 2008.

State of Rhode Island Highway Safety Performance Plan FFY 2010
Office on Highway Safety 39
Based on NHTSA imputed data, from 2003 to 2007, the highest percentage of alcohol-related crashes in Rhode Island occurred in March, July, and August; on Saturdays and Sundays; with the majority occurring between the hours of 9:00 p.m. and 3:00 a.m.
Several state laws and policies impact how the State is able to identify, enforce, and report on impaired driving:
• In July 2003, Rhode Island enacted a law making it a crime for anyone to operate a motor vehicle with a BAC of .08 or above. For young drivers, a BAC level of .02 results in license suspension until the age of 21.
• Sobriety checkpoints are constitu-tionally banned in Rhode Island.
• A police officer may not indicate suspi-cion of alcohol involvement in a crash report.
• BAC testing is often performed only on persons who are killed in a crash and not on surviving drivers.
• Prior to June 28, 2006, refusing a chemical test carried a lower penalty than a DUI, and citations for chemical test refusals continued to increase. The significant number of refusals severely limited the availability of Blood Alcohol Concentration (BAC) data, impeding proper problem identification. On June 28, 2006, Governor Carcieri signed into law legislation doubling the license suspension for a first offense refusal. Additionally, second and subsequent offenses were criminalized; fines, imprisonment, and license suspensions were increased; and community service was required. The intent of the law is to make the choice of chemical test refusal less attractive and increase BAC data. To accurately measure the impact of the law, multiple years of data will need to be analyzed.
Of the 81 drivers and motorcycle operators involved in fatal crashes in 2008, 65 percent were male (53 male; 25 female; and 3 unknown or “blank”). Table 3.1 provides the BAC test results for these drivers.
Dan DiBiasio hosts the OHS Traffic Safety Booth at a RIPCA event
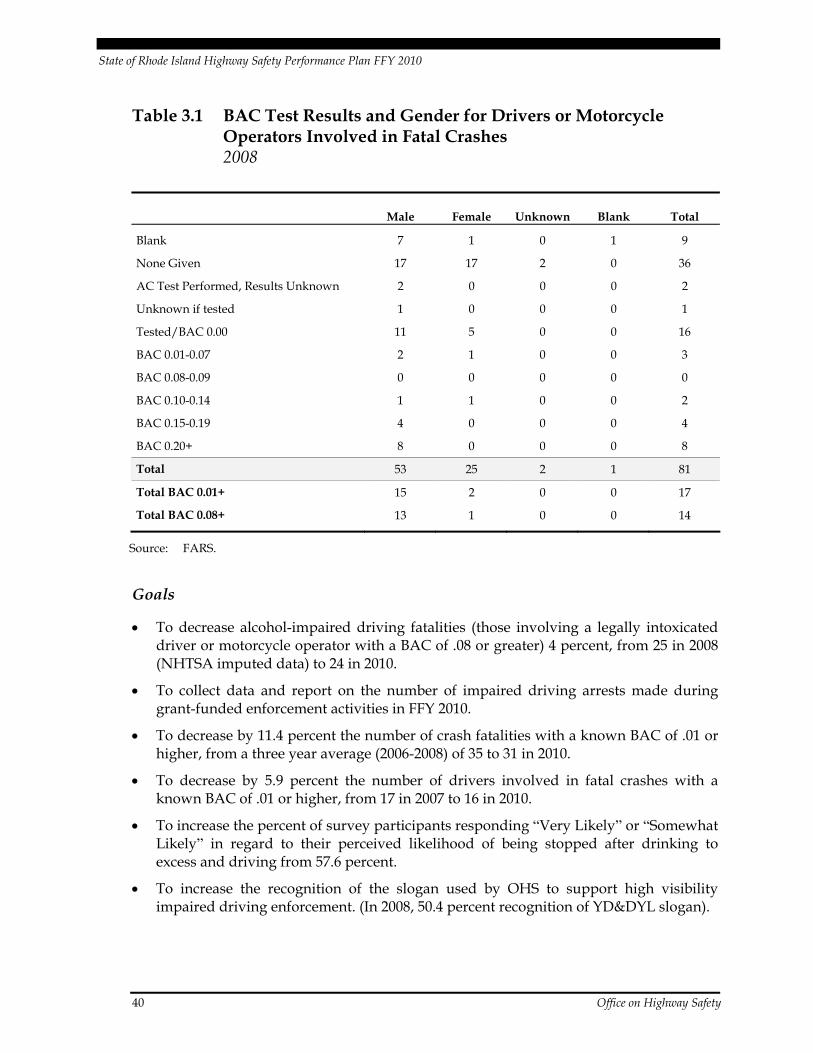
State of Rhode Island Highway Safety Performance Plan FFY 2010
40 Office on Highway Safety
Table 3.1 BAC Test Results and Gender for Drivers or Motorcycle Operators Involved in Fatal Crashes 2008
Male Female Unknown Blank Total
Blank 7 1 0 1 9
None Given 17 17 2 0 36
AC Test Performed, Results Unknown 2 0 0 0 2
Unknown if tested 1 0 0 0 1
Tested/BAC 0.00 11 5 0 0 16
BAC 0.01-0.07 2 1 0 0 3
BAC 0.08-0.09 0 0 0 0 0
BAC 0.10-0.14 1 1 0 0 2
BAC 0.15-0.19 4 0 0 0 4
BAC 0.20+ 8 0 0 0 8
Total 53 25 2 1 81
Total BAC 0.01+ 15 2 0 0 17
Total BAC 0.08+ 13 1 0 0 14
Source: FARS.
Goals
• To decrease alcohol-impaired driving fatalities (those involving a legally intoxicated driver or motorcycle operator with a BAC of .08 or greater) 4 percent, from 25 in 2008 (NHTSA imputed data) to 24 in 2010.
• To collect data and report on the number of impaired driving arrests made during grant-funded enforcement activities in FFY 2010.
• To decrease by 11.4 percent the number of crash fatalities with a known BAC of .01 or higher, from a three year average (2006-2008) of 35 to 31 in 2010.
• To decrease by 5.9 percent the number of drivers involved in fatal crashes with a known BAC of .01 or higher, from 17 in 2007 to 16 in 2010.
• To increase the percent of survey participants responding “Very Likely” or “Somewhat Likely” in regard to their perceived likelihood of being stopped after drinking to excess and driving from 57.6 percent.
• To increase the recognition of the slogan used by OHS to support high visibility impaired driving enforcement. (In 2008, 50.4 percent recognition of YD&DYL slogan).
State of Rhode Island Highway Safety Performance Plan FFY 2010
Office on Highway Safety 41
Performance Measures
• Number of fatalities involving a driver or motorcycle operator with a BAC of .08 or greater.
• Number of impaired driving arrests made during grant-funded enforcement activities.
• Number of crash fatalities with a known BAC of .01 or higher.
• Number of drivers involved in fatal crashes with a known BAC of .01 or higher.
• Percent of survey participants responding “Very Likely” or “Somewhat Likely” in regards to their perceived likelihood of being stopped after drinking to excess and driving.
• Percent of survey respondents reporting slogan recognition.
Strategic Partners
OHS will expand working relationships with those involved in the arrest, prosecution, and adjudication of impaired drivers. A well-trained police force can identify and arrest impaired drivers before they injure themselves or others. OHS began utilizing the Rhode Island Municipal Police Academy to expand the number of SFST and Drug Recognition Expert (DRE) trained local law enforcement personnel in late FFY 2009. We will implement a greater number of trainings in FFY 2010.
These OHS initiatives complement the activities of other partners, such as MADD and SADD; MHRH Division of Behavioral Health Care Services’ Enforcing the Underage Drinking Laws Advisory Committee; Substance Abuse Task Forces; the Department of Health and its Injury Prevention Plan; the Attorney General’s Office; the Department of Corrections; the University of Rhode Island’s Transportation Research Center and the Judiciary.
Strategies
1. Increase average frequency of Operation Blue RIPTIDE patrols.
2. Include impaired driving information on RIDOT web site.
3. Expand impaired driving resources for state and local law enforcement agencies:
− Conduct High Visibility Enforcement (HVE) mobilizations and monthly sustained DUI enforcement programs, supported by participation in the Variable Message Sign (VMS) program. The VMS program is an incentive program launched in FFY 2009 for all local police departments and RISP for participating in a minimum number of speed, CIOT, and driving while intoxicated (DWI) patrols. VMS purchased in FFY 2009 will be on indefinite loan to law enforcement agencies to use, with appropriate messaging, for all OHS-funded patrols. (Supports idea of VMS use, as delineated in Non-Checkpoint State meeting in Texas and endorsed by NHTSA Region 1.) Participating agencies also are encouraged to apply for the
State of Rhode Island Highway Safety Performance Plan FFY 2010
42 Office on Highway Safety
International Association of Chiefs of Police “Law Enforcement Challenge” Award Program.
− Offer DRE and SFST refresher training courses via LEHSTC, the latter in coordination with those offered by the RI Department of Health/Forensic Sciences, Breath Analysis Unit.
− Institute LEHSTC management of Operation Blue RIPTIDE and continue LEHSTC outreach to police chiefs and implementation of traffic safety training initiatives.
− Increase DUI conviction rate as a result of more timely analysis of specimens by the RI Department of Health/Forensic Sciences, Breath Analysis Unit.
4. Expand media messages, including participation in national HVE mobilizations:
− Conduct HVE Media Campaign.
− Implement coordinated paid and earned media plan with summer program messaging.
− Promote public awareness of regional saturation patrols under Operation Blue RIPTIDE.
− Promote the State Police DUI Hot line (*77).
− Develop culturally appropriate messages and expand minority outreach efforts.
5. Integrate youth programs to prevent underage drinking.
6. Continue to fund the MADD Rhode Island Team Spirit Leadership Training, which employs peer-to-peer and environmental underage drinking-and-driving prevention models.
7. Improve collection and analysis of impaired driving data on highway safety in Rhode Island:
− Increase the quantity of BAC data in the FARS and EARS files.
− Improve the quality and coordination of alcohol-related databases.
− Continue to work with TSRP to evaluate the impact of Rhode Island’s breath test refusal law on refusal rates.
8. Fund 66.6 percent of the salary of a TSRP within the Attorney General’s Office.
9. Fund 100 percent of the salary of a Traffic Safety Resource Forensic Toxicologist within the Department of Health.
10. Develop Alcohol Impaired Driving Social Marketing Programs statewide via the URI’s Transportation Resource Center (IP2 – Intervention Pilot Program).
11. Educate higher education leaders about the benefits of the “Age 21” drinking age and the alcohol policies of Rhode Island institutes of higher learning.

State of Rhode Island Highway Safety Performance Plan FFY 2010
Office on Highway Safety 43
12. Designate a permanent, statewide mourning site, a safe location that would be available 24 hours a day, 7 days a week to be used as a gathering place for mourners after any type of crash fatality. RIDOT will consider placing a “wall of names” at the site to be part of the memorial.
13. Include program management and oversight for all activities within this priority area.
Programs and Projects
Project Title – Drug Recognition Expert (DRE) Training and Statewide Program
Project Description – OHS will reinvigorate the DRE training and program implementation through the Municipal Police Academy’s Law Enforcement Highway Safety Training Coordinator.
Project Staff – Jim Barden
Project Budget/Source – $15,000 of Section 402AL
Project Title – Permanent Statewide Safe Mourning Site
Project Description – Temporary memorials have been established at the site of fatal crashes around the state. Vigils are held and mementoes are placed, many times without careful consideration of location or obstruction of traffic. Often, by their very nature, these sites are in dangerous locations and place those mourning the victim in dangerous, unsafe conditions, as well. (Rhode Island suffered the fatality of a mourning student at a fatality site several years ago, thus compounding the tragedy.) This initiative would establish a safe location that would be available 24 hours a day/7 days a week to be used as a gathering place for mourners after any type of crash fatality. A Wall of Names will be considered.
Project Staff – OHS administrator and all program managers.
Project Budget/Source – $20,000 of Sections 402AL, $20,000 of Section 402OP and $80,000 of Section 164AL
Project Title – Youth in Action
Project Description – MADD Youth In Action (YIA) helps young people focus on law enforcement, educational and policy level changes that impact underage drinking and occupant protection. It provides an opportunity for youth to build a community-based coalition and activities to change community norms regarding underage drinking and impaired driving.
Project Staff – Dan DiBiasio
Project Budget/Source – $7,500 of Section 402OP and $7,500 of Section 164AL
State of Rhode Island Highway Safety Performance Plan FFY 2010
44 Office on Highway Safety
Project Title – “You Drink & Drive. You Lose” Impaired Driving (YD&DYL) Law Enforcement Patrols
Project Description – Implementation of YD&DYL overtime enforcement patrols by local city/town/state police departments. Potential for 38 participating communities and the State Police. All participants are funded to participate in the two YD&DYL annual mobilizations scheduled for December 2009 and August 20-September 6, 2010. Patrols are conducted on Thursday, Friday, and/or Saturday evenings. Participating officers must be fully trained in the use of SFST or DRE detection techniques. This also includes RISP C.A.R.E. patrols.
Project Staff – Jim Barden
Project Budget/Source – $200,000 of Section 410, $138,500 Section 164AL, $2,375 of Section 402AL
Project Title – Department of Environmental Management (DEM) Park/Beach Impaired Driving Patrols
Project Description –This would provide DEM patrols in the vicinity of boat launch areas during hours identified thorough data-driven problem analysis.
Project Staff – Jim Barden
Project Budget/Source – $25,000 of Section 164AL
Project Title – Intoxilyzers for State and Local Law Enforcement
Project Description – To ensure that all law enforcement have appropriate equipment to support their DUI arrests, OHS will reimburse the purchase of five new intoxilyzers to municipal police departments needing replacement of these machines. OHS will maintain the inventory for this equipment in accordance with Federal and state requirements.
Project Staff – Jim Barden
Project Budget/Source – $28,500 of Section 164AL
Project Title – Portable Breath Testers (PBTs) for State and Local Law Enforcement
Project Description – To ensure that all law enforcement have appropriate equipment to support their DUI arrests, OHS will reimburse the purchase of two new PBTs to each participating municipal police department and the Rhode Island State Police.
Project Staff – Jim Barden
Project Budget/Source – $29,450 of Section 164AL

State of Rhode Island Highway Safety Performance Plan FFY 2010
Office on Highway Safety 45
Project Title – College-Level Alcohol Program
Project Description – This program would compile the alcohol policies of all Rhode Island institutions of higher learning to develop a base matrix of these policies, and convene a meeting of the Presidents of all Rhode Island colleges/universities to review the matrix and highlight best practices.
Project Staff – Janis Loiselle, Jim Barden, and Dan DiBiasio
Project Budget/Source – $50,000 of Section 410
Project Title – Impaired Driving Paid and Earned Media
Project Description – OHS will develop and implement a statewide paid and earned media campaign for the YD&DYL campaigns to coincide with enforcement mobilizations scheduled for December 2009 and August/September 2010 in addition to supporting monthly sustained enforcement. The target audience is 21- to 34-year-old males. Media materials are produced in both English and Spanish and the venues are chosen based on market data for each audience.
Project Staff – Jim Barden and Despina Metakos
Project Budget/Source – $143,250 of Section 402PM, $140,000 of Section 410, $50,000 of Section 164PM
Project Title – Zero Fatalities Project
Project Description – The TSRP worked with the Department of Corrections, MADD and the school departments to develop this innovative project. High school students are brought by school bus to the prison and have listening sessions with prisoners convicted of DUI, death resulting. These prisoners discuss the actions leading up to the incident and the impact it has had on their lives and on those around them. MADD includes families of victims that explain about the impact these fatalities have had on their lives as well. Response from the high schools has been very favorable and a full year of programming is expected, reaching out to every high school.
Project Staff – Jim Barden, Dan DiBiasio, and the TSRP
Project Budget/Source – $15,000 of Section 164AL
Project Title – Alcohol Survey
Project Description – This telephone survey will be conducted following the August/September national impaired driving campaign to determine the behavioral and social impact of the earned and paid media efforts that were conducted prior to and during the mobilization period.
Project Staff – Jim Barden
Project Budget/Source – $25,674 of Section 164AL

State of Rhode Island Highway Safety Performance Plan FFY 2010
46 Office on Highway Safety
Project Title – Court Monitoring
Project Description – OHS is working with MADD and the Attorney General’s Office to implement a pilot DUI court monitoring project.
Project Staff – Janis Loiselle and Jim Barden
Project Budget/Source – $60,000 of Section 164AL
Project Title – MADD Team Spirit
Project Description – MADD Team Spirit is based on the Team Spirit Leadership Training developed and piloted by NHTSA over 13 years ago. MADD RI has, however, added an environmental approach to the original peer-to-peer model. The program includes the education component, and also addresses the desire of the students to change the law and the norms surrounding drunk driving and underage drinking by offering opportunities to be involved with these processes. The mechanics of the program are youth led and youth driven. The 30 teens, with a program coordinator, plan, develop, implement, and evaluate the program each year.
Project Staff – Jim Barden
Project Budget/Source – $40,000 of Section 164AL
Project Title – Standardized Field Sobriety Test (SFST) Refresher Training
Project Description – OHS will conduct SFST Refresher Training courses through the Municipal Police Academy’s Law Enforcement Highway Safety Training Coordinator.
Project Staff – Jim Barden
Project Budget/Source – $30,000 of Section 164AL
Project Title – Traffic Safety Resource Prosecutor (TSRP)
Project Description – OHS pays two-thirds of the salary of John E. Sullivan III, Esq. from the Attorney General’s staff, who serves as the Transportation Safety Resource Prosecutor.
Project Staff – Jim Barden
Project Budget/Source – $100,000 of Section 164AL
Project Title – IP2 (Intervention Pilot Project) Social Marketing Program
Project Description – OHS is working with the University of Rhode Island Transportation Center (URITC) and has developed a “Request for Proposals” to address the alcohol challenges within our state using a social marketing approach. Potential responders would be local communities, town and/or community advocates with proposals for program implementation. Research projects will not be eligible. A review board will
State of Rhode Island Highway Safety Performance Plan FFY 2010
Office on Highway Safety 47
review the proposals, rank and select proposals, with final OHS approval. In concert with OHS, the URITC has developed program guidelines and requirements; a statewide “Request for Proposals;” and will monitor monthly reports for benchmarks and deliverables with final reimbursements approved by OHS. OHS believes that this will provide more community input into programming and can potentially result in a broader network of creative program providers.
Project Staff – Janis Loiselle, Jim Barden, and Dan DiBiasio
Project Budget/Source – $316,776 of Section 164AL
Project Title – Resource Center
Project Description – OHS maintains appropriate resource materials/promotional materials for use at local and state programs for all age levels addressing, among other issues: child passenger safety, “Click It or Ticket,” YD&DYL, “Obey the Sign or Pay the Fine,” graduated drivers licensing (GDL), and underage alcohol use.
Project Staff – Administrator and all program managers
Project Budget/Source – $20,000 of Section 164AL
Project Title – Law Enforcement Highway Safety Training Coordinator (LEHSTC)
Project Description – The Rhode Island Municipal Police Academy is employing a full-time contract employee with OHS funds to serve as the LEHSTC, an integral component of all the law enforcement programs. The LEHSTC will promote law enforcement participation in Operation Blue RIPTIDE, conduct outreach to police chiefs, and provide traffic safety training.
Project Staff – Administrator and all program managers
Project Budget/Source – $19,600 of Section 402PT, $1,600 of Section 402AL, $13,281 of 405, $19,600 of 1906, and $19,600 of 164AL
Project Title – Creative Media
Project Description – OHS does not have the ability to actually create and produce the ads for each of its major campaigns. Therefore, OHS is conducting an RFP and will then sign a contract for creative media with the selected public relations firm.
Project Staff – Jim Barden
Project Budget/Source – $200,000 of Section 402PM

State of Rhode Island Highway Safety Performance Plan FFY 2010
48 Office on Highway Safety
Project Title – Traffic Safety Resource Forensic Toxicologist (TSRFT)
Project Description – OHS will pays two-thirds of the salary of a Full-time Equivalent, who will serve as the Traffic Safety Resource Forensic Toxicologist at the Rhode Island Department of Health, Forensics Laboratory.
Project Staff – Jim Barden
Project Budget/Source – $52,000 of Section 402AL
Project Title – Riders Helping Riders (RHR) Training Program
Project Description – OHS will initiate and host one RHR training program to encourage a partnership with the motorcycle community to assist in identifying impaired operators and to work to keep them off the roadways. The RHR program is an instructional program designed to encourage motorcyclists to intervene to prevent drinking and riding by their motorcyclist peers. The program is based on focus group research which found that riders consider themselves to be united by an interest in riding, and willing to help other riders in need, but that a sense of individualism limits the extent to which riders are willing to intervene in drinking and riding.
RHR is intended to convince motorcyclists that an impaired rider needs their help, and that they are in the best position to provide help. The program provides a “toolkit” of techniques for separating drinking from riding, discouraging impaired riders from riding. An optional role-playing module is included. At the end of class, students are asked to sign a pledge to do their best to help an impaired rider live to ride another day.
RHR was developed with the assistance of instructors from the South Carolina Rider Education Program and pilot tested by instructors of Georgia’s Department of Driver Services, Motorcycle Safety Program.
Project Staff – Despina Metakos
Project Budget/Source – $100,000 of Section 410
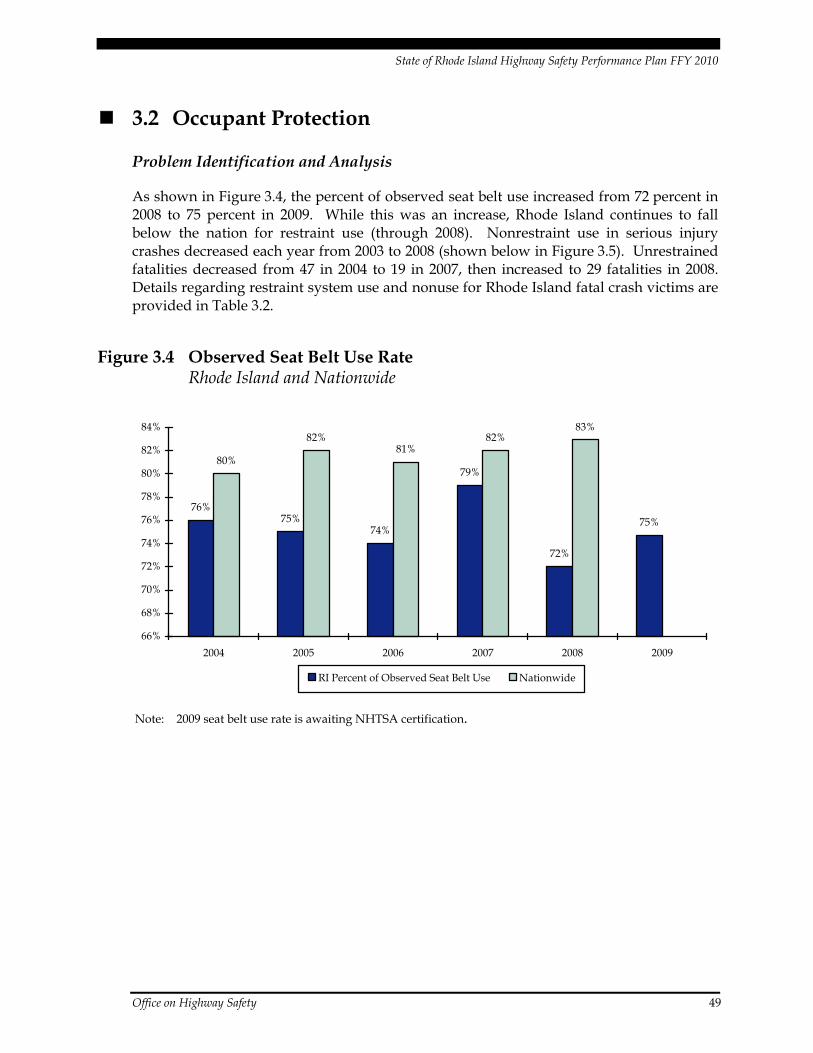
State of Rhode Island Highway Safety Performance Plan FFY 2010
Office on Highway Safety 49
3.2 Occupant Protection
Problem Identification and Analysis
As shown in Figure 3.4, the percent of observed seat belt use increased from 72 percent in 2008 to 75 percent in 2009. While this was an increase, Rhode Island continues to fall below the nation for restraint use (through 2008). Nonrestraint use in serious injury crashes decreased each year from 2003 to 2008 (shown below in Figure 3.5). Unrestrained fatalities decreased from 47 in 2004 to 19 in 2007, then increased to 29 fatalities in 2008. Details regarding restraint system use and nonuse for Rhode Island fatal crash victims are provided in Table 3.2.
Figure 3.4 Observed Seat Belt Use Rate Rhode Island and Nationwide
76%75%
74%
79%
72%
75%
80%
82%81%
82%83%
66%
68%
70%
72%
74%
76%
78%
80%
82%
84%
2004 2005 2006 2007 2008 2009
RI Percent of Observed Seat Belt Use Nationwide
Note: 2009 seat belt use rate is awaiting NHTSA certification.
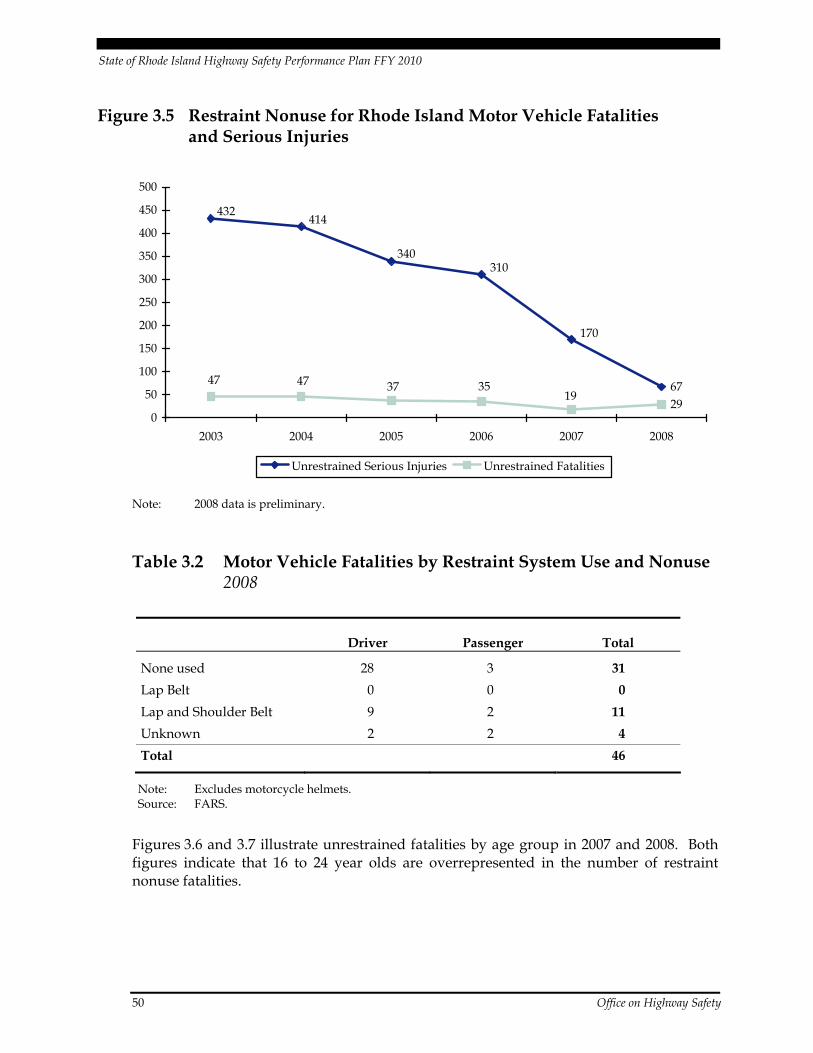
State of Rhode Island Highway Safety Performance Plan FFY 2010
50 Office on Highway Safety
Figure 3.5 Restraint Nonuse for Rhode Island Motor Vehicle Fatalities and Serious Injuries
6729
170
310340
414432
1935374747
0
50
100
150
200
250
300
350
400
450
500
2003 2004 2005 2006 2007 2008
Unrestrained Serious Injuries Unrestrained Fatalities
Note: 2008 data is preliminary.
Table 3.2 Motor Vehicle Fatalities by Restraint System Use and Nonuse 2008
Driver Passenger Total
None used 28 3 31 Lap Belt 0 0 0 Lap and Shoulder Belt 9 2 11 Unknown 2 2 4 Total 46
Note: Excludes motorcycle helmets. Source: FARS.
Figures 3.6 and 3.7 illustrate unrestrained fatalities by age group in 2007 and 2008. Both figures indicate that 16 to 24 year olds are overrepresented in the number of restraint nonuse fatalities.

State of Rhode Island Highway Safety Performance Plan FFY 2010
Office on Highway Safety 51
Figure 3.6 Number of Restraint Nonuse Fatalities by Age Group 2007
2(12%)
3(18%)
3(18%)
2 (13%)
2(13%)
2(13%)
2(13%)
16-2021-2425-3435-4445-5455-6465+
Note: Excludes motorcycle operators and passengers.
Figure 3.7 Number of Restraint Nonuse Fatalities by Age Group 2008
2(9%)4
(17%)
3(13%)
3(13%)
2(9%)
9(39%)
16-2021-2425-3435-4445-5455-6465+
Notes: Excludes motorcycle operators and passengers. 2008 data is preliminary.
State of Rhode Island Highway Safety Performance Plan FFY 2010
52 Office on Highway Safety
Goals
• To increase by 4.3 percentage points the statewide observed seat belt use of front seat outboard occupants in passenger vehicles, from 74.7 percent in 2009 to 79 percent in 2010.
• To decrease the number of unrestrained passenger vehicle occupant fatalities, in all seat positions, by 3.4 percent, from 29 in 2008 to 28 in 2010.
• To increase the number of seat belt citations issued during grant-funded enforcement activities, from 2,553 in 2009.
• To increase seat belt use among pickup truck drivers, as measured by observational study, from 52.8 percent in 2009.
• To increase awareness of the “Click It or Ticket” slogan, as measured by a telephone survey, from 91.7 percent in 2009.
• To increase perception that persons are likely to be ticketed for not wearing seat belts, as measured by a telephone survey, from 47 percent in 2009.
• To decrease by one (1) point the percent of passenger vehicle occupant fatalities known to be not wearing a restraint, from 66 percent in 2008 to 65 percent in 2010 (three-year average is 65.5 percent).
Performance Measures
• Percent of front seat outboard vehicle occupants who are observed to be using seat belts.
• Number of unrestrained passenger vehicle occupant fatalities (all seat positions).
• Number of seat belt citations issued during grant-funded enforcement activities.
• Percent of pickup truck drivers observed to be using seat belts.
• Percent of telephone survey participants aware of the “Click It or Ticket” slogan.
• Percent of telephone survey participants with perception that persons are likely to be ticketed for not wearing seat belts.
• Percent of passenger vehicle occupant fatalities known to be not wearing a restraint.
Strategic Partners
Currently, the OHS works primarily with 37 local law enforcement agencies and the Rhode Island State Police as partners for national traffic safety initiatives to increase safety belt use. OHS will be expanding this network to include:
• A school-based network to promote safety belt use, with a focus on teens; and
• A community-based network to promote safety belt use by establishing connections with local organizations, senior centers, and religious leaders.
State of Rhode Island Highway Safety Performance Plan FFY 2010
Office on Highway Safety 53
Strategies
1. Increase awareness among drivers that Rhode Island law requires all drivers and passengers to wear safety belts, and increase the perception of Rhode Island drivers that an adult who is not wearing a safety belt will be cited by police:
− Conduct a CIOT Media Campaign;
− Conduct a CIOT Enforcement Campaign (two weeks from 5/24/10 to 6/06/10);
− Seek to re-engage the RI Interscholastic League to cosponsor the Fourth Annual Teens on the Rhode Television/Radio Commercial Contest (partnership with RISP, AAA, and media partners); and
− Maintain aggressive sports-marketing campaign.
2. In media and education programs, address at-risk communities (males, pickup truck drivers, counties with a high percentage of unbelted fatalities, and low belt-use rate counties):
− Conduct CIOT Media Campaign, including a special component for pickup truck drivers and passengers;
− Continue CIOT Media Campaign;
− Continue to aggressively deploy the RISP Rollover Simulator to demonstrate the value of seat belt use;
− Initiate community-based outreach to at-risk populations; and
− Develop culturally appropriate messages to expand minority outreach efforts.
3. Encourage the use of appropriate child passenger safety (CPS) restraint systems among children under eight years of age:
− Work with state and local law enforcement to conduct CPS clinics throughout the State; and
− Increase public awareness of the booster seat law that requires use of child restraints up to age eight.
4. Continue Professional Traffic Stop and Traffic Occupant Protection Strategies (TOPS) training for police officers.
5. Provide decision-makers within the legislature and the minority communities information on the value of a primary seat belt law.
6. Collect and analyze Rhode Island occupant protection data:
− Conduct the annual observation and telephone surveys of occupant protection use.
State of Rhode Island Highway Safety Performance Plan FFY 2010
54 Office on Highway Safety
7. Continue to work with NHTSA on the Performance Enhancement Plan (PEP) to implement recommendations of the Occupant Protection Special Management Review.
8. Include program management and oversight for all activities within this priority area.
Programs and Projects
Project Title – “Click It or Ticket” (CIOT) Law Enforcement Patrols
Project Description – OHS will fund implementation of the CIOT overtime enforcement patrols by local city/town/State police departments, with the potential for 38 participating communities and the State police. Patrols are conducted during daylight hours and there is mandatory participation for the national mobilization, May 24-June 6, 2010.
Project Staff – Jim Barden
Project Budget/Source – $113,000 of Section 402OP and $4,750 of Section 405
Project Title – Child Passenger Safety (CPS)
Project Description – This project funds training for law enforcement and other personnel to become certified CPS technicians. Monies also are included for law enforcement personnel to conduct seat belt checks and/or CPS clinics.
Project Staff – Jim Barden
Project Budget/Source – $140,000 of Section 402OP
Project Title – CIOT Observational Survey
Project Description – OHS has finalized a contract to have the annual “Mini-Pre” paid and earned media and enforcement observational seat belt use survey conducted in May and the full observational seat belt survey following the enforcement period, according to NHTSA regulations.
Project Staff – Jim Barden
Project Budget/Source – $27,345 of Section 402OP
Project Title – Occupant Protection Paid and Earned Media
Project Description – OHS will develop and implement a statewide paid and earned media campaign for the CIOT campaign scheduled for May 2010. The target audience will be 16- to 34-year-old males. Media materials will be produced in both English and Spanish and the venues will be chosen based on market data for each audience.
Project Staff – Jim Barden
Project Budget/Source – $318,000 of Section 402PM
State of Rhode Island Highway Safety Performance Plan FFY 2010
Office on Highway Safety 55
Project Title – CIOT Statewide Phone Surveys
Project Description – A “Pre” and a “Post” telephone survey will be conducted to assess the public awareness and effectiveness of the CIOT media and enforcement campaign conducted in conjunction with the national mobilization in May/June.
Project Staff – Jim Barden
Project Budget/Source – $25,674 of Section 405
Project Title – Woonsocket Safe Communities Partnership (WSCP)
Project Description – WSCP fosters cooperation between Woonsocket families and community education, social service, health care and public safety organizations; conducts CPS clinics and individual seat checks; fits and distributes bicycle helmets; provides education/outreach on child restraint use, bicycle, and pedestrian safety.
Project Staff – Jim Barden
Project Budget/Source – $30,000 of Section 402SA
Project Title – Law Enforcement Highway Safety Training Coordinator (LEHSTC)
Project Description – The Rhode Island Municipal Police Academy is employing a full-time contract employee with OHS funds to serve as the LEHSTC, an integral component of all the law enforcement programs. The LEHSTC will promote law enforcement participation in Operation Blue RIPTIDE, conduct outreach to police chiefs, and provide traffic safety training.
Project Staff – Administrator and all program managers
Project Budget/Source – $19,600 of Section 402PT, $1,600 of Section 402AL, $13,281 of 405, $19,600 of 1906, and $19,600 of 164AL
Project Title – Rollover Simulator Demonstrations – RISP
Project Description – With the acquisition of the Rollover Simulator, OHS is working with RISP to promote and conduct demonstrations in as many locations as possible (with a warranted size audience.) Two persons are required for each demonstration and OHS Program Managers have all been trained for these demonstrations. Wherever possible, one RISP officer and a program manager attend the event. If a program manager is not available, OHS funds two RISP officers for the event.
Project Staff – All program managers
Project Budget/Source – $16,250 of Section 405
State of Rhode Island Highway Safety Performance Plan FFY 2010
56 Office on Highway Safety
Project Title – Resource Center
Project Description – OHS maintains appropriate resource materials/promotional materials for use at local and state programs for all age levels addressing, among other issues: CPS, CIOT, YD&DYL, Obey the Sign or Pay the Fine, and underage alcohol use.
Project Staff – Administrator and all program managers
Project Budget/Source – $10,000 of Section 402OP
Project Title – Creative Media
Project Description – OHS does not have the ability to actually create and produce the ads for each of its major campaigns. Therefore, OHS is conducting an RFP and will then sign a contract for creative media with the selected public relations firm.
Project Staff – Jim Barden
Project Budget/Source – $200,000 of Section 402PM
Project Title – Youth in Action
Project Description – MADD Youth In Action (YIA) helps young people focus on law enforcement, educational and policy level changes that impact underage drinking and occupant protection. It provides an opportunity for youth to build a community-based coalition and activities to change community norms regarding underage drinking and impaired driving.
Project Staff – Dan DiBiasio
Project Budget/Source – $7,500 of Section 402OP and $7,500 of Section 164AL
State of Rhode Island Highway Safety Performance Plan FFY 2010
Office on Highway Safety 57
3.3 Speed
Problem Identification and Analysis
A fatality is defined as speed-related if one of the driver-related factors includes driving over the speed limit, excessive speed, driving too fast for conditions, or racing. A speed-related serious injury crash is defined as occurring when a citation is issued to a driver involved in the crash for exceeding the lawful speed limit.
Crashes related to speeding continue to be a problem in Rhode Island. Prior to 2007, the Rhode Island Standard Crash Report form did not record speed violations. In an effort to provide more reliable data, the new form includes information on speed violations. The transition to this new format was fully implemented on January 1, 2008, thereby allowing law enforcement the opportunity to more properly document vehicle crashes related to speed. This will greatly assist in identifying the problems and developing improvements at locations where speed crashes might be more prevalent.
Speed was a likely factor in 42 percent of all fatalities in 2007 in the State. From 2003 to 2007, speeding-related fatal crashes in Rhode Island most frequently occurred in March, April, and June; on weekend evenings; and between the hours of 9:00 p.m. and 3:00 a.m. Although the percentage of speed-related fatalities decreased from 2006 to 2007, Rhode Island still exceeds the national and New England regional percentages for speed-related fatalities, as shown in Figure 3.8. Preliminary data shows a continued decline in 2008 with 20 speed-related fatalities, comprising only 31 percent of all fatalities.
As shown in Table 3.3, in Rhode Island, 47 percent of speeding-related fatalities occurred on roads with a speed limit of 30 mph or below. This rate was higher than in the New England Region (31 percent), both of which were higher than the Nationwide rate (11 percent). Eighty-two (82) percent of the speeding-related fatalities in the State occurred on roads with a speed limit under 50 mph. This percentage was higher than in the New England Region (70 percent) and the U.S. as a whole (44 percent).

State of Rhode Island Highway Safety Performance Plan FFY 2010
58 Office on Highway Safety
Table 3.3 Speed-Related Fatalities by Posted Speed Limit
Rhode Island Total 2003-2007
Posted Speed 2003
(N=55) 2004
(N=45) 2005
(N=40) 2006
(N=42) 2007
(N=14) RI
(N=196) Region
(N=2,230) U.S.
(N=67,022)
30 or less 26 21 17 22 7 47.4% 30.5% 11.4%
35 7 6 6 8 3 15.3% 15.6% 11.8%
40 7 6 2 2 2 9.7% 12.3% 6.9%
45 8 5 2 2 1 9.2% 11.6% 14.1%
50 3 2 5 3 0 6.6% 9.5% 4.1%
55 3 4 2 4 0 6.6% 7.9% 28.9%
60 0 0 0 0 0 0.0% 0.2% 3.6%
65+ 1 1 6 1 1 5.1% 10.2% 16.9%
no limit 0 0 0 0 0 0.0% 0.8% 0.3%
Unknown 0 0 0 0 0 0.0% 1.3% 2.0%
Total 55 45 40 42 14 100.0% 100.0% 100.0%
Source: Preusser Research Group, Inc., Analysis of Fatal Crash Data Rhode Island 2003-2007.
Figure 3.8 Percent of Fatalities Resulting from Crashes Involving Speeding5 Rhode Island, New England, and U.S.
53% 54%
46%52%
42%35%35%38%36%37%
32%32%31%31%31%
0%
10%
20%
30%
40%
50%
60%
2003 2004 2005 2006 2007
Rhode Island New England Average National Average
5 In Figure 3.8, 2007 data for Rhode Island reflects State reported numbers; 2007 data for New
England and National Average reflects NHTSA imputed numbers.
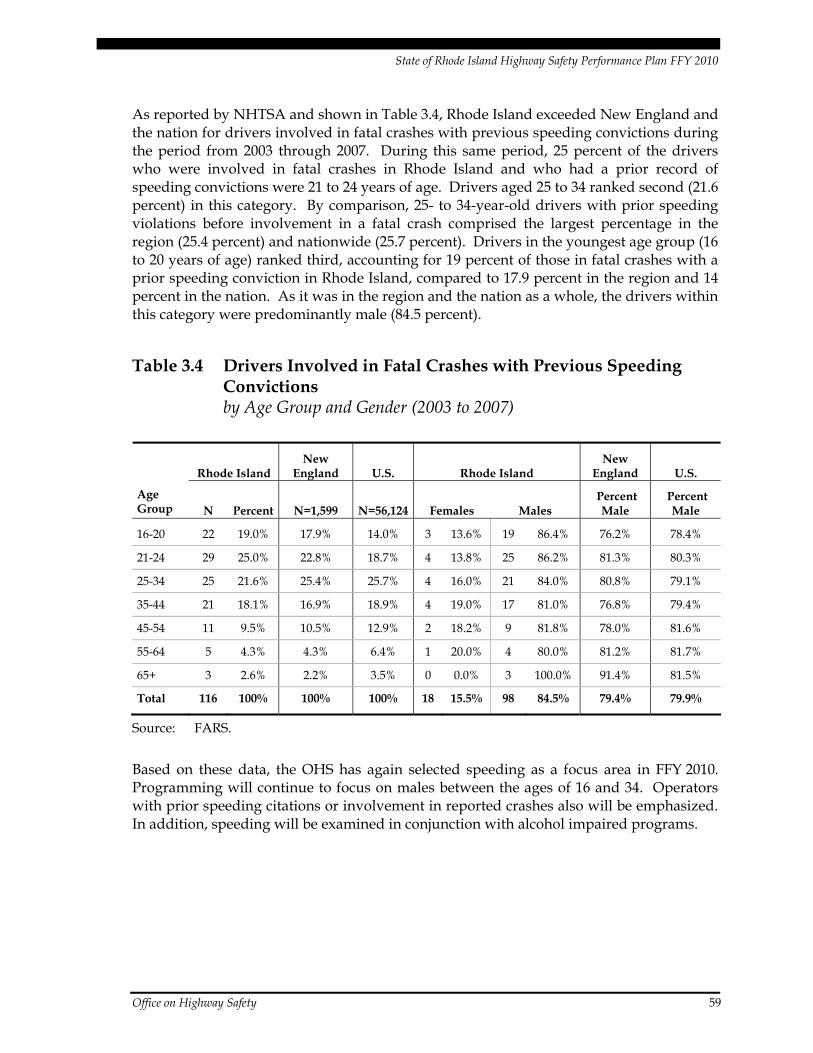
State of Rhode Island Highway Safety Performance Plan FFY 2010
Office on Highway Safety 59
As reported by NHTSA and shown in Table 3.4, Rhode Island exceeded New England and the nation for drivers involved in fatal crashes with previous speeding convictions during the period from 2003 through 2007. During this same period, 25 percent of the drivers who were involved in fatal crashes in Rhode Island and who had a prior record of speeding convictions were 21 to 24 years of age. Drivers aged 25 to 34 ranked second (21.6 percent) in this category. By comparison, 25- to 34-year-old drivers with prior speeding violations before involvement in a fatal crash comprised the largest percentage in the region (25.4 percent) and nationwide (25.7 percent). Drivers in the youngest age group (16 to 20 years of age) ranked third, accounting for 19 percent of those in fatal crashes with a prior speeding conviction in Rhode Island, compared to 17.9 percent in the region and 14 percent in the nation. As it was in the region and the nation as a whole, the drivers within this category were predominantly male (84.5 percent).
Table 3.4 Drivers Involved in Fatal Crashes with Previous Speeding Convictions by Age Group and Gender (2003 to 2007)
Rhode Island New
England U.S. Rhode Island New
England U.S.
Age Group N Percent N=1,599 N=56,124 Females Males
Percent Male
Percent Male
16-20 22 19.0% 17.9% 14.0% 3 13.6% 19 86.4% 76.2% 78.4%
21-24 29 25.0% 22.8% 18.7% 4 13.8% 25 86.2% 81.3% 80.3%
25-34 25 21.6% 25.4% 25.7% 4 16.0% 21 84.0% 80.8% 79.1%
35-44 21 18.1% 16.9% 18.9% 4 19.0% 17 81.0% 76.8% 79.4%
45-54 11 9.5% 10.5% 12.9% 2 18.2% 9 81.8% 78.0% 81.6%
55-64 5 4.3% 4.3% 6.4% 1 20.0% 4 80.0% 81.2% 81.7%
65+ 3 2.6% 2.2% 3.5% 0 0.0% 3 100.0% 91.4% 81.5%
Total 116 100% 100% 100% 18 15.5% 98 84.5% 79.4% 79.9%
Source: FARS.
Based on these data, the OHS has again selected speeding as a focus area in FFY 2010. Programming will continue to focus on males between the ages of 16 and 34. Operators with prior speeding citations or involvement in reported crashes also will be emphasized. In addition, speeding will be examined in conjunction with alcohol impaired programs.
State of Rhode Island Highway Safety Performance Plan FFY 2010
60 Office on Highway Safety
Goals
• To decrease by 3 percent the number of speeding-related fatalities from the five-year average (2004-2008) of 33 (NHTSA imputed data) to 32 in 2010.
• To increase the number of speeding citations issued during grant-funded enforcement activities in 2010. (FFY 2009 will be the first year this data is collected.)
• To increase the number of speeding citations written and tracked monthly of all OT speed patrols.
Performance Measures
• Number of speeding-related fatalities.
• Number of speeding citations issued during grant-funded enforcement activities.
• Number of speeding citations written and tracked monthly of all OT speed patrols.
Strategic Partners
Expanding or developing working relationships with those involved in the arrest, prosecution, and adjudication of speeding drivers is a priority. A well-trained police force can identify and arrest drivers who speed before they injure themselves or others. In addition, the Rhode Island court system is moving towards implementation of electronic ticketing which will expedite the ticketing process and improve accuracy of data.
Strategies
1. Use VMS signs to increase visibility of speed enforcement activities.
1. Implement a statewide speeding/aggressive driving campaign targeted to males 16 to 34 years old.
2. Conduct sustained monthly enforcement for statewide high-publicity speed activities as well as one annual high-visibility “speed wave” enforcement.
3. Target speed enforcement patrols on non-interstate roadways with speed limits of 35 mph or less.
4. Continue overtime speed patrols with the State Police and Operation Blue RIPTIDE.
5. Employ speed-activated roadside displays showing speed limit and actual speed traveled.
6. Include program management and oversight for all activities within this priority area.

State of Rhode Island Highway Safety Performance Plan FFY 2010
Office on Highway Safety 61
Programs and Projects
Project Title – “Obey the Sign or Pay the Fine” Law Enforcement Patrols
Project Description – OHS will fund implementation of the “Obey the Sign or Pay the Fine” overtime speed enforcement patrols by local city/town/State police departments. There is potential for 38 participating communities and the State Police. Patrols are conducted during daylight hours and there is mandatory participation in one annual enforcement period. This also includes RISP C.A.R.E. patrols and travel.
Project Staff – Despina Metakos
Project Budget/Source – $228,375 of Section 402PT
Project Title – “Obey the Sign or Pay the Fine” Paid and Earned Media
Project Description – OHS will develop and implement statewide paid and earned media campaigns for the “Obey the Sign or Pay the Fine” law enforcement mobilizations. The target audience will be 16- to 34-year-old males. Media materials will be produced in both English and Spanish and the venues will be chosen based on market data for each audience.
Project Staff – Despina Metakos
Project Budget/Source – $390,000 of Section 402PM
Project Title – Law Enforcement Highway Safety Training Coordinator (LEHSTC)
Project Description – The Rhode Island Municipal Police Academy is employing a full-time contract employee with OHS funds to serve as the LEHSTC, an integral component of all the law enforcement programs. The LEHSTC will promote law enforcement participation in Operation Blue RIPTIDE, conduct outreach to police chiefs, and provide traffic safety training.
Project Staff – Administrator and all program managers
Project Budget/Source – $19,600 of Section 402PT, $1,600 of Section 402AL, $13,281 of 405, $19,600 of 1906, and $19,600 of 164AL
Project Title – Creative Media
Project Description – OHS does not have the ability to actually create and produce the ads for each of its major campaigns. Therefore, OHS is conducting an RFP and will then sign a contract for creative media with the selected public relations firm.
Project Staff – Jim Barden, Dan DiBiasio, and Despina Metakos
Project Budget/Source – $200,000 of Section 402PM
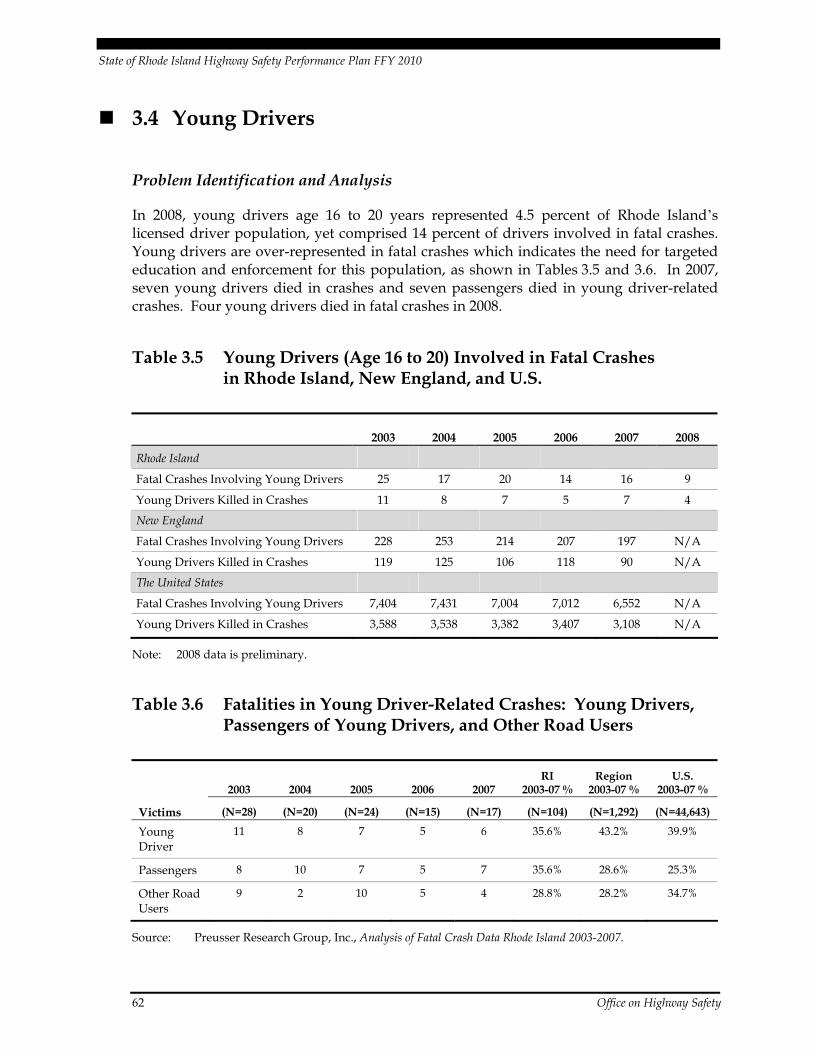
State of Rhode Island Highway Safety Performance Plan FFY 2010
62 Office on Highway Safety
3.4 Young Drivers
Problem Identification and Analysis
In 2008, young drivers age 16 to 20 years represented 4.5 percent of Rhode Island’s licensed driver population, yet comprised 14 percent of drivers involved in fatal crashes. Young drivers are over-represented in fatal crashes which indicates the need for targeted education and enforcement for this population, as shown in Tables 3.5 and 3.6. In 2007, seven young drivers died in crashes and seven passengers died in young driver-related crashes. Four young drivers died in fatal crashes in 2008.
Table 3.5 Young Drivers (Age 16 to 20) Involved in Fatal Crashes in Rhode Island, New England, and U.S.
2003 2004 2005 2006 2007 2008
Rhode Island
Fatal Crashes Involving Young Drivers 25 17 20 14 16 9
Young Drivers Killed in Crashes 11 8 7 5 7 4
New England
Fatal Crashes Involving Young Drivers 228 253 214 207 197 N/A
Young Drivers Killed in Crashes 119 125 106 118 90 N/A
The United States
Fatal Crashes Involving Young Drivers 7,404 7,431 7,004 7,012 6,552 N/A
Young Drivers Killed in Crashes 3,588 3,538 3,382 3,407 3,108 N/A
Note: 2008 data is preliminary.
Table 3.6 Fatalities in Young Driver-Related Crashes: Young Drivers, Passengers of Young Drivers, and Other Road Users
2003 2004 2005 2006 2007
RI 2003-07 %
Region 2003-07 %
U.S. 2003-07 %
Victims (N=28) (N=20) (N=24) (N=15) (N=17) (N=104) (N=1,292) (N=44,643)
Young Driver
11 8 7 5 6 35.6% 43.2% 39.9%
Passengers 8 10 7 5 7 35.6% 28.6% 25.3%
Other Road Users
9 2 10 5 4 28.8% 28.2% 34.7%
Source: Preusser Research Group, Inc., Analysis of Fatal Crash Data Rhode Island 2003-2007.
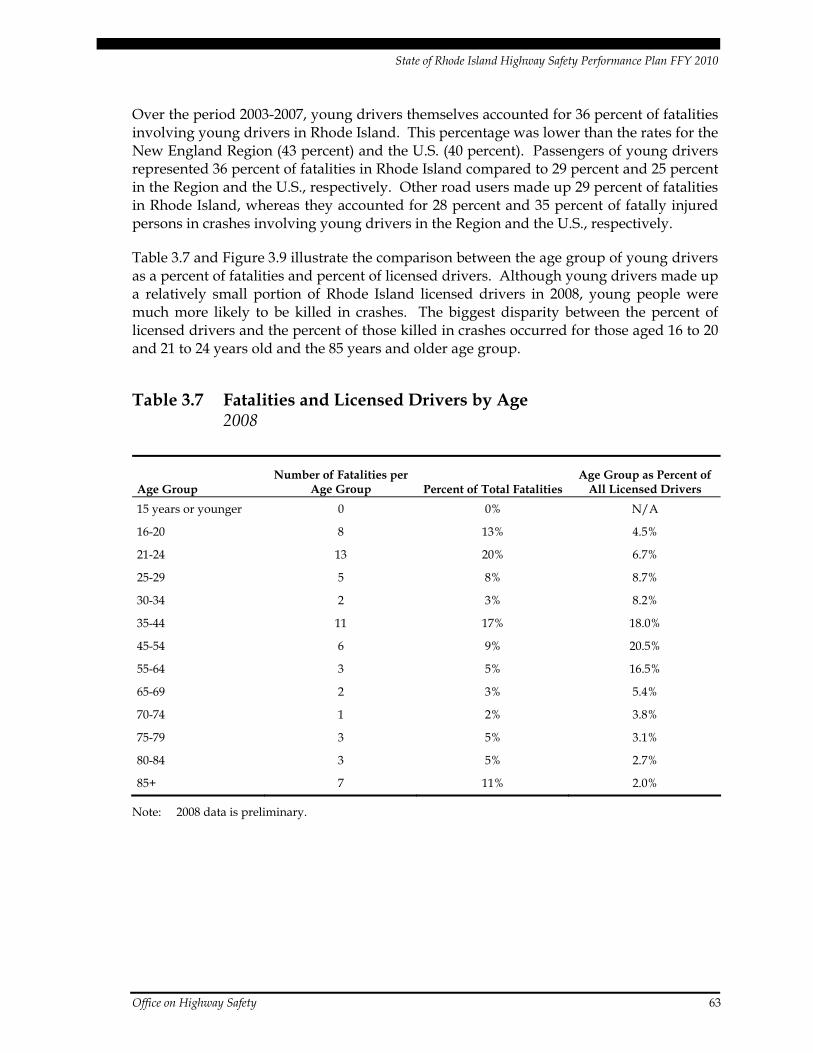
State of Rhode Island Highway Safety Performance Plan FFY 2010
Office on Highway Safety 63
Over the period 2003-2007, young drivers themselves accounted for 36 percent of fatalities involving young drivers in Rhode Island. This percentage was lower than the rates for the New England Region (43 percent) and the U.S. (40 percent). Passengers of young drivers represented 36 percent of fatalities in Rhode Island compared to 29 percent and 25 percent in the Region and the U.S., respectively. Other road users made up 29 percent of fatalities in Rhode Island, whereas they accounted for 28 percent and 35 percent of fatally injured persons in crashes involving young drivers in the Region and the U.S., respectively.
Table 3.7 and Figure 3.9 illustrate the comparison between the age group of young drivers as a percent of fatalities and percent of licensed drivers. Although young drivers made up a relatively small portion of Rhode Island licensed drivers in 2008, young people were much more likely to be killed in crashes. The biggest disparity between the percent of licensed drivers and the percent of those killed in crashes occurred for those aged 16 to 20 and 21 to 24 years old and the 85 years and older age group.
Table 3.7 Fatalities and Licensed Drivers by Age 2008
Age Group Number of Fatalities per
Age Group Percent of Total Fatalities Age Group as Percent of
All Licensed Drivers 15 years or younger 0 0% N/A
16-20 8 13% 4.5%
21-24 13 20% 6.7%
25-29 5 8% 8.7%
30-34 2 3% 8.2%
35-44 11 17% 18.0%
45-54 6 9% 20.5%
55-64 3 5% 16.5%
65-69 2 3% 5.4%
70-74 1 2% 3.8%
75-79 3 5% 3.1%
80-84 3 5% 2.7%
85+ 7 11% 2.0%
Note: 2008 data is preliminary.
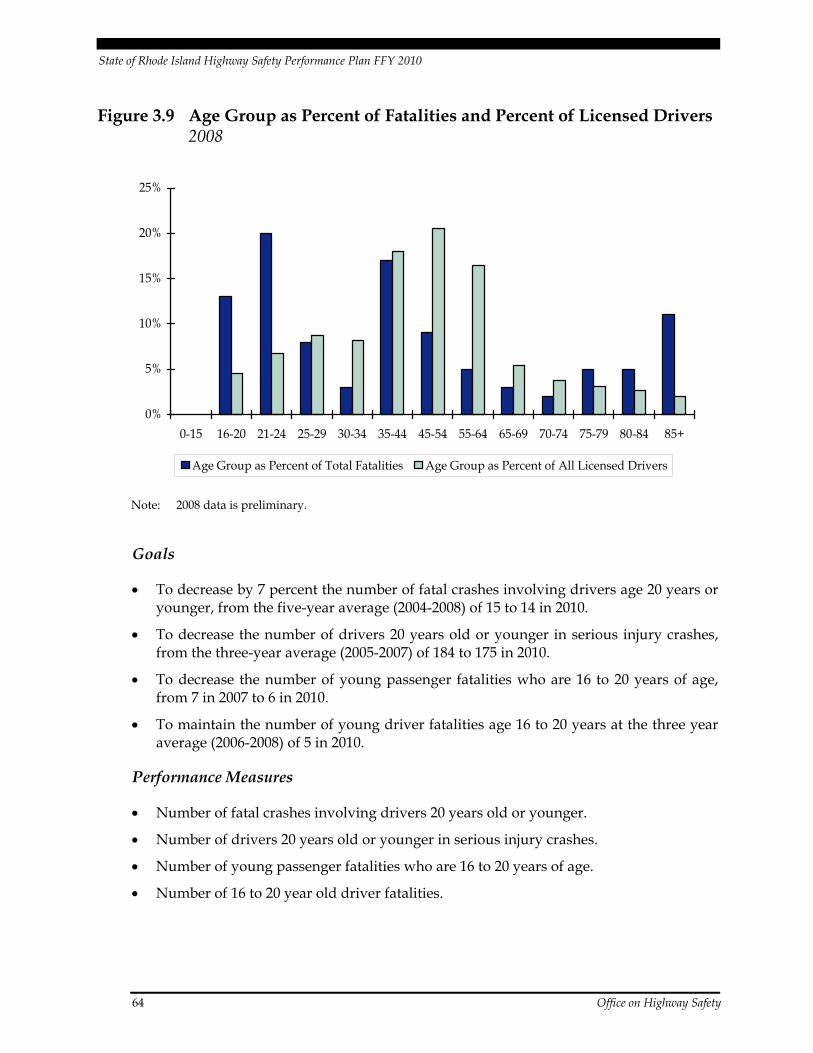
State of Rhode Island Highway Safety Performance Plan FFY 2010
64 Office on Highway Safety
Figure 3.9 Age Group as Percent of Fatalities and Percent of Licensed Drivers 2008
0%
5%
10%
15%
20%
25%
0-15 16-20 21-24 25-29 30-34 35-44 45-54 55-64 65-69 70-74 75-79 80-84 85+
Age Group as Percent of Total Fatalities Age Group as Percent of All Licensed Drivers
Note: 2008 data is preliminary.
Goals
• To decrease by 7 percent the number of fatal crashes involving drivers age 20 years or younger, from the five-year average (2004-2008) of 15 to 14 in 2010.
• To decrease the number of drivers 20 years old or younger in serious injury crashes, from the three-year average (2005-2007) of 184 to 175 in 2010.
• To decrease the number of young passenger fatalities who are 16 to 20 years of age, from 7 in 2007 to 6 in 2010.
• To maintain the number of young driver fatalities age 16 to 20 years at the three year average (2006-2008) of 5 in 2010.
Performance Measures
• Number of fatal crashes involving drivers 20 years old or younger.
• Number of drivers 20 years old or younger in serious injury crashes.
• Number of young passenger fatalities who are 16 to 20 years of age.
• Number of 16 to 20 year old driver fatalities.

State of Rhode Island Highway Safety Performance Plan FFY 2010
Office on Highway Safety 65
Strategic Partners
The Rhode Island DMV is charged with licensing drivers in the State of Rhode Island. Currently, applicants between the ages of 16 and 18 are subject to Graduated Licensing requirements. These rules are a key avenue for addressing the needs of young drivers, including training and restrictions on driving activities. Ensuring the uniform and rigorous application of these laws, as well as evaluating their effectiveness and strengthening them, where necessary, is pivotal. Driver training and outreach programs also play a critical role for the new driver. Forming partnerships to address training needs and training effectiveness also aid in strengthening the skills of new drivers. Other partners include MADD, AAA, Rhode Island Attorney General’s Office, Rhode Island Traffic Tribunal Court, the minority community, and law enforcement throughout the State.
Strategies
1. Increase awareness and understanding of Graduated Drivers Licensing (GDL) laws for law enforcement, parents, and young drivers.
2. Implement a minimum of four contacts with parents/care givers to provide information on the role of alcohol and/or primary seat belt use for young drivers.
3. Distribute GDL informational packet to new young drivers/parents/law enforcement.
4. Establish a coordinated effort and training for School Resource Officers in high schools.
5. Improve and expand educational outreach to high schools (including School Resource Officers), colleges, and community partners
− Develop and expand a “Young Driver Resource Reference” book/CD/web site which will be a compilation of national and State programs to change the attitudes and behavior of Young Drivers and their passengers;
− Develop and implement occupant protection awareness programs for middle schools, focused on tweens;
− Increase emphasis for young drivers in the alcohol and CIOT media campaigns;
− Create and distribute an alcohol-related informational brochure for high school and/or college students;
− Evaluate and coordinate public/private efforts in area of young driver safety efforts statewide;
− Develop current “Welcome Back to School” college packets for distribution at beginning of fall 2010 to 2011 school years;
− Work with community and business partners to educate parents/care givers about the role of alcohol in crashes among 16- to 20-year-old drivers. Also educate
State of Rhode Island Highway Safety Performance Plan FFY 2010
66 Office on Highway Safety
young drivers and their parents/care givers about primary seat belt enforcement for persons under 18 years of age;
− Develop an informational/educational introduction packet for GDL License applicants. This packet would be distributed to young drivers/parents as part of the process to obtain a drivers license;
− Expand educational permit program with AAASNE to be offered statewide to nonmembers. This program promotes and encourages more parental and teen partnerships in the area of driver education on a state level;
− Work with the CCRI driver education administrator to identify and implement potential improvements to the drivers’ training program;
− Develop culturally appropriate messages and expand minority outreach efforts;
− Explore potential training to develop an Underage Drinking Rapid Response Team;
− Coordinate statewide high school participation in occupant protection and impaired driving campaigns focused around winter ball and prom season;
− Distribute banners with “Don’t let this be your prom picture” (young couple, prom attire, being cuffed). The distribution would be through School Resource Officers;
− Work with private/public partners to implement a pilot program utilizing the “Teen Monitoring technology;”
− Implement the young driver/GDL enforcement in and around selected high schools. This would be a coordinated three week program of education and enforcement of GDL laws;
− Develop a coordinated statewide outreach/enforcement program around national Teen Safety Week campaign;
− Develop a defensive driving program that would provide the opportunity for young drivers to experience roadway situations through a combination of behind the wheel and classroom experience designed to alter young driver attitudes and behavior, without providing a false sense of “improved ability,” i.e., that young drivers believe they now have the skills for such situations; and
− Collect and analyze age-related data on highway safety.
6. Include program management oversight for all activities within this priority area.

State of Rhode Island Highway Safety Performance Plan FFY 2010
Office on Highway Safety 67
Programs and Projects
Project Title – Intervention Pilot Project (IP2)
Project Description – Up to six local communities will be offered the opportunity to develop a young drivers’ alcohol-related program to be implemented through the local school/after school/sports/recreation programs. Response and success will be assessed to determine future continuation of program.
Project Staff – Dan DiBiasio
Project Budget/Source – $316,776 of Section 164AL
Project Title – Occupant Protection and Underage Drinking Paid and Earned Media
Project Description – This will provide for placement of media associated with young driver programs, including such opportunities as the HOT 106 high school football events.
Project Staff – Dan DiBiasio
Project Budget/Source – $15,000 of Section 402PM
Project Title – Permanent Statewide Safe Mourning Site
Project Description – Temporary memorials have been established at the site of fatal crashes around the state. Vigils are held and mementoes are placed, many times without careful consideration of location or obstruction of traffic. Often, by their very nature, these sites are in dangerous locations and place those mourning the victim in dangerous, unsafe conditions, as well. (Rhode Island suffered the fatality of a mourning student at a fatality site several years ago, thus compounding the tragedy.) This initiative would establish a safe location that would be available 24 hours a day/7 days a week to be used as a gathering place for mourners after any type of crash fatality. A Wall of Names will be considered.
Project Staff – OHS administrator and all program managers.
Project Budget/Source – $20,000 of Section 402AL, $20,000 of Section 402OP and $80,000 of Section 164AL
Project Title – Youth in Action
Project Description – MADD YIA helps young people focus on law enforcement, educational and policy level changes that impact underage drinking. It provides an opportunity for youth to build a community-based coalition and activities to change community norms regarding underage drinking and impaired driving.
Project Staff – Dan DiBiasio
Project Budget/Source – $7,500 of Section 402OP and $7,500 of Section 164AL

State of Rhode Island Highway Safety Performance Plan FFY 2010
68 Office on Highway Safety
Project Title – “Obey the Sign or Pay the Fine” Paid and Earned Media
Project Description – OHS will develop and implement statewide paid and earned media campaigns for the “Obey the Sign or Pay the Fine” law enforcement mobilizations. The target audience will be 16- to 34-year-old males. Media materials will be produced in both English and Spanish and the venues will be chosen based on market data for each audience.
Project Staff – Despina Metakos, Jim Barden, and Dan DiBiasio
Project Budget/Source – $390,000 of Section 402PM
Project Title – Occupant Protection Paid and Earned Media
Project Description – OHS will develop and implement a statewide paid and earned media campaign for the CIOT campaign scheduled for May 2010. The target audience will be 16- to 34-year-old males. Media materials will be produced in both English and Spanish and the venues will be chosen based on market data for each audience.
Project Staff – Jim Barden and Dan DiBiasio
Project Budget/Source – $318,000 of Section 402PM
Project Title – Resource Center
Project Description – OHS maintains appropriate resource materials/promotional materials for use at local and state programs for all age levels addressing, among other issues: CPS, CIOT, YD&DYL, Obey the Sign or Pay the Fine, GDL, and underage alcohol use.
Project Staff – Administrator and all program managers
Project Budget/Source – $5,000 of Section 402PS Project Title – Zero Fatalities Project
Project Description – The TSRP worked with the Department of Corrections, MADD and the school departments to develop this innovative project. High school students are brought by school bus to the prison and have listening sessions with prisoners convicted of DUI, death resulting. These prisoners discuss the actions leading up to the incident and the impact it has had on their lives and on those around them. MADD includes families of victims that explain about the impact these fatalities have had on their lives as well. Response from the high schools has been very favorable and a full year of programming is expected, reaching out to every high school.
Project Staff – Jim Barden, Dan DiBiasio, and the TSRP
Project Budget/Source – $15,000 of Section 164AL
State of Rhode Island Highway Safety Performance Plan FFY 2010
Office on Highway Safety 69
Project Title – Cranston Child Opportunity Zone (COZ)
Project Description – COZ fosters cooperation between Cranston families and community education, social service, health-care, and public safety organizations; conducts CPS clinics and individual seat checks; fits and distributes bicycle helmets; provides education/outreach on child restraint use, bicycle, and pedestrian safety.
Project Staff – Despina Metakos and Dan DiBiasio
Project Budget/Source – $15,000 of Section 402PS
Project Title –School Resource Officer (SRO) Resource Center
Project Description – OHS will be coordinating with School Resource Officers in all communities in Rhode Island to educate and provide them with a foundation for OHS programs with young driver and passenger emphasis. This will coordinate efforts for the SRO’s in high schools for enforcement/education of our safety messaging during national campaigns.
OHS will maintain appropriate resource materials/promotional materials for use at local and state programs for high school age levels addressing, among other issues: CPS, CIOT, YD&DYL, Obey the Sign or Pay the Fine, GDL, and underage alcohol use.
Project Staff – Dan DiBiasio
Project Budget/Source – $15,000 of Section 402AL _______________________________________________________________________________
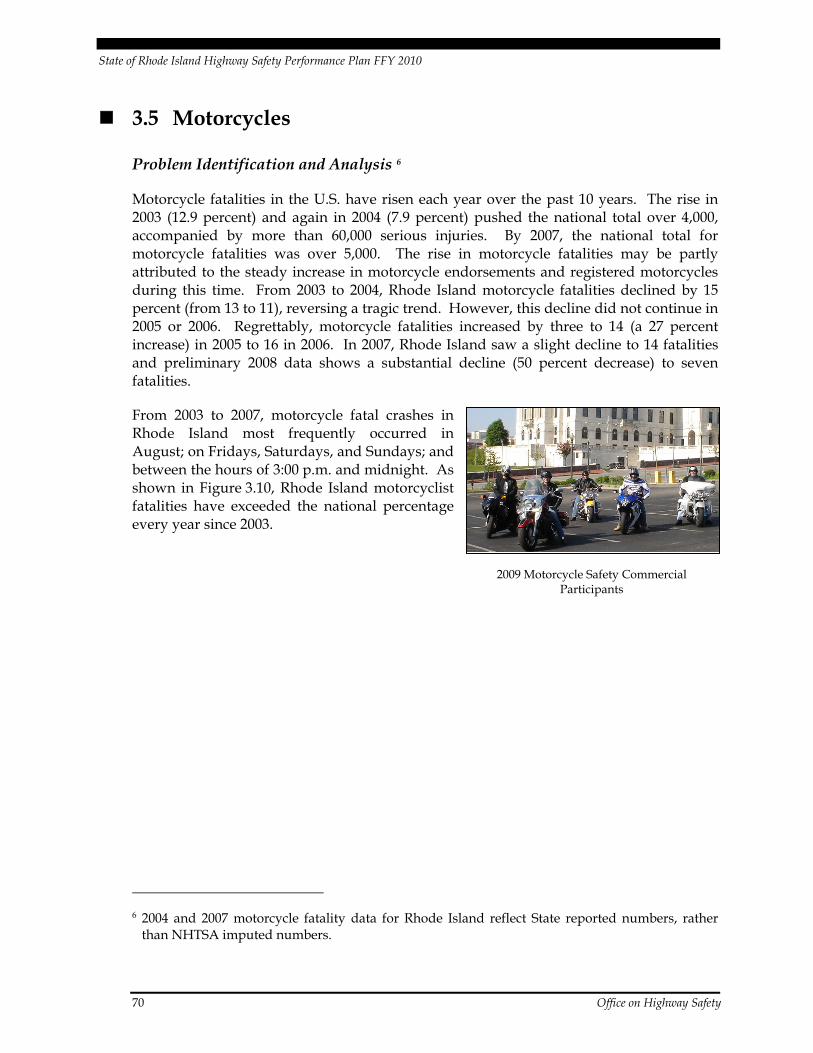
State of Rhode Island Highway Safety Performance Plan FFY 2010
70 Office on Highway Safety
3.5 Motorcycles
Problem Identification and Analysis 6
Motorcycle fatalities in the U.S. have risen each year over the past 10 years. The rise in 2003 (12.9 percent) and again in 2004 (7.9 percent) pushed the national total over 4,000, accompanied by more than 60,000 serious injuries. By 2007, the national total for motorcycle fatalities was over 5,000. The rise in motorcycle fatalities may be partly attributed to the steady increase in motorcycle endorsements and registered motorcycles during this time. From 2003 to 2004, Rhode Island motorcycle fatalities declined by 15 percent (from 13 to 11), reversing a tragic trend. However, this decline did not continue in 2005 or 2006. Regrettably, motorcycle fatalities increased by three to 14 (a 27 percent increase) in 2005 to 16 in 2006. In 2007, Rhode Island saw a slight decline to 14 fatalities and preliminary 2008 data shows a substantial decline (50 percent decrease) to seven fatalities.
From 2003 to 2007, motorcycle fatal crashes in Rhode Island most frequently occurred in August; on Fridays, Saturdays, and Sundays; and between the hours of 3:00 p.m. and midnight. As shown in Figure 3.10, Rhode Island motorcyclist fatalities have exceeded the national percentage every year since 2003.
6 2004 and 2007 motorcycle fatality data for Rhode Island reflect State reported numbers, rather
than NHTSA imputed numbers.
2009 Motorcycle Safety Commercial Participants
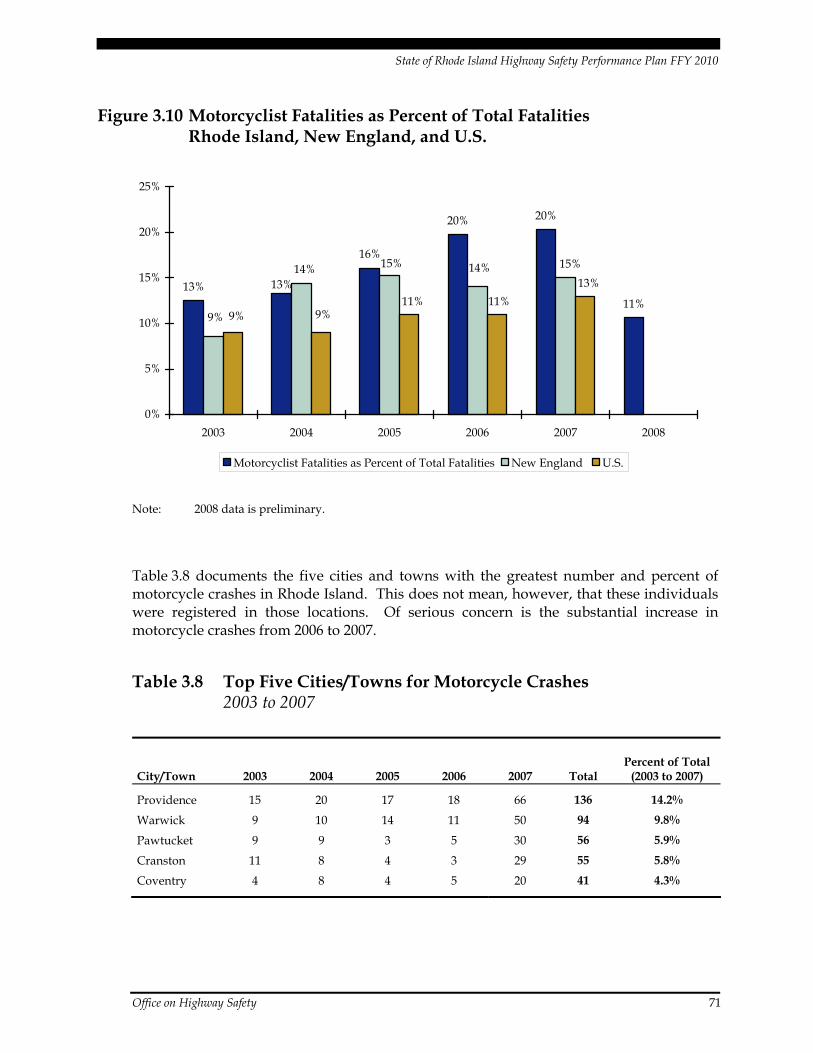
State of Rhode Island Highway Safety Performance Plan FFY 2010
Office on Highway Safety 71
Figure 3.10 Motorcyclist Fatalities as Percent of Total Fatalities Rhode Island, New England, and U.S.
13%
16%
20% 20%
11%13%
15% 15%
9%
14% 14%13%
11%11%9% 9%
0%
5%
10%
15%
20%
25%
2003 2004 2005 2006 2007 2008
Motorcyclist Fatalities as Percent of Total Fatalities New England U.S.
Note: 2008 data is preliminary.
Table 3.8 documents the five cities and towns with the greatest number and percent of motorcycle crashes in Rhode Island. This does not mean, however, that these individuals were registered in those locations. Of serious concern is the substantial increase in motorcycle crashes from 2006 to 2007.
Table 3.8 Top Five Cities/Towns for Motorcycle Crashes 2003 to 2007
City/Town 2003 2004 2005 2006 2007 Total Percent of Total
(2003 to 2007)
Providence 15 20 17 18 66 136 14.2%
Warwick 9 10 14 11 50 94 9.8%
Pawtucket 9 9 3 5 30 56 5.9%
Cranston 11 8 4 3 29 55 5.8%
Coventry 4 8 4 5 20 41 4.3%
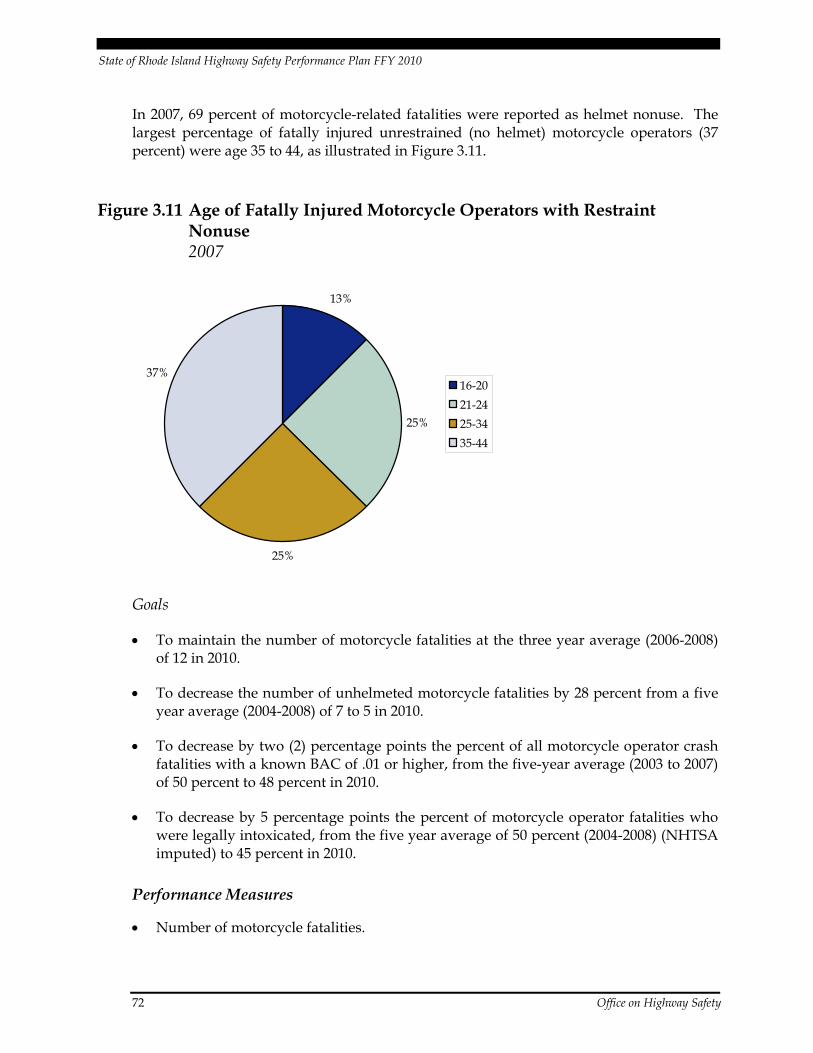
State of Rhode Island Highway Safety Performance Plan FFY 2010
72 Office on Highway Safety
In 2007, 69 percent of motorcycle-related fatalities were reported as helmet nonuse. The largest percentage of fatally injured unrestrained (no helmet) motorcycle operators (37 percent) were age 35 to 44, as illustrated in Figure 3.11.
Figure 3.11 Age of Fatally Injured Motorcycle Operators with Restraint Nonuse 2007
13%
25%
25%
37%16-2021-2425-3435-44
Goals
• To maintain the number of motorcycle fatalities at the three year average (2006-2008) of 12 in 2010.
• To decrease the number of unhelmeted motorcycle fatalities by 28 percent from a five year average (2004-2008) of 7 to 5 in 2010.
• To decrease by two (2) percentage points the percent of all motorcycle operator crash fatalities with a known BAC of .01 or higher, from the five-year average (2003 to 2007) of 50 percent to 48 percent in 2010.
• To decrease by 5 percentage points the percent of motorcycle operator fatalities who were legally intoxicated, from the five year average of 50 percent (2004-2008) (NHTSA imputed) to 45 percent in 2010.
Performance Measures
• Number of motorcycle fatalities.
State of Rhode Island Highway Safety Performance Plan FFY 2010
Office on Highway Safety 73
• Number of unhelmeted motorcycle fatalities.
• Percent of all motorcycle operator crash fatalities with a known BAC of .01 or higher.
• Percent of motorcycle operator fatalities who were legally intoxicated.
Strategic Partners
Partners will include the Departments of Transportation and Health, as well as the DMV, RISP, CCRI, AAA, the Rhode Island Association of Independent Insurers, Rhode Island Hospitality Association, Injury Prevention Center, representatives from all of the motorcycle retail and repair shops in the State, as well as representatives from organized motorcycle clubs
Strategies
1. Increase the emphasis on the importance of wearing all the appropriate gear all the time.
2. Continue to work with CCRI to expand the number of rider training classes offered.
3. Increase awareness of helmet and safety gear use through the use of the recently completed 60 second TV commercial.
4. Purchase new equipment to expand the existing MC Rider Education program.
5. Enhance the safety of the existing ranges through the installation of proper lighting for the night classes (approximately 75 percent of all classes are given at night and the existing ranges have insufficient lighting that have caused safety problems in the past).
6. Introduce a campaign to entice older motorcycle operators back to the classroom to formalize their training and/or get licensed.
7. Develop an impaired riding program to educate motorcyclists on the negative effects of riding under the influence.
8. Develop a web site solely for motorcyclists, streamlining the class registration process.
9. Develop and disseminate printed safety materials to all students within the program.
10. Develop a scooter-only class.
11. Develop an experienced rider “rodeo” to encourage safe riding practices for experienced motorcyclists.
12. Develop and maintain a comprehensive database of students.
13. Expand and enhance the Motorcycle Awareness Campaign:
State of Rhode Island Highway Safety Performance Plan FFY 2010
74 Office on Highway Safety
− Emphasize the negatives of driving under the influence of alcohol and riding motorcycles, correlating motorcyclist fatalities to alcohol;
− Increase automobile drivers’ awareness of the characteristics of motorcyclists; and
− Continue the Motorcycle Safety and Awareness Campaign preceding the national “Motorcycle Awareness Month” in May.
14. Staff a position that oversees the expansion of the CCRI training programs.
15. Continue to develop a motorcycle database with the assistance of the Rhode Island DMV:
− Periodically mail safety and awareness information to all riders with registered motorcycles in the State;
− Continue to work with CCRI to expand the number of rider training classes offered through the CCRI Motorcycle Training Program;
− Work with the Rhode Island Independent Insurers Association and AAA to offer discounted insurance rates to riders that continue their education and take the intermediate and advanced rider training courses offered by CCRI.
16. Include program management and oversight for all activities within this priority area.
Programs and Projects
Project Title – Motorcycle Paid and Earned Media
Project Description – OHS utilizes paid and earned media to address visibility issues, safety, and motorcycle awareness for all drivers, particularly during Motorcycle Awareness month. As supported by data, the target audience for motorcycle media is older than for most of other media programs, including males 35 to 54 years of age.
Project Staff – Despina Metakos and Jim Barden
Project Budget/Source – $124,835 of Section 2010
Project Title – Motorcycle Resource and Outreach Center
Project Description – OHS maintains appropriate resource materials/promotional materials for use at local and state programs specifically for the motorcycle community addressing speeding; utilization of appropriate gear (helmets and visibility) and drinking and riding.
Project Staff – Despina Metakos
Project Budget/Source – $5,000 of Section 402MC

State of Rhode Island Highway Safety Performance Plan FFY 2010
Office on Highway Safety 75
Project Title – CCRI RIREP Program
Project Description – The CCRI RIREP Program currently is the sole provider of Basic Rider Training courses offered in the state of RI. In Rhode Island it is the law that motorcyclists must be trained prior to obtaining their license to ride a motorcycle. The RIREP program sees more than 3500 students annually. This project will assist in the expansion of this program as follows:
• Purchase of new equipment;
• Enhance the safety of the existing ranges through the installation of proper lighting for the night classes (approximately 75 percent of all classes are given at night and the existing ranges have insufficient lighting that have caused safety problems in the past);
• Introduce a campaign to entice older motorcycle operators back to the classroom to formalize their training and get licensed;
• Develop an impaired riding program to educate motorcyclists of the negative effects of riding under the influence;
• Develop a web site solely for motorcyclists, streamlining the registration process;
• Develop and disseminate printed safety materials to all students within the program;
• Develop a scooter-only class;
• Develop an experienced rider “rodeo” to encourage safe riding practices for experienced motorcyclists;
• Develop and maintain a comprehensive database of students; and
• Staff a position that would oversee the expansion of the existing program to accomplish these goals and objectives.
Project Staff – Despina Metakos
Project Budget/Source – $44,000 of Section 402MC and $85,000 of Section 2010
Project Title – Riders Helping Riders (RHR) Training Program
Project Description – OHS will initiate and host one RHR training program to encourage a partnership with the motorcycle community to assist in identifying impaired operators and to work to keep them off the roadways. The RHR program is an instructional program designed to encourage motorcyclists to intervene to prevent drinking and riding by their motorcyclist peers. The program is based on focus group research which found that riders consider themselves to be united by an interest in riding, and willing to help other riders in need, but that a sense of individualism limits the extent to which riders are willing to intervene in drinking and riding.
RHR is intended to convince motorcyclists that an impaired rider needs their help, and that they are in the best position to provide help. The program provides a “toolkit” of techniques for separating drinking from riding, discouraging impaired riders from riding.

State of Rhode Island Highway Safety Performance Plan FFY 2010
76 Office on Highway Safety
An optional role-playing module is included. At the end of class, students are asked to sign a pledge to do their best to help an impaired rider live to ride another day.
RHR was developed with the assistance of instructors from the South Carolina Rider Education Program and pilot tested by instructors of Georgia’s Department of Driver Services, Motorcycle Safety Program.
Project Staff – Despina Metakos
Project Budget/Source – $100,000 of Section 410
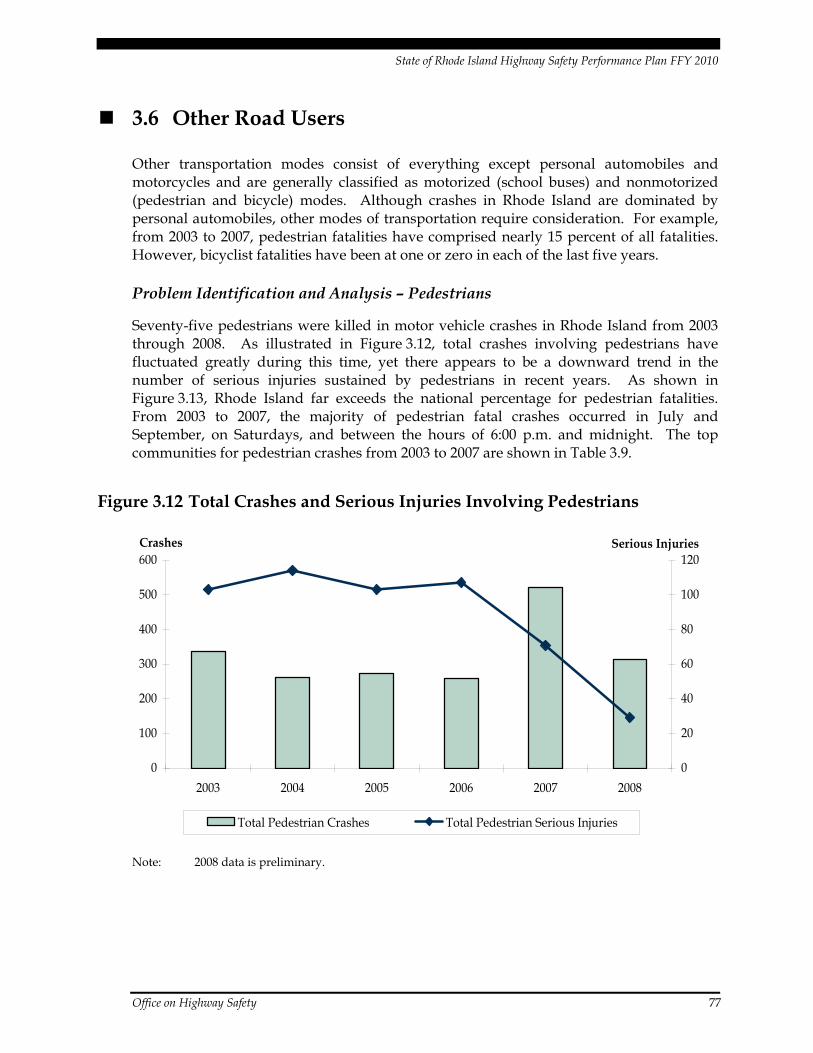
State of Rhode Island Highway Safety Performance Plan FFY 2010
Office on Highway Safety 77
3.6 Other Road Users
Other transportation modes consist of everything except personal automobiles and motorcycles and are generally classified as motorized (school buses) and nonmotorized (pedestrian and bicycle) modes. Although crashes in Rhode Island are dominated by personal automobiles, other modes of transportation require consideration. For example, from 2003 to 2007, pedestrian fatalities have comprised nearly 15 percent of all fatalities. However, bicyclist fatalities have been at one or zero in each of the last five years.
Problem Identification and Analysis – Pedestrians
Seventy-five pedestrians were killed in motor vehicle crashes in Rhode Island from 2003 through 2008. As illustrated in Figure 3.12, total crashes involving pedestrians have fluctuated greatly during this time, yet there appears to be a downward trend in the number of serious injuries sustained by pedestrians in recent years. As shown in Figure 3.13, Rhode Island far exceeds the national percentage for pedestrian fatalities. From 2003 to 2007, the majority of pedestrian fatal crashes occurred in July and September, on Saturdays, and between the hours of 6:00 p.m. and midnight. The top communities for pedestrian crashes from 2003 to 2007 are shown in Table 3.9.
Figure 3.12 Total Crashes and Serious Injuries Involving Pedestrians
0
100
200
300
400
500
600
2003 2004 2005 2006 2007 2008
Crashes
0
20
40
60
80
100
120Serious Injuries
Total Pedestrian Crashes Total Pedestrian Serious Injuries
Note: 2008 data is preliminary.

State of Rhode Island Highway Safety Performance Plan FFY 2010
78 Office on Highway Safety
Figure 3.13 Pedestrian Fatalities as a Percent of Total Fatalities Rhode Island Compared to U.S.
8.4%
16.1%
18.5% 18.8% 18.5%
10.9% 11.2% 11.7%11.4%11.2%
0.0%
2.0%
4.0%
6.0%
8.0%
10.0%
12.0%
14.0%
16.0%
18.0%
20.0%
2004 2005 2006 2007 2008
Pedestrian Fatalities as % of Total Fatalities U.S. Average
Note: 2008 data is preliminary. Source: FARS.
Table 3.9 Top Five Cities/Towns by Pedestrian Crashes 2003 to 2007
City/Town 2003 2004 2005 2006 2007 Total Percent of Total
2002 to 2006
Providence 77 50 60 71 187 445 27.0%
Cranston 34 31 28 30 48 171 10.4%
Warwick 28 30 28 22 34 142 8.6%
Pawtucket 18 22 21 15 49 125 7.6%
East Providence 15 17 12 16 16 76 4.6%
As shown in Table 3.10, during 2003 to 2007, 37 percent of pedestrians killed in Rhode Island age 16 and above had a BAC at or above .08 percent. This percentage was higher than the New England Region (25 percent), both of which were below the national average of 40 percent. In these pedestrian fatalities in Rhode Island, alcohol was most prevalent among those 25 to 34 years of age (82 percent).

State of Rhode Island Highway Safety Performance Plan FFY 2010
Office on Highway Safety 79
Table 3.10 Pedestrian Fatalities by Age Group with BAC Test of .08 or Greater 2003 to 2007
Rhode Island Region U.S.
Age Group .08% or greater
N=19 of 51a .08% or greater
N=97 of 394a .08% or greater
N=5,581 of 13,979a
16-20 0.0% 17.9% 30.5%
21-24 50.0% 53.3% 55.9%
25-34 81.8% 47.1% 52.9%
35-44 75.0% 40.4% 53.2%
45-54 22.2% 41.5% 49.1%
55-64 25.0% 11.9% 31.3%
65+ 9.1% 2.5% 9.0%
Total 37.3% 24.6% 39.9%
a Persons with known BACs. Source: Preusser Research Group, Inc., Analysis of Fatal Crash Data Rhode Island 2003-2007.
Problem Identification and Analysis – Bicyclists
The total number of crashes and number of serious injuries sustained involving bicyclists decreased between 2003 and 2008, as shown in Figure 3.14. As shown in Figure 3.15, the State remains well below the national average for bicyclist fatalities (one per year except for 2004 when there were zero bicyclist fatalities). Table 3.11 shows the top five cities/towns for bicycle crashes from 2003 to 2007.

State of Rhode Island Highway Safety Performance Plan FFY 2010
80 Office on Highway Safety
Figure 3.14 Total Crashes and Serious Injuries Involving Bicyclists
0
50
100
150
200
250
300
350
400
2003 2004 2005 2006 2007 2008
Crashes
05101520253035404550
Serious Injuries
Total Bicycle Crashes Total Bicyclist Serious Injuries
Note: 2008 data is preliminary.
Figure 3.15 Bicyclist Involved Fatalities as Percent of Total Fatalities Rhode Island Compared to U.S.
1.0%
0.0%
1.1% 1.2%1.4%
1.5%1.5%
1.7%1.8% 1.8%
1.7%
0.5%
0.0%0.2%0.4%0.6%0.8%1.0%1.2%1.4%1.6%1.8%2.0%
2003 2004 2005 2006 2007 2008
Bicyclist Fatalities as % of Total Fatalities U.S. Average
Note: 2008 data is preliminary. Source: FARS.
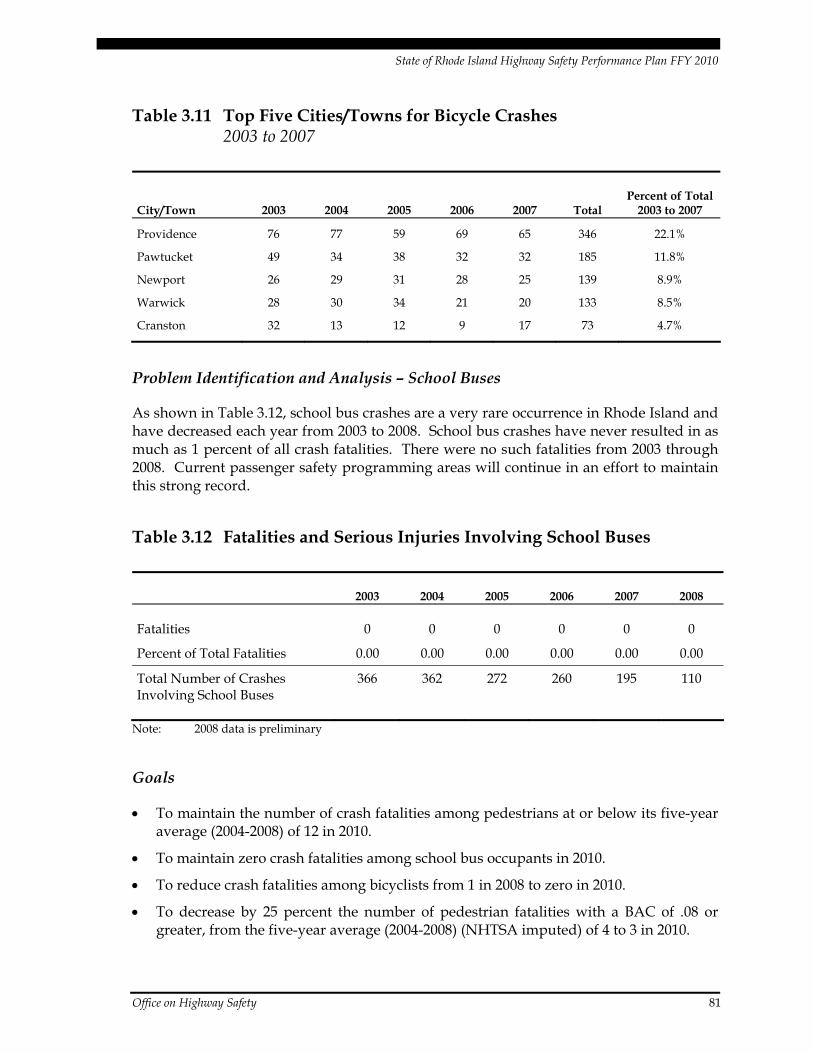
State of Rhode Island Highway Safety Performance Plan FFY 2010
Office on Highway Safety 81
Table 3.11 Top Five Cities/Towns for Bicycle Crashes 2003 to 2007
City/Town 2003 2004 2005 2006 2007 Total Percent of Total
2003 to 2007
Providence 76 77 59 69 65 346 22.1%
Pawtucket 49 34 38 32 32 185 11.8%
Newport 26 29 31 28 25 139 8.9%
Warwick 28 30 34 21 20 133 8.5%
Cranston 32 13 12 9 17 73 4.7%
Problem Identification and Analysis – School Buses
As shown in Table 3.12, school bus crashes are a very rare occurrence in Rhode Island and have decreased each year from 2003 to 2008. School bus crashes have never resulted in as much as 1 percent of all crash fatalities. There were no such fatalities from 2003 through 2008. Current passenger safety programming areas will continue in an effort to maintain this strong record.
Table 3.12 Fatalities and Serious Injuries Involving School Buses
2003 2004 2005 2006 2007 2008
Fatalities 0 0 0 0 0 0
Percent of Total Fatalities 0.00 0.00 0.00 0.00 0.00 0.00
Total Number of Crashes Involving School Buses
366 362 272 260 195 110
Note: 2008 data is preliminary
Goals
• To maintain the number of crash fatalities among pedestrians at or below its five-year average (2004-2008) of 12 in 2010.
• To maintain zero crash fatalities among school bus occupants in 2010.
• To reduce crash fatalities among bicyclists from 1 in 2008 to zero in 2010.
• To decrease by 25 percent the number of pedestrian fatalities with a BAC of .08 or greater, from the five-year average (2004-2008) (NHTSA imputed) of 4 to 3 in 2010.
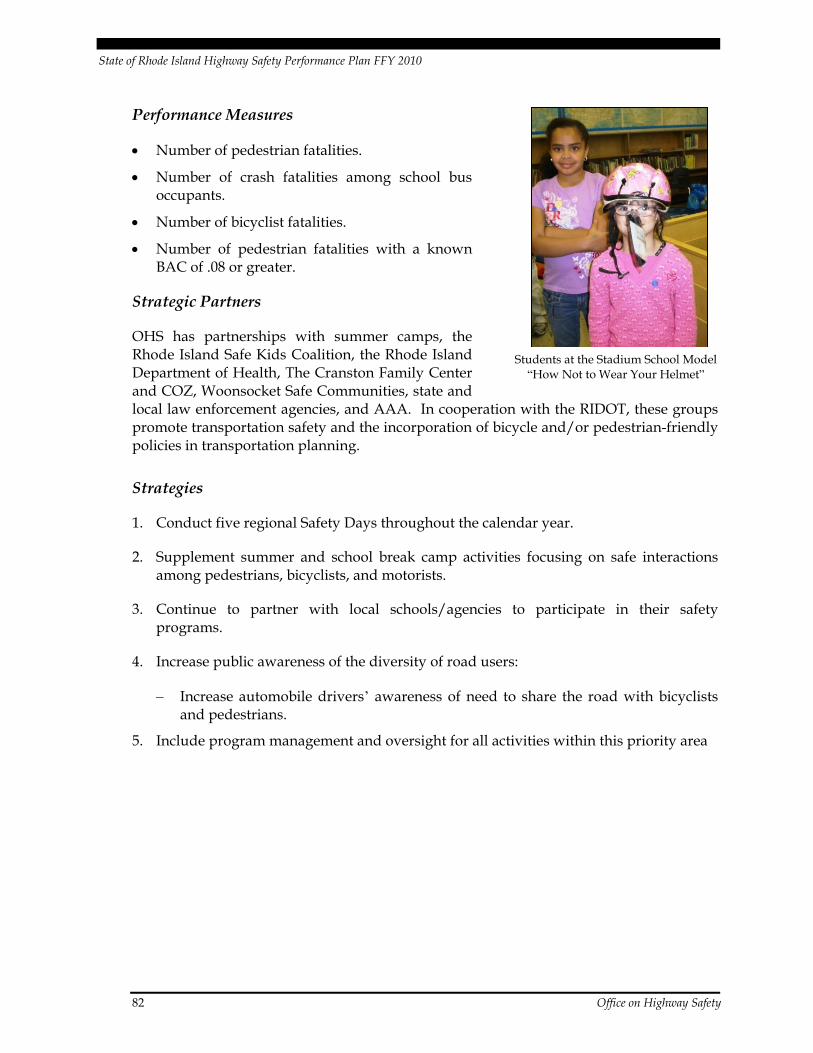
State of Rhode Island Highway Safety Performance Plan FFY 2010
82 Office on Highway Safety
Performance Measures
• Number of pedestrian fatalities.
• Number of crash fatalities among school bus occupants.
• Number of bicyclist fatalities.
• Number of pedestrian fatalities with a known BAC of .08 or greater.
Strategic Partners
OHS has partnerships with summer camps, the Rhode Island Safe Kids Coalition, the Rhode Island Department of Health, The Cranston Family Center and COZ, Woonsocket Safe Communities, state and local law enforcement agencies, and AAA. In cooperation with the RIDOT, these groups promote transportation safety and the incorporation of bicycle and/or pedestrian-friendly policies in transportation planning.
Strategies
1. Conduct five regional Safety Days throughout the calendar year.
2. Supplement summer and school break camp activities focusing on safe interactions among pedestrians, bicyclists, and motorists.
3. Continue to partner with local schools/agencies to participate in their safety programs.
4. Increase public awareness of the diversity of road users:
− Increase automobile drivers’ awareness of need to share the road with bicyclists and pedestrians.
5. Include program management and oversight for all activities within this priority area
Students at the Stadium School Model “How Not to Wear Your Helmet”
State of Rhode Island Highway Safety Performance Plan FFY 2010
Office on Highway Safety 83
Programs and Projects
Project Title – Pedestrian/Bicycle Safety Resource Center
Project Description – OHS maintains appropriate resource materials/promotional materials for use at local and state bicycle/pedestrian safety events.
Project Staff – Despina Metakos
Project Budget/Source – $5,000 of Section 402PS
Project Title – Statewide Safety Events
Project Description – OHS maintains a presence at statewide safety events which provide an opportunity to distribute diverse safety messages to audiences of various ages and interests, including such events as the Construction Career Day, which is attended by high schools from throughout the State, and Safety Days conducted by the Cranston Child Opportunity Zone (COZ) during the summer months.
Project Staff – Administrator and all program managers. For large events, Administrative Assistant assists.
Project Budget/Source – $5,000 of Section 402PS
Project Title – Cranston Child Opportunity Zone (COZ)
Project Description – COZ fosters cooperation between Cranston families and community education, social service, health-care, and public safety organizations; conducts CPS clinics and individual seat checks; fits and distributes bicycle helmets; provides education/outreach on child restraint use, bicycle, and pedestrian safety.
Project Staff – Despina Metakos
Project Budget/Source – $15,000 of Section 402PS
Project Title – Woonsocket Safe Communities Partnership (WSCP)
Project Description – WSCP fosters cooperation between Woonsocket families and community education, social service, health care and public safety organizations; conducts CPS clinics and individual seat checks; fits and distributes bicycle helmets; provides education/outreach on child restraint use, bicycle, and pedestrian safety.
Project Staff – Jim Barden
Project Budget/Source – $30,000 of Section 402SA
State of Rhode Island Highway Safety Performance Plan FFY 2010
84 Office on Highway Safety
3.7 Traffic Records
Problem Identification and Analysis
OHS has requested a NHTSA Traffic Records Assessment which is scheduled for March of 2010. At that time, a revised plan will be developed and implemented. The TRCC has been operating under the recommendations of the last Traffic Records Assessment. OHS safety stakeholders have continued to improve the exchange of information but need improvement in the areas of a timely, accurate, complete, uniform, and integrated system. The traffic records system includes data elements necessary for problem identification, problem analysis, and countermeasure evaluation in all areas of traffic safety in the State.
The TRCC has been working on the multiyear Highway Safety Data and Traffic Records System Improvement Plan. This is technically the last year of the Section 408 grant. Congress will provide the State with further direction for continuation of this program.
Goals
• To increase the timeliness of E-citation data from police and state and Municipal Courts being posted into the system, from monthly in 2009 to daily in 2010.
• To increase by 19 the number of Law Enforcement Agencies backfilling data into citations, from 6 in 2009 to 25 in 2010.
Program Performance Measures
• Number of days necessary for E-citation data from police and state and Municipal Courts to be posted into the system.
• Number of Law Enforcement Agencies backfilling data into citations.
Strategic Partners
OHS will continue to work with members of the TRCC, including RIDOT, FMCSA, FHWA, DMV, Department of Health, local/state police, and public/private organizations.
Strategies
1. Conduct 12 TRCC meetings in 2010 (10 in 2009).
2. Implement procedures necessary for Traffic Stop Data (Race Data) from Local/State Police Law Enforcement to be electronically transmitted to a designated institution for collection and analysis (none in 2009 to 39 in 2010).
3. Continue to expand and improve databases on highway safety.
4. Improve and refine data integration and coordination with highway safety stakeholders.

State of Rhode Island Highway Safety Performance Plan FFY 2010
Office on Highway Safety 85
5. Complete implementation and deployment of hardware, software, and training to support the electronic collection and transmission of traffic safety information (E-citation, Crash form, and Race data collection).
6. Expand sharing of problem identification data among shareholders, partners, and traffic safety advocates.
7. Monitor NHTSA 408 Grant Management Projects. This is the last year of the Grant program. The amount of funding received will determine the measurable goals set for 2010.
8. Provide law enforcement with community statistics one month prior to the national “Click It or Ticket” and “You Drink. You Drive. You Lose.” campaigns.
9. Increase the data linkage of traffic records with other data systems within the State and local highway and traffic safety programs.
10. Improve the maintenance, coordination, accuracy, and analysis of current transportation safety data:
− Conduct regularly scheduled meetings of the TRCC;
− Utilize NHTSA 408 Grant Funding to partner with other state agencies in data coordination, management, and analysis; and
− Seek contractor for data coordination, management, and analysis.
11. Increase the availability of safety data and traffic records to highway safety stakeholders:
− Use Critical Analysis Reporting Environment (CARE) software to generate community-wide data analysis. This analysis will be made available to highway safety stakeholders through improved web site access;
− Provide community-wide analysis to all Operation Blue RIPTIDE partners through web site connections;
− Hold informational meetings with potential grantees (15 in 2009);
− Expand the total number of potential program partners; and
− Continue working with the RIDOT to update the Rhode Island SHSP.
12. Provide information on highway safety problem identification, process, program planning, and evaluation to potential grantees:
13. Redesign the OHS web page to include a secure traffic records information section that highway safety stakeholders can access. Create a public side to this page for public access to static information.
State of Rhode Island Highway Safety Performance Plan FFY 2010
86 Office on Highway Safety
14. Identify, adjust, track, and document systemwide and project level performance measures for inclusion in final report to NHTSA on Section 408. If grant program is continued, provide information for new application.
15. Continue development of a comprehensive inventory of highway safety information sources in the State and create a statewide Traffic Records System Resource Guide.
16. Include program management and oversight for all activities within this priority area.
Programs and Projects
Project Title – Traffic Records Coordinating Committee Support and Assistance
Project Description – OHS is finalizing an RFP to seek a qualified data management firm to provide support and technical assistance to the Rhode Island TRCC.
Project Staff – Dan DiBiasio
Project Budget/Source – $80,000 of Section 408
Project Title – Rhode Island DOH Traffic Records Programs
Project Description – This project will develop an analysis of crashes involving young drivers, passengers, pedestrians, and pedal cyclists between the ages of 15 to 24 years of age. An algorithm will be developed to create an integrated data set composed of records of hospital emergency department visits, observation periods, and inpatient hospital discharges for events occurring in Rhode Island.
Project Staff – Dan DiBiasio
Project Budget/Source – $60,000 of Section 408
Project Title – Local Law Enforcement Traffic Records Equipment
Project Description – To fully implement the E-Citation program and the requirements of the Section 1906, Racial Profiling, programs, OHS is working in conjunction with the courts to ensure that all patrol cars in the State are equipped with a computer and printer for electronic transmission of citation/passenger ethnicity data. All cities/towns have signed a Memorandum of Understanding (MOU) which agrees to provide this data upon receipt of the equipment. Data will be provided to the courts and the educational institution that is chosen through the RFP process to collect and analyze the ethnicity of driver/passenger information.
Project Staff – Dan DiBiasio
Project Budget/Source – $250,000 of Section 1906
State of Rhode Island Highway Safety Performance Plan FFY 2010
Office on Highway Safety 87
Project Title – Data Collection, Analysis, and Recommendation RFP
Project Description – OHS is finalizing an RFP to complete the requirements for the Section 1906 grant monies to determine an educational institution that will collect the ethnicity data from the police departments, analyze it, and produce the results and recommendations to address pertinent issues. Information will then be distributed through various web sites for public inspection and discussion.
Project Staff – Dan DiBiasio
Project Budget/Source – $400,000 of Section 1906
Project Title – Traffic Records Coordinating Committee Initiatives
Project Description – One of the missions of the TRCC is to develop information systems and business processes that promote the sharing of highway safety data among all involved agencies. This ensures that accurate, complete, and timely safety data is collected, analyzed, and made available for decision-making among appropriate partners.
Initiatives within this project include the: GIS Map interface for the Rhode Island Crash Reporting System; development of an information sharing agreement between state agen-cies involved with traffic records; and development of an intranet site for OHS to improve accessibility to highway safety data.
Project Staff – Dan DiBiasio
Project Budget/Source – $401,250 of Section 408
Project Title – Emergency Management Systems Software
Project Description – OHS is working with the Department of Health Emergency Medical Services to improve the reporting system currently used by EMS providers throughout the state. This system is the statewide trauma registry that collects and analyzes information on the incident, severity, causes and outcomes of trauma events to evaluate the factors and the health system’s response.
Project Staff – Dan DiBiasio
Project Budget/Source – $100,000 of Section 402TR
Project Title – Rhode Island Traffic Tribunal E-Citation Program
Project Description – OHS is partnering with the Rhode Island Judiciary, RISP, local law enforcement agencies and the DMV to improve traffic-related records and data sharing. This project increases operational efficiency and accountability by replacing the hand written summons pad with an electronic citation process.
Project Staff – Dan DiBiasio
Project Budget/Source – $70,000 of Section 408

State of Rhode Island Highway Safety Performance Plan FFY 2010
88 Office on Highway Safety
Project Title – Rhode Island Traffic Tribunal E-Citation DMV Interface Program
Project Description – OHS is partnering with the Rhode Island Judiciary, and the DMV to improve traffic-related records and data sharing. This project increases operational efficiency and accountability by direct electronic citation interface with both agencies.
Project Staff – Dan DiBiasio
Project Budget/Source – $100,000 of Section 408
Project Title – Rhode Island Traffic Tribunal E-Citation Municipal Court Interface Program
Project Description – OHS is partnering with the Rhode Island Judiciary, and Municipal Courts throughout the state to improve traffic-related records and data sharing. This project increases operational efficiency and accountability by direct electronic citation interface with agencies.
Project Staff – Dan DiBiasio
Project Budget/Source – $40,000 of Section 408
Project Title – Rhode Island Division of Motor Vehicle Crash Report Imaging Program
Project Description – OHS is partnering with the Rhode Island DMV Safety Responsibility (Accident) Section for converting from paper to electronic format the Vehicle Crash Reports currently in its system. This will improve traffic-related records and data sharing. This project increases operational efficiency and accountability by direct electronic Crash Report file to driver file information for retrieval by law enforcement.
Project Staff – Dan DiBiasio
Project Budget/Source – $150,000 of Section 408
Project Title – Emergency Management Systems Field Software
Project Description – OHS is working with the Department of Health Emergency Medical Services to improve the reporting system currently used by EMS providers throughout the state. This system is the statewide trauma registry that collects and analyzes information on the incident, severity, causes and outcomes of trauma events to evaluate the factors and the health system’s response in the field.
Project Staff – Dan DiBiasio
Project Budget/Source – $50,000 of Section 408
State of Rhode Island Highway Safety Performance Plan FFY 2010
Office on Highway Safety 89
Project Title – RISP Traffic Records Program
Project Description – As part of the implementation of the E-Citation program and the Section 1906 racial profiling programs, the RISP are working in conjunction with the courts to equip all patrol cars in the agency with computers and printers for electronic transmission of citation/passenger ethnicity data.
Project Staff – Dan DiBiasio
Project Budget/Source – $150,000 of Section 408

State of Rhode Island Highway Safety Performance Plan FFY 2010
90 Office on Highway Safety
3.8 Racial Profiling
Problem Identification and Analysis
The act of racial profiling affects both law enforcement and the community at large by undermining the civil rights of everyone; this creates mistrust with the majority of law enforcement personnel who are enforcing the law in an equitable manner. The State of Rhode Island has received racial profiling monies (Section 1906) as an assurance state for two years under the SAFETEA-LU legislation. RIDOT OHS is utilizing these funds to continue developing a multifaceted program to assess the level and/or locations where racial profiling may exist and to implement programs to address and improve community/police relations. There is a great need to create an effective mechanism to collect and analyze traffic stop data on both drivers and passengers and develop an aggressive program to address deficiencies, if they are found. Existing programs, policies, and procedures that have been implemented by law enforcement to eliminate these prac-tices also need to be collected and analyzed with the ultimate goal of promoting trust and effective community relations between law enforcement and the communities they serve.
Two other key elements have been characterized as challenges, including the lack of knowledge/education of the minority community in regards to knowing what to do during a traffic stop and the potential for language barriers.
As Rhode Island no longer has legislation mandating the collection of traffic stop data, RIDOT OHS has signed commitments [through the Memorandum of Understanding (MOU) process] with the 38 local police departments and the RISP to voluntarily collect statistical information on the race and ethnicity of the driver and passengers for each motor vehicle stop. An RFP to provide the appropriate mechanism to collect, analyze, and assess this information and provide recommendations to address issues that arise from the data is being finalized and final selection of an appropriate entity for the program is anticipated in the near future. In conjunction with these activities, RIDOT has negotiated an agreement with the Information Management Corporation (IMC) to revise the traffic stop form to include a module for number and ethnicity of passengers in each vehicle and to develop the transmittal mechanism to allow the departments to electronically provide the information to the entity chosen to collect the data by May 2010. RIDOT will collect the data from the police departments until the transmittal mechanism is in place.
Finally, OHS has committed to implementing an enhanced Professional Traffic Stop Training for all law enforcement agencies. This program is based on NHTSA’s model, which was reviewed and extensively revised by NHTSA’s Regional LEL, Ted Minall, and the Rhode Island State LEHSTC, Col. Richard Sullivan (ret.). The revised training was reviewed and extensively discussed with members of the minority community and law enforcement and has been well supported by all. The first “train the trainer” class was conducted in June of this year. Further classes will be conducted throughout this and the next Federal fiscal year.
State of Rhode Island Highway Safety Performance Plan FFY 2010
Office on Highway Safety 91
Goals
• To establish a process and secure the infrastructure needed to determine if racial profiling is occurring and to identify appropriate program recommendations if necessary.
• To produce by means of data collection and analysis by an appropriate entity at least one quarterly comprehensive report, including passenger and driver ethnicity information, summarizing the traffic stop information from all police departments who have received computer equipment.
Program Performance Measures
• Finalize installation of computers and printers in all law enforcement vehicles to collect traffic stop information.
• Have IMC complete module change to include ethnicity of passengers on the traffic stop form and provide mechanism to transmit information from police departments to the designated data collection entity.
• Begin work on developing independent software program that would allow all police departments to transmit required information regardless of their software service provider.
• Implement contract with the college/university or research institution that is chosen in the RFP process to collect, analyze, and distribute traffic stop data and to make programmatic recommendations.
Strategic Partners
To achieve these aggressive goals, it is imperative that the interactions between state and local law enforcement, agencies representing minority interests, legislators, and leaders within all the diverse communities throughout the State of Rhode Island work with the OHS in the planning, development, and implementation process to achieve our common goals. Currently, two different ethnic groups – African American and Latino – have been identified and are involved in the current process. As the program develops, OHS plans to expand its scope to include other ethnic groups within the State.
Strategies
1. Generate programs to enhance law enforcement and minority community involvement and communication to ensure collaborations on highway safety programs.
2. Conduct at least 10 Professional Traffic Stop Trainings, for a total of approximately 300 trainees.
3. Continue distribution of “What should I do if I am stopped by an officer of the law?” and “What to do during an encounter with a police officer” brochures.
State of Rhode Island Highway Safety Performance Plan FFY 2010
92 Office on Highway Safety
4. Develop and provide strategic recommendations/initiatives to eliminate/prevent racial profiling based on data analysis.
5. Finalize and implement the process necessary to develop program initiatives designed to foster understanding, communication, and involvement between the minority communities and law enforcement personnel. Such a program would include extensive education and outreach initiatives, such as faith-based programs and public forums between law enforcement and the minority community and culturally appropriate literature and media campaigns in multiple languages.
6. Develop tools, products, or activities that will facilitate the implementation or advancement of best practices to prohibit racial profiling and to ensure project effectiveness.
7. Develop culturally appropriate education/information tools to support all of the program initiatives of the OHS, including occupant protection, impaired driving, motorcycle safety, young driver programs, speed, and other roadway users.
8. Include program management and oversight for all activities within this priority area.
Program and Projects
Project Title – Passenger Race Data Module Modification, New World Information Management
Project Description – To create a Race Data module to be used by the Providence Police Department and any other law enforcement agencies that might choose to utilize the New World system and to meet the requirements of the Section 1906 program, OHS is working with New World to create a Race Data module for passengers for the traffic stop form and a program to allow the electronic transmission of the citation/passenger/driver ethnicity data to the educational institution that is chosen through the RFP process to collect, analyze and report the data for the State. OHS has a signed a Memorandum of Understanding (MOU) with Providence in which they agree to provide this data upon receipt of the appropriate equipment.
Project Staff – Dan DiBiasio
Project Budget/Source – $110,000 of Section 1906
Project Title – Passenger Race Data Module Modification, Information Management Corporation (IMC)
Project Description – To fully implement the IMC Race Data module currently used by 98 percent of Rhode Islands state and local law enforcement agencies and to fulfill the requirements of the Section 1906, Racial Profiling, program, OHS is working with IMC to create a Race Data module for passengers for the traffic stop form and a program to allow the electronic transmission of the citation/passenger/driver ethnicity data to the educational institution that is chosen through the RFP process to collect, analyze and

State of Rhode Island Highway Safety Performance Plan FFY 2010
Office on Highway Safety 93
report the data for the State. All cities/towns have signed a Memorandum of Understanding (MOU) to provide this data upon receipt of the appropriate equipment. Data will be provided to the courts and the educational institution that is chosen through the RFP process to collect and analyze the ethnicity of driver/passenger information.
Project Staff – Dan DiBiasio
Project Budget/Source – $53,814 of Section 1906
Project Title – RFP for State Owned E-Citation/Race Data Module
Project Description – OHS is finalizing an RFP to seek a qualified data management firm to develop a software package for E-Citation and Passenger Ethnicity as a stand alone program for the state to be used with law enforcement agencies not currently using IMC software. This will enable full implementation of the E-Citation program and fulfill the requirements of the Section 1906 Racial Profiling program.
Project Staff – Dan DiBiasio
Project Budget/Source – $90,000 of Section 1906
Project Title – Local Law Enforcement Traffic Records Equipment
Project Description – To fully implement the E-Citation program and the requirements of the Section 1906, Racial Profiling, programs, OHS is working in conjunction with the courts to ensure that all patrol cars in the state are equipped with a computer and printer for electronic transmission of citation/passenger ethnicity data. All cities/towns have signed a MOU which agrees to provide this data upon receipt of the equipment. Data will be provided to the courts and the educational institution that is chosen through the RFP process to collect and analyze the ethnicity of driver/passenger information.
Project Staff – Dan DiBiasio
Project Budget/Source – $250,000 of Section 1906
Project Title – Data Collection, Analysis, and Recommendation RFP
Project Description – OHS is finalizing an RFP to complete the requirements for the Section 1906 grant monies to determine an educational institution that will collect the ethnicity data from the police departments, analyze it, and produce the results and recommendations to address pertinent issues. Final selection of the entity is anticipated in the near future. Information will then be distributed through various web sites for public inspection and discussion.
Project Staff – Dan DiBiasio
Project Budget/Source – $400,000 of Section 1906
State of Rhode Island Highway Safety Performance Plan FFY 2010
94 Office on Highway Safety
Project Title – Professional Traffic Stop Training
Project Description – Conduct at least 10 Professional Traffic Stop Trainings for local/state law enforcement personnel.
Project Staff – Janis Loiselle and Jim Barden
Project Budget/Source – $12,000 of Section 1906
Project Title – Community Outreach and Training Program
Project Description – Develop and implement a community outreach/education and training program within the African American and Latino communities to improve working relationships between police and the members of the community.
Project Staff – Janis Loiselle
Project Budget/Source – $96,042 of Section 1906
Project Title – LEHSTC Salary support for Section 1906 Activities
Project Description – Salary for Col. Richard Sullivan for implementation of Section 1906 programs.
Project Staff – Janis Loiselle
Project Budget/Source – $19,600 of Section 402PT, $1,600 of Section 402AL, $13,281 of Section 405, $19,600 of Section 1906, and $19,600 of Section 164AL
Project Title – RISP Traffic Records Program
Project Description – As part of the implementation of the E-Citation program and the Section 1906 racial profiling programs, the RISP are working in conjunction with the courts to equip all patrol cars in the agency with computers and printers for electronic transmission of citation/passenger ethnicity data
Project Staff – Dan DiBiasio
Project Budget/Source – $150,000 of Section 408

State of Rhode Island Highway Safety Performance Plan FFY 2010
Office on Highway Safety 95
3.9 Planning and Administration The RIDOT Office on Highway Safety will serve as the primary agency responsible for insuring that highway safety concerns for Rhode Island are identified and addressed through the development and implementation of appropriate countermeasures.
Goals
• To administer a fiscally responsible, effective highway safety program that is data driven, includes stakeholders, and addresses the State’s specific safety characteristics.
Program Performance Measures
• Integrate recommendations from NHTSA’s Special Management Review (PEP) within specified timeframe.
• Conduct a Stakeholders’ meeting to receive input for development of the FFY 2011 Highway Safety Performance Plan.
• Deliver the FFY 2009 Annual Report by December 31, 2009. • Deliver the Federal Fiscal Year 2011 Highway Safety Performance Plan by September
1, 2010.
Strategic Partners
OHS will continue to work with traffic safety stakeholders, including state and local law enforcement agencies and all grant recipients.
Strategies
1. Administer the statewide traffic safety program:
− Implement the FFY 2010 HSPP and develop future initiatives; − Provide sound fiscal management for traffic safety programs; − Coordinate state plans with other Federal, state, and local agencies; and − Assess program outcomes.
2. Provide data required for Federal and state reports.
3. Provide program staff, professional development, travel funds, space, equipment, materials, and fiscal support for all programs.
4. Provide data and information to policy and decision-makers on the benefits of various traffic safety laws.
5. Identify and prioritize highway safety problems for future OHS attention, programming, and activities.
6. Include program management and oversight for all activities within this priority area.
State of Rhode Island Highway Safety Performance Plan FFY 2010
96 Office on Highway Safety
Programs and Projects
Project Title – HSPP and Annual Report Preparation
Project Description – OHS will continue the contract for the development and production of the OHS HSPP for FFY 2011 and the Annual Report for FFY 2009.
Project Staff – Janis Loiselle
Project Budget/Source – $60,000 of Section 402PA
Project Title – Dues and Subscriptions
Project Description – OHS will pay fees for dues for the Governors’ Highway Safety Association and any required periodicals/publications.
Project Staff – Sharon Bazor
Project Budget/Source – $5,000 of Section 402PA
Project Title – Audit Fees
Project Description – OHS will pay the audit fees charged by the State of Rhode Island based on cash receipts from NHTSA.
Project Staff – Sharon Bazor
Project Budget/Source – $100 of Section 402PA $1,000 of Section 402PM
$100 of Section 402AL $45 of Section 405
$150 of Section 402MC $750 of Section 408
$300 of Section 402OP $100 of Section 410
$100 of Section 402PS $165 of Section 2010
$150 of Section 402PT $1,000 of Section 1906
$400 of Section 402TR $5,000 of Section 164PA
$45 of Section 402SA $9,405 TOTAL
Project Title – Office Supplies/Equipment
Project Description – OHS will purchase office supplies, phone, postage, and equipment necessary to support programming of all NHTSA projects. The OHS copier is essentially nonfunctional and needs replacing. OHS also canceled the maintenance on the fax machine as it will be more cost effective to purchase a replacement when this one is no longer working than to maintain the annual contract.
State of Rhode Island Highway Safety Performance Plan FFY 2010
Office on Highway Safety 97
Project Staff – Kathy Smith
Project Budget/Source – $19,900 of Section 402PA
Project Title – Travel
Project Description – This is for instate and out-of-state travel for OHS employees for pertinent conferences and training sessions.
Project Staff – Administrator and all program managers
Project Budget/Source – $10,000 of Section 402PA
Project Title – Salaries
Project Description – OHS will pay amounts charged to NHTSA accounts for Dan DiBiasio, Despina Metakos, Kathy Smith, and 50 percent of Jim Barden’s salaries.
Project Staff – Sharon Bazor
Project Budget/Source – $63,700 of Section 402AL, $146,850 of Section 402MC, $67,500 of Section 402OP, $5,600 of Section 402PS, $10,000 of Section 402PT, $172,000 of Section 402TR, and $77,300 of Section 410.
Project Title – Hazard Elimination Program
Project Description – These are funds that are transferred to RIDOT for Hazard Elimination Projects
Project Staff – Sharon Bazor
Project Budget/Source – $2,000,000 of Section 164AL

State of Rhode Island Highway Safety Performance Plan FFY 2010
Office on Highway Safety 99
4.0 State Certifications and Assurances
Failure to comply with applicable Federal statutes, regulations and directives may subject State officials to civil or criminal penalties and/or place the State in a high-risk grantee status in accordance with 49 CFR §18.12.
Each fiscal year the State will sign these Certifications and Assurances that the State complies with all applicable Federal statutes, regulations, and directives in effect with respect to the periods for which it receives grant funding. Applicable provisions include, but not limited to, the following:
• 23 U.S.C. Chapter 4 – Highway Safety Act of 1966, as amended;
• 49 CFR Part 18 – Uniform Administrative Requirements for Grants and Cooperative Agreements to State and Local Governments;
• 49 CFR Part 19 – Uniform Administrative Requirements for Grants and Agreements with Institutions of Higher Education, Hospitals and Other Nonprofit Organizations;
• 23 CFR Chapter II\(§§1200, 1205, 1206, 1250, 1251, & 1252) Regulations governing highway safety programs;
• NHTSA Order 462-6C – Matching Rates for State and Community Highway Safety Programs; and
• Highway Safety Grant Funding Policy for Field-Administered Grants.
4.1 Certifications and Assurances
The Governor is responsible for the administration of the State highway safety program through a State highway safety agency which has adequate powers and is suitably equipped and organized (as evidenced by appropriate oversight procedures governing such areas as procurement, financial administration, and the use, management, and disposition of equipment) to carry out the program (23 USC 402(b)(1)(A));
The political subdivisions of this State are authorized, as part of the State highway safety program, to carry out within their jurisdictions local highway safety programs which have been approved by the Governor and are in accordance with the uniform guidelines promulgated by the Secretary of Transportation (23 USC 402(b)(1)(B));
State of Rhode Island Highway Safety Performance Plan FFY 2010
100 Office on Highway Safety
At least 40 per cent of all Federal funds apportioned to this State under 23 USC 462 for this fiscal year will be expended by or for the benefit of the political subdivision of the State in carrying out local highway safety programs (23 USC 402(b)(1)(C)), unless this requirement is waived in writing;
The State will implement activities in support of national highway safety goals to reduce motor vehicle-related fatalities that also reflect the primary data-related crash factors within the State as identified by the State highway safety planning process, including:
• National law enforcement mobilizations;
• Sustained enforcement of statutes addressing impaired driving, occupant protection, and driving in excess of posted speed limits;
• An annual statewide safety belt use survey in accordance with criteria established by the Secretary for the measurement of State safety belt use rates to ensure that the measurements are accurate and representative; and
• Development of statewide data systems to provide timely and effective data analysis to support allocation of highway safety resources.
The State shall actively encourage all relevant law enforcement agencies in the State to follow the guidelines established for vehicular pursuits issued by the International Association of Chiefs of Police that are currently in effect.
This State’s highway safety program provides adequate and reasonable access for the safe and convenient movement of physically handicapped persons, including those in wheelchairs, across curbs constructed or replaced on or after July 1, 1976, at all pedestrian crosswalks (23 USC 402(b)(1)(0));
Cash draw downs will be initiated only when actually needed for disbursement, cash disbursements and balances will be reported in a timely manner as required by NHTSA, and the same standards of timing and amount, including the reporting of cash disbursement and balances, will be imposed upon any secondary recipient organizations (49 CFR 18.20, 18.21, and 18.41). Failure to adhere to these provisions may result in the termination of drawdown privileges;
The State has submitted appropriate documentation for review to the single point of contact designated by the Governor to review Federal programs, as required by Executive Order 12372 (Intergovernmental Review of Federal Programs);
Equipment acquired under this agreement for use in highway safety program areas shall be used and kept in operation for highway safety purposes by the State; or the State, by formal agreement with appropriate officials of a political subdivision or State agency, shall cause such equipment to be used and kept in operation for highway safety purposes (23 CFR 1200.21);
State of Rhode Island Highway Safety Performance Plan FFY 2010
Office on Highway Safety 101
The State will comply with all applicable State procurement procedures and will maintain a financial management system that complies with the minimum requirements of 49 CFR 18.20;
The State highway safety agency will comply with all Federal statutes and implementing regulations relating to nondiscrimination. These include but are not limited to: a) Title VI of the Civil Rights Act of 1964 (P.L. 88-352) which prohibits discrimination on the basis of race, color or national origin (and 49 CFR Part 21); b) Title IX of the Education Amendments of 1972, as amended (20 U.S.C. §§ 1681-1683, and 1685-1686), which prohibits discrimination on the basis of sex; c) Section 504 of the Rehabilitation Act of 1973, as amended (29 U.S.C. §794), which prohibits discrimination on the basis of handicaps (and 49 CFR Part 27); d) the Age Discrimination Act of 1975, as amended (42U.S.C. §§ 6101-6107), which prohibits discrimination on the basis of age; e) the Drug Abuse Office and Treatment Act of 1972 (P.L. 92-255), as amended, relating to nondiscrimination on the basis of drug abuse; f) the comprehensive Alcohol Abuse and Alcoholism Prevention, Treatment and Rehabilitation Act of 1970 (P.L. 91-616), as amended, relating to nondiscrimination on the basis of alcohol abuse or alcoholism; g) §§ 523 and 527 of the Public Health Service Act of 1912 (42.U.S.C. §§ 290 dd-3 and 290 ee-3), as amended, relating to confidentiality of alcohol and drug abuse patient records; h) Title VIII of the Civil Rights Act of 1968 (42 U.S.C. §§ 3601 et seq.), as amended, relating to nondiscrimination in the sale, rental or financing of housing; i) any other nondiscrimination provisions in the specific statute(s) under which application for Federal assistance is being made; and, j) the requirements of any other nondiscrimination statute(s) which may apply to the application.
4.2 The Drug-free Workplace Act of 1988 (49 CFR Part 29 Subpart F)
The State will provide a drug-free workplace by:
a. Publishing a statement notifying employees that the unlawful manufacture, distribution, dispensing, possession or use of a controlled substance is prohibited in the grantee’s workplace and specifying the actions that will be taken against employees for violation of such prohibition;
b. Establishing a drug-free awareness program to inform employees about:
1. The dangers of drug abuse in the workplace.
2. The grantee’s policy of maintaining a drug-free workplace.
3. Any available drug counseling, rehabilitation, and employee assistance programs.
4. The penalties that may be imposed upon employees for drug violations occurring in the workplace.
State of Rhode Island Highway Safety Performance Plan FFY 2010
102 Office on Highway Safety
c. Making it a requirement that each employee engaged in the performance of the grant be given a copy of the statement required by paragraph (a).
d. Notifying the employee in the statement required by paragraph (a) that, as a condition of employment under the grant, the employee will:
1. Abide by the terms of the statement.
2. Notify the employer of any criminal drug statute conviction for a violation occurring in the workplace no later than five days after such conviction.
e. Notifying the agency within ten days after receiving notice under subparagraph (d)(2) from an employee or otherwise receiving actual notice of such conviction.
f. Taking one of the following actions, within 30 days of receiving notice under subparagraph (d)(2), with respect to any employee who is so convicted
1. Taking appropriate personnel action against such an employee, up to and including termination.
2. Requiring such employee to participate satisfactorily in a drug abuse assistance or rehabilitation program approved for such purposes by a Federal, state, or local health, law enforcement, or other appropriate agency.
g. Making a good faith effort to continue to maintain a drug-free workplace through implementation of paragraphs (a), (b), (c), (d), (e), and (f) above.
4.3 Buy America Act
The State will comply with the provisions of the Buy America Act (23 USC 101 Note) which contains the following requirements:
Only steel, iron and manufactured products produced in the United States may be purchased with Federal funds unless the Secretary of Transportation determines that such domestic purchases would be inconsistent with the public interest; that such materials are not reasonably available and of a satisfactory quality; or that inclusion of domestic materials will increase the cost of the overall project contract by more than 25 percent. Clear justification for the purchase of non-domestic items must be in the form of a waiver request submitted to and approved by the Secretary of Transportation.
State of Rhode Island Highway Safety Performance Plan FFY 2010
Office on Highway Safety 103
4.4 Political Activity (Hatch Act)
The State will comply with the provisions of five U.S.C. §§ 1501-1508 and implementing regulations of five CFR Part 151, concerning “Political Activity of State or Local Offices, or Employees.”
4.5 Certification Regarding Federal Lobbying
Certification for Contracts, Grants, Loans, and Cooperative Agreements
The undersigned certifies, to the best of his or her knowledge and belief, that:
1. No Federal appropriated funds have been paid or will be paid, by or on behalf of the undersigned, to any person for influencing or attempting to influence an officer or employee of any agency, a Member of Congress, an officer or employee of Congress, or an employee of a Member of Congress in connection with the awarding of any Federal contract, the making of any Federal grant, the making of any Federal loan, the entering into of any cooperative agreement, and the extension, continuation, renewal, amendment, or modification of any Federal contract, grant, loan, or cooperative agreement.
2. If any funds other than Federal appropriated funds have been paid or will be paid to any person for influencing or attempting to influence an officer or employee of any agency, a Member of Congress, an officer or employee of Congress, or an employee of a Member of Congress in connection with this Federal contract, grant, loan, or cooperative agreement, the undersigned shall complete and submit Standard Form-LLL, “Disclosure Form to Report Lobbying,” in accordance with its instructions.
3. The undersigned shall require that the language of this certification be included in the award documents for all subaward at all tiers (including subcontracts, subgrants, and contracts under grant, loans, and cooperative agreements) and that all subrecipients shall certify and disclose accordingly.
This certification is a material representation of fact upon which reliance was placed when this transaction was made or entered into. Submission of this certification is a prerequisite for making or entering into this transaction imposed by section 1352, title 31, U.S. Code. Any person who fails to file the required certification shall be subject to a civil penalty of not less than $10,000 and not more than $100,000 for each such failure.

State of Rhode Island Highway Safety Performance Plan FFY 2010
104 Office on Highway Safety
4.6 Restriction on State Lobbying
None of the funds under this program will be used for any activity specifically designed to urge or influence a State or local legislator to favor or oppose the adoption of any specific legislative proposal pending before any State or local legislative body. Such activities include both direct and indirect (e.g., “grassroots”) lobbying activities, with one exception. This does not preclude a State official whose salary is supported with NHTSA funds from engaging in direct communications with State or local legislative officials, in accordance with customary State practice, even if such communications urge legislative officials to favor or oppose the adoption of a specific pending legislative proposal.
4.7 Certification Regarding Debarment and Suspension
Instructions for Primary Certification
1. By signing and submitting this proposal, the prospective primary participant is providing the certification set out below.
2. The inability of a person to provide the certification required below will not necessarily result in denial of participation in this covered transaction. The prospective participant shall submit an explanation of why it cannot provide the certification set out below. The certification or explanation will be considered in connection with the department or agency’s determination whether to enter into this transaction. However, failure of the prospective primary participant to furnish a certification or an explanation shall disqualify such person from participation in this transaction.
3. The certification in this clause is a material representation of fact upon which reliance was placed when the department or agency determined to enter into this transaction. If it is later determined that the prospective primary participant knowingly rendered an erroneous certification, in addition to other remedies available to the Federal Government, the department or agency may terminate this transaction for cause or default.
4. The prospective primary participant shall provide immediate written notice to the department or agency to which this proposal is submitted if at any time the prospective primary participant learns its certification was erroneous when submitted or has become erroneous by reason of changed circumstances.
5. The terms covered transaction, debarred, suspended, ineligible, lower-tier covered transaction, participant, person, primary covered transaction, principal, proposal, and voluntarily excluded, as used in this clause, have the meaning set out in the Definitions and coverage sections of 49 CFR Part 29. You may contact the department
State of Rhode Island Highway Safety Performance Plan FFY 2010
Office on Highway Safety 105
or agency to which this proposal is being submitted for assistance in obtaining a copy of those regulations.
6. The prospective primary participant agrees by submitting this proposal that, should the proposed covered transaction be entered into, it shall not knowingly enter into any lower-tier covered transaction with a person who is proposed for debarment under 48 CFR Part 9, subpart 9.4, debarred, suspended, declared ineligible, or voluntarily excluded from participation in this covered transaction, unless authorized by the department or agency entering into this transaction.
7. The prospective primary participant further agrees by submitting this proposal that it will include the clause titled “Certification Regarding Debarment, Suspension, Ineligibility and Voluntary Exclusion-Lower-Tier Covered Transaction,” provided by the department or agency entering into this covered transaction, without modification, in all lower-tier covered transactions and in all solicitations for lower-tier covered transactions.
8. A participant in a covered transaction may rely upon a certification of a prospective participant in a lower-tier covered transaction that it is not proposed for debarment under 48 CFR Part 9, subpart 9.4, debarred, suspended, ineligible, or voluntarily excluded from the covered transaction, unless it knows that the certification is erroneous. A participant may decide the method and frequency by which it determines the eligibility of its principals. Each participant may, but is not required to, check the list of Parties Excluded from Federal Procurement and Non-procurement Programs.
9. Nothing contained in the foregoing shall be construed to require establishment of a system of records in order to render in good faith the certification required by this clause. The knowledge and information of a participant is not required to exceed that which is normally possessed by a prudent person in the ordinary course of business dealings.
10. Except for transactions authorized under paragraph 6 of these instructions, if a participant in a covered transaction knowingly enters into a lower-tier covered transaction with a person who is proposed for debarment under 48 CFR Part 9, subpart 9.4, suspended, debarred, ineligible, or voluntarily excluded from participation in this transaction, in addition to other remedies available to the Federal Government, the department or agency may terminate this transaction for cause or default.
State of Rhode Island Highway Safety Performance Plan FFY 2010
106 Office on Highway Safety
4.8 Certification Regarding Debarment, Suspension, and Other Responsibility Matters – Primary Covered Transactions
1. The prospective primary participant certifies to the best of its knowledge and belief, that its principals:
a. Are not presently debarred, suspended, proposed for debarment, declared ineligible, or voluntarily excluded by any Federal department or agency;
b. Have not within a three-year period preceding this proposal been convicted of or had a civil judgment rendered against them for commission of fraud or a criminal offense in connection with obtaining, attempting to obtain, or performing a public (Federal, State or local) transaction or contract under a public transaction; violation of Federal or State antitrust statutes or commission of embezzlement, theft, forgery, bribery, falsification or destruction of record, making false statements, or receiving stolen property;
c. Are not presently indicted for or otherwise criminally or civilly charged by a governmental entity (Federal, State or Local) with commission of any of the offenses enumerated in paragraph (1)(b) of this certification; and
d. Have not within a three-year period preceding this application/proposal had one or more public transactions (Federal, State, or local) terminated for cause or default.
2. Where the prospective primary participant is unable to certify to any of the Statements in this certification, such prospective participant shall attach an explanation to this proposal.
4.9 Instructions for Lower-Tier Certification
1. By signing and submitting this proposal, the prospective lower-tier participant is providing the certification set out below.
2. The certification in this clause is a material representation of fact upon which reliance was placed when this transaction was entered into. If it is later determined that the prospective lower-tier participant knowingly rendered an erroneous certification, in addition to other remedies available to the Federal government, the department or agency with which this transaction originated may pursue available remedies, including suspension and/or debarment.
State of Rhode Island Highway Safety Performance Plan FFY 2010
Office on Highway Safety 107
3. The prospective lower-tier participant shall provide immediate written notice to the person to which this proposal is submitted if at any time the prospective lower-tier participant learns that its certification was erroneous when submitted or has become erroneous by reason of changed circumstances.
4. The terms covered transaction, debarred, suspended, ineligible, lower-tier covered transaction, participant, person, primary covered transaction, principal, proposal, and voluntarily excluded, as used in this clause, have the meanings set out in the Definition and Coverage sections of 49 CFR Part 29. You may contact the person to whom this proposal is submitted for assistance in obtaining a copy of those regulations.
5. The prospective lower-tier participant agrees by submitting this proposal that, should the proposed covered transaction be entered into, it shall not knowingly enter into any lower-tier covered transaction with a person who is proposed for debarment under 48 CFR Part 9, subpart 9.4, debarred, suspended, declared ineligible, or voluntarily excluded from participation in this covered transaction, unless authorized by the department or agency with which this transaction originated.
6. The prospective lower-tier participant further agrees by submitting this proposal that is it will include the clause titled “Certification Regarding Debarment, Suspension, Ineligibility and Voluntary Exclusion – Lower-Tier Covered Transaction,” without modification, in all lower-tier covered transactions and in all solicitations for lower-tier covered transactions. (See below)
7. A participant in a covered transaction may rely upon a certification of a prospective participant in a lower-tier covered transaction that it is not proposed for debarment under 48 CFR Part 9, subpart 9.4, debarred, suspended, ineligible, or voluntarily excluded from the covered transaction, unless it knows that the certification is erroneous. A participant may decide the method and frequency by which it determines the eligibility of its principals. Each participant may, but is not required to, check the List of Parties Excluded from Federal Procurement and Nonprocurement Programs.
8. Nothing contained in the foregoing shall be construed to require establishment of a system of records in order to render in good faith the certification required by this clause. The knowledge and information of a participant is not required to exceed that which is normally possessed by a prudent person in the ordinary course of business dealings.
9. Except for transactions authorized under paragraph 5 of these instructions, if a participant in a covered transaction knowingly enters into a lower-tier covered transaction with a person who is proposed for debarment under 48 CFR Part 9, subpart 9.4, suspended, debarred, ineligible, or voluntarily excluded from participation in this transaction, in addition to other remedies available to the Federal government, the department or agency with which this transaction originated may pursue available remedies, including suspension and/or debarment.
State of Rhode Island Highway Safety Performance Plan FFY 2010
Office on Highway Safety 109
5.0 Cost Summary
The OHS Highway Safety Performance Plan Cost Summary is provided in this section.
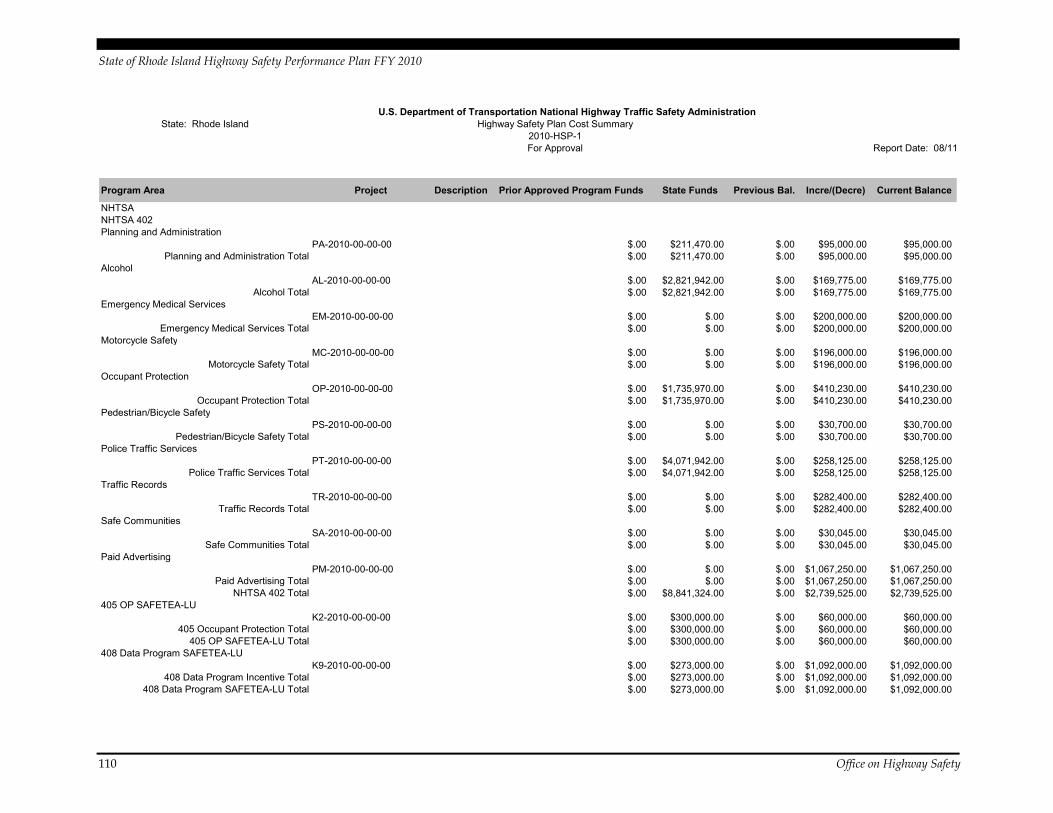
State of Rhode Island Highway Safety Performance Plan FFY 2010
110 Office on Highway Safety
State: Rhode Island
Report Date: 08/11
Program Area Project Description Prior Approved Program Funds State Funds Previous Bal. Incre/(Decre) Current Balance
NHTSANHTSA 402Planning and Administration
PA-2010-00-00-00 $.00 $211,470.00 $.00 $95,000.00 $95,000.00 Planning and Administration Total $.00 $211,470.00 $.00 $95,000.00 $95,000.00
AlcoholAL-2010-00-00-00 $.00 $2,821,942.00 $.00 $169,775.00 $169,775.00
Alcohol Total $.00 $2,821,942.00 $.00 $169,775.00 $169,775.00 Emergency Medical Services
EM-2010-00-00-00 $.00 $.00 $.00 $200,000.00 $200,000.00 Emergency Medical Services Total $.00 $.00 $.00 $200,000.00 $200,000.00
Motorcycle SafetyMC-2010-00-00-00 $.00 $.00 $.00 $196,000.00 $196,000.00
Motorcycle Safety Total $.00 $.00 $.00 $196,000.00 $196,000.00 Occupant Protection
OP-2010-00-00-00 $.00 $1,735,970.00 $.00 $410,230.00 $410,230.00 Occupant Protection Total $.00 $1,735,970.00 $.00 $410,230.00 $410,230.00
Pedestrian/Bicycle SafetyPS-2010-00-00-00 $.00 $.00 $.00 $30,700.00 $30,700.00
Pedestrian/Bicycle Safety Total $.00 $.00 $.00 $30,700.00 $30,700.00 Police Traffic Services
PT-2010-00-00-00 $.00 $4,071,942.00 $.00 $258,125.00 $258,125.00 Police Traffic Services Total $.00 $4,071,942.00 $.00 $258,125.00 $258,125.00
Traffic RecordsTR-2010-00-00-00 $.00 $.00 $.00 $282,400.00 $282,400.00
Traffic Records Total $.00 $.00 $.00 $282,400.00 $282,400.00 Safe Communities
SA-2010-00-00-00 $.00 $.00 $.00 $30,045.00 $30,045.00 Safe Communities Total $.00 $.00 $.00 $30,045.00 $30,045.00
Paid AdvertisingPM-2010-00-00-00 $.00 $.00 $.00 $1,067,250.00 $1,067,250.00
Paid Advertising Total $.00 $.00 $.00 $1,067,250.00 $1,067,250.00 NHTSA 402 Total $.00 $8,841,324.00 $.00 $2,739,525.00 $2,739,525.00
405 OP SAFETEA-LUK2-2010-00-00-00 $.00 $300,000.00 $.00 $60,000.00 $60,000.00
405 Occupant Protection Total $.00 $300,000.00 $.00 $60,000.00 $60,000.00 405 OP SAFETEA-LU Total $.00 $300,000.00 $.00 $60,000.00 $60,000.00
408 Data Program SAFETEA-LUK9-2010-00-00-00 $.00 $273,000.00 $.00 $1,092,000.00 $1,092,000.00
408 Data Program Incentive Total $.00 $273,000.00 $.00 $1,092,000.00 $1,092,000.00 408 Data Program SAFETEA-LU Total $.00 $273,000.00 $.00 $1,092,000.00 $1,092,000.00
U.S. Department of Transportation National Highway Traffic Safety AdministrationHighway Safety Plan Cost Summary
2010-HSP-1For Approval

State of Rhode Island Highway Safety Performance Plan FFY 2010
Office on Highway Safety 111
Program Area Project Description Prior Approved Program Funds State Funds Previous Bal. Incre/(Decre) Current Balance 410 Alcohol SAFETEA-LU
K8-2010-00-00-00 $.00 $1,250,000.00 $.00 $429,000.00 $429,000.00 410 Alcohol SAFETEA-LU Total $.00 $1,250,000.00 $.00 $429,000.00 $429,000.00
410 Alcohol SAFETEA-LU Paid MediaK8PM-2010-00-00-00 $.00 $.00 $.00 $141,000.00 $141,000.00
410 Alcohol SAFETEA-LU Paid Media Total $.00 $.00 $.00 $141,000.00 $141,000.00 410 Alcohol SAFETEA-LU Total $.00 $1,250,000.00 $.00 $570,000.00 $570,000.00
2010 Motorcycle SafetyK6-2010-00-00-00 $.00 $.00 $.00 $210,000.00 $210,000.00
2010 Motorcycle Safety Incentive Total $.00 $.00 $.00 $210,000.00 $210,000.00 2010 Motorcycle Safety Total $.00 $.00 $.00 $210,000.00 $210,000.00
1906 Prohibit Racial ProfilingK10-2010-00-00-00 $.00 $258,114.00 $.00 $1,032,456.00 $1,032,456.00
1906 Prohibit Racial Profiling Total $.00 $258,114.00 $.00 $1,032,456.00 $1,032,456.00 164 Transfer Funds
164PA-2010-00-00-00 $.00 $.00 $.00 $5,000.00 $5,000.00 164 Planning and Administration Total $.00 $.00 $.00 $5,000.00 $5,000.00
164 Alcohol164AL-2010-00-00-00 $.00 $.00 $.00 $936,000.00 $936,000.00
164 Alcohol Total $.00 $.00 $.00 $936,000.00 $936,000.00 164 Paid Media
164PM-2010-00-00-00 $.00 $.00 $.00 $50,000.00 $50,000.00 164 Paid Media Total $.00 $.00 $.00 $50,000.00 $50,000.00
164 Hazard Elimination164HE-2010-00-00-00 $.00 $.00 $.00 $2,000,000.00 $2,000,000.00
164 Hazard Elimination Total $.00 $.00 $.00 $2,000,000.00 $2,000,000.00 164 Transfer Funds Total $.00 $.00 $.00 $2,991,000.00 $2,991,000.00
NHTSA Total $.00 $10,922,438.00 $.00 $8,694,981.00 $8,694,981.00 Total $.00 $10,922,438.00 $.00 $8,694,981.00 $8,694,981.00