Embed Size (px)
Citation preview

STATE OF RHODE ISLAND
INVESTMENT COMMISSION MEETING
DATA AT
December 31, 2014
MEMBERS OF THE STATE INVESTMENT COMMISSION
Honorable Seth Magaziner, Chair
Mr. J. Michael Costello Mr. Thomas P. Fay
Mr. Robert Giudici Mr. Frank J. Karpinski
Ms. Faith LaSalle Ms. Paula M. McNamara
Mr. Thomas Mullaney Ms. Marcia Reback
Mr. Andrew K. Reilly

Information Security Identification: Confidential
Section I. Agenda
2

RHODE ISLAND STATE INVESTMENT COMMISSION
The meeting of the Rhode Island State Investment Commission
scheduled for Wednesday, January 28, 2014 was cancelled.
Information Security Identification: Confidential
Section II. Approval of Minutes
4

December 16, 2014
1
State Investment Commission Monthly Meeting Minutes
Tuesday, December 16, 2014 2:00 p.m.
Room 205, State House
The Monthly Meeting of the State Investment Commission (SIC) was called to order at 2:03 p.m., Tuesday, December 16, 2014 in Room 205, State House.
I. Roll Call of Members The following members were present: Mr. J. Michael Costello, Mr. Thomas Fay, Mr. Robert Giudici, Ms. Faith LaSalle, Mr. Thomas Mullaney, Ms. Marcia Reback, Mr. Andrew Reilly, Mr. Frank Karpinski and Governor-Elect Gina Raimondo. Also in attendance: Mr. Thomas Lynch of Cliffwater, alternative investment consultant; Mr. Chuck
Bauer and Mr. Doug Swanson of EnCap Energy Capital; Mr. Dexter Paine and Ms. Natasha Sunderam of
Paine & Partners, LP; Mr. John Burns and Ms. Judy Chambers of Pension Consulting Alliance (PCA), general consultant; Mr. Eric Conklin and Mr. Anthony Merhige of Harvest Fund Advisors, LLC; Mr. Andreas Moon and Mr. Adil Rahmathulla of ISQ Global Infrastructure Fund, LP; Ms. Sally Dowling of Adler Pollock & Sheehan P.C., legal counsel; Mr. Gregory Balewicz of State Street Global Advisors, index manager; Mr. Seth Magaziner, Rhode Island Treasurer-Elect; Mr. Jeffrey Padwa, General Counsel to Treasurer-Elect Magaziner; Mr. Robert Bromley, of the Senate Fiscal Office; Ms. Anne-Marie Fink, chief investment officer, and members of the Treasurer’s staff. Ms. Paula McNamara was absent.
II. Approval of Minutes
On a motion by Mr. Costello and seconded by Mr. Mullaney, it was unanimously VOTED: to approve the draft of the minutes of the November 19, 2014 meeting of the State Investment Commission.
III. Private Equity Recommendations—EnCap Energy Capital Fund X & Paine & Partners Food and Agribusiness Fund IV
Mr. Lynch introduced EnCap Energy Capital, a firm that focuses on upstream energy investments.
Mr. Bauer gave an overview of the firm. He said over the course of their 26-year history they have raised a
combination of 18 funds. He said ERSRI has invested in their prior Fund IX.
Mr. Doug Swanson reviewed the performance of their previous funds. EnCap has had very consistent returns
across their funds. The team focuses on capital preservation and have a very limited loss history.
He reviewed the fund being raised and their strategy. He noted that managing risk is critically important.
They maintain a very limited use of leverage in their portfolio companies. They have the ability to start
small and grow organically. He said with oil prices declining, they currently see tremendous opportunity to
invest.
The board asked questions.
Mr. Bauer and Mr. Swanson left the room.
Mr. Lynch added that Cliffwater recommends a $30 million investment.
The board discussed.
On a motion by Mr. Reilly and seconded by Mr. Mullaney, it was unanimously
5

December 16, 2014
2
VOTED: to approve a $30 million investment in EnCap Energy Capital Fund X.
Ms. Reback wanted the record to reflect that she voted yes with the representation they are good stewards
and follow environmental best practices.
Then Ms. Fink introduced the next fund by noting changes happening in the agricultural sector. Demand for
agricultural products is rising, leading to investments in research and technological breakthroughs in the
space.
She introduced Paine & Partners and said they have deep expertise in the agricultural sector. Their strategy is
to invest in profitable companies and to capitalize on the changes affecting the sector. They are one of, if not
the only, private equity fund specializing in the agricultural space or “farm to fork” as they call it.
Mr. Paine gave an overview of the firm. They are the leaders investing in the food and agricultural space. He
noted that it is a very high growth area.
He described their personnel structure. He went on to review some of their previous investment funds. Since
2010, they have been exclusively focused on the agricultural space and have provided more returns in this
area than any other firm. Fund IV will be the largest fund in the space and the only one to make investments
exclusively in food and agricultural business.
He reviewed some of the investments they have made in the agricultural sector. They have invested in excess
of $1 billion and have no realized losses.
He gave an outlook for the industry. He went on to review the terms of Fund IV.
The board asked questions.
Paine & Partners left the room.
Mr. Lynch explained that the recommendation for investment is up to $30 million. He noted that the fund is
oversubscribed so it’s not certain how much they will take.
On a motion by Mr. Costello and seconded by Mr. Reilly, it was
VOTED: to approve an investment of up to $30 million in Paine & Partners Fund IV.
Ms. Reback voted nay.
IV. Master Limited Partnership Manager—Harvest Fund Advisors LLC Ms. Chambers introduced the proposed MLP manager identified by responses to the RFP issued by the
Treasurer’s office. She said Harvest is a firm that focuses on mid-stream energy infrastructure.
Mr. Merhige gave an overview of the firm. They currently manage over $7 billion exclusively for institutions
in public-market infrastructure equities. He briefly reviewed some of their clients and gave an overview of
the team.
Mr. Conklin reviewed the portfolio and the opportunity in the market. He noted MLPs have a tremendous
growth rate due to the lack of energy infrastructure in the country. He noted there is relatively lower
correlation among MLPs and other asset classes, which increases returns and lowers overall risk when MLPs
are added to a broader portfolio.
He reviewed what they’re seeing in terms of production growth. He went on to talk about Harvest’s
investment process. They populate models with best-in-class data and seek the best risk-adjusted returns.
He gave some insight into the overall portfolio. They are able to achieve high growth rates because they
invest in companies that have the best growth profiles.
Mr. Merhige reviewed the terms of the fund.
The board asked questions.
Harvest left the room.
6

December 16, 2014
3
Ms. Fink noted that there is a 2% allocation to MLPs in the pension fund’s strategy allocation that has not
been fulfilled. She mentioned this may be is a good time to invest in MLPs because of the recent disruption
in the energy markets.
The board discussed.
Some members of the board expressed concern over investing the entire 2% allocation into one manager.
Mr. Burns noted that these are publically traded equities and there is limited manager risk.
Mr. Costello said he would be more comfortable if the allocation was not given to the manager all at once
but rather over the course of the year.
The board discussed the options for investing over a one-year period.
The board invited the firm back into the room to share their concerns and get their input.
Mr. Conklin said right now there is a good dislocation and tax considerations keep many from investing in
MLPs at the end of the calendar year. His preference would be to try to capture as much of the dislocation as
soon as possible. He believed it was a very good time and a rare year in that there are a lot of MLPs that are
down.
On a motion by Ms. Reback and seconded by Mr. Fay, it was unanimously
VOTED: to commit $160 million to Harvest Fund Advisors with up to $80 million upfront and the rest
at the manager’s discretion over the course of one year and with the fee locked in based on the total
commitment amount.
V. ISQ Global Infrastructure Fund, L.P. Ms. Chambers introduced ISQ, a private infrastructure firm focused on investing in global assets. She noted
that they have a great management process in place.
Mr. Rahmathulla gave an overview of the firm. They invest in energy, utilities and transportation assets in
North America, Europe and Asia.
He said two critical elements to their strategy are downside protection and value creation. They focus on
operations and policy considerations. They look for investments to add explicit or implicit linkage to
inflation.
He said to date they have made 8 investments and have deployed over $700 million in their current fund. He
gave an overview of the team.
He talked about their overall track record. Over the team’s history they have invested about $14 billion in 21
investments and their experience has been truly global. He reviewed their risk model.
He gave a summary of the fund’s current portfolio. Their target is to have 80% in US assets and 20%
invested across India and China. He gave some examples of their investments.
In terms of opportunistic investments in India and China, they only make investments in which the risk-
adjusted returns are higher than what they see in the US. They don’t venture into large investments in these
geographies.
Mr. Moon talked about the terms of the fund and the fee structure.
The board asked questions.
ISQ left the room.
The board discussed.
On a motion by Ms. Reback and seconded by Mr. Mullaney, it was unanimously
VOTED: to approve a $50 million investment in ISQ Global Infrastructure Fund L.P.
7

December 16, 2014
4
VI. Legal Counsel Report There was no legal counsel report.
VII. CIO Report Ms. Fink said that the redemption for Mason Capital has been submitted and ERSRI will be out as of
December 31, 2014. ERSRI also declined to roll over its investment in Perseus, a 2006 private equity fund.
The firm’s CEO passed away and investors were given an opportunity to either exit the fund or to invest in a
new recapitalized fund for an additional eight years.
Ms. Fink went on to review the performance for the month of November. The portfolio was up 1% and 0.6%
fiscal year-to-date. She reviewed the performance of each asset class. Hedge funds returned 1.3% in line
with the 60/40. Since inception, the hedge funds have returned 7.4% which is 0.2% better than the 60/40. She
said the overall portfolio has strong returns with less volatility than the benchmark and the 60/40 over the 3
and 5 year time frame.
Ms. Fink reviewed the performance of the portfolio for the last 3 years and 11 months or the term of the
current administration. The portfolio has averaged 8.4% annual gain which compared to 8.3% for the
bottom-up benchmark and 7.2% for the 60/40 basic allocation.
VIII. Treasurer Report Governor-Elect Raimondo thanked the board for the last four years. She commended the board for all their
work and contributions to the board.
There being no other business to come before the Board, on a motion by Ms. Reback and seconded by Mr. Mullaney the meeting adjourned at 4:27 p.m.
Respectfully submitted, Gina M. Raimondo Governor-Elect
8

Section III. Staff Summary
9

Information Security Identification: Confidential
Portfolio Highlights
10

Information Security Identification: Confidential 5
11

12
Information Security Identification: Confidential
Section IV. Asset Allocation
13

ERSRI Portfolio%%% - as of December 31, 2014
Actual Allocation Tactical Allocation Policy Allocation
Notes:
Tactical vs. Policy: Tactical allocations diverge from policy to
allow time to vet third-party managers allowing prudent
implementation of SIC policy decisions, and to diversify vintage-
year exposure for drawdown funds (e.g., private equity, real
estate, infrastructure).
Currently tactical allocations are (4) percentage points (pps)
below policy on real estate and (5) pps on infrastructure & MLP's,
due to timing required to deploy funds. An additional +9 pps in
equity offers interim exposure to economic growth and
protection from interest rate volatility, capturing similar
macroeconomic exposures to underallocated asset classes.
Actual vs. Tactical Tactical vs. Policy
Actual vs. Tactical: SIC policy allows for fluctuations of ±2% from
Tactical to accommodate market movements while minimizing
trading costs for rebalancing, and lags in rebalancing to less liquid
asset classes.
Cash 0.8
Equity - US 23.9
Equity - Developed
17.4
Equity - EM 5.5
Equity - Private 6.8
Equity - Alternative
8.2
Fixed Income 14.3
Real Estate 4.6
Infrastructure 1.0
Credit & GILB's 8.7
Absolute Return
6.7
Tactical Cash 2.1
(6.0)
(4.0)
(2.0)
-
2.0
4.0
6.0
(6.0)
(4.0)
(2.0)
-
2.0
4.0
6.0
Cash 0.0
Equity - US 19.0
Equity - Developed
14.4
Equity - EM 4.6
Equity - Private
7.0
Equity - Alternative
8.0
Fixed Income 15.0
Real Estate 8.0
Infrastructure 5.0
Credit & GILB's 9.0
Absolute Return
7.0
Tactical Cash 3.0
Cash 0.0
Equity - US 23.0
Equity - Developed
17.0
Equity - EM 5.4
Equity - Private 7.0
Equity - Alternative
7.8
Fixed Income 15.0
Real Estate 5.0
Infrastructure 1.0
Credit & GILB's 8.6
Absolute Return
7.0
Tactical Cash 3.0
14
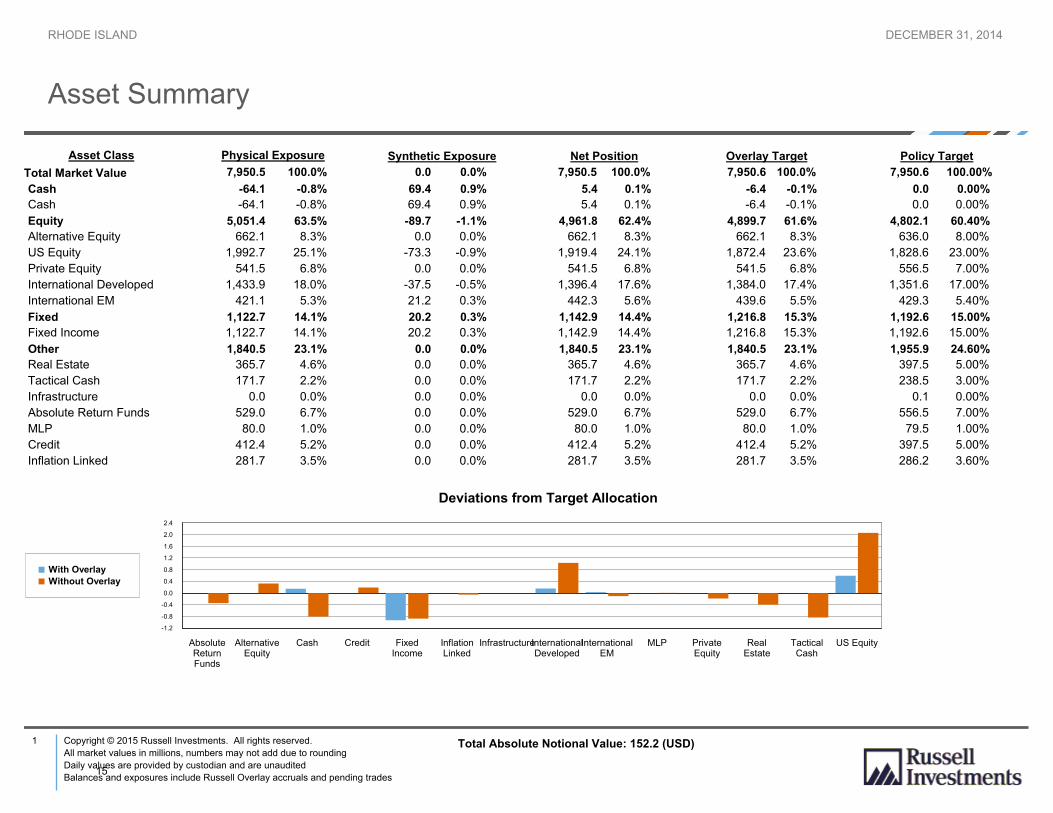
Asset Summary
RHODE ISLAND DECEMBER 31, 2014
Total Market Value 100.0% 7,950.6 100.0% 7,950.5 0.0% 0.0 100.0% 7,950.5 100.00% 7,950.6
Overlay TargetAsset Class Physical Exposure Synthetic Exposure Net Position Policy Target
Cash -64.1 -0.8% 69.4 0.9% 5.4 0.1% -6.4 -0.1% 0.0 0.00%
Cash -64.1 -0.8% 69.4 0.9% 5.4 0.1% -6.4 -0.1% 0.00% 0.0
Equity 5,051.4 63.5% -89.7 -1.1% 4,961.8 62.4% 4,899.7 61.6% 4,802.1 60.40%
Alternative Equity 662.1 8.3% 0.0 0.0% 662.1 8.3% 662.1 8.3% 8.00% 636.0
US Equity 1,992.7 25.1% -73.3 -0.9% 1,919.4 24.1% 1,872.4 23.6% 23.00% 1,828.6
Private Equity 541.5 6.8% 0.0 0.0% 541.5 6.8% 541.5 6.8% 7.00% 556.5
International Developed 1,433.9 18.0% -37.5 -0.5% 1,396.4 17.6% 1,384.0 17.4% 17.00% 1,351.6
International EM 421.1 5.3% 21.2 0.3% 442.3 5.6% 439.6 5.5% 5.40% 429.3
Fixed 1,122.7 14.1% 20.2 0.3% 1,142.9 14.4% 1,216.8 15.3% 1,192.6 15.00%
Fixed Income 1,122.7 14.1% 20.2 0.3% 1,142.9 14.4% 1,216.8 15.3% 15.00% 1,192.6
Other 1,840.5 23.1% 0.0 0.0% 1,840.5 23.1% 1,840.5 23.1% 1,955.9 24.60%
Real Estate 365.7 4.6% 0.0 0.0% 365.7 4.6% 365.7 4.6% 5.00% 397.5
Tactical Cash 171.7 2.2% 0.0 0.0% 171.7 2.2% 171.7 2.2% 3.00% 238.5
Infrastructure 0.0 0.0% 0.0 0.0% 0.0 0.0% 0.0 0.0% 0.00% 0.1
Absolute Return Funds 529.0 6.7% 0.0 0.0% 529.0 6.7% 529.0 6.7% 7.00% 556.5
MLP 80.0 1.0% 0.0 0.0% 80.0 1.0% 80.0 1.0% 1.00% 79.5
Credit 412.4 5.2% 0.0 0.0% 412.4 5.2% 412.4 5.2% 5.00% 397.5
Inflation Linked 281.7 3.5% 0.0 0.0% 281.7 3.5% 281.7 3.5% 3.60% 286.2
-1.2
-0.8
-0.4
0.0
0.4
0.8
1.2
1.6
2.0
2.4
AbsoluteReturnFunds
AlternativeEquity
Cash Credit FixedIncome
InflationLinked
InfrastructureInternationalDeveloped
InternationalEM
MLP PrivateEquity
RealEstate
TacticalCash
US Equity
With Overlay
Without Overlay
Deviations from Target Allocation
1 Copyright © 2015 Russell Investments. All rights reserved.
All market values in millions, numbers may not add due to rounding
Daily values are provided by custodian and are unaudited
Balances and exposures include Russell Overlay accruals and pending trades
Total Absolute Notional Value: 152.2 (USD)
15

ERSRI Asset AllocationPublic-Asset Portfolios%%% - as of December 31, 2014
Global Public Equity - by Industry Sector
Global Public Equity - by Geography
Core Fixed Income - by Type
Global Inflation-Linked Bonds - by Geography
Financials 22.6
Info. Tech. 13.4
Cons. Disc. 12.0 Industrials
11.3
Cons. Staples 9.2
Healthcare 11.3
Energy 7.5
Materials 5.6
Telecomm. Svcs. 3.7
Utilities 3.4
Other -
United States 50.4
United Kingdom 6.8
Japan 7.2
Canada 3.8
Switzerland 3.4
Australia 2.5
France 3.1
Germany 2.9
Other 20.1
Treasuries & Sovereign
33.1
Agencies 3.6 MBS
Passthrough 27.8
CMBS 3.4
ABS 1.1
Corporates 29.4
Cash & Cash Equivalents
-
United States 58.3
United Kingdom
14.9
EURO Currency 21.1
Japan 2.8
Canada 1.7
Australia 1.2
16

Strategy Exposure & Committed Capital – Private Equity
24%
3%
12% 61%
Diversification by Valuation - 12/31/2014
Venture Capital
Secondary
Private Debt
Buyout
15%
5%
12%
68%
Diversification by Commitment - 12/31/2014
Venture Capital
Secondary
Private Debt
Buyout
$0
$100
$200
$300
$400
$500
$600
$700
Mill
ion
s
Strategy Exposure - Private Equity
Venture Capital
Secondary
Private Debt
Buyout
$-
$200
$400
$600
$800
$1,000
$1,200
$1,400
Mill
ion
s
Committed Capital - Private Equity
Unfunded
Funded
17
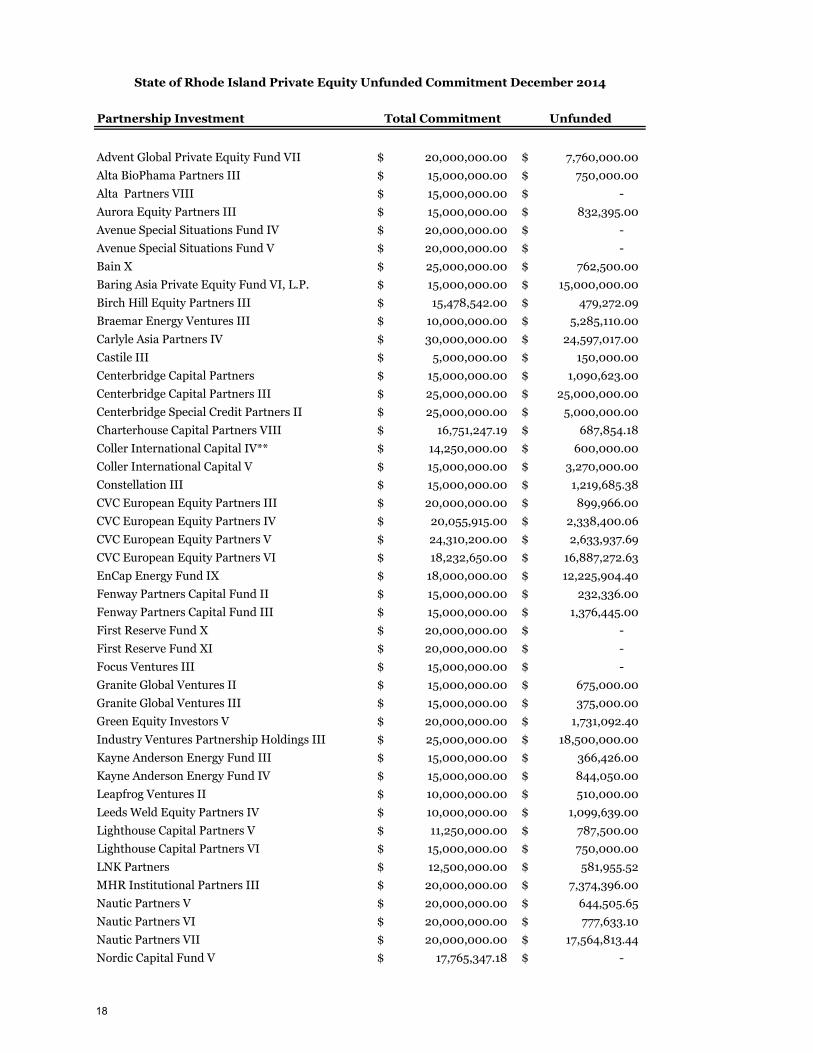
Partnership Investment Total Commitment Unfunded
Advent Global Private Equity Fund VII 20,000,000.00$ 7,760,000.00$
Alta BioPhama Partners III 15,000,000.00$ 750,000.00$
Alta Partners VIII 15,000,000.00$ -$
Aurora Equity Partners III 15,000,000.00$ 832,395.00$
Avenue Special Situations Fund IV 20,000,000.00$ -$
Avenue Special Situations Fund V 20,000,000.00$ -$
Bain X 25,000,000.00$ 762,500.00$
Baring Asia Private Equity Fund VI, L.P. 15,000,000.00$ 15,000,000.00$
Birch Hill Equity Partners III 15,478,542.00$ 479,272.09$
Braemar Energy Ventures III 10,000,000.00$ 5,285,110.00$
Carlyle Asia Partners IV 30,000,000.00$ 24,597,017.00$
Castile III 5,000,000.00$ 150,000.00$
Centerbridge Capital Partners 15,000,000.00$ 1,090,623.00$
Centerbridge Capital Partners III 25,000,000.00$ 25,000,000.00$
Centerbridge Special Credit Partners II 25,000,000.00$ 5,000,000.00$
Charterhouse Capital Partners VIII 16,751,247.19$ 687,854.18$
Coller International Capital IV** 14,250,000.00$ 600,000.00$
Coller International Capital V 15,000,000.00$ 3,270,000.00$
Constellation III 15,000,000.00$ 1,219,685.38$
CVC European Equity Partners III 20,000,000.00$ 899,966.00$
CVC European Equity Partners IV 20,055,915.00$ 2,338,400.06$
CVC European Equity Partners V 24,310,200.00$ 2,633,937.69$
CVC European Equity Partners VI 18,232,650.00$ 16,887,272.63$
EnCap Energy Fund IX 18,000,000.00$ 12,225,904.40$
Fenway Partners Capital Fund II 15,000,000.00$ 232,336.00$
Fenway Partners Capital Fund III 15,000,000.00$ 1,376,445.00$
First Reserve Fund X 20,000,000.00$ -$
First Reserve Fund XI 20,000,000.00$ -$
Focus Ventures III 15,000,000.00$ -$
Granite Global Ventures II 15,000,000.00$ 675,000.00$
Granite Global Ventures III 15,000,000.00$ 375,000.00$
Green Equity Investors V 20,000,000.00$ 1,731,092.40$
Industry Ventures Partnership Holdings III 25,000,000.00$ 18,500,000.00$
Kayne Anderson Energy Fund III 15,000,000.00$ 366,426.00$
Kayne Anderson Energy Fund IV 15,000,000.00$ 844,050.00$
Leapfrog Ventures II 10,000,000.00$ 510,000.00$
Leeds Weld Equity Partners IV 10,000,000.00$ 1,099,639.00$
Lighthouse Capital Partners V 11,250,000.00$ 787,500.00$
Lighthouse Capital Partners VI 15,000,000.00$ 750,000.00$
LNK Partners 12,500,000.00$ 581,955.52$
MHR Institutional Partners III 20,000,000.00$ 7,374,396.00$
Nautic Partners V 20,000,000.00$ 644,505.65$
Nautic Partners VI 20,000,000.00$ 777,633.10$
Nautic Partners VII 20,000,000.00$ 17,564,813.44$
Nordic Capital Fund V 17,765,347.18$ -$
State of Rhode Island Private Equity Unfunded Commitment December 2014
18
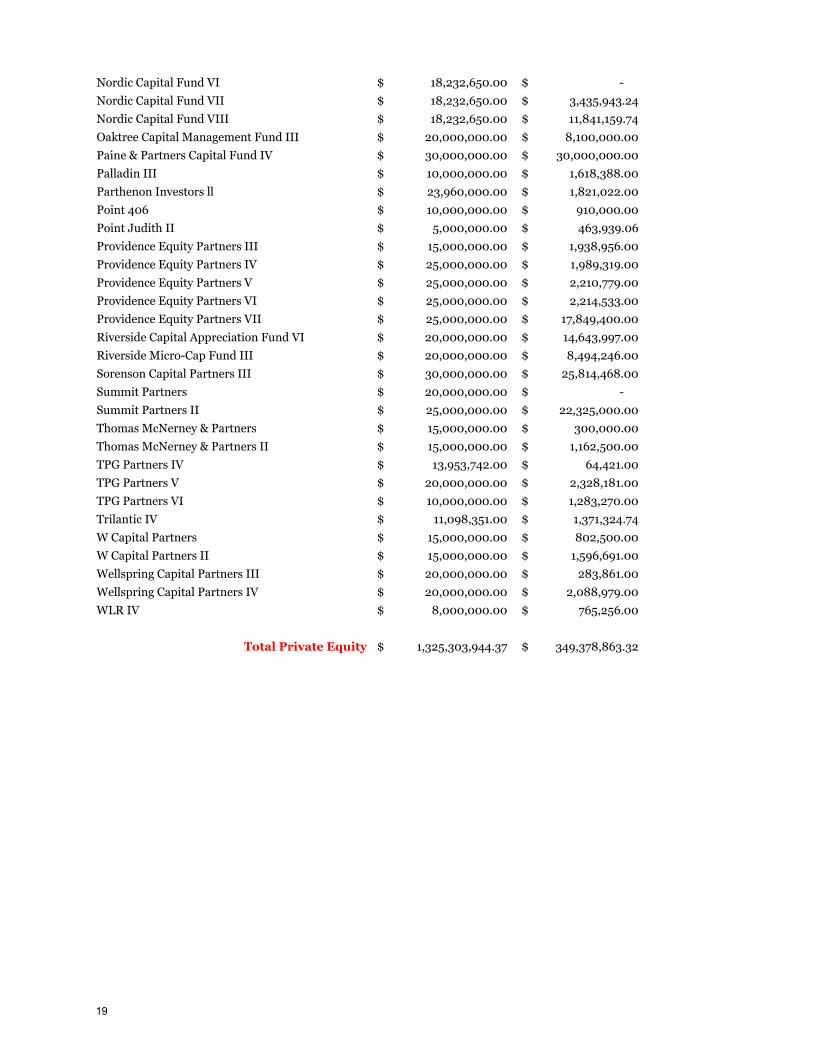
Nordic Capital Fund VI 18,232,650.00$ -$
Nordic Capital Fund VII 18,232,650.00$ 3,435,943.24$
Nordic Capital Fund VIII 18,232,650.00$ 11,841,159.74$
Oaktree Capital Management Fund III 20,000,000.00$ 8,100,000.00$
Paine & Partners Capital Fund IV 30,000,000.00$ 30,000,000.00$
Palladin III 10,000,000.00$ 1,618,388.00$
Parthenon Investors ll 23,960,000.00$ 1,821,022.00$
Point 406 10,000,000.00$ 910,000.00$
Point Judith II 5,000,000.00$ 463,939.06$
Providence Equity Partners III 15,000,000.00$ 1,938,956.00$
Providence Equity Partners IV 25,000,000.00$ 1,989,319.00$
Providence Equity Partners V 25,000,000.00$ 2,210,779.00$
Providence Equity Partners VI 25,000,000.00$ 2,214,533.00$
Providence Equity Partners VII 25,000,000.00$ 17,849,400.00$
Riverside Capital Appreciation Fund VI 20,000,000.00$ 14,643,997.00$
Riverside Micro-Cap Fund III 20,000,000.00$ 8,494,246.00$
Sorenson Capital Partners III 30,000,000.00$ 25,814,468.00$
Summit Partners 20,000,000.00$ -$
Summit Partners II 25,000,000.00$ 22,325,000.00$
Thomas McNerney & Partners 15,000,000.00$ 300,000.00$
Thomas McNerney & Partners II 15,000,000.00$ 1,162,500.00$
TPG Partners IV 13,953,742.00$ 64,421.00$
TPG Partners V 20,000,000.00$ 2,328,181.00$
TPG Partners VI 10,000,000.00$ 1,283,270.00$
Trilantic IV 11,098,351.00$ 1,371,324.74$
W Capital Partners 15,000,000.00$ 802,500.00$
W Capital Partners II 15,000,000.00$ 1,596,691.00$
Wellspring Capital Partners III 20,000,000.00$ 283,861.00$
Wellspring Capital Partners IV 20,000,000.00$ 2,088,979.00$
WLR IV 8,000,000.00$ 765,256.00$
Total Private Equity 1,325,303,944.37$ 349,378,863.32$
19

Strategy Exposure & Committed Capital – Real Estate
20%
24%
14%
17%
17%
4%
4%
Diversification by Valuation - 12/31/2014
Core: AEW
Core: JPMorgan StrategicProperty
Core: Morgan StanleyPrime Property
Core: Prudential RealEstate Investors
Core: Heitman
Non-Core: Opportunistic
Non-Core: Value-add
0%
38%
62%
Diversification by Unfunded Commitment - 12/31/2014
Core
Opportunistic
Value-Add
$-
$50
$100
$150
$200
$250
$300
$350
$400
Mill
ion
s
Strategy Exposure - Real Estate
Non-Core
Core
$-
$50
$100
$150
$200
$250
$300
$350
$400
$450
$500
Mill
ion
s
Committed Capital - Real Estate
Unfunded
Funded
20

Real Estate Partnership Investment Total Commitment Unfunded
AEW 60,000,000.00$ -$
Exeter Industrial Value Fund III 30,000,000.00$ 24,000,000.00$
Fillmore East Fund I 10,000,000.00$ -$
GEM Realty V 50,000,000.00$ 40,178,750.00$
Heitman 60,000,000.00$ -$
IC Berkeley Partners III 18,000,000.00$ 12,570,248.97$
JPMorgan Strategic Property Fund 75,000,000.00$ -$
JPMorgan Alternative Property Fund 20,000,000.00$ -$
Magna Hotel 4,000,000.00$ 630,943.49$
Morgan Stanley Prime Property Fund 35,000,000.00$ -$
Prudential Real Estate Investors (PRISA) 50,000,000.00$ -$
Tri Continential Fund VII 15,000,000.00$ 428,467.00$
Waterton Venture Fund XII 32,000,000.00$ 29,464,648.00$
Total Real Estate 459,000,000.00$ 107,273,057.46$
State of Rhode Island Real Estate Unfunded Commitment December 2014
21

Information Security Identification: Confidential
Section V. Risk Overview
22

ERSRI Portfolio% - as of December 31, 2014 Bubble-Size Scaled based on Current Allocations
Month-End Values
Total Plan Benchmark
Total Plan
US Public Equity
Non-US Public Equity
Equity Hedge Fund
Private Equity
US Fixed Income
Real Estate
Total Real Return
60/40 Blend
Total Plan Benchmark
Total Plan
US Public Equity
Non-US Public Equity
Private Equity
Equity Hedge Fund
US Fixed Income
Real Estate
Total Real Return
60/40 Blend
-
5.0
10.0
15.0
20.0
25.0
- 2.0 4.0 6.0 8.0 10.0 12.0 14.0 16.0
Re
turn
Volatility
3-Year Risk-Return
Total Plan Benchmark
Total Plan
US Public Equity
Non-US Public Equity
Private Equity
US Fixed Income
Real Estate
Total Real Return 60/40 Blend
-
2.0
4.0
6.0
8.0
10.0
12.0
14.0
16.0
18.0
- 2.0 4.0 6.0 8.0 10.0 12.0 14.0 16.0 18.0 20.0
Re
turn
Volatility
5-Year Risk-Return
23

Information Security Identification: Confidential
5 Years Ending December 31, 2014 Comparison
TOTAL PLAN Total Plan Benchmark
Ann Return Ann Ex Ret vs Mkt Ann Tracking Error Ann Std Dev Beta R-Squared Ann Alpha Ann Sharpe Ratio
8.78 8.78 0.01 0.00 1.12 0.00 7.62 8.24 0.92 1.00 0.99 1.00 0.66 0.00 1.13 1.05
24

Information Security Identification: Confidential
Risk Exposures 3 Years Ending December 31, 2014
Annualized Return
Ann Std Dev Beta (ACWI)
US Public Equity Non-US Public Equity Equity Hedge Funds Private Equity Traditional Fixed Income Real Estate Real Return Hedge Funds Inflation-Linked Bonds Cash Russell Overlay Fd TOTAL PLAN
20.23 9.27 0.81 9.11 12.77 1.18 9.08 3.89 0.25
11.40 4.42 0.11 3.91 2.79 0.07 8.70 3.45 0.12 5.66 2.47 0.08 1.80 4.50 0.08 0.35 0.31 -0.01 0.11 0.13 0.01
10.27 5.54 0.52
Beta (BC AGG)
-0.02 0.74
-0.16 -0.31 1.01 0.36 0.08 1.44 0.00
-0.01 0.37
Beta (GSCI)
0.25 0.44 0.10 0.09 0.01 0.00 0.00 0.01
-0.01 0.00 0.18
Beta (CPI)
0.11 -0.61
--- -0.10 0.01
-0.84 ---
-0.52 0.01 0.01
-0.22
25
Information Security Identification: Confidential
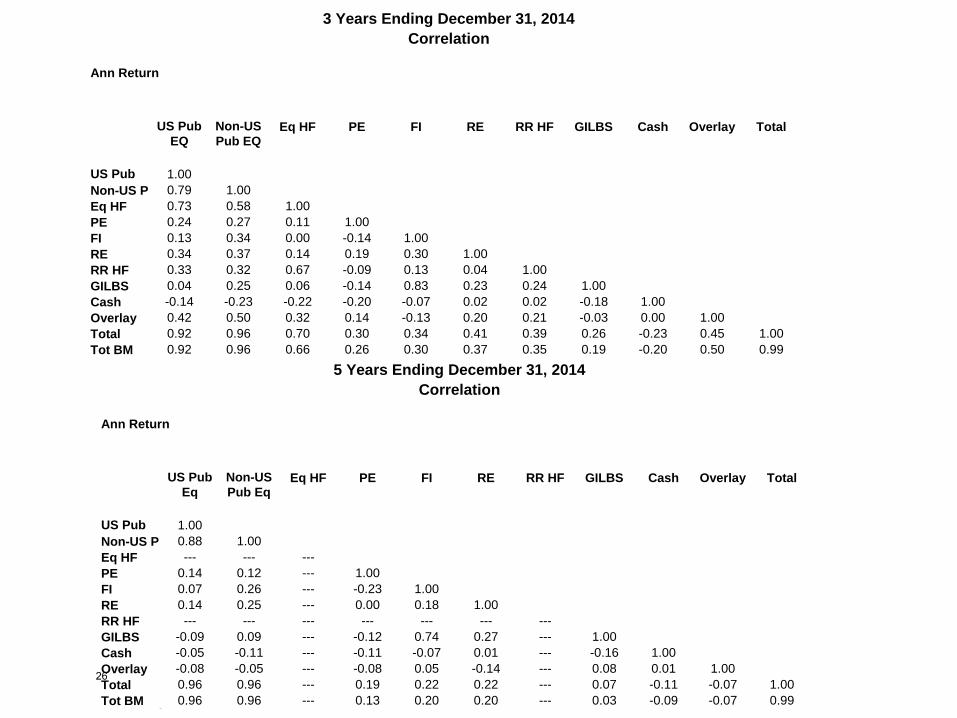
3 Years Ending December 31, 2014 Correlation
Ann Return
US Pub EQ
Non-US Pub EQ
Eq HF PE FI RE RR HF GILBS Cash Overlay Total
US Pub
1.00 Non-US P 0.79 1.00 Eq HF 0.73 0.58 1.00 PE 0.24 0.27 0.11 1.00 FI 0.13 0.34 0.00 -0.14 1.00 RE 0.34 0.37 0.14 0.19 0.30 1.00 RR HF 0.33 0.32 0.67 -0.09 0.13 0.04 1.00 GILBS 0.04 0.25 0.06 -0.14 0.83 0.23 0.24 1.00 Cash -0.14 -0.23 -0.22 -0.20 -0.07 0.02 0.02 -0.18 1.00 Overlay 0.42 0.50 0.32 0.14 -0.13 0.20 0.21 -0.03 0.00 1.00 Total 0.92 0.96 0.70 0.30 0.34 0.41 0.39 0.26 -0.23 0.45 1.00 Tot BM 0.92 0.96 0.66 0.26 0.30 0.37 0.35 0.19 -0.20 0.50 0.99
5 Years Ending December 31, 2014 Correlation
Ann Return
US Pub Eq
Non-US Pub Eq
Eq HF PE FI RE RR HF GILBS Cash Overlay Total
US Pub
1.00 Non-US P 0.88 1.00 Eq HF PE 0.14 0.12 1.00 FI 0.07 0.26 -0.23 1.00 RE 0.14 0.25 0.00 0.18 1.00 RR HF GILBS -0.09 0.09 -0.12 0.74 0.27 1.00 Cash -0.05 -0.11 -0.11 -0.07 0.01 -0.16 1.00 Overlay -0.08 -0.05 -0.08 0.05 -0.14 0.08 0.01 1.00 Total 0.96 0.96 0.19 0.22 0.22 0.07 -0.11 -0.07 1.00 Tot BM 0.96 0.96 0.13 0.20 0.20 0.03 -0.09 -0.07 0.99
--- --- --- --- --- ---
--- --- --- --- --- --- --- --- --- --- --- --- --- --- --- --- ---
26
Information Security Identification: Confidential
Section VI. Performance Overview
27

Account Name Benchmark Name
MarketValue % of Total Month Fiscal YTD 1 Year 3 Years 5 Years 10 Years ITD
Annualized
InceptionDate
SSGA R3000 INDEX 1,990,085,722 25 -0.02 5.29 12.59 19.99 10/1/2012Russell 3000 Index 0.00 5.25 12.56 19.99 10/1/2012
US Public Equity 1,990,085,797 25 -0.02 5.29 12.57 20.23 15.12 7.31 8/1/2007Russell 3000 Index 0.00 5.25 12.56 20.51 15.63 7.33 8/1/2007
SSGA MSCI EAFE 1,289,095,678 16 -3.46 -9.22 -4.64 11.46 9/1/2012MSCI EAFE Net Dividend Index -3.46 -9.24 -4.90 11.20 9/1/2012
SSGA MSCI CANADA 144,835,830 2 -1.91 -8.74 2.17 5.64 9/1/2012MSCI Canada Net Dividend Index -1.97 -9.04 1.51 4.93 9/1/2012
SSGA MSCI EM 421,112,730 5 -4.44 -7.86 -2.34 2.67 9/1/2012MSCI Emerging Markets NetDividend Index
-4.61 -7.84 -2.19 2.80 9/1/2012
Non-US Public Equity 1,855,044,324 23 -3.56 -8.88 -3.63 9.11 4.57 10.41 5/1/2009Total International Equity BM -3.61 -8.93 -3.87 8.90 4.10 9.35 5/1/2009
Global Public Equity 3,845,130,121 48 -1.74 -1.86 4.35 15.06 10.76 6.57 4.05 7/1/2000MSCI All Country World Net Index -1.93 -1.90 4.16 14.10 9.17 6.09 7/1/2000
Private Equity 541,556,914 7 -0.31 0.15 7.70 11.41 12.11 10.66 4.48 1/1/1993Venture Economics Custom BM -0.31 -0.76 6.52 16.77 14.68 8.91 1/1/1993S&P + 300 BP 0.02 7.44 16.69 23.57 18.65 10.78 1/1/1993
Equity Hedge Funds 658,378,202 8 -0.57 -0.05 2.64 9.08 8.31 11/1/2011HFRI Equity Hedge (Total) Index -0.16 -1.17 2.05 7.79 6.37 11/1/2011
Total Equity 5,045,065,236 63 -1.44 -1.43 4.48 13.87 10.60 6.75 3.24 6/1/1996
MACKAY SHIELDS 565,416,324 7 0.08 1.82 6.00 1.93 11/1/2012Barclays U.S. Aggregate BondIndex
0.09 1.96 5.97 1.75 11/1/2012
PYRAMIS GLOBAL ADV 557,023,606 7 -0.05 1.69 5.83 1.81 11/1/2012Barclays U.S. Aggregate BondIndex
0.09 1.96 5.97 1.75 11/1/2012
Traditional Fixed Income 1,122,658,099 14 0.01 1.75 5.91 3.91 4.65 4.85 5.75 7/1/2000Barclays U.S. Aggregate BondIndex
0.09 1.96 5.97 2.66 4.45 4.71 5.62 7/1/2000
Total Performance Summary
TOTAL NET OF FEES12/31/2014
Report ID: IPM0005
Reporting Currency: USD
Page 1 of 2 Source: The Bank of New York Mellon Corporation1/22/2015 11:25:05 AM EST28

Account Name Benchmark Name
MarketValue % of Total Month Fiscal YTD 1 Year 3 Years 5 Years 10 Years ITD
Annualized
InceptionDate
Real Return Hedge Funds 533,163,183 7 0.58 2.40 4.70 5.66 5.45 11/1/2011HFRI Fund of Funds CompositeIndex
0.32 1.21 3.35 5.67 4.86 11/1/2011
PIMCO 207,096,669 3 -1.13 -0.64 1.22 2.01 5/1/201330% BoA1-3BB-BHY/70%CSInstLLI
-0.79 -0.28 2.11 3.16 5/1/2013
WAMCO 207,008,701 3 -1.85 -2.28 0.10 2.13 4/1/201330% BoA 1-3 BB-B HY/70% CS LLI -0.91 -0.58 2.03 3.38 4/1/2013
Credit Aggregate 414,105,369 5 -1.49 -1.47 0.66 1.92 5/1/2013
30% BoA1-3BB-BHY/70%CSInstLLI
-0.79 -0.28 2.11 3.67 3/1/2013
BROWN BROTHERS HARR 281,767,304 4 -0.96 -1.15 1.72 -0.78 11/1/2012BBH Inflation-Linked Custom BM -1.09 -1.27 2.04 -0.89 11/1/2012
Inflation-Linked Bonds 281,767,304 4 -0.96 -1.15 1.72 1.80 4.94 4.89 11/1/2009Total Inflation Linked Custom -1.09 -1.27 2.04 1.67 4.88 4.82 11/1/2009
Publicly Traded Infrastructure 81,274,995 1 1.59 1.59 12/1/2014
Total Real Return 1,310,310,852 16 -0.37 0.36 2.74 4.21 6.38 5.65 5.99 6/1/2004
Real Estate 365,924,050 5 0.32 5.44 10.90 8.70 9.31 1.31 1.31 1/1/2005NCREIF Property Lagged + 100bp 2.69 6.06 12.26 12.09 11.99 9.56 9.56 1/1/2005
ERSRI CASH 89,184,379 1 0.55 0.67 0.75 0.33 0.27 3.16 14.67 7/1/2000BofA Merrill Lynch 3 Month USTreasury Bill G0O1
0.00 0.01 0.03 0.07 0.09 1.54 1.88 7/1/2000
Total Cash 91,241,077 1 0.54 0.66 0.74 0.35 0.28 2.33 2.65 4/1/2004
Russell Overlay Fd 18,503,709 0 0.02 0.03 -0.02 0.11 -0.05 -0.09 9/1/2008
TOTAL PLAN 7,956,344,668 100 -0.96 -0.40 4.49 10.27 8.78 6.01 4.79 7/1/2000Total Plan Benchmark -0.89 -0.50 4.40 10.14 8.78 5.93 7/1/200060/40 Blend -1.12 -0.36 4.96 9.54 7.56 5.89 7/1/2000
Total Plan ex PE & RE 7,048,863,704 89 -1.07 -0.70 3.98 9.77 8.16 5.76 6.51 4/1/1996Total Plan BM ex PE RE -1.15 -0.85 3.92 10.09 8.52 5.70 4/1/1996
Total Performance Summary
TOTAL NET OF FEES12/31/2014
Report ID: IPM0005
Reporting Currency: USD
Page 2 of 2 Source: The Bank of New York Mellon Corporation1/22/2015 11:25:05 AM EST29

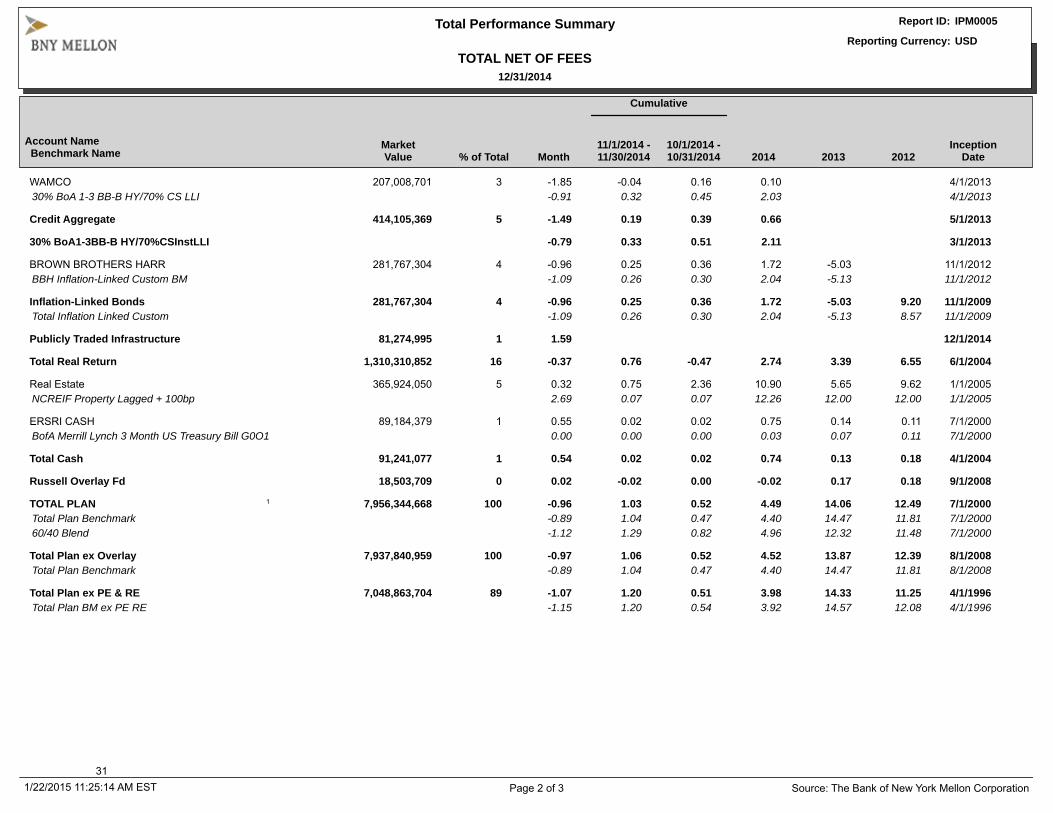
Account Name Benchmark Name
MarketValue % of Total Month
11/1/2014 -11/30/2014
10/1/2014 -10/31/2014
Cumulative
2014 2013 2012Inception
Date
SSGA R3000 INDEX 1,990,085,722 25 -0.02 2.44 2.77 12.59 33.49 10/1/2012Russell 3000 Index 0.00 2.42 2.75 12.56 33.55 10/1/2012
US Public Equity 1,990,085,797 25 -0.02 2.44 2.77 12.57 33.48 15.66 8/1/2007Russell 3000 Index 0.00 2.42 2.75 12.56 33.55 16.42 8/1/2007
SSGA MSCI EAFE 1,289,095,678 16 -3.46 1.34 -1.46 -4.64 23.08 9/1/2012MSCI EAFE Net Dividend Index -3.46 1.36 -1.45 -4.90 22.78 9/1/2012
SSGA MSCI CANADA 144,835,830 2 -1.91 0.05 -2.79 2.17 6.35 9/1/2012MSCI Canada Net Dividend Index -1.97 0.01 -2.87 1.51 5.63 9/1/2012
SSGA MSCI EM 421,112,730 5 -4.44 -1.12 1.16 -2.34 -2.81 9/1/2012MSCI Emerging Markets Net Dividend Index -4.61 -1.06 1.18 -2.19 -2.60 9/1/2012
Non-US Public Equity 1,855,044,324 23 -3.56 0.67 -0.97 -3.63 15.18 17.02 5/1/2009Total International Equity BM -3.61 0.72 -0.99 -3.87 15.29 16.52 5/1/2009
Global Public Equity 3,845,130,121 48 -1.74 1.58 0.93 4.35 23.90 17.82 7/1/2000MSCI All Country World Net Index -1.93 1.67 0.70 4.16 22.80 16.13 7/1/2000
Private Equity 541,556,914 7 -0.31 -0.98 -0.44 7.70 14.86 11.77 1/1/1993Venture Economics Custom BM -0.31 0.00 0.00 6.52 25.14 19.44 1/1/1993S&P + 300 BP 0.02 2.89 2.60 16.69 35.39 19.44 1/1/1993
Equity Hedge Funds 658,378,202 8 -0.57 1.15 -0.76 2.64 17.11 7.98 11/1/2011HFRI Equity Hedge (Total) Index -0.16 0.39 -0.05 2.05 14.28 7.41 11/1/2011
Total Equity 5,045,065,236 63 -1.44 1.25 0.56 4.48 21.95 15.88 6/1/1996
MACKAY SHIELDS 565,416,324 7 0.08 0.67 0.91 6.00 -1.79 11/1/2012Barclays U.S. Aggregate Bond Index 0.09 0.71 0.98 5.97 -2.02 11/1/2012
PYRAMIS GLOBAL ADV 557,023,606 7 -0.05 0.66 0.99 5.83 -1.93 11/1/2012Barclays U.S. Aggregate Bond Index 0.09 0.71 0.98 5.97 -2.02 11/1/2012
Traditional Fixed Income 1,122,658,099 14 0.01 0.66 0.95 5.91 -1.86 7.95 7/1/2000Barclays U.S. Aggregate Bond Index 0.09 0.71 0.98 5.97 -2.02 4.21 7/1/2000
Real Return Hedge Funds 533,163,183 7 0.58 1.50 -1.59 4.70 6.96 5.33 11/1/2011HFRI Fund of Funds Composite Index 0.32 1.25 -0.63 3.35 8.96 4.79 11/1/2011
PIMCO 207,096,669 3 -1.13 0.43 0.63 1.22 5/1/201330% BoA1-3BB-B HY/70%CSInstLLI -0.79 0.33 0.51 2.11 5/1/2013
Total Performance Summary
TOTAL NET OF FEES12/31/2014
Report ID: IPM0005
Reporting Currency: USD
Page 1 of 3 Source: The Bank of New York Mellon Corporation1/22/2015 11:25:14 AM EST30
Account Name Benchmark Name
MarketValue % of Total Month
11/1/2014 -11/30/2014
10/1/2014 -10/31/2014
Cumulative
2014 2013 2012Inception
Date
WAMCO 207,008,701 3 -1.85 -0.04 0.16 0.10 4/1/201330% BoA 1-3 BB-B HY/70% CS LLI -0.91 0.32 0.45 2.03 4/1/2013
Credit Aggregate 414,105,369 5 -1.49 0.19 0.39 0.66 5/1/2013
30% BoA1-3BB-B HY/70%CSInstLLI -0.79 0.33 0.51 2.11 3/1/2013
BROWN BROTHERS HARR 281,767,304 4 -0.96 0.25 0.36 1.72 -5.03 11/1/2012BBH Inflation-Linked Custom BM -1.09 0.26 0.30 2.04 -5.13 11/1/2012
Inflation-Linked Bonds 281,767,304 4 -0.96 0.25 0.36 1.72 -5.03 9.20 11/1/2009Total Inflation Linked Custom -1.09 0.26 0.30 2.04 -5.13 8.57 11/1/2009
Publicly Traded Infrastructure 81,274,995 1 1.59 12/1/2014
Total Real Return 1,310,310,852 16 -0.37 0.76 -0.47 2.74 3.39 6.55 6/1/2004
Real Estate 365,924,050 5 0.32 0.75 2.36 10.90 5.65 9.62 1/1/2005NCREIF Property Lagged + 100bp 2.69 0.07 0.07 12.26 12.00 12.00 1/1/2005
ERSRI CASH 89,184,379 1 0.55 0.02 0.02 0.75 0.14 0.11 7/1/2000BofA Merrill Lynch 3 Month US Treasury Bill G0O1 0.00 0.00 0.00 0.03 0.07 0.11 7/1/2000
Total Cash 91,241,077 1 0.54 0.02 0.02 0.74 0.13 0.18 4/1/2004
Russell Overlay Fd 18,503,709 0 0.02 -0.02 0.00 -0.02 0.17 0.18 9/1/2008
1TOTAL PLAN 7,956,344,668 100 -0.96 1.03 0.52 4.49 14.06 12.49 7/1/2000Total Plan Benchmark -0.89 1.04 0.47 4.40 14.47 11.81 7/1/200060/40 Blend -1.12 1.29 0.82 4.96 12.32 11.48 7/1/2000
Total Plan ex Overlay 7,937,840,959 100 -0.97 1.06 0.52 4.52 13.87 12.39 8/1/2008Total Plan Benchmark -0.89 1.04 0.47 4.40 14.47 11.81 8/1/2008
Total Plan ex PE & RE 7,048,863,704 89 -1.07 1.20 0.51 3.98 14.33 11.25 4/1/1996Total Plan BM ex PE RE -1.15 1.20 0.54 3.92 14.57 12.08 4/1/1996
Total Performance Summary
TOTAL NET OF FEES12/31/2014
Report ID: IPM0005
Reporting Currency: USD
Page 2 of 3 Source: The Bank of New York Mellon Corporation1/22/2015 11:25:14 AM EST31

1 RI6G23000000 TOTAL PLAN Month - Current Month
Cumulative Months - Prior Month and Second Prior Month
Monthly Reporting for Private Equity and Real Estate skew performance on an actual and benchmark basis due tonature of valuations
2013, 2012, 2011 - Calendar Years
RI6G23000000 TOTAL PLAN The current composition of the Total Plan Benchmark is as follows:
15.0% Barclays U.S. Aggregate Bond Index
47.0% MSCI All Country World Net Index
7.0% HFRI Fund of Funds Composite Index
4.0% BofA Merrill Lynch 3 Month US Treasury Bill
7.5% HFRI Equity Hedge (Total) Index
3.5% NCREIF Property Index 1Q in Arrears + 100 bps
4.0% Barclays World Govt Inflation-Linked 1-10 Yr Index Hedged US
5.0% Credit Aggregate Custom: 30% BoA1-3BB-B HY/70%CSInstLLI
7.0% Venture Economics Custom BM
Total Performance Summary
END NOTES12/31/2014
Report ID: IPM0005
Reporting Currency: USD
Page 3 of 3 Source: The Bank of New York Mellon Corporation1/22/2015 11:25:14 AM EST32

Employees' Retirement System of the State of Rhode IslandHedge Fund Portfolio
Portfolio Performance Summary
Estimated as of December 31, 2014
Sharpe Incep
Fund Market Value Actual % Dec QTD YTD FYTD 1 Year 3 Year 5 Year Incep Std Dev Ratio Date
Global Equities
Ascend Partners Fund II LP 71,686,873 6.0% 0.63% 0.67% 5.00% 1.88% 5.00% 6.32% - 5.78% 2.66% 2.01 Nov-11
Davidson Kempner Institutional Partners, L.P. 74,292,184 6.2% 0.10% -1.40% 4.44% -1.37% 4.44% 7.27% - 6.98% 2.21% 2.92 Nov-11
Elliott Associates, L.P. 82,231,075 6.9% 0.10% 0.50% 8.54% 3.53% 8.54% 11.83% - 10.47% 3.45% 2.82 Nov-11
ESG Cross Border Equity Fund LP 46,220,525 3.9% -4.80% -3.73% - -7.62% - - - -7.50% 6.54% - Jun-14
Indus Asia Pacific Fund, LP 743,267 0.1% -4.07% -9.81% -15.92% -12.83% -15.92% -2.08% - -2.08% 7.05% -0.31 Jan-12
Luxor Capital Partners, LP 44,471,079 3.7% -4.59% -8.14% - -9.49% - - - -11.06% 8.12% - May-14
Mason Capital Ltd. 60,029,224 5.0% -2.87% -9.66% -14.22% -13.27% -14.22% 0.02% - 0.02% 7.95% 0.00 Jan-12
PFM Diversified Fund, L.P. 38,506,138 3.2% 0.35% 3.10% 2.86% 3.02% 2.86% - - 9.21% 9.39% 0.96 Mar-12
PFM Diversified Offshore Fund A.I., Ltd. 38,213,382 3.2% 0.36% 3.14% 2.73% 2.99% 2.73% - - 8.92% 9.33% 0.93 Mar-12
Samlyn Onshore Fund, L.P. 107,870,659 9.1% 2.52% 6.65% 9.60% 6.24% 9.60% 12.73% - 12.73% 5.69% 2.09 Jan-12
Viking Global Equities, LP 94,488,426 7.9% 0.30% 2.38% 13.69% 6.77% 13.69% 16.40% - 15.87% 5.67% 2.59 Dec-11
Total Global Equities 658,752,833 55.3% -0.37% -0.18% 2.60% -0.02% 2.60% 9.04% - 8.24% 4.00% 1.93 Nov-11
MSCI AC World Index Free - Net -1.93% 0.41% 4.16% -1.90% 4.16% 14.10% - 12.16% 10.63% 1.11 Nov-11
Russell 3000 Index (DRI) 0.00% 5.24% 12.56% 5.25% 12.56% 20.51% - 19.54% 9.23% 1.96 Nov-11
HFRI Equity Hedge (Total) Index 0.04% 0.39% 2.26% -0.96% 2.26% 7.87% - 6.44% 5.88% 1.04 Nov-11
Real Return
BlueCrest Capital LP 20,861,264 1.8% -1.14% -0.79% 0.14% -0.57% 0.14% 1.42% - 1.42% 2.33% 0.48 Jan-12
Brevan Howard LP 79,922,304 6.7% -0.16% -1.24% -0.82% 3.73% -0.82% 1.76% - 2.03% 5.17% 0.35 Nov-11
Brigade Leveraged Capital Structures Fund LP 55,864,831 4.7% -1.24% -2.39% 0.62% -4.35% 0.62% - - 3.99% 3.27% 1.13 Mar-12
Capula Global Relative Value Fund Ltd. 58,294,823 4.9% 1.09% 2.72% 8.12% 4.49% 8.12% 5.33% - 5.10% 1.99% 2.36 Dec-11
Claren Road Credit Fund, Ltd. 45,747,040 3.8% 0.08% -10.49% -9.57% -11.79% -9.57% - - -4.95% 8.40% -0.59 Apr-13
DE Shaw Composite Fund LLC 77,906,862 6.5% 2.70% 2.57% 16.31% 6.08% 16.31% 15.81% - 15.03% 4.28% 3.24 Nov-11
Graham Global Investment Fund I SPC Ltd. - Discretionary Segregated Portfolio 55,516,516 4.7% 0.40% 0.00% 3.18% 6.93% 3.18% 3.55% - 3.55% 4.10% 0.80 Jan-12
OZ Domestic Partners II, L.P. 102,531,939 8.6% 0.33% 2.94% 5.86% 3.65% 5.86% 11.19% - 10.38% 3.70% 2.61 Nov-11
Winton Futures Fund Limited 36,520,034 3.1% 1.09% 11.70% 13.87% 12.46% 13.87% 6.31% - 6.59% 8.28% 0.77 Dec-11
Total Real Return 533,165,614 44.7% 0.49% 0.44% 4.31% 2.37% 4.31% 5.66% - 5.43% 2.56% 1.96 Nov-11
ML 3-month T-Bills 0.00% 0.00% 0.04% 0.01% 0.04% 0.07% - 0.07% 0.02% - Nov-11
HFRI Fund of Funds Composite Index 0.15% 0.79% 3.19% 1.05% 3.19% 5.62% - 4.80% 3.25% 1.36 Nov-11
Total Hedge Fund Portfolio 1,191,918,448 100.0% 0.01% 0.10% 3.37% 1.04% 3.37% 7.45% - 6.96% 3.08% 2.10 Nov-11
HFRI Fund of Funds Composite Index 0.15% 0.79% 3.19% 1.05% 3.19% 5.62% - 4.80% 3.25% 1.36 Nov-11
Market Indices
Libor3Month 0.02% 0.06% 0.23% 0.12% 0.23% 0.31% - 0.32% 0.03% - Nov-11
Barclays Aggregate Bond Index 0.09% 1.78% 5.94% 1.94% 5.94% 2.66% - 2.84% 2.64% 0.95 Nov-11
Barclays High Yield Credit Bond Index -1.45% -1.01% 2.46% -2.84% 2.46% 8.44% - 8.13% 4.86% 1.57 Nov-11
S&P 500 TR -0.25% 4.93% 13.69% 6.12% 13.69% 20.41% - 19.54% 8.92% 2.02 Nov-11
MSCI EAFE - Net -3.46% -3.57% -4.90% -9.24% -4.90% 11.06% - 8.40% 13.29% 0.65 Nov-11
MSCI EMF (Emerging Markets Free) - Net -4.61% -4.50% -2.19% -7.84% -2.19% 4.05% - 1.20% 15.34% 0.13 Nov-11
Returns
Page 1 of 233

Employees' Retirement System of the State of Rhode IslandHedge Fund Portfolio
Portfolio Performance Summary
Estimated as of December 31, 2014
Sharpe Incep
Fund Market Value Actual % Dec QTD YTD FYTD 1 Year 3 Year 5 Year Incep Std Dev Ratio Date
Returns
Copyright MSCI 2014. Unpublished. All Rights Reserved. This information may only be used for your internal use, may not be reproduced or redisseminated, and may not be used to create any financial instruments or products or any indices. This information is provided on an “as is” basis and the user of this information assumes the
entire risk of any use. Neither MSCI, any or its affiliates, Cliffwater or any other person involved in or related to compiling, computing or creating this information makes any express or implied warranties or representations with respect to such information. Without limiting any of the foregoing, in no event shall MSCI, any of its affiliates,
Cliffwater or any other person involved in or related to compiling, computing or creating this information have any liability for any direct, indirect, special, incidental, punitive, consequential or any other damages .
Most recent month returns are based on manager estimates; prior months use final market values.
Hedge Fund Research, Inc. (“HFR”) is the source and owner of the HFR data contained or reflected in this report. The HFR indices included in this report are revised by HFR for up to three months following their initial release. The revisions are reflected in the trailing period returns.
This report reflects information only through the date hereof. Our due diligence and reporting rely upon the accuracy and completeness of financial information (which may or may not be audited by the fund manager) and other information publicly available or provided to us by the fund manager, its professional staff, and references we
have contacted and other third parties. We have not conducted an independent verification of the information provided other than as described in this report. Our conclusions do not reflect an audit of the investment nor should they be construed as providing legal advice. Past performance does not guarantee future performance. The
information contained herein is confidential commercial or financial information, the disclosure of which would cause substantial competitive harm to you, Cliffwater LLC, or the person or entity from whom the information was obtained, and may not be disclosed except as required by applicable law.
Page 2 of 234

Employees' Retirement System of the State of Rhode IslandHedge Fund PortfolioFund Level Performance ReportEstimated as of December 31, 2014
5 Yr StartFund QTD YTD Dec Nov Oct 1 Year 3 Year 5 Year 2013 2012 2011 2010 2009 Std Dev 3 yr 5 yr Incep. DateGlobal EquitiesAscend Partners Fund II LP 0.67% 4.98% 0.63% 0.22% ‐0.18% 4.98% 6.49% 3.81% 12.22% 2.50% ‐3.02% 2.94% 13.61% 3.80% 2.23 0.92 1.12 Jan‐04Davidson Kempner Institutional Partners, LP ‐1.38% 4.19% 0.10% 0.25% ‐1.72% 4.19% 6.73% 6.09% 9.20% 6.87% 1.27% 9.17% 17.79% 3.10% 2.84 1.83 1.55 Mar‐96Elliott Associates, L.P. (HFR98) 0.50% 8.24% 0.10% 0.90% ‐0.50% 8.24% 11.26% 8.99% 12.44% 13.18% 3.94% 7.39% 30.85% 3.04% 3.44 2.75 1.95 Jan‐90ESG Cross Border Equity ‐3.75% ‐7.16% ‐4.80% 0.50% 0.60% ‐7.16% 4.02% 6.43% 13.59% 6.74% 9.45% 10.86% 7.79% 5.86% 0.63 1.04 0.91 Jan‐04Luxor Capital Partners, LP ‐8.27% ‐9.96% ‐4.59% ‐0.84% ‐3.04% ‐9.96% 1.94% 4.13% 14.77% 2.52% 6.07% 8.98% 31.26% 6.17% 0.28 0.64 1.09 Apr‐02Mason Capital, Ltd. ‐9.74% ‐14.10% ‐2.87% 0.03% ‐7.10% ‐14.10% ‐0.18% 2.58% 22.83% ‐5.73% 4.20% 9.62% 25.16% 7.15% ‐0.02 0.35 0.63 Feb‐02PFM Diversified Fund, LP 3.03% 2.85% 0.35% 3.09% ‐0.41% 2.85% 9.88% 6.00% 22.17% 5.59% ‐3.35% 4.36% 21.35% 8.12% 1.06 0.72 0.95 Nov‐04Samlyn Capital ‐ Composite 6.52% 9.20% 1.84% 2.91% 1.64% 9.20% 12.79% 6.80% 18.93% 10.49% ‐5.05% 1.98% 23.57% 7.61% 2.03 0.86 1.24 Mar‐07Viking Global Equities 2.32% 13.65% 0.30% 0.80% 1.20% 13.65% 16.21% 11.87% 22.47% 12.75% 7.71% 3.67% 19.20% 6.36% 2.55 1.75 1.55 Oct‐99
Real ReturnBlueCrest Capital International Limited ‐0.78% 0.22% ‐1.14% 0.05% 0.31% 0.22% 1.45% 4.56% ‐1.56% 5.83% 6.11% 12.80% 45.41% 2.83% 0.50 1.48 1.60 Dec‐00Brevan Howard L.P. (Series B) ‐1.27% ‐0.88% ‐0.16% 0.91% ‐2.00% ‐0.88% 1.51% 3.28% 1.85% 3.60% 11.33% 0.92% 17.10% 5.26% 0.25 0.58 1.06 Sep‐05Brigade Leveraged Capital Structures Fund ‐2.38% 0.62% ‐1.24% 0.31% ‐1.46% 0.62% 4.52% 4.74% 6.13% 6.91% 2.55% 7.66% 39.64% 3.19% 1.28 1.37 0.77 Jan‐07Capula Global Relative Value Fund Limited 2.63% 8.06% 1.09% 1.28% 0.24% 8.06% 5.30% 6.32% 7.60% 0.41% 6.19% 9.58% 12.24% 2.19% 2.49 2.67 1.74 Oct‐05Claren Road Credit Master Fund ‐10.59% ‐9.93% 0.08% ‐1.03% ‐9.73% ‐9.93% ‐1.22% 1.51% 5.43% 1.49% 6.88% 4.64% 24.75% 6.05% ‐0.18 0.23 0.95 Jan‐06DE Shaw Composite International Fund 2.52% 15.57% 2.70% 1.90% ‐2.04% 15.57% 13.66% 9.11% 11.51% 13.94% 3.69% 1.56% 21.31% 4.56% 3.13 1.87 1.51 Mar‐01Graham Discretionary ‐ 6V Portfolio 0.04% 3.25% 0.40% 1.49% ‐1.82% 3.25% 3.56% 4.26% 3.61% 3.82% 3.56% 7.12% 17.09% 3.59% 0.80 1.09 0.85 Jun‐04OZ Master Fund, Ltd 2.46% 4.96% 0.33% 2.62% ‐0.48% 4.96% 10.32% 7.88% 14.20% 12.01% 0.17% 8.62% 26.15% 3.74% 2.71 1.97 1.22 Jan‐04Winton Futures Fund ‐ USD Class B 11.70% 13.89% 1.09% 5.86% 4.38% 13.89% 6.32% 7.90% 9.43% ‐3.56% 6.29% 14.47% ‐4.64% 8.36% 0.74 0.91 0.73 Oct‐97
BenchmarksHFRI Fund of Funds Composite Index 1.03% 3.46% 0.39% 1.28% ‐0.63% 3.46% 5.71% 3.32% 8.96% 4.79% ‐5.72% 5.70% 11.47% 4.02% 1.67 0.75 0.65 Jan‐90HFRI Fund Weighted Composite Index 0.71% 3.58% 0.31% 0.79% ‐0.38% 3.58% 6.33% 4.66% 9.13% 6.36% ‐5.25% 10.25% 19.98% 5.19% 1.52 0.84 1.02 Jan‐90
Market Indices3 Month Libor ‐ BOM 0.06% 0.23% 0.02% 0.02% 0.02% 0.23% 0.31% 0.32% 0.26% 0.42% 0.35% 0.35% 0.65% 0.03% Mar‐86Barclays Aggregate Bond Index 1.78% 5.94% 0.09% 0.70% 0.98% 5.94% 2.66% 4.46% ‐2.02% 4.23% 7.86% 6.56% 5.93% 2.69% Jan‐76Barclays High Yield Credit Bond Index ‐1.01% 2.46% ‐1.45% ‐0.73% 1.19% 2.46% 8.44% 9.03% 7.46% 15.81% 4.98% 15.11% 58.21% 6.30% Jul‐83S&P 500 (TR) 4.93% 13.69% ‐0.25% 2.69% 2.44% 13.69% 20.41% 15.45% 32.39% 16.00% 2.11% 15.06% 26.46% 13.00% Jan‐70MSCI EAFE ‐ Net ‐ USD ‐3.57% ‐4.90% ‐3.46% 1.36% ‐1.45% ‐4.90% 11.06% 5.33% 22.78% 17.32% ‐12.14% 7.75% 31.78% 16.73% Dec‐69MSCI EM (EMERGING MARKETS) ‐ Net ‐ USD ‐4.50% ‐2.19% ‐4.61% ‐1.06% 1.18% ‐2.19% 4.04% 1.78% ‐2.60% 18.22% ‐18.42% 18.88% 78.51% 18.55% Jan‐99
Trailing Returns Calendar Year Returns Sharpe Ratio
Note: The above is manager composite history.
35
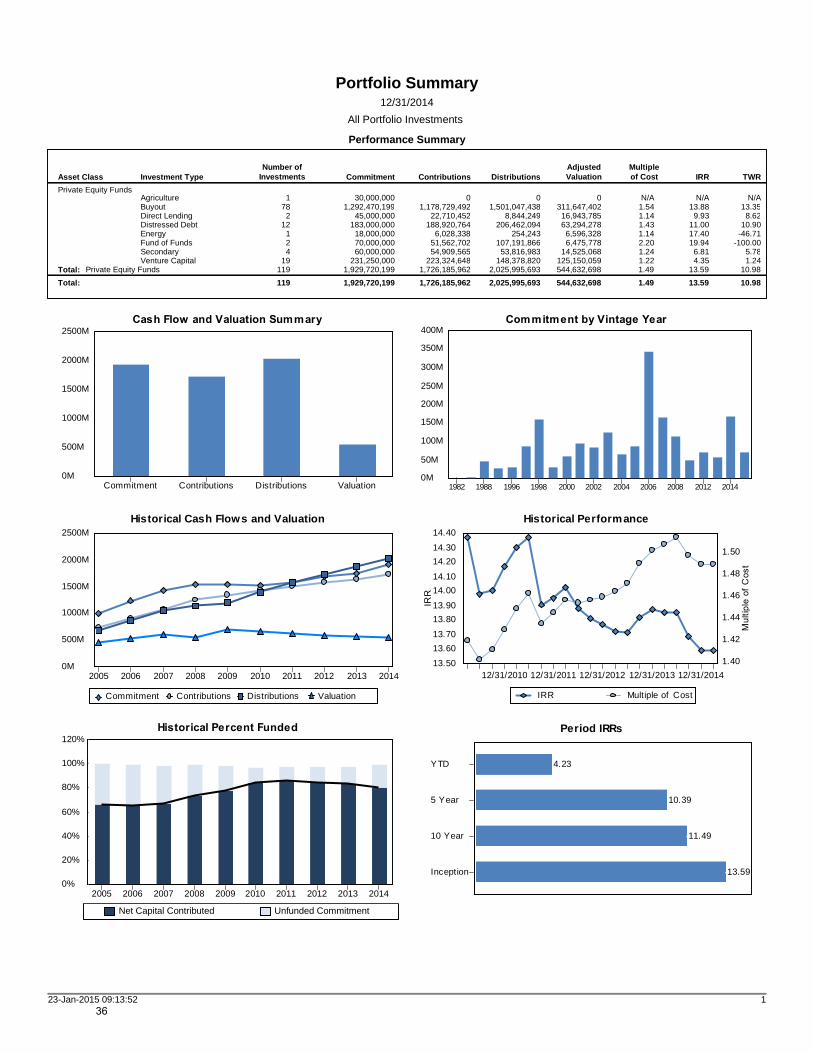
Portfolio Summary12/31/2014
All Portfolio Investments
Commitment Contributions Distributions Valuation
2500M
2000M
1500M
1000M
500M
0M 1982 1988 1996 1998 2000 2002 2004 2006 2008 2012 2014
400M
350M
300M
250M
200M
150M
100M
50M
0M
Historical Cash Flows and Valuation
Commitment Contributions Distributions Valuation
2005 2006 2007 2008 2009 2010 2011 2012 2013 2014
2500M
2000M
1500M
1000M
500M
0M
Historical Performance
IRR Multiple of Cost
12/31/2010 12/31/2011 12/31/2012 12/31/2013 12/31/2014
14.40
14.30 14.20
14.10 14.00
13.90 13.80
13.70 13.60 13.50
1.50
1.48
1.46
1.44
1.42
1.40
Period IRRs
Inception
10 Year
5 Year
YTD
13.59
11.49
10.39
4.23
2005 2006 2007 2008 2009 2010 2011 2012 2013 2014
120%
100%
80%
60%
40%
20%
0%
Net Capital Contributed Unfunded Commitment
Asset Class Investment Type CommitmentAdjustedValuationContributions TWRIRR
Multipleof CostDistributions
Number ofInvestments
Private Equity FundsAgriculture 30,000,000 0 00 N/A N/A N/A1Buyout 1,292,470,199 1,178,729,492 311,647,4021,501,047,438 1.54 13.88 13.3578Direct Lending 45,000,000 22,710,452 16,943,7858,844,249 1.14 9.93 8.622Distressed Debt 183,000,000 188,920,764 63,294,278206,462,094 1.43 11.00 10.9012Energy 18,000,000 6,028,338 6,596,328254,243 1.14 17.40 -46.711Fund of Funds 70,000,000 51,562,702 6,475,778107,191,866 2.20 19.94 -100.002Secondary 60,000,000 54,909,565 14,525,06853,816,983 1.24 6.81 5.784Venture Capital 231,250,000 223,324,648 125,150,059148,378,820 1.22 4.35 1.2419
Private Equity Funds 1,929,720,199Total: 1,726,185,962 2,025,995,693 544,632,698 1.49 13.59 10.98119Total: 1,929,720,199 1,726,185,962 2,025,995,693 544,632,698 1.49 13.59 10.98119
Performance Summary
123-Jan-2015 09:13:5236

Information Security Identification: Confidential
Section VII. Cash Flow
37
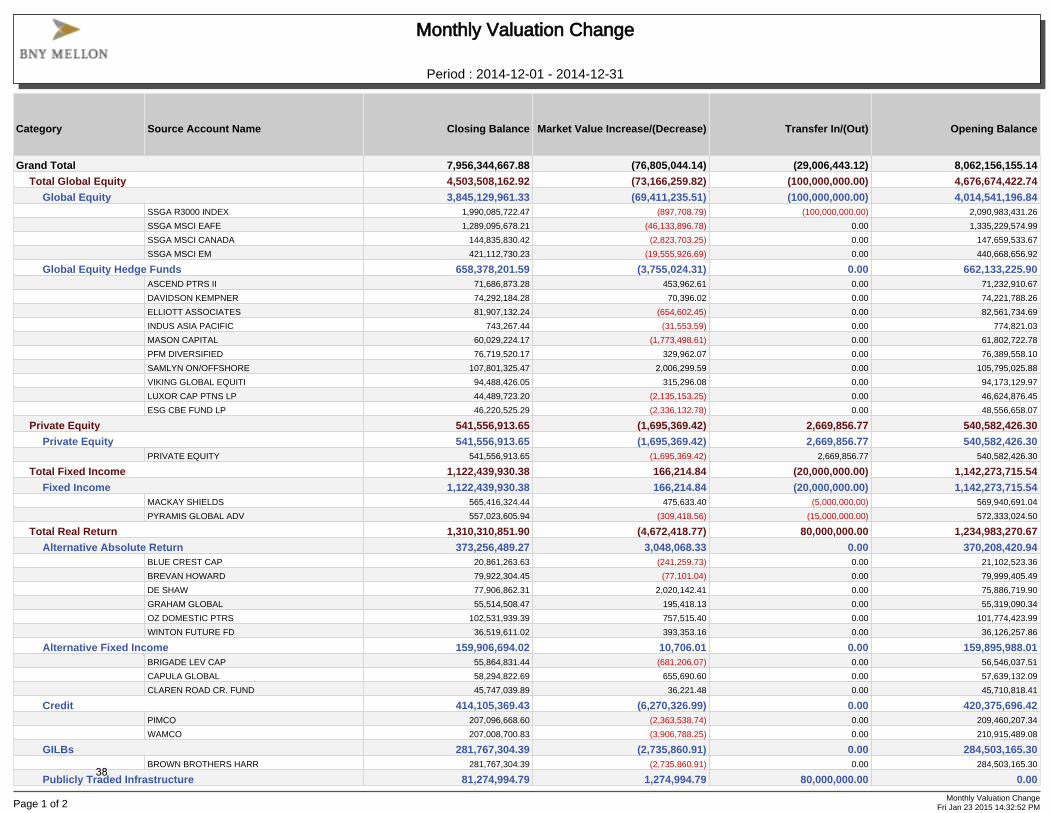
Category Source Account Name Closing Balance Market Value Increase/(Decrease) Transfer In/(Out) Opening Balance
Grand Total 7,956,344,667.88 (76,805,044.14) (29,006,443.12) 8,062,156,155.14
Total Global Equity 4,503,508,162.92 (73,166,259.82) (100,000,000.00) 4,676,674,422.74
Global Equity 3,845,129,961.33 (69,411,235.51) (100,000,000.00) 4,014,541,196.84SSGA R3000 INDEX 1,990,085,722.47 (897,708.79) (100,000,000.00) 2,090,983,431.26
SSGA MSCI EAFE 1,289,095,678.21 (46,133,896.78) 0.00 1,335,229,574.99
SSGA MSCI CANADA 144,835,830.42 (2,823,703.25) 0.00 147,659,533.67
SSGA MSCI EM 421,112,730.23 (19,555,926.69) 0.00 440,668,656.92
Global Equity Hedge Funds 658,378,201.59 (3,755,024.31) 0.00 662,133,225.90ASCEND PTRS II 71,686,873.28 453,962.61 0.00 71,232,910.67
DAVIDSON KEMPNER 74,292,184.28 70,396.02 0.00 74,221,788.26
ELLIOTT ASSOCIATES 81,907,132.24 (654,602.45) 0.00 82,561,734.69
INDUS ASIA PACIFIC 743,267.44 (31,553.59) 0.00 774,821.03
MASON CAPITAL 60,029,224.17 (1,773,498.61) 0.00 61,802,722.78
PFM DIVERSIFIED 76,719,520.17 329,962.07 0.00 76,389,558.10
SAMLYN ON/OFFSHORE 107,801,325.47 2,006,299.59 0.00 105,795,025.88
VIKING GLOBAL EQUITI 94,488,426.05 315,296.08 0.00 94,173,129.97
LUXOR CAP PTNS LP 44,489,723.20 (2,135,153.25) 0.00 46,624,876.45
ESG CBE FUND LP 46,220,525.29 (2,336,132.78) 0.00 48,556,658.07
Private Equity 541,556,913.65 (1,695,369.42) 2,669,856.77 540,582,426.30
Private Equity 541,556,913.65 (1,695,369.42) 2,669,856.77 540,582,426.30PRIVATE EQUITY 541,556,913.65 (1,695,369.42) 2,669,856.77 540,582,426.30
Total Fixed Income 1,122,439,930.38 166,214.84 (20,000,000.00) 1,142,273,715.54
Fixed Income 1,122,439,930.38 166,214.84 (20,000,000.00) 1,142,273,715.54MACKAY SHIELDS 565,416,324.44 475,633.40 (5,000,000.00) 569,940,691.04
PYRAMIS GLOBAL ADV 557,023,605.94 (309,418.56) (15,000,000.00) 572,333,024.50
Total Real Return 1,310,310,851.90 (4,672,418.77) 80,000,000.00 1,234,983,270.67
Alternative Absolute Return 373,256,489.27 3,048,068.33 0.00 370,208,420.94BLUE CREST CAP 20,861,263.63 (241,259.73) 0.00 21,102,523.36
BREVAN HOWARD 79,922,304.45 (77,101.04) 0.00 79,999,405.49
DE SHAW 77,906,862.31 2,020,142.41 0.00 75,886,719.90
GRAHAM GLOBAL 55,514,508.47 195,418.13 0.00 55,319,090.34
OZ DOMESTIC PTRS 102,531,939.39 757,515.40 0.00 101,774,423.99
WINTON FUTURE FD 36,519,611.02 393,353.16 0.00 36,126,257.86
Alternative Fixed Income 159,906,694.02 10,706.01 0.00 159,895,988.01BRIGADE LEV CAP 55,864,831.44 (681,206.07) 0.00 56,546,037.51
CAPULA GLOBAL 58,294,822.69 655,690.60 0.00 57,639,132.09
CLAREN ROAD CR. FUND 45,747,039.89 36,221.48 0.00 45,710,818.41
Credit 414,105,369.43 (6,270,326.99) 0.00 420,375,696.42PIMCO 207,096,668.60 (2,363,538.74) 0.00 209,460,207.34
WAMCO 207,008,700.83 (3,906,788.25) 0.00 210,915,489.08
GILBs 281,767,304.39 (2,735,860.91) 0.00 284,503,165.30BROWN BROTHERS HARR 281,767,304.39 (2,735,860.91) 0.00 284,503,165.30
Publicly Traded Infrastructure 81,274,994.79 1,274,994.79 80,000,000.00 0.00
Monthly Valuation Change
Period : 2014-12-01 - 2014-12-31
Page 1 of 2Monthly Valuation Change
Fri Jan 23 2015 14:32:52 PM
38
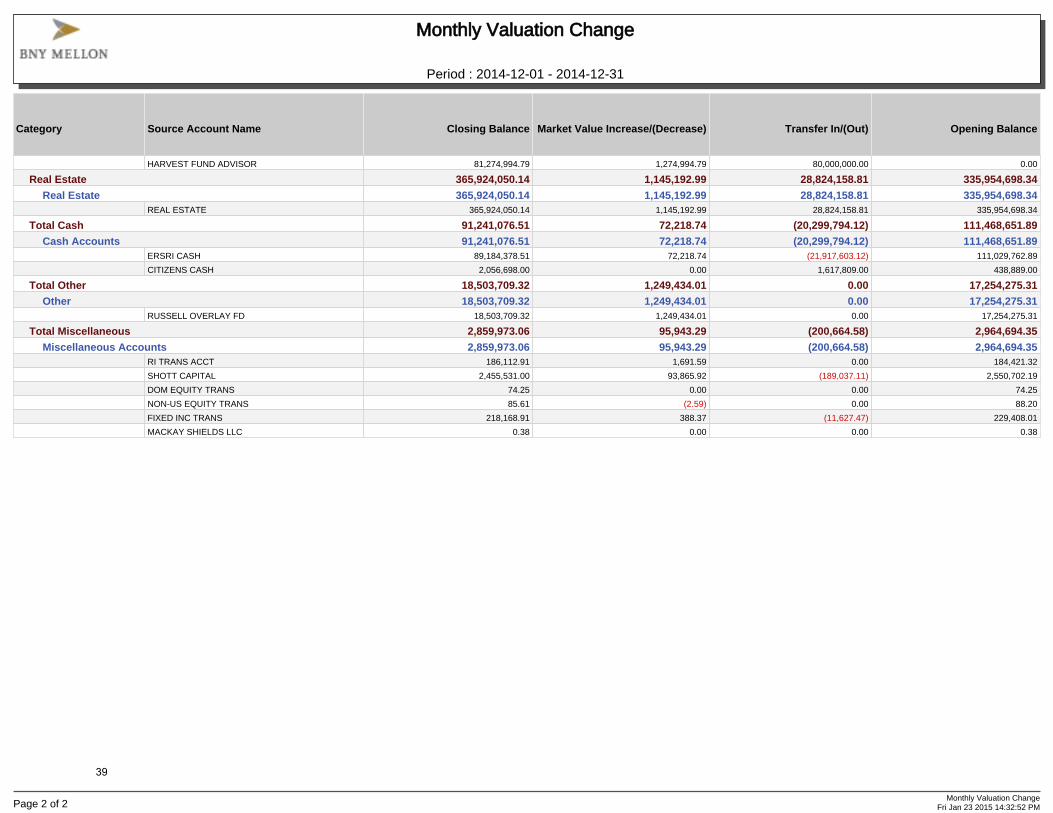
Category Source Account Name Closing Balance Market Value Increase/(Decrease) Transfer In/(Out) Opening Balance
HARVEST FUND ADVISOR 81,274,994.79 1,274,994.79 80,000,000.00 0.00
Real Estate 365,924,050.14 1,145,192.99 28,824,158.81 335,954,698.34
Real Estate 365,924,050.14 1,145,192.99 28,824,158.81 335,954,698.34REAL ESTATE 365,924,050.14 1,145,192.99 28,824,158.81 335,954,698.34
Total Cash 91,241,076.51 72,218.74 (20,299,794.12) 111,468,651.89
Cash Accounts 91,241,076.51 72,218.74 (20,299,794.12) 111,468,651.89ERSRI CASH 89,184,378.51 72,218.74 (21,917,603.12) 111,029,762.89
CITIZENS CASH 2,056,698.00 0.00 1,617,809.00 438,889.00
Total Other 18,503,709.32 1,249,434.01 0.00 17,254,275.31
Other 18,503,709.32 1,249,434.01 0.00 17,254,275.31RUSSELL OVERLAY FD 18,503,709.32 1,249,434.01 0.00 17,254,275.31
Total Miscellaneous 2,859,973.06 95,943.29 (200,664.58) 2,964,694.35
Miscellaneous Accounts 2,859,973.06 95,943.29 (200,664.58) 2,964,694.35RI TRANS ACCT 186,112.91 1,691.59 0.00 184,421.32
SHOTT CAPITAL 2,455,531.00 93,865.92 (189,037.11) 2,550,702.19
DOM EQUITY TRANS 74.25 0.00 0.00 74.25
NON-US EQUITY TRANS 85.61 (2.59) 0.00 88.20
FIXED INC TRANS 218,168.91 388.37 (11,627.47) 229,408.01
MACKAY SHIELDS LLC 0.38 0.00 0.00 0.38
Monthly Valuation Change
Period : 2014-12-01 - 2014-12-31
Page 2 of 2Monthly Valuation Change
Fri Jan 23 2015 14:32:52 PM
39

Category Source Account Name Closing Balance Market Value Increase/(Decrease) Transfer In/(Out) Opening Balance
Grand Total 7,956,344,667.88 1,547,712,203.21 (972,623,446.49) 7,381,255,911.16
Total Global Equity 4,503,508,162.92 1,213,099,333.54 (476,546,081.30) 3,766,954,910.68
Global Equity 3,845,129,961.33 1,091,220,707.70 (477,730,067.05) 3,231,639,320.68SSGA MSCI CANADA 144,835,830.42 13,055,100.52 86,979.77 131,693,750.13
SSGA MSCI EAFE 1,289,095,678.21 268,938,601.73 (79,189,177.28) 1,099,346,253.76
SSGA MSCI EM 421,112,730.23 4,029,541.89 891,098.31 416,192,090.03
SSGA R3000 INDEX 1,990,085,722.47 805,197,463.56 (399,518,967.85) 1,584,407,226.76
Global Equity Hedge Funds 658,378,201.59 121,878,625.84 1,183,985.75 535,315,590.00ASCEND PTRS II 71,686,873.28 10,700,593.28 0.00 60,986,280.00
DAVIDSON KEMPNER 74,292,184.28 10,245,904.28 0.00 64,046,280.00
ELLIOTT ASSOCIATES 81,907,132.24 16,720,372.24 0.00 65,186,760.00
ESG CBE FUND LP 46,220,525.29 (3,779,474.71) 50,000,000.00 0.00
INDUS ASIA PACIFIC 743,267.44 1,299,723.44 (42,228,816.00) 41,672,360.00
LUXOR CAP PTNS LP 44,489,723.20 (5,510,276.80) 50,000,000.00 0.00
MASON CAPITAL 60,029,224.17 3,316,024.17 0.00 56,713,200.00
PFM DIVERSIFIED 76,719,520.17 18,652,000.17 0.00 58,067,520.00
SAMLYN ON/OFFSHORE 107,801,325.47 22,926,265.47 20,000,000.00 64,875,060.00
THIRD POINT PTRS 0.00 20,373,848.25 (76,587,198.25) 56,213,350.00
VIKING GLOBAL EQUITI 94,488,426.05 26,933,646.05 0.00 67,554,780.00
Private Equity 541,556,913.65 135,085,763.24 (200,260,297.51) 606,731,447.92
Private Equity 541,556,913.65 135,085,763.24 (200,260,297.51) 606,731,447.92PRIVATE EQUITY 541,556,913.65 135,085,763.24 (200,260,297.51) 606,731,447.92
Total Fixed Income 1,122,439,930.38 45,033,009.31 (18,517,390.67) 1,095,924,311.74
Fixed Income 1,122,439,930.38 45,033,009.31 (18,517,390.67) 1,095,924,311.74MACKAY SHIELDS 565,416,324.44 23,181,557.43 (5,000,000.00) 547,234,767.01
PYRAMIS GLOBAL ADV 557,023,605.94 21,851,451.88 (13,517,390.67) 548,689,544.73
Total Real Return 1,310,310,851.90 84,313,805.48 332,456,172.37 893,540,874.05
Alternative Absolute Return 373,256,489.27 62,692,701.03 (54,619,461.76) 365,183,250.00BLUE CREST CAP 20,861,263.63 (106,236.37) 0.00 20,967,500.00
BREVAN HOWARD 79,922,304.45 3,199,929.45 0.00 76,722,375.00
DE SHAW 77,906,862.31 23,046,162.31 0.00 54,860,700.00
GRAHAM GLOBAL 55,514,508.47 4,788,808.47 0.00 50,725,700.00
OZ DOMESTIC PTRS 102,531,939.39 20,256,714.39 0.00 82,275,225.00
WEXFORD SPECTRUM 0.00 3,621,811.76 (54,619,461.76) 50,997,650.00
WINTON FUTURE FD 36,519,611.02 7,885,511.02 0.00 28,634,100.00
Alternative Fixed Income 159,906,694.02 5,408,719.89 15,075,634.13 139,422,340.00BRIGADE LEV CAP 55,864,831.44 4,331,731.44 0.00 51,533,100.00
CAPULA GLOBAL 58,294,822.69 8,471,222.69 0.00 49,823,600.00
CLAREN ROAD CR. FUND 45,747,039.89 (4,252,960.11) 50,000,000.00 0.00
GRACIE CREDIT FUND 0.00 (3,141,274.13) (34,924,365.87) 38,065,640.00
Credit 414,105,369.43 14,105,369.43 400,000,000.00 0.00PIMCO 207,096,668.60 7,096,668.60 200,000,000.00 0.00
WAMCO 207,008,700.83 7,008,700.83 200,000,000.00 0.00
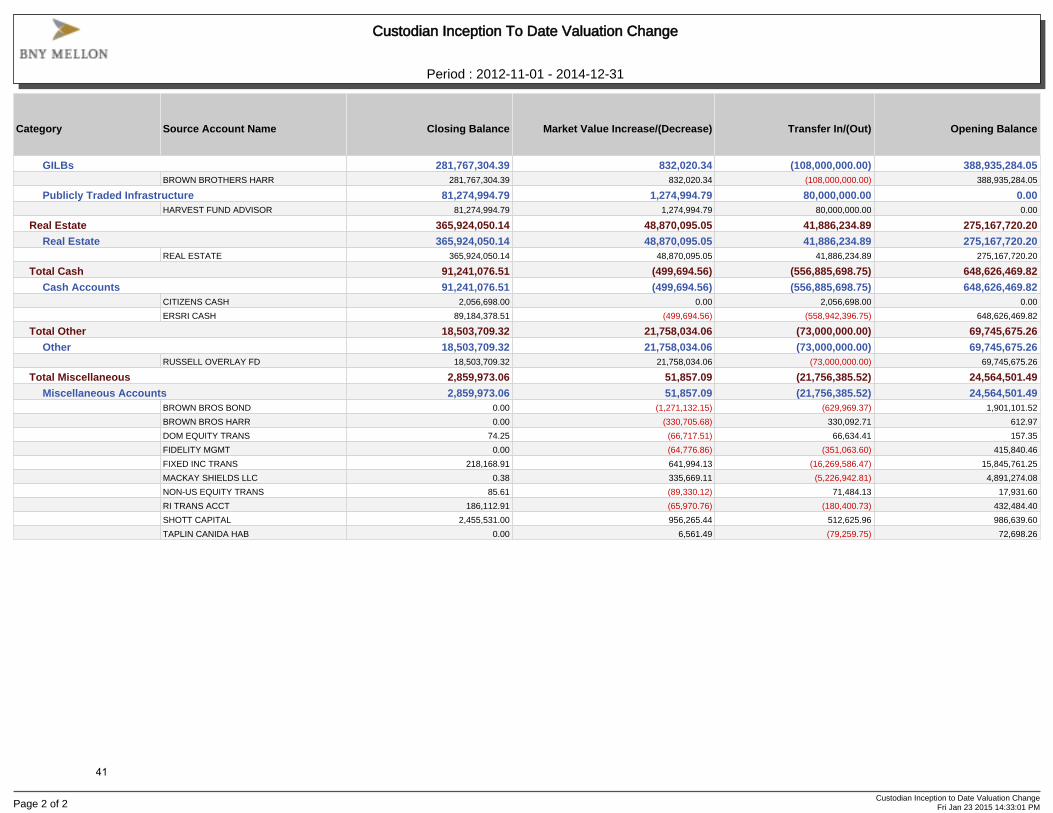
Custodian Inception To Date Valuation Change
Period : 2012-11-01 - 2014-12-31
Page 1 of 2Custodian Inception to Date Valuation Change
Fri Jan 23 2015 14:33:01 PM
40
Category Source Account Name Closing Balance Market Value Increase/(Decrease) Transfer In/(Out) Opening Balance
GILBs 281,767,304.39 832,020.34 (108,000,000.00) 388,935,284.05BROWN BROTHERS HARR 281,767,304.39 832,020.34 (108,000,000.00) 388,935,284.05
Publicly Traded Infrastructure 81,274,994.79 1,274,994.79 80,000,000.00 0.00HARVEST FUND ADVISOR 81,274,994.79 1,274,994.79 80,000,000.00 0.00
Real Estate 365,924,050.14 48,870,095.05 41,886,234.89 275,167,720.20
Real Estate 365,924,050.14 48,870,095.05 41,886,234.89 275,167,720.20REAL ESTATE 365,924,050.14 48,870,095.05 41,886,234.89 275,167,720.20
Total Cash 91,241,076.51 (499,694.56) (556,885,698.75) 648,626,469.82
Cash Accounts 91,241,076.51 (499,694.56) (556,885,698.75) 648,626,469.82CITIZENS CASH 2,056,698.00 0.00 2,056,698.00 0.00
ERSRI CASH 89,184,378.51 (499,694.56) (558,942,396.75) 648,626,469.82
Total Other 18,503,709.32 21,758,034.06 (73,000,000.00) 69,745,675.26
Other 18,503,709.32 21,758,034.06 (73,000,000.00) 69,745,675.26RUSSELL OVERLAY FD 18,503,709.32 21,758,034.06 (73,000,000.00) 69,745,675.26
Total Miscellaneous 2,859,973.06 51,857.09 (21,756,385.52) 24,564,501.49
Miscellaneous Accounts 2,859,973.06 51,857.09 (21,756,385.52) 24,564,501.49BROWN BROS BOND 0.00 (1,271,132.15) (629,969.37) 1,901,101.52
BROWN BROS HARR 0.00 (330,705.68) 330,092.71 612.97
DOM EQUITY TRANS 74.25 (66,717.51) 66,634.41 157.35
FIDELITY MGMT 0.00 (64,776.86) (351,063.60) 415,840.46
FIXED INC TRANS 218,168.91 641,994.13 (16,269,586.47) 15,845,761.25
MACKAY SHIELDS LLC 0.38 335,669.11 (5,226,942.81) 4,891,274.08
NON-US EQUITY TRANS 85.61 (89,330.12) 71,484.13 17,931.60
RI TRANS ACCT 186,112.91 (65,970.76) (180,400.73) 432,484.40
SHOTT CAPITAL 2,455,531.00 956,265.44 512,625.96 986,639.60
TAPLIN CANIDA HAB 0.00 6,561.49 (79,259.75) 72,698.26
Custodian Inception To Date Valuation Change
Period : 2012-11-01 - 2014-12-31
Page 2 of 2Custodian Inception to Date Valuation Change
Fri Jan 23 2015 14:33:01 PM
41
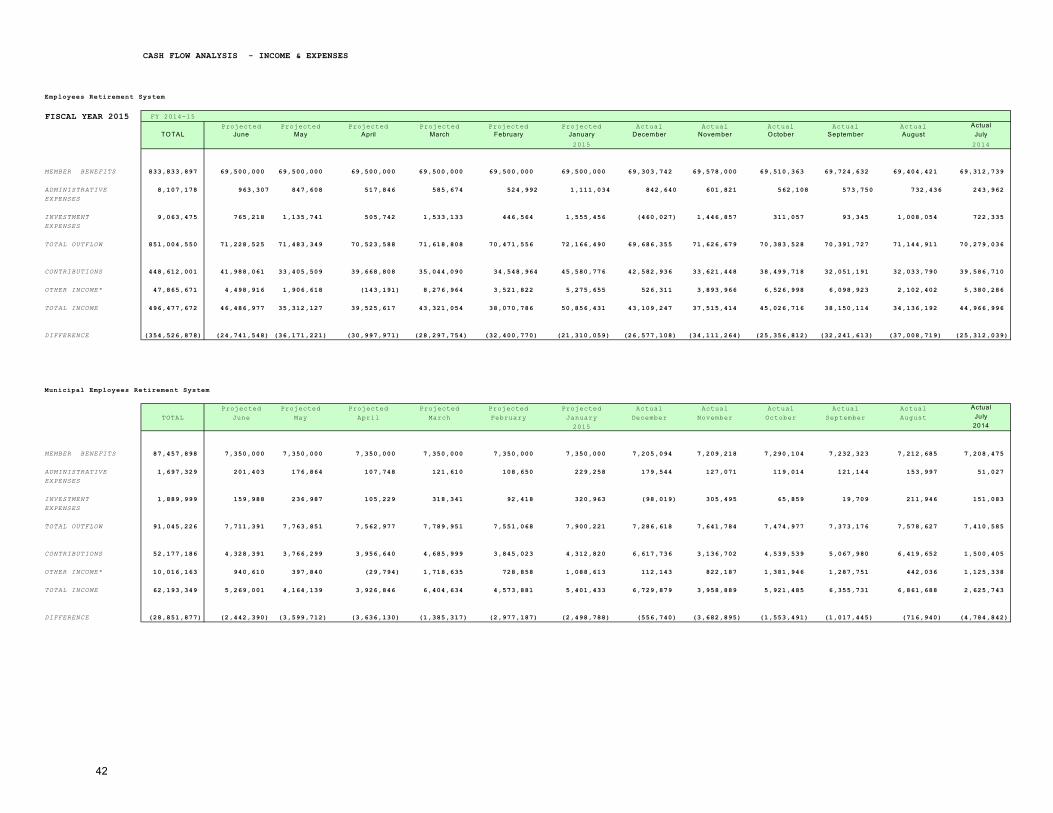
CASH FLOW ANALYSIS - INCOME & EXPENSES
Employees Retirement System
FISCAL YEAR 2015 FY 2014-15
Projected Projected Projected Projected Projected Projected Actual Actual Actual Actual Actual ActualTOTAL June May April March February January December November October September August July
2015 2014
MEMBER BENEFITS 833,833,897 69,500,000 69,500,000 69,500,000 69,500,000 69,500,000 69,500,000 69,303,742 69,578,000 69,510,363 69,724,632 69,404,421 69,312,739
ADMINISTRATIVE 8,107,178 963,307 847,608 517,846 585,674 524,992 1,111,034 842,640 601,821 562,108 573,750 732,436 243,962
EXPENSES
INVESTMENT 9,063,475 765,218 1,135,741 505,742 1,533,133 446,564 1,555,456 (460,027) 1,446,857 311,057 93,345 1,008,054 722,335
EXPENSES
TOTAL OUTFLOW 851,004,550 71,228,525 71,483,349 70,523,588 71,618,808 70,471,556 72,166,490 69,686,355 71,626,679 70,383,528 70,391,727 71,144,911 70,279,036
CONTRIBUTIONS 448,612,001 41,988,061 33,405,509 39,668,808 35,044,090 34,548,964 45,580,776 42,582,936 33,621,448 38,499,718 32,051,191 32,033,790 39,586,710
OTHER INCOME* 47,865,671 4,498,916 1,906,618 (143,191) 8,276,964 3,521,822 5,275,655 526,311 3,893,966 6,526,998 6,098,923 2,102,402 5,380,286
TOTAL INCOME 496,477,672 46,486,977 35,312,127 39,525,617 43,321,054 38,070,786 50,856,431 43,109,247 37,515,414 45,026,716 38,150,114 34,136,192 44,966,996
DIFFERENCE (354,526,878) (24,741,548) (36,171,221) (30,997,971) (28,297,754) (32,400,770) (21,310,059) (26,577,108) (34,111,264) (25,356,812) (32,241,613) (37,008,719) (25,312,039)
Municipal Employees Retirement System
Projected Projected Projected Projected Projected Projected Actual Actual Actual Actual Actual Actual
TOTAL June May April March February January December November October September August July2015 2014
MEMBER BENEFITS 87,457,898 7,350,000 7,350,000 7,350,000 7,350,000 7,350,000 7,350,000 7,205,094 7,209,218 7,290,104 7,232,323 7,212,685 7,208,475
ADMINISTRATIVE 1,697,329 201,403 176,864 107,748 121,610 108,650 229,258 179,544 127,071 119,014 121,144 153,997 51,027
EXPENSES
INVESTMENT 1,889,999 159,988 236,987 105,229 318,341 92,418 320,963 (98,019) 305,495 65,859 19,709 211,946 151,083
EXPENSES
TOTAL OUTFLOW 91,045,226 7,711,391 7,763,851 7,562,977 7,789,951 7,551,068 7,900,221 7,286,618 7,641,784 7,474,977 7,373,176 7,578,627 7,410,585
CONTRIBUTIONS 52,177,186 4,328,391 3,766,299 3,956,640 4,685,999 3,845,023 4,312,820 6,617,736 3,136,702 4,539,539 5,067,980 6,419,652 1,500,405
OTHER INCOME* 10,016,163 940,610 397,840 (29,794) 1,718,635 728,858 1,088,613 112,143 822,187 1,381,946 1,287,751 442,036 1,125,338
TOTAL INCOME 62,193,349 5,269,001 4,164,139 3,926,846 6,404,634 4,573,881 5,401,433 6,729,879 3,958,889 5,921,485 6,355,731 6,861,688 2,625,743
DIFFERENCE (28,851,877) (2,442,390) (3,599,712) (3,636,130) (1,385,317) (2,977,187) (2,498,788) (556,740) (3,682,895) (1,553,491) (1,017,445) (716,940) (4,784,842)
42

CASH FLOW ANALYSIS - INCOME & EXPENSES
State Police
Retirement System Projected Projected Projected Projected Projected Projected Actual Actual Actual Actual Actual ActualTOTAL June May April March February January December November October September August July
2015 2014
MEMBER BENEFITS 2,066,825 155,000 155,000 155,000 155,000 155,000 155,000 192,180 192,180 220,241 180,853 174,655 176,716
ADMINISTRATIVE 133,443 15,826 13,840 8,385 9,414 8,373 17,530 14,477 10,139 9,542 9,666 12,217 4,037
EXPENSES
INVESTMENT 147,701 12,572 18,544 8,189 24,642 7,122 24,542 (7,903) 24,375 5,280 1,573 16,814 11,952
EXPENSES
TOTAL OUTFLOW 2,347,969 183,398 187,384 171,573 189,056 170,495 197,072 198,753 226,693 235,063 192,092 203,686 192,704
CONTRIBUTIONS 5,116,825 405,000 395,000 395,000 415,000 395,000 655,000 382,180 192,180 415,241 440,853 624,655 401,716
OTHER INCOME* 787,445 73,912 31,131 (2,318) 133,035 56,169 83,239 9,042 65,600 110,798 102,746 35,067 89,024
TOTAL INCOME 5,904,270 478,912 426,131 392,682 548,035 451,169 738,239 391,222 257,780 526,039 543,599 659,722 490,740
DIFFERENCE 3,556,301 295,514 238,747 221,108 358,980 280,674 541,168 192,469 31,087 290,975 351,508 456,036 298,035
Judicial
Retirement System Projected Projected Projected Projected Projected Projected Actual Actual Actual Actual Actual ActualTOTAL June May April March February January December November October September August July
2015 2014
MEMBER BENEFITS 1,629,674 134,136 134,136 134,136 134,136 134,136 134,136 139,166 149,147 134,136 134,136 134,136 134,136
ADMINISTRATIVE 68,337 8,097 7,079 4,287 4,812 4,280 8,958 7,453 5,199 4,895 4,956 6,256 2,066
EXPENSES
INVESTMENT 75,554 6,432 9,485 4,187 12,597 3,640 12,541 (4,069) 12,498 2,709 806 8,610 6,117
EXPENSES
TOTAL OUTFLOW 1,773,565 148,666 150,700 142,610 151,545 142,056 155,634 142,550 166,844 141,740 139,899 149,002 142,318
CONTRIBUTIONS 3,674,674 274,136 274,136 274,136 279,136 264,136 404,136 299,166 294,147 289,136 294,136 439,136 289,136
OTHER INCOME* 403,141 37,817 15,923 (1,185) 68,007 28,710 42,535 4,655 33,637 56,842 52,685 17,958 45,559
TOTAL INCOME 4,077,815 311,953 290,059 272,951 347,143 292,846 446,671 303,821 327,785 345,978 346,821 457,094 334,695
DIFFERENCE 2,304,250 163,287 139,359 130,341 195,598 150,790 291,036 161,271 160,940 204,238 206,922 308,091 192,377
*includes income from Real Estate Investments, Private Equity, and Cash Accounts
43

FISCAL YEAR 2015 DIRECT BILLED INVESTMENT MANAGER FEES, PROFESSIONAL FEES & OPERATING EXPENSES
ERSRI & MERSRI ACCRUAL BASIS
Actual Actual Actual Actual Actual Projected Projected Projected Projected Projected Projected Projected Projected
Jul 14 Aug Sept Oct Nov Dec Jan 15 Feb Mar Apr May June TOTAL
EQUITIES US SSGA Russell 2000/3000 63,563 63,000 63,000 63,000 252,563 Shott Capital/Hamilton Lane 2,213 1,000 1,000 1,000 5,213
65,775 64,000 64,000 64,000 257,775
FIXED INCOME
Pyramis 178,196 175,000 175,000 175,000 703,196 Mackay Shields 202,579 185,000 185,000 185,000 757,579 Brown Bros.TIPS/GILB 83,477 85,000 85,000 85,000 338,477
464,252 445,000 445,000 445,000 1,799,252
INT'L EQUITIES
SSgA MSCI ACWI 0 0 0 0 0
SSGA MSCI EAFE 102,974 105,000 105,000 105,000 417,974
SSGA MSCI CAD 11,818 11,000 11,000 11,000 44,818
SSGA MSCI Emerg Mkts 114,934 110,000 110,000 110,000 444,934
229,726 226,000 226,000 226,000 907,726CREDIT
WAMCO 155,625 155,000 155,000 155,000 620,625
PIMCO 144,134 245,000 245,000 245,000 879,134
299,759 400,000 400,000 400,000 1,499,759
REAL ESTATE Direct Billed Real Estate 152,092 18,125 87,487 239,996 516,384 0 291,327 260,428 86,386 149,734 0 252,935 2,054,894 ALTERNATIVE INVESTMENTS
Direct Billed Private Equity 161,438 1,227,352 27,950 144,927 1,272,911 (570,046) 1,622,232 289,334 1,802,381 473,634 1,400,808 691,307 8,544,228
SUB TOTAL-INV MGMT FEES 313,531 1,245,477 875,190 384,923 1,789,295 164,954 1,913,559 549,762 3,023,767 623,368 1,400,808 2,079,242 15,063,634
PROFESSIONAL FEES
Legal 7,904 5,841 7,150 9,408 6,411 11,810 0 0 12,644 7,999 24,528 7,239 100,936 BNY Mellon - Custodial 29,130 29,241 29,182 29,127 29,112 29,306 29,071 29,446 29,413 28,906 30,000 30,000 351,934 Cliffwater 37,500 37,500 37,500 37,500 37,500 37,500 37,500 37,500 37,500 37,500 37,500 37,500 450,000 PCA/Russell 13,125 13,125 95,076 13,125 31,875 70,163 13,125 13,125 76,073 13,125 13,125 80,000 445,065 PCA Real Estate 10,417 10,417 10,417 10,417 10,417 10,417 10,417 10,417 10,417 10,417 10,417 10,417 125,004
98,077 96,124 179,325 99,577 115,315 159,196 90,113 90,488 166,047 97,948 115,571 165,156 1,472,938OPERATING EXPENSE
Retirement Transfers 194,136 729,054 1,001,704 1,046,133 401,145 871,468 1,265,779 470,299 936,603 515,370 943,387 1,631,781 10,006,858
Other Expense 0 7,995 13,500 4,500 650 13,500 0 0 13,425 21,875 1,000 13,532 89,977
194,136 737,049 1,015,204 1,050,633 401,795 884,968 1,265,779 470,299 950,028 537,245 944,387 1,645,313 10,096,835
TOTAL: 605,743 2,078,650 2,069,718 1,535,134 2,306,405 1,209,118 3,269,451 ######### 4,139,842 1,258,561 2,460,765 3,889,711 26,633,407
Note: Numbers in bold are actual. -2-
44
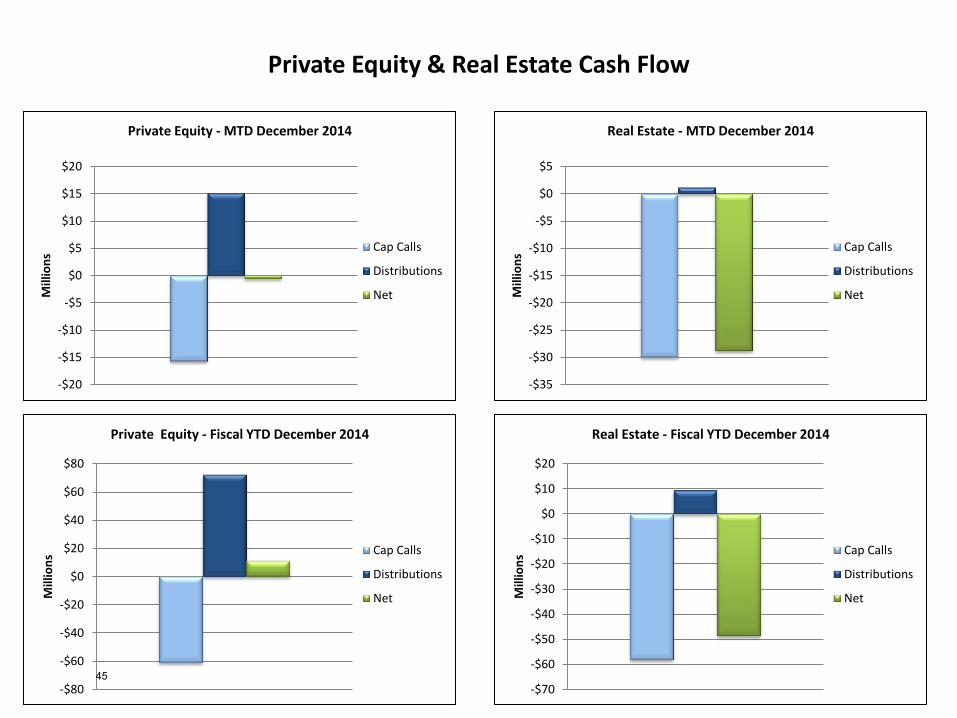
Private Equity & Real Estate Cash Flow
-$20
-$15
-$10
-$5
$0
$5
$10
$15
$20
Mill
ion
s
Private Equity - MTD December 2014
Cap Calls
Distributions
Net
-$80
-$60
-$40
-$20
$0
$20
$40
$60
$80
Mill
ion
s
Private Equity - Fiscal YTD December 2014
Cap Calls
Distributions
Net
-$35
-$30
-$25
-$20
-$15
-$10
-$5
$0
$5
Mill
ion
s
Real Estate - MTD December 2014
Cap Calls
Distributions
Net
-$70
-$60
-$50
-$40
-$30
-$20
-$10
$0
$10
$20
Mill
ion
s
Real Estate - Fiscal YTD December 2014
Cap Calls
Distributions
Net
45
Information Security Identification: Confidential
Section VIII. Short-Term Investments
46

Vendor CP CD Agency Money Mkt PIP Repo GID OSIP Total ($)Guidelines-Total/Vendor 25%/10% 50%/20% 75%/35% 75%/35% 75%/35% 100%/20% 75%/35% 50%/50%
OSIP 0 0 0 0 0 0 0 107,563,156 107,563,1560% 0% 0% 0% 0% 0% 0% 22% 22%
Bank RI 0 15,151,752 0 0 0 0 0 0 15,151,7520% 3% 0% 0% 0% 0% 0% 0% 3%
Santander Bank 0 0 0 0 170,914,885 0 0 0 170,914,8850% 0% 0% 0% 35% 0% 0% 0% 35%
Citizens Bank 0 0 0 0 30,511,610 0 0 0 30,511,6100% 0% 0% 0% 6% 0% 0% 0% 6%
Webster Bank 0 0 0 0 55,403,975 0 0 0 55,403,9750% 0% 0% 0% 11% 0% 0% 0% 11%
Customers Bank 0 0 0 0 30,010,001 0 0 0 30,010,0010% 0% 0% 0% 6% 0% 0% 0% 6%
Washington Trust 0 0 0 65,462,279 0 0 0 0 65,462,2790% 0% 0% 14% 0% 0% 0% 0% 14%
TD Bank 0 0 0 0 8,026,317 0 0 0 8,026,3170% 0% 0% 0% 2% 0% 0% 0% 2%
TOTALS - 15,151,752 - 65,462,279 294,866,788 - - 107,563,156 483,043,975(%) PORTFOLIO 0.00% 3.14% 0.00% 13.55% 61.04% 0.00% 0.00% 22.27% 100.00%
Note: PIP + CD must be under 75%.Note: Maximum participation by any one vendor limited to 35% of total portfolio.
Short-Term Investment Maturity Schedule & SIC Compliance Report at December 31, 2014
$483,043,974
$141,592,282
$0
$100,000,000
$200,000,000
$300,000,000
$400,000,000
$500,000,000
$600,000,000
Under 30 Days 31-60 Days 61-90 Days 91-120 Days Over 120 Days
Maturity Schedule Operating Cash
Bond Proceeds
47
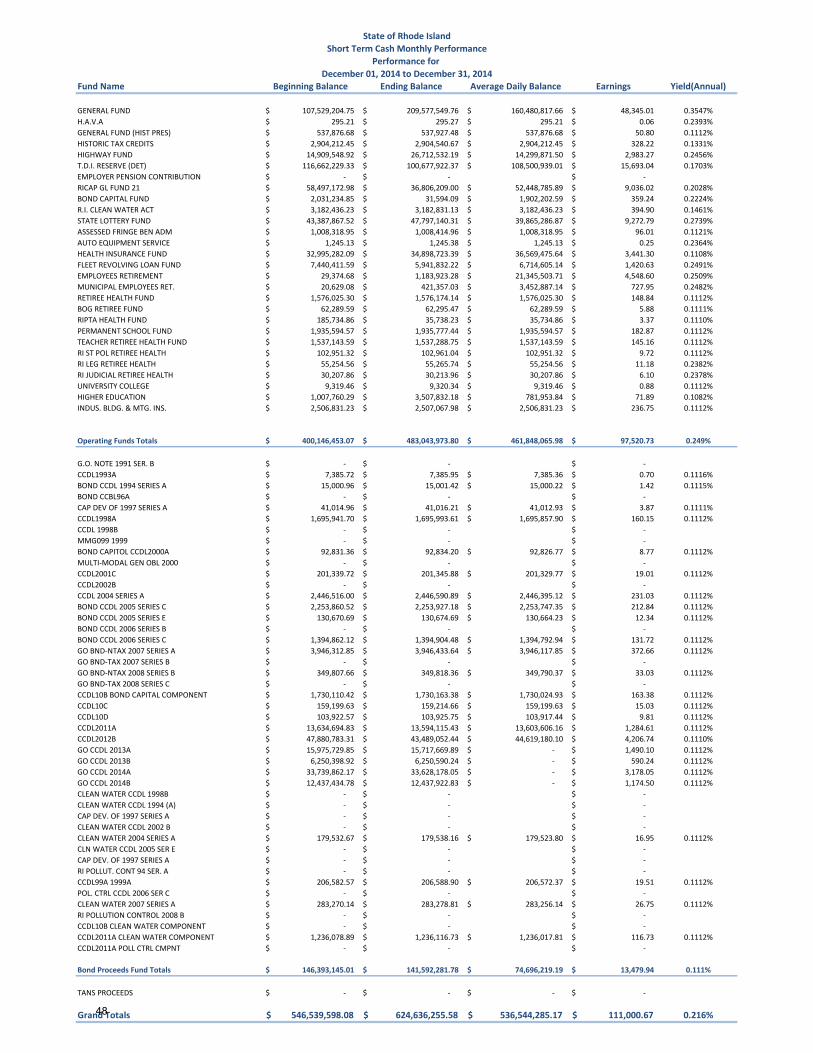
Fund Name Beginning Balance Ending Balance Average Daily Balance Earnings Yield(Annual)
GENERAL FUND 107,529,204.75$ 209,577,549.76$ 160,480,817.66$ 48,345.01$ 0.3547%
H.A.V.A 295.21$ 295.27$ 295.21$ 0.06$ 0.2393%
GENERAL FUND (HIST PRES) 537,876.68$ 537,927.48$ 537,876.68$ 50.80$ 0.1112%
HISTORIC TAX CREDITS 2,904,212.45$ 2,904,540.67$ 2,904,212.45$ 328.22$ 0.1331%
HIGHWAY FUND 14,909,548.92$ 26,712,532.19$ 14,299,871.50$ 2,983.27$ 0.2456%
T.D.I. RESERVE (DET) 116,662,229.33$ 100,677,922.37$ 108,500,939.01$ 15,693.04$ 0.1703%
EMPLOYER PENSION CONTRIBUTION -$ -$ -$
RICAP GL FUND 21 58,497,172.98$ 36,806,209.00$ 52,448,785.89$ 9,036.02$ 0.2028%
BOND CAPITAL FUND 2,031,234.85$ 31,594.09$ 1,902,202.59$ 359.24$ 0.2224%
R.I. CLEAN WATER ACT 3,182,436.23$ 3,182,831.13$ 3,182,436.23$ 394.90$ 0.1461%
STATE LOTTERY FUND 43,387,867.52$ 47,797,140.31$ 39,865,286.87$ 9,272.79$ 0.2739%
ASSESSED FRINGE BEN ADM 1,008,318.95$ 1,008,414.96$ 1,008,318.95$ 96.01$ 0.1121%
AUTO EQUIPMENT SERVICE 1,245.13$ 1,245.38$ 1,245.13$ 0.25$ 0.2364%
HEALTH INSURANCE FUND 32,995,282.09$ 34,898,723.39$ 36,569,475.64$ 3,441.30$ 0.1108%
FLEET REVOLVING LOAN FUND 7,440,411.59$ 5,941,832.22$ 6,714,605.14$ 1,420.63$ 0.2491%
EMPLOYEES RETIREMENT 29,374.68$ 1,183,923.28$ 21,345,503.71$ 4,548.60$ 0.2509%
MUNICIPAL EMPLOYEES RET. 20,629.08$ 421,357.03$ 3,452,887.14$ 727.95$ 0.2482%
RETIREE HEALTH FUND 1,576,025.30$ 1,576,174.14$ 1,576,025.30$ 148.84$ 0.1112%
BOG RETIREE FUND 62,289.59$ 62,295.47$ 62,289.59$ 5.88$ 0.1111%
RIPTA HEALTH FUND 185,734.86$ 35,738.23$ 35,734.86$ 3.37$ 0.1110%
PERMANENT SCHOOL FUND 1,935,594.57$ 1,935,777.44$ 1,935,594.57$ 182.87$ 0.1112%
TEACHER RETIREE HEALTH FUND 1,537,143.59$ 1,537,288.75$ 1,537,143.59$ 145.16$ 0.1112%
RI ST POL RETIREE HEALTH 102,951.32$ 102,961.04$ 102,951.32$ 9.72$ 0.1112%
RI LEG RETIREE HEALTH 55,254.56$ 55,265.74$ 55,254.56$ 11.18$ 0.2382%
RI JUDICIAL RETIREE HEALTH 30,207.86$ 30,213.96$ 30,207.86$ 6.10$ 0.2378%
UNIVERSITY COLLEGE 9,319.46$ 9,320.34$ 9,319.46$ 0.88$ 0.1112%
HIGHER EDUCATION 1,007,760.29$ 3,507,832.18$ 781,953.84$ 71.89$ 0.1082%
INDUS. BLDG. & MTG. INS. 2,506,831.23$ 2,507,067.98$ 2,506,831.23$ 236.75$ 0.1112%
Operating Funds Totals 400,146,453.07$ 483,043,973.80$ 461,848,065.98$ 97,520.73$ 0.249%
G.O. NOTE 1991 SER. B -$ -$ -$
CCDL1993A 7,385.72$ 7,385.95$ 7,385.36$ 0.70$ 0.1116%
BOND CCDL 1994 SERIES A 15,000.96$ 15,001.42$ 15,000.22$ 1.42$ 0.1115%
BOND CCBL96A -$ -$ -$
CAP DEV OF 1997 SERIES A 41,014.96$ 41,016.21$ 41,012.93$ 3.87$ 0.1111%
CCDL1998A 1,695,941.70$ 1,695,993.61$ 1,695,857.90$ 160.15$ 0.1112%
CCDL 1998B -$ -$ -$
MMG099 1999 -$ -$ -$
BOND CAPITOL CCDL2000A 92,831.36$ 92,834.20$ 92,826.77$ 8.77$ 0.1112%
MULTI-MODAL GEN OBL 2000 -$ -$ -$
CCDL2001C 201,339.72$ 201,345.88$ 201,329.77$ 19.01$ 0.1112%
CCDL2002B -$ -$ -$
CCDL 2004 SERIES A 2,446,516.00$ 2,446,590.89$ 2,446,395.12$ 231.03$ 0.1112%
BOND CCDL 2005 SERIES C 2,253,860.52$ 2,253,927.18$ 2,253,747.35$ 212.84$ 0.1112%
BOND CCDL 2005 SERIES E 130,670.69$ 130,674.69$ 130,664.23$ 12.34$ 0.1112%
BOND CCDL 2006 SERIES B -$ -$ -$
BOND CCDL 2006 SERIES C 1,394,862.12$ 1,394,904.48$ 1,394,792.94$ 131.72$ 0.1112%
GO BND-NTAX 2007 SERIES A 3,946,312.85$ 3,946,433.64$ 3,946,117.85$ 372.66$ 0.1112%
GO BND-TAX 2007 SERIES B -$ -$ -$
GO BND-NTAX 2008 SERIES B 349,807.66$ 349,818.36$ 349,790.37$ 33.03$ 0.1112%
GO BND-TAX 2008 SERIES C -$ -$ -$
CCDL10B BOND CAPITAL COMPONENT 1,730,110.42$ 1,730,163.38$ 1,730,024.93$ 163.38$ 0.1112%
CCDL10C 159,199.63$ 159,214.66$ 159,199.63$ 15.03$ 0.1112%
CCDL10D 103,922.57$ 103,925.75$ 103,917.44$ 9.81$ 0.1112%
CCDL2011A 13,634,694.83$ 13,594,115.43$ 13,603,606.16$ 1,284.61$ 0.1112%
CCDL2012B 47,880,783.31$ 43,489,052.44$ 44,619,180.10$ 4,206.74$ 0.1110%
GO CCDL 2013A 15,975,729.85$ 15,717,669.89$ -$ 1,490.10$ 0.1112%
GO CCDL 2013B 6,250,398.92$ 6,250,590.24$ -$ 590.24$ 0.1112%
GO CCDL 2014A 33,739,862.17$ 33,628,178.05$ -$ 3,178.05$ 0.1112%
GO CCDL 2014B 12,437,434.78$ 12,437,922.83$ -$ 1,174.50$ 0.1112%
CLEAN WATER CCDL 1998B -$ -$ -$
CLEAN WATER CCDL 1994 (A) -$ -$ -$
CAP DEV. OF 1997 SERIES A -$ -$ -$
CLEAN WATER CCDL 2002 B -$ -$ -$
CLEAN WATER 2004 SERIES A 179,532.67$ 179,538.16$ 179,523.80$ 16.95$ 0.1112%
CLN WATER CCDL 2005 SER E -$ -$ -$
CAP DEV. OF 1997 SERIES A -$ -$ -$
RI POLLUT. CONT 94 SER. A -$ -$ -$
CCDL99A 1999A 206,582.57$ 206,588.90$ 206,572.37$ 19.51$ 0.1112%
POL. CTRL CCDL 2006 SER C -$ -$ -$
CLEAN WATER 2007 SERIES A 283,270.14$ 283,278.81$ 283,256.14$ 26.75$ 0.1112%
RI POLLUTION CONTROL 2008 B -$ -$ -$
CCDL10B CLEAN WATER COMPONENT -$ -$ -$
CCDL2011A CLEAN WATER COMPONENT 1,236,078.89$ 1,236,116.73$ 1,236,017.81$ 116.73$ 0.1112%
CCDL2011A POLL CTRL CMPNT -$ -$ -$
Bond Proceeds Fund Totals 146,393,145.01$ 141,592,281.78$ 74,696,219.19$ 13,479.94$ 0.111%
TANS PROCEEDS -$ -$ -$ -$
Grand Totals 546,539,598.08$ 624,636,255.58$ 536,544,285.17$ 111,000.67$ 0.216%
State of Rhode Island
Short Term Cash Monthly Performance
Performance for
December 01, 2014 to December 31, 2014
48

Issuer Ratings S-T Debt Rating L-T Debt Rating Credit OutlookType of Month End %
Issuer Instrument* Portfolio Moody's Moody's S&P Moody's S&P S&P
Bank RI 3,4 3% N/R N/A N/A N/A N/A N/A
Santander Bank 3,4 35% Baa1 P-2 A-2 Baa1 BBB Stable
Bank of America 0% Baa2 P-2 A-2 Baa2 A- Negative
JP Morgan Chase 0% A3 P-2 A-1 A3 A Negative
Fidelity 0% N/R N/A N/A N/A N/A N/A
State Street Bank & Trust Company 0% Aa3 P-1 A-1+ Aa3 AA- Stable
RBS Citizens 3,4 6% A3 P-2 A-2 A3 A- Stable
Webster Bank 3,4 11% A3 P-2 A-2 A3 BBB Positive
Ocean State Investment Pool 6 22% N/R N/A N/A N/A N/A N/A
Washington Trust 3,7 14% N/R N/A N/A N/A N/A N/A
TD Bank 3 2% Aa1 P-1 A-1+ Aa1 AA- Negative
Customers Bank 4 6% N/R N/A N/A N/A N/A N/A
REPO = Repurchase Agreement 1*CP = Commercial Paper 2*CD = Certificate of Deposit 3*CoD = Collateralized Deposit 4*AG = US Government Agency Note 5*MM = Government Money Market 6*GID = Government Insured Deposit 7*
Moody's Short-Term Debt Ratings: S&P Short -Term Credit Ratings:P-1 - Prime-1 have a superior ability for repayment of sr. S-T debt obligations A-1 - Highest rated, strong capacity to meet obligationsP-2 - Prime-1 have a strong ability for repayment of sr. S-T debt obligations A-2 - Somewhat more susceptible to adverse effects of changes in financial conditions; satisfactoryP-3 - Prime-1 have an acceptable ability for repayment of sr. S-T debt obligations A-3 - Exhibits adequate protection parametersNP - Not Prime B - Significant speculative characteristics, faces major ongoing uncertainties
C - Vulnerable to non-paymentMoody's Issuer Rating Symbols: D - Payment defaultAaa - Offer exceptional financial security (high-grade) Modifiers:Aa - Offer excellent financial security (high-grade) + or - show relative standing within the category.A - Offer good financial securityBaa - Offer adequate financial security S&P Outlook Definitions:Ba - Offer questionable financial security Positive - A rating may be raisedB - Offer poor financial security Negative - A rating may be loweredCaa - Offer very poor financial security Stable - A rating is not likely to change Ca - Offer extremely poor financial security Developing - May be raised or loweredC - Lowest rated class, usually in default NM - Not meaningful
Moody's Long-Term Debt Ratings: S&P Long-Term Debt Ratings:Aaa - Best Quality AAA - Highest rating, extremely strongAa - High Quality AA - Differs slightly from highest rating, very strongA - Posess many favorable investment attributes A - More susceptible to adverse effects of change in economic condition, strongBaa - Medium-grade obligations BBB - Exhibits adequate protection parametersBa - Posess speculative elements BB, B, - Have significant speculative characteristics. BB least speculativeB - Generally lack characteristics of desirable investments CCC, CC, C - C highest degreeCaa - Poor standing D - Payment defaultCa - Speculative in a high degree Modifiers:C - Lowest rated class of bonds + or - show relative standing within the category.
Modifiers:1 - Higher end of letter rating category2 - Mid-range of letter rating category3 - Lower end of letter rating category
Office of the General TreasurerState of Rhode Island
Ratings Definitions
December 31, 2014Issuer Credit Rating
Short Term Investments
49
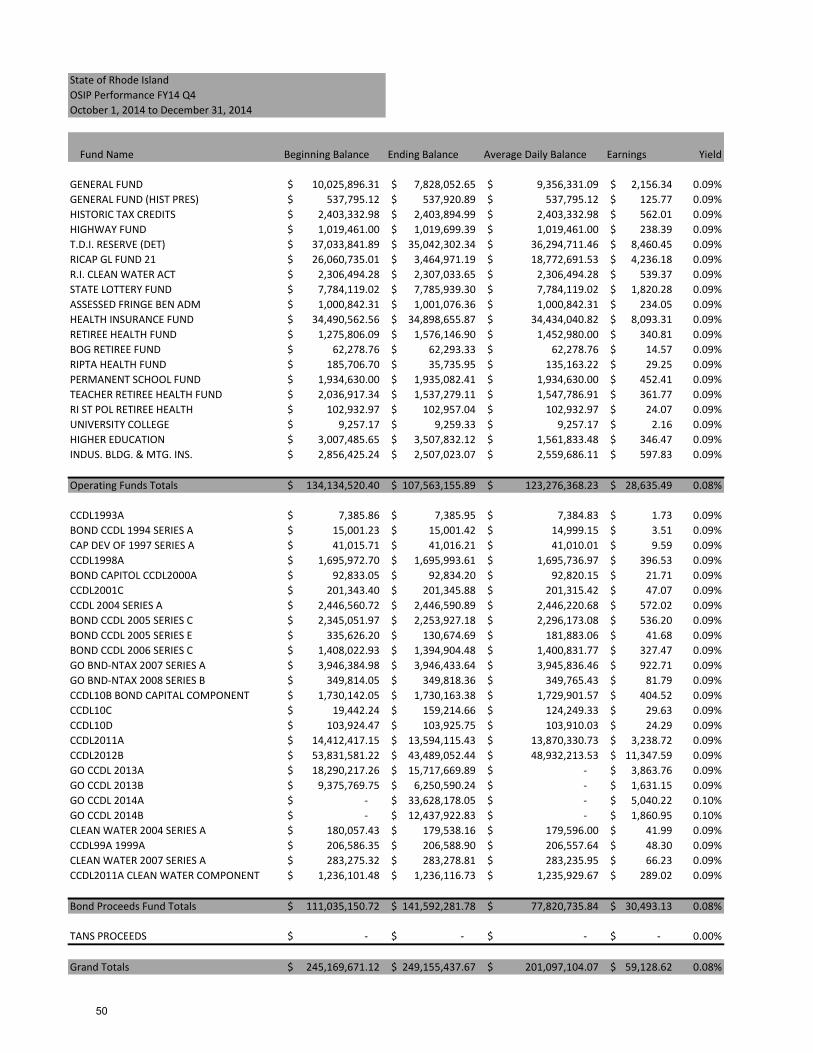
State of Rhode Island
OSIP Performance FY14 Q4
October 1, 2014 to December 31, 2014
Fund Name Beginning Balance Ending Balance Average Daily Balance Earnings Yield
GENERAL FUND 10,025,896.31$ 7,828,052.65$ 9,356,331.09$ 2,156.34$ 0.09%
GENERAL FUND (HIST PRES) 537,795.12$ 537,920.89$ 537,795.12$ 125.77$ 0.09%
HISTORIC TAX CREDITS 2,403,332.98$ 2,403,894.99$ 2,403,332.98$ 562.01$ 0.09%
HIGHWAY FUND 1,019,461.00$ 1,019,699.39$ 1,019,461.00$ 238.39$ 0.09%
T.D.I. RESERVE (DET) 37,033,841.89$ 35,042,302.34$ 36,294,711.46$ 8,460.45$ 0.09%
RICAP GL FUND 21 26,060,735.01$ 3,464,971.19$ 18,772,691.53$ 4,236.18$ 0.09%
R.I. CLEAN WATER ACT 2,306,494.28$ 2,307,033.65$ 2,306,494.28$ 539.37$ 0.09%
STATE LOTTERY FUND 7,784,119.02$ 7,785,939.30$ 7,784,119.02$ 1,820.28$ 0.09%
ASSESSED FRINGE BEN ADM 1,000,842.31$ 1,001,076.36$ 1,000,842.31$ 234.05$ 0.09%
HEALTH INSURANCE FUND 34,490,562.56$ 34,898,655.87$ 34,434,040.82$ 8,093.31$ 0.09%
RETIREE HEALTH FUND 1,275,806.09$ 1,576,146.90$ 1,452,980.00$ 340.81$ 0.09%
BOG RETIREE FUND 62,278.76$ 62,293.33$ 62,278.76$ 14.57$ 0.09%
RIPTA HEALTH FUND 185,706.70$ 35,735.95$ 135,163.22$ 29.25$ 0.09%
PERMANENT SCHOOL FUND 1,934,630.00$ 1,935,082.41$ 1,934,630.00$ 452.41$ 0.09%
TEACHER RETIREE HEALTH FUND 2,036,917.34$ 1,537,279.11$ 1,547,786.91$ 361.77$ 0.09%
RI ST POL RETIREE HEALTH 102,932.97$ 102,957.04$ 102,932.97$ 24.07$ 0.09%
UNIVERSITY COLLEGE 9,257.17$ 9,259.33$ 9,257.17$ 2.16$ 0.09%
HIGHER EDUCATION 3,007,485.65$ 3,507,832.12$ 1,561,833.48$ 346.47$ 0.09%
INDUS. BLDG. & MTG. INS. 2,856,425.24$ 2,507,023.07$ 2,559,686.11$ 597.83$ 0.09%
Operating Funds Totals 134,134,520.40$ 107,563,155.89$ 123,276,368.23$ 28,635.49$ 0.08%
CCDL1993A 7,385.86$ 7,385.95$ 7,384.83$ 1.73$ 0.09%
BOND CCDL 1994 SERIES A 15,001.23$ 15,001.42$ 14,999.15$ 3.51$ 0.09%
CAP DEV OF 1997 SERIES A 41,015.71$ 41,016.21$ 41,010.01$ 9.59$ 0.09%
CCDL1998A 1,695,972.70$ 1,695,993.61$ 1,695,736.97$ 396.53$ 0.09%
BOND CAPITOL CCDL2000A 92,833.05$ 92,834.20$ 92,820.15$ 21.71$ 0.09%
CCDL2001C 201,343.40$ 201,345.88$ 201,315.42$ 47.07$ 0.09%
CCDL 2004 SERIES A 2,446,560.72$ 2,446,590.89$ 2,446,220.68$ 572.02$ 0.09%
BOND CCDL 2005 SERIES C 2,345,051.97$ 2,253,927.18$ 2,296,173.08$ 536.20$ 0.09%
BOND CCDL 2005 SERIES E 335,626.20$ 130,674.69$ 181,883.06$ 41.68$ 0.09%
BOND CCDL 2006 SERIES C 1,408,022.93$ 1,394,904.48$ 1,400,831.77$ 327.47$ 0.09%
GO BND-NTAX 2007 SERIES A 3,946,384.98$ 3,946,433.64$ 3,945,836.46$ 922.71$ 0.09%
GO BND-NTAX 2008 SERIES B 349,814.05$ 349,818.36$ 349,765.43$ 81.79$ 0.09%
CCDL10B BOND CAPITAL COMPONENT 1,730,142.05$ 1,730,163.38$ 1,729,901.57$ 404.52$ 0.09%
CCDL10C 19,442.24$ 159,214.66$ 124,249.33$ 29.63$ 0.09%
CCDL10D 103,924.47$ 103,925.75$ 103,910.03$ 24.29$ 0.09%
CCDL2011A 14,412,417.15$ 13,594,115.43$ 13,870,330.73$ 3,238.72$ 0.09%
CCDL2012B 53,831,581.22$ 43,489,052.44$ 48,932,213.53$ 11,347.59$ 0.09%
GO CCDL 2013A 18,290,217.26$ 15,717,669.89$ -$ 3,863.76$ 0.09%
GO CCDL 2013B 9,375,769.75$ 6,250,590.24$ -$ 1,631.15$ 0.09%
GO CCDL 2014A -$ 33,628,178.05$ -$ 5,040.22$ 0.10%
GO CCDL 2014B -$ 12,437,922.83$ -$ 1,860.95$ 0.10%
CLEAN WATER 2004 SERIES A 180,057.43$ 179,538.16$ 179,596.00$ 41.99$ 0.09%
CCDL99A 1999A 206,586.35$ 206,588.90$ 206,557.64$ 48.30$ 0.09%
CLEAN WATER 2007 SERIES A 283,275.32$ 283,278.81$ 283,235.95$ 66.23$ 0.09%
CCDL2011A CLEAN WATER COMPONENT 1,236,101.48$ 1,236,116.73$ 1,235,929.67$ 289.02$ 0.09%
Bond Proceeds Fund Totals 111,035,150.72$ 141,592,281.78$ 77,820,735.84$ 30,493.13$ 0.08%
TANS PROCEEDS -$ -$ -$ -$ 0.00%
Grand Totals 245,169,671.12$ 249,155,437.67$ 201,097,104.07$ 59,128.62$ 0.08%
50

Information Security Identification: Confidential
Section IX. Defined Contribution Plan
51

(A) (B) (C) (D) (E) (F) (G) (H) (I) (J) (K) (L) (M) (N) (O) (P) (Q) (R) (S) (T) (U) (V) (W) (X) (Y)
TIAA-CREF Manager AUM Gross Net Net Rev Recent Returns Annualized Total Returns as of 12/31/14 Since Incep. Sharpe Ratio Std. Deviation Tracking Error
As of 12/31/2014 Ticker Tenure $ Millions ER ER %-ile Share 1 Month YTD 1 Year %-ile 3 Year %-ile 5 Year %-ile 10 Year %-ile Incep. Date 3 Year %-ile 3 Year %-ile 3 Year
Stable Value/Guaranteed & Money Market
Stable Value/GuaranteedTIAA Stable Value**** Current crediting rate = 1.90% 0.16 1.95 1.95 1.87 03/31/12
Money Market
Vanguard Prime Money Market Inv VMMXX 11.50 132,691.53 0.16 0.16 0.00 - 0.01 0.01 0.02 0.04 1.63 5.38 06/04/75 (4.22) 0.01
Current 7-day Yield: 0.01
Citi 3-Month Treasury Bill - 0.03 0.03 0.05 0.07 1.46 FIXED INCOME
Intermediate-Term BondVanguard Total Bond Market Index Adm VBTLX 1.92 136,672.66 0.08 0.08 1 0.00 0.10 5.89 5.89 30 2.57 75 4.37 68 4.68 42 4.67 11/12/01 0.94 72 2.69 32 0.18
Barclays U.S. Aggregate Float Adjusted Index 0.08 5.85 5.85 2.68 4.48
Intermediate-Term Bond Median 0.90 0.80 (0.11) 5.46 5.46 3.36 4.80 4.55 1.14 2.81 1.02
Intermediate-Term Bond Number of Funds 1,086 1,086 1,038 914 808 589 914 914
Inflation-Linked Bond
PIMCO Real Return Instl PRRIX 7.08 14,091.62 0.47 0.45 17 0.00 (1.95) 3.42 3.42 12 0.91 4 4.33 2 4.68 3 6.57 01/29/97 0.17 10 6.03 94 1.11
Barclays US Treasury US TIPS TR USD (1.13) 3.64 3.64 0.44 4.11 4.37 0.10 5.23
Inflation-Protected Bond Median 0.87 0.75 (1.32) 2.34 2.34 (0.08) 3.35 3.65 (0.01) 5.01 0.77
Inflation-Protected Bond Number of Funds 230 230 219 192 153 88 193 193EquityLarge Cap Blend
Vanguard Institutional Index I VINIX 14.08 187,724.73 0.04 0.04 1 0.00 (0.26) 13.65 13.65 18 20.38 29 15.43 19 7.68 23 9.75 07/31/90 2.09 11 9.10 18 0.68
S&P 500 TR USD (0.25) 13.69 13.69 20.41 15.45 7.67 9.74 2.09 9.10
TIAA-CREF Social Choice Eq Instl TISCX 9.42 2,730.26 0.18 0.18 3 0.00 (0.11) 11.25 11.25 55 19.45 50 14.57 38 7.80 20 5.01 07/01/99 1.91 48 9.55 44 1.58
Russell 3000 TR USD - 12.56 12.56 20.51 15.63 7.94 5.17 2.03 9.42
Large Blend Median 1.21 1.10 (0.30) 11.62 11.62 19.45 14.02 7.06 1.89 9.67
Large Blend Number of Funds 1,664 1,664 1,568 1,336 1,193 812 1,343 1,343 Mid Cap Blend
Vanguard Mid Cap Index Adm VIMAX 16.67 58,927.75 0.09 0.09 1 0.00 0.27 13.76 13.76 5 21.27 20 17.04 10 9.47 9 10.45 11/12/01 1.90 16 10.48 27 0.87
Spliced Mid Cap Index * 0.27 13.83 13.83 21.32 17.10 9.50
CRSP US Mid Cap TR USD 0.27 13.83 13.83 21.57 17.36 9.50 10.62 2.09 9.10
Mid-Cap Blend Median 1.35 1.23 0.41 8.21 8.21 19.59 15.37 8.25 1.64 11.23 3.31
Mid-Cap Blend Number of Funds 379 379 369 311 268 167 312 312 Small Cap Blend
Vanguard Small Cap Index Adm VSMAX 23.08 50,472.59 0.09 0.09 1 0.00 1.25 7.50 7.50 13 20.55 20 16.87 17 9.13 13 9.32 11/13/00 1.62 10 12.03 22 2.61
Spliced Small Cap Index ** 1.25 7.54 7.54 20.53 16.83 9.06 CRSP US Small Cap TR USD 1.25 7.54 7.54 20.87 17.28 9.71 1.65 9.81 Small Blend Median 1.38 1.25 2.11 4.55 4.55 18.29 15.01 7.56 1.40 12.69Small Blend Number of Funds 792 792 737 624 567 362 624 624
2014 YTD Performance Summary
152
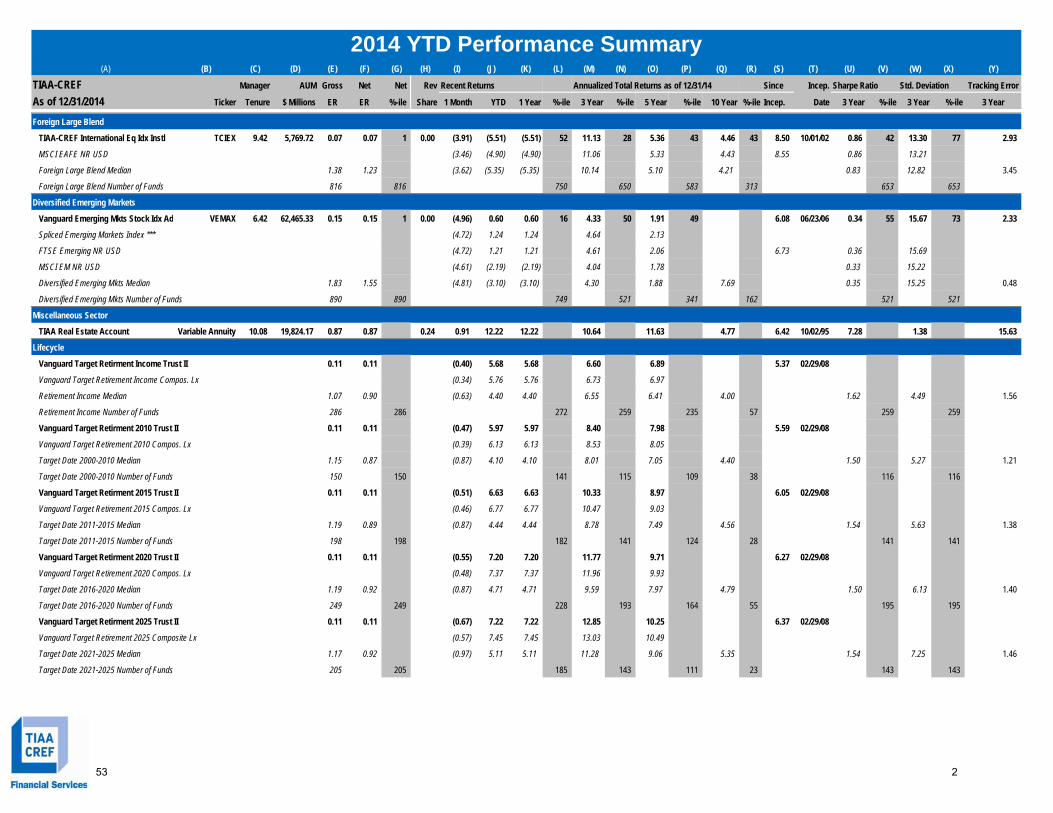
(A) (B) (C) (D) (E) (F) (G) (H) (I) (J) (K) (L) (M) (N) (O) (P) (Q) (R) (S) (T) (U) (V) (W) (X) (Y)
TIAA-CREF Manager AUM Gross Net Net Rev Recent Returns Annualized Total Returns as of 12/31/14 Since Incep. Sharpe Ratio Std. Deviation Tracking Error
As of 12/31/2014 Ticker Tenure $ Millions ER ER %-ile Share 1 Month YTD 1 Year %-ile 3 Year %-ile 5 Year %-ile 10 Year %-ile Incep. Date 3 Year %-ile 3 Year %-ile 3 Year
2014 YTD Performance Summary
Foreign Large Blend
TIAA-CREF International Eq Idx Instl TCIEX 9.42 5,769.72 0.07 0.07 1 0.00 (3.91) (5.51) (5.51) 52 11.13 28 5.36 43 4.46 43 8.50 10/01/02 0.86 42 13.30 77 2.93
MSCI EAFE NR USD (3.46) (4.90) (4.90) 11.06 5.33 4.43 8.55 0.86 13.21
Foreign Large Blend Median 1.38 1.23 (3.62) (5.35) (5.35) 10.14 5.10 4.21 0.83 12.82 3.45
Foreign Large Blend Number of Funds 816 816 750 650 583 313 653 653
Diversified Emerging Markets
Vanguard Emerging Mkts Stock Idx Ad VEMAX 6.42 62,465.33 0.15 0.15 1 0.00 (4.96) 0.60 0.60 16 4.33 50 1.91 49 6.08 06/23/06 0.34 55 15.67 73 2.33
Spliced Emerging Markets Index *** (4.72) 1.24 1.24 4.64 2.13
FTSE Emerging NR USD (4.72) 1.21 1.21 4.61 2.06 6.73 0.36 15.69
MSCI EM NR USD (4.61) (2.19) (2.19) 4.04 1.78 0.33 15.22
Diversified Emerging Mkts Median 1.83 1.55 (4.81) (3.10) (3.10) 4.30 1.88 7.69 0.35 15.25 0.48
Diversified Emerging Mkts Number of Funds 890 890 749 521 341 162 521 521
Miscellaneous Sector
TIAA Real Estate Account Variable Annuity 10.08 19,824.17 0.87 0.87 0.24 0.91 12.22 12.22 10.64 11.63 4.77 6.42 10/02/95 7.28 1.38 15.63
Lifecycle
Vanguard Target Retirment Income Trust II 0.11 0.11 (0.40) 5.68 5.68 6.60 6.89 5.37 02/29/08
Vanguard Target Retirement Income Compos. Lx (0.34) 5.76 5.76 6.73 6.97
Retirement Income Median 1.07 0.90 (0.63) 4.40 4.40 6.55 6.41 4.00 1.62 4.49 1.56
Retirement Income Number of Funds 286 286 272 259 235 57 259 259
Vanguard Target Retirment 2010 Trust II 0.11 0.11 (0.47) 5.97 5.97 8.40 7.98 5.59 02/29/08
Vanguard Target Retirement 2010 Compos. Lx (0.39) 6.13 6.13 8.53 8.05
Target Date 2000-2010 Median 1.15 0.87 (0.87) 4.10 4.10 8.01 7.05 4.40 1.50 5.27 1.21
Target Date 2000-2010 Number of Funds 150 150 141 115 109 38 116 116
Vanguard Target Retirment 2015 Trust II 0.11 0.11 (0.51) 6.63 6.63 10.33 8.97 6.05 02/29/08
Vanguard Target Retirement 2015 Compos. Lx (0.46) 6.77 6.77 10.47 9.03
Target Date 2011-2015 Median 1.19 0.89 (0.87) 4.44 4.44 8.78 7.49 4.56 1.54 5.63 1.38
Target Date 2011-2015 Number of Funds 198 198 182 141 124 28 141 141
Vanguard Target Retirment 2020 Trust II 0.11 0.11 (0.55) 7.20 7.20 11.77 9.71 6.27 02/29/08
Vanguard Target Retirement 2020 Compos. Lx (0.48) 7.37 7.37 11.96 9.93
Target Date 2016-2020 Median 1.19 0.92 (0.87) 4.71 4.71 9.59 7.97 4.79 1.50 6.13 1.40
Target Date 2016-2020 Number of Funds 249 249 228 193 164 55 195 195
Vanguard Target Retirment 2025 Trust II 0.11 0.11 (0.67) 7.22 7.22 12.85 10.25 6.37 02/29/08
Vanguard Target Retirement 2025 Composite Lx (0.57) 7.45 7.45 13.03 10.49
Target Date 2021-2025 Median 1.17 0.92 (0.97) 5.11 5.11 11.28 9.06 5.35 1.54 7.25 1.46
Target Date 2021-2025 Number of Funds 205 205 185 143 111 23 143 143
253

(A) (B) (C) (D) (E) (F) (G) (H) (I) (J) (K) (L) (M) (N) (O) (P) (Q) (R) (S) (T) (U) (V) (W) (X) (Y)
TIAA-CREF Manager AUM Gross Net Net Rev Recent Returns Annualized Total Returns as of 12/31/14 Since Incep. Sharpe Ratio Std. Deviation Tracking Error
As of 12/31/2014 Ticker Tenure $ Millions ER ER %-ile Share 1 Month YTD 1 Year %-ile 3 Year %-ile 5 Year %-ile 10 Year %-ile Incep. Date 3 Year %-ile 3 Year %-ile 3 Year
2014 YTD Performance Summary
Vanguard Target Retirment 2030 Trust II 0.11 0.11 (0.76) 7.22 7.22 13.90 10.80 6.44 02/29/08
Vanguard Target Retirement 2030 Composite Lx (0.67) 7.51 7.51 14.10 11.03
Target Date 2026-2030 Median 1.27 0.99 (1.01) 5.15 5.15 12.21 9.30 4.99 1.47 7.90 1.51
Target Date 2026-2030 Number of Funds 250 250 228 193 164 55 195 195
Vanguard Target Retirment 2035 Trust II 0.11 0.11 (0.88) 7.22 7.22 14.96 11.32 6.66 02/29/08
Vanguard Target Retirement 2035 Composite Lx (0.76) 7.57 7.57 15.18 11.55
Target Date 2031-2035 Median 1.22 0.96 (1.15) 5.36 5.36 13.35 10.09 5.63 1.50 8.56 1.56
Target Date 2031-2035 Number of Funds 205 205 185 143 111 23 143 143
Vanguard Target Retirment 2040 Trust II 0.11 0.11 (0.97) 7.26 7.26 15.56 11.63 6.91 02/29/08
Vanguard Target Retirement 2040 Composite Lx (0.85) 7.61 7.61 15.78 11.87
Target Date 2036-2040 Median 1.34 1.01 (1.16) 5.37 5.37 13.71 10.06 5.33 1.46 8.98 1.62
Target Date 2036-2040 Number of Funds 249 249 227 192 163 50 194 194
Vanguard Target Retirment 2045 Trust II 0.11 0.11 (0.97) 7.22 7.22 15.55 11.64 6.87 02/29/08
Vanguard Target Retirement 2045 Composite Lx (0.85) 7.61 7.61 15.78 11.87
Target Date 2041-2045 Median 1.35 0.99 (1.18) 5.54 5.54 14.36 10.60 6.13 1.49 9.21 1.46
Target Date 2041-2045 Number of Funds 205 205 185 134 110 13 134 134
Vanguard Target Retirment 2050 Trust II 0.11 0.11 (0.97) 7.23 7.23 15.54 11.62 6.90 02/29/08
Vanguard Target Retirement 2050 Composite Lx (0.85) 7.61 7.61 15.78 11.87
Target Date 2046-2050 Median 1.47 1.02 (1.19) 5.62 5.62 14.44 10.37 5.76 1.46 9.41 1.63
Target Date 2046-2050 Number of Funds 233 233 212 165 127 7 168 168
Vanguard Target Retirment 2055 Trust II 0.11 0.11 (0.97) 7.26 7.26 15.54 14.44 08/31/10
Vanguard Target Retirement 2055 Composite Lx (0.85) 7.61 7.61 15.78
Vanguard Target Retirment 2060 Trust II 0.11 0.11 (0.99) 7.22 7.22 12.69 03/01/12
Vanguard Target Retirement 2060 Composite Lx (0.85) 7.61 7.61
Target Date 2051+ Median 1.40 0.98 (1.18) 5.52 5.52 14.67 10.37 1.48 9.55 1.50
Target Date 2051+ Number of Funds 239 239 156 101 25 101 101
Source: Morningstar & TIAA-CREF -Tracking error calculated using "Morningstar Analyst Assigned Benchmark"
Since Incep. = Since Inception Date Incep. Date = Inception Date
Vanguard Index Information from available at http://www.vanguard.com
* = S&P MidCap 400 Index through May 16, 2003; the MSCI US Mid Cap 450 Index through January 30, 2013; and the CRSP US Mid Cap Index thereafter
** = Russell 2000 Index through May 16, 2003; the MSCI US Small Cap 1750 Index through January 30, 2013; and the CRSP US Small Cap Index thereafter
*** = Spliced Emerging Markets Index reflects performance of the Select Emerging Markets Index through August 23, 2006; the MSCI Emerging Markets Index through January 9, 2013; FTSE Emerging Transition Index through June 27, 2013;
and FTSE Emerging Index thereafter.
**** = The TIAA Stable Value Inception Date represents the date that the plan's TIAA Stable Value record was initiated on TIAA-CREF's recordkeeping system which may be earlier than the date of first deposit to the contract.
"Since Inception" performance is calculated from this date.
***** = For definitions please visit www.tiaa-cref.org/public/assetmanagement
Note: Rankings shown for returns are calculated by Morningstar. Rankings for expense ratio, Sharpe ratio and standard deviation are calculated by TIAA-CREF and may differ
based on calculation methods
Fee Disclosures: 1 The net expense ratio reflects total annual fund operating expenses excluding interest expense. Ifinterest expense was included, returns would have been lower.
2 Accumulations in mutual funds not managed by TIAA-CREF may be subject to administrative charges. These charges are subject to change. Please review current documents related to your plan. 354
Disclosures%-ile --> Percentile Ranking in Morningstar Category.
The performance data quoted represents past performance and is no guarantee of future results. Your returns and the principal value of your investments will fluctuate so that your shares or accumulation units, when redeemed, may be worth more or less than their original cost. Current performance may be lower or higher than the performance quoted below. For performance current to the most recent month‐end, visit the TIAA‐CREF Website at www.tiaa‐cref.org, or call 877 518‐9161.
Annuity account options are available through annuity contracts issued by TIAA or CREF. These contracts are designed for retirement or other long‐term goals, and offer a variety of income options, including lifetime income. Payments from the variable annuity accounts are not guaranteed and will rise or fall based on investment performance.
For the variable annuity accounts, we estimate expenses for the plan year based on projected expense and asset levels. Differences between estimated and actual expenses are adjusted quarterly and reflected in current investment results. Historically, the adjusting payments have resulted in both upward and downward adjustments.
Investing in non‐investment grade securities presents special risks, including significantly higher interest‐rate and credit risk.
Small‐cap and mid‐cap stocks may have limited marketability and may be subject to more abrupt or erratic market movements than large‐cap stocks.
The risks associated with foreign investments are often magnified in emerging markets where there is greater potential for political, currency, and economic volatility.
Funds that invest in fixed‐income securities are not guaranteed and are subject to interest‐rate, inflation and credit risks.
455

DisclosuresFunds that invest in fixed-income securities are not guaranteed and are subject to interest-rate, inflation and credit risks.
Funds that invest in foreign securities are subject to special risks, including currency fluctuation and political and economic instability.
Real estate securities are subject to various risks, including fluctuations in property values, higher expenses or lower income than expected, and potential environmental problems and liability.
Any guarantees under annuities issued by TIAA are subject to TIAA's claims-paying ability. TIAA Stable Value is guaranteed insurance contract and not an investment for Federal Securities Law purposes.
Target Date Funds share the risks associated with the types of securities held by each of the underlying funds in which they invest. In addition to the fees and expenses associated with the Target Date Funds, there is exposure to the fees and expenses associated with the underlying mutual funds as well.
TIAA-CREF Individual & Institutional Services, LLC, Teachers Personal Investors Services, Inc., and Nuveen Securities, LLC, Members FINRA and SIPC, distribute securities products. Annuity contracts and certificates are issued by Teachers Insurance and Annuity Association of America (TIAA) and College Retirement Equities Fund (CREF), New York, NY. Each is solely responsible for its own financial condition and contractual obligations.
Investment, insurance and annuity products are not FDIC insured, are not bank guaranteed, are not deposits, are not insured by any federal government agency, are not a condition to any banking service or activity, and may lose value.
You should consider the investment objectives, risks, charges and expenses carefully before investing. Please call 877 518-9161 or log on to tiaacref.org for product and fund prospectuses that contains this and other information. Please read the prospectuses carefully before investing.
556

DisclosuresMorningstar is an independent service that rates mutual funds and variable annuities, based on risk‐adjusted returns. Although Morningstar data is gathered from reliable sources, neither Morningstar nor TIAA‐CREF can guarantee its completeness and accuracy. Morningstar does not rate money market accounts, and the other TIAA‐CREF mutual fund accounts are too new to be rated. Past performance does not guarantee future results. Accumulation net asset values and returns will vary.
For each fund/account with at least a three‐year history, Morningstar calculates a Morningstar Rating™ based on a Morningstar Risk‐Adjusted Return measure that accounts for variation in a fund's/account's monthly performance (including the effects of sales charges, loads, and redemption fees), placing more emphasis on downward variations and rewarding consistent performance. Where applicable, Morningstar's performance rankings are based on linked performance that considers the differences in expense ratios, while actual performance data shown does not reflect such differences. The top 10 percent of funds/accounts in a category receive five stars, the next 22.5 percent receive four stars, and the next 35 percent receive three stars, the next 22.5 percent receive two stars and the bottom 10 percent receive one star. (Each share class is counted as a fraction of one fund/account within this scale and rated separately, which may cause slight variations in the distribution percentages.) Morningstar proprietary ratings on U.S.‐domiciled funds/accounts reflect historical risk‐adjusted performance, are subject to change every month. They are derived from a weighted average of the performance figures associated with its three‐, five‐ and ten‐year (if applicable) Morningstar Rating metrics. Please note, Morningstar now rates group variable annuities within the open‐end mutual fund universe.
657

Disclosures
Prospectus Gross Expense Ratio The percentage of fund assets used to pay for operating expenses and management fees, including 12b‐1 fees, administrative fees, and all other asset‐based costs incurred by the fund, except brokerage costs. Fund expenses are reflected in the fund's NAV. Sales charges are not included in the expense ratio.‐‐The expense ratio for fund of funds is the aggregate expense ratio as defined as the sum of the wrap or sponsor fees plus the estimated weighted average of the underlying fund fees. ‐‐Often referred to as the Annual Operating Expense, the Prospectus Gross Expense Ratio is collected annually from a fund's prospectus.
Prospectus Net Expense RatioThe percentage of fund assets, net of reimbursements, used to pay for operating expenses and management fees, including 12b‐1 fees, administrative fees, and all other asset‐based costs incurred by the fund, except brokerage costs. Fund expenses are reflected in the fund's NAV. Sales charges are not included in the expense ratio.‐‐The expense ratio for fund of funds is the aggregate expense ratio as defined as the sum of the wrap or sponsor fees plus the estimated weighted average of the underlying fund fees. ‐‐Net reimbursements, the Prospectus Net Expense Ratio is collected annually from a fund's prospectus.‐‐TIAA‐CREF, unless noted, does not charge additional fees for record keeping a fund. 12b‐1, revenue share and admin fees are all included in the Prospectus fees.‐‐ Prospectus Net Expense Ratio % ‐ ile rank is the percentile rank for the fund. The better the expense ratio (lower) the lower the ranking out of 100.
Sharpe Ratio (Source: Morningstar Direct)A risk‐adjusted measure developed by Nobel Laureate William Sharpe. It is calculated by using standard deviation and excess return to determine reward per unit of risk. The higher the Sharpe Ratio, the better the portfolio’s historical risk‐adjusted performance. The Sharpe Ratio can be used to compare two portfolios directly with regard to how much excess return each portfolio achieved for a certain level of risk. Morningstar first calculates a monthly Sharpe Ratio and then annualizes it to put the number in a more useful one‐year context.
758

DisclosuresStandard Deviation (Source: Morningstar Direct) The statistical measurement of dispersion about an average, which depicts how widely a stock or portfolio's returns varied over a certain period of time. Investors use the standard deviation of historical performance to try to predict the range of returns that is most likely for a given investment. When a stock or portfolio has a high standard deviation, the predicted range of performance is wide, implying greater volatility.Information Ratio (Source: Morningstar Direct) Benchmark SpecificInformation ratio is a risk‐adjusted performance measure. The information ratio is a special version of the Sharpe Ratio in that the benchmark doesn't have to be the risk‐free rate.Beta (Source: Morningstar Direct) Benchmark SpecificBeta is a measure of a portfolio's sensitivity to market movements. The beta of the market is 1.00 by definition.Alpha (Source: Morningstar Direct) Benchmark SpecificA measure of the difference between a portfolio’s actual returns and its expected performance, given its level of risk as measured by beta. A positive Alpha figure indicates the portfolio has performed better than its beta would predict. In contrast, a negative Alpha indicates the portfolio has underperformed, given the expectations established by beta.Tracking Error (Source: Morningstar Direct) Benchmark SpecificTracking error is a measure of the volatility of excess returns relative to a benchmark.Upside (Source: Morningstar Direct) Benchmark SpecificUpside Capture Ratio measures a manager's performance in up markets relative to the market (benchmark) itself. It is calculated by taking the security’s upside capture return and dividing it by the benchmark’s upside capture return.Downside (Source: Morningstar Direct) Benchmark SpecificDownside Capture Ratio measures a manager's performance in down markets relative to the market (benchmark) itself. It is calculated by taking the security’s downside capture return and dividing it by the benchmark’s downside capture return.R‐Square (Source: Morningstar Direct) Benchmark SpecificReflects the percentage of a portfolio's movements that can be explained by movements in its benchmark.
You cannot invest directly in index.
TIAA‐CREF reported performance may differ from Morningstar source returns for thesame option over the same time period. We would expect an occasional one to two basis point difference. Morningstar Direct calculates returns by one share owned by a hypothetical investor over the requested time period. So the return for one year is calculated using the same formula as one month. TIAA‐CREF calculates returns by $1,000 owned by hypothetical investor for one month then links returns for requested time period. Both set of returns include dividends and capital gains. C12205
859

Information Security Identification: Confidential
Section X. 457 Plans
60

Plan Provider 3/31/2014 6/30/2014 9/30/2014 12/31/2014
Valic 54,006,256.15$ $55,249,741.79 54,973,099.24$ 55,843,317.59$ Fidelity 103,233,672.83$ 107,320,669.62$ $107,450,479.38 $110,004,991.94ING/Voya 134,348,166.52$ 138,560,343.36$ 139,389,789.78$ 143,076,082.10$
Total 291,588,095.50$ 301,130,754.77$ 301,813,368.40$ 308,924,391.63$
State of Rhode Island Total Assets 457 Plans
61

Monthly Plan Performance UpdateSTATE OF RHODE ISLAND - STATE OF RI (35835)
DOW JONES 30 INDUSTRIALAVERAGE
12/31/2014 0.12 5.20 10.04 12/31/2014 10.04 16.29 14.22 7.91
BARCLAYS CAPITAL U.S.AGGREGATE BOND INDEX
12/31/2014 0.09 1.79 5.97 12/31/2014 5.97 2.66 4.45 4.71
NASDAQ COMPOSITE INDEX 12/31/2014 -1.09 5.70 14.75 12/31/2014 14.75 23.60 17.19 9.15
RUSSELL 2000 INDEX 12/31/2014 2.85 9.73 4.89 12/31/2014 4.89 19.21 15.55 7.77
STANDARD & POOR'S 500 ™INDEX
12/31/2014 -0.25 4.93 13.69 12/31/2014 13.69 20.41 15.45 7.67
FID BLUE CHIP GR 12/31/2014 -0.53 5.37 14.60 12/31/2014 14.60 23.58 17.04 9.15 11.47 — 0.80% on09/29/2014
12/31/1987
FID CONTRAFUND 12/31/2014 -0.53 3.12 9.56 12/31/2014 9.56 19.55 14.81 9.66 12.52 — 0.67% on03/01/2014
05/17/1967
FID CONTRAFUND K 12/31/2014 -0.51 3.15 9.68 12/31/2014 9.68 19.69 14.95 9.76 12.54 — 0.56% on03/01/2014
05/17/1967
FID DIVIDEND GR 12/31/2014 -0.67 3.98 11.87 12/31/2014 11.87 20.46 14.15 7.19 11.02 — 0.56% on09/29/2014
04/27/1993
FID EQUITY INC 12/31/2014 -0.68 1.96 8.68 12/31/2014 8.68 17.61 12.29 5.66 11.60 — 0.66% on04/01/2014
05/16/1966
FID GROWTH & INC 12/31/2014 -0.87 3.27 10.38 12/31/2014 10.38 20.60 15.30 3.50 10.14 — 0.66% on09/29/2014
12/30/1985
FID LARGE CAP STOCK 12/31/2014 -0.78 2.85 10.13 12/31/2014 10.13 22.79 16.58 8.86 8.61 — 0.88% on06/28/2014
06/22/1995
FID MAGELLAN 12/31/2014 -0.10 5.16 14.08 12/31/2014 14.08 22.12 12.61 5.77 16.31 — 0.53% on05/30/2014
05/02/1963
FID NEW MILLEN 12/31/2014 -0.54 2.11 6.96 12/31/2014 6.96 19.28 15.65 9.70 13.90 — 0.91% on01/29/2014
12/28/1992
FID OTC PORTFOLIO 12/31/2014 -0.61 5.81 16.49 12/31/2014 16.49 23.84 17.84 11.59 13.52 — 0.77% on09/29/2014
12/31/1984
INVS DIVRS DIVD INV 12/31/2014 0.18 5.59 12.09 12/31/2014 12.09 19.21 14.26 8.07 8.18 — 0.89% on02/28/2014
07/15/2005
INVS DIVRS DIVD R5 12/31/2014 0.18 5.65 12.32 12/31/2014 12.32 19.55 14.61 8.33 9.11 — 0.60% on02/28/2014
10/25/2005
Page 1 of 462

SPTN 500 INDEX ADV 12/31/2014 -0.26 4.91 13.62 12/31/2014 13.62 20.36 15.40 7.64 10.27 — 0.07% on04/29/2014
02/17/1988
SPTN 500 INDEX INST 12/31/2014 -0.24 4.93 13.65 12/31/2014 13.65 20.37 15.42 7.65 10.28 — 0.05% on04/29/2014
02/17/1988
SPTN 500 INDEX INV 12/31/2014 -0.26 4.91 13.59 12/31/2014 13.59 20.31 15.36 7.61 10.26 — 0.10% on04/29/2014
02/17/1988
FID LOW PRICED STK 12/31/2014 0.36 4.18 7.65 12/31/2014 7.65 19.66 15.63 9.25 14.46 1.5 % /90days
0.82% on09/29/2014
12/27/1989
FID LOW PRICED STK K 12/31/2014 0.36 4.19 7.75 12/31/2014 7.75 19.79 15.76 9.34 14.49 1.5 % /90days
0.72% on09/29/2014
12/27/1989
FID MID CAP STOCK 12/31/2014 0.11 4.10 7.11 12/31/2014 7.11 19.60 15.59 9.23 11.87 .75 % /30days
0.81% on06/28/2014
03/29/1994
FID VALUE 12/31/2014 0.54 5.57 11.72 12/31/2014 11.72 23.13 16.32 8.23 12.68 — 0.76% on12/30/2014
12/01/1978
FKLN SMMIDCAP GRTH A 12/31/2014 -0.43 4.97 7.53 12/31/2014 7.53 18.19 15.06 8.22 10.84 — 0.96% on09/01/2014
02/14/1992
SPTN MID CAP IDX ADV 12/31/2014 0.22 5.94 13.14 12/31/2014 13.14 21.30 — — 20.66 .75 % /30days
0.21% on06/28/2014
09/08/2011
SPTN SM CAP IDX ADV 12/31/2014 2.87 9.81 5.09 12/31/2014 5.09 19.32 — — 19.76 1.5 % /90days
0.34% on06/28/2014
09/08/2011
FID DIVERSIFD INTL 12/31/2014 -2.64 -1.11 -3.20 12/31/2014 -3.20 13.11 6.47 5.11 8.61 1 % /30days
0.91% on12/30/2014
12/27/1991
HARBOR INTL INST 12/31/2014 -4.65 -4.05 -6.81 12/31/2014 -6.81 9.59 5.54 7.35 11.38 — 0.76% on03/01/2014
12/29/1987
HARBOR INTL INV 12/31/2014 -4.68 -4.15 -7.16 12/31/2014 -7.16 9.17 5.15 6.94 10.44 — 1.13% on03/01/2014
11/01/2002
SPTN INTL INDEX ADV 12/31/2014 -3.74 -4.01 -5.37 12/31/2014 -5.37 11.04 5.32 4.49 4.81 1 % /90days
0.17% on04/29/2014
11/05/1997
TEMPLETON FOREIGN A 12/31/2014 -4.11 -9.60 -10.80 12/31/2014 -10.80 10.38 4.96 4.81 10.72 — 1.16% on01/01/2014
10/05/1982
FID FREEDOM 2010 12/31/2014 -0.76 1.47 4.84 12/31/2014 4.84 8.75 7.44 5.21 6.72 — 0.61% on05/30/2014
10/17/1996
FID FREEDOM 2020 12/31/2014 -0.87 1.76 5.34 12/31/2014 5.34 10.05 8.23 5.42 6.90 — 0.67% on05/30/2014
10/17/1996
FID FREEDOM 2030 12/31/2014 -1.06 1.98 5.67 12/31/2014 5.67 12.31 9.36 5.63 6.86 — 0.77% on05/30/2014
10/17/1996
FID FREEDOM INCOME 12/31/2014 -0.54 1.12 3.86 12/31/2014 3.86 4.93 4.88 4.12 5.00 — 0.49% on05/30/2014
10/17/1996
FID FREEDOM K 2005 12/31/2014 -0.65 1.32 4.57 12/31/2014 4.57 7.15 6.43 — 8.72 — 0.50% on05/30/2014
07/02/2009
FID FREEDOM K 2010 12/31/2014 -0.71 1.51 4.93 12/31/2014 4.93 8.85 7.55 — 9.93 — 0.53% on05/30/2014
07/02/2009
Page 2 of 463

FID FREEDOM K 2015 12/31/2014 -0.73 1.65 5.25 12/31/2014 5.25 9.30 7.81 — 10.30 — 0.55% on05/30/2014
07/02/2009
FID FREEDOM K 2020 12/31/2014 -0.88 1.74 5.40 12/31/2014 5.40 10.15 8.33 — 11.26 — 0.57% on05/30/2014
07/02/2009
FID FREEDOM K 2025 12/31/2014 -0.86 1.92 5.75 12/31/2014 5.75 11.79 9.18 — 12.26 — 0.61% on05/30/2014
07/02/2009
FID FREEDOM K 2030 12/31/2014 -1.00 2.05 5.86 12/31/2014 5.86 12.45 9.49 — 12.79 — 0.65% on05/30/2014
07/02/2009
FID FREEDOM K 2035 12/31/2014 -1.10 2.05 5.88 12/31/2014 5.88 13.61 9.94 — 13.34 — 0.66% on05/30/2014
07/02/2009
FID FREEDOM K 2040 12/31/2014 -1.12 2.01 5.88 12/31/2014 5.88 13.74 10.00 — 13.50 — 0.66% on05/30/2014
07/02/2009
FID FREEDOM K 2045 12/31/2014 -1.10 2.02 5.90 12/31/2014 5.90 14.05 10.14 — 13.68 — 0.66% on05/30/2014
07/02/2009
FID FREEDOM K 2050 12/31/2014 -1.05 2.12 5.96 12/31/2014 5.96 14.23 10.14 — 13.77 — 0.65% on05/30/2014
07/02/2009
FID FREEDOM K 2055 12/31/2014 -1.13 2.01 5.99 12/31/2014 5.99 14.51 — — 8.75 — 0.66% on05/30/2014
06/01/2011
FID FREEDOM K INCOME 12/31/2014 -0.53 1.09 3.96 12/31/2014 3.96 4.97 4.93 — 6.32 — 0.44% on05/30/2014
07/02/2009
FID PURITAN 12/31/2014 -0.24 3.04 10.75 12/31/2014 10.75 14.89 11.73 7.14 11.11 — 0.56% on10/30/2014
04/16/1947
MIP II CL 1 12/31/2014 0.11 0.31 1.16 12/31/2014 1.16 1.20 1.33 2.43 4.11 — 0.59% on09/30/2014
04/20/1993
PIM TOTAL RT INST 12/31/2014 -0.48 1.32 4.69 12/31/2014 4.69 4.26 5.14 5.99 7.83 — 0.46% on10/21/2014
05/11/1987
PIMCO TOT RETURN ADM 12/31/2014 -0.51 1.26 4.43 12/31/2014 4.43 4.00 4.87 5.72 6.81 — 0.71% on10/21/2014
09/08/1994
SPTN US BOND IDX ADV 12/31/2014 0.02 1.73 5.93 12/31/2014 5.93 2.56 4.31 4.37 6.49 — 0.17% on10/30/2014
03/08/1990
FID RETIRE MMKT 12/31/2014 0 0 0.01 12/31/2014 0.01 0.01 0.01 1.63 3.49 — 0.42% on10/30/2014
12/02/1988
BROKERAGELINK — — — — — — — — — — — — —
† For Fidelity fund of funds the performance table displays both the Expense Ratio and the Combined Total Expense Ratio. Expense Ratio is the total annual fund operatingexpense ratio from the fund's most recent prospectus. Combined Total Expense Ratio reflects expense reimbursements and reductions and is based on the total operatingexpense ratio of the fund plus a weighted average of the total operating expense ratios of the underlying Fidelity funds in which it was invested. This ratio may be higher orlower depending on the allocation of the fund's assets among the underlying Fidelity funds and the actual expenses of the underlying Fidelity funds.
† Expense Ratio is the total annual fund operating expense ratio from the fund's most recent prospectus. Please note that for the non-Fidelity fund-of-funds listed, the ratio
Page 3 of 464

shown may solely reflect the total operating expense ratio of the fund, or may be a combined ratio reflecting both the total operating expense ratio of the fund and the totaloperating expense ratios of the underlying funds in which it was invested. Please consult the fund's prospectus for more detail on a particular fund's expense ratio.
Total returns are historical and include change in share value and reinvestment of dividends and capital gains, if any. Cumulative total returns are reported as of the periodindicated. Life of Fund figures are reported as of the inception date to the period indicated. These figures do not include the effect of sales charges, if any, as these charges arewaived for contributions made through your company's employee benefit plans. If sales charges were included, returns would have been lower.
The management company may be temporarily reimbursing a portion of the fund's expenses. Absent such reimbursement, returns and yields would have been lower. A fund'sexpense limitation may be terminated at any time. Please see the prospectus for further information.
AN INVESTMENT IN A MONEY MARKET FUND IS NOT INSURED OR GUARANTEED BY THE FDIC OR ANY OTHER GOVERNMENT AGENCY. ALTHOUGH MONEY MARKETFUNDS SEEK TO PRESERVE THE VALUE OF YOUR INVESTMENT AT $1 PER SHARE, IT IS POSSIBLE TO LOSE MONEY BY INVESTING IN THESE FUNDS.
A money market fund's current yield reflects the current earnings of the fund while the total return refers to a specific past holding period.
Performance of an index is not illustrative of any particular investment and an investment cannot be made directly in an index.
The NASDAQ Composite® Index is an unmanaged market capitalization-weighted index of the National Market System which includes over 5,000 stocks traded onlyover-the-counter and not on an exchange.
The Dow Jones Industrial Average (DJIA) is an unmanaged price-weighted index and is the most widely used indicator of how the country's industrial leaders are performing.Also known as "the Dow," this is a formula based on the stock prices of 30 major companies chosen from sectors of the economy most representative of our country'seconomic condition.
The Russell 2000® Index is an unmanaged market capitalization-weighted index of 2,000 small company stocks of U.S. domiciled companies.
The S&P 500® Index is a registered service mark of The McGraw-Hill Companies, Inc., and has been licensed for use by Fidelity Distributors Corporation and its affiliates. It isan unmanaged index of the common stock prices of 500 widely held U.S. stocks that includes the reinvestment of dividends.
The Lehman Brothers Aggregate Bond Index is an unmanaged market value-weighted index for investment-grade fixed-rate debt issues, including government, corporate,asset-backed, and mortgage-backed securities with maturities of at least one year.
Because of their narrow focus, sector funds may be more volatile than funds that diversify across many sectors.
Investments in mortgage securities are subject to prepayment risk, which can limit the potential for gain during a declining interest rate environment and increase the potentialfor loss in a rising interest rate environment.
Lower-quality debt securities involve greater risk of default and/or price changes due to changes in the credit quality of the issuer.
Investments in smaller companies may involve greater risks than those of larger, more well-known companies.
Foreign investments, especially those in emerging markets involve greater risk and may offer greater potential returns than U.S. investments. This risk includes political andeconomic uncertainties of foreign countries, as well as the risk of currency fluctuations.
Strategic Advisers, Inc., a subsidiary of FMR LLC, manages the Fidelity Freedom Funds.
BEFORE INVESTING IN ANY INVESTMENT OPTION, PLEASE CAREFULLY CONSIDER THE INVESTMENT OBJECTIVES, RISKS, CHARGES AND EXPENSES. FOR THIS ANDOTHER INFORMATION, PLEASE CALL FIDELITY AT 1-800-343-0860 OR VISIT WWW.FIDELITY.COM FOR A FREE MUTUAL FUND PROSPECTUS OR VARIABLE ANNUITYPROSPECTUS. FOR INFORMATION ON FIXED ANNUITIES, CONTACT FIDELITY TO REQUEST A FACT SHEET. READ THEM CAREFULLY BEFORE YOU INVEST.
Brokerage Products and Services are offered through Fidelity Brokerage Services, Member NYSE, SIPC. Investment and workplace savings plan products and services offereddirectly to investors and plan sponsors are provided by Fidelity Brokerage Services, Member NYSE, SIPC, 900 Salem Street, Smithfield, RI 02917. Investment and workplacesavings plan products and services distributed through investment professionals are provided by Fidelity Investments Institutional Services Company, Inc., 100 Salem Street,Smithfield, RI 02917.
© 2013 FMR LLC. All rights reserved. The trademarks and service marks appearing herein are the property of their respective owners.
Page 4 of 465

STATE OF RHODE ISLANDMUTUAL FUND SELECTION The information is current as of 12/31/2014.
VALIC
Category/Funds YTD 1 Year Return
3 Year Return
5 Year Return
10 Year Return
Since Inception
Expense Ratio
Inception Date
Foreign Large Blend
American Funds EuroPacific Growth -2.66% -2.66% 11.72% 5.68% 6.69% 8.31% 0.84% 6/7/2002MSCI ACWl Ex USA GR USD -3.87% 8.99% 4.43% 5.13%
Small Blend
Dreyfus Small Cap Stock Index 5.41% 5.41% 19.84% 16.95% 8.78% 9.02% 0.50% 6/30/1997S&P Small/Cap 600 TR USD 5.76% 20.24% 17.27% 9.02%
Mid-Cap Blend
Dreyfus Midcap Index 9.37% 9.37% 19.42% 15.99% 9.24% 11.95% 0.50% 6/19/1991Standard & Poor's Midcap 400 9.77% 19.99% 16.54% 9.71%
Large Growth
MFS Mass Investors Growth Stock (A) 11.49% 11.49% 19.27% 14.46% 8.04% 8.25% 0.75% 4/1/2005Russell 1000 Growth 13.05% 20.26% 15.81% 8.49%
Large Blend
Vanguard Dividend Growth Inv 11.85% 11.85% 17.54% 14.64% 9.12% 8.25% 0.31% 5/15/1992Russell 1000 13.20% 20.62% 15.64% 7.96%
Vanguard 500 Index (Signal) 13.64% 13.64% 20.37% 5.42% 7.66% 7.27% 0.05% 9/29/2006Standard & Poor's 500 12.99% 19.64% 14.73% 7.00%
Target Date 2050+
Vanguard Target Retirement 2060 Inv 7.16% 7.16% N/A N/A N/A 14.54% 0.18% 1/19/2012DJ Targer 2055 TR USD 6.19% N/A N/A N/A
Target Date 2046-2050
Vanguard Target Retirement 2050 Inv 7.18% 7.18% 15.49% 11.58% N/A 6.85% 0.18% 6/7/2006DJ Target 2050 TR USD 6.19% 14.91% 11.43% N/A
Target Date 2036-2040
Vanguard Target Retirement 2040 Inv 7.15% 7.15% 15.48% 11.57% N/A 6.79% 0.18% 6/7/2006DJ Target 2040 TR USD 6.03% 14.23% 11.08% N/A
Target Date 2026-2030
Vanguard Target Retirement 2030 Inv 7.17% 7.17% 13.84% 10.76% N/A 6.53% 0.17% 6/7/2006DJ Target 2030 TR USD 5.50% 11.45% 9.61% N/A
Target Date 2016-2020
Vanguard Target Retirement 2020 Inv 7.11% 7.11% 11.71% 9.67% N/A 6.43% 0.16% 6/7/2006DJ Target 2020 TR USD 4.81% 7.68% 7.44% N/A
Target Date 2000-2010
Vanguard Target Retirement 2010 Inv 5.93% 5.93% 8.37% 7.95% N/A 5.96% 0.16% 6/7/2006DJ Target 2010 TR USD 4.20% 4.53% 5.54% N/A
High Yield Bond
Federated Instl High Yield Bond Instl 3.08% 3.08% 8.40% 9.09% 7.76% 9.85% 0.50% 11/1/2002Barclays US High Yield 2% Issuer 2.46% 8.42% 8.98% 7.73%
Inflation-Protected Bond
American Century Inflation-Adjusted Bond Inv 2.67% 2.67% -0.15% 3.48% 3.98% 5.42% 0.47% 2/10/1997
Barclays Capital U.S. Treasury TIPS 3.64% 0.44% 4.11% 4.37%
Intermediate-Term Bond
PIMCO Total Return (A) 4.29% 4.29% 3.85% 4.72% 5.53% 6.34% 0.85% 1/13/1997
Barclays Capital U.S. Aggregate Bond 5.97% 2.66% 4.45% 4.71%66
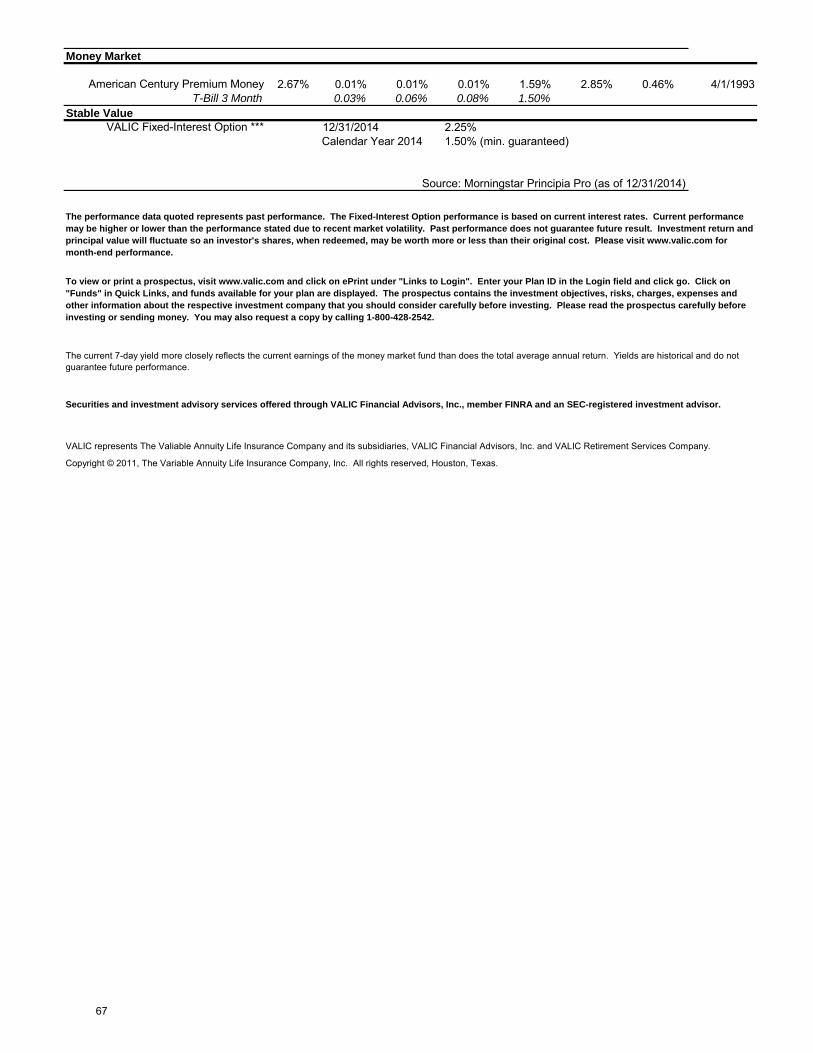
Money Market
American Century Premium Money 2.67% 0.01% 0.01% 0.01% 1.59% 2.85% 0.46% 4/1/1993T-Bill 3 Month 0.03% 0.06% 0.08% 1.50%
Stable Value VALIC Fixed-Interest Option *** 12/31/2014 2.25%
Calendar Year 2014 1.50% (min. guaranteed)
VALIC represents The Valiable Annuity Life Insurance Company and its subsidiaries, VALIC Financial Advisors, Inc. and VALIC Retirement Services Company.
Source: Morningstar Principia Pro (as of 12/31/2014)
The performance data quoted represents past performance. The Fixed-Interest Option performance is based on current interest rates. Current performance may be higher or lower than the performance stated due to recent market volatility. Past performance does not guarantee future result. Investment return and principal value will fluctuate so an investor's shares, when redeemed, may be worth more or less than their original cost. Please visit www.valic.com for month-end performance.
To view or print a prospectus, visit www.valic.com and click on ePrint under "Links to Login". Enter your Plan ID in the Login field and click go. Click on "Funds" in Quick Links, and funds available for your plan are displayed. The prospectus contains the investment objectives, risks, charges, expenses and other information about the respective investment company that you should consider carefully before investing. Please read the prospectus carefully before investing or sending money. You may also request a copy by calling 1-800-428-2542.
The current 7-day yield more closely reflects the current earnings of the money market fund than does the total average annual return. Yields are historical and do not guarantee future performance.
Securities and investment advisory services offered through VALIC Financial Advisors, Inc., member FINRA and an SEC-registered investment advisor.
Copyright © 2011, The Variable Annuity Life Insurance Company, Inc. All rights reserved, Houston, Texas.
67

The information is current as of 12/31/2014.
Effective December 31, 2001, all future contributions for all existing and new participants will be directed to VALIC for investment into the mutual fund and fixed-interest option investments. All VALIC annuity investment options will be closed to current or future Plan participants after this date.
Category/Funds YTD Return
1 Year Return
3 Year Return
5 Year Return
10 Year Return
Since Inception
Expense Ratio ITD Date
Domestic Equity
Large Cap Value
Dividend Value Fund (Black Rock/SunAmerica) 8.35 8.35 16.01 13.64 5.52 5.52 1.63 12/8/2000Vanguard Windsor II Fund 10.00 10.00 18.00 12.82 6.08 6.08 1.41 6/24/1985
Large Cap Blend
Core Equity Fund (Black Rock) 10.64 10.64 18.80 13.13 5.15 5.15 1.73 4/29/1994Stock Index Fund (SunAmerica) 12.38 12.38 19.02 14.15 6.47 6.47 1.15 4/20/1987
Large Cap Growth
Growth Fund (American Century) 9.85 9.85 17.65 13.50 6.16 6.16 1.61 12/5/2005Large Capital Growth Fund (SunAmerica/Invesco) 10.56 10.56 17.19 11.42 5.60 5.60 1.56 12/20/2004
Domestic Mid Cap EquityMid Cap
Mid Cap Strategic Growth Fund (Allianz Global/MorganStanley) 2.40 2.40 15.12 12.05 7.27 7.27 1.62 12/20/2004
Global EquityGlobal Social Awareness Fund (PineBridge Investments) 7.11 7.11 16.80 10.55 4.63 4.63 1.44 10/2/1989
Emerging Economies Fund (JPMorgan) -6.32 -6.32 2.15 0.29 -0.91 -0.91 1.75 12/5/2005Foreign Value Fund (Templeton Global) -12.34 -12.34 8.95 3.56 2.87 2.87 1.60 12/5/2005
SpecialityScience & Technology Fund (T. Rowe/Allianz Global/Wellington) 13.52 13.52 21.30 15.06 8.35 8.35 1.79 4/29/1994
HybridLifestyle
Dynamic Allocation (AllianceBernstein/SunAmerica) 3.41 3.41 - - 9.49 9.49 1.74 12/19/2012Balanced
Vanguard Wellington Fund 8.68 8.68 12.75 10.09 6.84 6.84 1.31 7/1/1929Fixed IncomeInvestment Grade
Vanguard Long-Term Investment-Grade Fund 17.22 17.22 6.30 9.13 6.46 6.46 1.02 7/9/1973Vanguard Long-Term Treasury Fund 24.28 24.28 3.24 8.81 6.38 6.38 1.00 5/19/1986
International
International Government Bond Fund (PineBridge) 0.56 0.56 0.49 2.44 3.28 4.24 1.45 10/1/1991Stable Value
Money Market I Fund (SunAmerica) -0.79 -0.79 -0.79 -0.79 0.64 0.64 1.31 1/16/19867-Day current yield at 30-Sep-2009: -0.79
Fixed Account Plus 2.32 2.32 2.45 2.86 3.92 3.92 1/1/1982Short Term Fixed Account 1.00 1.00 1.00 1.20 2.10 2.10 1/1/1991
# This fund closed to new deposits effective 2/12/2010.
~ Effective 10/01/2011, the Global Equity Fund [87] was renamed Emerging Economies Fund and has a new investment strategy that focuses primarily on companies domiciled in emerging markets countries. The new sub-advisor to the fund is JP Morgan. Performance as of 9/30/2011 and prior is attributable to the Global Equity Fund.
Fixed Account Plus contributions received and deposited during a given month will earn that month's current interest rate for the remainder of that calendar year (for all contact series except 7.0, 7.20, 12.0, 12.40, and 13.20). VALIC intends (though does not guarantee) to pay this same interest rate for those deposits and transfers through the end of the following calendar year. The current interest rate may differ from month to month.
*Performance numbers for Fixed Account Plus and Short Term Fixed are based on annualized returns.
Returns for fixed options were calculated assuming a lump-sum deposit on the first day of each period and interest credited to the account according to VALIC's interest crediting policy. Equivalent rates were used, even though the contract may not have been available for sale during all periods shown.
Applicable to Portfolio Director Fixed and Variable Policy Form series UIT-194, UTIG-194, UTIG-194P, and UITN-194.
All Short-Term Fixed Account deposits will earn the annual declared interest rate for the remainder of that calendar year. Interest is credited daily and subject to the claims-paying ability of the insurance company. Please refer to your contract for the minimum guaranteed rate. VALIC's interest-crediting policy is subject to change. Premium taxes will be deducted when required by state law.
All Fixed Account Plus deposits for series 7.0, 7.20, 7.40, 12.0, 12.20, 1240, and 13.20 willl earn the monthly declared interest rate until that rate is changed. The interest rate for the Short-Term Fixed Account is declared annually in January.
Domestic Large Cap Equity
International Equity
Retirement plans and accounts that satisfy relevant qualification rules, such as 403(b)s, IRAs, 401(k)s, etc., can be tax deferred regardless of whether or not they are funded with an annuity. If you are considering funding a tax-qualified retirement plan or account with an annuity, you should know that an annuity does not provide any additional tax-deferred treatment of earnings beyond the tax deferral of the tax-qualified retirement plan or account itself. However, annuities do provide other features and benefits.
An investment in money market funds is not insured or guaranteed by the Federal Deposit Insurance Corporation or any other government agency. Although the funds seek to preserve the value of your investment at $1.00 per share, it is possible to lose money by investing in the funds.
Bear in mind that annuities also provide additional features and benefits, including, but not limited to a guaranteed death benefit and guaranteed lifetime income options, for which a Separate Account fee is charged. Annuities are long-term investments. Income taxes are payable upon withdrawal. Federal restrictions and tax penalties may apply to early withdrawals prior to age 59 1/2.
Returns reflect overall changes in accumulation unit value from the beginning to the end of the periods shown, after deduction of fund expenses. Figures on pages 3 & 4 do not reflect deduction of account maintenance fees, surrender charges, premium taxes or IncomeLOCK fees, if applicable. Separate Account expenses are deducted only from variable options. The expenses are calculated each day and are based on the average daily net asset value of each option at the Separate Account level. The expenses are annualized at 0.35% to 1.25%, depending on the variable option and contract. Returns for periods prior to the date the funds became available in the Separate Account are hypothetical and are calculated as if the fund had been in the Separate Account during the stated period.
68
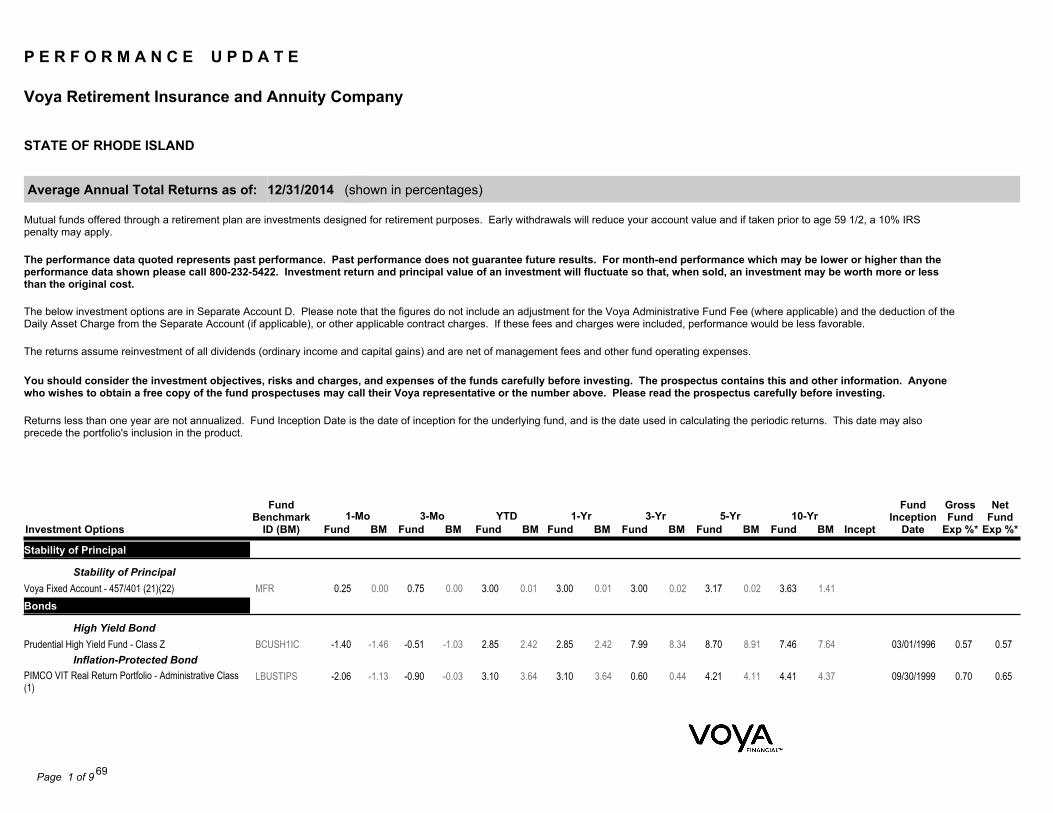
P E R F O R M A N C E U P D A T E
Voya Retirement Insurance and Annuity Company
STATE OF RHODE ISLAND
12/31/2014 (shown in percentages) Average Annual Total Returns as of:
Mutual funds offered through a retirement plan are investments designed for retirement purposes. Early withdrawals will reduce your account value and if taken prior to age 59 1/2, a 10% IRSpenalty may apply.
The performance data quoted represents past performance. Past performance does not guarantee future results. For month-end performance which may be lower or higher than theperformance data shown please call 800-232-5422. Investment return and principal value of an investment will fluctuate so that, when sold, an investment may be worth more or lessthan the original cost.
The below investment options are in Separate Account D. Please note that the figures do not include an adjustment for the Voya Administrative Fund Fee (where applicable) and the deduction of theDaily Asset Charge from the Separate Account (if applicable), or other applicable contract charges. If these fees and charges were included, performance would be less favorable.
The returns assume reinvestment of all dividends (ordinary income and capital gains) and are net of management fees and other fund operating expenses.
You should consider the investment objectives, risks and charges, and expenses of the funds carefully before investing. The prospectus contains this and other information. Anyonewho wishes to obtain a free copy of the fund prospectuses may call their Voya representative or the number above. Please read the prospectus carefully before investing.
Returns less than one year are not annualized. Fund Inception Date is the date of inception for the underlying fund, and is the date used in calculating the periodic returns. This date may alsoprecede the portfolio's inclusion in the product.
BM10-YrYTD3-Mo
BMBM
GrossFund
Exp %*5-Yr3-Yr1-Mo
BMFund
FundInception
Date1-Yr
NetFund
Exp %*Fund
FundBenchmark
ID (BM) InceptFund FundFund FundBM BMBM FundInvestment Options
Stability of Principal
Stability of PrincipalVoya Fixed Account - 457/401 (21)(22) 0.25 0.75 3.00 3.00 3.00 3.17 3.63MFR 0.00 0.01 0.01 0.02 1.410.00 0.02Bonds
High Yield BondPrudential High Yield Fund - Class Z -1.40 -0.51 2.85 2.85 7.99 8.70 7.46 0.57 0.5703/01/1996BCUSH1IC -1.03 2.42 2.42 8.34 7.64-1.46 8.91
Inflation-Protected BondPIMCO VIT Real Return Portfolio - Administrative Class(1)
-2.06 -0.90 3.10 3.10 0.60 4.21 4.41 0.70 0.6509/30/1999LBUSTIPS -0.03 3.64 3.64 0.44 4.37-1.13 4.11
Page 1 of 9 69

See Performance Introduction Page for Important Information
BM10-YrYTD3-Mo
BMBM
GrossFund
Exp %*5-Yr3-Yr1-Mo
BMFund
FundInception
Date1-Yr
NetFund
Exp %*Fund
FundBenchmark
ID (BM) InceptFund FundFund FundBM BMBM FundInvestment Options
Intermediate-Term BondVoya Intermediate Bond Portfolio - Class I (2) -0.17 1.35 6.67 6.67 5.24 6.60 4.81 0.51 0.5105/23/1973LEHM 1.79 5.97 5.97 2.66 4.710.09 4.45Voya U.S. Bond Index Portfolio - Class I (3) -0.02 1.68 5.71 5.71 2.28 4.01 4.33 0.40 0.4003/04/2008LEHM 1.79 5.97 5.97 2.660.09 4.45Asset Allocation
LifecycleVoya Solution 2015 Portfolio - Adviser Class (4)(5) -0.74 1.76 5.43 5.43 8.47 6.99 4.57 1.37 1.2304/29/2005SPT2015 1.85 5.49 5.49 9.29-0.55 8.19Voya Solution 2015 Portfolio - Initial Class (5)(6) -0.64 1.98 6.04 6.04 9.03 7.54 5.11 0.87 0.7304/29/2005SPT2015 1.85 5.49 5.49 9.29-0.55 8.19Voya Solution 2025 Portfolio - Initial Class (5)(7) -0.83 2.26 5.82 5.82 11.97 9.23 5.57 0.95 0.8004/29/2005SPT2025 1.90 5.56 5.56 11.60-0.80 9.54Voya Solution 2035 Portfolio - Initial Class (5)(8) -1.10 2.35 5.93 5.93 13.84 10.11 6.05 1.00 0.8704/29/2005SP2035 2.02 5.69 5.69 13.38-0.96 10.51Voya Solution 2045 Portfolio - Initial Class (5)(9) -1.14 2.58 6.34 6.34 15.08 10.83 6.35 1.02 0.8904/29/2005SP2045 2.05 5.67 5.67 14.43-1.07 11.04Voya Solution 2055 Portfolio - Initial Class (5)(10) -1.09 2.77 6.56 6.56 15.20 10.95 1.04 0.8903/08/2010SP2045 2.05 5.67 5.67 14.43-1.07Voya Solution Income Portfolio - Initial Class (5)(11) -0.50 1.89 6.02 6.02 7.80 6.71 5.00 0.83 0.6804/29/2005SPTREIN 1.50 4.87 4.87 6.21-0.35 6.33Balanced
Moderate AllocationVY® T. Rowe Price Capital Appreciation Portfolio - Inst(12)
-0.16 4.79 12.43 12.43 16.49 13.26 8.93 0.64 0.6401/24/1989SPXLBGC 0.73 2.37 2.37 6.97 4.950.03 7.54
Large Cap Value
Large BlendVoya Growth and Income Portfolio - Class I (13) -0.81 2.98 10.72 10.72 18.76 13.77 7.46 0.59 0.5912/31/1979SPXRE 4.93 13.69 13.69 20.41 7.67-0.25 15.45Voya U.S. Stock Index Portfolio - Institutional Class -0.24 4.89 13.36 13.36 20.12 15.15 7.41 0.27 0.2705/03/2004SPXRE 4.93 13.69 13.69 20.41 7.67-0.25 15.45
Large ValueBlackRock Equity Dividend Fund - Institutional Shares 0.58 4.24 9.35 9.35 15.21 12.80 8.78 0.74 0.7411/29/1988RS1000V 4.98 13.45 13.45 20.90 7.300.61 15.43Large Cap Growth
Large GrowthVoya Large Cap Growth Portfolio - Institutional Class (14) -1.04 5.19 13.62 13.62 20.67 15.59 10.17 0.68 0.6005/03/2004RS1000G 4.78 13.05 13.05 20.26 8.49-1.04 15.81Small/Mid/Specialty
Mid-Cap BlendVoya Russell Mid Cap Index Portfolio - Class I (15) 0.17 5.82 12.70 12.70 20.97 16.81 11.09 0.43 0.4303/04/2008RSMID 5.94 13.22 13.22 21.400.21 17.19
Mid-Cap GrowthPrincipal MidCap Fund - R-5 Class Shares 0.24 6.80 12.47 12.47 21.24 18.87 10.91 0.86 0.8612/06/2000RSMID 5.94 13.22 13.22 21.40 9.560.21 17.19
Small BlendVoya Russell Small Cap Index Portfolio - Class I (16) 2.74 9.71 4.93 4.93 19.10 15.46 10.97 0.47 0.4603/04/2008RS2000 9.73 4.89 4.89 19.212.85 15.54Voya Small Company Portfolio - Class I (17) 2.06 9.62 6.54 6.54 18.90 15.31 9.35 0.85 0.8512/27/1996RS2000 9.73 4.89 4.89 19.21 7.772.85 15.54Global / International
Foreign Large Blend
Page 2 of 9 70

See Performance Introduction Page for Important Information
BM10-YrYTD3-Mo
BMBM
GrossFund
Exp %*5-Yr3-Yr1-Mo
BMFund
FundInception
Date1-Yr
NetFund
Exp %*Fund
FundBenchmark
ID (BM) InceptFund FundFund FundBM BMBM FundInvestment OptionsAmerican Funds EuroPacific Growth Fund - Class R-4(18)
-3.99 -1.72 -2.66 -2.66 11.72 5.68 6.69 0.84 0.8404/16/1984MSCIXUS -3.87 -3.87 -3.87 8.99 5.13-3.61 4.43
Voya International Index Portfolio - Class I (19) -3.90 -4.19 -5.94 -5.94 10.69 5.14 1.05 0.55 0.4903/04/2008MSEAFANET -3.57 -4.90 -4.90 11.06-3.46 5.33World Stock
VY® Oppenheimer Global Portfolio - Initial Class (20) -2.84 -0.32 2.32 2.32 16.54 11.04 7.22 0.76 0.7605/01/2002MSCIWOR 1.01 4.94 4.94 15.47 6.03-1.61 10.20The risks of investing in small company stocks may include relatively low trading volumes, a greater degree of change in earnings and greater short-term volatility.
Foreign investing involves special risks such as currency fluctuation and public disclosure, as well as economic and political risks.
Some of the Funds invest in securities guaranteed by the U.S. Government as to the timely payment of principal and interest; however, shares of the Funds are not insured nor guaranteed.
High yielding fixed-income securities generally are subject to greater market fluctuations and risks of loss of income and principal than are investments in lower yielding fixed-income securities.
Sector funds may involve greater-than average risk and are often more volatile than funds holding a diversified portfolio of stocks in many industries. Examples include: banking, biotechnology,chemicals, energy, environmental services, natural resources, precious metals, technology, telecommunications, and utilities.*The Gross Expense Ratios shown do not reflect any temporary fee or expense waivers that may be in effect for a fund. The performance of a fund with a temporary fee or expense waiver wouldhave been lower if the gross fund fees / expenses listed had been reflected.
Page 3 of 9 71

P E R F O R M A N C E U P D A T E
Voya Retirement Insurance and Annuity Company
STATE OF RHODE ISLAND
Separate Account D
12/31/2014 (shown in percentages) Average Annual Total Returns as of:
Variable annuities and funding agreements are long-term investment vehicles designed for retirement purposes which allow you to allocate contributions among variable investment options that havethe potential to grow tax-deferred with an option to receive a stream of income at a later date.
The performance data quoted represents past performance. Past performance does not guarantee future results. For month-end performance which may be lower or higher than theperformance data shown please call 800-232-5422. Investment return and principal value of an investment will fluctuate so that, when sold, an investment may be worth more or lessthan the original cost.
These numbers reflect total Separate Account charges of 0.15% on an annual basis. They also assume reinvestment of all dividends (ordinary income and capital gains) and are net of managementfees and other fund operating expenses.
Depending upon the type of contract in which you participate, you have either received disclosure booklets for the separate account and/or fund prospectuses. You should considerthe investment objectives, risks and charges, and expenses of the variable product and its underlying fund options carefully before investing. The disclosure booklet contains this andother information. Anyone who wishes to obtain a free copy of the separate account disclosure booklet and/or fund prospectuses may call their Voya representative or the numberabove. Please read the separate account disclosure booklet and/or the fund prospectuses carefully before investing.
Returns less than one year are not annualized. Fund Inception Date is the date of inception for the underlying fund, and is the date used in calculating the periodic returns. This date may alsoprecede the portfolio's inclusion in the product.
1-Mo 3-Yr1-Yr3-Mo YTD 10-Yr
FundInception
DateInvestment Options Incept5-Yr
Stability of Principal
Stability of Principal3.003.00 3.633.00Voya Fixed Account - 457/401 (21)(22) 3.170.750.25
This fund is not part of the product's separate account.
Bonds
High Yield Bond2.682.68 7.30 03/01/19967.80Prudential High Yield Fund - Class Z 8.52-0.55-1.41
Inflation-Protected Bond2.942.94 4.25 09/30/19990.44PIMCO VIT Real Return Portfolio - Administrative Class (1) 4.05-0.94-2.07
Intermediate-Term Bond
Page 4 of 9 72
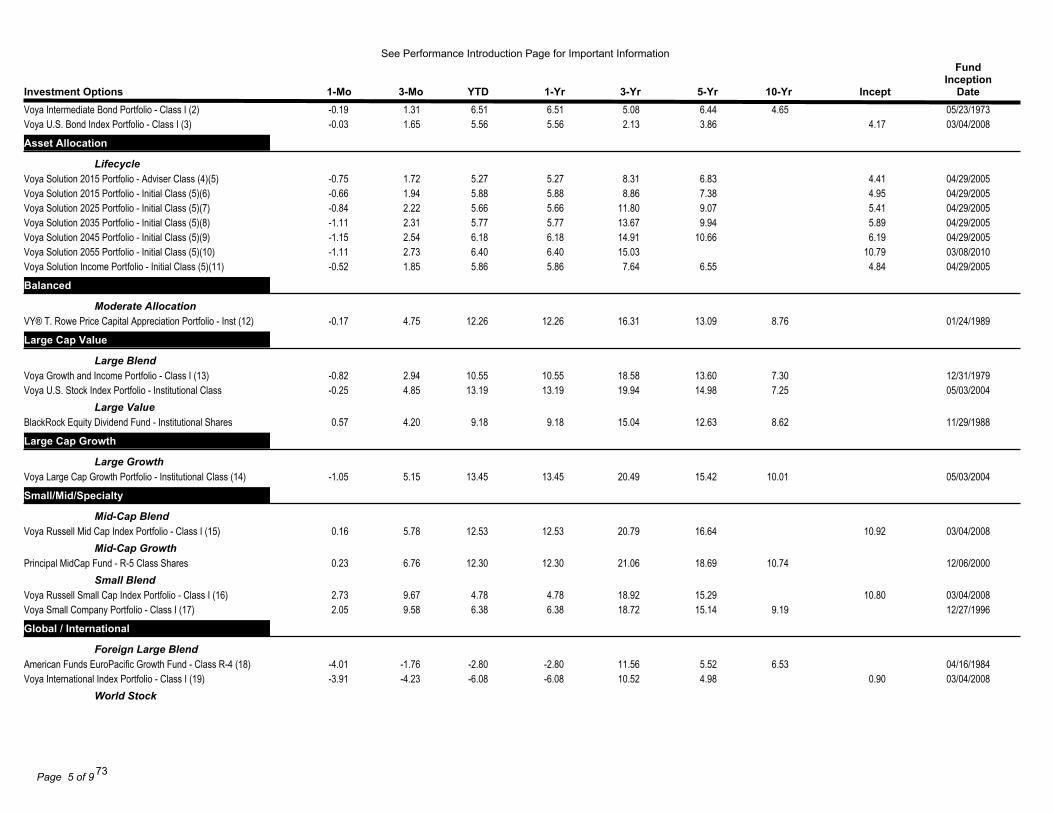
See Performance Introduction Page for Important Information
1-Mo 3-Yr1-Yr3-Mo YTD 10-Yr
FundInception
DateInvestment Options Incept5-Yr6.516.51 4.65 05/23/19735.08Voya Intermediate Bond Portfolio - Class I (2) 6.441.31-0.195.56 4.175.56 03/04/20082.13Voya U.S. Bond Index Portfolio - Class I (3) 3.861.65-0.03
Asset Allocation
Lifecycle5.27 4.415.27 04/29/20058.31Voya Solution 2015 Portfolio - Adviser Class (4)(5) 6.831.72-0.755.88 4.955.88 04/29/20058.86Voya Solution 2015 Portfolio - Initial Class (5)(6) 7.381.94-0.665.66 5.415.66 04/29/200511.80Voya Solution 2025 Portfolio - Initial Class (5)(7) 9.072.22-0.845.77 5.895.77 04/29/200513.67Voya Solution 2035 Portfolio - Initial Class (5)(8) 9.942.31-1.116.18 6.196.18 04/29/200514.91Voya Solution 2045 Portfolio - Initial Class (5)(9) 10.662.54-1.156.40 10.796.40 03/08/201015.03Voya Solution 2055 Portfolio - Initial Class (5)(10) 2.73-1.115.86 4.845.86 04/29/20057.64Voya Solution Income Portfolio - Initial Class (5)(11) 6.551.85-0.52
Balanced
Moderate Allocation12.2612.26 8.76 01/24/198916.31VY® T. Rowe Price Capital Appreciation Portfolio - Inst (12) 13.094.75-0.17
Large Cap Value
Large Blend10.5510.55 7.30 12/31/197918.58Voya Growth and Income Portfolio - Class I (13) 13.602.94-0.8213.1913.19 7.25 05/03/200419.94Voya U.S. Stock Index Portfolio - Institutional Class 14.984.85-0.25
Large Value9.189.18 8.62 11/29/198815.04BlackRock Equity Dividend Fund - Institutional Shares 12.634.200.57
Large Cap Growth
Large Growth13.4513.45 10.01 05/03/200420.49Voya Large Cap Growth Portfolio - Institutional Class (14) 15.425.15-1.05
Small/Mid/Specialty
Mid-Cap Blend12.53 10.9212.53 03/04/200820.79Voya Russell Mid Cap Index Portfolio - Class I (15) 16.645.780.16
Mid-Cap Growth12.3012.30 10.74 12/06/200021.06Principal MidCap Fund - R-5 Class Shares 18.696.760.23
Small Blend4.78 10.804.78 03/04/200818.92Voya Russell Small Cap Index Portfolio - Class I (16) 15.299.672.736.386.38 9.19 12/27/199618.72Voya Small Company Portfolio - Class I (17) 15.149.582.05
Global / International
Foreign Large Blend-2.80-2.80 6.53 04/16/198411.56American Funds EuroPacific Growth Fund - Class R-4 (18) 5.52-1.76-4.01-6.08 0.90-6.08 03/04/200810.52Voya International Index Portfolio - Class I (19) 4.98-4.23-3.91
World Stock
Page 5 of 9 73
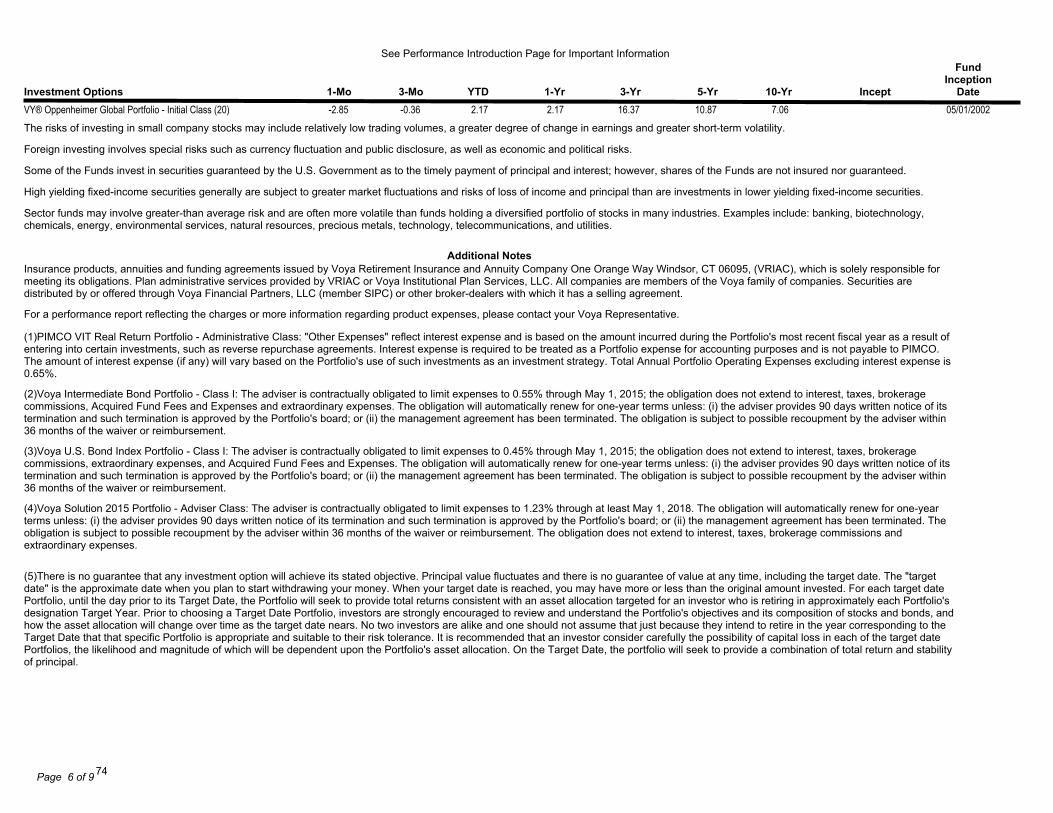
See Performance Introduction Page for Important Information
1-Mo 3-Yr1-Yr3-Mo YTD 10-Yr
FundInception
DateInvestment Options Incept5-Yr2.172.17 7.06 05/01/200216.37VY® Oppenheimer Global Portfolio - Initial Class (20) 10.87-0.36-2.85
The risks of investing in small company stocks may include relatively low trading volumes, a greater degree of change in earnings and greater short-term volatility.
Foreign investing involves special risks such as currency fluctuation and public disclosure, as well as economic and political risks.
Some of the Funds invest in securities guaranteed by the U.S. Government as to the timely payment of principal and interest; however, shares of the Funds are not insured nor guaranteed.
High yielding fixed-income securities generally are subject to greater market fluctuations and risks of loss of income and principal than are investments in lower yielding fixed-income securities.
Sector funds may involve greater-than average risk and are often more volatile than funds holding a diversified portfolio of stocks in many industries. Examples include: banking, biotechnology,chemicals, energy, environmental services, natural resources, precious metals, technology, telecommunications, and utilities.
Additional NotesInsurance products, annuities and funding agreements issued by Voya Retirement Insurance and Annuity Company One Orange Way Windsor, CT 06095, (VRIAC), which is solely responsible formeeting its obligations. Plan administrative services provided by VRIAC or Voya Institutional Plan Services, LLC. All companies are members of the Voya family of companies. Securities aredistributed by or offered through Voya Financial Partners, LLC (member SIPC) or other broker-dealers with which it has a selling agreement.
For a performance report reflecting the charges or more information regarding product expenses, please contact your Voya Representative.
(1)PIMCO VIT Real Return Portfolio - Administrative Class: "Other Expenses" reflect interest expense and is based on the amount incurred during the Portfolio's most recent fiscal year as a result ofentering into certain investments, such as reverse repurchase agreements. Interest expense is required to be treated as a Portfolio expense for accounting purposes and is not payable to PIMCO.The amount of interest expense (if any) will vary based on the Portfolio's use of such investments as an investment strategy. Total Annual Portfolio Operating Expenses excluding interest expense is0.65%.
(2)Voya Intermediate Bond Portfolio - Class I: The adviser is contractually obligated to limit expenses to 0.55% through May 1, 2015; the obligation does not extend to interest, taxes, brokeragecommissions, Acquired Fund Fees and Expenses and extraordinary expenses. The obligation will automatically renew for one-year terms unless: (i) the adviser provides 90 days written notice of itstermination and such termination is approved by the Portfolio's board; or (ii) the management agreement has been terminated. The obligation is subject to possible recoupment by the adviser within36 months of the waiver or reimbursement.
(3)Voya U.S. Bond Index Portfolio - Class I: The adviser is contractually obligated to limit expenses to 0.45% through May 1, 2015; the obligation does not extend to interest, taxes, brokeragecommissions, extraordinary expenses, and Acquired Fund Fees and Expenses. The obligation will automatically renew for one-year terms unless: (i) the adviser provides 90 days written notice of itstermination and such termination is approved by the Portfolio's board; or (ii) the management agreement has been terminated. The obligation is subject to possible recoupment by the adviser within36 months of the waiver or reimbursement.
(4)Voya Solution 2015 Portfolio - Adviser Class: The adviser is contractually obligated to limit expenses to 1.23% through at least May 1, 2018. The obligation will automatically renew for one-yearterms unless: (i) the adviser provides 90 days written notice of its termination and such termination is approved by the Portfolio's board; or (ii) the management agreement has been terminated. Theobligation is subject to possible recoupment by the adviser within 36 months of the waiver or reimbursement. The obligation does not extend to interest, taxes, brokerage commissions andextraordinary expenses.
(5)There is no guarantee that any investment option will achieve its stated objective. Principal value fluctuates and there is no guarantee of value at any time, including the target date. The "targetdate" is the approximate date when you plan to start withdrawing your money. When your target date is reached, you may have more or less than the original amount invested. For each target datePortfolio, until the day prior to its Target Date, the Portfolio will seek to provide total returns consistent with an asset allocation targeted for an investor who is retiring in approximately each Portfolio'sdesignation Target Year. Prior to choosing a Target Date Portfolio, investors are strongly encouraged to review and understand the Portfolio's objectives and its composition of stocks and bonds, andhow the asset allocation will change over time as the target date nears. No two investors are alike and one should not assume that just because they intend to retire in the year corresponding to theTarget Date that that specific Portfolio is appropriate and suitable to their risk tolerance. It is recommended that an investor consider carefully the possibility of capital loss in each of the target datePortfolios, the likelihood and magnitude of which will be dependent upon the Portfolio's asset allocation. On the Target Date, the portfolio will seek to provide a combination of total return and stabilityof principal.
Page 6 of 9 74
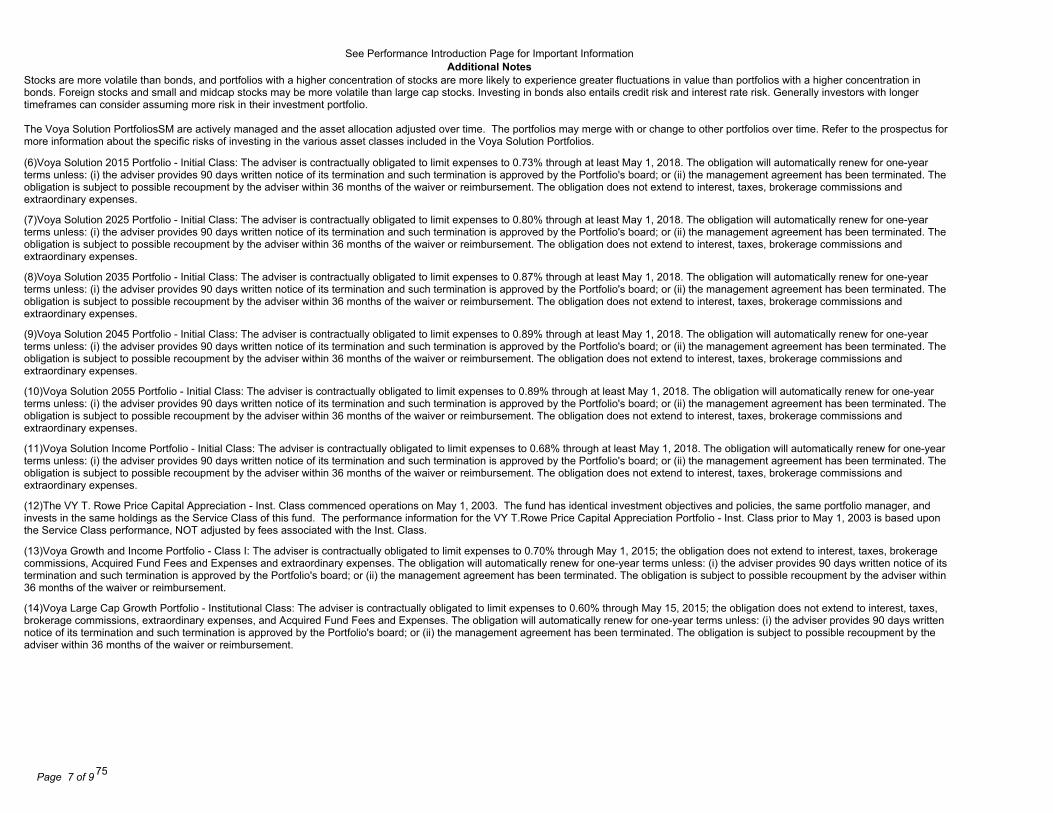
See Performance Introduction Page for Important InformationAdditional Notes
Stocks are more volatile than bonds, and portfolios with a higher concentration of stocks are more likely to experience greater fluctuations in value than portfolios with a higher concentration inbonds. Foreign stocks and small and midcap stocks may be more volatile than large cap stocks. Investing in bonds also entails credit risk and interest rate risk. Generally investors with longertimeframes can consider assuming more risk in their investment portfolio.
The Voya Solution PortfoliosSM are actively managed and the asset allocation adjusted over time. The portfolios may merge with or change to other portfolios over time. Refer to the prospectus formore information about the specific risks of investing in the various asset classes included in the Voya Solution Portfolios.
(6)Voya Solution 2015 Portfolio - Initial Class: The adviser is contractually obligated to limit expenses to 0.73% through at least May 1, 2018. The obligation will automatically renew for one-yearterms unless: (i) the adviser provides 90 days written notice of its termination and such termination is approved by the Portfolio's board; or (ii) the management agreement has been terminated. Theobligation is subject to possible recoupment by the adviser within 36 months of the waiver or reimbursement. The obligation does not extend to interest, taxes, brokerage commissions andextraordinary expenses.
(7)Voya Solution 2025 Portfolio - Initial Class: The adviser is contractually obligated to limit expenses to 0.80% through at least May 1, 2018. The obligation will automatically renew for one-yearterms unless: (i) the adviser provides 90 days written notice of its termination and such termination is approved by the Portfolio's board; or (ii) the management agreement has been terminated. Theobligation is subject to possible recoupment by the adviser within 36 months of the waiver or reimbursement. The obligation does not extend to interest, taxes, brokerage commissions andextraordinary expenses.
(8)Voya Solution 2035 Portfolio - Initial Class: The adviser is contractually obligated to limit expenses to 0.87% through at least May 1, 2018. The obligation will automatically renew for one-yearterms unless: (i) the adviser provides 90 days written notice of its termination and such termination is approved by the Portfolio's board; or (ii) the management agreement has been terminated. Theobligation is subject to possible recoupment by the adviser within 36 months of the waiver or reimbursement. The obligation does not extend to interest, taxes, brokerage commissions andextraordinary expenses.
(9)Voya Solution 2045 Portfolio - Initial Class: The adviser is contractually obligated to limit expenses to 0.89% through at least May 1, 2018. The obligation will automatically renew for one-yearterms unless: (i) the adviser provides 90 days written notice of its termination and such termination is approved by the Portfolio's board; or (ii) the management agreement has been terminated. Theobligation is subject to possible recoupment by the adviser within 36 months of the waiver or reimbursement. The obligation does not extend to interest, taxes, brokerage commissions andextraordinary expenses.
(10)Voya Solution 2055 Portfolio - Initial Class: The adviser is contractually obligated to limit expenses to 0.89% through at least May 1, 2018. The obligation will automatically renew for one-yearterms unless: (i) the adviser provides 90 days written notice of its termination and such termination is approved by the Portfolio's board; or (ii) the management agreement has been terminated. Theobligation is subject to possible recoupment by the adviser within 36 months of the waiver or reimbursement. The obligation does not extend to interest, taxes, brokerage commissions andextraordinary expenses.
(11)Voya Solution Income Portfolio - Initial Class: The adviser is contractually obligated to limit expenses to 0.68% through at least May 1, 2018. The obligation will automatically renew for one-yearterms unless: (i) the adviser provides 90 days written notice of its termination and such termination is approved by the Portfolio's board; or (ii) the management agreement has been terminated. Theobligation is subject to possible recoupment by the adviser within 36 months of the waiver or reimbursement. The obligation does not extend to interest, taxes, brokerage commissions andextraordinary expenses.
(12)The VY T. Rowe Price Capital Appreciation - Inst. Class commenced operations on May 1, 2003. The fund has identical investment objectives and policies, the same portfolio manager, andinvests in the same holdings as the Service Class of this fund. The performance information for the VY T.Rowe Price Capital Appreciation Portfolio - Inst. Class prior to May 1, 2003 is based uponthe Service Class performance, NOT adjusted by fees associated with the Inst. Class.
(13)Voya Growth and Income Portfolio - Class I: The adviser is contractually obligated to limit expenses to 0.70% through May 1, 2015; the obligation does not extend to interest, taxes, brokeragecommissions, Acquired Fund Fees and Expenses and extraordinary expenses. The obligation will automatically renew for one-year terms unless: (i) the adviser provides 90 days written notice of itstermination and such termination is approved by the Portfolio's board; or (ii) the management agreement has been terminated. The obligation is subject to possible recoupment by the adviser within36 months of the waiver or reimbursement.
(14)Voya Large Cap Growth Portfolio - Institutional Class: The adviser is contractually obligated to limit expenses to 0.60% through May 15, 2015; the obligation does not extend to interest, taxes,brokerage commissions, extraordinary expenses, and Acquired Fund Fees and Expenses. The obligation will automatically renew for one-year terms unless: (i) the adviser provides 90 days writtennotice of its termination and such termination is approved by the Portfolio's board; or (ii) the management agreement has been terminated. The obligation is subject to possible recoupment by theadviser within 36 months of the waiver or reimbursement.
Page 7 of 9 75

See Performance Introduction Page for Important InformationAdditional Notes
(15)Voya Russell (TM) Mid Cap Index Portfolio - Class I: The adviser is contractually obligated to limit expenses to 0.43% through May 1, 2015: The obligation does not extend to interest, taxes,brokerage commissions, extraordinary expenses, and Acquired Fund Fees and Expenses. The obligation will automatically renew for one-year terms unless: (i) the adviser provides 90 days writtennotice of its termination and such termination is approved by the Portfolio's board; or (ii) the management agreement has been terminated. The obligation is subject to possible recoupment by theadviser within 36 months of the waiver or reimbursement.
(16)Voya Russell (TM) Small Cap Index Portfolio - Class I: The adviser is contractually obligated to limit expenses to 0.45% through May 1, 2015; the obligation does not extend to interest, taxes,brokerage commissions, extraordinary expenses, and Acquired Fund Fees and Expenses. The obligation will automatically renew for one-year terms unless: (i) the adviser provides 90 days writtennotice of its termination and such termination is approved by the Portfolio's board; or (ii) the management agreement has been terminated. The obligation is subject to possible recoupment by theadviser within 36 months of the waiver or reimbursement.
(17)Voya Small Company Portfolio - Class I: The adviser is contractually obligated to limit expenses to 0.95% through May 1, 2015; the obligation does not extend to interest, taxes, brokeragecommissions, Acquired Fund Fees and Expenses and extraordinary expenses. The obligation will automatically renew for one-year terms unless: (i) the adviser provides 90 days written notice of itstermination and such termination is approved by the Portfolio's board; or (ii) the management agreement has been terminated. The obligation is subject to possible recoupment by the adviser within36 months of the waiver or reimbursement.
(18)EuroPacific Growth Fund - Class R-4 commenced operations on May 15, 2002. Class R-4 has identical investment objectives and policies, the same portfolio manager, and invests in the sameholdings as Class A. The performance information above prior to May 15, 2002 is based upon the Class A performance adjusted by the fee differences between classes.
(19)Voya International Index Portfolio - Class I: The adviser is contractually obligated to limit expenses to 0.50%, through May 1, 2015; the obligation does not extend to interest, taxes, brokeragecommissions, extraordinary expenses, and Acquired Fund Fees and Expenses. The obligation will automatically renew for one-year terms unless: (i) the adviser provides 90 days written notice of itstermination and such termination is approved by the Portfolio's board; or (ii) the management agreement has been terminated. The obligation is subject to possible recoupment by the adviser within36 months of the waiver or reimbursement. In addition, the adviser is contractually obligated to further limit expenses to 0.48% through May 1, 2016. There is no guarantee that the obligation willcontinue after May 1, 2016. The obligation will renew if the adviser elects to renew it and is subject to possible recoupment by the Adviser within 36 months of the waiver or reimbursement. Thesewaivers will only renew if the distributor elects to renew them. Notwithstanding the foregoing, termination or modification of these obligations require approval by the Portfolio's board.
(20)VY Oppenheimer Global Portfolio - Initial Class: The adviser is contractually obligated to limit expenses to 0.80% through May 1, 2015. The obligation will automatically renew for one-year termsunless: (i) the adviser provides 90 days written notice of its termination and such termination is approved by the Portfolio's board; or (ii) the management agreement has been terminated. Theobligation is subject to possible recoupment by the adviser within 36 months of the waiver or reimbursement. The obligation does not extend to interest, taxes, brokerage commissions, extraordinaryexpenses, and Acquired Fund Fees and Expenses.
(21)The CURRENT rate for the Voya Fixed Account - 457/401 Base+110 is 3.00%, expressed as an annual effective yield, and is guaranteed not to drop below 3.00% through 12/31/2015. Theannual rate of interest applied to your account may be higher or lower than the current rate. Restrictions may apply to transfers of funds from the Fixed Account to other contract investment options.Please refer to your product prospectus / disclosure booklet and call your 800 number for more information.
(22)The Investment Option is neither a mutual fund nor part of a Separate Account. The returns listed do not include the impact of contract charges. Please refer to the contract or disclosure book todetermine which Fixed Interest Options are available for your specific plan. The Investment Option is offered through Voya Retirement Insurance and Annuity Company.
The returns do not reflect the impact of a Deferred Surrender Charge. If included, performance would be less favorable.
Not all investments options are available under all contracts; please check your disclosure booklet for options available under your plan.
Benchmark DescriptionBenchmark IdBarclays US HY 1% Issuer Cap TR USDBCUSH1IC
Barclays Capital U.S. Treasury U.S. TIPS Index measures the performance of rulesbased, market value-weighted inflation-protectedsecurities issued by the U.S. Treasury. It is a subset of the Global Inflation-Linked Index (Series-L).
LBUSTIPS
Barclays Capital U.S. Aggregate Bond Index measures the performance of investment grade, U.S. dollar-denominated, fixed-ratetaxable bond market, including Treasuries, government-related and corporate securities, MBS (agency fixed-rate and hybrid ARMpassthroughs), ABS, and CMBS. It rolls up into other Barclays flagship indices, such as the multi-currency Global Aggregate Index andthe U.S. Universal Index, which includes high yield and emerging markets debt.
LEHM
MFR Money Market Index is comprised of returns which are based upon historical average 30-day compound yields on a universe oftaxable money market funds. The data for the universe, which includes approximately 980 funds, is compiled by iMoneynet, Inc. Goal of
MFR
Page 8 of 9 76

See Performance Introduction Page for Important InformationBenchmark DescriptionBenchmark IdING Fixed Account - 457/401 is to outperform the MFR by 150 - 200 basis points over 3 - 5 year time periods.
MSCI World Index measures the performance of the large and mid-cap segment of world equity securities. It is free float-adjustedmarket-capitalization weighted.
MSCIWOR
MSCI ACWI (All Country World Index) ex USA Index measures the performance of the large and mid-cap segment of the particularregions, excluding USA equity securities,including developed and emerging market. It is free float-adjusted market-capitalizationweighted.
MSCIXUS
MSCI EAFE Index measures the performance of the large and mid-cap segment of developed markets, excluding the U.S. & Canadaequity securities. It is free float-adjusted market-capitalization weighted.
MSEAFANET
Russell 1000 Growth Index measures the performance of the large-cap growth segment of the U.S. equity securities. It includes theRussell 1000 index companies with higher price-to-book ratios and higher forecasted growth values. It is market-capitalization weighted.
RS1000G
Russell 1000 Value Index measures the performance of the large-cap value segment of the U.S. equity securities. It includes the Russell1000 index companies with lower price-to-book ratios and lower expected growth values. It is market-capitalization weighted.
RS1000V
Russell 2000 Index measures the performance of the small-cap segment of the U.S. equity universe. It is a subset of the Russell 3000and includes approximately 2000 of the smallest securities based on a combination of their market cap and current index membership.
RS2000
Russell Mid-Cap Index measures the performance of the mid-cap segment of the U.S. equity universe. It is a subset of Russell 1000index and includes approximately 800 of the smallest securities based on a combination of their market cap and current indexmembership. The index represents approximately 31% of the total market capitalization of the Russell 1000 companies.
RSMID
S&P Target Date 2035 Index measures the performance of a portfolio of multi-asset including equities, fixed income and commodities.The index has target retirement date of 2035, and belongs to S&P Target Date Index Series which comprises eleven indexes withdifferent target retirement date. Each index in this series is determined once a year through survey of large fund managementcompanies that offer target date products.
SP2035
S&P Target Date 2045 Index measures the performance of a portfolio of multi-asset including equities, fixed income and commodities.The index has target retirement date of 2045, and belongs to S&P Target Date Index Series which comprises eleven indexes withdifferent target retirement date. Each index in this series is determined once a year through survey of large fund managementcompanies that offer target date products.
SP2045
S&P Target Date 2015 Index measures the performance of a portfolio of multi-asset including equities, fixed income and commodities.The index has target retirement date of 2015, and belongs to S&P Target Date Index Series which comprises eleven indexes withdifferent target retirement date. Each index in this series is determined once a year through survey of large fund managementcompanies that offer target date products.
SPT2015
S&P Target Date 2025 Index measures the performance of a portfolio of multi-asset including equities, fixed income and commodities.The index has target retirement date of 2025, and belongs to S&P Target Date Index Series which comprises eleven indexes withdifferent target retirement date. Each index in this series is determined once a year through survey of large fund managementcompanies that offer target date products.
SPT2025
S&P Target Date Retirement Income Index measures the performance of a portfolio of multi-asset including equities, fixed income andcommodities. The index belongs to S&P Target Date Index Series which comprises eleven indexes with different target retirement date.Each index in this series is determined once a year through survey of large fund management companies that offer target date products.
SPTREIN
S&P 500 60% / Barclays Capital Corp/Gov Bond Index 40% consists of a mix of 60% of an unmanaged stock index (The Standard &Poor's 500) and 40% of an unmanaged bond index (Barclays Capital Gov't Corp. Bond Index).
SPXLBGC
S&P 500 Index measures the performance of 500 widely held stocks in U.S. equity market. Standard and Poor's chooses membercompanies for the index based on market size, liquidity and industry group representation. Included are the stocks of industrial, financial,utility, and transportation companies. Since mid 1989, this composition has been more flexible and the number of issues in each sectorhas varied. The index is market capitalization-weighted.
SPXRE
Friday, January 23, 2015Creation Date:
Page 9 of 977
Information Security Identification: Confidential
Section XI. OPEB Trust
78
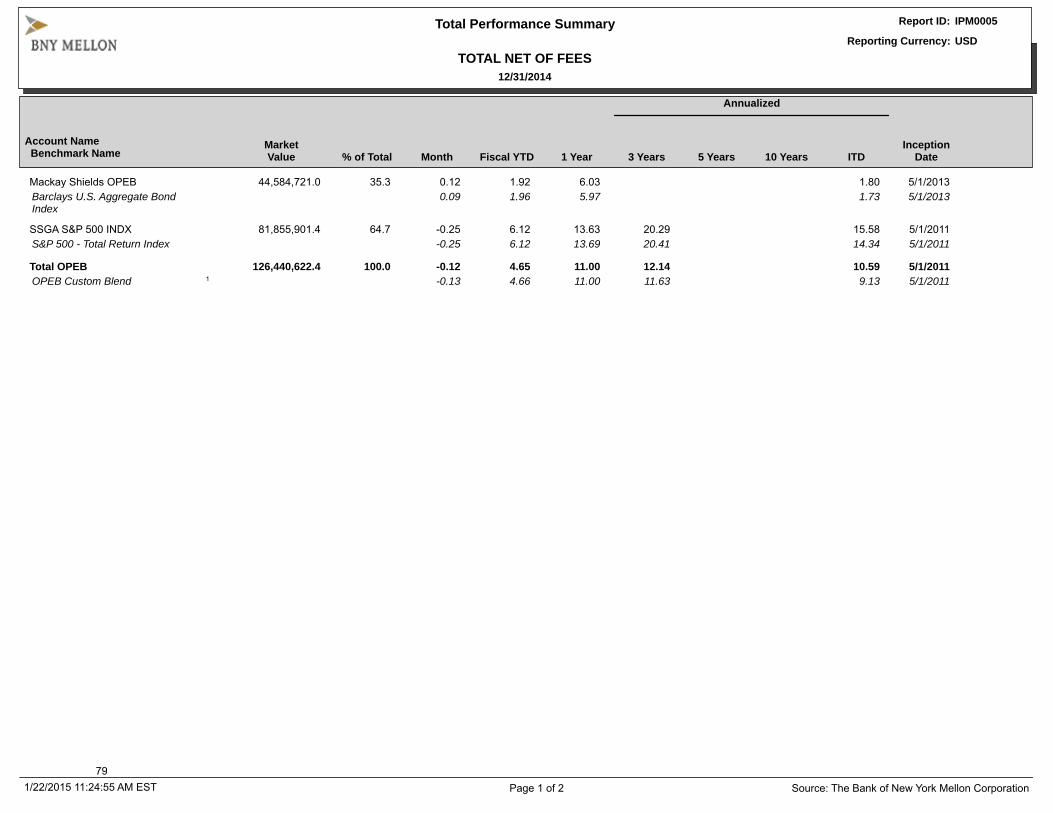
Account Name Benchmark Name
MarketValue % of Total Month Fiscal YTD 1 Year 3 Years 5 Years 10 Years ITD
Annualized
InceptionDate
Mackay Shields OPEB 44,584,721.0 35.3 0.12 1.92 6.03 1.80 5/1/2013Barclays U.S. Aggregate BondIndex
0.09 1.96 5.97 1.73 5/1/2013
SSGA S&P 500 INDX 81,855,901.4 64.7 -0.25 6.12 13.63 20.29 15.58 5/1/2011S&P 500 - Total Return Index -0.25 6.12 13.69 20.41 14.34 5/1/2011
Total OPEB 126,440,622.4 100.0 -0.12 4.65 11.00 12.14 10.59 5/1/20111OPEB Custom Blend -0.13 4.66 11.00 11.63 9.13 5/1/2011
Total Performance Summary
TOTAL NET OF FEES12/31/2014
Report ID: IPM0005
Reporting Currency: USD
Page 1 of 2 Source: The Bank of New York Mellon Corporation1/22/2015 11:24:55 AM EST79

1 RI7GX0903OPE OPEB Custom Blend 35% Barclays Aggregate and 65% S&P 500
Total Performance Summary
END NOTES12/31/2014
Report ID: IPM0005
Reporting Currency: USD
Page 2 of 2 Source: The Bank of New York Mellon Corporation1/22/2015 11:24:55 AM EST80

Account Name Benchmark Name
MarketValue % of Total YTD Month
11/1/2014 -11/30/2014
10/1/2014 -10/31/2014
Cumulative
2014 2013 2012Inception
Date
Mackay Shields OPEB 44,584,721.0 35.3 6.03 0.12 0.70 0.93 6.03 5/1/2013Barclays U.S. Aggregate BondIndex
5.97 0.09 0.71 0.98 5.97 5/1/2013
SSGA S&P 500 INDX 81,855,901.4 64.7 13.63 -0.25 2.70 2.44 13.63 32.09 15.96 5/1/2011S&P 500 - Total Return Index 13.69 -0.25 2.69 2.44 13.69 32.39 16.00 5/1/2011
1Total OPEB 126,440,622.4 100.0 11.00 -0.12 2.00 1.94 11.00 15.77 9.74 5/1/20112OPEB Custom Blend 11.00 -0.13 2.00 1.93 11.00 15.73 8.30 5/1/2011
Total Performance Summary
TOTAL NET OF FEES12/31/2014
Report ID: IPM0005
Reporting Currency: USD
Page 1 of 2 Source: The Bank of New York Mellon Corporation1/22/2015 11:24:52 AM EST81
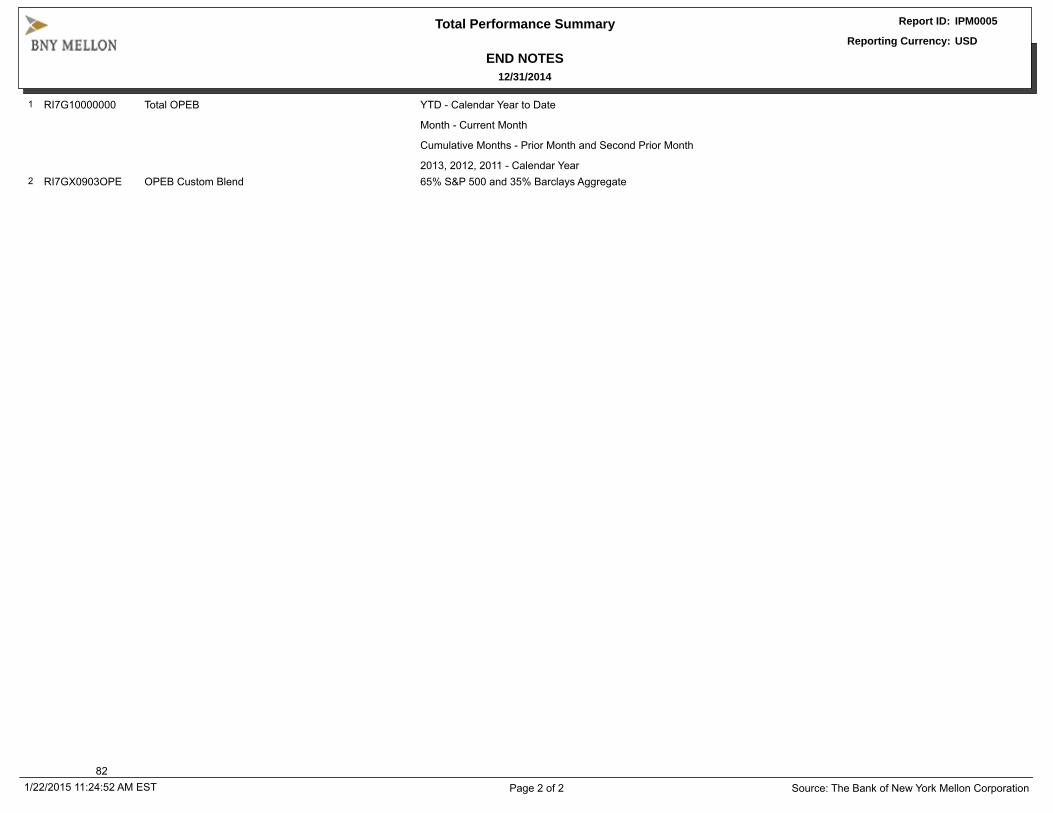
1 RI7G10000000 Total OPEB YTD - Calendar Year to Date
Month - Current Month
Cumulative Months - Prior Month and Second Prior Month
2013, 2012, 2011 - Calendar Year2 RI7GX0903OPE OPEB Custom Blend 65% S&P 500 and 35% Barclays Aggregate
Total Performance Summary
END NOTES12/31/2014
Report ID: IPM0005
Reporting Currency: USD
Page 2 of 2 Source: The Bank of New York Mellon Corporation1/22/2015 11:24:52 AM EST82