Embed Size (px)
Citation preview

MEMBERS OF THE STATE INVESTMENT COMMISSION
Honorable Seth Magaziner, Chair
Ms. Karen Hazard Mr. Frank Karpinski Ms. Sylvia Maxfield Mr. Thomas Mullaney
Mr. Erik Carleton Mr. J. Michael Costello Mr. Thomas P. Fay Ms. Karen Hammond
STATE OF RHODE ISLAND INVESTMENT COMMISSION MEETING
DATA AT February 29th, 2020
March 20th, 2020 MEETING

Section I.
Agenda

State of Rhode Island and Providence Plantations Office of the General Treasurer
Seth Magaziner General Treasurer
50 Service Avenue – Warwick, Rhode Island 02886-1021 – (401) 462–7650 / Fax 462–7695
RHODE ISLAND STATE INVESTMENT COMMISSION MEETING NOTICE
The next meeting of the Rhode Island State Investment Commission has been scheduled for Friday, March 20th, 2020 at 9:00 a.m. via teleconference (dial-in: 1-877-309-2073, access code: 814-081-397).
AGENDA
Chairperson Call to Order Membership Roll Call
Approval of Draft Meeting Minutes 1
State Investment Commission Meeting held February 26th, 2020
Chief Investment Officer Report
Investment Advisor Update, Meketa Allan Emkin, Meketa
Fixed Income Implementation Plan 1
Will Forde & Doug Moseley, NEPC
Legal Counsel Report
Treasurer’s General Comments
1 Commission members may be asked to vote on this item
POSTED ON MARCH 17, 2020 Anyone wishing to attend this meeting who may have special needs for access or services such as an interpreter, please contact Justin
Maistrow at (401) 574-9246 twenty-four hours in advance of the scheduled meeting.

Section II.
Approval of Minutes

1
February 26th, 2020
StateInvestmentCommissionMonthlyMeetingMinutes
Wednesday,February26th,20209:00a.m.
ExecutiveConferenceRoom,DepartmentofAdministration
The Monthly Meeting of the State Investment Commission (SIC) was called to order at 9:02 AM, Wednesday, February 26th, 2020 in the Executive Conference Room, Department of Administration.
I. RollCallofMembersThe following members were present: Mr. Michael Costello, Mr. Thomas Fay, Mr. Thomas Mullaney, Ms. Karen Hammond, Mr. Frank Karpinski, Mr. Erik Carleton, Ms. Karen Hazard1, and Treasurer Seth Magaziner.
Also in attendance: Kevin Murphy, Maura Neely, and Kristina O’Gannon, Wellington; Thomas Lynch, Cliffwater; Tiffany Spudich and Nathan Kinney, Capital Cities; Kevin Leonard and Will Forde, NEPC; Mr. Alec Stais, Chief Investment Officer; Mr. Matthew Waters, Adler Pollock & Sheehan, legal counsel; and other members of the Treasurer’s Staff.
Treasurer Magaziner called the meeting to order at 9:02 AM.
II. ApprovalofMinutesOn a motion by Ms. Karen Hammond and seconded by Mr. Thomas Mullaney, it was unanimously VOTED: to approve the draft meeting minutes of the January 22nd, 2020 meeting of the State Investment Commission.
III. EmergingMarketsDebtInvestmentRecommendation,WellingtonMr. Will Forde and Kevin Leonard, NEPC, introduced the Emerging Markets Debt asset class and Wellington. Ms. Kristina O’Gannon, Ms. Maura Neely, and Mr. Kevin Murphy, Wellington, provided an overview of the firm, detailed the firm’s Blended Opportunistic Emerging Markets Debt Strategy, including the firm’s commingled investment fund vehicle.
The Board asked questions. On a motion by Mr. Michael Costello and seconded by Mr. Thomas Fay, it was unanimously VOTED: that the Rhode Island Employees Retirement Systems Pooled Trust allocate 2% of Total Plan assets to Wellington’s Blended Opportunistic Emerging Markets Debt commingled pool, under the proposed performance based fee schedule (0.25% base fee, 20% of excess return above the benchmark net of base fee and operating expenses; one year measurement period, with high watermark), subject to legal and investment staff review.
1 Ms. Karen Hazard joined the meeting at approximately 9:04 am and did not vote on item II. Her temporary absence did not impact quorum.

2
February 26th, 2020
IV. PrivateEquityInvestmentRecommendation,RiversideMicro‐CapFundIVB,L.P.
Mr. Thomas Lynch, Cliffwater, provided an overview of the firm and its acquisition-based growth investment approach. Mr. Lynch highlighted the firm’s strong track record and the profile of the companies within the Riverside Micro-Cap IV Fund. The Board asked questions.
On a motion by Mr. Thomas Mullaney and seconded by Mr. Michael Costello, it was unanimously VOTED: that the Rhode Island Employees Retirement Systems Pooled Trust make a commitment of up to $20 million in Riverside Micro-Cap IV B, L.P., subject to legal and investment staff review.
V. IlliquidAssetClassUpdateandPacingPlanMr. Thomas Lynch, Cliffwater, provided an overview of the investment pacing plan and the performance of the Plan’s illiquid asset class portfolios. The Board asked questions.
VI. CollegeBoundProgramEnhancementRecommendations,CapitalPreservationandGlobalSustainableEquity
Ms. Tiffany Spudich, Capital Cities, presented an overview of Capital Cities’ proposed changes to the CollegeBound program. The Board asked questions. On a motion by Mr. Eric Carleton and seconded by Mr. Thomas Mullaney, it was unanimously VOTED: to adopt the following recommended program enhancements: (a) Replace the existing Invesco Short Term Government & Agency Fund (AGPXX) with Invesco Treasury Collateral ETF (CLTL) within CollegeBound Saver’s Age-Based Portfolios; (b) Eliminate the Invesco Global Sustainable Equity Individual Portfolio in the CollegeBound Program, mapping the assets to a new Invesco MSCI World SRI Index Portfolio (CollegeBound 529)/Global Responsible Equity Portfolio (CollegeBound Saver); and (c) Utilize the Invesco MSCI World SRI Index as the underlying fund of a new Invesco MSCI World SRI Index Portfolio (CollegeBound 529)/Global Responsible Equity Portfolio (CollegeBound Saver).
VII. Non‐CoreRealEstateInvestmentRecommendationUpdate,BerkeleyPartnersValueIndustrialFundV,L.P.
Mr. Alec Stais, Chief Investment Officer, provided an updated investment recommendation for Berkeley Partners Value Industrial Fund V, L.P., originally voted on during the January 22, 2020 SIC meeting. The updated recommendation memo presented during the February 26, 2020 meeting included a correction to the investment terms presented in the January 22, 2020 SIC meeting memo. The correction was immaterial to the investment recommendation and return expectation, but warranted a reauthorization vote.

3
February 26th, 2020
999997.v1
The Board asked questions. On a motion by Mr. Thomas Fay and seconded by Ms. Karen Hammond, it was unanimously VOTED: to reauthorize the investment recommendation for Berkeley Partners Value Industrial Fund V, L.P., which was initially approved at the January 22, 2020 SIC meeting, based on the updated recommendation memo.
VIII. ShortTermInvestmentProviderRecommendation,GreenwoodCreditUnion
Treasury Staff provided a recommendation to add Greenwood Credit Union as a new provider within the Community Deposit Program. On a motion by Ms. Karen Hazard and seconded by Mr. Thomas Fay, it was unanimously VOTED: to approve Greenwood Credit Union as a short-term investment provider within the Community Deposit Program.
IX. LegalCounselReportThere was no legal counsel report.
X. ChiefInvestmentOfficerReportMr. Alec Stais, Chief Investment Officer, discussed the Plan’s performance across the different asset classes and buckets, highlighting the positive effects of diversification.
XI. Treasurer’sGeneralCommentsTreasurer Magaziner asked if there were any further comments or questions and thanked the Board and Staff.
On a motion by Ms. Karen Hammond and seconded by Mr. Michael Costello, it was unanimously VOTED: to adjourn the meeting at 11:04 AM.
Respectfully submitted,
Seth Magaziner, General Treasurer

Section III.
Staff Summary

February 2020
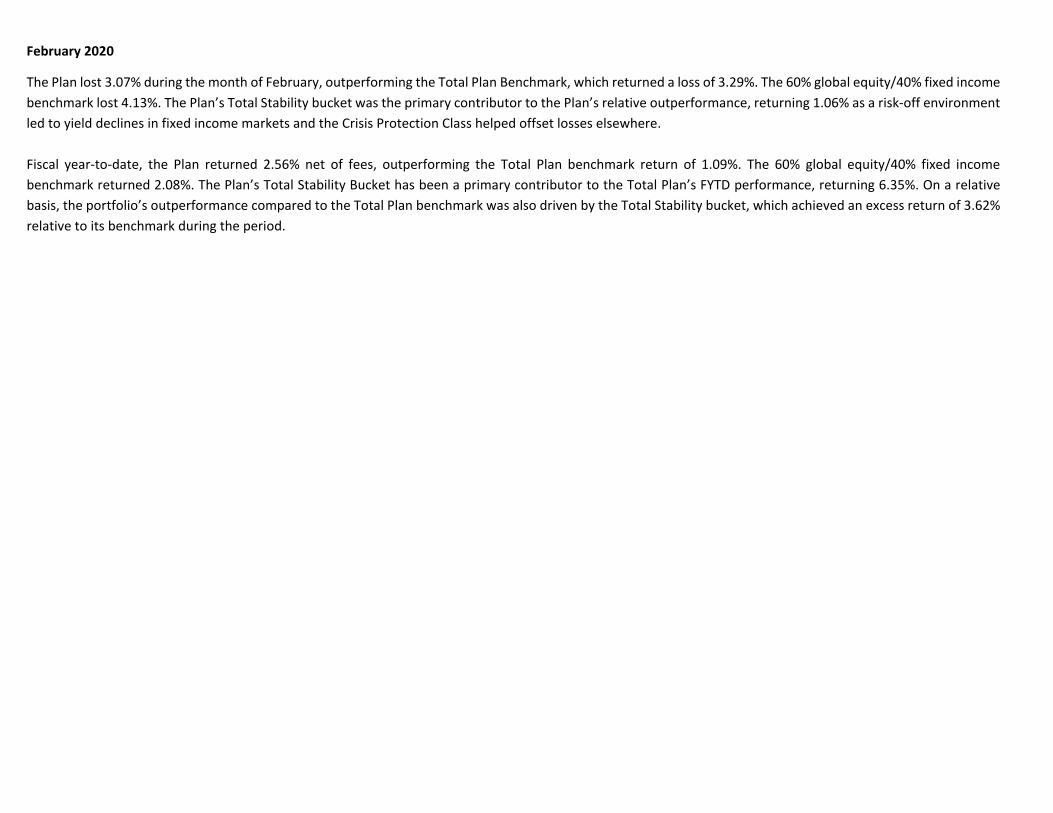
The Plan lost 3.07% during the month of February, outperforming the Total Plan Benchmark, which returned a loss of 3.29%. The 60% global equity/40% fixed income benchmark lost 4.13%. The Plan’s Total Stability bucket was the primary contributor to the Plan’s relative outperformance, returning 1.06% as a risk-off environment led to yield declines in fixed income markets and the Crisis Protection Class helped offset losses elsewhere. Fiscal year-to-date, the Plan returned 2.56% net of fees, outperforming the Total Plan benchmark return of 1.09%. The 60% global equity/40% fixed income benchmark returned 2.08%. The Plan’s Total Stability Bucket has been a primary contributor to the Total Plan’s FYTD performance, returning 6.35%. On a relative basis, the portfolio’s outperformance compared to the Total Plan benchmark was also driven by the Total Stability bucket, which achieved an excess return of 3.62% relative to its benchmark during the period.

Total Plan ‐ February 28th, 2020
*Allocation reflects physical exposure; Russell Overlay rebalancing program classified as, “Other”
AnnualizedFeb-2020 YTD FYTD 1 Year 3 Years 5 Years ITD Inception
GROWTH -6.36 -7.39 0.44 4.73 7.20 7/1/2017GROWTH BM -5.52 -6.26 0.79 5.23
Public Growth -8.10 -9.31 -1.39 3.02 6.82 5.58 4.61 7/1/2000Public Growth BM -8.08 -9.09 -0.98 3.89 6.96 5.55
Private Growth 1.24 1.14 8.32 11.86 15.28 7/1/2017Private Growth BM 1.29 1.37 5.20 8.17
INCOME -4.18 -4.45 -2.11 -0.39 1.87 7/1/2017INCOME BM -3.51 -3.98 -2.80 -0.23 2.39 7/1/2017
STABILITY 1.86 3.76 6.35 12.10 5.94 7/1/2017STABILITY BM 0.52 1.38 2.73 7.55
CPC 4.20 8.04 9.18 22.13 5.41 7/1/2017CPC BM 1.42 2.46 0.43 10.21 1.26 7/1/2017
Inflation Protection 0.47 1.53 5.29 8.43 7.10 7/1/2017Inflation Protection BM 0.62 1.29 3.38 5.90 5.25 7/1/2017
Volatility Protection 1.06 2.40 5.05 9.37 5.36 7/1/2017Volatility Protection BM -0.13 0.71 2.90 6.67
TOTAL PLAN -3.07 -3.04 2.56 7.22 6.87 5.62 5.10 7/1/2000TOTAL PLAN BM -3.29 -3.49 1.09 5.58 6.29 5.15
60/40 -4.13 -4.02 2.08 7.28 6.41 4.97

Section IV.
Asset Allocation

ERSRI Asset Allocation Tracking
Functional
Bucket
Aggregate
Asset Class
Aggregate
Allocation
Weight
Asset Class
(a) Strategic
Benchmark
Weight/Target
Allocation
(b) Actual
exposure as of
02/29/20
(b) ‐ (a)
US Equity 22.5% 24.2% 1.7%
International
Developed Equity12.7% 13.6% 1.0%
EM Equity 4.9% 5.0% 0.1%
PE 11.25% 8.2% ‐3.1%
Non‐core RE 2.25% 1.9% ‐0.4%
Opp Private Credit 1.5% 0.7% ‐0.8%HY Infra 1.0% 0.9% ‐0.1%REITs 1.0% 0.9% ‐0.1%
Equity Options 2.0% 1.9% ‐0.1%
EMD (50/50 Blend) 2.0% ‐ ‐2.0%
Liquid Credit 2.8% 3.6% 0.8%
Private Credit 3.2% 1.9% ‐1.3%
Treasury Duration 5.0% 5.7% 0.7%
Systematic Trend 5.0% 5.4% 0.4%
Core RE 3.6% 3.9% 0.3%
Private Infra 2.4% 2.2% ‐0.2%
TIPs 2.0% 2.1% 0.1%
IG Fixed Income ‐ 7.5% 7.5%
IG Corp. Credit 3.25% ‐ ‐3.3%
Securitized Credit 3.25% ‐ ‐3.3%
Absolute Return 6.5% 6.7% 0.2%
Strategic Cash 2.0% 2.2% 0.2%
‐ Short‐Term Cash ‐ 0.6% 0.6%
‐ Russell Overlay ‐ 0.6% 0.6%
TOTAL Total 100.0% 100.0% 100.0% 0.0%
GROWTH
Global
Equity40.0%
Private
Growth15.0%
STABILITY
CPC 10.0%
Inflation
Protection8.0%
INCOME Income 12.0%
Volatility
Protection15.0%
OTHERShort‐term
Tactical

Section V.
Risk Overview
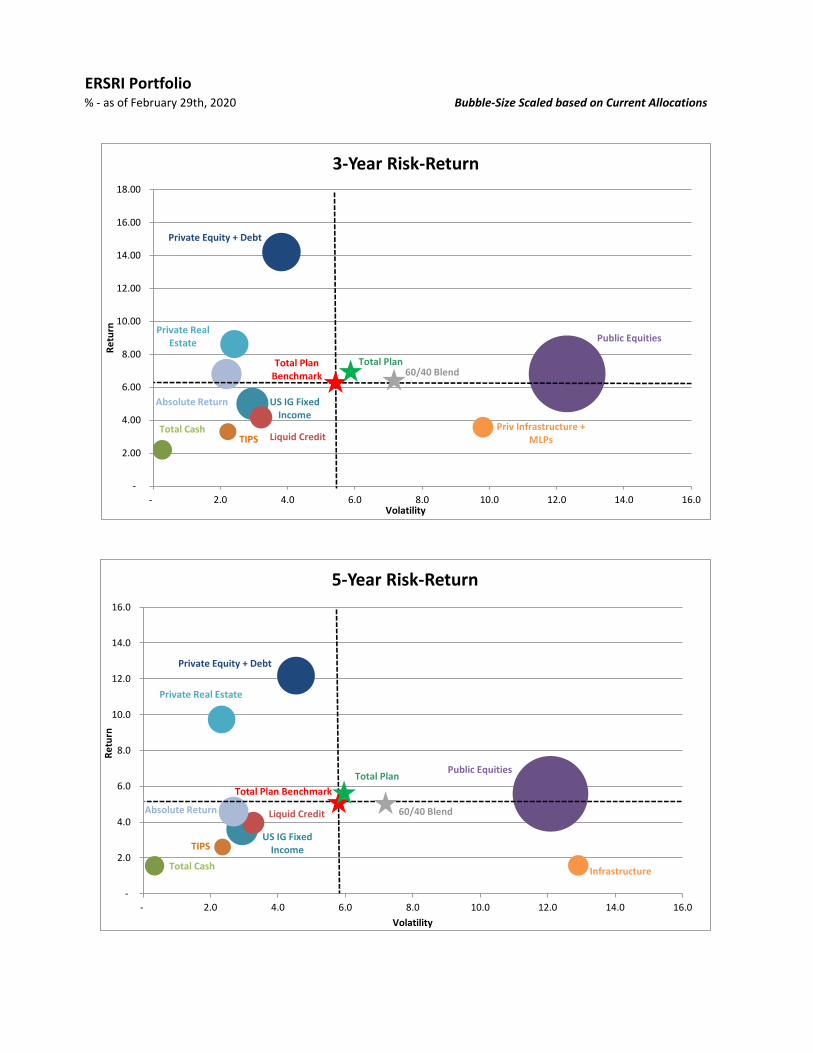
ERSRI Portfolio% ‐ as of February 29th, 2020 Bubble‐Size Scaled based on Current Allocations
Total Plan Benchmark
Total Plan
Total Cash
Public Equities
TIPS
US IG Fixed Income
Liquid Credit
Private Equity + Debt
60/40 Blend
Private Real Estate
Priv Infrastructure + MLPs
Absolute Return
‐
2.00
4.00
6.00
8.00
10.00
12.00
14.00
16.00
18.00
‐ 2.0 4.0 6.0 8.0 10.0 12.0 14.0 16.0
Return
Volatility
3‐Year Risk‐Return
Total Plan Benchmark
Total Plan
Total Cash
Public Equities
TIPSUS IG Fixed Income
Liquid Credit
Private Equity + Debt
60/40 Blend
Private Real Estate
Infrastructure
Absolute Return
‐
2.0
4.0
6.0
8.0
10.0
12.0
14.0
16.0
‐ 2.0 4.0 6.0 8.0 10.0 12.0 14.0 16.0
Return
Volatility
5‐Year Risk‐Return
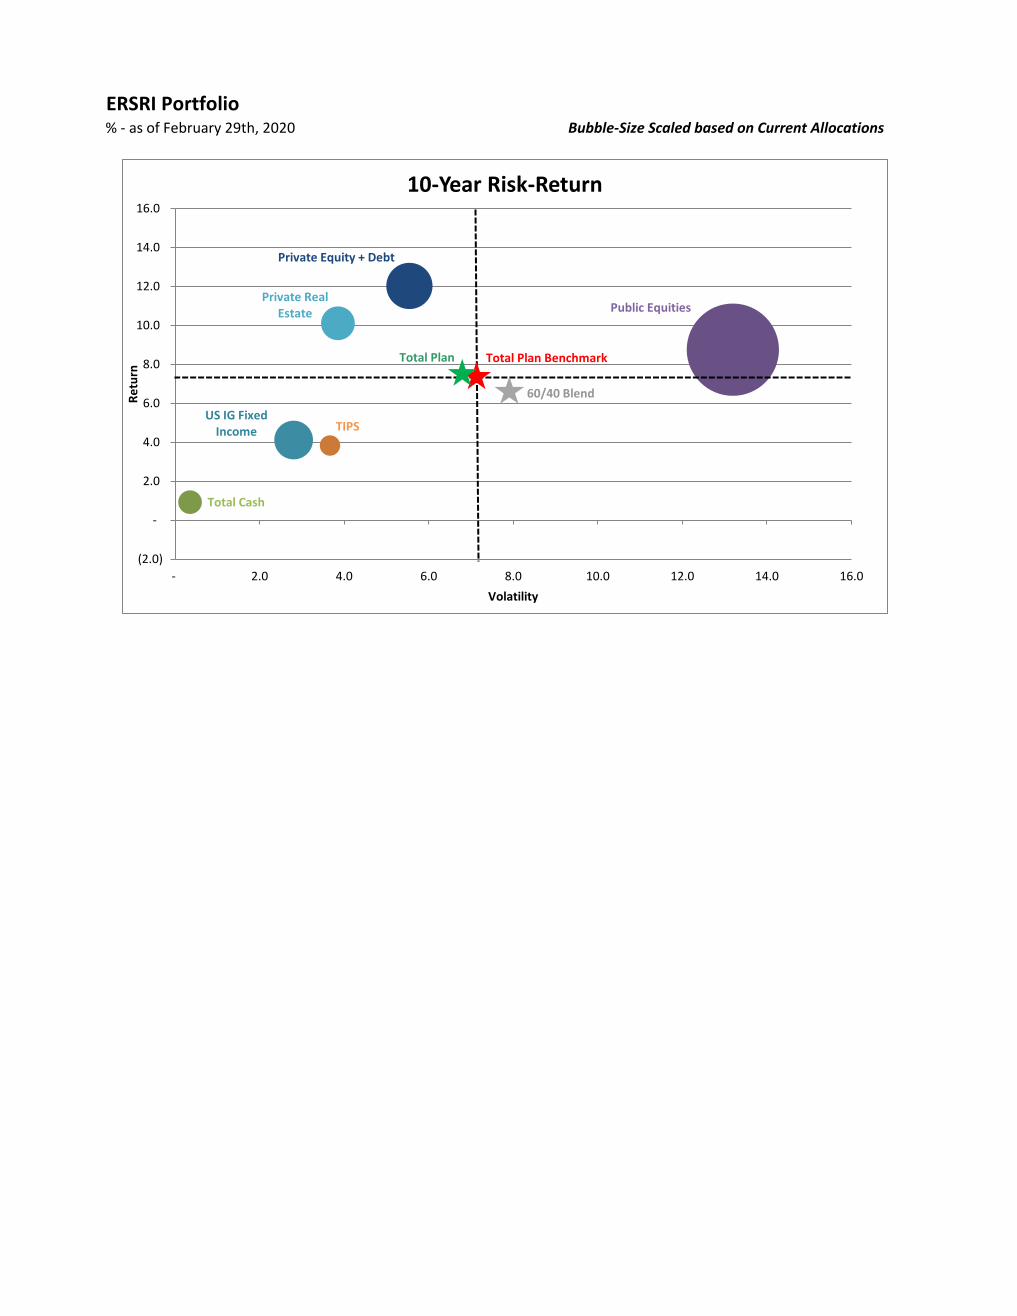
ERSRI Portfolio% - as of February 29th, 2020 Bubble-Size Scaled based on Current Allocations
Total Plan BenchmarkTotal Plan
Total Cash
Public Equities
TIPSUS IG Fixed
Income
Private Equity + Debt
60/40 Blend
Private Real Estate
(2.0)
-
2.0
4.0
6.0
8.0
10.0
12.0
14.0
16.0
- 2.0 4.0 6.0 8.0 10.0 12.0 14.0 16.0
Retu
rn
Volatility
10-Year Risk-Return

Section VI.
Performance Overview

Total Performance Summary
TOTAL NET OF FEES2/29/2020
Report ID: IPM0005
Reporting Currency: USD
Account Name Benchmark Name Market Value % of Total Month YTD Fiscal YTD 1 Year 3 Years 5 Years 10 Years ITD
Inception Date
US Public Equity 1,330,171,705 16 -8.19 -8.31 1.20 7.01 9.34 8.80 12.27 8.04 8/1/2007Russell 3000 Index -8.19 -8.29 1.22 6.90 9.28 8.72 12.48 8.02 8/1/2007
Non-US Public Equity 1,129,776,131 13 -7.43 -10.30 -4.00 -0.70 4.36 2.42 4.54 6.98 5/1/2009Total International Equity BM -7.90 -10.38 -4.14 -0.69 4.15 2.18 4.20 6.33 5/1/2009
QVM Tilt 1,171,252,110 14 -8.65 -9.50 -1.70 2.30 6.69 8.87 10/1/2015MSCI World Net Dividend Index -8.45 -9.01 -0.69 4.63 7.24 9.15 10/1/2015
Total Public Growth 3,631,199,946 43 -8.10 -9.31 -1.39 3.02 6.82 5.58 8.76 4.61 7/1/2000MSCI All Country World Net Index -8.08 -9.09 -0.98 3.89 6.96 5.55 8.10 7/1/2000
Private Equity 693,239,451 8 1.19 0.92 9.43 13.06 16.13 13.31 12.60 9.75 2/1/19891.19 0.92 5.15 8.26 13.28 10.98 13.84 2/1/1989
157,021,225 2 0.83 0.83 4.02 8.52 15.94 7/1/2017
59,096,110 1 3.03 4.67 7.75 7.30 11.00 7/1/20173.03 4.67 6.58 7.20 8.03 7/1/2017
ILPA All Fds BM 1Q Lag 2
Non Core Real Estate
Opportunistic Private CreditILPA Distressed BM 1Q Lag
Total Private Growth 909,356,785 11 1.24 1.14 8.32 11.86 15.28 7/1/2017Private Growth Benchmark 1.29 1.37 5.20 8.17 7/1/2017
54 -6.36 -7.39 0.44 4.73 7.20 7/1/2017TOTAL GROWTH COMPOSITETotal Growth Composite BM
4,540,556,732RI6G60000000 -5.52 -6.26 0.79 5.23 7/1/2017
79,303,628 1 -9.74 -13.41 -18.51 -15.05 -7.98 -7.38 -7.23 1/1/2015Harvest Fund AdvisorAlerian MLP Index -14.05 -18.87 -26.09 -23.46 -12.41 -10.62 -10.48 1/1/2015
1 -7.65 -6.06 0.24 1.95 6/1/201980,024,1050002IX1F00370207B -8.00 -6.97 -1.20 -0.11 6/1/2019
2 -8.95 -8.95 2/1/2020159,340,853002RI6GX0903CBOB -10.25 2/1/2020
Heitman US FocusedMSCI US REIT Index
RI6G06700000IX1F00370207NB US PutWrite
CBOE S&P 500 PutWrite Price Index RI6G06700000Liquid Credit 307,630,552 4 -1.53 -1.41 1.98 3.94 4.17 3.96 5/1/2013
Liquid Credit BM (50% BoA US HY/50% CS LL) RI6G06700000RI6GX -1.45 -1.19 2.01 4.58 4.21 4.36
-10.25
3.624.23 5/1/2013
Private Credit 159,965,254 2 4.37 2.98 3.92 7/1/2017S&P LSTA Lev Loans + 3%
-0.010.96
-0.010.93 4.90 7.21 6.88 7/1/2017
TOTAL INCOME COMPOSITE 9 -4.18 -4.45 -2.11 -0.39 1.87 7/1/2017Income Aggregate BM
786,264,392RI6G60000000 -3.51 -3.98 -2.80 -0.23 2.39 7/1/2017
Annualized

Total Performance Summary
TOTAL NET OF FEES2/29/2020
Report ID: IPM0005
Reporting Currency: USD
Account Name Benchmark Name Market Value % of Total Month YTD Fiscal YTD 1 Year 3 Years 5 Years 10 Years ITD
Inception Date
480,202,341 6 6.65 13.89 17.88 31.56 10.08 6/1/20176.70 14.00 17.96 31.64 10.29 6/1/2017
453,262,645 5 1.72 2.36 0.92 13.18 0.20 6/1/2017-8.54 6/1/2017
CPC Long DurationBarclays US Treasury LT Index
CPC Trend FollowingCredit Suisse Liquid Alt Beta
Total Crisis Protection 933,464,986 11 22.13 6/1/201750/50 CPC Custom BM RI6G05010000
-3.87
4.201.42
-8.46
8.042.46
-15.18
9.180.43 10.21
-7.83
5.411.26 6/1/2017
187,960,455 2 0.00 1.62 9.27 17.19 14.37 10.58 10.58 3/1/20150.71 0.94 3.37 6.49 6.04 3/1/2015
331,325,767 4 0.44 1.03 3.70 4.56 6.19 7/1/20170.44 1.03 2.90 5.72 6.21 7/1/2017
178,204,983 2 1.02 2.36 4.08 8.24 3.31 2.61 3.84 3.83 11/1/20090.87 2.17 3.81 7.86 3.19 2.64 3.83 3.80 11/1/2009
Priv Listed InfrastructureCPI + 4% 1 Mo Lag
Core Real EstateNFI-ODCE BM 2
Inflation-Linked BondsTotal Inflation Linked Custom
Total Inflation Protection 697,491,205 8 0.47 1.53 5.29 8.43 7.10 7/1/2017Inflation Protection Custom BM RI6G65000000 0.62 1.29 3.38 5.90 5.25 7/1/2017
568,694,574 7 0.89 1.65 4.58 8.56 7.09 7/1/20170.79 3.22 2.66 7/1/2017
639,090,742 8 6.13 11.55 5.00 3.60 4.13 5.22 7/1/2000
-1.60
1.361.80
-1.30
3.343.76 6.30 11.68 5.01 3.58 3.93 5.11 7/1/2000
Absolute ReturnHFRI Fund of Funds Composite Index
Traditional Fixed IncomeBloomberg Barclays U.S. Aggregate Bond Index
ERSRI SMA CashStrategic Cash 186,879,341 2 0.29 0.57 1.82 2.89 2.16 2.11 2/1/2017
ICE BofAML US Treasury Notes 0-1 Year 0.27 0.43 1.55 2.56 1.87 1.84 2/1/2017
Total Volatility Protection 1,394,667,430 16 1.06 2.40 5.05 9.37 5.36 7/1/2017Total Volitility Protection BM -0.13 0.71 2.90 6.67 7/1/2017
RI6GX0903STB3,025,623,620 36 1.86 3.76 6.35 12.10 5.94 7/1/2017TOTAL STABILITY COMPOSITE
Total Stability Composite BM 0.52 1.38 2.73 7.55 7/1/2017
52,506,365 1 0.12 0.25 1.34 4.78 2.84 7/1/2017
49,666,526 1 0.25 0.27 0.24 0.30 0.14 0.10 0.01 -0.01 9/1/2008
Short-Term CashRI6G67000000Russell Overlay FdRI6G67000000TOTAL PLAN 8,471,513,137 100 -3.07 -3.04 2.56 7.22 6.87 5.62 7.53 5.10 7/1/2000
-3.29 -3.49 1.09 5.58 6.29 5.15 7.31 7/1/2000Total Plan Benchmark60/40 Blend -4.13 -4.02 2.08 7.28 6.41 4.97 6.67 7/1/2000
Total Plan ex PE,RE & Priv Inf 6,882,904,876 81 -3.92 -3.94 1.61 6.63 5.87 4.67 6.77 6.20 4/1/1996Total Plan BM ex PE RE -4.68 -4.98 -0.07 4.88 5.05 4.08 6.60 4/1/1996
Annualized

TOTAL PLAN The current composition of the Total Plan Benchmark is as follows:
GROWTH
Total Public Growth
40% MSCI ACWI Net
Total Private Growth
11.25% ILPA All Funds Index, 1Q Lag
2.25% ODCE, 1Q Lag + 2.5%
1.5% ILPA Distressed Index, 1Q Lag
INCOME
1% Alerian MLP Index
1% MSCI US REIT Index
2% CBOE PUT Index
2% EMD 50/50 Blended Benchmark (50% JPM EMBI/50% GBI-EM)
2.8% Liquid Credit Custom (50% BofA US HY/50% CS LL)
3.2% S&P LSTA Lev Loans + 3%
STABILITY
Crisis Protection Class
5% CS Managed Futures 18% Vol Index
5% Barclays Long Duration US Treasury Index
Inflation Protection
3.6% NFI-ODCE Index, 1Q Lag
2.4% CPI + 4%, 1 Month Lag
2% Barclays 1-10 Year TIPS Index
Volatility Protection
3.25% Bloomberg Barclays US Corporate Bond Index
3.25% Bloomberg Barclays Securitized MBS/ABS/CMBS Index
6.5% HFRI FOF Composite
2.0% BofA Merrill Lynch US T-Notes 0-1 Yr
Total Performance Summary
END NOTES2/29/2020

Total Performance Summary
TOTAL NET OF FEES2/29/2020
Report ID: IPM0005
Reporting Currency: USD
Account Name Benchmark Name Market Value % of Total Month
1/1/2020 - 1/31/2020
12/1/2019 - 12/31/2019 YTD 2019 2018 2017 Inception Date
1,330,171,705 16 -8.19 -0.14 2.87 -8.31 31.16 -5.17 21.14 8/1/2007-8.19 -0.11 2.89 -8.29 31.02 -5.24 21.13 8/1/2007
1,129,776,131 13 -7.43 -3.11 4.75 -10.30 21.27 -13.85 27.76 5/1/2009-7.90 -2.69 4.33 -10.38 21.51 -14.20 27.19 5/1/2009
1,171,252,110 14 -8.65 -0.93 2.96 -9.50 24.42 -7.96 23.36 10/1/2015-8.45 -0.61 3.00 -9.01 27.67 -8.71 22.40 10/1/2015
US Public EquityRussell 3000 Index
Non-US Public EquityTotal International Equity BM
QVM TiltMSCI World Net Dividend Index
Total Public Growth 3,631,199,946 43 -8.10 -1.32 3.47 -9.31 25.77 -9.20 24.11 7/1/2000MSCI All Country World Net Index -8.08 -1.10 3.52 -9.09 26.60 -9.41 23.97 7/1/2000
693,239,451 8 1.19 -0.26 3.16 0.92 12.54 17.38 19.69 2/1/19891.19 0.60 0.92 7.27 16.01 15.74 2/1/1989
157,021,225 2 0.83 1.49 0.83 8.19 25.66 7/1/2017
59,096,110 1 3.03 4.67 1.40 11.81 7/1/20173.03
-0.26
0.00
1.591.59 4.67 2.42 7.95 7/1/2017
Private EquityILPA All Fds BM 1Q Lag 2
Non Core Real Estate
Opportunistic Private CreditILPA Distressed BM 1Q Lag
Total Private Growth 909,356,785 11 1.24 1.14 11.02 18.83 7/1/2017Private Growth Benchmark 1.29
-0.100.08
-0.170.34
2.640.69 1.37 6.78 14.22 7/1/2017
TOTAL GROWTH COMPOSITE 54 -6.36 -1.10 3.32 -7.39 23.15 -5.23 7/1/2017Total Growth Composite BM
4,540,556,732RI6G60000000 -5.52 -0.78 2.75 -6.26 21.04 -3.23 7/1/2017
79,303,628 1 -9.74 -4.07 7.68 -13.41 14.57 -13.27 -5.26 1/1/2015-14.05 8.53 -18.87 6.56 -12.42 -6.52 1/1/2015
Harvest Fund AdvisorAlerian MLP Index
RI6G06700000Heitman US Focused 80,024,105 1 -7.65 -0.69 -6.06 6/1/2019
MSCI US REIT Index IX1F00370207 -8.00
-5.61
1.721.12 -0.83 -6.97 6/1/2019
159,340,853 2 -8.95 2/1/2020RI6GX0903CBO -10.25 2/1/2020
NB US PutWriteCBOE S&P 500 PutWrite Index
RI6G06700000Liquid Credit 307,630,552 4 -1.53 0.12 1.43 -1.41 10.99 0.78 3.54 5/1/2013
Liquid Credit BM (50% BoA US HY/50% CS LL) RI6GX0903AGG -1.45 0.27 1.85 -1.19 11.27 4.60 5/1/2013
Private Credit 159,965,254 2 0.00 0.94 3.24 7/1/2017S&P LSTA Lev Loans + 3%
-0.010.96 -0.03 0.74
-0.010.93 6.10
-0.57
3.718.19 7/1/2017
TOTAL INCOME COMPOSITE 9 -4.18 -0.28 1.84 -4.45 11.52 7/1/2017Income Aggregate BM
786,264,392RI6G60000000 -3.51 -0.48 2.69 -3.98 8.70
-2.470.57 7/1/2017
Cumulative

Total Performance Summary
TOTAL NET OF FEES2/29/2020
Report ID: IPM0005
Reporting Currency: USD
Account Name Benchmark Name Market Value % of Total Month
1/1/2020 - 1/31/2020
12/1/2019 - 12/31/2019 YTD 2019 2018 2017 Inception Date
480,202,341 6 6.65 6.80 -2.72 13.89 14.90 -1.89 6/1/20176.70 6.85 -2.79 14.00 14.83 -1.84 6/1/2017
453,262,645 5 1.72 0.63 -2.15 2.36 3.86 -15.11 6/1/2017-1.30 -10.01 6/1/2017
CPC Long DurationBarclays US Treasury LT Index
CPC Trend FollowingCredit Suisse Liquid Alt Beta
Total Crisis Protection 933,464,986 11 -2.44 -7.99 6/1/201750/50 CPC Custom BM RI6G05010000
-3.87
4.201.42
-4.78
3.691.03 -2.05
-8.46
8.042.46
-9.85
9.331.98 -5.45 6/1/2017
187,960,455 2 0.00 1.62 1.21 1.62 16.67 13.32 12.45 3/1/20150.71 0.24 0.27 0.94 6.05 6.18 6.20 3/1/2015
331,325,767 4 0.44 0.59 0.35 1.03 5.03 7.22 7/1/20170.44 0.59 1.08 1.03 4.64 7.71 7/1/2017
178,204,983 2 1.02 1.32 0.67 2.36 7.03 -0.23 1.73 11/1/20090.87 1.30 0.70 2.17 6.85 1.90 11/1/2009
Priv Listed InfrastructureCPI + 4% 1 Mo Lag
Core Real EstateNFI-ODCE BM 2
Inflation-Linked BondsTotal Inflation Linked Custom
Total Inflation Protection 697,491,205 8 0.47 1.06 0.62 1.53 8.22 7/1/2017Inflation Protection Custom BM RI6G65000000 0.62 0.66 1.32 1.29 5.70
-0.25
6.303.84 7/1/2017
568,694,574 7 0.89 0.75 1.38 1.65 8.92 4.48 7/1/20170.31 1.63 8.40 -4.02 7/1/2017
639,090,742 8 1.95 0.01 9.33 3.99 7/1/2000
-1.60
1.361.80 1.92 -0.07
-1.30
3.343.76 8.72
-0.500.01 3.54 7/1/2000
Absolute ReturnHFRI Fund of Funds Composite Index
Traditional Fixed IncomeBloomberg Barclays U.S. Aggregate Bond Index
ERSRI SMA CashStrategic Cash 186,879,341 2 0.29 0.27 0.20 0.57 2.94 1.88 2/1/2017
ICE BofAML US Treasury Notes 0-1 Year 0.27 0.16 0.16 0.43 2.57 1.92 2/1/2017
Total Volatility Protection 1,394,667,430 16 1.06 1.32 0.53 2.40 8.31 1.41 7/1/2017Total Volitility Protection BM -0.13 0.84 0.49 0.71 7.75 -0.95 7/1/2017
36 1.86 1.86 3.76 8.52 0.57 7/1/2017TOTAL STABILITY COMPOSITETotal Stability Composite BM
3,025,623,620RI6GX0903STB 0.52 0.86
-0.130.12 1.38 6.18 -0.79 7/1/2017
52,506,365 1 0.12 0.13 0.20 0.25 4.93 1.76 7/1/2017
49,666,526 1 0.25 0.02 -0.05 0.27 0.17 0.06 -0.09 9/1/2008
Short-Term CashRI6G67000000Russell Overlay FdRI6G67000000TOTAL PLAN 8,471,513,137 100 -3.07 0.04 1.91 -3.04 16.66 -2.69 14.48 7/1/2000
-3.29 1.77 -3.49 14.51 -1.94 14.30 7/1/2000Total Plan Benchmark60/40 Blend -4.13
-0.210.11 2.09 -4.02 19.41 -5.52 15.41 7/1/2000
Total Plan ex PE,RE & Priv Inf 6,882,904,876 81 -3.92 -0.01 1.94 -3.94 18.20 -5.64 14.66 4/1/1996Total Plan BM ex PE RE -4.68 -0.32 2.10 -4.98 17.16 -6.02 14.79 4/1/1996
Cumulative

TOTAL PLAN Month - Current Month
Cumulative Months - Prior Month and Second Prior Month
Monthly Reporting for Private Equity and Real Estate skew performance on an actual and benchmark basis due to nature of valuations
Total Performance Summary
END NOTES2/29/2020
The current composition of the Total Plan Benchmark is as follows:
GROWTH
Total Public Growth
40% MSCI ACWI Net
Total Private Growth
11.25% ILPA All Funds Index, 1Q Lag
2.25% ODCE, 1Q Lag + 2.5%
1.5% ILPA Distressed Index, 1Q Lag
INCOME
1% Alerian MLP Index
1% MSCI US REIT Index
2% CBOE PUT Index
2% EMD 50/50 Blended Benchmark (50% JPM EMBI/50% GBI-EM)
2.8% Liquid Credit Custom (50% BofA US HY/50% CS LL)
3.2% S&P LSTA Lev Loans + 3%
STABILITY
Crisis Protection Class
5% CS Managed Futures 18% Vol Index
5% Barclays Long Duration US Treasury Index
Inflation Protection
3.6% NFI-ODCE Index, 1Q Lag
2.4% CPI + 4%, 1 Month Lag
2% Barclays 1-10 Year TIPS Index
Volatility Protection
3.25% Bloomberg Barclays US Corporate Bond Index
3.25% Bloomberg Barclays Securitized MBS/ABS/CMBS Index
6.5% HFRI FOF Composite
2.0% BofA Merrill Lynch US T-Notes 0-1 Yr

Section VII.
Private Equity & Private Credit
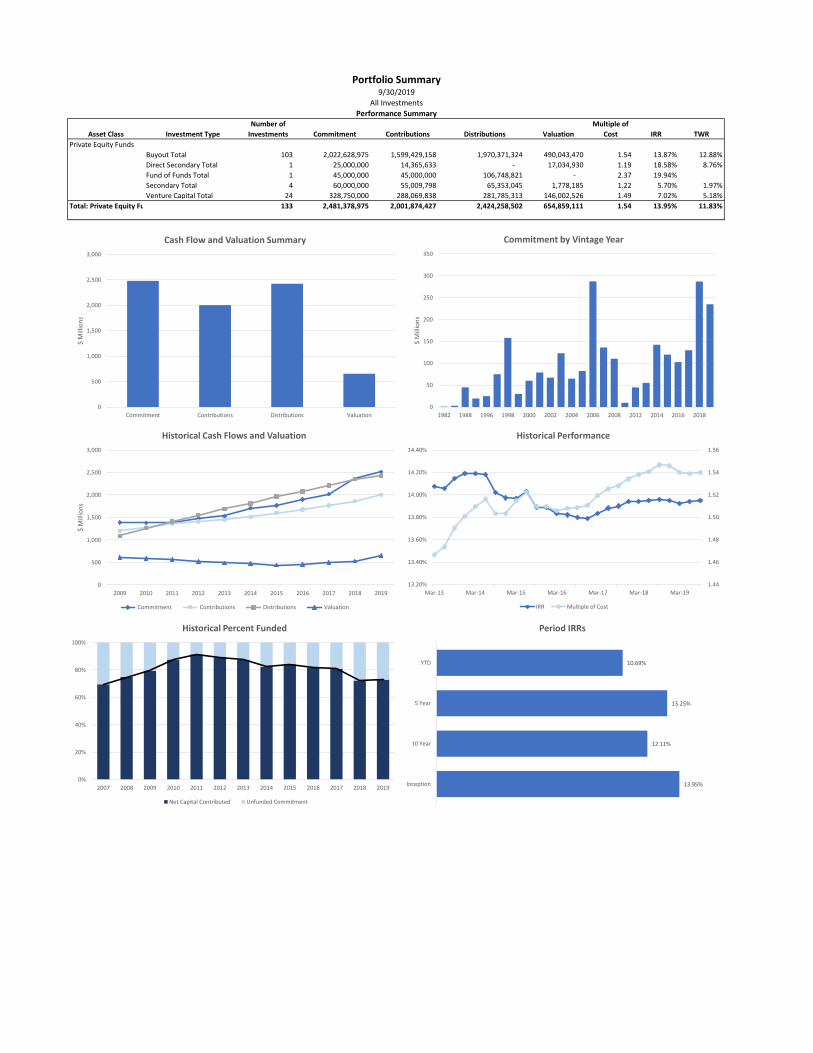
Asset Class Investment Type
Number of
Investments Commitment Contributions Distributions Valuation
Multiple of
Cost IRR TWR
Private Equity Funds
Buyout Total 103 2,022,628,975 1,599,429,158 1,970,371,324 490,043,470 1.54 13.87% 12.88%
Direct Secondary Total 1 25,000,000 14,365,633 - 17,034,930 1.19 18.58% 8.76%
Fund of Funds Total 1 45,000,000 45,000,000 106,748,821 - 2.37 19.94%
Secondary Total 4 60,000,000 55,009,798 65,353,045 1,778,185 1.22 5.70% 1.97%
Venture Capital Total 24 328,750,000 288,069,838 281,785,313 146,002,526 1.49 7.02% 5.18%
Total: Private Equity Funds 133 2,481,378,975 2,001,874,427 2,424,258,502 654,859,111 1.54 13.95% 11.83%
Portfolio Summary9/30/2019
All Investments
Performance Summary
0
500
1,000
1,500
2,000
2,500
3,000
Commitment Contributions Distributions Valuation
$ M
illio
ns
Cash Flow and Valuation Summary
0
50
100
150
200
250
300
350
1982 1988 1996 1998 2000 2002 2004 2006 2008 2012 2014 2016 2018$
Mill
ion
s
Commitment by Vintage Year
0
500
1,000
1,500
2,000
2,500
3,000
2009 2010 2011 2012 2013 2014 2015 2016 2017 2018 2019
$ M
illio
ns
Historical Cash Flows and Valuation
Commitment Contributions Distributions Valuation
1.44
1.46
1.48
1.50
1.52
1.54
1.56
13.20%
13.40%
13.60%
13.80%
14.00%
14.20%
14.40%
Mar-13 Mar-14 Mar-15 Mar-16 Mar-17 Mar-18 Mar-19
Historical Performance
IRR Multiple of Cost
0%
20%
40%
60%
80%
100%
2007 2008 2009 2010 2011 2012 2013 2014 2015 2016 2017 2018 2019
Historical Percent Funded
Net Capital Contributed Unfunded Commitment
13.95%
12.11%
13.25%
10.69%
Inception
10 Year
5 Year
YTD
Period IRRs

Current PartnershipsVintage
Year/Initial Investment
TypeAmount Committed (In
$ unless otherwise noted)
Amount Drawn
Amount Distributed
Amount Unfunded Valuation ($) Net IRR (%) Net Multiple of
Investment
Nautic Partners V 2000 Buyout 20,000,000 20,331,229 40,506,615 600,000 41,986,437 17.09 2.07CVC European Equity Partners III 2001 Buyout € 20,000,000 23,760,732 59,551,716 200,000 60,862,142 41.03 2.56Parthenon Investors II 2001 Buyout 23,960,000 23,409,381 37,415,960 1,916,800 37,719,362 12.23 1.61Leeds IV 2003 Buyout 10,000,000 10,209,327 13,390,948 1,100,000 13,411,725 4.28 1.31Nordic Capital V 2003 Buyout € 14,615,550 18,203,152 47,996,633 - 48,291,319 20.21 2.65TPG Partners IV 2003 Buyout 15,000,000 16,672,684 31,655,907 - 32,106,256 15.43 1.93Aurora Equity Partners III 2004 Buyout 15,000,000 16,243,392 26,952,245 900,000 27,063,165 14.85 1.67First Reserve Fund X 2004 Buyout 20,000,000 19,999,999 36,485,800 - 36,553,692 31.03 1.83Birch Hill Equity Partners III 2005 Buyout CAD 18,000,000 15,488,068 30,211,113 135,918 31,794,709 13.19 2.05CVC Equity Partners IV 2005 Buyout € 16,500,000 17,696,691 34,604,836 2,158,002 34,622,315 16.64 1.96Providence Equity Partners V 2005 Buyout 25,000,000 31,142,133 36,171,706 2,250,000 36,471,626 3.03 1.17Charterhouse VIII 2006 Buyout 15,000,000 14,632,455 15,519,381 - 15,568,886 0.98 1.06Fenway III 2006 Buyout 15,000,000 17,285,636 26,618,650 900,000 27,998,884 7.50 1.62First Reserve Fund XI 2006 Buyout 20,000,000 22,125,580 15,331,412 - 16,379,497 -7.01 0.74Nordic Capital VI 2006 Buyout € 15,000,000 17,754,759 30,449,027 - 30,698,038 8.62 1.73TPG Partners V 2006 Buyout 20,000,000 20,697,887 27,486,167 400,000 28,578,430 4.97 1.38Green Equity V 2007 Buyout 20,000,000 20,422,420 39,600,087 1,800,000 47,330,069 18.51 2.32Kayne Anderson IV 2007 Buyout 15,000,000 16,605,519 17,447,153 - 17,838,463 2.41 1.07Nautic Partners VI 2007 Buyout 20,000,000 24,233,473 50,881,593 600,000 55,624,896 17.43 2.30Providence Equity Partners VI 2007 Buyout 25,000,000 29,531,677 31,539,322 1,250,000 37,897,378 4.91 1.28Trilantic Capital Partners IV 2007 Buyout 11,098,351 11,611,409 17,227,741 1,442,786 18,373,960 13.49 1.58Bain Capital X 2008 Buyout 25,000,000 24,300,000 35,703,798 750,000 41,050,261 9.95 1.69CVC Equity Partners V 2008 Buyout € 20,000,000 23,861,334 49,059,248 217,980 52,610,792 20.05 2.20Nordic Capital VII 2008 Buyout € 15,000,000 16,856,174 26,471,511 817,425 26,764,207 8.18 1.59TPG Partners VI 2008 Buyout 10,000,000 13,924,603 16,766,716 400,000 19,155,379 8.62 1.38Advent International GPE VII-C 2012 Buyout 20,000,000 18,800,000 17,124,167 1,200,000 33,043,279 15.31 1.76Providence Equity Partners VII 2012 Buyout 25,000,000 31,886,316 28,029,573 4,250,000 51,959,184 21.30 1.63EnCap Energy IX 2013 Buyout 18,000,000 20,203,414 15,264,264 1,260,000 25,263,205 9.54 1.25Nordic Capital VIII 2013 Buyout 15,000,000 17,604,584 11,328,626 9,972,585 26,760,389 15.44 1.52Riverside Capital Appreciation Fund VI 2013 Buyout 20,000,000 18,519,214 11,522,380 2,200,000 27,354,458 13.16 1.48Carlyle Asia Partners IV 2014 Buyout 30,000,000 34,043,514 13,356,591 2,700,000 41,725,541 8.06 1.23CVC Capital Partners VI 2014 Buyout € 15,000,000 18,521,806 8,247,721 3,433,185 25,357,134 13.97 1.37Nautic Partners VII 2014 Buyout 20,000,000 18,657,570 24,765,438 3,400,000 36,078,954 41.99 1.93Riverside Micro-Cap III 2014 Buyout 20,000,000 21,874,016 14,135,671 2,400,000 62,157,993 30.66 2.84Sorenson Capital Partners III 2014 Buyout 30,000,000 27,964,630 4,445,661 10,500,000 35,422,652 8.61 1.27Baring Asia VI 2015 Buyout 15,000,000 15,272,501 3,313,782 1,950,000 20,271,462 14.60 1.33Centerbridge Capital Partners III 2015 Buyout 25,000,000 16,092,081 5,154,875 14,000,000 22,815,796 15.95 1.42EnCap Energy X 2015 Buyout 25,000,000 21,973,582 4,101,073 4,500,000 26,327,967 9.29 1.20Paine & Partners Capital IV 2015 Buyout 30,000,000 22,576,022 6,305,447 8,100,000 28,941,411 10.27 1.28Advent International GPE VIII 2016 Buyout 20,000,000 17,370,000 - 2,600,000 21,703,743 14.65 1.25Nautic Partners VIII 2016 Buyout 20,000,000 13,865,883 11,217,232 8,200,000 18,450,344 56.43 1.33Southvest Partners VII 2016 Buyout 37,500,000 14,917,810 2,283,474 23,250,000 10,914,821 -31.77 0.73Tenex Capital Partners II 2016 Buyout 25,000,000 18,166,214 1,978,499 8,500,000 23,047,488 15.03 1.27CVC Capital Partners VII 2017 Buyout € 35,000,000 6,062,045 160,682 32,043,060 7,679,087 N/M 1.27EnCap Energy XI 2017 Buyout 50,000,000 10,206,826 - 40,000,000 8,323,654 -18.97 0.82RLH IV 2017 Buyout 40,000,000 9,542,596 - 30,400,000 7,805,675 -21.33 0.82Altaris Constellation Partners IV 2018 Buyout 24,000,000 11,516,157 - 12,480,000 13,211,723 N/M 1.15Altaris IV 2018 Buyout 6,000,000 1,848,514 - 4,140,000 2,322,536 N/M 1.26Baring Asia VII 2018 Buyout 50,000,000 12,629,258 - 37,500,000 11,683,004 N/M 0.93Carlyle Asia V 2018 Buyout 50,000,000 4,641,341 15,021 45,500,000 5,068,828 N/M 1.09
Employees' Retirement System of Rhode Island Private Equity Performance9/30/2019
Cumulative Cash Flows ($) Cumulative Performance*
*IRR refers to the fund's Internal Rate of Return, or the annualized compounded yield on an investment. This calculation is typically applied in private equity where there are multiple points at which capital is invested (capital called) and at which it is distributed. A positive IRR means that the fund's current value plus any cash distributions are greater than the cash value contributed and management fees paid. Typically a fund will have a negative IRR during the first few years of its life, a period referred to as the “J-Curve”, because cash is invested upfront and it takes time to generate value. It is important to consider a fund's start date (vintage year) when assessing IRRs. Multiple of investment is another indicator of returns, and is calculated by dividing the fund's cumulative distributions and current value, after fees, by the amount of capital paid in. Please note that performance calculations are specific to the ERSRI investment, and were not prepared, reviewed or approved by the General Partners.

Current PartnershipsVintage
Year/Initial Investment
Type Amount Committed (In $ unless otherwise noted) Amount Drawn Amount Distributed Amount Unfunded Valuation ($) Net IRR (%) Net Multiple of
Investment
German Equity Partners V 2018 Buyout € 21,500,000 2,308,245 - 21,089,565 1,567,315 N/M 0.68Level Equity Opportunities Fund 2018 Growth 15,000,000 3,161,802 - 11,850,000 3,478,322 N/M 1.10Siris Partners IV 2018 Buyout 50,000,000 15,247,092 - 35,000,000 15,538,416 N/M 1.02Hastings Equity IV 2019 Buyout 25,000,000 8,666,387 - 16,250,000 7,629,432 N/M 0.88Riverside Micro-Cap V 2019 Buyout 25,000,000 5,051,652 - 20,000,000 4,451,394 N/M 0.88Vinci Capital Partners III-B 2019 Buyout 30,000,000 7,009,757 365,313 23,700,000 5,901,425 N/M 0.84Eureka III 2019 Direct Secondary 25,000,000 14,365,633 (753) 10,750,000 17,034,177 N/M 1.19Coller V 2006 Secondary 15,000,000 12,620,912 16,902,008 3,300,000 17,886,345 7.92 1.42W Capital II 2007 Secondary 15,000,000 14,896,718 19,924,585 1,650,000 20,718,433 10.24 1.39Granite Global Ventures II 2004 Venture Capital 15,000,000 14,333,510 22,180,375 600,000 23,251,582 6.20 1.62Leapfrog II 2005 Venture Capital 10,000,000 9,715,000 6,811,564 300,000 10,616,654 1.42 1.09Alta VIII 2006 Venture Capital 15,000,000 15,000,000 28,214,986 - 46,578,647 19.38 3.11Castile Ventures III 2006 Venture Capital 5,000,000 5,009,730 1,396,371 - 1,615,900 -23.63 0.32Granite Global Ventures III 2006 Venture Capital 15,000,000 14,625,748 41,675,138 300,000 42,120,867 18.37 2.88Point 406 Ventures I 2006 Venture Capital 10,000,000 11,317,207 12,372,105 200,000 18,805,386 8.02 1.66Point Judith Venture II 2006 Venture Capital 5,000,000 6,286,683 7,928,451 100,000 9,191,873 5.76 1.46Lighthouse VI 2007 Venture Capital 15,000,000 14,250,000 19,832,947 750,000 20,282,811 6.81 1.42Paladin III 2008 Venture Capital 10,000,000 13,439,505 9,624,614 200,000 25,985,493 12.17 1.93Industry Ventures III 2014 Venture Capital 25,000,000 25,670,775 5,106,429 1,750,000 51,051,795 24.35 1.99Industry Ventures III Co-Inv. 2015 Venture Capital 15,000,000 11,626,161 1,055,227 3,300,000 18,184,917 22.41 1.56Industry Ventures IV 2015 Venture Capital 10,000,000 6,760,000 489,841 3,200,000 8,209,986 14.00 1.21Level Equity Growth Partners IV 2018 Growth 17,500,000 5,030,032 - 12,425,000 4,625,369 N/M 0.92Industry Ventures V 2019 Venture Capital 30,000,000 4,410,000 78,296 25,500,000 5,125,635 N/M 1.16Other funds in aggregrate** 55,000,000 57,992,545 49,805,642 1,050,000 66,927,597
Total 1,595,682,839$ 1,210,550,702 1,221,558,600 525,582,306 1,877,221,986
**Other funds in aggregate are the total commitments to and amounts drawn and distributed by funds whose confidentiality provisions do not permit the disclosure of their performance data. These funds include Braemar Energy Ventures III, Constellation Ventures III,Thomas, McNerney & Partners and Thomas McNerney & Partners II.“ In addition, other funds in aggregate includes commitments to funds where no capital has been drawn, as well as funds in final liquidation.
*IRR refers to the fund's Internal Rate of Return, or the annualized compounded yield on an investment. This calculation is typically applied in private equity where there are multiple points at which capital is invested (capital called) and at which it is distributed. A positive IRR means that the fund's current value plus any cash distributions are greater than the cash value contributed and management fees paid. Typically a fund will have a negative IRR during the first few years of its life, a period referred to as the “J-Curve”, because cash is invested upfront and it takes time to generate value. It is important to consider a fund's start date (vintage year) when assessing IRRs. Multiple of investment is another indicator of returns, and is calculated by dividing the fund's cumulative distributions and current value, after fees, by the amount of capital paid in. Please note that performance calculations are specific to the ERSRI investment, and were not prepared, reviewed or approved by the General Partners.
Employees' Retirement System of Rhode Island Private Equity Performance9/30/2019
Cumulative Cash Flows ($) Cumulative Performance*

Asset Class Investment Type
Number of
Investments Commitment Contributions Distributions Valuation
Multiple of
Cost IRR TWR
Private Credit Funds
Distressed Debt Total 15 298,000,000 231,323,412 256,283,733 63,550,920 1.38 10.13% 9.50%
Private Credit Total 7 225,000,000 208,139,185 61,222,221 167,443,105 1.10 5.91% 6.53%
Total: Private Credit Funds 22 523,000,000 439,462,597 317,505,954 230,994,025 1.25 9.52% 9.54%
Portfolio Summary9/30/2019
All Investments
Performance Summary
0
100
200
300
400
500
600
Commitment Contributions Distributions Valuation
$ M
illio
ns
Cash Flow and Valuation Summary
0
20
40
60
80
100
120
2006 2007 2008 2011 2012 2013 2014 2015 2016 2017 2018 2019
$ M
illio
ns
Commitment by Vintage Year
0
50
100
150
200
250
300
350
400
450
500
2008 2009 2010 2011 2012 2013 2014 2015 2016 2017 2018 2019
$ M
illio
ns
Historical Cash Flows and Valuation
Commitment Contributions Distributions Valuation
0.00
0.20
0.40
0.60
0.80
1.00
1.20
1.40
1.60
4.00%
5.00%
6.00%
7.00%
8.00%
9.00%
10.00%
11.00%
12.00%
Mar-13 Mar-14 Mar-15 Mar-16 Mar-17 Mar-18 Mar-19
Historical Performance
IRR Multiple of Cost
0%
20%
40%
60%
80%
100%
2007 2008 2009 2010 2011 2012 2013 2014 2015 2016 2017 2018 2019
Historical Percent Funded
Net Capital Contributed Unfunded Commitment
9.52%
10.42%
4.21%
3.96%
Inception
10 Year
5 Year
YTD
Period IRRs

Current PartnershipsVintage
Year/Initial Investment
TypeAmount Committed
(In $ unless otherwise noted)
Amount Drawn Amount Distributed
Amount Unfunded Valuation ($) Net IRR (%) Net Multiple
of Investment
GOF IV 2014 Private Credit 25,000,000 22,500,000 20,420,000 2,500,000 25,205,000 2.80 1.12CSIP V 2016 Private Credit 25,000,000 33,400,000 18,260,000 3,750,000 38,970,000 8.80 1.17Virgo Societas Partnership IV 2017 Private Credit 30,000,000 23,844,000 7,620,000 11,400,000 27,045,000 7.83 1.13Owl Rock Capital Corporation 2018 Private Credit 50,000,000 34,500,000 - 15,500,000 36,822,000 N/M 1.07Zephyrus Aviation Partners I 2019 Private Credit 50,000,000 50,000,000 3,679,000 - 53,172,000 N/M 1.06CCP 2006 Opportunistic Private Credit 15,000,000 23,811,000 40,606,000 900,000 42,411,000 19.35 1.78MHR III 2006 Opportunistic Private Credit 15,000,000 23,811,000 40,606,000 900,000 42,411,000 19.35 1.78WLR Recovery IV 2007 Opportunistic Private Credit 20,000,000 20,817,000 21,250,000 7,000,000 27,536,000 5.35 1.32OCM EPF III 2011 Opportunistic Private Credit 8,000,000 7,277,000 9,374,000 240,000 9,819,000 7.45 1.35Centerbridge Sp. Credit II 2012 Opportunistic Private Credit 20,000,000 20,697,000 24,955,000 2,200,000 27,112,000 10.28 1.31DK L-T Opps. IV 2018 Opportunistic Private Credit 50,000,000 42,120,000 318,000 9,000,000 42,185,000 N/M 1.00Other funds in aggregrate** 50,000,000 45,524,000 20,324,000 5,800,000 57,689,000
Total 363,000,000$ 334,324,000 166,806,000 68,490,000 397,445,000
**Other funds in aggregate are the total commitments to and amounts drawn and distributed by funds whose confidentiality provisions do not permit the disclosure of their performance data. These funds include Summit Credit Partners I and Summit Credit Partners II.
Employees' Retirement System of Rhode Island Private Credit Performance9/30/2019
Cumulative Cash Flows ($) Cumulative Performance*
*IRR refers to the fund's Internal Rate of Return, or the annualized compounded yield on an investment. This calculation is typically applied in private equity where there are multiple points at which capital is invested (capital called) and at which it is distributed. A positive IRR means that the fund's current value plus any cash distributions are greater than the cash value contributed and management fees paid. Typically a fund will have a negative IRR during the first few years of its life, a period referred to as the “J-Curve”, because cash is invested upfront and it takes time to generate value. It is important to consider a fund's start date (vintage year) when assessing IRRs. Multiple of investment is another indicator of returns, and is calculated by dividing the fund's cumulative distributions and current value, after fees, by the amount of capital paid in. Please note that performance calculations are specific to the ERSRI investment, and were not prepared, reviewed or approved by the General Partners.

Section VIII.
Crisis Protection Class
Account Name MTD Return
Annualized Return (Since
Inception)
Annualized Std. Dev (February
'20)
Annualized Std. Dev (Since Inception)
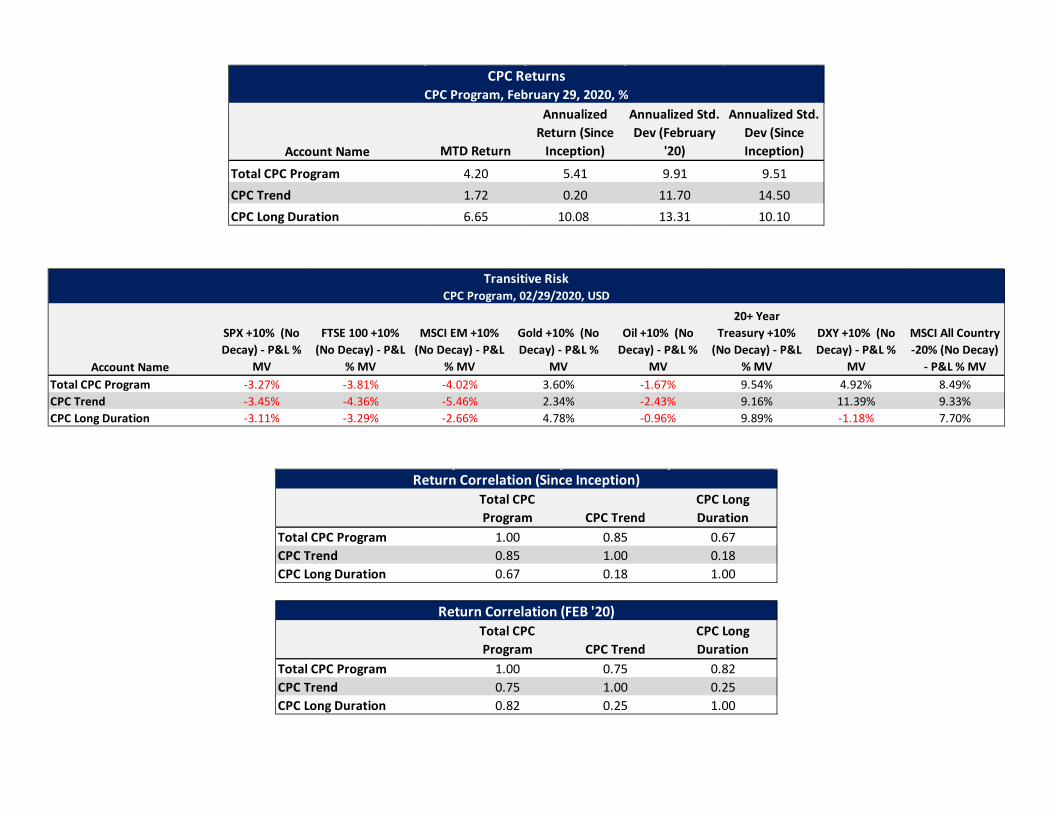
Total CPC Program 4.20 5.41 9.91 9.51CPC Trend 1.72 0.20 11.70 14.50CPC Long Duration 6.65 10.08 13.31 10.10
CPC ReturnsCPC Program, February 29, 2020, %
Transitive RiskCPC Program, 02/29/2020, USD
Account Name
SPX +10% (No Decay) - P&L %
MV
FTSE 100 +10% (No Decay) - P&L
% MV
MSCI EM +10% (No Decay) - P&L
% MV
Gold +10% (No Decay) - P&L %
MV
Oil +10% (No Decay) - P&L %
MV
20+ Year Treasury +10%
(No Decay) - P&L % MV
DXY +10% (No Decay) - P&L %
MV
MSCI All Country-20% (No Decay)
- P&L % MVTotal CPC Program -3.27% -3.81% -4.02% 3.60% -1.67% 9.54% 4.92% 8.49%CPC Trend -3.45% -4.36% -5.46% 2.34% -2.43% 9.16% 11.39% 9.33%CPC Long Duration -3.11% -3.29% -2.66% 4.78% -0.96% 9.89% -1.18% 7.70%
Total CPC Program CPC Trend
CPC Long Duration
Total CPC Program 1.00 0.85 0.67CPC Trend 0.85 1.00 0.18CPC Long Duration 0.67 0.18 1.00
Total CPC Program CPC Trend
CPC Long Duration
Total CPC Program 1.00 0.75 0.82CPC Trend 0.75 1.00 0.25CPC Long Duration 0.82 0.25 1.00
Return Correlation (Since Inception)
Return Correlation (FEB '20)

Section IX.
Absolute Return

Incep Return - Compounded
Employees' Retirement System of the State of Rhode IslandAbsolute Return Portfolio Current Value Current Month ReturnQTD Compounded ReturnYTD ReturnFYTD Compounded Return1 Year 3 Year 5 YearIncep Return - AnnualizedLTD Standard Deviation AnnualizedIncep Sharpe RatioInception Date
Portfolio Performance Summary
Estimated as of February 29, 2020 QTD Compounded ReturnYTD ReturnFYTD Return 1 Year 3 Year 5 Year Incep ReturnIncep Std Dev Incep Sharpe Ratio
Annualized Incep Return
LTD Sharpe Incep
Fund Market Value Actual % Feb QTD YTD FYTD 1 Year 3 Year 5 Year Incep Std Dev Beta Ratio Date
Absolute Return Portfolio
Capula Global Relative Value Fund Ltd. 80,826,706 14.3% 1.49% 1.49% 5.55% 7.64% 5.32% 6.23% 6.00% 1.76% -0.03 2.72 Dec-11
Davidson Kempner Institutional Partners, L.P. 86,079,794 15.3% 0.35% 0.35% 3.01% 5.83% 4.72% 4.78% 5.58% 2.01% 0.10 2.19 Nov-11
DE Shaw Composite Fund LLC 121,811,689 21.6% 2.11% 2.11% 7.06% 10.00% 11.41% 10.19% 12.48% 4.11% 0.03 2.63 Nov-11
Elliott Associates, L.P. 118,579,176 21.0%
-0.48%
1.80% 2.11% 2.11% 4.29% 8.85% 6.21% 7.80% 8.52% 3.52% 0.07 2.04 Nov-11
Graham Absolute Return Trading Ltd. 53,916,267 9.6% -3.53% -3.65% -3.65% -1.69% 2.37% 1.72% 2.21% 2.82% 5.77% 0.10 0.34 Jan-12
Viking Global Equities, LP 64,506,011 11.4% 1.10% 3.09% 3.09% 4.01% 12.91% 10.78% 6.70% 10.42% 7.50% 0.31 1.23 Dec-11
Winton Fund Limited 37,239,027 6.6% -5.76% -5.85% -5.85% -3.10% -1.49% 0.88% -0.14% 2.65% 8.41% 0.15 0.23 Dec-11
Absolute Return Portfolio - Total 562,958,671 99.8% -0.03% 0.73% 0.73% 3.69% 7.54% 6.81% 4.81% 6.13% 2.98% 0.16 1.68 Nov-11
HFRI Fund of Funds Composite Index -1.45% -1.15% -1.15% 0.93% 3.37% 2.83% 1.76% 3.12% 3.57% 0.60 Nov-11
MSCI AC World Index Free - Net -8.08% -9.09% -9.09% -0.98% 3.89% 6.96% 5.55% 8.39% 11.62% 0.67 Nov-11
ML 3-month T-Bills 0.15% 0.28% 0.28% 1.31% 2.18% 1.73% 1.13% 0.70% 0.25% - Nov-11
25% MSCI ACWI/75% Barclays Aggregate -0.67% 0.49% 0.49% 4.60% 9.97% 5.68% 4.24% 4.75% 3.47% 1.07 Nov-11
Liquidating Portfolio
Indus Asia Pacific Distribution Holding Company II, 06.30.14 Series
(liquidating trust) 301,054 0.1% -1.28% -1.25% -1.25% -6.69% -6.18% -4.13% -15.32% -10.18% 17.33% 0.34 -0.58 Jan-12
Luxor Capital Partners, LP - Liquidating SPV 712,218 0.1% -5.21% -5.23% -5.23% -11.92% -26.48% 2.08% - -0.99% 18.11% -0.24 -0.06 Jul-16
Liquidating/Redeeming - Total 1,013,271 0.2% -4.07% -4.08% -4.08% -10.42% -21.43% -7.15% -5.02% -2.28% 7.56% -0.05 -0.39 Nov-11
Total Absolute Return Portfolio 563,971,942 100.0% -0.04% 0.72% 0.72% 3.66% 7.47% 6.39% 4.41% 5.57% 2.84% 0.14 1.58 Nov-11
HFRI Fund of Funds Composite Index -1.45% -1.15% -1.15% 0.93% 3.37% 2.83% 1.76% 3.12% 3.57% - Nov-11
Market Indices
Libor3Month 0.12% 0.26% 0.26% 1.29% 2.13% 2.01% 1.45% 0.99% 0.24% - Nov-11
Bloomberg Barclays US Aggregate Bond Index 1.80% 3.76% 3.76% 6.31% 11.70% 5.02% 3.59% 3.37% 2.97% 0.81 Nov-11
Bloomberg Barclays US High Yield Bond Index -1.41% -1.38% -1.38% 2.54% 6.09% 4.85% 5.20% 6.58% 5.10% 1.08 Nov-11
S&P 500 TR -8.23% -8.27% -8.27% 1.75% 8.19% 9.87% 9.23% 13.18% 11.26% 1.07 Nov-11
MSCI EAFE - Net -9.04% -10.94% -10.94% -4.70% -0.57% 3.92% 1.96% 5.11% 12.94% 0.37 Nov-11
MSCI EMF (Emerging Markets Free) - Net -5.27% -9.69% -9.69% -3.29% -1.88% 4.89% 2.73% 2.54% 15.62% 0.17 Nov-11
Returns
*LTD Beta is calculated with Holding Level Returns. The market benchmark is MSCI AC World Index Free - Net Index
Most recent month returns are based on manager estimates; prior months use final market values.
Hedge Fund Research, Inc. (“HFR”) is the source and owner of the HFR data contained or reflected in this report. The HFR indices included in this report are revised by HFR for up to three months following their initial release. The revisions are reflected in the trailing period returns.
This report reflects information only through the date hereof. Our due diligence and reporting rely upon the accuracy and completeness of financial information (which may or may not be audited by the fund manager) and other information publicly available or provided to us by the fund manager, its professional staff, and references we have contacted and other third
parties. We have not conducted an independent verification of the information provided other than as described in this report. Our conclusions do not reflect an audit of the investment nor should they be construed as providing legal advice. Past performance does not guarantee future performance. The information contained herein is confidential commercial or
financial information, the disclosure of which would cause substantial competitive harm to you, Cliffwater LLC, or the person or entity from whom the information was obtained, and may not be disclosed except as required by applicable law.
Page 1 of 1
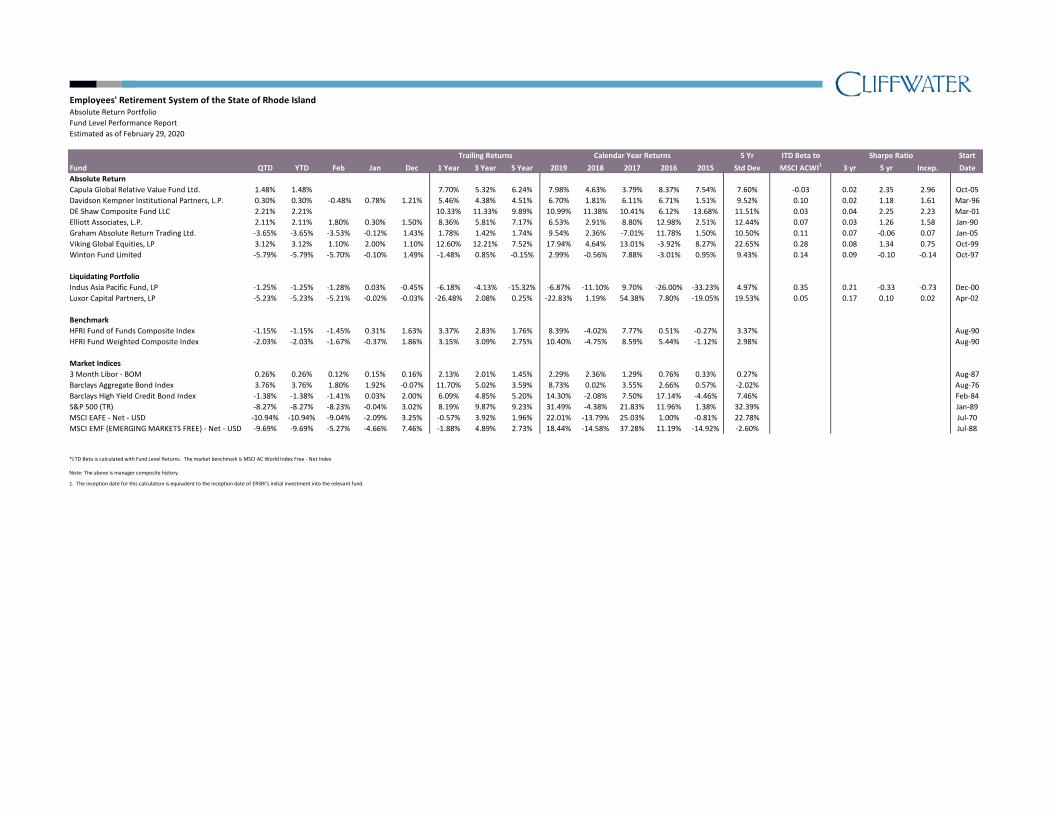
Employees' Retirement System of the State of Rhode IslandAbsolute Return Portfolio
Fund Level Performance Report
Estimated as of February 29, 2020
5 Yr ITD Beta to Start
Fund QTD YTD Feb Jan Dec 1 Year 3 Year 5 Year 2019 2018 2017 2016 2015 Std Dev MSCI ACWI1 3 yr 5 yr Incep. Date
Absolute Return
Capula Global Relative Value Fund Ltd. 1.48% 1.48% 7.70% 5.32% 6.24% 7.98% 4.63% 3.79% 8.37% 7.54% 7.60% -0.03 0.02 2.35 2.96 Oct-05
Davidson Kempner Institutional Partners, L.P. 0.30% 0.30% 0.78% 1.21% 5.46% 4.38% 4.51% 6.70% 1.81% 6.11% 6.71% 1.51% 9.52% 0.10 0.02 1.18 1.61 Mar-96
DE Shaw Composite Fund LLC 2.21% 2.21% 10.33% 11.33% 9.89% 10.99% 11.38% 10.41% 6.12% 13.68% 11.51% 0.03 0.04 2.25 2.23 Mar-01
Elliott Associates, L.P. 2.11% 2.11%
-0.48%
1.80% 0.30% 8.36% 5.81% 7.17% 6.53% 2.91% 8.80% 12.98% 2.51% 12.44% 0.07 0.03 1.26 1.58 Jan-90
Graham Absolute Return Trading Ltd. -3.65% -3.65% -3.53% -0.12% 1.78% 1.42% 1.74% 9.54% 2.36% -7.01% 11.78% 1.50% 10.50% 0.11 0.07 -0.06 0.07 Jan-05
Viking Global Equities, LP 3.12% 3.12% 1.10% 2.00% 12.60% 12.21% 7.52% 17.94% 4.64% 13.01% -3.92% 8.27% 22.65% 0.28 0.08 1.34 0.75 Oct-99
Winton Fund Limited -5.79% -5.79% -5.70% -0.10%
1.50%
1.43%
1.10%
1.49% -1.48% 0.85% -0.15% 2.99% -0.56% 7.88% -3.01% 0.95% 9.43% 0.14 0.09 -0.10 -0.14 Oct-97
Liquidating Portfolio
Indus Asia Pacific Fund, LP -1.25% -1.25% -1.28% 0.03% -0.45% -6.18% -4.13% -15.32% -6.87% -11.10% 9.70% -26.00% -33.23% 4.97% 0.35 0.21 -0.33 -0.73 Dec-00
Luxor Capital Partners, LP -5.23% -5.23% -5.21% -0.02% -0.03% -26.48% 2.08% 0.25% -22.83% 1.19% 54.38% 7.80% -19.05% 19.53% 0.05 0.17 0.10 0.02 Apr-02
Benchmark
HFRI Fund of Funds Composite Index -1.15% -1.15% -1.45% 0.31% 1.63% 3.37% 2.83% 1.76% 8.39% -4.02% 7.77% 0.51% -0.27% 3.37% Aug-90
HFRI Fund Weighted Composite Index -2.03% -2.03% -1.67% -0.37% 1.86% 3.15% 3.09% 2.75% 10.40% -4.75% 8.59% 5.44% -1.12% 2.98% Aug-90
Market Indices
3 Month Libor - BOM 0.26% 0.26% 0.12% 0.15% 0.16% 2.13% 2.01% 1.45% 2.29% 2.36% 1.29% 0.76% 0.33% 0.27% Aug-87
Barclays Aggregate Bond Index 3.76% 3.76% 1.80% 1.92% -0.07% 11.70% 5.02% 3.59% 8.73% 0.02% 3.55% 2.66% 0.57% -2.02% Aug-76
Barclays High Yield Credit Bond Index -1.38% -1.38% -1.41% 0.03% 2.00% 6.09% 4.85% 5.20% 14.30% -2.08% 7.50% 17.14% -4.46% 7.46% Feb-84
S&P 500 (TR) -8.27% -8.27% -8.23% -0.04% 3.02% 8.19% 9.87% 9.23% 31.49% -4.38% 21.83% 11.96% 1.38% 32.39% Jan-89
MSCI EAFE - Net - USD -10.94% -10.94% -9.04% -2.09% 3.25% -0.57% 3.92% 1.96% 22.01% -13.79% 25.03% 1.00% -0.81% 22.78% Jul-70
MSCI EMF (EMERGING MARKETS FREE) - Net - USD -9.69% -9.69% -5.27% -4.66% 7.46% -1.88% 4.89% 2.73% 18.44% -14.58% 37.28% 11.19% -14.92% -2.60% Jul-88
Trailing Returns Calendar Year Returns Sharpe Ratio
Note: The above is manager composite history.
1. The inception date for this calculation is equivalent to the inception date of ERSRI's initial investment into the relevant fund.
*LTD Beta is calculated with Fund Level Returns. The market benchmark is MSCI AC World Index Free - Net Index

Section X.
Real Estate

PORTFOLIO SUMMARY
9/30/2019
All Portfolio Investments - Real Estate (1)
Performance Summary
Asset Class Investment Type
Number of
Investments (4) Commitment Contributions (2), (3) Distributions (3)Adjusted
Valuation
Multiple of
Cost IRR TWR
Real Estate Funds Core 8 414,873,660 483,876,584 408,657,065 366,564,640 1.6x 5.5% 5.7%
Non-Core 22 450,260,817 396,947,787 258,150,882 164,227,340 1.1x 1.3% 3.6%
Total: Real Estate Funds 30 865,134,477 880,824,371 666,807,947 530,791,980 1.4x 4.6% 5.1%
Total: 30 865,134,477 880,824,371 666,807,947 530,791,980 1.4x 4.6% 5.1%
Historical Cash Flows and Valuation Historical Performance
Historical Percent Funded
Historical Percent Funded Period IRRs (5)
(1) Investment information listed as of March 31, 1989 through September 30, 2019 and includes those investments which have been liquidated.(2) Contributions are based on cash activity and are higher than commitments primarily due to reinvestments and contributions for management fees in some of the core open-end funds.(3) Contributions and Distributions each include activity in the amount of $33.5 million related to a simultaneous sale and purchase of shares in a core open-end fund. (4) As of September 30, 2019 there are four core funds and eleven non-core funds. (5) The YTD IRR presented is an unannualized percentage.
Cash Flow and Valuation Summary Commitment by Vintage Year
-
200
400
600
800
1,000
Commitments Contributions Distributions Valuations
Mill
ion
s
-
30
60
90
120
150
180
210
2007 2008 2009 2010 2011 2012 2013 2014 2015 2016 2017 2018 2019
Mill
ion
s
-
100
200
300
400
500
600
700
800
900
1,000
2006 2007 2008 2009 2010 2011 2012 2013 2014 2016 2017 2018 2019
Mill
ion
s
Commitment Contributions Distributions Valuation
4.1%
10.3%
9.8%
4.6%
YTD
5-Year
10-Year
SinceInception
-8.0%
-6.0%
-4.0%
-2.0%
0.0%
2.0%
4.0%
6.0%
8.0%
3/3
1/2
009
9/3
0/2
009
3/3
1/2
010
9/3
0/2
010
3/3
1/2
011
9/3
0/2
011
3/3
1/2
012
9/3
0/2
012
3/3
1/2
013
9/3
0/2
013
3/3
1/2
014
9/3
0/2
014
3/3
1/2
015
9/3
0/2
015
3/3
1/2
016
9/3
0/2
016
3/3
1/2
017
9/3
0/2
017
3/3
1/2
018
9/3
0/2
018
3/3
1/2
019
9/3
0/2
019
0.0x
0.2x
0.4x
0.6x
0.8x
1.0x
1.2x
1.4x
1.6x
Multiples of Cost IRRs
2013 2014 2015 2016 2017 2018 20190%
20%
40%
60%
80%
100%
120%
Net Capital Contributed Unfunded Commitment

Current PartnershipsVintage
Year/Initial Investment
TypeAmount Committed
(In $ unless otherwise noted)
Amount Drawn Amount Distributed Amount Unfunded Valuation ($) Net IRR (%) Net Multiple of Investment
Morgan Stanley Prime Property Fund 2005 Core 35,000,000 35,000,000 26,247,556 - 66,581,410 7.30 2.20JP Morgan Strategic Property Fund 2006 Core 75,000,000 75,000,000 35,307,360 - 110,180,188 6.10 1.70AEW Core Property Trust 2010 Core 69,873,660 69,873,660 58,070,161 - 108,024,995 10.40 1.60Heitman America Real Estate Trust 2014 Core 60,000,000 60,000,000 15,336,080 - 81,778,047 8.50 1.40TriCon Capital Fund VII 2005 Non-Core 15,000,000 14,571,533 4,818,706 428,467 528,633 -15.60 0.30Magna Hotel Fund III 2008 Non-Core 4,000,000 3,426,573 5,764,047 573,427 10,272 14.30 1.70IC Berkeley Partners III 2013 Non-Core 18,000,000 16,038,326 24,635,098 1,961,674 100,911 19.90 1.50GEM Realty Fund V 2013 Non-Core 50,000,000 39,874,323 13,092,186 10,125,677 46,555,822 11.00 1.40Exeter Industrial Value Fund III 2014 Non-Core 30,000,000 29,099,454 46,021,825 900,546 11,178,073 28.70 1.90Waterton Fund XII 2014 Non-Core 35,000,000 34,265,141 20,974,872 - 31,943,858 13.70 1.40Crow Holdings Retail Fund 2015 Non-Core 24,000,000 20,935,313 3,414,851 3,064,687 24,544,319 10.60 1.30Lone Star Real Estate Fund IV 2015 Non-Core 24,260,817 19,056,195 17,372,456 5,204,622 9,766,779 17.70 1.40IC Berkeley Partners IV 2016 Non-Core 30,000,000 23,165,455 1,783,071 6,834,545 25,861,813 10.60 1.10GEM Realty Fund VI 2017 Non-Core 20,000,000 4,204,599 1,200,000 15,795,401 3,499,176 -9.80 1.00Raith Real Estate II 2018 Non-Core 35,000,000 10,716,068 846,886 24,283,932 10,237,685 4.40 N/A
Total 525,134,477$ 455,226,640 274,885,155 69,172,978 530,791,981
Employees' Retirement System of Rhode Island Real Estate Performance9/30/2019
Cumulative Cash Flows ($) Cumulative Performance*
*IRR refers to the fund's Internal Rate of Return, or the annualized compounded yield on an investment. This calculation is typically applied in private real estate where there are multiple points at which capital is invested (capital called) and at which it is distributed. A positive IRR means that the fund's current value plus any cash distributions are greater than the cash value contributed and management fees paid. Typically a fund will have a negative IRR during the first few years of its life, a period referred to as the “J-Curve”, because cash is invested upfront and it takes time to generate value. It is important to consider a fund's start date (vintage year) when assessing IRRs. Multiple of investment is another indicator of returns, and is calculated by dividing the fund's cumulative distributions and current value, after fees, by the amount of capital paid in. Please note that performance calculations are specific to the ERSRI investment, and were not prepared, reviewed or approved by the General Partners.

Section XI.
Infrastructure

Asset
Class Investment Type Commitment Contributions Distributions Valuation
Multiple of
Cost IRR
Infrastructure Funds
Homestead Capital USA Farmland Fund III, L.P. 25,000,000 923,823 - 685,943 0.74 -96.47%
IFM Global Infrastructure Fund 50,032,902 50,032,902 20,776,714 56,730,729 1.55 11.74%
ISQ Global Infrastructure Fund (UST), L.P. 50,000,000 67,586,672 44,146,212 44,103,924 1.31 15.92%
ISQ Global Infrastructure Fund II (UST), L.P. 40,000,000 15,601,266 2,337,998 14,842,152 1.10 15.59%
Stonepeak Infrastructure Fund II - Master Co- Investment Partners LP 20,000,000 10,939,008 632,375 12,279,839 1.18 11.55%
Stonepeak Infrastructure Fund II Cayman (G AIV) LP 43,000,000 52,379,765 28,083,915 36,789,144 1.24 14.60%
Stonepeak Infrastructure Fund III LP 35,000,000 19,229,936 3,638,040 17,564,289 1.10 21.13%
Total: Infrastructure Funds 263,032,902 216,693,372 99,615,254 182,996,020 1.30 13.48%
Portfolio Summary9/30/2019
All Investments
Performance Summary
0
50
100
150
200
250
300
Commitment Contributions Distributions Valuation
$ M
illio
ns
Cash Flow and Valuation Summary
0
20
40
60
80
100
120
140
160
180
2015 2016 2017 2018 2019
$ M
illio
ns
Commitment by Vintage Year
0
50
100
150
200
250
300
2013 2014 2015 2016 2017 2018 2019
$ M
illio
ns
Historical Cash Flows and Valuation
Commitment Contributions Distributions Valuation
0.00
0.20
0.40
0.60
0.80
1.00
1.20
1.40
-10.00%
-5.00%
0.00%
5.00%
10.00%
15.00%
Jun-15 Jun-16 Jun-17 Jun-18 Jun-19
Historical Performance
IRR Multiple of Cost
0%
20%
40%
60%
80%
100%
2013 2014 2015 2016 2017 2018 2019
Historical Percent Funded
Net Capital Contributed Unfunded Commitment
13.48%
11.83%
Inception
10 Year
5 Year
YTD
Period IRRs
Current PartnershipsVintage
Year/Initial Investment
TypeAmount Committed
(In $ unless otherwise noted)
Amount Drawn Amount Distributed
Amount Unfunded Valuation ($) Net IRR (%)
Net Multiple of
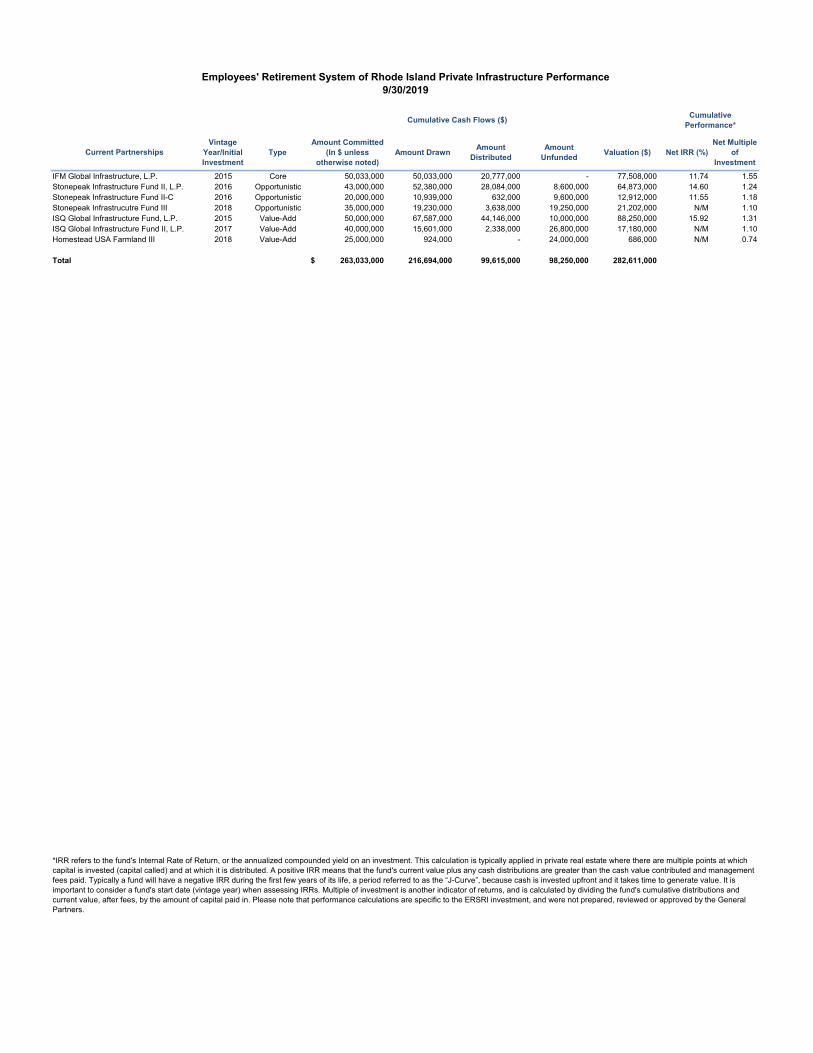
InvestmentIFM Global Infrastructure, L.P. 2015 Core 50,033,000 50,033,000 20,777,000 - 77,508,000 11.74 1.55Stonepeak Infrastructure Fund II, L.P. 2016 Opportunistic 43,000,000 52,380,000 28,084,000 8,600,000 64,873,000 14.60 1.24Stonepeak Infrastructure Fund II-C 2016 Opportunistic 20,000,000 10,939,000 632,000 9,600,000 12,912,000 11.55 1.18Stonepeak Infrastrucutre Fund III 2018 Opportunistic 35,000,000 19,230,000 3,638,000 19,250,000 21,202,000 N/M 1.10ISQ Global Infrastructure Fund, L.P. 2015 Value-Add 50,000,000 67,587,000 44,146,000 10,000,000 88,250,000 15.92 1.31ISQ Global Infrastructure Fund II, L.P. 2017 Value-Add 40,000,000 15,601,000 2,338,000 26,800,000 17,180,000 N/M 1.10Homestead USA Farmland III 2018 Value-Add 25,000,000 924,000 - 24,000,000 686,000 N/M 0.74
Total 263,033,000$ 216,694,000 99,615,000 98,250,000 282,611,000
Employees' Retirement System of Rhode Island Private Infrastructure Performance9/30/2019
Cumulative Cash Flows ($) Cumulative Performance*
*IRR refers to the fund's Internal Rate of Return, or the annualized compounded yield on an investment. This calculation is typically applied in private real estate where there are multiple points at which capital is invested (capital called) and at which it is distributed. A positive IRR means that the fund's current value plus any cash distributions are greater than the cash value contributed and management fees paid. Typically a fund will have a negative IRR during the first few years of its life, a period referred to as the “J-Curve”, because cash is invested upfront and it takes time to generate value. It is important to consider a fund's start date (vintage year) when assessing IRRs. Multiple of investment is another indicator of returns, and is calculated by dividing the fund's cumulative distributions and current value, after fees, by the amount of capital paid in. Please note that performance calculations are specific to the ERSRI investment, and were not prepared, reviewed or approved by the General Partners.

Section XII.
Cash Flow

CASH FLOW ANALYSIS - INCOME & EXPENSES
Employees Retirement System
FISCAL YEAR 2020 FY 2019-20Projected Projected Projected Projected Actual Actual Actual Actual Actual Actual Actual Actual
TOTAL June May April March February January December November October September August July2019 2019
MEMBER BENEFITS 832,944,953 69,132,324 69,155,407 69,178,465 69,266,687 69,404,870 69,487,211 69,573,911 69,588,526 69,696,408 69,594,830 69,472,755 69,393,560
ADMINISTRATIVE 9,159,934 1,245,040.43 610,799 594,437 861,267 891,593 861,730 688,897 927,674 685,823 620,260 817,218 355,195EXPENSES
INVESTMENT 37,910,392 10,037,448 17,681 18,470 10,062,340 17,468 17,467 6,335,494 17,500 17,509 11,333,904 17,530 17,581EXPENSES
TOTAL OUTFLOW 880,015,279 80,414,813 69,783,888 69,791,371 80,190,294 70,313,932 70,366,408 76,598,302 70,533,700 70,399,740 81,548,993 70,307,503 69,766,336
CONTRIBUTIONS 575,783,439 50,184,219 62,786,062 44,874,628 55,109,606 61,918,806 36,340,836 59,065,742 41,714,021 48,498,890 26,559,817 26,653,809 62,077,003
OTHER INCOME* 69,449,615 3,294,658 8,361,789 (926,666) 683,544 4,134,575 2,857,507 (399,190) 16,964,649 9,773,079 9,240,586 10,304,355 5,160,730
TOTAL INCOME 645,233,054 53,478,877 71,147,851 43,947,962 55,793,150 66,053,381 39,198,343 58,666,552 58,678,670 58,271,969 35,800,403 36,958,164 67,237,733
DIFFERENCE (234,782,225) (26,935,936) 1,363,964 (25,843,409) (24,397,144) (4,260,551) (31,168,064) (17,931,751) (11,855,030) (12,127,771) (45,748,591) (33,349,339) (2,528,602)
Municipal Employees Retirement System
Projected Projected Projected Projected Actual Actual Actual Actual Actual Actual Actual ActualTOTAL June May April March February January December November October September August July
2019 2019
MEMBER BENEFITS 103,519,650 8,492,798 8,506,904 8,490,720 8,451,729 8,952,795 8,909,011 8,717,645 8,671,244 8,650,757 8,586,800 8,558,190 8,531,056
ADMINISTRATIVE 2,250,213 303,272 148,540 144,781 209,053 222,459 215,127 170,060 229,041 168,937 152,513 199,939 86,489EXPENSES
INVESTMENT 9,272,905 2,444,966 4,300 4,499 2,442,403 4,359 4,361 1,563,973 4,321 4,313 2,786,843 4,289 4,281EXPENSES
TOTAL OUTFLOW 115,042,767 11,241,036 8,659,743 8,640,000 11,103,185 9,179,613 9,128,499 10,451,678 8,904,607 8,824,007 11,526,156 8,762,418 8,621,827
CONTRIBUTIONS 78,583,584 6,431,212 5,735,660 9,706,407 6,695,695 6,430,076 7,627,014 5,933,580 5,289,544 6,927,606 6,155,497 5,721,125 5,930,168
OTHER INCOME* 17,068,388 802,527 2,033,494 (225,699) 165,915 1,031,609 713,365 (98,544) 4,188,547 2,407,374 2,272,126 2,521,044 1,256,630
TOTAL INCOME 95,651,972 7,233,739 7,769,154 9,480,708 6,861,610 7,461,685 8,340,379 5,835,036 9,478,091 9,334,980 8,427,623 8,242,169 7,186,798
DIFFERENCE (19,390,795) (4,007,297) (890,589) 840,707 (4,241,575) (1,717,928) (788,120) (4,616,642) 573,485 510,974 (3,098,532) (520,249) (1,435,029)

CASH FLOW ANALYSIS - INCOME & EXPENSES
State Police Retirement System Projected Projected Projected Projected Actual Actual Actual Actual Actual Actual Actual Actual
TOTAL June May April March February January December November October September August July2019 2019
MEMBER BENEFITS 6,035,113 499,445 499,445 499,445 499,003 515,690 508,102 508,102 508,102 499,445 499,445 499,445 499,445
ADMINISTRATIVE 205,609 27,589 13,497 13,113 18,896 20,464 19,648 15,701 21,101 15,479 13,967 18,271 7,884EXPENSES
INVESTMENT 845,963 222,419 391 407 220,762 401 398 144,392 398 395 255,217 392 390EXPENSES
TOTAL OUTFLOW 7,086,685 749,453 513,332 512,965 738,660 536,555 528,148 668,195 529,601 515,319 768,629 518,107 507,719
CONTRIBUTIONS 6,673,522 446,796 643,522 418,874 517,636 524,160 590,910 544,416 848,591 505,274 552,960 562,117 518,267
OTHER INCOME* 1,562,754 73,006 184,770 -20,442 14,997 94,898 65,152 (9,098) 385,877 220,584 208,080 230,376 114,554
TOTAL INCOME 8,236,276 519,802 828,291 398,432 532,632 619,058 656,063 535,318 1,234,468 725,858 761,039 792,493 632,821
DIFFERENCE 1,149,590 (229,651) 314,959 (114,534) (206,028) 82,503 127,914 (132,877) 704,867 210,538 (7,589) 274,385 125,102
JudicialRetirement System Projected Projected Projected Projected Actual Actual Actual Actual Actual Actual Actual Actual
TOTAL June May April March February January December November October September August July2019 2019
MEMBER BENEFITS 3,711,729 307,623 307,623 307,623 305,669 315,038 315,038 315,038 307,586 307,623 307,623 307,623 307,623
ADMINISTRATIVE 108,021 14,526 7,110 6,912 9,960 10,686 10,323 8,217 11,062 8,134 7,337 9,607 4,147EXPENSES
INVESTMENT 444,764 117,108 206 215 116,360 209 209 75,567 209 208 134,063 206 205EXPENSES
TOTAL OUTFLOW 4,264,514 439,256 314,939 314,749 431,989 325,933 325,571 398,821 318,857 315,965 449,023 317,436 311,976
CONTRIBUTIONS 3,436,954 241,159 365,766 241,379 242,261 253,183 352,906 241,399 381,785 254,526 308,067 308,121 246,403
OTHER INCOME* 781,503 38,439 97,335 (10,775) 7,904 155,323 34,233 (4,761) 202,293 (29,185) 109,302 121,135 60,259
TOTAL INCOME 4,218,457 279,598 463,101 230,604 250,166 408,506 387,139 236,637 584,078 225,341 417,369 429,256 306,662
DIFFERENCE (46,057) (159,659) 148,162 (84,145) (181,823) 82,573 61,568 (162,184) 265,221 (90,623) (31,654) 111,820 (5,313)
*includes income from Real Estate Investments, Private Equity, and Cash Accounts

FISCAL YEAR 2020 INVESTMENT MANAGER FEES, PROFESSIONAL FEES & OPERATING EXPENSES
ERSRI Pooled Trust ACCRUAL BASIS
Projected Projected Projected Projected Projected Projected Projected Projected Projected Projected Projected Projected ProjectedJul 19 Aug Sept Oct Nov Dec Jan 20 Feb Mar Apr May June TOTAL
EQUITIES US SSGA Russell 3000 41,899 43,964 42,000 42,000 169,863 Shott Capital/Hamilton Lane 338 451 500 500 1,789 SSGA QVM Tilt 190,229 198,918 190,000 190,000 769,147
232,467 243,333 232,500 239,300 178,452FIXED INCOME Fidelity 156,000 159,670 156,000 156,000 627,670 Mackay Shields 146,479 136,974 170,000 170,000 623,453 Brown Bros.TIPS/GILB 43,330 49,746 60,000 60,000 213,076
345,809 346,391 386,000 386,000 1,464,199INT'L EQUITIES SSGA MSCI EAFE 51,564 53,244 55,000 55,000 214,807 SSGA MSCI CAD 4,509 4,441 5,000 5,000 18,950 SSGA MSCI Emerg Mkts 103,790 108,987 108,000 108,000 428,777
159,863 166,672 168,000 168,000 662,535CREDITLoomis 139,630 124,779 110,000 110,000 484,409PIMCO 110,000 110,000 110,000 110,000 440,000
249,630 234,779 220,000 220,000 924,409Infrastructure Harvest Partners 214,627 300,000 300,000 300,000 1,114,627
Systematic Trend Followers 215,362 224,302 230,692 226,120 206,950 210,000 210,000 210,000 210,000 210,000 210,000 210,000 2,573,426
Long Duration WAMCO 33,396 32,629 30,000 30,000 126,025 Mackay Shields 32,951 35,068 30,000 30,000 128,018
66,347 67,696 60,000 60,000 254,043
REAL ESTATE 0 0 2,268,181 0 0 1,316,299 0 0 6,013,911 0 0 3,900,000 13,498,391
ALTERNATIVE INVESTMENTSPrivate Infrastructure 1,526,570 1,962,839 1,707,969 2,250,000 7,447,378Hedge Funds 4,907,979 2,549,827 7,307,576 5,500,000 20,265,382Private Equity 5,786,256 2,143,095 9,861,859 5,000,000 22,791,211
0 0 12,220,805 0 0 6,655,761 0 0 18,877,404 0 0 12,750,000 50,503,970
OtherRussell Overlay 51,891 56,217 50,000 75,000 233,108Heitman 100,825 103,337 100,000 100,000 404,162Payden & Rygel 20,531 21,776 22,500 19,893 20,513 20,077 22,500 22,500 22,500 22,500 22,500 22,500 260,290
20,531 21,776 175,217 19,893 20,513 179,631 22,500 22,500 172,500 22,500 22,500 197,500 897,561
SUB TOTAL-INV MGMT FEES 235,893 246,078 16,163,638 246,013 227,463 9,720,561 232,500 232,500 26,640,315 232,500 232,500 18,430,800 72,071,613
PROFESSIONAL FEES
Legal 9,173 7,250 9,804 17,650 11,687 10,000 14,574 10,000 10,000 10,000 10,000 10,000 130,137 BNY Mellon - Custodial 42,213 42,213 42,213 42,213 42,213 42,213 48,000 48,000 48,000 48,000 48,000 48,000 541,275 Cliffwater 33,333 33,333 35,417 35,417 35,417 35,417 64,583 33,333 33,334 33,333 33,333 33,333 439,583 Meketa General & Infrastructure 6,250 6,250 6,250 6,250 6,250 6,250 6,250 6,250 6,250 6,250 6,250 6,250 75,000 NEPC 0 0 91,250 0 0 91,250 0 0 91,250 0 0 91,250 365,000 Aberdeen 28,721 29,811 28,985 28,834 27,471 30,898 35,629 27,000 27,000 27,000 27,000 27,000 345,349 Meketa Real Estate 10,417 10,417 10,417 10,417 10,417 10,417 10,417 10,417 10,417 10,417 10,417 10,417 125,004
130,107 129,273 224,335 140,780 133,454 226,444 179,453 135,000 226,251 135,000 135,000 226,250 2,021,348OPERATING EXPENSE Retirement Transfers 465,094 478,478 882,244 910,680 1,025,374 820,928 968,951 780,086 834,367 630,113 650,150 1,361,470 9,807,933 Other Expense 0 4,000 25,420 105,420 7,457 25,394 96 3,080 6,420 177,287
465,094 482,478 882,244 936,100 1,025,374 926,348 968,951 787,543 859,761 630,209 653,230 1,367,890 9,985,220
TOTAL: 831,094 857,829 17,270,217 1,322,893 1,386,291 10,873,352 1,380,903 1,155,043 27,726,327 997,709 1,020,730 20,024,940 84,078,181
Note: Numbers in bold are actual.

Section XIII.
Short-Term Investments

Vendor CD CDARS Money Mkt CoD OSIP Total ($)Guidelines-Total/Vendor 50%/20% 50%/20% 75%/35% 75%/35% 50%/50%
OSIP 0 0 0 0 110,023,803 110,023,803.22$ 0% 0% 0% 0% 34% 33.8%
Bank RI 0 0 10,363,181 0 0 10,363,180.82$ 0% 0% 3% 0% 0% 3.2%
Santander Bank 0 0 0 27,882,764 0 27,882,763.63$ 0% 0% 0% 9% 0% 8.6%
People's Credit Union Comm Dep. 0 2,705,073 0 0 0 2,705,072.63$ 0% 1% 0% 0% 0% 0.83%
Navigant Credit Union Comm Dep. 0 6,315,746 0 0 0 6,315,746.25$ 0% 2% 0% 0% 0% 1.94%
Bristol County Savings Bk Comm Dep. 0 0 0 5,126,608 0 5,126,608.27$ 0% 0% 0% 2% 0% 1.58%
Centreville Bank 0 15,328,351 0 0 0 15,328,351.49$ Centerville Community Dep. 0 7,389,987 0 0 0 7,389,987
0% 2% 0% 0% 0% 6.99%Citizens Bank 0 0 0 20,355,403 0 20,355,403.22$
0% 0% 0% 6% 0% 6.3%Webster Bank 0 0 0 26,607,430 0 26,607,429.77$
0% 0% 0% 8% 0% 8.2%Customers Bank 0 0 0 42,232,174 0 42,232,173.97$
0% 0% 0% 13% 0% 13.0%Washington Trust 0 37,043,235 0 0 0 37,043,234.72$ Washington Trust Community Dep. 0 2,891,717 0 0 0 2,891,717.45$
0% 11% 0% 0% 0% 12.3%Freedom National Community Dep. 0 0 0 5,053,790 0 5,053,789.50$
0% 0% 0% 2% 0% 1.6%TD Bank 0 0 0 653,822 0 653,822.16$
0% 0% 0% 0% 0% 0.2%BankNewport Community Dep. 0 5,235,977 0 0 0 5,235,977.01$
0% 2% 0% 0% 0% 1.6%
TOTALS - 53,454,041 10,363,181 122,858,201 110,023,803 325,209,061.58$ (%) PORTFOLIO 0.0% 16.4% 3.2% 37.8% 33.8% 100.0%
37.78% CD = Certificate of DepositCDARS = Cert.of Dep.Acct Registry SvcMMKT = Money MarketCoD = Collateralized DepositOSIP = Ocean State Investment Pool
State of Rhode Island Office of the General Treasurer
Short Term Investments
Short-Term Investment Maturity ScheduleRI SIC Guideline Compliance ReportInvestments as of:February 29, 2020
Actual PIP + CD:Note: PIP + CD must be under 75%.
$0
$50,000,000
$100,000,000
$150,000,000
$200,000,000
$250,000,000
$300,000,000
$350,000,000
Under 30 Days 31-60 Days 61-90 Days 91-120 Days Over 120 Days
Maturity Schedule Operating Cash
Bond Proceeds
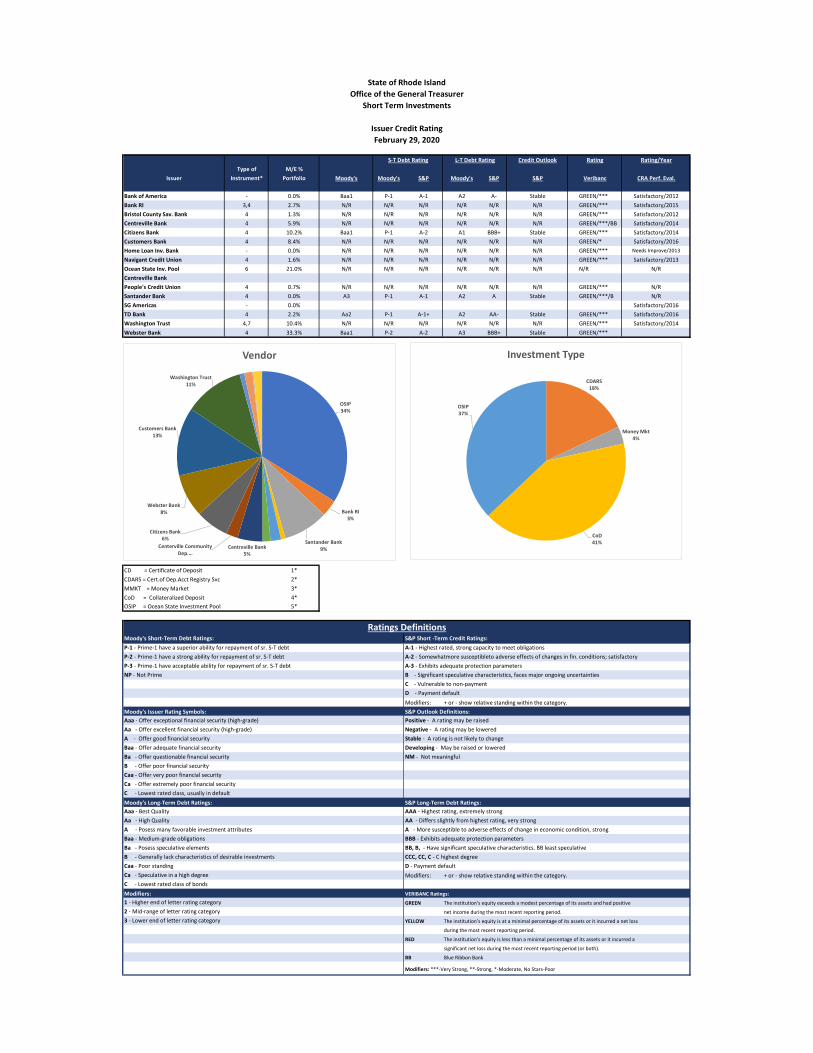
Credit Outlook Rating Rating/YearType of M/E %
Issuer Instrument* Portfolio Moody's Moody's S&P Moody's S&P S&P Veribanc CRA Perf. Eval.
Bank of America - 0.0% Baa1 P-1 A-1 A2 A- Stable GREEN/*** Satisfactory/2012Bank RI 3,4 2.7% N/R N/R N/R N/R N/R N/R GREEN/*** Satisfactory/2015Bristol County Sav. Bank 4 1.3% N/R N/R N/R N/R N/R N/R GREEN/*** Satisfactory/2012Centreville Bank 4 5.9% N/R N/R N/R N/R N/R N/R GREEN/***/BB Satisfactory/2014Citizens Bank 4 10.2% Baa1 P-1 A-2 A1 BBB+ Stable GREEN/*** Satisfactory/2014Customers Bank 4 8.4% N/R N/R N/R N/R N/R N/R GREEN/* Satisfactory/2016Home Loan Inv. Bank - 0.0% N/R N/R N/R N/R N/R N/R GREEN/*** Needs Improve/2013
Navigant Credit Union 4 1.6% N/R N/R N/R N/R N/R N/R GREEN/*** Satisfactory/2013Ocean State Inv. Pool 6 21.0% N/R N/R N/R N/R N/R N/R N/R N/RCentreville BankPeople's Credit Union 4 0.7% N/R N/R N/R N/R N/R N/R GREEN/*** N/RSantander Bank 4 0.0% A3 P-1 A-1 A2 A Stable GREEN/***/B N/RSG Americas - 0.0% Satisfactory/2016TD Bank 4 2.2% Aa2 P-1 A-1+ A2 AA- Stable GREEN/*** Satisfactory/2016Washington Trust 4,7 10.4% N/R N/R N/R N/R N/R N/R GREEN/*** Satisfactory/2014Webster Bank 4 33.3% Baa1 P-2 A-2 A3 BBB+ Stable GREEN/***
CD = Certificate of Deposit 1*CDARS = Cert.of Dep.Acct Registry Svc 2*MMKT = Money Market 3*CoD = Collateralized Deposit 4*OSIP = Ocean State Investment Pool 5*
Moody's Short-Term Debt Ratings: S&P Short -Term Credit Ratings:P-1 - Prime-1 have a superior ability for repayment of sr. S-T debt A-1 - Highest rated, strong capacity to meet obligationsP-2 - Prime-1 have a strong ability for repayment of sr. S-T debt A-2 - Somewhatmore susceptibleto adverse effects of changes in fin. conditions; satisfactoryP-3 - Prime-1 have acceptable ability for repayment of sr. S-T debt A-3 - Exhibits adequate protection parametersNP - Not Prime B - Significant speculative characteristics, faces major ongoing uncertainties
C - Vulnerable to non-paymentD - Payment default
Modifiers: + or - show relative standing within the category.Moody's Issuer Rating Symbols: S&P Outlook Definitions:Aaa - Offer exceptional financial security (high-grade) Positive - A rating may be raisedAa - Offer excellent financial security (high-grade) Negative - A rating may be loweredA - Offer good financial security Stable - A rating is not likely to changeBaa - Offer adequate financial security Developing - May be raised or loweredBa - Offer questionable financial security NM - Not meaningful B - Offer poor financial securityCaa - Offer very poor financial securityCa - Offer extremely poor financial securityC - Lowest rated class, usually in default
Moody's Long-Term Debt Ratings: S&P Long-Term Debt Ratings:Aaa - Best Quality AAA - Highest rating, extremely strongAa - High Quality AA - Differs slightly from highest rating, very strongA - Posess many favorable investment attributes A - More susceptible to adverse effects of change in economic condition, strongBaa - Medium-grade obligations BBB - Exhibits adequate protection parametersBa - Posess speculative elements BB, B, - Have significant speculative characteristics. BB least speculativeB - Generally lack characteristics of desirable investments CCC, CC, C - C highest degreeCaa - Poor standing D - Payment defaultCa - Speculative in a high degree Modifiers: + or - show relative standing within the category.C - Lowest rated class of bonds
Modifiers: VERIBANC Ratings:
1 - Higher end of letter rating category GREEN The institution’s equity exceeds a modest percentage of its assets and had positive
2 - Mid-range of letter rating category net income during the most recent reporting period.
3 - Lower end of letter rating category YELLOW The institution’s equity is at a minimal percentage of its assets or it incurred a net loss
during the most recent reporting period.
RED The institution’s equity is less than a minimal percentage of its assets or it incurred a
significant net loss during the most recent reporting period (or both).
BB Blue Ribbon Bank
Modifiers: ***-Very Strong, **-Strong, *-Moderate, No Stars-Poor
Ratings Definitions
S-T Debt Rating L-T Debt Rating
State of Rhode IslandOffice of the General Treasurer
Short Term Investments
Issuer Credit RatingFebruary 29, 2020
OSIP34%
Bank RI3%
Santander Bank9%Centreville Bank
5%Centerville Community
Dep.…
Citizens Bank6%
Webster Bank8%
Customers Bank13%
Washington Trust11%
Vendor
CDARS18%
Money Mkt4%
CoD41%
OSIP37%
Investment Type

Fund Beginning Balance Average Daily Balance Ending Balance Earnings Annualized YieldGENERAL FUND 161,666,324.19$ 178,537,681.43$ 94,274,788.57$ 229,888.87$ 1.62%H.A.V.A 2,347,375.18$ 2,332,865.23$ 2,349,887.53$ 2,511.02$ 1.35%GENERAL FUND (HIST PRES) 572,052.57$ 567,813.40$ 572,787.08$ 733.99$ 1.63%HIST TAX CREDIT 10,008,475.72$ 9,934,300.57$ 10,021,318.47$ 12,841.62$ 1.63%HIGHWAY FUND 14,095,398.42$ 24,390,621.64$ 26,330,150.26$ 34,338.11$ 1.77%T.D.I. RESERVE (DET) 70,671,023.52$ 87,703,622.38$ 87,833,602.65$ 100,079.53$ 1.44%RICAP GL FUND 21 406,168.05$ 403,073.57$ 406,408.97$ 492.15$ 1.54%BOND CAPITAL FUND 1,405,459.45$ 7,149,023.77$ 5,014,730.59$ 9,187.64$ 1.62%R.I. CLEAN WATER ACT 3,973,772.70$ 3,945,346.47$ 3,978,715.45$ 4,923.99$ 1.57%STATE LOTTERY FUND 60,060,867.15$ 55,119,918.63$ 58,932,690.39$ 73,642.63$ 1.68%ASSESSED FRINGE BEN ADM 3,748,342.40$ 2,187,151.88$ 1,251,204.85$ 2,837.20$ 1.63%AUTO EQUIPMENT SERVICE 4,273.03$ 4,251.06$ 4,282.04$ 4.57$ 1.35%HEALTH INSURANCE FUND 8,785,619.63$ 6,111,099.83$ 2,866,680.60$ 7,692.93$ 1.58%FLEET REVOLVING LOAN FUND 4,784,569.30$ 4,754,536.77$ 4,795,205.70$ 6,001.35$ 1.59%EMPLOYEES RETIREMENT 422,925.27$ 16,723,789.27$ 15,546,912.95$ 22,211.49$ 1.67%MUNICIPAL EMPLOYEES RETIREMENT 83,277.82$ 2,292,857.41$ 85,911.56$ 3,046.20$ 1.67%RETIREE HEALTH FUND 2,085,923.19$ 1,996,481.74$ 1,988,574.57$ 2,394.82$ 1.51%BOG RETIREE FUND 302,767.28$ 300,905.31$ 303,100.84$ 323.87$ 1.35%RIPTA HEALTH FUND 3,192,930.88$ 3,676,981.24$ 3,296,914.50$ 3,957.76$ 1.35%PERMANENT SCHOOL FUND 738,649.86$ 733,197.46$ 739,619.58$ 947.74$ 1.63%TEACHER RETIREE HEALTH FUND 230,173.58$ 228,720.63$ 230,445.56$ 254.47$ 1.40%RISTP RETIREE HEALTH 537,587.64$ 534,266.25$ 538,164.61$ 575.06$ 1.35%RILEG REITREE HEALTH 864.42$ 859.14$ 865.38$ 0.92$ 1.35%RIJUD RETIREE HEALTH 343,434.60$ 341,312.24$ 343,802.66$ 367.37$ 1.35%UNIVERSITY COLLEGE 4,568,706.78$ 3,980,365.78$ 2,773,906.26$ 5,153.29$ 1.63%INDUS. BLDG. & MTG. INS. 766,288.58$ 760,656.05$ 767,318.45$ 983.20$ 1.63%HIGHER EDUCATION -$ -$ -$ 0.00%TANS PROCEEDS -$ -$ -$ 0.00%
Total Operating Funds 355,803,251.21$ 414,711,699.15$ 325,247,990.07$ 525,391.79$ 1.59%
BOND CCDL 2006 SERIES C 462,123.13$ 355,985.72$ 311,540.73$ 459.40$ 1.62%GO BND-NTAX 2007 SERIES A 124,237.53$ 127,707.46$ 128,633.96$ 159.43$ 1.57%CCDL10B BOND CAPITAL COMPONENT 950,000.00$ 942,644.03$ 949,976.31$ 1,269.53$ 1.70%CCDL2010C 169,314.95$ 166,257.02$ 167,519.25$ 217.23$ 1.64%CCDL2011A 1,148,304.77$ 1,131,663.05$ 1,136,507.25$ 1,463.08$ 1.63%CCDL2012B 5,100,000.00$ 5,061,953.08$ 5,099,979.07$ 6,544.06$ 1.63%GO CCDL 2013A 2,590,915.50$ 2,571,586.06$ 2,590,904.12$ 3,324.53$ 1.63%GO CCDL 2014B 94,193.10$ 28,987.50$ 0.79$ 37.99$ 1.65%GO CCDL 2014C 40,664.27$ 40,361.03$ 40,664.24$ 52.18$ 1.63%GO CCDL 2016A 2,457,196.82$ 2,433,988.52$ 2,450,050.88$ 3,145.26$ 1.63%GO CCDL 2016B 2,624,354.16$ 2,411,332.70$ 2,341,755.71$ 3,118.80$ 1.63%GO CCDL 2017A 260,684.91$ 258,473.74$ 260,667.18$ 377.62$ 1.84%GO CCDL 2018A 3,000,000.00$ 2,932,438.47$ 2,939,672.46$ 3,807.23$ 1.63%GO CCDL 2018B 10,869,876.02$ 9,107,100.52$ 8,436,783.42$ 11,852.02$ 1.64%GO CCDL 2019A 33,633,761.71$ 29,631,662.39$ 28,153,712.40$ 38,335.46$ 1.63%GO CCDL 2019B 25,000,000.00$ 24,813,601.23$ 25,000,002.82$ 32,078.67$ 1.63%GO CCDL 2019C 130,871,130.24$ 124,230,980.97$ 122,596,457.01$ 160,646.47$ 1.63%GO CCDK 2019D 17,500,000.00$ 17,369,518.94$ 17,500,000.00$ 22,455.06$ 1.63%CCDL99A 1999A 206,569.39$ 204,883.85$ 206,424.05$ 265.06$ 1.63%CCDL2011A CLEAN WATER COMPONENT 4,157.58$ 4,122.01$ 4,152.98$ 5.33$ 1.63%
-$ Total Non-Operating Funds 237,107,484.08$ 223,825,248.28$ 220,315,404.63$ 289,614.41$ 1.63%
All Funds Total 592,910,735.29$ 638,536,947.42$ 545,563,394.70$ 815,006.20$ 1.61%
Feb 01, 2020 to Feb 29, 2020
State of Rhode IslandOffice of the General Treasurer
All Funds PerformanceFrom
Section XIV.
Defined Contribution Plan

State of Rhode Island401(a) Monthly Performance Summary
As of 2/29/2020
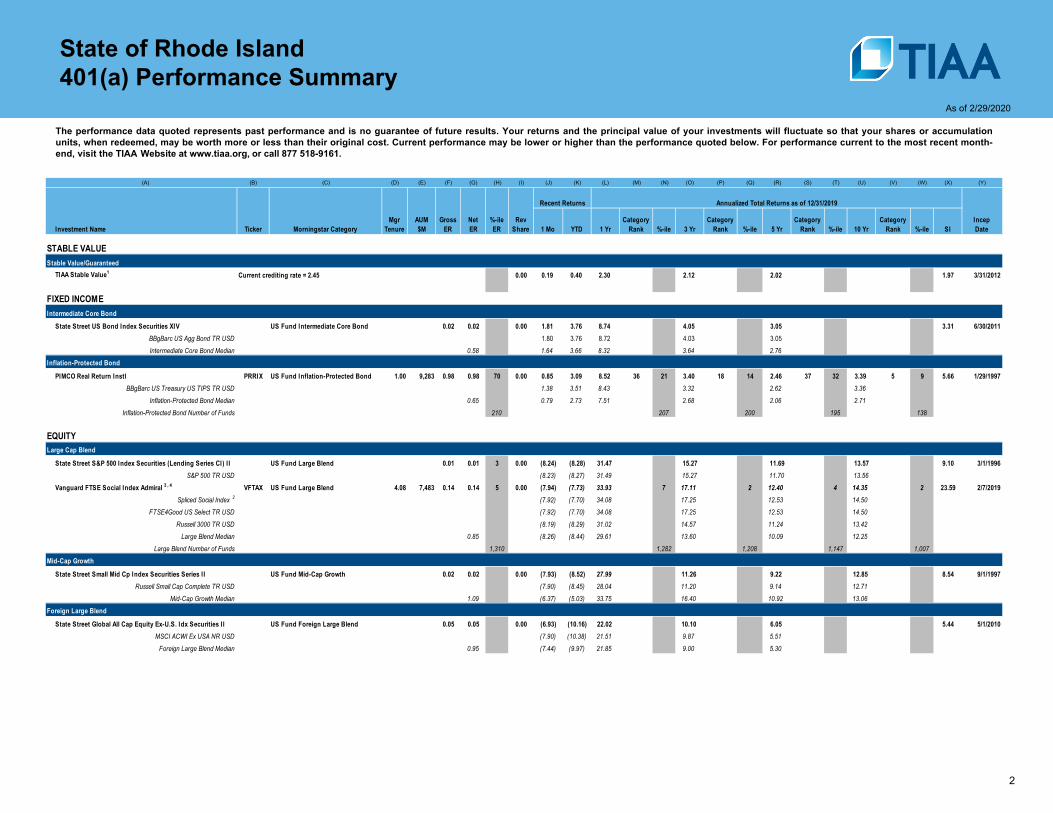
State of Rhode Island401(a) Performance Summary
2
The performance data quoted represents past performance and is no guarantee of future results. Your returns and the principal value of your investments will fluctuate so that your shares or accumulation units, when redeemed, may be worth more or less than their original cost. Current performance may be lower or higher than the performance quoted below. For performance current to the most recent month-end, visit the TIAA Website at www.tiaa.org, or call 877 518-9161.
As of 2/29/2020
(A) (B) (C) (D) (E) (F) (G) (H) (I) (J) (K) (L) (M) (N) (O) (P) (Q) (R) (S) (T) (U) (V) (W) (X) (Y)
Investment Name Ticker Morningstar CategoryMgr
TenureAUM$M
GrossER
NetER
%-ileER
RevShare 1 Mo YTD 1 Yr
Category Rank %-ile 3 Yr
Category Rank %-ile 5 Yr
Category Rank %-ile 10 Yr
Category Rank %-ile SI
IncepDate
STABLE VALUEStable Value/Guaranteed
TIAA Stable Value1 0.00 0.19 0.40 2.30 2.12 2.02 1.97 3/31/2012
FIXED INCOMEIntermediate Core Bond
State Street US Bond Index Securities XIV US Fund Intermediate Core Bond 0.02 0.02 0.00 1.81 3.76 8.74 4.05 3.05 3.31 6/30/20111.80 3.76 8.72 4.03 3.05BBgBarc US Agg Bond TR USD
Intermediate Core Bond Median 0.58 1.64 3.66 8.32 3.64 2.76Inflation-Protected Bond
PIMCO Real Return Instl PRRIX US Fund Inflation-Protected Bond 1.00 9,283 0.98 0.98 70 0.00 0.85 3.09 8.52 36 21 3.40 18 14 2.46 37 32 3.39 5 9 5.66 1/29/19971.38 3.51 8.43 3.32 2.62 3.36
0.65 0.79 2.73 7.51 2.68 2.06 2.71BBgBarc US Treasury US TIPS TR USD
Inflation-Protected Bond MedianInflation-Protected Bond Number of Funds 210 207 200 195 138
EQUITYLarge Cap Blend
State Street S&P 500 Index Securities (Lending Series CI) I I US Fund Large Blend 0.01 0.01 3 0.00 (8.24) (8.28) 31.47 15.27 11.69 13.57 9.10 3/1/1996S&P 500 TR USD (8.23) (8.27) 31.49 15.27 11.70 13.56
Vanguard FTSE Social Index Admiral 3 , 4 VFTAX US Fund Large Blend 4.08 7,483 0.14 0.14 5 0.00 (7.94) (7.73) 33.93 7 17.11 2 12.40 4 14.35 2 23.59 2/7/2019(7.92) (7.70) 34.08 17.25 12.53 14.50(7.92) (7.70) 34.08 17.25 12.53 14.50(8.19) (8.29) 31.02 14.57 11.24 13.42
0.85 (8.26) (8.44) 29.61 13.60 10.09 12.25
Spliced Social Index 2
FTSE4Good US Select TR USDRussell 3000 TR USD
Large Blend MedianLarge Blend Number of Funds 1,310 1,282 1,208 1,147 1,007
Mid-Cap Growth
State Street Small Mid Cp Index Securities Series I I US Fund Mid-Cap Growth 0.02 0.02 11.26 9.22 12.85 8.54 9/1/199711.20 9.14 12.71Russell Small Cap Complete TR USD
Mid-Cap Growth Median 1.09
0.00 (7.93) (8.52) 27.99(7.90) (8.45) 28.04(6.37) (5.03) 33.75 16.40 10.92 13.06
Foreign Large Blend
State Street Global All Cap Equity Ex-U.S. Idx Securities I I US Fund Foreign Large Blend 0.05 0.05 10.10 6.05 5.44 5/1/20109.87 5.51MSCI ACWI Ex USA NR USD
Foreign Large Blend Median 0.95
0.00 (6.93) (10.16) 22.02(7.90) (10.38) 21.51(7.44) (9.97) 21.85 9.00 5.30
Recent Returns Annualized Total Returns as of 12/31/2019
Current crediting rate = 2.45

State of Rhode Island401(a) Performance Summary
3
The performance data quoted represents past performance and is no guarantee of future results. Your returns and the principal value of your investments will fluctuate so that your shares or accumulation units, when redeemed, may be worth more or less than their original cost. Current performance may be lower or higher than the performance quoted below. For performance current to the most recent month-end, visit the TIAA Website at www.tiaa.org, or call 877 518-9161.
As of 2/29/2020
(A) (B) (C) (D) (E) (F) (G) (H) (I) (J) (K) (L) (M) (N) (O) (P) (Q) (R) (S) (T) (U) (V) (W) (X) (Y)
Investment Name Ticker Morningstar CategoryMgr
TenureAUM$M
GrossER
NetER
%-ileER
RevShare 1 Mo YTD 1 Yr
Category Rank %-ile 3 Yr
Category Rank %-ile 5 Yr
Category Rank %-ile 10 Yr
Category Rank %-ile SI
IncepDate
ALLOCATIONTarget-Date
Vanguard Target Retirement Inc Trust I US Fund Target-Date Retirement 0.07 0.07 42 6.43 28 4.86 25 5.89 19 5.25 6/22/20076.51 4.97 5.97
0.67 5.81 4.18 5.23
Vanguard Target Retirement Income Composite
Target-Date Retirement MedianTarget-Date Retirement Number of Funds 189 173 158 121
Vanguard Target Retirement 2015 Trust I US Fund Target-Date 2015 0.07 0.07 62 7.56 31 5.67 43 7.32 25 5.30 6/28/2007Vanguard Target Retirement 2015 Composite 7.65 5.78 7.39
0.58 7.29 5.48 7.03134 113 96 73
Target-Date 2015 MedianTarget-Date 2015 Number of Funds
Vanguard Target Retirement 2020 Trust I US Fund Target-Date 2020 0.07 0.07 26 8.80 13 6.51 10 8.12 4 5.67 6/22/2007Vanguard Target Retirement 2020 Composite 8.88 6.62 8.26
0.68 7.57 5.57 7.11239 214 190 133
Target-Date 2020 MedianTarget-Date 2020 Number of Funds
Vanguard Target Retirement 2025 Trust I US Fund Target-Date 2025 0.07 0.07 16 9.68 8 7.10 9 8.68 8 5.79 6/28/2007Vanguard Target Retirement 2025 Composite 9.76 7.20 8.83
0.67 8.60 6.26 7.90238 214 191 119
Target-Date 2025 MedianTarget-Date 2025 Number of Funds
Vanguard Target Retirement 2030 Trust I US Fund Target-Date 2030 0.07 0.07 16 10.33 17 7.51 20 9.17 10 5.89 6/28/2007Vanguard Target Retirement 2030 Composite 10.40 7.61 9.31
0.69 9.51 6.82 8.34244 220 196 135
Target-Date 2030 MedianTarget-Date 2030 Number of Funds
Vanguard Target Retirement 2035 Trust I US Fund Target-Date 2035 0.07 0.07 36 10.96 24 7.92 21 9.63 8 6.10 6/28/200711.04 8.02 9.77
0.68
0.00 (1.46) (0.69) 13.27(1.59) (0.82) 13.41
(1.88) (1.07) 13.02
0.00 (2.01) (1.40) 14.91(2.19) (1.58) 15.08(2.65) (2.35) 15.20
0.00 (3.20) (2.99) 17.73(3.48) (3.21) 17.87(2.95) (2.81) 15.85
0.00 (4.04) (4.02) 19.78(4.36) (4.27) 19.92(3.72) (3.77) 18.22
0.00 (4.69) (4.92) 21.18(5.07) (5.21) 21.34(4.55) (4.83) 20.25
0.00 (5.37) (5.83) 22.58(5.78) (6.14) 22.76(5.57) (6.14) 22.16 10.28 7.30 8.81
Vanguard Target Retirement 2035 CompositeTarget-Date 2035 Median
Target-Date 2035 Number of Funds 232 208 185 113
Recent Returns Annualized Total Returns as of 12/31/2019
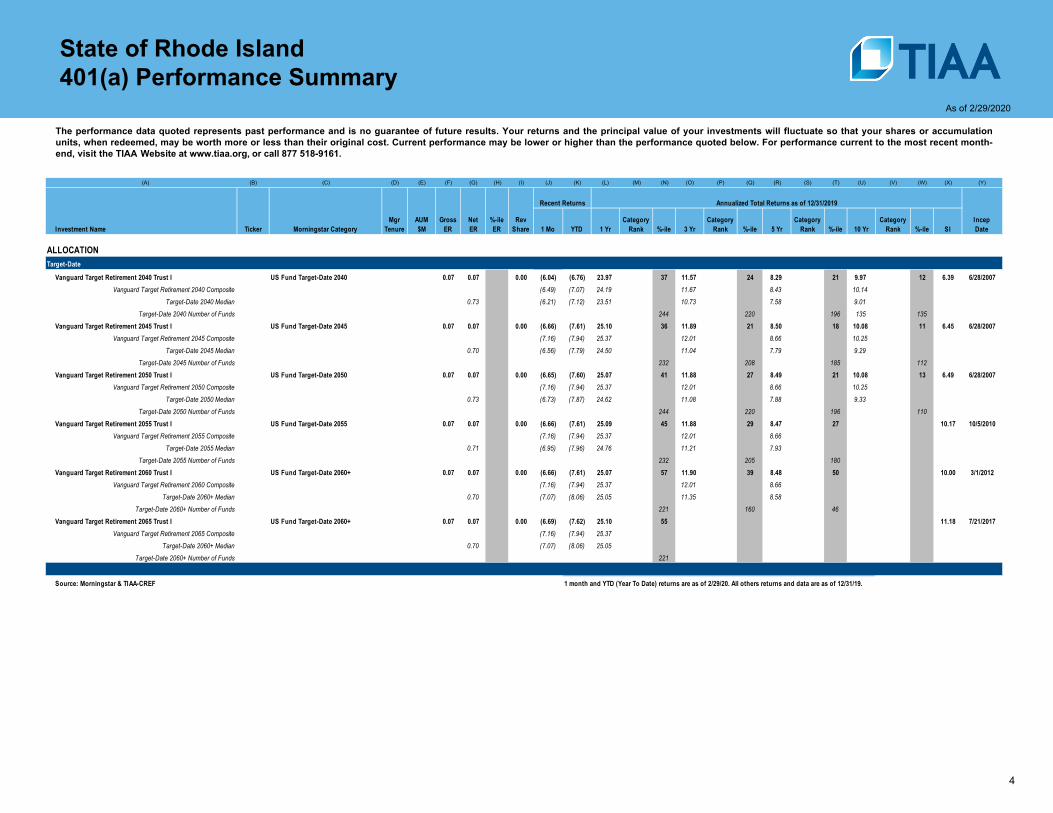
State of Rhode Island401(a) Performance Summary
4
The performance data quoted represents past performance and is no guarantee of future results. Your returns and the principal value of your investments will fluctuate so that your shares or accumulation units, when redeemed, may be worth more or less than their original cost. Current performance may be lower or higher than the performance quoted below. For performance current to the most recent month-end, visit the TIAA Website at www.tiaa.org, or call 877 518-9161.
As of 2/29/2020
(A) (B) (C) (D) (E) (F) (G) (H) (I) (J) (K) (L) (M) (N) (O) (P) (Q) (R) (S) (T) (U) (V) (W) (X) (Y)
Investment Name Ticker Morningstar CategoryMgr
TenureAUM$M
GrossER
NetER
%-ileER
RevShare 1 Mo YTD 1 Yr
Category Rank %-ile 3 Yr
Category Rank %-ile 5 Yr
Category Rank %-ile 10 Yr
Category Rank %-ile SI
IncepDate
ALLOCATIONTarget-Date
Vanguard Target Retirement 2040 Trust I US Fund Target-Date 2040 0.07 0.07 37 11.57 24 8.29 21 9.97 12 6.39 6/28/200711.67 8.43 10.14
0.73 10.73 7.58 9.01Vanguard Target Retirement 2040 Composite
Target-Date 2040 MedianTarget-Date 2040 Number of Funds 244 220 196 135 135
Vanguard Target Retirement 2045 Trust I US Fund Target-Date 2045 0.07 0.07 36 11.89 21 8.50 18 10.08 11 6.45 6/28/2007Vanguard Target Retirement 2045 Composite 12.01 8.66 10.25
0.70 11.04 7.79 9.29232 208 185 112
Target-Date 2045 MedianTarget-Date 2045 Number of Funds
Vanguard Target Retirement 2050 Trust I US Fund Target-Date 2050 0.07 0.07 41 11.88 27 8.49 21 10.08 13 6.49 6/28/2007Vanguard Target Retirement 2050 Composite 12.01 8.66 10.25
0.73 11.08 7.88 9.33244 220 196 110
Target-Date 2050 MedianTarget-Date 2050 Number of Funds
Vanguard Target Retirement 2055 Trust I US Fund Target-Date 2055 0.07 0.07 45 11.88 29 8.47 27 10.17 10/5/2010Vanguard Target Retirement 2055 Composite 12.01 8.66
0.71 11.21 7.93232 205 180
Target-Date 2055 MedianTarget-Date 2055 Number of Funds
Vanguard Target Retirement 2060 Trust I US Fund Target-Date 2060+ 0.07 0.07 57 11.90 39 8.48 50 10.00 3/1/2012Vanguard Target Retirement 2060 Composite 12.01 8.66
0.70 11.35 8.58221 160 46
Target-Date 2060+ MedianTarget-Date 2060+ Number of Funds
Vanguard Target Retirement 2065 Trust I US Fund Target-Date 2060+ 0.07 0.07 55 11.18 7/21/2017
0.70
0.00 (6.04) (6.76) 23.97(6.49) (7.07) 24.19(6.21) (7.12) 23.51
0.00 (6.66) (7.61) 25.10(7.16) (7.94) 25.37(6.56) (7.79) 24.50
0.00 (6.65) (7.60) 25.07(7.16) (7.94) 25.37(6.73) (7.87) 24.62
0.00 (6.66) (7.61) 25.09(7.16) (7.94) 25.37(6.95) (7.96) 24.76
0.00 (6.66) (7.61) 25.07(7.16) (7.94) 25.37(7.07) (8.06) 25.05
0.00 (6.69) (7.62) 25.10(7.16) (7.94) 25.37(7.07) (8.06) 25.05
Vanguard Target Retirement 2065 CompositeTarget-Date 2060+ Median
Target-Date 2060+ Number of Funds 221
Source: Morningstar & TIAA-CREF 1 month and YTD (Year To Date) returns are as of 2/29/20. All others returns and data are as of 12/31/19.
Recent Returns Annualized Total Returns as of 12/31/2019

5
State of Rhode Island401(a) Performance Summary
% -ile --> Percentile Ranking in Morningstar Category
Note: Rankings shown for returns are calculated by Morningstar. Rankings for expense ratio is calculated by TIAA and may differ based on calculation methods
Morningstar peer rankings include fractional weights for all share classes. Morningstar peer rankings also include ETFs. Depending on the category, this may cause some variances with the category median illustrated in this report since most ETFs are index based options that can include more volatile and less mainstream indices.
SI = Since Inception Annualized Total Return; Incep. Date = Since Inception Date (SI return is calculated from this date)
1 The TIAA Stable Value Inception Date represents the date that the plan's TIAA Stable Value record was initiated on TIAA's recordkeeping system which may be earlier than the date of first deposit to the contract.2 Calvert Social Index through December 16, 2005; FTSE4Good US Select Index thereafter.
You cannot invest directly in an index.
Accumulations in mutual funds not managed by TIAA-CREF may be subject to administrative charges. These charges are subject to change. Please review current documents related to your plan.
The expense ratio paid by an investor is the net expense ratio as stated in the prospectus. The net expense ratio reflects total annual fund operating expenses excluding interest expense. If interest
expense was included, returns would have been lower. For definitions please visit www.tiaa-cref.org/public/assetmanagement
Vanguard Index Information available at http://www.vanguard.com
The performance data quoted represents past performance and is no guarantee of future results. Your returns and the principal value of your investments will fluctuate so that your shares or accumulation units, when redeemed, may be worth more or less than their original cost. Current performance may be lower or higher than the performance quoted below. For performance current to the most recent month-end, visit the TIAA Website at www.tiaa.org, or call 877 518-9161.
3 Investor share migrated to Admiral share 08/1/2019.
4 Performance shown for periods prior to the inception date reflects the performance of an oldest share class of the fund/account or underlying fund. Total returns have not been restated to reflect any expense differential between any of the
classes. Had the expense differential been reflected, total returns for the fund may have been higher or lower. Category ranks are not available for periods prior to the inception of the fund.
As of 2/29/2020

Disclosures
6
Investing in non‐investment grade securities presents special risks, including significantly higher interest‐rate and credit risk.
Small‐cap and mid‐cap stocks may have limited marketability and may be subject to more abrupt or erratic market movements than large‐cap stocks.
The risks associated with foreign investments are often magnified in emerging markets where there is greater potential for political, currency, and economic volatility.
Funds that invest in fixed‐income securities are not guaranteed and are subject to interest‐rate, inflation and credit risks.
Funds that invest in foreign securities are subject to special risks, including currency fluctuation and political and economic instability.
Real estate securities are subject to various risks, including fluctuations in property values, higher expenses or lower income than expected, and potential environmental problems and liability. Any guarantees under annuities issued by TIAA are subject to TIAA's claims-paying ability. TIAA Stable Value is a guaranteed insurance contract and not an investment for Federal Securities Law purposes.
Target Date Funds share the risks associated with the types of securities held by each of the underlying funds in which they invest. In addition to the fees and expenses associated with the Target Date Funds, there is exposure to the fees and expenses associated with the underlying mutual funds as well.
Investment, insurance and annuity products are not FDIC insured, are not bank guaranteed, are not deposits, are not insured by any federal government agency, are not a condition to any banking service or activity, and may lose value.
Morningstar Ranking/Number of Funds in Category displays the Fund's actual rank within its Morningstar Category based on average annual total return and number of funds in that Category. The returns assume reinvestment of dividends and do not reflect any applicable sales charge. Absent expense limitation, total return would be less. Morningstar Percentile Rankings are the Fund's total return rank relative to all funds in the same Morningstar category, where 1 is the highest percentile and 100 is the lowest percentile.

Prospectus Gross Expense Ratio The percentage of fund assets used to pay for operating expenses and management fees, including 12b‐1 fees, administrative fees, and all other asset‐based costs incurred by the fund, except brokerage costs. Fund expenses are reflected in the fund's NAV. Sales charges are not included in the expense ratio. ‐‐The expense ratio for fund of funds is the aggregate expense ratio as defined as the sum of the wrap or sponsor fees plus the estimated weighted average of the underlying fund fees. ‐‐Often referred to as the Annual Operating Expense, the Prospectus Gross Expense Ratio is collected annually from a fund's prospectus.
Prospectus Net Expense Ratio The percentage of fund assets, net of reimbursements, used to pay for operating expenses and management fees, including 12b‐1 fees, administrative fees, and all other asset‐based costs incurred by the fund, except brokerage costs. Fund expenses are reflected in the fund's NAV. Sales charges are not included in the expense ratio. ‐‐The expense ratio for fund of funds is the aggregate expense ratio as defined as the sum of the wrap or sponsor fees plus the estimated weighted average of the underlying fund fees. ‐‐Net reimbursements, the Prospectus Net Expense Ratio is collected annually from a fund's prospectus. ‐‐TIAA, unless noted, does not charge additional fees for record keeping a fund. 12b‐1, revenue share and admin fees are all included in the Prospectus fees. ‐‐ Prospectus Net Expense Ratio % ‐ ile rank is the percentile rank for the fund. The better the expense ratio (lower) the lower the ranking out of 100.
By communicating the information contained in this material, TIAA is not providing impartial investment advice or giving advice in a fiduciary capacity regarding any investment by, or other transaction of, the plan(s).TIAA is acting solely in a sales capacity with respect to an arms-length sale, purchase, loan, exchange or other transaction related to the investment of securities or other investment property.
Disclosures
7

State of Rhode Island - Plan Balance Summary401(a)/414(h)(2)State of Rhode Island Defined Contribution Retirement Plan
8
As of 2/29/2020
Investment Name Asset Class Description Balance
$$$$$$$
EquitiesEquitiesGuaranteedEquitiesFixed IncomeFixed IncomeEquitiesMulti-Asset $
State Street S&P 500 Index Securities (Lending Series CI) IIState Street Small Mid Cp Index Securities Series IITIAA Stable ValueState Street Global All Cap Equity Ex-U.S. Idx Securities IIState Street US Bond Index Securities XIVPIMCO Real Return InstlVanguard FTSE Social Index AdmVanguard Target Retirement Income Trust IVanguard Target Retirement 2015 Trust I $
$$$$$$$$$
Vanguard Target Retirement 2020 Trust IVanguard Target Retirement 2025 Trust IVanguard Target Retirement 2030 Trust IVanguard Target Retirement 2035 Trust IVanguard Target Retirement 2040 Trust IVanguard Target Retirement 2045 Trust IVanguard Target Retirement 2050 Trust IVanguard Target Retirement 2055 Trust IVanguard Target Retirement 2060 Trust IVanguard Target Retirement 2065 Trust I
Multi-AssetMulti-AssetMulti-AssetMulti-AssetMulti-AssetMulti-AssetMulti-AssetMulti-AssetMulti-AssetMulti-AssetMulti-Asset
34,614,306 25,312,120 16,652,417 13,931,899
9,262,541 7,906,433 3,994,893
11,350,357 42,182,952
109,326,289 144,774,391 155,975,692 174,314,557 140,151,280 106,548,774 64,896,213 28,854,477
6,382,794 439,580$
1,096,871,963$

State of Rhode Island - Plan Balance Summary401(a)Rhode Island FICA 406403 Alternative Retirement Income Security Program
9
As of 2/29/2020
Investment Name Asset Class Description Balance
Guaranteed 2,250$Multi-Asset 13,194$Multi-Asset 14,065$Multi-Asset 1,431,848$ Multi-Asset 179,426$Multi-Asset 197,310$Multi-Asset 118,454$Multi-Asset 95,332$Multi-Asset 105,594$Multi-Asset 129,013$Multi-Asset 241,677$Multi-Asset 604,277$
TIAA Stable ValueVanguard Target Retirement Income Trust IVanguard Target Retirement 2015 Trust IVanguard Target Retirement 2020 Trust IVanguard Target Retirement 2025 Trust IVanguard Target Retirement 2030 Trust IVanguard Target Retirement 2035 Trust IVanguard Target Retirement 2040 Trust IVanguard Target Retirement 2045 Trust IVanguard Target Retirement 2050 Trust IVanguard Target Retirement 2055 Trust IVanguard Target Retirement 2060 Trust IVanguard Target Retirement 2065 Trust I Multi-Asset 190,885$
3,323,323$

Disclosures
TIAA is providing educational services concerning plan menu construction and the plan sponsor’s fiduciary duties under its plan. It is not providing investment advice and is not a plan fiduciary with respect to the education and information presented herein. Note also that TIAA cannot and does not provide legal advice and that we recommend that you seek such advice from your own legal advisors.
TIAA reported performance may differ from Morningstar source returns for the same option over the same time period. We would expect an occasional one to two basis point difference. Morningstar Direct calculates returns by one share owned by hypothetical investor over the requested time period. The return for one year is calculated using the same formula as one month. TIAA calculates returns by $1,000 owned by hypothetical investor for one month then links returns for requested time period. Both set of returns would include dividends and capital gains, if applicable.
Investment products may be subject to market and other risk factors. See the applicable product literature or visit tiaa.org for details. You should consider the investment objectives, risks, charges and expenses carefully before investing. Please call 877-518-9161 or go to www.TIAA.org/prospectuses for current product and fund prospectuses that contain this and other information. Please read the prospectuses carefully before investing.
TIAA-CREF Individual & Institutional Services, LLC, Member FINRA, distributes securities products. Annuity contracts and certificates are issued by Teachers Insurance and Annuity Association (TIAA) of America and College Retirement Equities Fund (CREF), New York, NY. Each is solely responsible for its own financial condition and contractual obligations.
tiaa.org © 2020 Teachers Insurance and Annuity Association of America-College Retirement Equities Fund, 730 Third Avenue, New York, NY 10017
1115600

Section XV.
457 Plans
State of Rhode Island 457(b) Monthly Performance Summary
As of 2/29/2020

As of 2/29/2020
State of Rhode Island457(b) Performance Summary
2
The performance data quoted represents past performance and is no guarantee of future results. Your returns and the principal value of your investments will fluctuate so that your shares or accumulation units, when redeemed, may be worth more or less than their original cost. Current performance may be lower or higher than the performance quoted below. For performance current to the most recent month-end, visit the TIAA Website at www.tiaa.org, or call 877 518-9161.
(A) (B) (C) (D) (E) (F) (G) (H) (I) (I) (K) (L) (M) (N) (O) (P) (Q) (R) (S) (T) (U) (V) (W) (X) (Y)
Investment Name Ticker Morningstar CategoryMgr
TenureAUM$M
GrossER
NetER
%-ileER
RevShare 1 Mo YTD 1 Yr
Category Rank %-ile 3 Yr
Category Rank %-ile 5 Yr
Category Rank %-ile 10 Yr
Category Rank %-ile SI
IncepDate
GUARANTEEDGuaranteed
TIAA Traditional RCP Current crediting rate = 3.00 0.15 0.25 0.52 3.26 3.31 3.41 3.46 3.68 6/1/2006
FIXED INCOMEIntermediate Core Bond
State Street US Bond Index Securities XIV US Fund Intermediate Core Bond 0.02 0.02 0.00 1.81 3.76 8.74 4.05 3.05 3.31 6/30/20111.80 3.76 8.72 4.03 3.05BBgBarc US Agg Bond TR USD
Intermediate Core Bond Median 0.58 1.64 3.66 8.32 3.64 2.76
Intermediate Core-Plus BondPIMCO Total Return Instl PTTRX US Fund Intermediate Core-Plus Bond 5.33 67,096 0.71 0.71 52 0.00 1.46 3.97 8.26 463 73 4.31 184 36 3.25 186 45 4.19 165 54 7.11 5/11/1987
1.80 3.76 8.72 4.03 3.05 3.750.70 1.46 3.97 9.23 4.10 3.17 4.27
BBgBarc US Agg Bond TR USDIntermediate Core-Plus Bond Median
Intermediate Core-Plus Bond Number of Funds 610 606 567 522 460
Inflation-Protected Bond
American Century Inflation-Adjs Bond R6 5 AIADX US Fund Inflation-Protected Bond 18.17 2,531 0.22 0.22 10 0.00 0.84 3.11 8.14 73 45 2.91 52 2.24 46 2.86 50 3.02 7/28/20171.38 3.51 8.43 3.32 2.62 3.36
0.65 0.79 2.73 7.51 2.68 2.06 2.71BBgBarc US Treasury US TIPS TR USD
Inflation-Protected Bond MedianInflation-Protected Bond Number of Funds 210 207 200 195 138
Recent Returns Annualized Total Returns as of 12/31/2019

State of Rhode Island457(b) Performance Summary
3
As of 2/29/2020
The performance data quoted represents past performance and is no guarantee of future results. Your returns and the principal value of your investments will fluctuate so that your shares or accumulation units, when redeemed, may be worth more or less than their original cost. Current performance may be lower or higher than the performance quoted below. For performance current to the most recent month-end, visit the TIAA Website at www.tiaa.org, or call 877 518-9161.
(A) (B) (C) (D) (E) (F) (G) (H) (I) (I) (K) (L) (M) (N) (O) (P) (Q) (R) (S) (T) (U) (V) (W) (X) (Y)
Investment Name Ticker Morningstar CategoryMgr
TenureAUM$M
GrossER
NetER
%-ileER
RevShare 1 Mo YTD 1 Yr
Category Rank %-ile 3 Yr
Category Rank %-ile 5 Yr
Category Rank %-ile 10 Yr
Category Rank %-ile SI
IncepDate
EQUITYLarge Cap Blend
State Street S&P 500 Index Securities (Lending Series CI) I I US Fund Large Blend 0.01 0.01 3 0.00 (8.24) (8.28) 31.47 15.27 11.69 13.57 9.10 3/1/1996S&P 500 TR USD (8.23) (8.27) 31.49 15.27 11.70 13.56
Vanguard FTSE Social Index Admiral 6 , 7 VFTAX US Fund Large Blend 4.08 7,483 0.14 0.14 5 0.00 (7.94) (7.73) 33.93 7 17.11 2 12.40 4 14.35 2 23.59 2/7/2019(7.92) (7.70) 34.08 17.25 12.53 14.50(7.92) (7.70) 34.08 17.25 12.53 14.50(8.19) (8.29) 31.02 14.57 11.24 13.42
0.85 (8.26) (8.44) 29.61 13.60 10.09 12.25
Spliced Social Index 2
FTSE4Good US Select TR USDRussell 3000 TR USD
Large Blend MedianLarge Blend Number of Funds 1,310 1,282 1,208 1,147 1,007
Mid-Cap BlendVanguard Mid Cap Index Institutional VMCIX US Fund Mid-Cap Blend 21.67 111,567 0.04 0.04 2 0.00 (8.76) (8.97) 31.04 66 13 12.37 33 11 9.26 34 17 13.09 11 7 10.04 5/21/1998
Spliced Mid Cap Index 3 (8.75) (8.97) 31.09 12.39 9.29 13.13(8.75) (8.97) 31.09 12.39 9.29 13.25
0.99 (9.13) (10.69) 26.82 9.02 7.21 11.08CRSP US Mid Cap TR USD
Mid-Cap Blend MedianMid-Cap Blend Number of Funds 381 370 359 321 279
Small BlendVanguard Small Cap Index I VSCIX US Fund Small Blend 3.75 96,752 0.04 0.04 2 0.00 (8.67) (10.52) 27.40 127 18 10.33 41 7 8.90 81 17 12.83 33 9 9.02 7/7/1997
Spliced Small Cap Index 4 (8.67) (10.52) 27.35 10.31 8.86 12.78(8.67) (10.52) 27.35 10.31 8.86 12.99
1.08 (9.42) (12.71) 24.31 7.04 7.30 11.29CRSP US Small Cap TR USD
Small Blend MedianSmall Blend Number of Funds 679 672 657 603 495
Foreign Large BlendState Street Global All Cap Equity Ex-U.S. Idx Securities I I US Fund Foreign Large Blend 0.05 0.05 0.00 (6.93) (10.16) 22.02 10.10 6.05 5.44 5/1/2010
(7.90) (10.38) 21.51 9.87 5.51MSCI ACWI Ex USA NR USDForeign Large Blend Median 0.95 (7.44) (9.97) 21.85 9.00 5.30
Foreign Large GrowthAmerican Funds Europacific Growth R6 RERGX US Fund Foreign Large Growth 18.58 171,878 0.49 0.49 3 276 59 12.45 186 47 7.41 130 44 6.73 120 55 9.43 5/1/2009
9.87 5.51 4.971.05
0.00 (6.16) (9.02) 27.40(7.90) (10.38) 21.51(6.11) (7.74) 27.86 12.46 7.08 6.79
MSCI ACWI Ex USA NR USDForeign Large Growth Median
Foreign Large Growth Number of Funds 492 480 460 419 336
Recent Returns Annualized Total Returns as of 12/31/2019

State of Rhode Island457(b) Performance Summary
4
As of 2/29/2020
The performance data quoted represents past performance and is no guarantee of future results. Your returns and the principal value of your investments will fluctuate so that your shares or accumulation units, when redeemed, may be worth more or less than their original cost. Current performance may be lower or higher than the performance quoted below. For performance current to the most recent month-end, visit the TIAA Website at www.tiaa.org, or call 877 518-9161.
(A) (B) (C) (D) (E) (F) (G) (H) (I) (I) (K) (L) (M) (N) (O) (P) (Q) (R) (S) (T) (U) (V) (W) (X) (Y)
Investment Name Ticker Morningstar CategoryMgr
TenureAUM$M
GrossER
NetER
%-ileER
RevShare 1 Mo YTD 1 Yr
Category Rank %-ile 3 Yr
Category Rank %-ile 5 Yr
Category Rank %-ile 10 Yr
Category Rank %-ile SI
IncepDate
ALLOCATIONTarget-Date
Vanguard Target Retirement Inc Trust I US Fund Target-Date Retirement 0.07 0.07 0.00 (1.46) (0.69) 13.27 42 6.43 28 4.86 25 5.89 19 5.25 6/22/2007(1.59) (0.82) 13.41 6.51 4.97 5.97
0.67 (1.88) (1.07) 13.02 5.81 4.18 5.23
Vanguard Target Retirement Income Composite
Target-Date Retirement MedianTarget-Date Retirement Number of Funds 189 173 158 121
Vanguard Target Retirement 2015 Trust I US Fund Target-Date 2015 0.07 0.07 0.00 (2.01) (1.40) 14.91 62 7.56 31 5.67 43 7.32 25 5.30 6/28/2007Vanguard Target Retirement 2015 Composite (2.19) (1.58) 15.08 7.65 5.78 7.39
0.58 (2.65) (2.35) 15.20 7.29 5.48 7.03134 113 96 73
Target-Date 2015 MedianTarget-Date 2015 Number of Funds
Vanguard Target Retirement 2020 Trust I US Fund Target-Date 2020 0.07 0.07 0.00 (3.20) (2.99) 17.73 26 8.80 13 6.51 10 8.12 4 5.67 6/22/2007Vanguard Target Retirement 2020 Composite (3.48) (3.21) 17.87 8.88 6.62 8.26
0.68 (2.95) (2.81) 15.85 7.57 5.57 7.11239 214 190 133
Target-Date 2020 MedianTarget-Date 2020 Number of Funds
Vanguard Target Retirement 2025 Trust I US Fund Target-Date 2025 0.07 0.07 0.00 (4.04) (4.02) 19.78 16 9.68 8 7.10 9 8.68 8 5.79 6/28/2007Vanguard Target Retirement 2025 Composite (4.36) (4.27) 19.92 9.76 7.20 8.83
0.67 (3.72) (3.77) 18.22 8.60 6.26 7.90238 214 191 119
Target-Date 2025 MedianTarget-Date 2025 Number of Funds
Vanguard Target Retirement 2030 Trust I US Fund Target-Date 2030 0.07 0.07 0.00 (4.69) (4.92) 21.18 16 10.33 17 7.51 20 9.17 10 5.89 6/28/2007Vanguard Target Retirement 2030 Composite (5.07) (5.21) 21.34 10.40 7.61 9.31
0.69 (4.55) (4.83) 20.25 9.51 6.82 8.34244 220 196 135
Target-Date 2030 MedianTarget-Date 2030 Number of Funds
Vanguard Target Retirement 2035 Trust I US Fund Target-Date 2035 0.07 0.07 0.00 (5.37) (5.83) 22.58 36 10.96 24 7.92 21 9.63 8 6.10 6/28/2007(5.78) (6.14) 22.76 11.04 8.02 9.77
0.68 (5.57) (6.14) 22.16 10.28 7.30 8.81Vanguard Target Retirement 2035 Composite
Target-Date 2035 MedianTarget-Date 2035 Number of Funds 232 208 185 113
Recent Returns Annualized Total Returns as of 12/31/2019
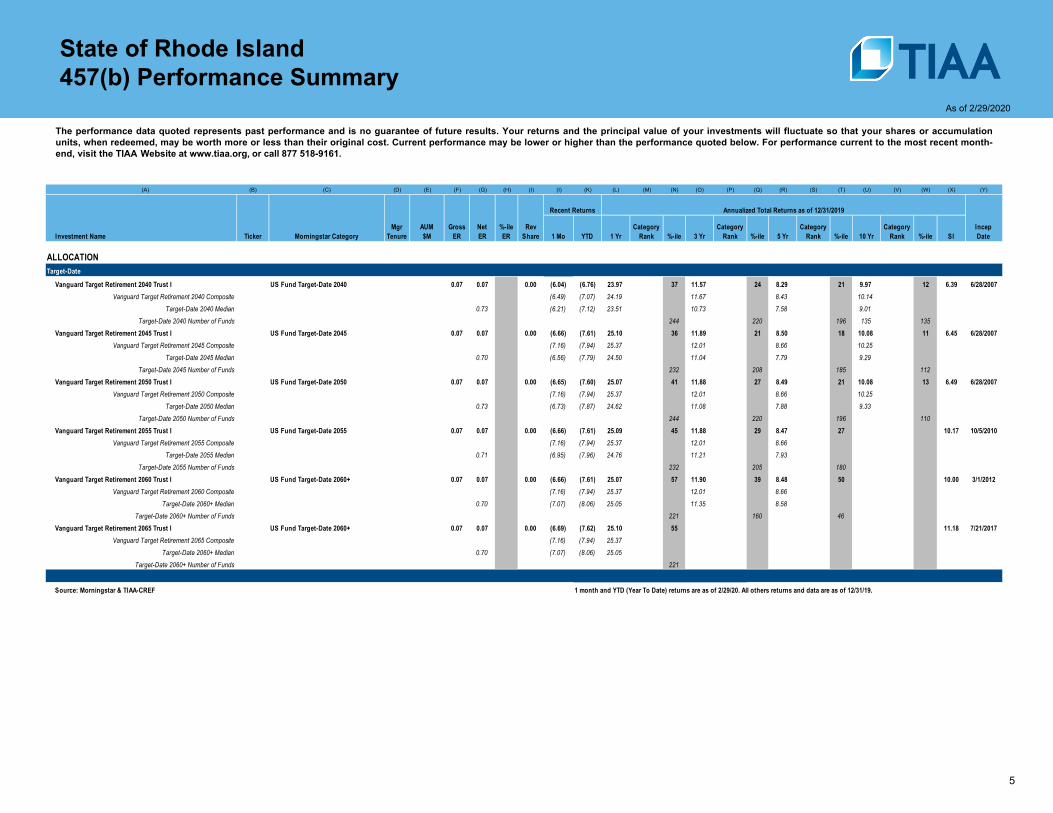
5
State of Rhode Island457(b) Performance Summary
As of 2/29/2020
The performance data quoted represents past performance and is no guarantee of future results. Your returns and the principal value of your investments will fluctuate so that your shares or accumulation units, when redeemed, may be worth more or less than their original cost. Current performance may be lower or higher than the performance quoted below. For performance current to the most recent month-end, visit the TIAA Website at www.tiaa.org, or call 877 518-9161.
(A) (B) (C) (D) (E) (F) (G) (H) (I) (I) (K) (L) (M) (N) (O) (P) (Q) (R) (S) (T) (U) (V) (W) (X) (Y)
Investment Name Ticker Morningstar CategoryMgr
TenureAUM$M
GrossER
NetER
%-ileER
RevShare 1 Mo YTD 1 Yr
Category Rank %-ile 3 Yr
Category Rank %-ile 5 Yr
Category Rank %-ile 10 Yr
Category Rank %-ile SI
IncepDate
ALLOCATIONTarget-Date
Vanguard Target Retirement 2040 Trust I US Fund Target-Date 2040 0.07 0.07 0.00 (6.04) (6.76) 23.97 37 11.57 24 8.29 21 9.97 12 6.39 6/28/2007(6.49) (7.07) 24.19 11.67 8.43 10.14
0.73 (6.21) (7.12) 23.51 10.73 7.58 9.01Vanguard Target Retirement 2040 Composite
Target-Date 2040 MedianTarget-Date 2040 Number of Funds 244 220 196 135 135
Vanguard Target Retirement 2045 Trust I US Fund Target-Date 2045 0.07 0.07 0.00 (6.66) (7.61) 25.10 36 11.89 21 8.50 18 10.08 11 6.45 6/28/2007Vanguard Target Retirement 2045 Composite (7.16) (7.94) 25.37 12.01 8.66 10.25
0.70 (6.56) (7.79) 24.50 11.04 7.79 9.29232 208 185 112
Target-Date 2045 MedianTarget-Date 2045 Number of Funds
Vanguard Target Retirement 2050 Trust I US Fund Target-Date 2050 0.07 0.07 0.00 (6.65) (7.60) 25.07 41 11.88 27 8.49 21 10.08 13 6.49 6/28/2007Vanguard Target Retirement 2050 Composite (7.16) (7.94) 25.37 12.01 8.66 10.25
0.73 (6.73) (7.87) 24.62 11.08 7.88 9.33244 220 196 110
Target-Date 2050 MedianTarget-Date 2050 Number of Funds
Vanguard Target Retirement 2055 Trust I US Fund Target-Date 2055 0.07 0.07 0.00 (6.66) (7.61) 25.09 45 11.88 29 8.47 27 10.17 10/5/2010Vanguard Target Retirement 2055 Composite (7.16) (7.94) 25.37 12.01 8.66
0.71 (6.95) (7.96) 24.76 11.21 7.93232 205 180
Target-Date 2055 MedianTarget-Date 2055 Number of Funds
Vanguard Target Retirement 2060 Trust I US Fund Target-Date 2060+ 0.07 0.07 0.00 (6.66) (7.61) 25.07 57 11.90 39 8.48 50 10.00 3/1/2012Vanguard Target Retirement 2060 Composite (7.16) (7.94) 25.37 12.01 8.66
0.70 (7.07) (8.06) 25.05 11.35 8.58221 160 46
Target-Date 2060+ MedianTarget-Date 2060+ Number of Funds
Vanguard Target Retirement 2065 Trust I US Fund Target-Date 2060+ 0.07 0.07 0.00 (6.69) (7.62) 25.10 55 11.18 7/21/2017(7.16) (7.94) 25.37
0.70 (7.07) (8.06) 25.05Vanguard Target Retirement 2065 Composite
Target-Date 2060+ MedianTarget-Date 2060+ Number of Funds 221
Source: Morningstar & TIAA-CREF 1 month and YTD (Year To Date) returns are as of 2/29/20. All others returns and data are as of 12/31/19.
Recent Returns Annualized Total Returns as of 12/31/2019

6
State of Rhode Island401(a) Performance Summary
You cannot invest directly in an index.
Accumulations in mutual funds not managed by TIAA-CREF may be subject to administrative charges. These charges are subject to change. Please review current documents related to your plan.
The expense ratio paid by an investor is the net expense ratio as stated in the prospectus. The net expense ratio reflects total annual fund operating expenses excluding interest expense. If interest
expense was included, returns would have been lower. For definitions please visit www.tiaa-cref.org/public/assetmanagement
Vanguard Index Information available at http://www.vanguard.com
The performance data quoted represents past performance and is no guarantee of future results. Your returns and the principal value of your investments will fluctuate so that your shares or accumulation units, when redeemed, may be worth more or less than their original cost. Current performance may be lower or higher than the performance quoted below. For performance current to the most recent month-end, visit the TIAA Website at www.tiaa.org, or call 877 518-9161.
% -ile --> Percentile Ranking in Morningstar Category
Note: Rankings shown for returns are calculated by Morningstar. Rankings for expense ratio is calculated by TIAA and may differ based on calculation methods
Morningstar peer rankings include fractional weights for all share classes. Morningstar peer rankings also include ETFs. Depending on the category, this may cause some variances with the category median illustrated in this report since most ETFs are index based options that can include more volatile and less mainstream indices.
SI = Since Inception Annualized Total Return; Incep. Date = Since Inception Date (SI return is calculated from this date)1 Calvert Social Index through December 16, 2005; FTSE4Good US Select Index thereafter.2 S&P MidCap 400 Index through May 16, 2003; the MSCI US Mid Cap 450 Index through January 30, 2013; and the CRSP US Mid Cap Index thereafter.
3 Russell 2000 Index through May 16, 2003; the MSCI US Small Cap 1750 Index through January 30, 2013; and the CRSP US Small Cap Index thereafter
4 Investor share migrated to Admiral share 08/1/2019.
5 Performance shown for periods prior to the inception date reflects the performance of an oldest share class of the fund/account or underlying fund. Total returns have not been restated to reflect any expense differential between any of
the classes. Had the expense differential been reflected, total returns for the fund may have been higher or lower. Category ranks are not available for periods prior to the inception of the fund.
As of 2/29/2020
Disclosures
7
Investing in non‐investment grade securities presents special risks, including significantly higher interest‐rate and credit risk.
Small‐cap and mid‐cap stocks may have limited marketability and may be subject to more abrupt or erratic market movements than large‐cap stocks.
The risks associated with foreign investments are often magnified in emerging markets where there is greater potential for political, currency, and economic volatility.
Funds that invest in fixed‐income securities are not guaranteed and are subject to interest‐rate, inflation and credit risks.
Funds that invest in foreign securities are subject to special risks, including currency fluctuation and political and economic instability.
Real estate securities are subject to various risks, including fluctuations in property values, higher expenses or lower income than expected, and potential environmental problems and liability. Any guarantees under annuities issued by TIAA are subject to TIAA's claims-paying ability. TIAA Traditional is a guaranteed insurance contract and not an investment for Federal Securities Law purposes.
Target Date Funds share the risks associated with the types of securities held by each of the underlying funds in which they invest. In addition to the fees and expenses associated with the Target Date Funds, there is exposure to the fees and expenses associated with the underlying mutual funds as well.
Investment, insurance and annuity products are not FDIC insured, are not bank guaranteed, are not deposits, are not insured by any federal government agency, are not a condition to any banking service or activity, and may lose value.
Morningstar Ranking/Number of Funds in Category displays the Fund's actual rank within its Morningstar Category based on average annual total return and number of funds in that Category. The returns assume reinvestment of dividends and do not reflect any applicable sales charge. Absent expense limitation, total return would be less. Morningstar Percentile Rankings are the Fund's total return rank relative to all funds in the same Morningstar category, where 1 is the highest percentile and 100 is the lowest percentile.

Prospectus Gross Expense Ratio The percentage of fund assets used to pay for operating expenses and management fees, including 12b‐1 fees, administrative fees, and all other asset‐based costs incurred by the fund, except brokerage costs. Fund expenses are reflected in the fund's NAV. Sales charges are not included in the expense ratio. ‐‐The expense ratio for fund of funds is the aggregate expense ratio as defined as the sum of the wrap or sponsor fees plus the estimated weighted average of the underlying fund fees. ‐‐Often referred to as the Annual Operating Expense, the Prospectus Gross Expense Ratio is collected annually from a fund's prospectus.
Prospectus Net Expense Ratio The percentage of fund assets, net of reimbursements, used to pay for operating expenses and management fees, including 12b‐1 fees, administrative fees, and all other asset‐based costs incurred by the fund, except brokerage costs. Fund expenses are reflected in the fund's NAV. Sales charges are not included in the expense ratio. ‐‐The expense ratio for fund of funds is the aggregate expense ratio as defined as the sum of the wrap or sponsor fees plus the estimated weighted average of the underlying fund fees. ‐‐Net reimbursements, the Prospectus Net Expense Ratio is collected annually from a fund's prospectus. ‐‐TIAA, unless noted, does not charge additional fees for record keeping a fund. 12b‐1, revenue share and admin fees are all included in the Prospectus fees. ‐‐ Prospectus Net Expense Ratio % ‐ ile rank is the percentile rank for the fund. The better the expense ratio (lower) the lower the ranking out of 100.
By communicating the information contained in this material, TIAA is not providing impartial investment advice or giving advice in a fiduciary capacity regarding any investment by, or other transaction of, the plan(s).TIAA is acting solely in a sales capacity with respect to an arms-length sale, purchase, loan, exchange or other transaction related to the investment of securities or other investment property.
Disclosures
8

State of Rhode Island - Plan Balance Summary457(b)State of Rhode Island 457(b) Deferred Compensation Plan
9
As of 2/29/2020
Investment Name Asset Class Description Balance
11,696,307$ 9,444,966$ 4,743,376$
EquitiesGuaranteedEquitiesGuaranteed 4,006,683$
2,602,387$EquitiesEquities 1,688,221$
683,780$ 647,615$
Fixed IncomeFixed IncomeEquities 644,423$
627,844$ 383,399$
Fixed IncomeEquitiesGuaranteed 23,596$
78,017$ 278,461$ 736,786$ 774,397$
1,246,139$ 489,576$ 143,644$ 162,268$ 143,845$
61,008$ 29,089$
State Street SP 500 Idx Sec IITIAA Traditional Benefit Responsive 2Vanguard Mid-Cap Idx InstVALIC Fixed-Interest Opt 3%Vanguard Small-Cap Idx InstAmerican EuroPac Growth R6PIMCO Total Return InstlState Street US Bd Idx Sec XIVVanguard FTSE Social Index AdmAmerican Century Inf Adj Bd R6State Street Cp Eq ExUS Idx IIVALIC Fixed-Interest Opt 1.5%Vanguard Target Retirement Income Trust IVanguard Target Retirement 2015 Trust IVanguard Target Retirement 2020 Trust IVanguard Target Retirement 2025 Trust IVanguard Target Retirement 2030 Trust IVanguard Target Retirement 2035 Trust IVanguard Target Retirement 2040 Trust IVanguard Target Retirement 2045 Trust IVanguard Target Retirement 2050 Trust IVanguard Target Retirement 2055 Trust IVanguard Target Retirement 2060 Trust IVanguard Target Retirement 2065 Trust I
Multi-AssetMulti-AssetMulti-AssetMulti-AssetMulti-AssetMulti-AssetMulti-AssetMulti-AssetMulti-AssetMulti-AssetMulti-AssetMulti-Asset 4,661$
41,340,488$

Disclosures
TIAA is providing educational services concerning plan menu construction and the plan sponsor’s fiduciary duties under its plan. It is not providing investment advice and is not a plan fiduciary with respect to the education and information presented herein. Note also that TIAA cannot and does not provide legal advice and that we recommend that you seek such advice from your own legal advisors.
TIAA reported performance may differ from Morningstar source returns for the same option over the same time period. We would expect an occasional one to two basis point difference. Morningstar Direct calculates returns by one share owned by hypothetical investor over the requested time period. The return for one year is calculated using the same formula as one month. TIAA calculates returns by $1,000 owned by hypothetical investor for one month then links returns for requested time period. Both set of returns would include dividends and capital gains, if applicable.
Investment products may be subject to market and other risk factors. See the applicable product literature or visit tiaa.org for details. You should consider the investment objectives, risks, charges and expenses carefully before investing. Please call 877-518-9161 or go to www.TIAA.org/prospectuses for current product and fund prospectuses that contain this and other information. Please read the prospectuses carefully before investing.
TIAA-CREF Individual & Institutional Services, LLC, Member FINRA, distributes securities products. Annuity contracts and certificates are issued byTeachers Insurance and Annuity Association (TIAA) of America and College Retirement Equities Fund (CREF), New York, NY. Each is solely responsible for its own financial condition and contractual obligations.
tiaa.org
© 2020 Teachers Insurance and Annuity Association of America-College Retirement Equities Fund, 730 Third Avenue, New York, NY 10017
1115633
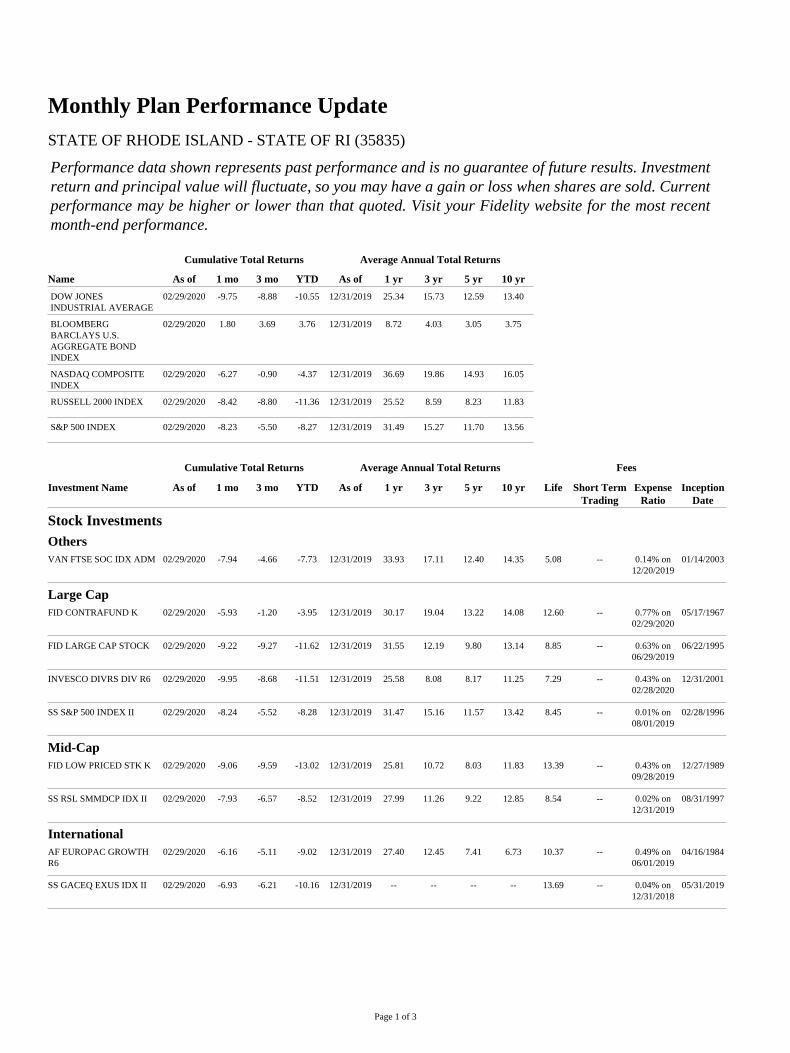
Page 1 of 3
Monthly Plan Performance UpdateSTATE OF RHODE ISLAND - STATE OF RI (35835)
Performance data shown represents past performance and is no guarantee of future results. Investmentreturn and principal value will fluctuate, so you may have a gain or loss when shares are sold. Currentperformance may be higher or lower than that quoted. Visit your Fidelity website for the most recentmonth-end performance.
Cumulative Total Returns Average Annual Total Returns
Name As of 1 mo 3 mo YTD As of 1 yr 3 yr 5 yr 10 yr
DOW JONESINDUSTRIAL AVERAGE
02/29/2020 -9.75 -8.88 -10.55 12/31/2019 25.34 15.73 12.59 13.40
BLOOMBERGBARCLAYS U.S.AGGREGATE BONDINDEX
02/29/2020 1.80 3.69 3.76 12/31/2019 8.72 4.03 3.05 3.75
NASDAQ COMPOSITEINDEX
02/29/2020 -6.27 -0.90 -4.37 12/31/2019 36.69 19.86 14.93 16.05
RUSSELL 2000 INDEX 02/29/2020 -8.42 -8.80 -11.36 12/31/2019 25.52 8.59 8.23 11.83
S&P 500 INDEX 02/29/2020 -8.23 -5.50 -8.27 12/31/2019 31.49 15.27 11.70 13.56
Cumulative Total Returns Average Annual Total Returns Fees
Investment Name As of 1 mo 3 mo YTD As of 1 yr 3 yr 5 yr 10 yr Life Short TermTrading
ExpenseRatio
InceptionDate
Stock InvestmentsOthersVAN FTSE SOC IDX ADM 02/29/2020 -7.94 -4.66 -7.73 12/31/2019 33.93 17.11 12.40 14.35 5.08 -- 0.14% on
12/20/201901/14/2003
Large CapFID CONTRAFUND K 02/29/2020 -5.93 -1.20 -3.95 12/31/2019 30.17 19.04 13.22 14.08 12.60 -- 0.77% on
02/29/202005/17/1967
FID LARGE CAP STOCK 02/29/2020 -9.22 -9.27 -11.62 12/31/2019 31.55 12.19 9.80 13.14 8.85 -- 0.63% on06/29/2019
06/22/1995
INVESCO DIVRS DIV R6 02/29/2020 -9.95 -8.68 -11.51 12/31/2019 25.58 8.08 8.17 11.25 7.29 -- 0.43% on02/28/2020
12/31/2001
SS S&P 500 INDEX II 02/29/2020 -8.24 -5.52 -8.28 12/31/2019 31.47 15.16 11.57 13.42 8.45 -- 0.01% on08/01/2019
02/28/1996
Mid-CapFID LOW PRICED STK K 02/29/2020 -9.06 -9.59 -13.02 12/31/2019 25.81 10.72 8.03 11.83 13.39 -- 0.43% on
09/28/201912/27/1989
SS RSL SMMDCP IDX II 02/29/2020 -7.93 -6.57 -8.52 12/31/2019 27.99 11.26 9.22 12.85 8.54 -- 0.02% on12/31/2019
08/31/1997
InternationalAF EUROPAC GROWTHR6
02/29/2020 -6.16 -5.11 -9.02 12/31/2019 27.40 12.45 7.41 6.73 10.37 -- 0.49% on06/01/2019
04/16/1984
SS GACEQ EXUS IDX II 02/29/2020 -6.93 -6.21 -10.16 12/31/2019 -- -- -- -- 13.69 -- 0.04% on12/31/2018
05/31/2019

Page 2 of 3
Cumulative Total Returns Average Annual Total Returns Fees
Investment Name As of 1 mo 3 mo YTD As of 1 yr 3 yr 5 yr 10 yr Life Short TermTrading
ExpenseRatio
InceptionDate
Blended Investments*OthersFID FREEDOM 2005 K 02/29/2020 -1.12 0.43 -0.80 12/31/2019 12.33 6.56 5.02 5.68 5.03 -- 0.42% on
05/30/201911/06/2003
FID FREEDOM 2010 K 02/29/2020 -1.80 -0.25 -1.80 12/31/2019 14.41 7.49 5.68 6.56 6.49 -- 0.46% on05/30/2019
10/17/1996
FID FREEDOM 2015 K 02/29/2020 -2.50 -0.94 -2.80 12/31/2019 16.37 8.35 6.29 7.00 6.04 -- 0.49% on05/30/2019
11/06/2003
FID FREEDOM 2020 K 02/29/2020 -3.17 -1.55 -3.70 12/31/2019 18.14 9.04 6.77 7.49 6.87 -- 0.53% on05/30/2019
10/17/1996
FID FREEDOM 2025 K 02/29/2020 -3.66 -2.06 -4.41 12/31/2019 19.57 9.59 7.15 8.10 6.66 -- 0.56% on05/30/2019
11/06/2003
FID FREEDOM 2030 K 02/29/2020 -4.43 -2.84 -5.45 12/31/2019 21.87 10.78 7.98 8.67 7.10 -- 0.60% on05/30/2019
10/17/1996
FID FREEDOM 2035 K 02/29/2020 -5.66 -4.08 -7.17 12/31/2019 24.55 11.70 8.60 9.19 7.21 -- 0.63% on05/30/2019
11/06/2003
FID FREEDOM 2040 K 02/29/2020 -6.26 -4.82 -8.03 12/31/2019 25.49 11.85 8.69 9.28 4.56 -- 0.65% on05/30/2019
09/06/2000
FID FREEDOM 2045 K 02/29/2020 -6.28 -4.81 -8.07 12/31/2019 25.54 11.85 8.69 9.33 6.46 -- 0.65% on05/30/2019
06/01/2006
FID FREEDOM 2050 K 02/29/2020 -6.23 -4.75 -8.02 12/31/2019 25.48 11.85 8.68 9.33 6.31 -- 0.65% on05/30/2019
06/01/2006
FID FREEDOM 2055 K 02/29/2020 -6.28 -4.81 -8.11 12/31/2019 25.57 11.88 8.70 -- 8.66 -- 0.65% on05/30/2019
06/01/2011
FID FREEDOM 2060 K 02/29/2020 -6.31 -4.79 -8.05 12/31/2019 25.44 11.81 8.66 -- 8.57 -- 0.65% on05/30/2019
08/05/2014
FID FREEDOM 2065 K 02/29/2020 -6.35 -4.88 -8.09 12/31/2019 -- -- -- -- 9.08 -- 0.65% on05/30/2019
06/28/2019
FID FREEDOM INC K 02/29/2020 -0.52 1.00 -0.09 12/31/2019 10.74 5.57 4.27 4.57 4.84 -- 0.42% on05/30/2019
10/17/1996
Bond InvestmentsStable ValueTRP STABLE VALUE A 02/29/2020 0.17 0.54 0.36 12/31/2019 2.20 2.05 1.97 2.36 4.71 -- 0.30% on
12/31/201809/12/1988
IncomePIM TOTAL RT INST 02/29/2020 1.46 3.72 3.97 12/31/2019 8.26 4.31 3.25 4.19 7.11 -- 0.71% on
01/14/202005/11/1987
SS US BOND INDX XIV 02/29/2020 1.81 3.70 3.76 12/31/2019 8.74 4.04 3.05 3.73 4.32 -- 0.02% on08/01/2019
02/02/2004
Other InvestmentsOthersBROKERAGELINK -- -- -- -- -- -- -- -- -- -- -- -- --
Expense Ratio is the total annual fund operating expense ratio from the fund's most recent prospectus. For non-Fidelity fund of funds listed, the ratioshown may solely reflect the total operating expense ratio of the fund, or may be a combined ratio reflecting both the total operating expense ratio ofthe fund and the total operating expense ratios of the underlying funds in which it was invested. Please consult the fund's prospectus for more detailon a particular fund's expense ratio.

Page 3 of 3
Total returns are historical and include change in share value and reinvestment of dividends and capital gains, if any. Cumulative total returns arereported as of the period indicated. Life of Fund figures are reported as of the inception date to the period indicated.
The management company may be temporarily reimbursing a portion of the fund's expenses. Absent such reimbursement, returns and yields wouldhave been lower. A fund's expense limitation may be terminated at any time.
For any Government or U.S. Treasury Money Market funds listed: You could lose money by investing in a money market fund. Although thefund seeks to preserve the value of your investment at $1.00 per share, it cannot guarantee it will do so. An investment in the fund is not insured orguaranteed by the Federal Deposit Insurance Corporation or any other government agency. The fund's sponsor has no legal obligation to providefinancial support to money market funds and you should not expect that the sponsor will provide financial support to the fund at any time. Fidelity'sgovernment and U.S. Treasury money market funds will not impose a fee upon the sale of your shares, nor temporarily suspend your ability to sellshares if the fund's weekly liquid assets fall below 30% of its total assets because of market conditions or other factors.
For any Retail (Non Government or U.S. Treasury) Money Market Funds listed: You could lose money by investing in a money market fund.Although the fund seeks to preserve the value of your investment at $1.00 per share, it cannot guarantee it will do so. The Fund may impose a feeupon the sale of your shares or may temporarily suspend your ability to sell shares if the Fund's liquidity falls below required minimums because ofmarket conditions or other factors. An investment in the fund is not insured or guaranteed by the Federal Deposit Insurance Corporation or any othergovernment agency. The fund's sponsor has no legal obligation to provide financial support to money market funds and you should not expect thatthe sponsor will provide financial support to the fund at any time.
For any Institutional Money Market Funds listed: You could lose money by investing in a money market fund. Because the share price of thefund will fluctuate, when you sell your shares they may be worth more or less than what you originally paid for them. The Fund may impose a feeupon the sale of your shares or may temporarily suspend your ability to sell shares if the Fund's liquidity falls below required minimums because ofmarket conditions or other factors. An investment in the fund is not insured or guaranteed by the Federal Deposit Insurance Corporation or any othergovernment agency. The fund's sponsor has no legal obligation to provide financial support to money market funds and you should not expect thatthe sponsor will provide financial support to the fund at any time.
A money market fund's current yield reflects the current earnings of the fund, while the total return refers to a specific past holding period.
Performance of an index is not illustrative of any particular investment and an investment cannot be made directly in an index.
Generally, among asset classes stocks are more volatile than bonds or short-term instruments and can decline significantly in response to adverse issuer,political, regulatory, market, or economic developments. Although the bond market is also volatile, lower-quality debt securities including leveragedloans generally offer higher yields compared to investment grade securities, but also involve greater risk of default or price changes. Foreign marketscan be more volatile than U.S. markets due to increased risks of adverse issuer, political, market or economic developments, all of which are magnifiedin emerging markets.
Before investing, consider the funds' investment objectives, risks, charges, and expenses. Contact Fidelity for a prospectus or, if available, asummary prospectus containing this information. Read it carefully.
For Investment Professional or Plan Sponsor use only.
Fidelity Brokerage Services LLC, Member NYSE, SIPC, 900 Salem Street, Smithfield, RI 02917
© 2016 FMR LLC. All rights reserved. The trademarks and service marks appearing herein are the property of their respective owners

STATE OF RHODE ISLANDBalance by FundData As Of: 02/29/20DC Plan Number DC Plan Short Name Fund Code Fund Name Fund Ticker Symbol Fund Type Fund Distinct Count By Participant Market Value Asset Percentage35835 STATE OF RI 338 FID LARGE CAP STOCK FLCSX DOMESTIC EQUITY 375 $8,048,229.00 5.09%35835 STATE OF RI 2080 FID CONTRAFUND K FCNKX DOMESTIC EQUITY 680 $36,379,601.46 23.02%35835 STATE OF RI 2095 FID LOW PRICED STK K FLPKX DOMESTIC EQUITY 440 $9,069,332.28 5.74%35835 STATE OF RI 3019 FID FREEDOM INC K FNSHX LIFECYCLE 45 $1,700,443.71 1.08%35835 STATE OF RI 3020 FID FREEDOM 2005 K FSNJX LIFECYCLE 9 $371,147.40 0.23%35835 STATE OF RI 3021 FID FREEDOM 2010 K FSNKX LIFECYCLE 69 $4,043,110.97 2.56%35835 STATE OF RI 3022 FID FREEDOM 2015 K FSNLX LIFECYCLE 47 $1,923,853.91 1.22%35835 STATE OF RI 3023 FID FREEDOM 2020 K FSNOX LIFECYCLE 220 $14,236,357.14 9.01%35835 STATE OF RI 3024 FID FREEDOM 2025 K FSNPX LIFECYCLE 115 $4,691,234.80 2.97%35835 STATE OF RI 3025 FID FREEDOM 2030 K FSNQX LIFECYCLE 262 $13,294,865.64 8.41%35835 STATE OF RI 3026 FID FREEDOM 2035 K FSNUX LIFECYCLE 85 $3,251,074.40 2.06%35835 STATE OF RI 3027 FID FREEDOM 2040 K FSNVX LIFECYCLE 65 $1,664,053.78 1.05%35835 STATE OF RI 3028 FID FREEDOM 2045 K FSNZX LIFECYCLE 65 $1,324,403.99 0.84%35835 STATE OF RI 3029 FID FREEDOM 2050 K FNSBX LIFECYCLE 62 $365,188.16 0.23%35835 STATE OF RI 3030 FID FREEDOM 2055 K FNSDX LIFECYCLE 49 $759,061.07 0.48%35835 STATE OF RI 3031 FID FREEDOM 2060 K FNSFX LIFECYCLE 25 $97,949.99 0.06%35835 STATE OF RI BLNK BROKERAGELINK OTHER 113 $11,891,353.88 7.52%35835 STATE OF RI OE9Q VAN FTSE SOC IDX ADM VFTAX DOMESTIC EQUITY 165 $1,623,883.72 1.03%35835 STATE OF RI OF1P PIM TOTAL RT INST PTTRX BOND 280 $7,602,314.29 4.81%35835 STATE OF RI OGMU TRP STABLE VALUE A STABLE VALUE 354 $8,612,203.44 5.45%35835 STATE OF RI OK26 INVESCO DIVRS DIV R6 LCEFX DOMESTIC EQUITY 118 $2,220,385.11 1.40%35835 STATE OF RI OMF4 SS GACEQ EXUS IDX II INTERNATIONAL EQUITY 210 $2,120,398.34 1.34%35835 STATE OF RI OMF5 SS RSL SMMDCP IDX II DOMESTIC EQUITY 302 $3,551,506.92 2.25%35835 STATE OF RI OMF6 SS S&P 500 INDEX II DOMESTIC EQUITY 360 $12,014,562.11 7.60%35835 STATE OF RI OMF7 SS US BOND INDX XIV BOND 217 $2,911,615.83 1.84%35835 STATE OF RI OUBE AF EUROPAC GROWTH R6 RERGX INTERNATIONAL EQUITY 351 $4,281,867.77 2.71%
$158,049,999.13

P E R F O R M A N C E U P D A T E
Voya Retirement Insurance and Annuity Company
State of RI 457 Plan
02/29/2020 (shown in percentages) Average Annual Total Returns as of:
Variable annuities and mutual funds offered through a retirement plan are intended as long-term investments designed for retirement purposes. Money distributed from a 403(b) plan, 401(a)/(k) plan,or a 457 plan will be taxed as ordinary income in the year the money is distributed. Early withdrawals from a 403(b) plan and a 401(a)/(k) plan, if taken prior to age 59 1/2, will be subject to the IRS10% premature distribution penalty tax, unless an exception applies. This IRS premature distribution penalty tax does not apply to 457 plans. Account values fluctuate with market conditions, andwhen surrendered the principal may be worth more or less than the original amount invested.
The performance data quoted represents past performance. Past performance does not guarantee future results. For month-end performance which may be lower or higher than theperformance data shown please call 800-232-5422. Investment return and principal value of an investment will fluctuate so that, when sold, an investment may be worth more or lessthan the original cost.
The below investment options are in Separate Account D. Please note that the figures do not include an adjustment for the Voya Administrative Fund Fee (where applicable) and the deduction of theDaily Asset Charge from the Separate Account (if applicable), or other applicable contract charges. If these fees and charges were included, performance would be less favorable.
The returns assume reinvestment of all dividends (ordinary income and capital gains) and are net of management fees and other fund operating expenses.
You should consider the investment objectives, risks and charges, and expenses of the funds carefully before investing. The prospectus contains this and other information. Anyonewho wishes to obtain a free copy of the fund prospectuses may call their Voya representative or the number above. Please read the prospectus carefully before investing.
Returns less than one year are not annualized. Fund Inception Date is the date of inception for the underlying fund, and is the date used in calculating the periodic returns. This date may alsoprecede the portfolio's inclusion in the product.
BM10-YrYTD3-Mo
BMBM
GrossFund
Exp %*5-Yr3-Yr1-Mo
BMFund
FundInception
Date1-Yr
NetFund
Exp %*Fund
FundBenchmark
ID (BM) InceptFund FundFund FundBM BMBM FundInvestment Options
Stability of Principal
Stability of PrincipalVoya Fixed Account - 457/401 II A - 4573 (18)(19) 0.12 0.38 0.25 1.67 1.72 1.86 2.19MFR 0.37 0.21 1.72 1.30 0.750.10 1.49Bonds
High Yield BondPGIM High Yield Fund - Class Z - 2482 -1.52 0.42 -1.70 7.69 5.55 5.83 7.43 0.54 0.5403/01/1996BCUSH1IC 0.54 -1.47 5.95 4.77 7.18-1.53 5.15
Inflation-Protected Bond
Page 1 of 13

See Performance Introduction Page for Important Information
BM10-YrYTD3-Mo
BMBM
GrossFund
Exp %*5-Yr3-Yr1-Mo
BMFund
FundInception
Date1-Yr
NetFund
Exp %*Fund
FundBenchmark
ID (BM) InceptFund FundFund FundBM BMBM FundInvestment OptionsPIMCO Real Return Fund - Institutional Class - 2695 0.85 3.68 3.09 10.05 3.87 2.57 3.62 0.98 0.9801/29/1997LBUSTIPS 3.91 3.51 10.76 4.06 3.671.38 2.94
Intermediate Core-Plus BondVoya Intermediate Bond Fund - Class I - 238 (1)(2) 1.33 3.41 3.50 12.10 5.55 4.21 5.34 0.36 0.3612/15/1998LEHM 3.69 3.76 11.68 5.01 3.931.80 3.58
Intermediate-Term BondState Street U.S. Bond Index SL Series Fund - Class XIVCIT - C925
1.81 3.70 3.76 11.68 5.03 3.58 3.92 0.02 0.0101/02/2004LEHM 3.69 3.76 11.68 5.01 3.931.80 3.58
Asset Allocation
LifecycleVoya Solution 2020 Portfolio - Initial Class - 6750 (3)(4) -2.14 -0.16 -1.24 7.67 6.02 5.12 8.29 0.87 0.7210/03/2011SPT2020 -1.80 -3.33 6.06 5.70-3.45 4.86Voya Solution 2025 Portfolio - Initial Class - 790 (4)(5) -4.34 -2.17 -3.93 6.28 6.10 5.03 7.62 0.85 0.7804/29/2005SPT2025 -2.69 -4.49 5.49 5.94 7.70-4.36 5.13Voya Solution 2030 Portfolio - Initial Class - 6753 (4)(6) -5.27 -3.24 -5.39 5.37 6.17 5.27 9.60 0.94 0.7910/03/2011SPT2030 -3.65 -5.74 4.83 6.11-5.32 5.34Voya Solution 2035 Portfolio - Initial Class - 761 (4)(7) -5.96 -3.94 -6.43 4.65 6.28 5.20 8.24 0.90 0.8304/29/2005SP2035 -4.57 -6.93 4.15 6.23 8.44-6.24 5.52Voya Solution 2040 Portfolio - Initial Class - 6756 (4)(8) -6.44 -4.58 -7.23 4.21 6.20 5.36 10.46 1.01 0.8310/03/2011SPT2040 -5.19 -7.74 3.70 6.32-6.86 5.65Voya Solution 2045 Portfolio - Initial Class - 764 (4)(9) -6.83 -5.04 -7.85 3.80 5.96 4.99 8.55 0.92 0.8604/29/2005SP2045 -5.56 -8.22 3.43 6.35 8.84-7.23 5.73Voya Solution 2050 Portfolio - Initial Class - 6759 (4)(10) -7.05 -5.27 -8.13 3.70 5.97 5.21 10.46 1.03 0.8610/03/2011SPT2050 -5.74 -8.46 3.24 6.40-7.41 5.81Voya Solution 2055 Portfolio - Initial Class - 1166 (4)(11) -7.14 -5.39 -8.26 3.61 5.95 5.00 8.17 0.93 0.8603/08/2010SPT2055 -5.85 -8.59 3.17 6.42-7.52 5.86Voya Solution 2060 Portfolio - Initial Class - 3290 (4)(12) -7.27 -5.48 -8.41 3.46 5.88 5.11 5.73 1.13 0.8702/09/2015SPT2060 -5.86 -8.63 3.25 6.54-7.55 5.95Voya Solution Income Portfolio - Initial Class - 767 (4)(13) -1.97 0.08 -0.91 7.63 5.24 4.20 5.65 0.80 0.6804/29/2005SPTREIN -0.39 -1.50 7.04 5.02 5.31-2.04 3.97Balanced
Allocation--50% to 70% EquityVY® T. Rowe Price Capital Appreciation Portfolio - Inst -1257
-4.87 -1.15 -2.96 10.27 10.38 9.26 11.45 0.64 0.6401/24/1989SPXLBGC -1.53 -3.21 10.64 8.20 9.40-4.10 7.18
Large Cap Value
Large BlendVanguard® FTSE Social Index Fund - Admiral™ Shares -D591
-7.94 -4.66 -7.73 10.72 11.54 9.99 13.40 0.14 0.1405/31/2000FTSE4GUSS -4.42 -7.48 11.19 10.43 14.50-7.70 10.12
Voya Growth and Income Portfolio - Class I - 001 (14) -8.36 -5.27 -7.84 8.70 8.77 7.36 10.97 0.63 0.5812/31/1979SPXRE -5.50 -8.27 8.19 9.87 12.65-8.23 9.23Voya U.S. Stock Index Portfolio - Institutional Class - 829 -8.24 -5.54 -8.30 7.90 9.58 8.93 12.35 0.27 0.2705/03/2004SPXRE -5.50 -8.27 8.19 9.87 12.65-8.23 9.23
Large ValueBlackRock Equity Dividend Fund - Institutional Shares -8518 (15)
-9.05 -8.91 -11.40 3.06 5.69 7.14 10.26 0.71 0.7111/29/1988RS1000V -9.20 -11.63 0.54 3.78 10.40-9.68 5.51
Large Cap Growth
Large GrowthVoya Large Cap Growth Portfolio - Institutional Class -742 (16)
-6.61 -2.07 -4.54 12.78 14.61 11.20 14.37 0.67 0.6705/03/2004RS1000G -1.85 -4.73 15.11 15.67 14.79-6.81 12.41
Small/Mid/Specialty
Mid-Cap Growth
Page 2 of 13
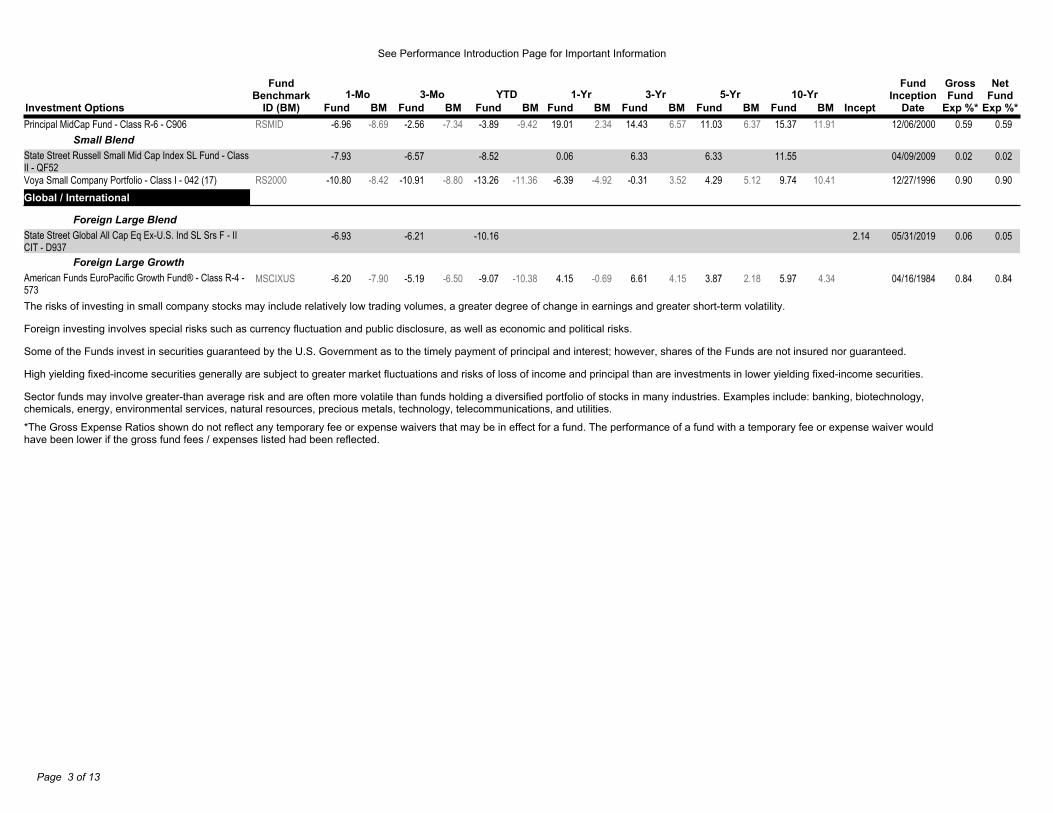
See Performance Introduction Page for Important Information
BM10-YrYTD3-Mo
BMBM
GrossFund
Exp %*5-Yr3-Yr1-Mo
BMFund
FundInception
Date1-Yr
NetFund
Exp %*Fund
FundBenchmark
ID (BM) InceptFund FundFund FundBM BMBM FundInvestment OptionsPrincipal MidCap Fund - Class R-6 - C906 -6.96 -2.56 -3.89 19.01 14.43 11.03 15.37 0.59 0.5912/06/2000RSMID -7.34 -9.42 2.34 6.57 11.91-8.69 6.37
Small BlendState Street Russell Small Mid Cap Index SL Fund - ClassII - QF52
-7.93 -6.57 -8.52 0.06 6.33 6.33 11.55 0.02 0.0204/09/2009
Voya Small Company Portfolio - Class I - 042 (17) -10.80 -10.91 -13.26 -6.39 -0.31 4.29 9.74 0.90 0.9012/27/1996RS2000 -8.80 -11.36 -4.92 3.52 10.41-8.42 5.12Global / International
Foreign Large BlendState Street Global All Cap Eq Ex-U.S. Ind SL Srs F - IICIT - D937
-6.93 -6.21 -10.16 2.14 0.06 0.0505/31/2019
Foreign Large GrowthAmerican Funds EuroPacific Growth Fund® - Class R-4 -573
-6.20 -5.19 -9.07 4.15 6.61 3.87 5.97 0.84 0.8404/16/1984MSCIXUS -6.50 -10.38 -0.69 4.15 4.34-7.90 2.18
The risks of investing in small company stocks may include relatively low trading volumes, a greater degree of change in earnings and greater short-term volatility.
Foreign investing involves special risks such as currency fluctuation and public disclosure, as well as economic and political risks.
Some of the Funds invest in securities guaranteed by the U.S. Government as to the timely payment of principal and interest; however, shares of the Funds are not insured nor guaranteed.
High yielding fixed-income securities generally are subject to greater market fluctuations and risks of loss of income and principal than are investments in lower yielding fixed-income securities.
Sector funds may involve greater-than average risk and are often more volatile than funds holding a diversified portfolio of stocks in many industries. Examples include: banking, biotechnology,chemicals, energy, environmental services, natural resources, precious metals, technology, telecommunications, and utilities.
*The Gross Expense Ratios shown do not reflect any temporary fee or expense waivers that may be in effect for a fund. The performance of a fund with a temporary fee or expense waiver wouldhave been lower if the gross fund fees / expenses listed had been reflected.
Page 3 of 13

P E R F O R M A N C E U P D A T E
Voya Retirement Insurance and Annuity Company
State of RI 457 Plan
12/31/2019 (shown in percentages) Average Annual Total Returns as of:
Variable annuities and mutual funds offered through a retirement plan are intended as long-term investments designed for retirement purposes. Money distributed from a 403(b) plan, 401(a)/(k) plan,or a 457 plan will be taxed as ordinary income in the year the money is distributed. Early withdrawals from a 403(b) plan and a 401(a)/(k) plan, if taken prior to age 59 1/2, will be subject to the IRS10% premature distribution penalty tax, unless an exception applies. This IRS premature distribution penalty tax does not apply to 457 plans. Account values fluctuate with market conditions, andwhen surrendered the principal may be worth more or less than the original amount invested.
The performance data quoted represents past performance. Past performance does not guarantee future results. For month-end performance which may be lower or higher than theperformance data shown please call 800-232-5422. Investment return and principal value of an investment will fluctuate so that, when sold, an investment may be worth more or lessthan the original cost.
The below investment options are in Separate Account D. Please note that the figures do not include an adjustment for the Voya Administrative Fund Fee (where applicable) and the deduction of theDaily Asset Charge from the Separate Account (if applicable), or other applicable contract charges. If these fees and charges were included, performance would be less favorable.
The returns assume reinvestment of all dividends (ordinary income and capital gains) and are net of management fees and other fund operating expenses.
Returns less than one year are not annualized. Fund Inception Date is the date of inception for the underlying fund, and is the date used in calculating the periodic returns. This date may alsoprecede the portfolio's inclusion in the product.
BM10-YrYTD3-Mo
BMBM
GrossFund
Exp %*5-Yr3-Yr1-Mo
BMFund
FundInception
Date1-Yr
NetFund
Exp %*Fund
FundBenchmark
ID (BM) InceptFund FundFund FundBM BMBM FundInvestment Options
Stability of Principal
Stability of PrincipalVoya Fixed Account - 457/401 II A - 4573 (18)(19) 0.13 0.39 1.70 1.70 1.74 1.88 2.21MFR 0.50 2.43 2.43 1.94 0.780.16 1.32Bonds
High Yield BondPGIM High Yield Fund - Class Z - 2482 2.16 3.06 16.12 16.12 7.30 6.77 7.73 0.54 0.5403/01/1996BCUSH1IC 2.63 14.27 14.27 6.30 7.502.04 6.10
Inflation-Protected BondPIMCO Real Return Fund - Institutional Class - 2695 0.57 0.92 8.53 8.53 3.40 2.47 3.40 0.98 0.9801/29/1997LBUSTIPS 0.79 8.43 8.43 3.32 3.360.38 2.62
Intermediate Core-Plus Bond
Page 4 of 13

See Performance Introduction Page for Important Information
BM10-YrYTD3-Mo
BMBM
GrossFund
Exp %*5-Yr3-Yr1-Mo
BMFund
FundInception
Date1-Yr
NetFund
Exp %*Fund
FundBenchmark
ID (BM) InceptFund FundFund FundBM BMBM FundInvestment OptionsVoya Intermediate Bond Fund - Class I - 238 (1)(2) -0.09 0.22 10.04 10.04 4.79 3.81 5.23 0.36 0.3612/15/1998LEHM 0.18 8.72 8.72 4.03 3.75-0.07 3.05
Intermediate-Term BondState Street U.S. Bond Index SL Series Fund - Class XIVCIT - C925
-0.06 0.17 8.74 8.74 4.04 3.05 3.73 0.02 0.0101/02/2004LEHM 0.18 8.72 8.72 4.03 3.75-0.07 3.05
Asset Allocation
LifecycleVoya Solution 2020 Portfolio - Initial Class - 6750 (3)(4) 1.09 2.94 15.22 15.22 7.71 6.02 8.62 0.87 0.7210/03/2011SPT2020 4.19 16.52 16.52 8.001.57 6.16Voya Solution 2025 Portfolio - Initial Class - 790 (4)(5) 1.83 4.83 18.32 18.32 8.95 6.58 7.90 0.85 0.7804/29/2005SPT2025 4.97 18.38 18.38 8.80 8.131.89 6.73Voya Solution 2030 Portfolio - Initial Class - 6753 (4)(6) 2.27 5.91 20.64 20.64 9.77 7.24 10.54 0.94 0.7910/03/2011SPT2030 5.81 20.38 20.38 9.552.22 7.27Voya Solution 2035 Portfolio - Initial Class - 761 (4)(7) 2.66 6.87 22.22 22.22 10.41 7.40 8.75 0.90 0.8304/29/2005SP2035 6.61 22.18 22.18 10.25 9.132.54 7.77Voya Solution 2040 Portfolio - Initial Class - 6756 (4)(8) 2.85 7.37 23.44 23.44 10.74 7.82 11.69 1.01 0.8310/03/2011SPT2040 7.15 23.37 23.37 10.732.76 8.11Voya Solution 2045 Portfolio - Initial Class - 764 (4)(9) 3.04 7.92 24.29 24.29 10.75 7.57 9.18 0.92 0.8604/29/2005SP2045 7.48 24.02 24.02 11.01 9.672.90 8.32Voya Solution 2050 Portfolio - Initial Class - 6759 (4)(10) 3.11 8.10 24.74 24.74 10.90 7.89 11.83 1.03 0.8610/03/2011SPT2050 7.65 24.35 24.35 11.222.97 8.49Voya Solution 2055 Portfolio - Initial Class - 1166 (4)(11) 3.13 8.17 24.76 24.76 10.92 7.67 9.27 0.93 0.8603/08/2010SPT2055 7.73 24.48 24.48 11.343.01 8.58Voya Solution 2060 Portfolio - Initial Class - 3290 (4)(12) 3.20 8.22 24.79 24.79 10.97 7.84 1.13 0.8702/09/2015SPT2060 7.81 24.73 24.73 11.503.03Voya Solution Income Portfolio - Initial Class - 767 (4)(13) 1.01 2.55 13.38 13.38 6.51 4.87 5.79 0.80 0.6804/29/2005SPTREIN 3.05 13.33 13.33 6.23 5.501.13 4.67Balanced
Allocation--50% to 70% EquityVY® T. Rowe Price Capital Appreciation Portfolio - Inst -1257
1.86 5.50 24.71 24.71 13.17 10.62 11.93 0.64 0.6401/24/1989SPXLBGC 5.38 22.64 22.64 10.81 9.811.73 8.34
Large Cap Value
Large BlendVanguard® FTSE Social Index Fund - Admiral™ Shares -D591
3.32 10.53 33.93 33.93 17.12 12.41 14.36 0.14 0.1405/31/2000FTSE4GUSS 10.59 33.96 33.96 17.14 14.383.31 12.42
Voya Growth and Income Portfolio - Class I - 001 (14) 2.79 7.48 28.88 28.88 14.01 9.90 11.82 0.63 0.5812/31/1979SPXRE 9.07 31.49 31.49 15.27 13.563.02 11.70Voya U.S. Stock Index Portfolio - Institutional Class - 829 3.01 9.01 31.12 31.12 14.95 11.39 13.25 0.27 0.2705/03/2004SPXRE 9.07 31.49 31.49 15.27 13.563.02 11.70
Large ValueBlackRock Equity Dividend Fund - Institutional Shares -8518 (15)
2.81 8.33 27.52 27.52 11.39 9.92 11.40 0.71 0.7111/29/1988RS1000V 7.41 26.54 26.54 9.68 11.802.75 8.29
Large Cap Growth
Large GrowthVoya Large Cap Growth Portfolio - Institutional Class -742 (16)
2.59 9.26 32.76 32.76 19.28 13.42 14.50 0.67 0.6705/03/2004RS1000G 10.62 36.39 36.39 20.49 15.223.02 14.63
Small/Mid/Specialty
Mid-Cap GrowthPrincipal MidCap Fund - Class R-6 - C906 1.38 6.20 43.08 43.08 18.77 13.32 16.06 0.59 0.5912/06/2000RSMID 7.06 30.54 30.54 12.06 13.192.29 9.33
Small Blend
Page 5 of 13

See Performance Introduction Page for Important Information
BM10-YrYTD3-Mo
BMBM
GrossFund
Exp %*5-Yr3-Yr1-Mo
BMFund
FundInception
Date1-Yr
NetFund
Exp %*Fund
FundBenchmark
ID (BM) InceptFund FundFund FundBM BMBM FundInvestment OptionsState Street Russell Small Mid Cap Index SL Fund - ClassII - QF52
2.13 8.93 27.95 27.95 11.13 9.07 12.68 0.02 0.0204/09/2009
Voya Small Company Portfolio - Class I - 042 (17) 2.71 8.88 26.21 26.21 5.73 7.86 11.52 0.90 0.9012/27/1996RS2000 9.94 25.52 25.52 8.59 11.832.88 8.23Global / International
Foreign Large BlendState Street Global All Cap Eq Ex-U.S. Ind SL Srs F - IICIT - D937
4.40 9.20 13.69 0.06 0.0505/31/2019
Foreign Large GrowthAmerican Funds EuroPacific Growth Fund® - Class R-4 -573
4.27 10.01 26.98 26.98 12.06 7.04 6.36 0.84 0.8404/16/1984MSCIXUS 8.92 21.51 21.51 9.87 4.974.33 5.51
The risks of investing in small company stocks may include relatively low trading volumes, a greater degree of change in earnings and greater short-term volatility.
Foreign investing involves special risks such as currency fluctuation and public disclosure, as well as economic and political risks.
Some of the Funds invest in securities guaranteed by the U.S. Government as to the timely payment of principal and interest; however, shares of the Funds are not insured nor guaranteed.
High yielding fixed-income securities generally are subject to greater market fluctuations and risks of loss of income and principal than are investments in lower yielding fixed-income securities.
Sector funds may involve greater-than average risk and are often more volatile than funds holding a diversified portfolio of stocks in many industries. Examples include: banking, biotechnology,chemicals, energy, environmental services, natural resources, precious metals, technology, telecommunications, and utilities.
*The Gross Expense Ratios shown do not reflect any temporary fee or expense waivers that may be in effect for a fund. The performance of a fund with a temporary fee or expense waiver wouldhave been lower if the gross fund fees / expenses listed had been reflected.
Page 6 of 13
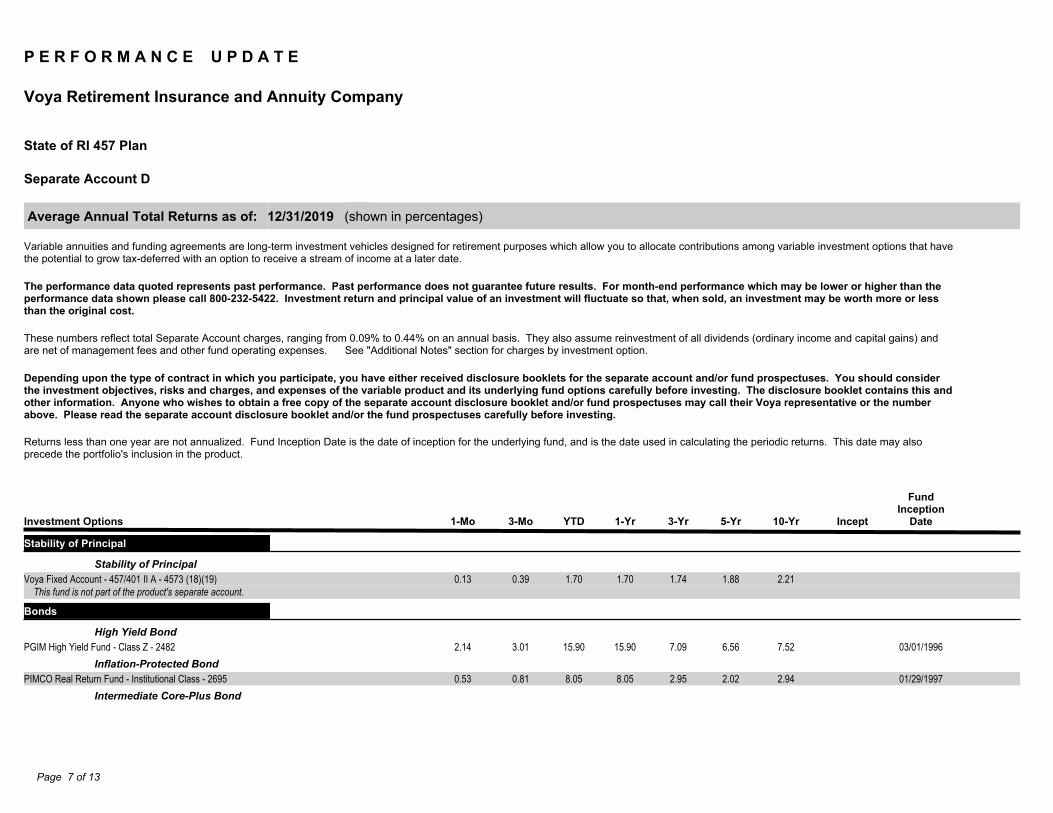
P E R F O R M A N C E U P D A T E
Voya Retirement Insurance and Annuity Company
State of RI 457 Plan
Separate Account D
12/31/2019 (shown in percentages) Average Annual Total Returns as of:
Variable annuities and funding agreements are long-term investment vehicles designed for retirement purposes which allow you to allocate contributions among variable investment options that havethe potential to grow tax-deferred with an option to receive a stream of income at a later date.
The performance data quoted represents past performance. Past performance does not guarantee future results. For month-end performance which may be lower or higher than theperformance data shown please call 800-232-5422. Investment return and principal value of an investment will fluctuate so that, when sold, an investment may be worth more or lessthan the original cost.
These numbers reflect total Separate Account charges, ranging from 0.09% to 0.44% on an annual basis. They also assume reinvestment of all dividends (ordinary income and capital gains) andare net of management fees and other fund operating expenses. See "Additional Notes" section for charges by investment option.
Depending upon the type of contract in which you participate, you have either received disclosure booklets for the separate account and/or fund prospectuses. You should considerthe investment objectives, risks and charges, and expenses of the variable product and its underlying fund options carefully before investing. The disclosure booklet contains this andother information. Anyone who wishes to obtain a free copy of the separate account disclosure booklet and/or fund prospectuses may call their Voya representative or the numberabove. Please read the separate account disclosure booklet and/or the fund prospectuses carefully before investing.
Returns less than one year are not annualized. Fund Inception Date is the date of inception for the underlying fund, and is the date used in calculating the periodic returns. This date may alsoprecede the portfolio's inclusion in the product.
1-Mo 3-Yr1-Yr3-Mo YTD 10-Yr
FundInception
DateInvestment Options Incept5-Yr
Stability of Principal
Stability of Principal1.701.70 2.211.74Voya Fixed Account - 457/401 II A - 4573 (18)(19) 1.880.390.13
This fund is not part of the product's separate account.
Bonds
High Yield Bond15.9015.90 7.52 03/01/19967.09PGIM High Yield Fund - Class Z - 2482 6.563.012.14
Inflation-Protected Bond8.058.05 2.94 01/29/19972.95PIMCO Real Return Fund - Institutional Class - 2695 2.020.810.53
Intermediate Core-Plus Bond
Page 7 of 13

See Performance Introduction Page for Important Information
1-Mo 3-Yr1-Yr3-Mo YTD 10-Yr
FundInception
DateInvestment Options Incept5-Yr9.749.74 4.95 12/15/19984.50Voya Intermediate Bond Fund - Class I - 238 (1)(2) 3.530.15-0.12
Intermediate-Term Bond8.268.26 3.28 01/02/20043.59State Street U.S. Bond Index SL Series Fund - Class XIV CIT - C925 2.600.06-0.10
Asset Allocation
Lifecycle15.08 8.4915.08 10/03/20117.58Voya Solution 2020 Portfolio - Initial Class - 6750 (3)(4) 5.892.911.0818.1818.18 7.77 04/29/20058.82Voya Solution 2025 Portfolio - Initial Class - 790 (4)(5) 6.454.801.8220.50 10.4120.50 10/03/20119.64Voya Solution 2030 Portfolio - Initial Class - 6753 (4)(6) 7.125.882.2622.0722.07 8.62 04/29/200510.28Voya Solution 2035 Portfolio - Initial Class - 761 (4)(7) 7.276.842.6523.29 11.5523.29 10/03/201110.61Voya Solution 2040 Portfolio - Initial Class - 6756 (4)(8) 7.697.342.8424.1424.14 9.05 04/29/200510.61Voya Solution 2045 Portfolio - Initial Class - 764 (4)(9) 7.447.893.0324.59 11.6924.59 10/03/201110.77Voya Solution 2050 Portfolio - Initial Class - 6759 (4)(10) 7.768.073.1024.61 9.1324.61 03/08/201010.79Voya Solution 2055 Portfolio - Initial Class - 1166 (4)(11) 7.548.143.1224.64 7.7224.64 02/09/201510.84Voya Solution 2060 Portfolio - Initial Class - 3290 (4)(12) 8.183.1913.2413.24 5.66 04/29/20056.39Voya Solution Income Portfolio - Initial Class - 767 (4)(13) 4.752.521.00
Balanced
Allocation--50% to 70% Equity24.5124.51 11.76 01/24/198912.99VY® T. Rowe Price Capital Appreciation Portfolio - Inst - 1257 10.455.461.84
Large Cap Value
Large Blend33.3633.36 13.87 05/31/200016.61Vanguard® FTSE Social Index Fund - Admiral™ Shares - D591 11.9210.413.2828.7028.70 11.67 12/31/197913.85Voya Growth and Income Portfolio - Class I - 001 (14) 9.757.442.7830.9230.92 13.08 05/03/200414.77Voya U.S. Stock Index Portfolio - Institutional Class - 829 11.218.972.99
Large Value27.2827.28 11.19 11/29/198811.18BlackRock Equity Dividend Fund - Institutional Shares - 8518 (15) 9.718.272.79
Large Cap Growth
Large Growth32.5832.58 14.34 05/03/200419.11Voya Large Cap Growth Portfolio - Institutional Class - 742 (16) 13.269.222.57
Small/Mid/Specialty
Mid-Cap Growth42.4742.47 15.55 12/06/200018.26Principal MidCap Fund - Class R-6 - C906 12.826.081.34
Small Blend27.4027.40 12.19 04/09/200910.65State Street Russell Small Mid Cap Index SL Fund - Class II - QF52 8.608.822.0926.0426.04 11.37 12/27/19965.59Voya Small Company Portfolio - Class I - 042 (17) 7.718.852.70
Global / International
Foreign Large Blend
Page 8 of 13

See Performance Introduction Page for Important Information
1-Mo 3-Yr1-Yr3-Mo YTD 10-Yr
FundInception
DateInvestment Options Incept5-Yr13.41 05/31/2019State Street Global All Cap Eq Ex-U.S. Ind SL Srs F - II CIT - D937 9.084.36
Foreign Large Growth26.8626.86 6.26 04/16/198411.96American Funds EuroPacific Growth Fund® - Class R-4 - 573 6.949.984.26
The risks of investing in small company stocks may include relatively low trading volumes, a greater degree of change in earnings and greater short-term volatility.
Foreign investing involves special risks such as currency fluctuation and public disclosure, as well as economic and political risks.
Some of the Funds invest in securities guaranteed by the U.S. Government as to the timely payment of principal and interest; however, shares of the Funds are not insured nor guaranteed.
High yielding fixed-income securities generally are subject to greater market fluctuations and risks of loss of income and principal than are investments in lower yielding fixed-income securities.
Sector funds may involve greater-than average risk and are often more volatile than funds holding a diversified portfolio of stocks in many industries. Examples include: banking, biotechnology,chemicals, energy, environmental services, natural resources, precious metals, technology, telecommunications, and utilities.
Additional Notes
Insurance products, annuities and funding agreements issued by Voya Retirement Insurance and Annuity Company, One Orange Way Windsor, CT 06095, (VRIAC), which is solely responsible formeeting its obligations. Plan administrative services provided by VRIAC or Voya Institutional Plan Services, LLC. All companies are members of the Voya family of companies. Securities aredistributed by or offered through Voya Financial Partners, LLC (member SIPC) or other broker-dealers with which it has a selling agreement.
For a performance report reflecting the charges or more information regarding product expenses, please contact your Voya Representative.
(1)Voya Intermediate Bond Fund - Class I has identical investment objectives and policies, the same portfolio manager, and invests in the same holdings as Class A. The performance informationabove is based upon the Class A performance, excluding sales charges, and has not been adjusted by the fee differences between classes.
(2)Voya Intermediate Bond Fund - Class I: The adviser is contractually obligated to limit expenses to 0.50% through August 1, 2018. The limitation does not extend to interest, taxes, investment-related costs, leverage expenses, extraordinary expenses, and Acquired Fund Fees and Expenses. This limitation is subject to possible recoupment by the adviser within 36 months of the waiver orreimbursement. Termination or modification of this obligation requires approval by the Fund's board.
(3)Voya Solution 2020 Portfolio - Initial Class: The adviser is contractually obligated to limit expenses to 0.72% of Class I shares through May 1, 2020. The limitation does not extend to interest,taxes, investment-related costs, leverage expenses and extraordinary expenses. This limitation is subject to possible recoupment by the adviser within 36 months of the waiver or reimbursement.Termination or modification of this obligation requires approval by the Portfolio's board.
(4)There is no guarantee that any investment option will achieve its stated objective. Principal value fluctuates and there is no guarantee of value at any time, including the target date. The "targetdate" is the approximate date when you plan to start withdrawing your money. When your target date is reached, you may have more or less than the original amount invested. For each target datePortfolio, until the day prior to its Target Date, the Portfolio will seek to provide total returns consistent with an asset allocation targeted for an investor who is retiring in approximately each Portfolio'sdesignation Target Year. Prior to choosing a Target Date Portfolio, investors are strongly encouraged to review and understand the Portfolio's objectives and its composition of stocks and bonds, andhow the asset allocation will change over time as the target date nears. No two investors are alike and one should not assume that just because they intend to retire in the year corresponding to theTarget Date that that specific Portfolio is appropriate and suitable to their risk tolerance. It is recommended that an investor consider carefully the possibility of capital loss in each of the target datePortfolios, the likelihood and magnitude of which will be dependent upon the Portfolio's asset allocation. On the Target Date, the portfolio will seek to provide a combination of total return and stabilityof principal.
The Voya Solution / Target Date PortfoliosSM are actively managed and the asset allocation adjusted over time. The portfolios may merge with or change to other portfolios over time. Refer to theprospectus for more information about the specific risks of investing in the various asset classes included in the The Voya Solution / Target Date PortfoliosSM.
Page 9 of 13
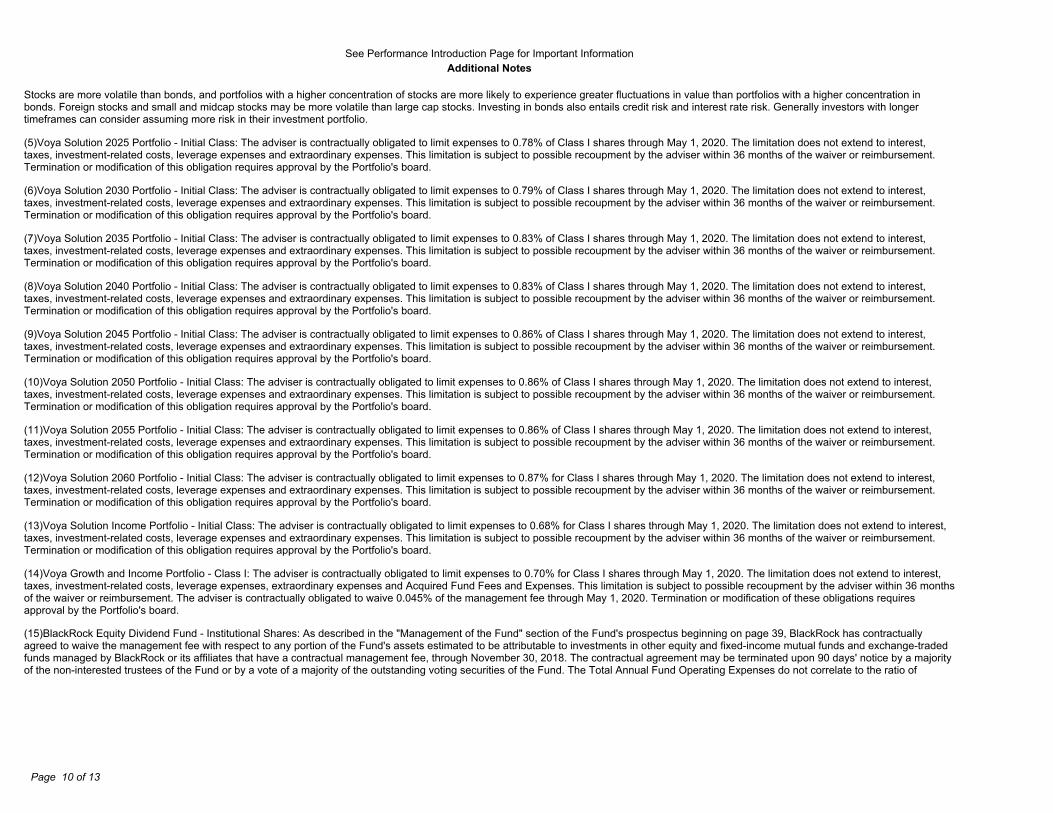
See Performance Introduction Page for Important InformationAdditional Notes
Stocks are more volatile than bonds, and portfolios with a higher concentration of stocks are more likely to experience greater fluctuations in value than portfolios with a higher concentration inbonds. Foreign stocks and small and midcap stocks may be more volatile than large cap stocks. Investing in bonds also entails credit risk and interest rate risk. Generally investors with longertimeframes can consider assuming more risk in their investment portfolio.
(5)Voya Solution 2025 Portfolio - Initial Class: The adviser is contractually obligated to limit expenses to 0.78% of Class I shares through May 1, 2020. The limitation does not extend to interest,taxes, investment-related costs, leverage expenses and extraordinary expenses. This limitation is subject to possible recoupment by the adviser within 36 months of the waiver or reimbursement.Termination or modification of this obligation requires approval by the Portfolio's board.
(6)Voya Solution 2030 Portfolio - Initial Class: The adviser is contractually obligated to limit expenses to 0.79% of Class I shares through May 1, 2020. The limitation does not extend to interest,taxes, investment-related costs, leverage expenses and extraordinary expenses. This limitation is subject to possible recoupment by the adviser within 36 months of the waiver or reimbursement.Termination or modification of this obligation requires approval by the Portfolio's board.
(7)Voya Solution 2035 Portfolio - Initial Class: The adviser is contractually obligated to limit expenses to 0.83% of Class I shares through May 1, 2020. The limitation does not extend to interest,taxes, investment-related costs, leverage expenses and extraordinary expenses. This limitation is subject to possible recoupment by the adviser within 36 months of the waiver or reimbursement.Termination or modification of this obligation requires approval by the Portfolio's board.
(8)Voya Solution 2040 Portfolio - Initial Class: The adviser is contractually obligated to limit expenses to 0.83% of Class I shares through May 1, 2020. The limitation does not extend to interest,taxes, investment-related costs, leverage expenses and extraordinary expenses. This limitation is subject to possible recoupment by the adviser within 36 months of the waiver or reimbursement.Termination or modification of this obligation requires approval by the Portfolio's board.
(9)Voya Solution 2045 Portfolio - Initial Class: The adviser is contractually obligated to limit expenses to 0.86% of Class I shares through May 1, 2020. The limitation does not extend to interest,taxes, investment-related costs, leverage expenses and extraordinary expenses. This limitation is subject to possible recoupment by the adviser within 36 months of the waiver or reimbursement.Termination or modification of this obligation requires approval by the Portfolio's board.
(10)Voya Solution 2050 Portfolio - Initial Class: The adviser is contractually obligated to limit expenses to 0.86% of Class I shares through May 1, 2020. The limitation does not extend to interest,taxes, investment-related costs, leverage expenses and extraordinary expenses. This limitation is subject to possible recoupment by the adviser within 36 months of the waiver or reimbursement.Termination or modification of this obligation requires approval by the Portfolio's board.
(11)Voya Solution 2055 Portfolio - Initial Class: The adviser is contractually obligated to limit expenses to 0.86% of Class I shares through May 1, 2020. The limitation does not extend to interest,taxes, investment-related costs, leverage expenses and extraordinary expenses. This limitation is subject to possible recoupment by the adviser within 36 months of the waiver or reimbursement.Termination or modification of this obligation requires approval by the Portfolio's board.
(12)Voya Solution 2060 Portfolio - Initial Class: The adviser is contractually obligated to limit expenses to 0.87% for Class I shares through May 1, 2020. The limitation does not extend to interest,taxes, investment-related costs, leverage expenses and extraordinary expenses. This limitation is subject to possible recoupment by the adviser within 36 months of the waiver or reimbursement.Termination or modification of this obligation requires approval by the Portfolio's board.
(13)Voya Solution Income Portfolio - Initial Class: The adviser is contractually obligated to limit expenses to 0.68% for Class I shares through May 1, 2020. The limitation does not extend to interest,taxes, investment-related costs, leverage expenses and extraordinary expenses. This limitation is subject to possible recoupment by the adviser within 36 months of the waiver or reimbursement.Termination or modification of this obligation requires approval by the Portfolio's board.
(14)Voya Growth and Income Portfolio - Class I: The adviser is contractually obligated to limit expenses to 0.70% for Class I shares through May 1, 2020. The limitation does not extend to interest,taxes, investment-related costs, leverage expenses, extraordinary expenses and Acquired Fund Fees and Expenses. This limitation is subject to possible recoupment by the adviser within 36 monthsof the waiver or reimbursement. The adviser is contractually obligated to waive 0.045% of the management fee through May 1, 2020. Termination or modification of these obligations requiresapproval by the Portfolio's board.
(15)BlackRock Equity Dividend Fund - Institutional Shares: As described in the "Management of the Fund" section of the Fund's prospectus beginning on page 39, BlackRock has contractuallyagreed to waive the management fee with respect to any portion of the Fund's assets estimated to be attributable to investments in other equity and fixed-income mutual funds and exchange-tradedfunds managed by BlackRock or its affiliates that have a contractual management fee, through November 30, 2018. The contractual agreement may be terminated upon 90 days' notice by a majorityof the non-interested trustees of the Fund or by a vote of a majority of the outstanding voting securities of the Fund. The Total Annual Fund Operating Expenses do not correlate to the ratio of
Page 10 of 13

See Performance Introduction Page for Important InformationAdditional Notes
expenses to average net assets given in the Fund's most recent annual report which does not include Acquired Fund Fees and Expenses.
(16)Voya Large Cap Growth Portfolio - Institutional Class: The adviser is contractually obligated to limit expenses to 0.67% through May 1, 2019. The limitation does not extend to interest, taxes,investment-related costs, leverage expenses, extraordinary expenses, and Acquired Fund Fees and Expenses. Termination or modification of this obligation requires approval by the Portfolio'sboard.
(17)Voya Small Company Portfolio - Class I: The adviser is contractually obligated to limit expenses to 0.93% through May 1, 2019. The limitation does not extend to interest, taxes, investment-related costs, leverage expenses, extraordinary expenses, and Acquired Fund Fees and Expenses. This limitation is subject to possible recoupment by the adviser within 36 months of the waiver orreimbursement. Termination or modification of this obligation requires approval by the Portfolio's board.
These numbers reflect the fund's investment advisory fees, other fund expenses, and the annual deduction from the Separate Account as stated below:American Funds EuroPacific Grw R4: 0.09%Voya Growth and Income Port I, Voya Large Cap Growth Port Inst, Voya Small Company Portfolio I: 0.14%VY TRowePrice Captl Apprec Pt Inst, Voya U.S. Stock Index Port Inst: 0.16%BlackRock Equity Dividend Fund Inst, PGIM High Yield Fund Z: 0.19%Voya Intermediate Bond Fund I: 0.27%PIMCO Real Return Fund Inst, Principal MidCap Fund R6, St Str Gl A Cp Eq Ex US In SL S F II, St Str Russell Sm/Md Cp Ind SL Fd II, St Str US Bond Index SL Fd XIV, Vanguard FTSE SocialIndex Fund Adm: 0.44%All Other funds: 0.12%
(18)The current rate for the Voya Fixed Account - 457/401 II A MC 901, Fund 4573 is 1.55%, expressed as an annual effective yield. The current rate may change and be higher or lower than thepreviously identified rate but is guaranteed not to be less than 1.00%. VRIAC will not apply a decrease to the current rate following a rate change initiated solely by us prior to the last day of thethree-month period measured from the first day of the month in which such change was effective. Note: The current rate for an initial investment in the fixed account previously identified may be ineffect for less than a full three-month period.
(19)The Investment Option is neither a mutual fund nor part of a Separate Account. The returns listed do not include the impact of contract charges. Please refer to the contract or disclosure book todetermine which Fixed Interest Options are available for your specific plan. The Investment Option is offered through Voya Retirement Insurance and Annuity Company.
The returns do not reflect the impact of a Deferred Surrender Charge. If included, performance would be less favorable.
Not all investments options are available under all contracts; please check your disclosure booklet for options available under your plan.
Benchmark DescriptionBenchmark IdBBgBarc US HY 1% Issuer Cap TR USDBCUSH1IC
FTSE 4Good US Select Index measures the performance of companies that meet globally recognized corporate responsibilitystandards, and to facilitate investment in those companies.
FTSE4GUSS
BBgBarc Capital U.S. Treasury U.S. TIPS Index measures the performance of rulesbased, market value-weighted inflation-protectedsecurities issued by the U.S. Treasury. It is a subset of the Global Inflation-Linked Index (Series-L).
LBUSTIPS
BBgBarc U.S. Aggregate Bond Index measures the performance of investment grade, U.S. dollar-denominated, fixed-rate taxable bondmarket, including Treasuries, government-related and corporate securities, MBS (agency fixed-rate and hybrid ARM passthroughs),ABS, and CMBS. It rolls up into other Barclays flagship indices, such as the multi-currency Global Aggregate Index and the U.S.Universal Index, which includes high yield and emerging markets debt.
LEHM
MFR Money Market Index is comprised of returns which are based upon historical average 30-day compound yields on a universe oftaxable money market funds. The data for the universe, which includes approximately 980 funds, is compiled by iMoneynet, Inc. Goal ofING Fixed Account - 457/401 is to outperform the MFR by 150 - 200 basis points over 3 - 5 year time periods.
MFR
MSCI ACWI (All Country World Index) ex USA Index measures the performance of the large and mid-cap segment of the particularregions, excluding USA equity securities,including developed and emerging market. It is free float-adjusted market-capitalization
MSCIXUS
Page 11 of 13
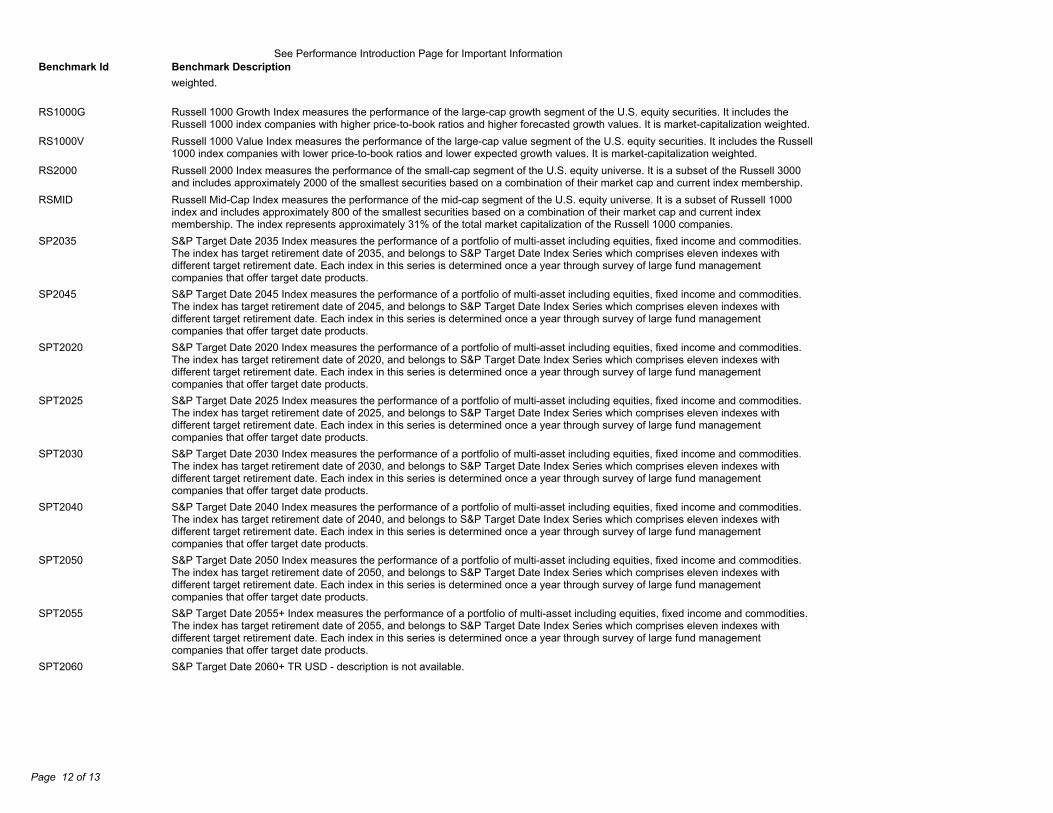
See Performance Introduction Page for Important InformationBenchmark DescriptionBenchmark Idweighted.
Russell 1000 Growth Index measures the performance of the large-cap growth segment of the U.S. equity securities. It includes theRussell 1000 index companies with higher price-to-book ratios and higher forecasted growth values. It is market-capitalization weighted.
RS1000G
Russell 1000 Value Index measures the performance of the large-cap value segment of the U.S. equity securities. It includes the Russell1000 index companies with lower price-to-book ratios and lower expected growth values. It is market-capitalization weighted.
RS1000V
Russell 2000 Index measures the performance of the small-cap segment of the U.S. equity universe. It is a subset of the Russell 3000and includes approximately 2000 of the smallest securities based on a combination of their market cap and current index membership.
RS2000
Russell Mid-Cap Index measures the performance of the mid-cap segment of the U.S. equity universe. It is a subset of Russell 1000index and includes approximately 800 of the smallest securities based on a combination of their market cap and current indexmembership. The index represents approximately 31% of the total market capitalization of the Russell 1000 companies.
RSMID
S&P Target Date 2035 Index measures the performance of a portfolio of multi-asset including equities, fixed income and commodities.The index has target retirement date of 2035, and belongs to S&P Target Date Index Series which comprises eleven indexes withdifferent target retirement date. Each index in this series is determined once a year through survey of large fund managementcompanies that offer target date products.
SP2035
S&P Target Date 2045 Index measures the performance of a portfolio of multi-asset including equities, fixed income and commodities.The index has target retirement date of 2045, and belongs to S&P Target Date Index Series which comprises eleven indexes withdifferent target retirement date. Each index in this series is determined once a year through survey of large fund managementcompanies that offer target date products.
SP2045
S&P Target Date 2020 Index measures the performance of a portfolio of multi-asset including equities, fixed income and commodities.The index has target retirement date of 2020, and belongs to S&P Target Date Index Series which comprises eleven indexes withdifferent target retirement date. Each index in this series is determined once a year through survey of large fund managementcompanies that offer target date products.
SPT2020
S&P Target Date 2025 Index measures the performance of a portfolio of multi-asset including equities, fixed income and commodities.The index has target retirement date of 2025, and belongs to S&P Target Date Index Series which comprises eleven indexes withdifferent target retirement date. Each index in this series is determined once a year through survey of large fund managementcompanies that offer target date products.
SPT2025
S&P Target Date 2030 Index measures the performance of a portfolio of multi-asset including equities, fixed income and commodities.The index has target retirement date of 2030, and belongs to S&P Target Date Index Series which comprises eleven indexes withdifferent target retirement date. Each index in this series is determined once a year through survey of large fund managementcompanies that offer target date products.
SPT2030
S&P Target Date 2040 Index measures the performance of a portfolio of multi-asset including equities, fixed income and commodities.The index has target retirement date of 2040, and belongs to S&P Target Date Index Series which comprises eleven indexes withdifferent target retirement date. Each index in this series is determined once a year through survey of large fund managementcompanies that offer target date products.
SPT2040
S&P Target Date 2050 Index measures the performance of a portfolio of multi-asset including equities, fixed income and commodities.The index has target retirement date of 2050, and belongs to S&P Target Date Index Series which comprises eleven indexes withdifferent target retirement date. Each index in this series is determined once a year through survey of large fund managementcompanies that offer target date products.
SPT2050
S&P Target Date 2055+ Index measures the performance of a portfolio of multi-asset including equities, fixed income and commodities.The index has target retirement date of 2055, and belongs to S&P Target Date Index Series which comprises eleven indexes withdifferent target retirement date. Each index in this series is determined once a year through survey of large fund managementcompanies that offer target date products.
SPT2055
S&P Target Date 2060+ TR USD - description is not available.SPT2060
Page 12 of 13

See Performance Introduction Page for Important InformationBenchmark DescriptionBenchmark IdS&P Target Date Retirement Income Index measures the performance of a portfolio of multi-asset including equities, fixed income andcommodities. The index belongs to S&P Target Date Index Series which comprises eleven indexes with different target retirement date.Each index in this series is determined once a year through survey of large fund management companies that offer target date products.
SPTREIN
S&P 500 60% / Barclays Capital Corp/Gov Bond Index 40% consists of a mix of 60% of an unmanaged stock index (The Standard &Poor's 500) and 40% of an unmanaged bond index (Barclays Capital Gov't Corp. Bond Index).
SPXLBGC
S&P 500 Index measures the performance of 500 widely held stocks in U.S. equity market. Standard and Poor's chooses membercompanies for the index based on market size, liquidity and industry group representation. Included are the stocks of industrial, financial,utility, and transportation companies. Since mid 1989, this composition has been more flexible and the number of issues in each sectorhas varied. The index is market capitalization-weighted.
SPXRE
Monday, March 16, 2020Creation Date:
Page 13 of 13

Fund NameFund
Number Asset Class Balance Percent
Voya Solution 2020 Port I 6750 Asset Allocation $26,464.57 0.01%
Voya Solution 2025 Portfolio I 790 Asset Allocation $1,572,714.12 0.81%
Voya Solution 2030 Port I 6753 Asset Allocation $53,623.57 0.03%
Voya Solution 2035 Portfolio I 761 Asset Allocation $1,231,539.74 0.63%
Voya Solution 2040 Port I 6756 Asset Allocation $4,161.86 0.00%
Voya Solution 2045 Portfolio I 764 Asset Allocation $1,050,141.31 0.54%
Voya Solution 2050 Port I 6759 Asset Allocation $14,588.86 0.01%
Voya Solution 2055 Portfolio I 1166 Asset Allocation $556,603.55 0.29%
Voya Solution 2060 Port I 3290 Asset Allocation $37,775.74 0.02%
Voya Solution Income Prt I 767 Asset Allocation $371,981.05 0.19%
VY TRowePrice Captl Apprec Pt Inst 1257 Balanced $9,470,004.60 4.86%
PGIM High Yield Fund Z 2482 Bonds $1,147,144.05 0.59%
PIMCO Real Return Fund Ins 2695 Bonds $573,924.40 0.29%
SStr US Bond Index SL Fd XIV C925 Bonds $797,450.90 0.41%
Voya Intermediate Bond Fund I 238 Bonds $8,546,883.65 4.38%
American Funds EuroPacific Grw R4 573 Global / International $6,184,154.42 3.17%
S St Gl Al Cp Eq xUS I SL S II D937 Global / International $3,832,153.58 1.97%
Voya Growth and Income Port I 1 Large Cap Blend $26,823,826.47 13.76%
Voya Large Cap Growth Port Inst 742 Large Cap Growth $12,679,933.85 6.50%
BlackRock Equity Dividend Fund Inst 8518 Large Cap Value $4,209,436.81 2.16%
Vangrd FTSE Social Ind Fd Adm D591 Large Cap Value $146,370.93 0.08%
Voya U.S. Stock Index Port Inst 829 Large Cap Value $12,494,401.45 6.41%
Principal MidCap Fd R6 C906 Small/Mid/Specialty $12,059,749.64 6.19%
SStr Russ SM Cp Ind SL Fd II QF52 Small/Mid/Specialty $2,982,288.02 1.53%
Voya Small Company Portfolio I 42 Small/Mid/Specialty $6,729,139.31 3.45%
Voya Fixed Account - 457/401 43 Stability of Principal $69,951,770.47 35.88%
Voya Fixed Account 457401 II A 4573 Stability of Principal $11,362,869.75 5.83%
Voya Long-Term GAA (4560) 4560 Stability of Principal $25,853.45 0.01%
TOTAL $194,936,950.12
State of RI 457b: Plan Balance By Investment - 02/29/2020

Section XVI.
OPEB Trust

Account Name Benchmark Name
MarketValue % of Total Month YTD Fiscal YTD 1 Year 3 Years 5 Years 10 Years ITD
Annualized
InceptionDate
Mackay Shields OPEB 141,457,451.8 38.2 1.79 3.91 6.48 11.89 5.00 3.45 3.16 5/1/2013Bloomberg Barclays U.S. AggregateBond Index
1.80 3.76 6.30 11.68 5.01 3.58 3.21 5/1/2013
SSGA S&P 500 INDX 228,761,289.2 61.8 -8.23 -8.28 1.72 8.02 9.76 9.19 11.93 5/1/2011S&P 500 - Total Return Index -8.23 -8.27 1.75 8.19 9.87 9.23 11.46 5/1/2011
Total OPEB 370,218,741.0 100.0 -4.66 -3.99 3.66 9.71 8.27 7.33 8.78 5/1/20111OPEB Custom Blend -4.72 -4.10 3.51 9.75 8.40 7.43 8.25 5/1/2011
Total Performance Summary
TOTAL NET OF FEES2/29/2020
Report ID: IPM0005
Reporting Currency: USD
Page 1 of 2 Source: The Bank of New York Mellon Corporation3/18/2020 7:08:11 PM EDT
1 RI7GX0903OPE OPEB Custom Blend 35% Barclays Aggregate and 65% S&P 500
Total Performance Summary
END NOTES2/29/2020
Report ID: IPM0005
Reporting Currency: USD
Page 2 of 2 Source: The Bank of New York Mellon Corporation3/18/2020 7:08:11 PM EDT

Account Name Benchmark Name
MarketValue % of Total YTD Month
1/1/2020 -1/31/2020
12/1/2019 -12/31/2019
Cumulative
2019 2018 2017Inception
Date
Mackay Shields OPEB 141,457,451.8 38.2 3.91 1.79 2.08 -0.08 8.91 -0.54 3.78 5/1/2013Bloomberg Barclays U.S. AggregateBond Index
3.76 1.80 1.92 -0.07 8.72 0.01 3.54 5/1/2013
SSGA S&P 500 INDX 228,761,289.2 61.8 -8.28 -8.23 -0.05 3.01 31.19 -4.42 21.80 5/1/2011S&P 500 - Total Return Index -8.27 -8.23 -0.04 3.02 31.49 -4.38 21.83 5/1/2011
1Total OPEB 370,218,741.0 100.0 -3.99 -4.66 0.70 1.93 22.99 -2.85 15.32 5/1/20112OPEB Custom Blend -4.10 -4.72 0.65 1.94 23.33 -2.58 15.14 5/1/2011
Total Performance Summary
TOTAL NET OF FEES2/29/2020
Report ID: IPM0005
Reporting Currency: USD
Page 1 of 2 Source: The Bank of New York Mellon Corporation3/18/2020 7:09:30 PM EDT

1 RI7G10000000 Total OPEB YTD - Calendar Year to Date
Month - Current Month
Cumulative Months - Prior Month and Second Prior Month
2013, 2012, 2011 - Calendar Year2 RI7GX0903OPE OPEB Custom Blend 65% S&P 500 and 35% Barclays Aggregate
Total Performance Summary
END NOTES2/29/2020
Report ID: IPM0005
Reporting Currency: USD
Page 2 of 2 Source: The Bank of New York Mellon Corporation3/18/2020 7:09:30 PM EDT