Embed Size (px)
Citation preview
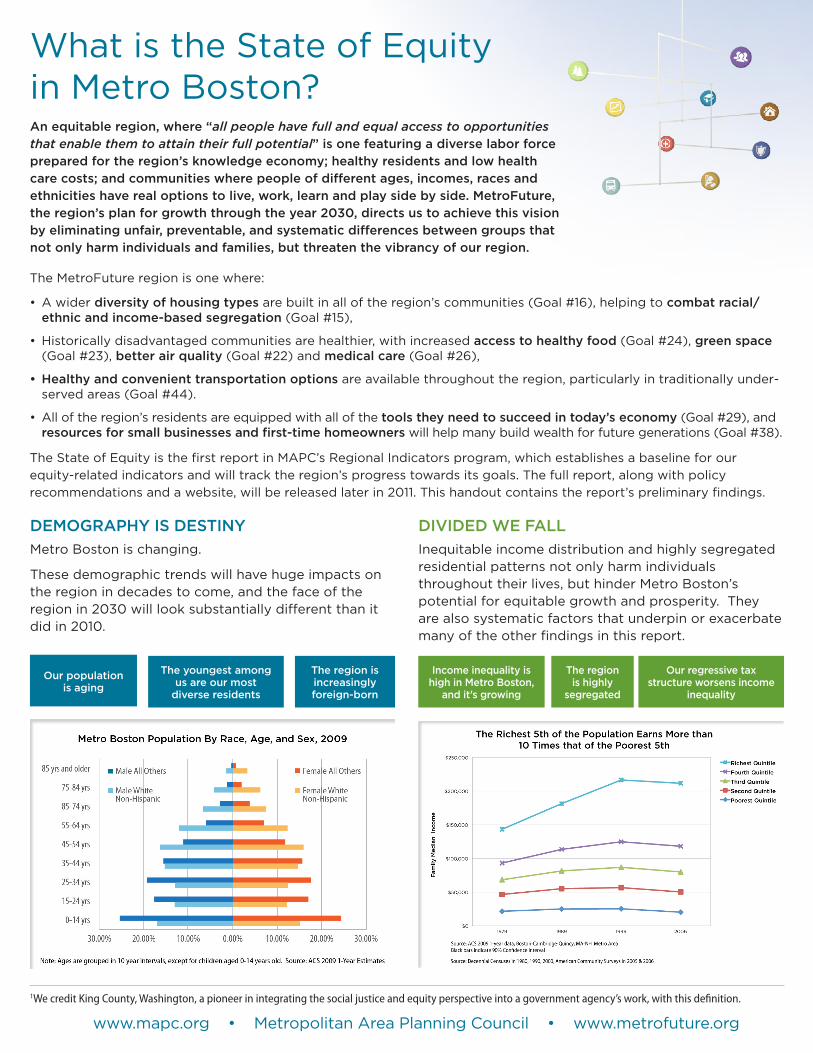
Demography is DestinyMetro Boston is changing.
These demographic trends will have huge impacts on the region in decades to come, and the face of the region in 2030 will look substantially different than it did in 2010.
DiviDeD we fallInequitable income distribution and highly segregated residential patterns not only harm individuals throughout their lives, but hinder Metro Boston’s potential for equitable growth and prosperity. They are also systematic factors that underpin or exacerbate many of the other findings in this report.
The MetroFuture region is one where:
A wider • diversity of housing types are built in all of the region’s communities (Goal #16), helping to combat racial/ethnic and income-based segregation (Goal #15),
Historically disadvantaged communities are healthier, with increased • access to healthy food (Goal #24), green space (Goal #23), better air quality (Goal #22) and medical care (Goal #26),
healthy and convenient transportation options• are available throughout the region, particularly in traditionally under-served areas (Goal #44).
All of the region’s residents are equipped with all of the • tools they need to succeed in today’s economy (Goal #29), and resources for small businesses and first-time homeowners will help many build wealth for future generations (Goal #38).
The State of Equity is the first report in MAPC’s Regional Indicators program, which establishes a baseline for our equity-related indicators and will track the region’s progress towards its goals. The full report, along with policy recommendations and a website, will be released later in 2011. This handout contains the report’s preliminary findings.
What is the State of Equity in Metro Boston?
1We credit King County, Washington, a pioneer in integrating the social justice and equity perspective into a government agency’s work, with this definition.
an equitable region, where “all people have full and equal access to opportunities that enable them to attain their full potential” is one featuring a diverse labor force prepared for the region’s knowledge economy; healthy residents and low health care costs; and communities where people of different ages, incomes, races and ethnicities have real options to live, work, learn and play side by side. metrofuture, the region’s plan for growth through the year 2030, directs us to achieve this vision by eliminating unfair, preventable, and systematic differences between groups that not only harm individuals and families, but threaten the vibrancy of our region.
the region is increasingly foreign-born
income inequality is high in metro Boston,
and it’s growing
the region is highly
segregated
our regressive tax structure worsens income
inequality
our population is aging
the youngest among us are our most
diverse residents
www.mapc.org•MetropolitanAreaPlanningCouncil•www.metrofuture.org
March 1
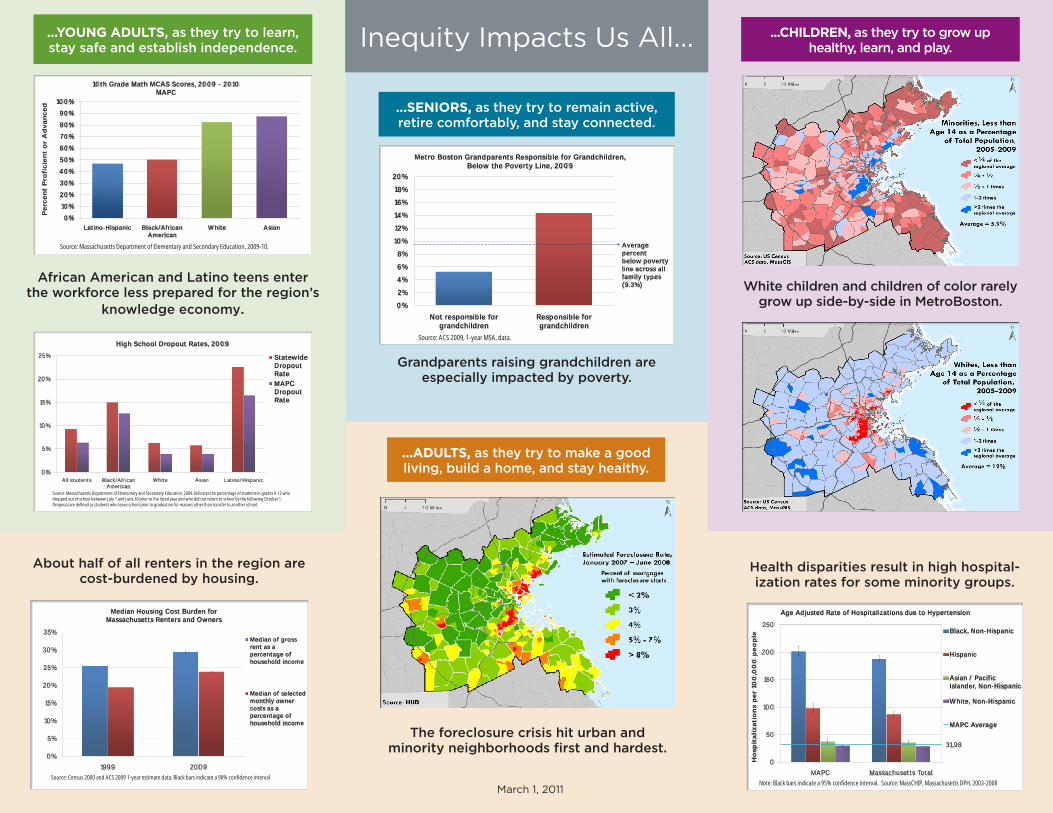
About half of all renters in the region are cost-burdened by housing.
0%
5%
10%
15%
20%
25%
30%
35%
1999 2009
Median Housing Cost Burden for Massachusetts Renters and Owners
Median of gross rent as a percentage of household income
Median of selected monthly owner costs as a percentage of household income
Source: Census 2000 and ACS 2009 1-year estimate data. Black bars indicate a 90% confidence interval
31.98
0
50
100
150
200
250
MAPC Massachusetts Total
Ho
sp
ita
liza
tio
ns p
er
100
,00
0 p
eo
ple
Age Adjusted Rate of Hospitalizations due to Hypertension
Black, Non-Hispanic
Hispanic
Asian / Pacific Islander, Non-Hispanic
White, Non-Hispanic
MAPC Average
Note: Black bars indicate a 95% confidence interval. Source: MassCHIP, Massachusetts DPH, 2003-2008
...SENIORS, as they try to remain active, retire comfortably, and stay connected.
0%
2%
4%
6%
8%
10%
12%
14%
16%
18%
20%
Not responsible for grandchildren
Responsible for grandchildren
Metro Boston Grandparents Responsible for Grandchildren, Below the Poverty Line, 2009
Source: ACS 2009, 1-year MSA, data.
Average percent below poverty line across all family types (9.3%)
Inequity Impacts Us All... ...CHILDREN, as they try to grow up healthy, learn, and play.
0%
10%
20%
30%
40%
50%
60%
70%
80%
90%
100%
Latino-Hispanic Black/African American
White Asian
Pe
rce
nt
Pro
ficie
nt
or
Ad
va
nce
d
10th Grade Math MCAS Scores, 2009 - 2010MAPC
Source: Massachusetts Department of Elementary and Secondary Education, 2009-10.
0%
5%
10%
15%
20%
25%
All students Black/African American
White Asian Latino/Hispanic
High School Dropout Rates, 2009
Statewide Dropout Rate
MAPC Dropout Rate
Source: Massachusetts Department of Elementary and Secondary Education, 2009. Indicates the percentage of students in grades 9-12 who dropped out of school between July 1 and June 30 prior to the listed year and who did not return to school by the following October 1. Dropouts are defined as students who leave school prior to graduation for reasons other than transfer to another school.
...YOUNG ADULTS, as they try to learn, stay safe and establish independence.
African American and Latino teens enter the workforce less prepared for the region’s
knowledge economy.
Grandparents raising grandchildren are especially impacted by poverty.
White children and children of color rarely grow up side-by-side in MetroBoston.
...ADULTS, as they try to make a good living, build a home, and stay healthy.
Health disparities result in high hospital-ization rates for some minority groups.
The foreclosure crisis hit urban and minority neighborhoods first and hardest.
March 1, 2011