Embed Size (px)
Citation preview

3519307.1
ISBN 978-1-869456-88-7
Project no. 13.03/16462
Public Version
Mobile Market Study - Preliminary Findings
The Commission: Dr Stephen Gale
Dr Jill Walker
Elisabeth Welson
John Crawford
Date of publication: 16 May 2019
3519307.1
Associated documents
Publication date
Reference Title
6 October 2017 N/A Mobile Market Study - Terms of Reference
27 March 2018 N/A Mobile Market Study - Scope
31 August 2018 ISBN no. 978-1-869456-54-2 Study of Mobile Telecommunications Markets in New Zealand - Issues Paper
Commerce Commission
Wellington, New Zealand

3
3519307.1

4
3519307.1
Glossary
Acronym Title
2G 2nd Generation mobile communications technology
3G 3rd Generation mobile communications technology
4G 4th Generation mobile communications technology
5G 5th Generation mobile communications technology
ACCC Australian Competition and Consumer Commission
ARPU Average Revenue Per month per User/subscriber
Backhaul Backhaul (transport) is a generic term used to describe a point to point service where aggregated traffic is carried between network nodes
BEREC Body of European Regulators for Electronic Communications
CDMA Code-Division Multiple Access – a 2G mobile phone standard developed in the United States
CDR Consumer Data Right - typically a data portability right, whereby a consumer can easily provide a standardised set of their usage information to a potential provider
Commerce Act The Commerce Act 1986
DFAS Direct fibre access service defined in section 164 of the Telecommunications Act. Typically used in mobile networks for dedicated backhaul services
EBITDA An accounting term - Earnings Before Interest, Tax, Depreciation and Amortisation
eSIMs Embedded SIM - a non-removable version of a SIM card
Ethernet A family of computer networking technologies most commonly used in wired Local Area Networks and Wide Area Networks
FWA Fixed Wireless Access – type of wireless broadband data communication which is performed between two fixed locations
GB Gigabyte. 1 gigabyte = 1024 megabytes

5
3519307.1
GCSB (NZ) Government Communications Security Bureau
GHz Gigahertz. 1 gigahertz = 1000 megahertz
GSM Global System for Mobile communications – a standard developed to describe the protocols for 2G digital cellular networks
GSMA Global System for Mobile Communication Association - trade body that represents the interests of mobile network operators worldwide
ICABS Intra-Candidate Area Backhaul – a Chorus ‘next generation commercial’ backhaul product
IoT Internet of Things – the network of physical and virtual objects accessed through the internet
IP
Internet protocol - the method or protocol by which data is sent from one computer to another on the internet. Each computer (host) on the internet has at least one IP address that uniquely identifies it from all other computers on the internet.
LFC Local Fibre Company – provider of fibre access services under the NZ Government’s UFB initiative (see section 156AB of the Telecommunications Act)
LRIC Long Run Incremental Cost – an economic method typically used to regulate the prices of wholesale voice or similar services
LTE Long Term Evolution – a name given to the fourth generation of mobile technology that can provide high speed mobile broadband
MBIE Ministry of Business Innovation and Employment
Mbps Megabits per second – used to measure data transfer speeds
MBSF Mobile Black Spot Fund – Government fund to provide greater mobile coverage on state highways and in tourism locations where no coverage currently exists
MHz Megahertz – one million oscillations per second
MMS Multimedia Messaging Service – a way of sending and receiving multimedia content, like emojis and pictures between mobile devices

6
3519307.1
MNO
Mobile Network Operator – an operator that owns or controls all the elements necessary to deliver mobile services to consumers, including radio spectrum and the wireless network infrastructure
MTAS Mobile Termination Access Service – a regulated service that provides for the termination on a cellular mobile telephone network of voice calls and SMS messages
MTR Mobile Termination Rates – the wholesale prices for the MTAS
MVNE
Mobile Virtual Network Enabler – a company that provides the platforms to keep pace with rapidly evolving consumer demand for services. They also allow rapid on-boarding and integration of an MVNO with an MNO and provide the ability to connect with third parties via defined IT systems
MVNO
Mobile Virtual Network Operator – an operator that provides mobile services but does not generally have its own radio spectrum or much of the infrastructure required to provide mobile services. It therefore relies on buying services from an MNO. The amount of control it has over the services it offers will vary according to the nature of its agreement
NERA NERA Economic Consulting
OECD Organisation for Economic Cooperation and Development
Ofcom Office of Communications – the regulatory and competition authority for broadcasting, telecommunications and postal industries in the United Kingdom
OTT Over the top – refers to content and applications provided from a third party and delivered to an end user device, leaving the retailer responsible only for transporting IP packets
RBI (RBI1 and RBI2)
Rural Broadband Initiative – an initiative in two stages where the Government partners with private sector telecommunications operators to upgrade or extend telecommunications networks in rural areas
RCG Rural Connectivity Group – a joint venture between 2degrees, Spark and Vodafone who have a contract with the Government under RBI2 and the MBSF
RSM Radio Spectrum Management – business unit of MBIE responsible for managing radio spectrum
7
3519307.1
RTP Restrictive Trade Practices
SIM
Subscriber Identity Module card – commonly known as a SIM card that contains a microchip that stores data that identifies the user, for use in GSM and compatible 3G and 4G mobile phones
SMS Short Message Service – commonly known as a text messaging, this is a service for sending and receiving short messages between mobile devices
STD
Standard Terms Determination - the Commerce Commission’s primary mechanism for regulating non-fibre telecommunications services under the Telecommunications Act by determining the terms on which a designated access service or specified service must be supplied
Telecommunications Act The Telecommunications Act 2001
TSLRIC Total Service Long Run Incremental Cost - the final pricing principle used as the basis for MTAS and is defined in Schedule 1 of the Telecommunications Act
UMTS
Universal Mobile Telecommunications System – the 3G successor to the 2G GSM standard, which allows voice telephony, mobile internet access, fixed wireless internet access, video calls and mobile TV
VoIP Voice of Internet Protocol - voice services delivered using IP networks
W-CDMA Wideband Code Division Multiple Access – third generation mobile phone standard
WiFi
Wireless Fidelity Standard – a series of standards for a popular technology that allows electronic devices to exchange data wirelessly (using radio waves), including allowing mobile devices to connect to high speed internet connections
WISPA
Wireless Internet Service Providers Association - an association of Wireless Internet Services Providers (WISPs) that typically service rural locations in New Zealand where mobile networks currently do not operate, or have limited coverage

8
3519307.1
TABLE OF CONTENTS
3
Glossary 4
Executive summary and preliminary findings 10
Mobile services market study 10 Competition in the mobile market 10 Preliminary findings from our study of the mobile services market 11
Chapter 1 Introduction 17
Purpose of the study and legal framework 17
Purpose of the study 17 Legal framework for the study 18 Current progress and timeline for completion 18 Purpose and structure of the Preliminary Findings report 20
Chapter 2 Mobile networks and services 23
Purpose of this chapter 23
Mobile networks 23 Mobile services 25 Mobile service providers 28 Mobile regulatory settings in New Zealand 28 Changes to regulation 30
Chapter 3 Development of mobile services and competition 31
Purpose and structure of this chapter 31
Purpose 31 Structure 31
Updated analysis of mobile services 31
Market structure and market shares 32 Bundling 35 Pricing 37 Usage trends 45 Investment 46 Profitability 48 Quality of mobile services 50 Consumer satisfaction 52
Our views on the key issues in the mobile market 55
Spectrum 55 MVNOs 56 Consumer engagement 57
Chapter 4 Key issues identified by the Commission 58
Purpose and structure of this chapter 58
Spectrum 58
Introduction 58 What we said in the Issues Paper 59 Further analysis of spectrum 60
MVNOs 67
Introduction 67

9
3519307.1
Potential benefits to consumers from MVNOs 67 MVNO operating models and margins 68 Emerging competition at the wholesale level 71
Consumer engagement and experience with mobile services 76
Introduction 76 How easily can consumers access the information they need? 76 How easily can consumers assess the information they have? 77 How easy is it for consumers to act? 81 Behavioural biases 84 Potential remedies/actions 87
Chapter 5 State of competition in the mobile market 89
Purpose and structure of this chapter 89
Purpose 89 Structure 89
Our view on the state of competition in the mobile market 89
Existing competition 89 Conditions for further expansion and entry 93 Consumer engagement 94
Chapter 6 Future developments in mobile services 97
Purpose of this chapter 97
5th Generation (5G) mobile networks 97
eSIMs 100
Network slicing 102
Infrastructure sharing 103
Chapter 7 Regulated services 107
Purpose of this chapter 107
Mobile termination access services (MTAS) 107
National roaming 110
Mobile co-location 111
Number portability 113
Backhaul 113

10
3519307.1
Executive summary and preliminary findings
Mobile services market study
X1 Mobile communications have developed into an essential function, supporting New
Zealanders in all aspects of their lives. Mobile services allow consumers to contact
friends and family, conduct business, be entertained, and engage with government,
medical, educational and emergency services when not connected to a fixed
network. The importance of mobile communications is expected to increase even
further in the future with the continued growth of machine-to-machine
communications and the internet of things (IoT).
X2 Rapid technological change is a hallmark of the telecommunications sector, but
particularly in markets in which mobile services are supplied. Non-traditional
network providers and over-the-top (OTT) suppliers such as Google and Apple add to
the challenges for regulatory authorities and policy makers seeking to ensure that
the competition and regulatory policy settings are appropriate.
X3 One of our mandates under the Telecommunications Act 2001 (Telecommunications
Act) is to monitor competition, and the performance and development of,
telecommunication markets. In this study we have been analysing the current state
of competition for mobile services, likely future developments, and the potential
impacts on competition and consumers. This analysis includes examining issues of
how the supply of mobile services has performed, barriers to entry and expansion,
and the extent to which consumers of mobile services are engaged and can take
advantage of competing retail offers.
X4 We welcome submissions on our preliminary findings and our exploration of the
issues discussed in this report. Details of the submissions timeline and process can
be found in Chapter 1 of this report.
Competition in the mobile market
X5 Three vertically integrated national mobile network operators (MNOs) 2degrees,
Vodafone and Spark provide retail mobile services to New Zealand consumers.
Alongside these MNOs are a small number of mobile service providers that operate
solely at the retail level as mobile virtual network operators (MVNOs). These retail
only mobile operators include the Vocus brands and the Warehouse, as well as sub-
brands like Spark’s Skinny mobile. This compares with ten years ago when there
were only two vertically integrated national MNOs and a small number of MVNOs
and no MNO sub-brands.

11
3519307.1
X6 Increased competition has contributed to improved outcomes for consumers
through lower prices, increasing quality, and greater choice of services. Most key
indicators like pricing, quality of service, coverage, and choice are trending in a
positive direction.
X7 Our study has identified spectrum, MVNOs and consumer engagement as important
factors likely to influence the further development of competition in the mobile
market going forward.
Preliminary findings from our study of the mobile services market
X8 In this section we set out our consolidated preliminary findings and our proposed
actions arising from our study into the mobile market.
X9 Table X1 sets out our general preliminary findings on the current state of the mobile
market.
Table X1 Preliminary findings on the development of the mobile market
Finding
number Preliminary Finding
PF1
Market shares amongst the three national MNOs have become more
evenly balanced over time, particularly in the prepaid and residential on-
account segments.
PF2
Ongoing investment in the mobile networks has seen all three MNOs
investing in new generations of mobile technology and 2degrees
completing the roll-out of its national network.
PF3 All three national MNOs are reporting profits, although profit margins vary,
reflecting differences in market share and mix of customers.
PF4
Three national mobile networks appear to perform well on most technical
measures of quality, although the quality of coverage for 4G services is
relatively low compared to other countries.
PF5
Prices of mobile services have been falling. Prices for low and medium
usage bundles compare well with other OECD countries. Prices for higher
usage bundles remain relatively expensive, especially when compared with
Australia.
PF6
Usage of mobile calls and in particular mobile data has continued to
increase in recent years, although average data usage appears to be
relatively low compared to other countries.

12
3519307.1
X10 Tables X2, X3 and X4 set out our preliminary findings on the key issues of spectrum
allocation, MVNOs, and consumer engagement.
Table X2 Preliminary findings on spectrum
Finding
number Preliminary Finding
PF7
Spectrum is a scarce and critical input into the supply of mobile services.
Significant asymmetries in spectrum holdings (including in terms of the
amount and type of spectrum held) can affect competition in the mobile
market, and the design of future allocation processes for spectrum should
have regard to such asymmetries. In setting limits on the amount of
spectrum that may be acquired, it may also be appropriate to have regard
to existing holdings in other bands which represent a substitute for the
spectrum being auctioned or allocated.
PF8
We do not believe there is a case for regulatory intervention to facilitate a
fourth national MNO to enter the market. However, the design of the
upcoming 3.5 GHz spectrum allocation process should not foreclose the
possibility for new parties (including parties who may complement or
compete with the existing MNOs) to obtain spectrum.
Table X3 Preliminary findings on MVNOs
Finding
number Preliminary Finding
PF9
MVNOs currently serve just over 1% of the retail mobile market. Until
recently, wholesale competition between MNOs to host MVNOs has been
limited.
PF10
With three national mobile networks, sufficient competitive conditions at
the wholesale level exist and we expect MVNOs should emerge if they are
commercially viable. However, spectrum allocation decisions will be critical
to support this competition.
PF11
There is some evidence that recent increased wholesale activity by
2degrees has prompted a response from Spark and Vodafone in offering
MVNO access. Spark has recently signed an MVNO agreement with
Trustpower, and Vodafone with Kogan Mobile.
PF12
In light of this, we do not consider MVNO access regulation to be
appropriate at this time. There would need to be greater evidence of
market failure to justify wholesale access regulation.

13
3519307.1
Table X4 Preliminary findings on consumer engagement
Finding
number Preliminary Finding
PF13 Most consumers can easily access their mobile usage information, but
information on mobile performance (speeds, actual quality of coverage etc)
is harder to access.
PF14 Most consumers find it easy to compare available plans, but report that
they only do so infrequently.
PF15
Our evidence shows that the process for residential consumers to switch
between mobile suppliers is relatively easy, given that:
a) mobile number portability is available;
b) there are low numbers of locked handsets; and
c) long-term contracts for residential consumers are not prominent.
Bundling of mobile and fixed line services, which can increase customer
stickiness, does not appear to be widespread in the residential market.
F16
While residential consumers report being able to easily access usage
information and compare plans, and that the process of switching appears
to be relatively easy, a significant proportion of consumers have not
compared plans in the last 12 months and have remained with their current
supplier for more than five years. This suggests that there is a degree of
consumer inertia.
PF17
Switching in the business market appears to be more complex and more
infrequent than residential mobile services. Businesses typically purchase
mobile and fixed services as a package, often through fixed-term contracts,
with brand reputation being an important driver. Larger business
customers are more sophisticated buyers, and generally have more access
to specialist advice and support and are more likely to have dedicated
procurement resources.

14
3519307.1
X11 A summary of our preliminary findings on the state of competition and our proposed
actions is set out in table X5 and table X6 below.
Table X5 Preliminary findings on the state of competition
Finding
number Preliminary Finding
PF18
Our preliminary view is that competition in the retail mobile market has become more established with three independent, national network-based competitors. This has resulted in mobile consumers benefitting from an increasingly competitive market environment.
PF19
There remain some areas where we anticipate competitive outcomes for consumers could improve further, such as pricing for higher usage bundles of mobile services. Average mobile data usage in New Zealand remains low by international standards, and this may reflect relatively high prices for larger bundles.
PF20
We believe that the conditions for effective competition exist, with the three MNOs each having a network of similar technology with similar geographic and population coverage metrics. We consider that:
a) spectrum must be allocated with wholesale and retail competition matters at the forefront of decisions;
b) with the pre-conditions for competition in place and the adequate
allocation of spectrum, we would expect MVNO services to develop
where market opportunities exist; and
c) there may be room for improved consumer engagement, to ensure that consumers are aware of and able to easily take advantage of competing offers to drive competition.

15
3519307.1
Table X6 Proposed actions on the state of competition
Finding
number Preliminary Finding
PA1
We will continue to engage with MBIE on the importance of the upcoming
spectrum allocation/auctions for delivering competitive outcomes in the
mobile market.
PA2 We will amend the Annual Monitoring Report to capture information on the
development of MVNO market share and business sustainability.
PA3
We will undertake further work as part of our wider responsibilities under
section 9A and Part 7 of the Telecommunications Act (outside of this study)
to:
a) continue to improve our understanding of the extent to which consumers can and do access, assess and act on relevant information in the mobile and wider telecommunications markets;
b) assess consumers choice of mobile plan against their usage, including quantification of the potential savings mobile consumers could make if they were on plans that better match their usage; and
c) continue to assess the quality of services provided by mobile suppliers and the extent to which consumers are actively engaged in the mobile market, as part of our wider retail service quality programme, including the Commissions ability to review or create retail service quality codes if appropriate.
X12 In table X7 we summarise our preliminary findings on some of the potential future
developments that may affect competition.
Table X7 Preliminary finding on future developments in the mobile market
Finding
number Preliminary Finding
PF21
5G will initially be an evolution over existing networks, and over time
network densification will occur. Investment in 5G may alter the economics
of mobile provision and raises the prospect of greater infrastructure sharing,
and larger incentives to utilise network capacity through MVNO agreements.
PF22
eSIM capable devices are likely to become more prevalent, with the
potential to reduce switching costs for both consumers, MNOs and MVNOs.
However, there is the potential for competition to be suppressed if MNOs do
not enable eSIMs or lock eSIM devices to their network.
PF23
We may see more infrastructure sharing. Whether this enhances or
suppresses competition will depend on how the arrangements are
structured. We would expect to see infrastructure sharing proposals that
raise potential competition concerns come to us for authorisation.

16
3519307.1
X13 In table X8 we set out our preliminary findings on our regulated services and our
planned reviews of our services over the next five years.
Table X8 Preliminary findings on regulated services
Finding
number Preliminary Finding
PF24
Our review of the current market competitive conditions, and likely future
developments, has not identified sufficient grounds for us to bring forward
our planned reviews of regulated services. The scheduled reviews for these
services are set out in Table 1 in Chapter 2.
PF25
Backhaul services, whether metropolitan or between national network
nodes, appear not to have constrained the competitiveness or development
of mobile services, to date. However, we recognise the potential for
bottlenecks to develop as mobile (eg, 5G), fibre technologies (eg, passive
optical networking) and fibre regulation undergo a period of significant
change.

17
3519307.1
Chapter 1 Introduction
Purpose of the study and legal framework
Purpose of the study
1.1 We have been undertaking this study of mobile markets in New Zealand (study), to
gain a better understanding of how the mobile market is currently performing and
developing, and to consider how the mobile landscape may evolve in the future.1
1.2 This study is helping us build an evidence base, so we can track relevant trends and
identify whether there are any current or potential barriers to competition
delivering benefits for consumers of mobile services in New Zealand.
1.3 Our study will help us to ensure that any future market interventions, if required,
are appropriate and proportionate. We will be able to:
1.3.1 identify areas in the mobile market that might require more or less focus
on an ongoing basis;
1.3.2 inform policy makers, industry and consumers of the performance of the
mobile market through regular monitoring and reporting of market
performance and development;
1.3.3 consider whether any regulatory measures (including deregulation) may
be appropriate;
1.3.4 if necessary, recommend legislative changes; and
1.3.5 consider whether any investigations into potential breaches of the Fair
Trading Act 1986, Part 2 of the Commerce Act 1986 (Commerce Act) or
Credit Contracts and Consumer Finance Act 2003 may be required.
1 Throughout this document we refer to the market in which mobile services are supplied. We do not
consider that a formal definition of the dimensions of the relevant market or markets (as might be
undertaken for the purposes of Part 2 or Part 3 of the Commerce Act) is required for this study.

18
3519307.1
Legal framework for the study
1.4 We are conducting this study under section 9A of the Telecommunications Act.
Section 9A2 sets out that:
(1) In addition to the other functions conferred on the Commission by this Act, the
Commission-
(a) must monitor competition in telecommunications markets and the performance
and development of telecommunications markets; and
(b) may conduct inquiries, reviews, and studies (including international benchmarking)
into any matter relating to the telecommunications industry or the long-term
benefit of end-users of telecommunications services within New Zealand; and
(c) must monitor compliance with the Commission 111 contact code; and
(d) must make available reports, summaries, and information about the things
referred to in paragraphs (a) to (c); and
(e) must monitor retail service quality in relation to telecommunications services; and
(f) must make available reports, summaries, and information about retail service
quality in a way that informs consumer choice.
(2) The functions in subsection (1)(d) and (f) do not require the Commission to release all
documents that the Commission produces or acquires under this section or section 10A.
1.5 One of the ways we use section 9A studies is to gather information about, and
develop our understanding of, telecommunications markets.
Current progress and timeline for completion
Progress to date
1.6 On 6 October 2017, we announced this study of mobile markets in New Zealand
and invited interested parties to submit on our proposed Terms of Reference for
the study.3
1.7 We received submissions from 2degrees, Blue Reach, Chorus, InternetNZ, New
Street Research, Spark, Trustpower, Vocus, Vodafone and WISPA New Zealand.
Public versions of the submissions are available on our website.
1.8 Following the submissions on the Terms of Reference, we published our scope
paper on 27 March 2018, and indicated that we would publish an issues paper and
seek submissions.
2 Section 9A was replaced on 13 November 2018 by section 25 of the Telecommunications (New Regulatory
Framework) Amendment Act 2018 (2018 No 48). 3 Commerce Commission website, “Mobile market study”, https://comcom.govt.nz/regulated-
industries/telecommunications/projects/mobile-market-study’

19
3519307.1
1.9 We published our Issues Paper on 31 August 2018, and received submissions from
2degrees, Chorus, InternetNZ, Spark, Trustpower, Speedchecker Ltd, Venture
Southland, Vocus, Vodafone and WISPA New Zealand. Public versions of the
submissions are available on our website.
1.10 In December 2018 we published an update on the study, setting out our intention
to publish preliminary findings in April 2019 and that we expected to complete the
study with our findings report in September 2019. On 18 March we provided a
further update that we expected to publish our preliminary findings in mid May
2019.4
Next steps
1.11 Following the publication of this preliminary findings report on 16 May 2019, we
anticipate the following timetable to complete the study.
Milestone Indicative dates
Submissions on the preliminary
findings due 28 June 2019
Cross submissions due 19 July 2019
Mobile market study findings
published end September 2019
Submissions
1.12 We are interested in your views and evidence in response to our preliminary
findings and proposed actions raised throughout this report. These are
consolidated on pages 11-16 for ease of reference.
1.13 Please send your submission to us by 5pm on 28 June 2019, and address these to
Andrew Harrison, c/o [email protected].
1.14 We anticipate that there may be important information of relevance to this study
that is commercially sensitive. If you wish to provide commercially sensitive
information in your submission, we request that you provide multiple versions of
your submission.
4 Commerce Commission website, “Mobile market study”,
https://comcom.govt.nz/__data/assets/pdf_file/0026/130886/Email-to-industry-Changes-to-the-mobile-
market-study-timeline-18-March-2019.pdf

20
3519307.1
1.15 If including commercially sensitive information in your submission, we offer the
following guidance:
1.15.1 Please provide a clearly labelled “confidential version” and “public
version”. This is because we intend to publish all public versions on our
website.
1.15.2 Where a confidential version of your submission is provided, please ensure
that you clearly and specifically identify all information you consider to be
confidential.
1.16 The responsibility for ensuring that confidential information is not included in a
public version of a submission rests entirely with the party making the submission.
1.17 Submitters must also explain the basis for any claims that the information
identified in their submissions is confidential. Where commercial sensitivity is
asserted, submitters must explain why the publication of the information would be
likely to unreasonably prejudice their commercial position or that of another
person who is the subject of the information.
1.18 If we consider that disclosure of information that has been provided in the
confidential version may be necessary for the public interest, we will consult with
the party that provided the information before any such disclosure is made.
Purpose and structure of the Preliminary Findings report
Purpose of the report
1.19 This paper presents our preliminary findings and proposed actions from our
analysis of the performance and development of the mobile market. It also
considers emerging trends and their potential impact on competition and market
outcomes.
1.20 In preparing our preliminary findings we have considered the submissions received
in response to our Terms of Reference and Issues Paper, information gathered from
stakeholders, analysis from independent consultants, and other information that
we have referenced throughout this paper.

21
3519307.1
Structure of the report
1.21 Chapter 2 provides background on mobile networks and services, and the
regulatory settings that currently apply to the mobile market.
1.22 Chapter 3 describes the development of mobile services and competition using a
range of competition indicators:
1.22.1 market structure and market shares, including by market segment;
1.22.2 bundling of mobile services with other services;
1.22.3 pricing, including how prices for mobile services have moved over time,
and how prices in New Zealand compare to prices in other countries;
1.22.4 usage trends, including how volumes of mobile calls, messaging services,
and mobile data have changed over time, and the importance of mobile
services to consumers;
1.22.5 investment in mobile access infrastructure and spectrum;
1.22.6 profitability of mobile suppliers;
1.22.7 quality of mobile services, including network coverage, availability, mobile
data speeds, and customer service; and
1.22.8 consumer satisfaction.
1.23 Chapter 4 sets out a detailed exploration of three key issues we have identified that
may have an influence on delivering competitive outcomes for mobile consumers in
New Zealand. These are:
1.23.1 Spectrum – the allocation of, or access to, adequate spectrum is an
important issue to sustain competition and to accommodate rapidly
growing demand for mobile services;
1.23.2 MVNO access – the competitive conditions for the provision of wholesale
mobile services; and
1.23.3 Consumer engagement – the ability of consumers to make informed
decisions and their willingness to take advantage of competition between
suppliers of mobile services. Consumer engagement is important for
driving competition and facilitating entry and expansion.

22
3519307.1
1.24 Chapter 5 sets out our views on the state of competition in the mobile market,
having considered the performance of the mobile market in New Zealand to date
and the key issues which are likely to influence the further development of
competition in the mobile market going forward.
1.25 Chapter 6 discusses a selection of potential developments which may be relevant
to future mobile competition and consumers.
1.26 Chapter 7 sets out our examination of our regulatory settings and services in light
of the performance and potential evolution of mobile services.
23
3519307.1
Chapter 2 Mobile networks and services
Purpose of this chapter
2.1 This chapter introduces and briefly describes the services within the scope of our
study. We discuss the components of a generic mobile telecommunications
network and the services that are supplied over it.
2.2 We distinguish between mobile services (where the signal connecting consumer
devices is handed over between cell sites as the consumer moves around) and fixed
wireless services (which are more location-specific).
2.3 We also summarise the different types of providers of mobile services and briefly
outline the current regulatory framework.
Mobile networks
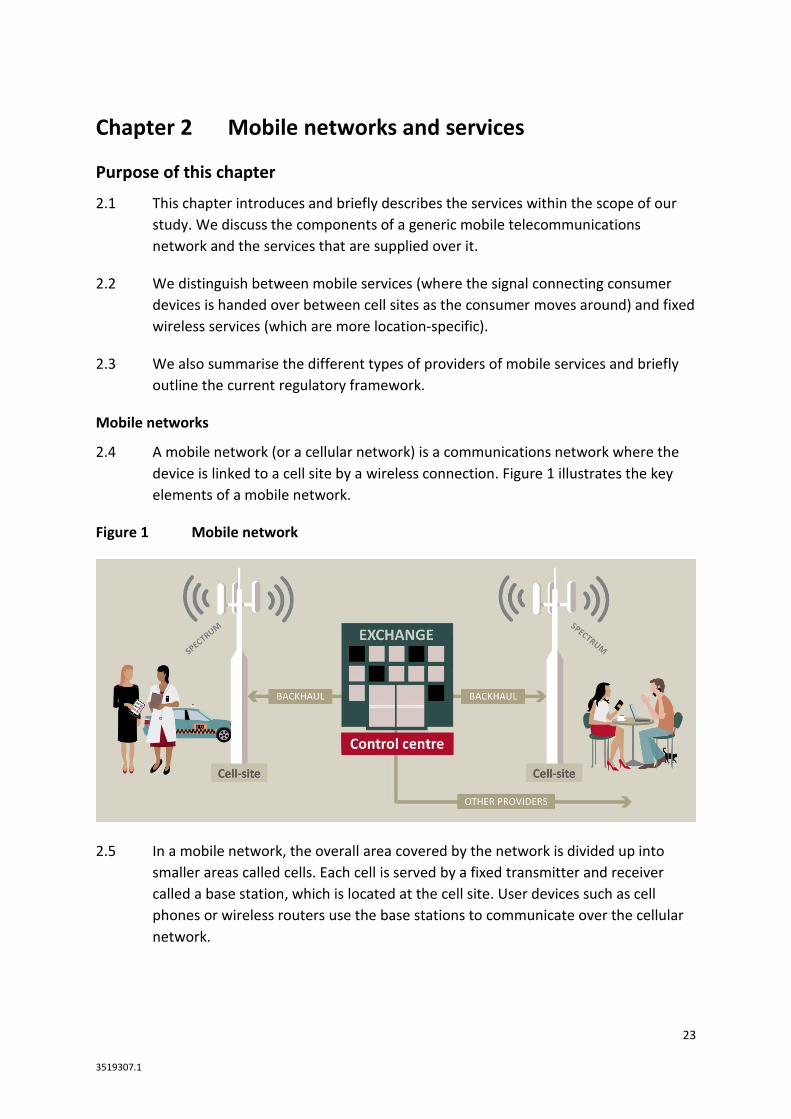
2.4 A mobile network (or a cellular network) is a communications network where the
device is linked to a cell site by a wireless connection. Figure 1 illustrates the key
elements of a mobile network.
Figure 1 Mobile network
2.5 In a mobile network, the overall area covered by the network is divided up into
smaller areas called cells. Each cell is served by a fixed transmitter and receiver
called a base station, which is located at the cell site. User devices such as cell
phones or wireless routers use the base stations to communicate over the cellular
network.

24
3519307.1
2.6 Spectrum is a critical input to the deployment of a mobile network. It refers to the
radio frequencies allocated to the mobile industry and other sectors for
communication over the air.
2.7 Mobile services and mobile network architectures have undergone significant
evolution since mobile networks were first deployed. Depending on the specific
region of the world, different sets of standards were adopted for each network
generation:
2.7.1 in Europe and most of the world, the Global System for Mobile (GSM)
standard was used for the second generation (2G) of mobile systems. This
later evolved to the Universal Mobile Telecommunications System (UMTS)
for the third generation (3G) and Long-Term Evolution (LTE) for 4G; and
2.7.2 in the USA, the CDMAOne standard became the dominant 2G system which
later evolved to CDMA2000 for 3G and LTE for 4G.
2.8 New Zealand MNOs currently use the GSM, UMTS and LTE systems for their 2G, 3G
and 4G networks respectively. Most mobile services in New Zealand use 3G or 4G
networks, with 2G either already decommissioned or being progressively phased
out.
2.9 MNOs use a variety of spectrum bands to provide mobile services. Lower spectrum
frequencies provide wider coverage and have better penetration (meaning they are
better able to pass through objects such as walls) than higher spectrum
frequencies. MNOs will use higher spectrum frequencies if they have exhausted the
lower ones or need more capacity.
2.10 This has meant that MNOs typically use lower spectrum frequencies to serve rural
locations, where coverage rather than capacity is a concern. Conversely, in urban
areas where capacity (rather than coverage) is a concern, MNOs typically use
higher frequency spectrum.
2.11 Backhaul (transport) is a generic term used to describe a point to point service
where aggregated traffic is carried between network nodes. In a mobile network,
the MNO uses backhaul to connect its cell sites to other aggregation nodes such as
mobile switching centres. Backhaul contributes to the service performance that an
MNO’s customers receive as it impacts on the capacity of the network and the
latency of mobile services provided.

25
3519307.1
2.12 The MNO may deploy its own backhaul infrastructure or may purchase backhaul
from third parties. The backhaul requirements of a mobile network are typically
based on fibre to ensure service performance levels, however wireless backhaul
(digital microwave) may be used in locations where fibre build out is prohibitively
expensive, traffic is low and spectrum interference is not an issue.
2.13 Mobile networks interconnect with one another (and fixed networks) so that
subscribers on one network are able to communicate with subscribers on other
networks.
2.14 Mobile networks can also provide connectivity to IoT devices. IoT describes the
network of physical and virtual objects accessed through the internet.5
Mobile services
2.15 Mobile services are location independent communications services (voice,
messaging, and data) delivered over a cellular mobile network to devices such as
mobile handsets, or data devices such as tablets with in-built mobile connectivity,
or ‘dongle’ devices using cellular modems (Figure 2).
Figure 2 Mobile devices
2.16 Mobile networks were initially designed to carry voice and messaging services.
More recently, the emergence of 3G and, in particular, 4G mobile network
technologies has made the delivery of mobile data services at least as important as
voice and messaging, providing for mobile broadband connectivity and OTT
services.
5 IoT devices can be connected via a mobile network or a specialised IoT network.

26
3519307.1
2.17 These services are mobile in the sense that they can be used while moving around
and are not tied to a specific fixed location of the consumer’s device. As a
consumer moves from the coverage area of one cell site to that of a neighbouring
cell site, the signal to their mobile device is handed over between cell sites.
2.18 This is in contrast to voice and broadband services that are delivered to a fixed
location, including fixed line services (delivered over copper, coaxial cable or fibre-
based networks) and ‘fixed wireless’ services (delivered over a wireless network).
2.19 From a consumer’s perspective, a fixed wireless modem looks and performs
similarly to a fixed line modem. In both cases, consumers’ devices are connected
either through local WiFi or an Ethernet cable. The only difference is that behind
the fixed wireless modem, the network connection is via a wireless network rather
than a copper or fibre cable.
2.20 In our 2016 review of the Schedule 1 services,6 we noted that fixed wireless
services provide similar functionality and features as a fixed line broadband service
at similar prices. We also found that mobile broadband services were considerably
more expensive on a price per gigabyte (GB) basis than fixed wireless and fixed line
broadband services, and that the average amount of data usage was considerably
higher for fixed broadband services than for mobile broadband. This remains the
case. For example, Spark offers entry-level fibre and fixed wireless broadband
services for the same retail price ($75 per month for up to 120GB, or $0.63 per GB).
By comparison, Spark offers mobile broadband for $69.99 for 12GB ($5.83 per GB).7
2.21 This suggests that fixed wireless services are currently competing with other fixed
line services in New Zealand, whereas mobile broadband services are likely to have
a more complementary relationship at this stage.8
2.22 Although we do not include fixed wireless services when assessing the current state
of competition in the mobile markets, we recognise that there are likely to be some
economies of scope on the supply side which may affect decisions around entry
and expansion by MNOs and MVNOs.
6 Commerce Commission “Review of Designated and Specified Services under Schedule 1 of the
Telecommunications Act 2001” (5 July 2016), paragraph A24. The review considered 14 services, including
mobile co-location and number portability, both relevant to mobile services. The process for reviewing
Schedule 1 services is discussed further at paragraph 2.40 below. 7 Spark website accessed May 2019. 8 We note that the boundary between fixed services (fixed line and fixed wireless) and mobile services may
become increasingly blurred, eg as a result of WiFi.

27
3519307.1
2.23 The ability to offer fixed wireless services will depend on spectrum holdings, in
particular in the frequency bands required to deliver the capacity associated with
fixed wireless services. We also note that fixed wireless services are likely to be an
important feature of 5G deployments and possible MVNO product offerings.
2.24 Mobile services have typically been offered to consumers through two types of retail plans. Prepay plans are where consumers pay for services in advance and on account plans, also called post-pay, are where consumers pay at the end of each month of service.
2.25 On account plans may be in the following forms:
2.25.1 fixed term contracts, where the consumer signs up for a contract period
of, for example, 12 or 24 months. These plans have typically been offered
with a handset discount, and the consumer faces an early termination
charge to break the contract; and
2.25.2 open term plans, where the consumer pays for the service on a month by
month basis and is not locked into a fixed term contract.
2.26 Recently mobile service providers in New Zealand have moved more towards
offering open term plans. These can be paired with monthly interest free payments
for new handsets. Interest free payments spread the purchase price of a handset
across a 12, 24 or 36-month period with the option to pay off the remaining
amount in full at any point.
2.27 If the customer switches to another supplier, they are required to pay the balance
on the handset and in some cases to repay any discount the customer received at
the time of purchasing the handset. Spark, Vodafone and 2degrees current handset
promotional offers all appear to relate to open term plans with interest free
payments.9
2.28 The on-account market can be further split into residential and business segments.
2.29 Mobile plans are typically made up of a set ‘bundle’ of texts, calls, and data. The
majority of plans have data caps; however there have been moves recently towards
plans that are marketed as having uncapped or “unlimited” data.10
9 As advertised online as of May 2019. 10 These uncapped data plans are not truly unlimited as they are subject to fair-use terms and MNOs
severely throttle customers’ speeds after a certain amount of data has been consumed. The Commission is
currently considering whether the use of the term ‘unlimited’ in describing these plans has the potential
to mislead consumers and breach the Fair Trading Act 1986.

28
3519307.1
Mobile service providers
2.30 There are two types of service providers competing in the supply of mobile services
to consumers:
2.30.1 MNOs own key mobile network infrastructure (such as spectrum, cell
towers, radio access and core network equipment) and supply mobile
services to wholesale and retail customers. The ability to offer coverage is
important due to the mobility of demand. An MNO can offer coverage by
building its own national network or by sharing capacity (either through
co-location or roaming). MNOs may launch sub-brands to target specific
segments of the retail market.
2.30.2 MVNOs are operators that provide mobile services to consumers but
generally do not own licensed radio spectrum or much of the
infrastructure required to provide mobile services. Instead, MVNOs rely on
buying wholesale services from an MNO. The amount of control an MVNO
has over the services it offers will vary according to the nature of its
agreement with its host MNO.
2.31 There are different types of MVNO operating models. These are typically described
as ranging from a licensed reseller, which is the minimalist form of MVNO, through
various intermediate models, to a ‘full’ MVNO (sometimes also referred to as
‘thick’). Under a full MVNO model, the MVNO invests in more of the key
components of a mobile network. The MVNO models offer the MNO the
opportunity to generate revenue from spare network capacity and to reach
customer segments where the MVNO may have better reach.
Mobile regulatory settings in New Zealand
2.32 There are two types of regulated telecommunications services in Schedule 1 of the
Telecommunications Act:
2.32.1 specified services, where the Commission can determine non-price terms;
and
2.32.2 designated services, where the Commission can determine price terms and
non-price terms.
2.33 We set the terms of access for the regulated services through a Standard Terms
Determination (STD).

29
3519307.1
2.34 Table 1 outlines the mobile services currently included in Schedule 1 of the
Telecommunications Act.
Table 1 Specified and designated mobile services in Schedule 111
Service Type Introduced Next Schedule 3
review due Subject to an
STD
National roaming Specified 19 December 2001 20 September 2023 No
Mobile termination access service (MTAS)
Designated 23 September 2010 23 September 2020 Yes
Mobile co-location Specified 19 December 2001 30 June 2021 Yes12
Local and mobile number portability
Designated 19 December 2001 30 June 2021 Yes
2.35 National roaming allows customers of one mobile network to use another network
when they are outside their own service provider’s coverage area.13
2.36 MTAS are the termination services a network operator needs to purchase to allow
its subscribers to communicate with the subscribers of another mobile network.14
2.37 Mobile co-location is a service that enables an MNO to install mobile network
transmission and reception equipment on the mast of another MNO.15
2.38 Local and mobile number portability allows customers to keep their number when
switching between service providers.16
11 These services, and the reasons why they are listed in Schedule 1 of the Telecommunications Act 2001, are
discussed further in Chapters 5 and 6. 12 The STD for mobile co-location was first introduced in 2008. 13 Commerce Commission “Final decision on consideration of deregulation of national roaming”, [2018]
NZCC 14, 4 September 2018. 14 Commerce Commission “Review of MTAS as a designated service” (23 September 2015). 15 Commerce Commission “Review of Designated and Specified Services under Schedule 1 of the
Telecommunications Act 2001” [2016] NZCC 13, (5 July 2016). 16 Commerce Commission “Review of Designated and Specified Services under Schedule 1 of the
Telecommunications Act 2001” [2016] NZCC 13, (5 July 2016).

30
3519307.1
2.39 In November 2018 a new Part 7 was also added to the Telecommunications Act,
which provides for the introduction of retail service quality obligations and powers,
including the ability for the Commission to review existing industry codes and
create codes of conduct that could apply to mobile services.
Changes to regulation
2.40 Schedule 3 of the Telecommunications Act sets out the process for altering
regulated services in Schedule 1 of the Telecommunications Act:
2.40.1 under clause 1(1) of Schedule 3, we can investigate whether to add a new
service to Schedule 1, amend an existing service in Schedule 1, or remove
a service from Schedule 1, if we are satisfied that there are reasonable
grounds for an investigation into the matter; and
2.40.2 under clause 1(3) of Schedule 3, we must consider, at no more than 5
yearly intervals from when a Schedule 1 service came into force, whether
there are reasonable grounds for commencing an investigation into
whether that service should be deregulated (by removing it from Schedule
1).

31
3519307.1
Chapter 3 Development of mobile services and
competition
Purpose and structure of this chapter
Purpose
3.1 This chapter looks at the development of competition in the supply of mobile
services in New Zealand. We focus on how competition has evolved, and whether
there are any factors which may have affected market dynamics in recent years.
Structure
3.2 This chapter sets out:
3.2.1 further analysis that we have undertaken as a result of new information
we have received since the Issues Paper;
3.2.2 our examination of a number of key indicators: market structure and
market shares, bundling of services, pricing, usage trends, investment,
profitability, quality of mobile services, and consumer satisfaction; and
3.2.3 the identification of a number of key issues which are in our view likely to
underpin the further development of competition in the mobile market
going forward. These are discussed in more detail in Chapter 4.
Updated analysis of mobile services
3.3 Since the Issues Paper we have further examined how the retail market for mobile
services has performed in New Zealand. This takes into account the following:
3.3.1 submissions received on the Issues Paper; and
3.3.2 new information that we have gathered since the publication of the Issues
Paper, including:
3.3.2.1 industry responses to our 2018 annual monitoring
questionnaire; and
3.3.2.2 updated price benchmarking results from Teligen.

32
3519307.1
3.4 There have also been other developments since we released our Issues Paper that
are relevant to the mobile services market in New Zealand. These include:
3.4.1 Dense Air’s acquisition of spectrum and its plans to use small-cell
technology to complement existing mobile coverage; and
3.4.2 Trustpower and Kogan’s announcements that they had signed MVNO
agreements with Spark and Vodafone respectively.
3.5 In the following, we review the key competition indicators that we used in the
Issues Paper in light of the information above. These indicators are relevant to how
the retail mobile market has performed in terms of delivering outcomes to mobile
consumers in New Zealand.
Market structure and market shares
3.6 Retail mobile services are predominantly supplied by the three MNOs, Spark,17
Vodafone,18 and 2degrees.19 In addition, several access-based MVNOs, Warehouse
Mobile, Vocus, and Compass, serve a small share of mobile subscribers.
3.7 Table 2 summarises the number of mobile subscribers in New Zealand as of June
2018, based on responses to our 2018 annual monitoring questionnaire.
Table 2 Mobile subscribers, 2018
Provider Subscribers %
Vodafone 2,591,092 40.5%
Spark (including Skinny) 2,423,532 37.9%
2degrees 1,313,497 20.5%
Total MNOs 6,328,121 98.9%
MVNOs (Warehouse Mobile, Vocus, Compass) 69,261 1.1%
Total 6,397,382 100.0%
Source: Responses to 2018 annual monitoring questionnaire
17 Spark New Zealand is a publicly traded company. 18 It was announced on 14 May 2019 that Vodafone New Zealand had been sold by Vodafone Group to
Infratil and Brookfield Asset Management. 19 Two Degrees’ parent company is Trilogy International Partners.
33
3519307.1
3.8 A number of parties have announced that they intend to enter the mobile market
in New Zealand as MVNOs:
3.8.1 Kogan Mobile has signed a commercial MVNO agreement with Vodafone,
and MyRepublic also intends to launch MVNO services in New Zealand;20
3.8.2 in November 2018, Trustpower announced that it had secured an MVNO
agreement with Spark. This will enable Trustpower to start offering mobile
and wireless broadband services.21 Trustpower, who also supplies retail
electricity, said it had nearly 400,000 customers in total, including 96,000
fixed-line telecommunications customers.22
3.9 In addition, towards the end of 2018, Dense Air acquired 70 MHz of spectrum in the
2.5 GHz band from Blue Reach and Cayman Wireless.23 Dense Air has informed us
that it intends to use the spectrum to offer network extension services to the
existing MNOs in New Zealand (similar to what it does in other countries), by using
small-cell technology at the edge of cells to enhance coverage. Dense Air’s entry is
more complementary to the existing MNOs, as Dense Air does not intend to
compete with existing mobile operators at either the retail or wholesale level.
3.10 We have updated market share information which includes 2018 data from our
latest annual monitoring questionnaire. As shown in Figure 3 , over the last 10
years:
3.10.1 2degrees initially rapidly increased its share of total mobile subscribers,
reaching 22% by 2013. Since 2013, 2degrees’ share of subscribers has
remained flat, with a small fall reported in 2018, to 21% (from 24% in
2017). As we noted in the 2018 Annual Monitoring Report, this was largely
a result of the closure of its 2G network in early 2018;24
3.10.2 Vodafone’s share of mobile subscribers has fallen steadily from around
53% in 2009 to 41% in 2018;
20 Issues Paper, paragraph 70. 21 Trustpower media release “Trustpower pleased to announce wireless broadband and mobile services on
the way for customers”, 20 November 2018. 22 Trustpower Annual Report 2019, page 38. 23 http://denseair.net/dense-air-acquires-2-6-ghz-spectrum-assets-in-new-zealand/ 24 Commerce Commission “Annual Telecommunications Monitoring Report 2018 Key Facts”, (18 December
2018), p 19.

34
3519307.1
3.10.3 Spark’s share of subscribers dropped from 46% in 2009 to 34% by 2013,
recovering in recent years as Spark’s Skinny brand, launched in early 2012,
expanded.
Figure 3 Mobile market shares – total subscribers
3.11 In the Issues Paper we indicated that competition in the supply of mobile services
had strengthened since the arrival of 2degrees in 2009. The retail market has
become less concentrated as 2degrees has gained market share, particularly in the
prepaid mobile services market segment but also more recently in the on-account
residential mobile services market segment.
3.12 The prepaid mobile services segment is relatively low value – based on responses
to our annual monitoring questionnaire, the average revenue per user (ARPU) for
prepaid customers was $12 per month in 2018, compared to ARPU for on account
subscribers of $43 per month.
3.13 The business segment has remained more concentrated, and this led the
Commission to undertake a study in 2015 to see whether there were any barriers
to expansion in this segment. The 2015 study identified a number of key factors
that business customers value when selecting a mobile provider. These include
reliable coverage, good customer service, competitive pricing, the ability to offer
bundles of services, and having an established reputation.
3.14 The 2015 study also found a perception among business customers that 2degrees
represented a lower cost, low quality brand with less coverage, although 2degrees’
own business customers reported the highest levels of satisfaction.

35
3519307.1
3.15 In revenue terms, 2degrees’ retail market share remained unchanged in 2018,
while Spark’s share increased slightly, and Vodafone’s share continued to drop.
2degrees’ on account residential mobile revenues have been increasingly
important, and this trend continued during 2018.
3.16 One factor influencing changes in market share is the level of porting activity.
Approximately five percent of New Zealand mobile subscribers port their number
each year. In the year to June 2018, a total of 301,762 mobile numbers were
ported.
Bundling
3.17 In the Issues Paper, we noted that bundling of multiple services can be beneficial
for consumers by offering convenience of single billing or by offering cheaper prices
when the services are purchased in a bundle than when purchased separately.
However, we also noted that potential competition concerns may arise if a service
provider offers bundles of services that its competitors cannot replicate.
3.18 In the case of bundles involving mobile services, such foreclosure concerns may be
mitigated by competition between the MNOs, unless an MNO offers a “must have”
service that the others cannot replicate. In addition, bundling can increase
consumer stickiness and customer acquisition costs which could potentially soften
competition.
3.19 Chorus, Vocus and Trustpower submitted that the ability of non-MNOs to compete
in retail markets may be constrained unless they are able to obtain wholesale
access to mobile services on reasonable terms.25 For example, according to
Trustpower:26
Fixed-line and mobile bundles appeal to high-value customer segments. Mobile and
fixed-line convergence (and increasingly substitution) are continuing to grow. This
creates the potential for MNOs to foreclose more valuable consumer segments from
fixed-line only providers. As Analysys Mason states:
“The anticipated increase in popularity of bundles in New Zealand’s telecoms
market, as well as the shift from prepaid to contract subscriptions, suggests that
customers will increasingly choose to purchase domestic telecoms (and family
member) bundles inclusive of mobile services. The convenience and savings offered
by fixed–mobile bundling means that operators which lack a mobile product will find
it much harder to attract high-value customer groups, regardless of the other
telecoms, TV or utility products offered in the bundle.”
25 Chorus submission on the Issues paper, (26 October 2018), para 16; Vocus submission on the Issues paper,
(26 October 2018), para 89-94; Trustpower submission on the Issues paper, (26 October 2018), p 15.
26 Trustpower submission on the Issues paper, (26 October 2018), para 3.5.2.

36
3519307.1
3.20 Trustpower submitted that this differs materially from bundling fixed-line and
electricity services, as the inputs required to supply these services are easily
accessible due to there being open wholesale markets with regulated access for
these services.
3.21 In the Issues Paper, we noted that consumers have benefitted from discounts by
bundling fixed and mobile services. For example, the three MNOs all offer
discounted prices for residential fixed broadband services if a qualifying mobile
subscription is also purchased.
3.22 However, we noted that the volume of fixed broadband subscriptions that
attracted such a discount accounted for less than 20% of the fixed broadband
services supplied by the MNOs. According to the responses to our 2018 annual
monitoring questionnaire, this proportion remains less than 20% although it has
been increasing.
3.23 The 2018 Consumer NZ survey results indicate that 73% of respondents do not
bundle their mobile service with other services.27 Of those who do purchase mobile
services as part of a bundle, the main services included with mobile are broadband
services and content.
3.24 The ability to bundle mobile connectivity with content was ranked relatively low by
respondents to Analysys Mason’s Connected Consumer Survey in New Zealand.
According to the 2018 survey results, the most important factors that influence
mobile consumers’ choice of a mobile plan include lower pricing of mobile services
(52%), data allowances (33%), value (24%), network coverage (16%), and data
speeds (15%).28 Bundling mobile with music was an influential factor for 8% of
respondents and bundling with video content was influential for 2%.
27 We note that the actual proportion of respondents who do not bundle may be higher than 73%. Some
Skinny respondents said they bought a mobile ‘bundle’ with broadband. However Skinny does not offer
bundles of mobile and broadband services. The respondents may be buying both mobile and broadband
services from Skinny, but it is not a ‘bundle’ in that the services are not tied or billed together.
28 Analysys Mason “Connected Consumer Survey 2018: mobile customer satisfaction in Australia and New
Zealand”, slide 11.

37
3519307.1
3.25 Spark appears to be moving away from offering discounts to customers who
purchase both fixed and mobile services from Spark. For example, Spark noted that
its new ‘Unplan’ broadband plan does not offer a bundled discount, and that it
expects the number of bundled discounts involving mobile to fall over time as
customers migrate to its new broadband plans. According to Spark,29
It is unclear whether bundling of mobile services may be a concern in the future. But
bundling can only be a concern where the bundle includes an element with market
power and there isn’t effective competition for the bundle, i.e. a fixed/mobile
bundle may compete against a fixed/electricity bundle. If anything, communications
markets are expected to be more competitive over time, leading us to conclude that
bundling of mobile services is unlikely at this time to represent a potential
competition problem.
3.26 Although Spark is moving away from such bundling, the other MNOs are continuing
to offer bundled discounts across fixed and mobile services, and the aggregate
number of discounted services has been gradually increasing. However, at this
stage, it appears that non-MNOs, such as Vocus and Trustpower, have been able to
offer, or expect to offer, similar bundles as the MNOs. For example:
3.26.1 Vocus supplies residential fixed broadband services at a discount where
the customer also purchases a mobile service from Vocus;30 and
3.26.2 in announcing its intention to offer mobile services, Trustpower said that
mobile is increasingly important to its customers, and that its wholesale
agreement with Spark will enable it to offer a wider range of bundles to its
customers.31
Pricing
3.27 In the Issues Paper, we referred to the benchmarking of mobile prices undertaken
by Teligen on behalf of the Organisation for Economic Cooperation and
Development (OECD), which we use in our annual monitoring reports.32 We also
referred to Analysys Mason’s claim that mobile ARPU had increased.33 We discuss
each of these below.
3.28 Mobile consumers typically purchase bundles of mobile services which provide a
monthly allowance of minutes, texts, and data. In order to examine how prices for
29 Spark submission on the Issues paper, (26 October 2018), para 46. 30 Slingshot website accessed May 2019 31 Trustpower media release “Trustpower pleased to announce wireless broadband and mobile services on
the way for customers”, (20 November 2018). 32 Commerce Commission: Study of mobile telecommunications markets in New Zealand – Issues Paper, 31
August 2018, paragraph 93. 33 Ibid., paragraph 95.
38
3519307.1
mobile services have moved over time and how prices in New Zealand compare to
other countries, Teligen’s benchmarking considers the cost of filling various usage
baskets. Teligen’s price benchmarking of mobile services is based on the two
largest MNOs in each country in the OECD and allows prices to be compared across
a range of usage baskets. Teligen updates its benchmarking three to four times
each year.
3.29 A number of submissions on the Issues Paper commented on the pricing of mobile
services in New Zealand:
3.29.1 2degrees: New Zealand has a small population and challenging
topography, making it relatively expensive to supply mobile services.
Despite this, since 2degrees entry, New Zealand’s ranking in terms of
mobile pricing has improved compared to other OECD countries.34
3.29.2 2degrees: benchmarking can overlook important differences. For example,
many Australian mobile plans are for fixed-term contracts; in New Zealand,
2degrees introduced open term plans and monthly repayment options for
handsets.35
3.29.3 Spark: referred to open term plans in New Zealand versus fixed-term
contracts in Australia, and that some of the Australian high usage plans
referred to in the Issues Paper included promotional bonus data
allowances and minimum 12-month contract terms.36
3.29.4 NERA: the OECD’s latest benchmarking (August 201837) shows New
Zealand prices below both the OECD average and Australia for low and
high usage baskets (including unlimited calls + 20GB, and unlimited calls +
unlimited data). NERA also said that it was important to consider price
trends over time, that prices per GB have been declining steeply in New
Zealand, and that the emergence of high usage plans (20GB and unlimited
data) and price reductions for these plans in recent years is consistent with
competition occurring as demand develops.38
3.29.5 Vodafone: new mobile plans introduced by the New Zealand MNOs in
2017 with high or unlimited data allowances have brought New Zealand
34 2degrees submission on the Issues paper, (October 2018), p 12. 35 2degrees submission on the Issues paper, (October 2018), p 12. 36 Spark submission on the Issues paper, (26 October 2018), para 27. 37 At the time of NERA’s submission, the latest Teligen/OECD benchmarking results were August 2018.
Teligen has since published November 2018 and February 2019 results. 38 NERA “Competition in the New Zealand Mobile Market”, (26 October 2018), para 38-40.

39
3519307.1
much more in line with other OECD countries. For example, Vodafone
submitted that New Zealand’s unlimited plans compare well to
comparable offers in Australia.39
3.29.6 Vocus: in the absence of disruptive offers from MVNOs, MNOs have little
incentive to compete down high prices of larger data plans, despite
increasing demand for data.40
3.29.7 Chorus: it is not clear why higher volume mobile bundles are expensive in
New Zealand compared to other countries. In New Zealand, there are
significant price differences between mobile broadband and fixed-wireless
services, suggesting cross-subsidisation and insufficient competition for
mobile.41
3.30 In the Issues Paper we referred to the increasing importance of mobile plans
offering higher volumes of data. As an example, the total number of residential on-
account subscribers purchasing bundles of voice, SMS, and data allowances of 3GB
or more increased from 133,000 subscribers in 2016, to 319,000 subscribers in
2017. This has continued to increase, to 497,000 subscribers in 2018.
3.31 To reflect the increasing importance of high usage plans, our 2018 Annual
Monitoring Report included a number of higher usage baskets (including unlimited
calls and 20GB) when comparing mobile prices in New Zealand and other countries.
In the Issues Paper we also included the unlimited calls and 20GB data basket when
comparing mobile pricing.
3.32 NERA’s submission claimed that the OECD’s August 2018 benchmarking shows that
New Zealand performs better than both the OECD average and Australia, including
for high usage baskets. However, we note that in Teligen’s initial results for its
August 2018 benchmarking, which was discussed by NERA in its submission, Teligen
had incorrectly reported a price for New Zealand based on a Skinny plan with a
data allowance that did not fill the 20GB basket.42 43 When corrected, New
Zealand’s price for that basket remained 23% higher than Australia, but below the
OECD average.
3.33 We note that Teligen no longer considers New Zealand’s ‘unlimited data’ plans
(where speed is throttled once a threshold of 22GB has been reached) to qualify as
39 Vodafone submission on the Issues paper, (26 October 2018), p 29. 40 Vocus submission on the Issues paper, (26 October 2018), para 96. 41 Chorus submission on the Issues Paper, (26 October 2018), page 7. 42 Spark (NERA: Competition in the NZ mobile market) submission on the Issues Paper, (26 October 2018),
page 14. 43 The plan was Skinny’s $46 Combo, which has 12GB data.

40
3519307.1
unlimited data plans, and so New Zealand no longer appears in the Teligen results
for that basket.
3.34 Table 3 shows the February 2019 results for the baskets that we used in the 2018
Annual Monitoring Report. For comparison, the figures in brackets are the August
2018 results reported in our 2018 Annual Monitoring Report.
Table 3 Latest Teligen benchmarking results, Feb 2019
Feb 2019 price, NZD PPP
(Aug 2018) NZ % price var. from
Mobile phone
services basket
NZ rank in
OECD NZ Aust.
OECD
Average Aust. OECD Average
30 calls + 500MB 10/37
(8/36)
17
(16)
13
(22)
25
(26) 28% -33%
100 calls + 2GB 18/37
(15/36)
28
(28)
13
(22)
37
(41) 114% -26%
300 calls + 5GB 20/37
(17/36)
48
(45)
13
(34)
50
(56) 268% -6%
unlimited calls +
20GB
20/32
(16/31)
72
(65)
26
(53)
95
(109) 177% -25%
Source: based on Teligen benchmarking results, Feb 2019
3.35 The results shown in Table 3 indicate that mobile prices in New Zealand are
relatively high for the larger usage baskets when compared to Australia but are
below the average for the OECD. In fact, New Zealand’s ranking appears to have
slightly deteriorated since the August 2018 results (used in our 2018 Annual
Monitoring Report). For example, in the unlimited calls + 20GB basket, the August
2018 results reported New Zealand as 16th most expensive out of 31 countries; in
the February 2019 results, New Zealand’s rank had fallen to 20/32 countries.
3.36 The reason for this appears to be the withdrawal by Skinny of its sub-brand (‘Skinny
Direct’) in respect of new customers towards the end of 2018. Skinny Direct’s retail
plans were the cheapest plans in New Zealand for some of the higher usage baskets
used by Teligen. For example, for the unlimited calls + 20GB basket, the cheapest
plan in New Zealand had been Skinny Direct’s 25GB plan (NZ$65 per month), which
appeared in Teligen’s benchmarking results in May and August 2018.
3.37 In Teligen’s February 2019 benchmarking, Skinny Direct’s plans no longer appear, with the cheapest plan in New Zealand now Skinny’s NZ$66 plan (per 4 weeks), which is equivalent to NZ$71.50 per month. While below the OECD average for this basket (NZ$95), this remains significantly higher than the price in Australia (NZ$26), as shown in Table 3.

41
3519307.1
3.38 Although the New Zealand prices for the higher usage baskets shown in Table 3 are
relatively high compared to Australia, it should be noted that the New Zealand
plans reported by Teligen provide more data than is required to fill the Teligen
baskets. For example, in the unlimited calls + 20GB basket, Skinny’s plan provides
for 33GB of data each month (the Australian plan reported by Teligen for this
basket provides for 20GB of data).
3.39 We have also compared specific retail mobile plans available in New Zealand and
Australia. The New Zealand MNOs typically do not offer fixed-term contracts to
residential customers, with retail plans available on a pay-monthly basis. In
Australia, the MNOs now offer both pay-monthly mobile plans as well as 12-month
contract plans. Although the pay-monthly plans offer more flexibility for the
customer in terms of the ability to switch, the contract plans tend to offer higher
data allowances.
3.40 Table 4 summarises the highest data plans available for each MNO in Australia and
New Zealand.44 In terms of the pay-monthly plans, the value offered by the New
Zealand MNOs appears to be similar to the plans available in Australia. For a
number of the New Zealand plans, the price per GB reduces further than shown in
Table 4 when additional subscribers are added to the plan.45 The contract plans in
Australia offer considerably higher value for customers who are prepared to sign up
for a 12-month term.
44 Prices of the Australian plans are converted to NZ$ using PPP rates derived from the Teligen benchmarking
(Feb 2019). 45 For example, the 2degrees plan allows for up to 4 people, each paying $40 per month for up to 40GB.

42
3519307.1
Table 4 Mobile prices (price per GB)
Pay monthly Optus Vodafone
Australia 2degrees Skinny Spark Vodafone
Price (NZ$) $77 $62 $85 $83 $80 $80
Data (GB) 40 20 40 43 22 22
Price per GB $1.93 $3.09 $2.13 $1.93 $3.64 $3.64
National calls
and SMS unlimited unlimited
unlimited
(incl to
Aust)
unlimited
unlimited
(incl to
Aust)
unlimited
(incl to
Aust)
12-month
contract Optus
Vodafone
Australia Telstra
Price (NZ$) $52 $82 $92
Data (GB) 80 150 90
Price per GB $0.64 $0.55 $1.02
Source: operator websites, accessed May 2019. Prices are for highest data plans offered by
each MNO in Australia and New Zealand
3.41 We note that the various plans shown in Table 4 have different inclusions. For
example, some of the New Zealand plans include subscriptions to content (such as
Netflix and Spotify), while the Australian plans often include services such as
picture messaging, international calls, and in some cases international roaming.
3.42 It appears that the pricing of pay-monthly mobile bundles in New Zealand is similar
to pay-monthly bundles in Australia. However, when compared to contract plans
available in Australia, New Zealand prices remain relatively expensive.
3.43 Spark submitted that New Zealand mobile network operators have moved away
from fixed-term contract plans following feedback from consumers and the
Commission.46 Our concerns with contracts were with the one-sided nature of the
conditions and unfair penalties for termination that existed in contracts at the time.
Unfair contract terms can apply to any kind of contract, whether fixed or open
term.
3.44 The use of fixed-term contracts per se is not necessarily problematic. As noted
above, consumers in Australia have the choice of fixed term contracts and pay-
46 Spark submission on the Issues paper, (26 October 2018), para 27b. Spark has since clarified that they
were referring to our comments on the management of fixed term contracts, particularly the actions we
have taken against parties who have included unfair contract terms within a fixed term contract structure.

43
3519307.1
monthly plans. Consumers who are prepared to sign up for a 12-month term
receive considerably higher value compared to the pay-monthly plans.
3.45 In the Consumer NZ survey, respondents were asked what is the one thing that
their mobile service provider could do to increase overall satisfaction. Having an
‘open term’ plan was the least important feature, with better pricing, cheaper data,
and better service quality being the most important. This suggests that consumers
would be willing to enter fixed term contracts in order to get better value.
3.46 A number of submissions on the Issues Paper responded to Analysys Mason’s
observation that mobile ARPU has been increasing in New Zealand in recent years.
NERA claimed that the Analysys Mason result appears to have been driven by an
anomaly in the Global System for Mobile Communication Association (GSMA) data
reported for Vodafone.47
3.47 Vodafone submitted that the GSMA data includes fixed and mobile revenues, which
spiked in 2013 as a result of Vodafone’s acquisition of TelstraClear (which included
high value fixed-line enterprise customers). Vodafone also submitted that the
GSMA data for 2016 contained an error. Vodafone referred to the revenue and
subscriber data supplied to the Commission as part of the annual monitoring
questionnaire, which shows ARPU declining since 2010.48
3.48 Figure 4 summarises the estimated mobile ARPU based on the responses to our
annual monitoring questionnaires. This indicates that mobile ARPU in New Zealand
has been flat (or showing a slight decline if handset revenues are excluded, as
shown by the dotted line).
3.49 The increase in ARPU in 2012/13 appears to have been driven by an increase in
Spark’s ARPU, which in turn was related to the closure of its CDMA network. As we
have previously noted, the closure of the CDMA network in 2012 resulted in a
reduction in the number of Spark’s subscribers.49 Spark reported that the loss of
lower value prepaid subscribers resulted in an increase in its mobile ARPU in
2013.50
47 NERA “Competition in the New Zealand Mobile Market”, (26 October 2018), paragraph 54. 48 Vodafone submission on the Issues paper, (26 October 2018), p 6-7. 49 Commerce Commission “Annual Telecommunications Monitoring Report 2013”, (21 May 2014), p 23, 24. 50 Spark Annual Report 2013, page 53.

44
3519307.1
Figure 4 Mobile ARPU, 2008-2018
3.50 As noted in the Issues Paper (and the following section), the average monthly volume of mobile-originated calling minutes per mobile subscriber has been increasing over this period, as has the average volume of mobile data per mobile subscriber.
3.51 These ARPU and usage trends are consistent with falling prices for mobile services over time.
3.52 Chorus submitted that there appear to be significant differences in prices per GB
between mobile broadband and fixed-wireless services. Chorus submitted that this
may reflect insufficient competition for mobile services, which may be cross-
subsidising fixed wireless services.51 However, we note that fixed-wireless services
are location-specific, providing connectivity to consumers at fixed locations.
3.53 As a result, the capacity required to support such services can more easily be
directed to those fixed locations. In contrast, for mobile broadband services,
demand is mobile as consumers are likely to be moving around, including between
cell-sites. This mobility of demand makes mobile services more challenging to
deliver in terms of network management.
51 Chorus submission on the Issues paper, (26 October 2018), p 7.

45
3519307.1
Usage trends
3.54 Responses to our 2018 annual monitoring questionnaire show that mobile voice
minutes continued to grow during 2018, both in aggregate and on a per-subscriber
basis. SMS volumes continued to decline as consumers increasingly favour OTT-
based messaging services. This is particularly evident from Analysys Mason’s
Connected Consumer Survey 2018, which found the following:52
3.54.1 81% of smartphone users in New Zealand use OTT communication and
social media services, with penetration particularly high in younger age
cohorts (94%-95% among users aged below 34); and
3.54.2 messaging services were the most common OTT service used by
respondents.
3.55 In our 2018 Annual Monitoring Report, we noted that the volume of data used by
mobile consumers continued to grow strongly in 2018, with the average volume of
mobile data per connection reaching 2GB per month in 2018 (up from 1.2 GB).
According to Consumer NZ’s survey of mobile consumers, 82% of respondents used
mobile broadband in 2018, up from 77% in 2017.53
3.56 Submissions on the Issues Paper were generally unanimous that there has been
strong growth in demand for mobile data, and that this was expected to continue.
Chorus noted that growth in demand for mobile data could be tempered to the
extent that prices for mobile data in New Zealand are high.54
3.57 2degrees submitted that voice and SMS traffic were likely to decline, as calls and
messaging services become increasingly data-based. This will contribute to demand
for larger data allowances, putting pressure on network capacity and the need for
more spectrum.55
3.58 Vodafone and Spark also noted that there must be sufficient spectrum made
available to meet the expected growth in mobile data.56
52 Analysys Mason “Connected Consumer Survey 2018: OTT communication services in Australia and New
Zealand”, slides 7, 10. 53 Consumer NZ: Telco Consumer Survey 2019.
54 Chorus submission on the Issues paper, (26 October 2018), p 7. 55 2degrees submission on the Issues paper, (October 2018), p 14. 56 Vodafone submission on the Issues paper. (26 October 2018), p 29; Spark submission on the Issues paper,
(26 October 2018), p 40.

46
3519307.1
3.59 Although the average amount of mobile data per connection has been increasing
strongly in New Zealand, New Zealand’s average appears to be relatively low
compared to other OECD countries, as shown in Figure 5. This may reflect the
relatively high prices for larger bundles of mobile voice and data in New Zealand.
Figure 5 Average mobile data per mobile subscription (December 2017) 57
Investment
3.60 In the Issues Paper we referred to the MNOs continuing investment in their mobile
networks. This was both in terms of network upgrades and expansion of coverage,
with the Government also contributing to the expansion of infrastructure in rural
areas through the Rural Broadband Initiative (RBI) and Mobile Black Spot Fund
(MBSF).
3.61 NERA submitted that despite rapid growth in mobile and fixed-wireless data usage,
Spark’s mobile users have experienced increased quality (in terms of speed, packet
loss, round trip time). This indicates that Spark has continued to invest in capacity
ahead of demand.58
3.62 2degrees referred to the investment that it had undertaken to date in product and
network deployment, and that it must continue to invest further, including at the
wholesale level.59 The MNOs submitted that competition between MNOs has
57 Commerce Commission generated chart based on OECD (2017) data at
http://www.oecd.org/sti/broadband/broadband-statistics/ Source: OECD, Broadband Portal,
www.oecd.org/sti/broadband/oecdbroadbandportal.htm 58 NERA “Competition in the New Zealand Mobile Market”, (26 October 2018), para 74-84. 59 2degrees submission on the Issues paper, (26 October 2018), p 7.

47
3519307.1
resulted in increased investment at the network, technology, and services level, as
well as in customer service quality.60
3.63 We have updated the data on investment in mobile access made by each of the
MNOs, as reported in responses to our annual monitoring questionnaire. This is
shown in Figure 6. Each MNO has in most years invested up to $100 million per
annum in their mobile networks. The investment peaks appear to relate to
Telecom’s investment in its new W-CDMA network in 2009, and investment by the
three MNOs in 700 MHz spectrum in 2015.61 62
Figure 6 Investment in mobile access, by MNO
3.64 A number of submissions argued that regulatory uncertainty can impact the ability
to fund much-needed new capacity, and that mobile operators are facing
investment in 5G technology at a time when mobile revenues are flat, and
profitability is constrained.63 2degrees also submitted that issues such as the
reserve prices and payment terms for new spectrum will influence investment in
network deployment.64
60 Ibid, at p7; Vodafone submission on the Issues paper, (26 October 2018), p 3. 61 Telecom’s Annual Report 2009 refers to capital expenditure during 2009 of $300M on its new XT mobile
network. 62 The results of the 700 MHz auction were announced in June 2014, with Spark acquiring 2x20MHz for
$158M; Vodafone acquiring 2x15MHz for $68M; and 2degrees acquiring 2x10MHz for $44M; MBIE “700
MHz auction: notice of provisional results” (19 June 2014). 63 Spark submission, on the Issues paper (26 October 2018), p 2; 2degrees submission on the Issues paper,
(26 October 2018), p 24. 64 2degrees submission on the Issues paper, (26 October 2018), p 5.

48
3519307.1
Profitability
3.65 Several submissions on the Issues Paper referred to profitability. For example,
NERA included the following diagram, and observed that “New Zealand has an
EBITDA65 margin which is consistently under the world average and this gap is
increasing over time.”66
Figure 7 EBITDA margin over time
3.66 The NERA submission was not explicit on whether the EBITDA margins reflect pure
mobile operations, or mobile operations that are integrated with fixed-line
operations. Spark has subsequently informed us that the Merrill Lynch EBITDA data
shown in Figure 7 above is based on Merrill Lynch estimates of margins for mobile
operations, where segmented results for fixed and mobile operations are not
separately reported.
3.67 However, it is not clear how Merrill Lynch has derived the segmented mobile
margins, and whether its estimates take into account the structure of the New
Zealand telecommunications sector.67 While the EBITDA margins shown above may
65 Earnings Before Interest, Tax, Depreciation and Amortisation 66 NERA “Competition in the New Zealand Mobile Market”, (26 October 2018), para 61. 67 For example, with structural separation of the fixed-line broadband networks in New Zealand, Spark and
Vodafone purchase wholesale fixed broadband services from Chorus and the other LFCs. This may result in
higher operating expenditure (and lower capital expenditure) for Spark and Vodafone, compared to the
other developed markets shown in Figure 7.

49
3519307.1
be consistent with a competitive mobile market, the lack of transparency has
limited the weight we have placed on the Merrill Lynch results at this stage.
3.68 The EBITDA margins shown in Figure 7 above for New Zealand appear to relate to
Vodafone and Spark only and sit at around 35%. The EBITDA and revenues reported
by Trilogy for 2degrees over the last three years is summarised in Table 5. This
indicates an EBITDA margin of 14% in 2015, increasing slightly to 16% in 2016,
2017, and 2018.
Table 5 2degrees EBITDA, revenues, and EBITDA margins68
Year ended 31 December
2015 2016 2017 2018
Revenues (US$’000) $ 393,055 $ 487,337 $ 517,952 $ 556,400
EBITDA (US$’000) $ 55,455 $ 79,291 $ 83,217 $ 90,400
EBITDA margin 14% 16% 16% 16%
EBIT (US$’000) $3,022 $ 19,855 $ 22,412 $24,200
Source: Trilogy International Partners Consolidated Financial Statements as of December 31
2017 and 2016
3.69 The EBITDA margin for 2degrees (16%) appears to be considerably lower than the
EBITDA margins shown in Figure 7 for the two larger MNOs in New Zealand. This is
likely to reflect differences in scale between the three MNOs.69 It may also partly
reflect 2degrees’ higher mix of prepaid subscribers.70
68 http://www.trilogy-international.com/Doc/Index?did=43976718 69 This is consistent with the findings of McKinsey that profitability of MNOs correlates strongly with market
share. See McKinsey “Middle East and Africa: Telecommunications industry at cliff’s edge”, (2016), Exhibit
14. 70 As noted above, there may be an issue with the segmentation of the fixed and mobile operations of Spark
and Vodafone.

50
3519307.1
Quality of mobile services
3.70 The Issues Paper noted that the quality of mobile services has several dimensions,
including network coverage, mobile broadband speeds, service availability, and
customer service. In terms of New Zealand’s performance on these, we made the
following observations:
3.70.1 network coverage: all MNOs offer mobile services to more than 97% of
population (4G to 95%);
3.70.2 mobile broadband speeds: speeds were increasing with the deployment of
4G LTE. OpenSignal reported New Zealand’s 4G download connection
speed of 33 Mbps, which was 8th fastest out of 88 countries;71
3.70.3 availability: 3G or 4G availability in New Zealand ranks well, with
OpenSignal ranking New Zealand 6th out of 95 countries.72 However, New
Zealand’s ranking in terms of availability of 4G services is lower (65th out
of 88 countries);73 and
3.70.4 customer service: Consumer NZ’s mobile consumer survey found that the
larger MNOs perform relatively poorly when compared to 2degrees and
Skinny in terms of customer service waiting times and overall customer
satisfaction.
3.71 A number of parties submitted on the issue of service quality. According to
2degrees, mobile service quality has a number of dimensions, including those we
identified in the Issues Paper. 2degrees supported the monitoring of retail service
quality as long as it avoids unnecessary costs and allows for meaningful
comparisons between operators. 2degrees also noted that monitoring mobile
performance is more complex than fixed-line services due to the greater sharing of
resources.74
71 OpenSignal is a company that specialises in tracking mobile network performance from the consumer’s
perspective. 72 OpenSignal defines ‘availability’ as the percentage of time that users can connect to the service. This
differs from population or geographic coverage, both of which omit the time dimension. 73 As discussed later, Dense Air intends to use recently acquired spectrum to enhance the coverage of
mobile services in New Zealand. 74 2degrees submission on the Issues paper, (26 October 2018), p 14-15.

51
3519307.1
3.72 On behalf of Spark, NERA submitted that although the roll-out of 4G started later in
New Zealand compared to Canada, the US, UK, and Australia, New Zealand’s 4G
coverage expanded quickly to reach levels similar to these countries.75
3.73 Spark and Vodafone both referred to New Zealand ranking 2nd highest in the GSMA
Global Mobile Connectivity Index (GMCI).76 The GMCI is comprised of 4 equally
weighted sub-indices, measuring:
3.73.1 mobile infrastructure (including mobile coverage, speeds, spectrum);
3.73.2 affordability of mobile services (mobile tariffs as a % of GDP per capita);
3.73.3 ‘consumer readiness’ (literacy, educational enrolment etc); and
3.73.4 content. (movies, music, games and sports)
3.74 Vodafone noted that New Zealand ranked 5th best in terms of infrastructure, 7th in
terms of affordability and 10th in terms of network performance.77
3.75 Vodafone argued that quality metrics should focus on the experience of consumers
rather than arbitrary measures of technology used (such as the Commission’s focus
on 4G availability). Vodafone submitted that the New Zealand mobile networks
perform well and that fixed line services are more problematic in terms of
complaints than mobile.78
3.76 In our view the measures relating to availability relate very much to the experience
of consumers. If a service is not available, it compromises the consumer
experience. The availability metrics referred to in the Issues Paper provide an
additional measure of service quality to coverage and speed. However, we agree
that availability alone does not provide a full view of quality.
3.77 Although New Zealand’s mobile networks generally appear to perform well in
terms of most measures of quality, New Zealand’s performance in terms of 4G
availability (measuring the proportion of time that end users can connect to 4G
services) ranks relatively poorly.
3.78 As noted by NERA, New Zealand initially lagged behind other countries on 4G
coverage, although currently it is broadly comparable. For example, in Australia
75 NERA “Competition in the New Zealand Mobile Market”, (26 October 2018), para 69-71. 76 Spark submission, 26 October 2018, paragraph 52; Vodafone submission, (26 October 2018), p 3. 77 Vodafone submission on the Issues paper, (26 October 2018), p 4. 78 Vodafone submission on the Issues paper, (26 October 2018), p 30.

52
3519307.1
Telstra and Optus report current 4G coverage of 99% and 97% respectively, which
is slightly higher than the 96%-98% reported by the New Zealand MNOs.79
Consumer satisfaction
3.79 The consumer experience with mobile services is mixed. As shown in Figure 8,
consumers experience fewer problems with mobile telecommunications than with
fixed-line telecommunications but experience more problems with mobile services
than utilities or banking services.
Figure 8 Purchasing experiences in the past two years by product or service category
3.80 While fixed-line telecommunications create more complaints than mobile services,
many issues are industry wide (eg, billing, contracts, and sales tactics).80
79 Telstra Annual Report 2018, page 9; and https://www.optus.com.au/shop/mobile/network 80 Complaints made to the Commerce Commission.

53
3519307.1
3.81 Satisfaction levels with mobile services are above fixed-line telecommunications
services and energy retailers but below banks (see Table 6).
Table 6 Consumer satisfaction by sector81
Industry Overall Satisfaction with Suppliers
Largest Supplier
Best Supplier Worst Supplier Industry Average
Retail - home tech 65% 85% 54% 68% Retail - mobile handsets
59% 83% 54% 62%
Banking 54% 87% 54% 60%
Mobile 51% 77% 51% 56% Fixed-line telecommunications
49% 68% 43% 51%
Energy 49% 68% 38% 51% Source: Derived from Consumer NZ (Mobile 2019, Fixed-line telecommunications 2019, Banking 2019,
Retail 2018, Energy 2018).82
3.82 However, the 2016 Ministry of Business Innovation and Employment (MBIE)
National Consumer Survey found that that mobile companies are viewed as less
trustworthy than utility companies, banks and fixed-line telecommunication
companies.83
81 Red numbers show the lowest industry in each satisfaction category, green numbers the highest. % is the
percentage of respondents who said they were very satisfied with their service provider.
82 Results for the banking, energy and telco sectors are from Consumer NZ’s nationally representative
surveys of the New Zealand population; results for the retail home tech and mobile handset categories are
from Consumer NZ member surveys
83 MBIE “National Consumer Survey 2016: Summary Findings”, (April 2017), Figure 20.
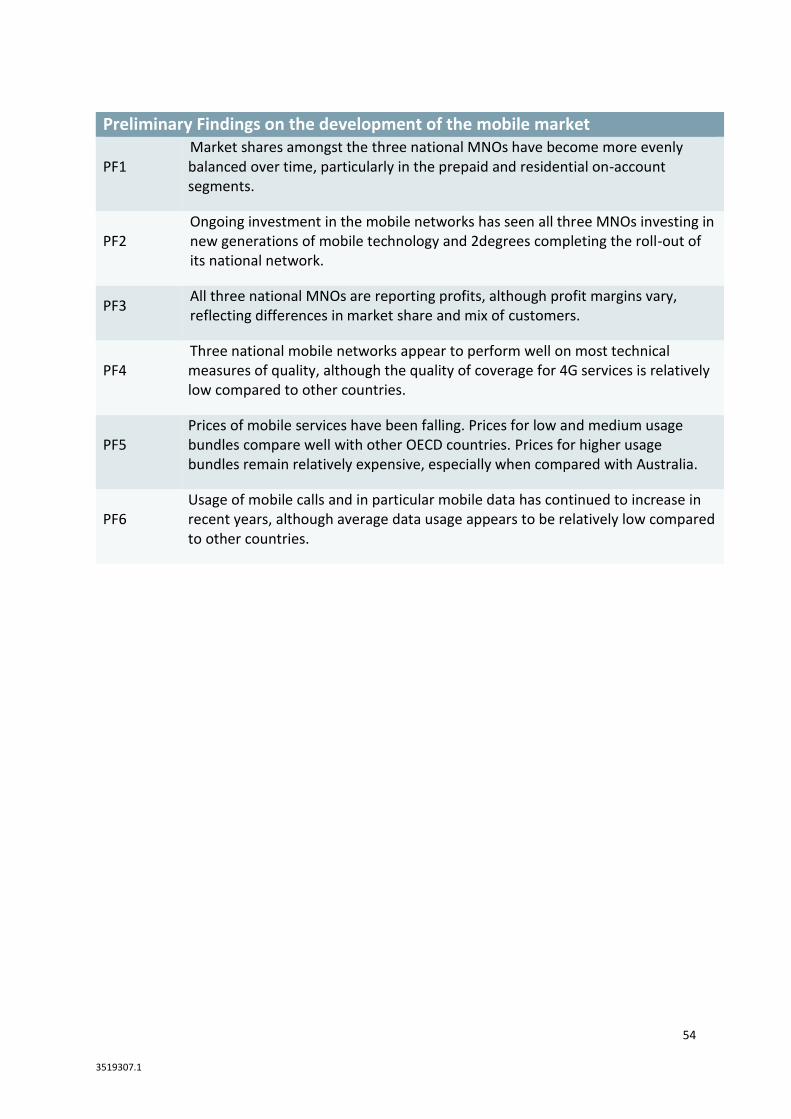
54
3519307.1
Preliminary Findings on the development of the mobile market
PF1 Market shares amongst the three national MNOs have become more evenly balanced over time, particularly in the prepaid and residential on-account segments.
PF2 Ongoing investment in the mobile networks has seen all three MNOs investing in new generations of mobile technology and 2degrees completing the roll-out of its national network.
PF3 All three national MNOs are reporting profits, although profit margins vary, reflecting differences in market share and mix of customers.
PF4 Three national mobile networks appear to perform well on most technical measures of quality, although the quality of coverage for 4G services is relatively low compared to other countries.
PF5 Prices of mobile services have been falling. Prices for low and medium usage bundles compare well with other OECD countries. Prices for higher usage bundles remain relatively expensive, especially when compared with Australia.
PF6 Usage of mobile calls and in particular mobile data has continued to increase in recent years, although average data usage appears to be relatively low compared to other countries.

55
3519307.1
Our views on the key issues in the mobile market
3.83 As discussed in the above sections, competition in the mobile market has been
developing to the point where there are now three national MNOs, as well as a
small number of MVNOs. The performance of the mobile market has generally
improved in terms of delivering competitive outcomes to consumers, through
lower prices, increasing quality, and greater choice of services.
3.84 Based on the above, as well as information provided in submissions on the Issues
Paper, we have identified three key issues which are likely to influence the further
development of competition in the mobile market going forward. These issues
relate to spectrum, MVNOs, and consumer engagement. Together these will
potentially have a significant influence on conditions for competition in the mobile
market.
3.85 We briefly discuss the importance of each of these issues below, before turning to
each of them in more detail in Chapter 4.
Spectrum
3.86 Radio spectrum is a critical input used in the deployment of a mobile network. The
type and amount of spectrum held by the MNOs will affect the way in which they
deploy their networks, and the capacity and services they can offer to retail and
wholesale customers.
3.87 The three MNOs currently have asymmetric holdings of spectrum, particularly in
the sub-1 GHz bands and in some of the higher frequency bands. 2degrees
submitted that it holds 18.5% of key mobile spectrum, compared to 40% held by
Spark and 30% held by Vodafone.84
3.88 According to 2degrees, it has been able to compete and expand since its entry,
although its ability to continue to do so will depend on acquiring sufficient new
spectrum, particularly due to the rapid increase in demand for mobile data.
Vodafone and Spark also referred to the importance of adequate spectrum being
released in the 3.5 GHz band to support the development of 5G networks.
84 The balance of 11% was held by Blue Reach at the time of 2degrees’ submission.

56
3519307.1
3.89 We note that 2degrees has now largely completed the roll-out of its national
network, for which it has incurred significant fixed and sunk costs. As long as each
of the MNOs has sufficient capacity, which will be influenced by their spectrum
holdings, they are likely to face strong incentives to compete at both the retail and
the wholesale level.
3.90 In our view, the allocation of spectrum will continue to have a very important
influence on competitive conditions in downstream markets, including the mobile
market, and on how competition evolves in the future.85
MVNOs
3.91 In the Issues Paper, we noted that we were interested to better understand why
the share of the mobile market served by MVNOs in New Zealand appeared to be
relatively small compared to other countries. We sought views on whether
competitive conditions at the wholesale level had changed as a result of 2degrees
having completed its national network, and how wholesale competition was
expected to evolve over the next two-three years.
3.92 In response, a number of parties provided extensive submissions on competitive
conditions at the wholesale level. Several submissions noted that MVNOs have
brought a range of benefits in other countries, such as greater variety of mobile
services, price competition, and increased options for bundling of mobile services
with other services which in turn may be of growing importance for the
effectiveness of competition in telecommunications markets.
3.93 Submissions from Spark, Vodafone and 2degrees generally claimed that they were
increasingly competing to attract MVNO business, pointing to the entry of
Warehouse Mobile as well as anticipated new entry by Trustpower and Kogan
Mobile.
3.94 For such MVNO-based competitors, the availability of MVNO access on reasonable
terms will influence their ability to expand and evolve in retail markets. Until
recently, there appears to have been limited competition between MNOs to host
MVNOs, and this may have resulted in commercial MVNO agreements which have
not been conducive to MVNO expansion.
85 The importance of competition objectives for spectrum allocation has been recognised in many overseas
jurisdictions. See for example, BEREC “BEREC report on practices on spectrum authorization, award
procedures and coverage obligations with a view to considering their suitability to 5G”, (6 December
2018); ACCC “Allocation limits advice for the 3.6 GHz spectrum allocation”, (July 2018).

57
3519307.1
3.95 However, there has been some evidence provided in submissions and elsewhere
that the level of wholesale activity has been increasing in recent years.
3.96 We are therefore interested in examining why MVNO entry into the mobile market
in New Zealand has been limited to date. That is, if and why MVNO-based
competition matters for the development of the mobile market and how this may
evolve in the future.
Consumer engagement
3.97 In the Issues Paper, we discussed why the level of engagement by consumers is an
important source of competitive pressure on suppliers of mobile services. We were
interested in better understanding the nature and effectiveness of consumer
engagement in the mobile market, and whether consumers faced any issues in
comparing and switching between retail mobile offers.
3.98 Although submissions on the Issues Paper did not reveal significant issues for
consumer engagement in the mobile market, we remain of the view that it is
important to better understand the extent to which mobile consumers are engaged
and active, and what is important to consumers when choosing a mobile service
provider.
3.99 The ability of different consumers to review their needs and to periodically
compare and switch between retail mobile offers will affect expansion conditions
within the mobile market and the incentives for mobile providers to compete. The
ability of a mobile service provider to enter and expand in market segments will
affect its competitive position. This is because the number and the mix of
customers are likely to influence a mobile provider’s costs, profitability, and its
ability to continue to invest in its network.
58
3519307.1
Chapter 4 Key issues identified by the Commission
Purpose and structure of this chapter
4.1 In our view, there are three key issues which may influence the performance of the
mobile market in delivering competitive outcomes for mobile consumers in New
Zealand:
4.1.1 spectrum;
4.1.2 MVNO access; and
4.1.3 mobile consumer engagement.
4.2 This chapter sets out our more detailed exploration of these three key issues,
discussing them and presenting our preliminary findings and proposed actions.
Spectrum
Introduction
4.3 This section sets out our analysis and preliminary findings on radio spectrum
allocation through;
4.3.1 a summary of what we said on spectrum in the Issues Paper;
4.3.2 the further analysis that we have undertaken in light of submissions on the
Issues Paper;
4.3.3 examining the developments that have occurred since the Issues Paper.
These include Cabinet decisions on the renewal of 1800/2100 MHz
spectrum and on 5G spectrum, and the acquisition of spectrum by Dense
Air; and
4.3.4 a summary of our preliminary views on spectrum.

59
3519307.1
What we said in the Issues Paper
4.4 In the Issues Paper we noted that radio spectrum is a critical input used in the
deployment of a mobile network. The type and amount of spectrum that is
allocated to MNOs will affect the way in which they deploy their networks and the
services that can be offered.86 We summarised the existing spectrum holdings in
Figure 9.
Figure 9 Spectrum holdings
4.5 We noted that the asymmetries in existing spectrum holdings between the MNOs
varies across spectrum bands. For example:87
4.5.1 in the sub 1 GHz bands, Spark holds a total of 70 MHz spectrum (700
MHz/850 MHz), Vodafone holds a total of 60 MHz spectrum (700 MHz/900
MHz), and 2degrees holds a total of 40 MHz spectrum (700 MHz/900MHz);
4.5.2 in the 1800 MHz band, each of the MNOs owns 50 MHz spectrum; and
4.5.3 in the 2100 MHz band, Spark and 2degrees each own 30 MHz, while
Vodafone owns 50 MHz.
86 Study of mobile telecommunications markets in New Zealand - Issues Paper – (31 August 2017), para 137-
138.
87 Ibid, at para 139.

60
3519307.1
4.6 We also noted that although 2degrees holds a smaller block of sub-1 GHz spectrum,
its parent had stated that it held enough spectrum to be able to compete to date
with the other MNOs.88
4.7 We said that the Commission would examine the competition implications of
spectrum acquisitions through the clearance regime in the Commerce Act.
Concerns around future acquisition of spectrum could be considered under the
clearance regime, as well as through the potential use of spectrum caps in future
spectrum allocations.89
4.8 We referred to MBIE’s Radio Spectrum Management (RSM) team and their process
relating to the allocation of key spectrum bands for 5G in 2019. We noted that
RSM’s initial priority is the 3.5 GHz band, expected to be allocated prior to 2020,
followed by the 26 GHz band.90
4.9 We said it would be useful to understand the likely entry and expansion costs for a
fourth MNO, and whether a fourth MNO is viable given the small size of the New
Zealand mobile market.
Further analysis of spectrum
Submissions on the Issues Paper
4.10 In its submission, 2degrees argued that it has significantly less spectrum than the
other MNOs, and that while it has been able to compete to date, lower spectrum
holdings limit network capacity, raise the costs of supplying customers, and create
uncertainty for potential MVNO customers.
4.11 2degrees submitted that redistributing existing spectrum holdings (in particular,
2100 MHz spectrum) would improve competitive outcomes in the long-term, and
that 3.5 GHz spectrum should also be distributed equally. 2degrees said that for the
3.5 GHz spectrum allocation, an ideal allocation would be 100 MHz for each MNO,
or 80 MHz if less spectrum is available in aggregate.91
88 Trilogy International Partners “Annual Information Form for the Year Ended December 31, 2017” (21
March 2018), p 16. 89 Study of mobile telecommunications markets in New Zealand - Issues Paper – (31 August 2017), para 143. 90 Ibid, at para 220, 221. 91 2degrees submission on the Issues paper, (26 October 2018), p 22-23.

61
3519307.1
4.12 2degrees also referred to the need for sufficient spectrum to launch fixed wireless access (FWA) services in order to minimise disruption to mobile customers.92 2degrees advocated that the existing spectrum disparities between the three MNOs should be reduced.93
4.13 On behalf of 2degrees, Covec submitted that 2degrees’ low spectrum holdings
relative to the other MNOs may constrain its ability to compete at both the retail
and wholesale levels going forward. Covec argued that it would be challenging to
build a fourth mobile network in New Zealand and estimated a break-even market
share of 10% of revenues would need to be achieved relatively quickly.94 Covec
noted that a fourth MNO would further fragment spectrum holdings.95
4.14 Vodafone submitted that sufficient spectrum must be released to meet future
demand. During MBIE’s consultation on 5G spectrum, Vodafone recommended that
parties be able to acquire up to 100 MHz of spectrum in the 3.5 GHz band.96
4.15 Spark noted the importance of releasing sufficient spectrum in a timely manner to
support 5G deployments in New Zealand. Spark’s preference appears to be for 100
MHz to be made available to each operator in the 3.5 GHz band.97
4.16 In its submission, InternetNZ noted the spectrum holdings are uneven, and that it
had previously expressed concerns over spectrum allocation and the risk of
hoarding.98
92 2degrees submission on the Issues paper, (26 October 2018), p 13. 93 Ibid, at p 24. 94 Covec submission on the Issues paper, (24 October 2018), para 62. 95 Ibid at p 8,9. 96 Vodafone’s submission on the Issues paper, (26 October 2018), p 26. 97 In its submission to RSM on 5G spectrum, Spark submitted that the MNOs should be permitted to
purchase at least 100 MHz in any auction of ‘C-band’ (3400-3800 MHz). Spark submission to MBIE “Preparing for 5G in New Zealand”, (30 April 2018), p 2.
98 InternetNZ submission on the Issues paper, (26 October 2018), p 9.

62
3519307.1
4.17 A number of other submissions commented on the need for a flexible approach for
the allocation of 5G spectrum. For example:
4.17.1 Vocus suggested a new approach is needed to avoid ending up with three
separate 5G networks.99 Vocus submitted that it is unlikely that a new
national entrant will emerge, and that entry at a regional level was more
likely, through operators such as Blue Reach.100 Vocus referred to the
importance of national roaming to support such entry; and
4.17.2 Chorus referred to several options, including allocating spectrum to
wholesale-only operators; enforcing ‘use it or lose it’ provisions; and the
use of coverage obligations.101
Further analysis
4.18 As shown in Figure 9, the MNOs use a range of spectrum bands to provide mobile
services. This provides a combination of coverage and capacity.
4.19 Since the Issues Paper, the Government has announced its decision on the renewal
of radio spectrum management rights in the 1800 MHz and 2100 MHz bands. These
rights are due to expire in 2021. As a result:102
4.19.1 in the 1800 MHz band, of the 50 MHz currently held by each of 2degrees,
Spark and Vodafone, 40 MHz are to be renewed;
4.19.2 in the 2100 MHz band, all of the existing rights held by 2degrees
(amounting to 30 MHz), Spark (30 MHz), and Vodafone (50 MHz) are to be
renewed.103
99 Vocus submission on the Issues paper, (26 October 2018), para 70. 100 Ibid, at para 74. 101 Chorus submission on the Issues paper, (26 October 2018), para 19. 102 Cabinet Paper “Renewal of radio spectrum management rights in the 1800 & 2100-megahertz frequency
bands”, (25 February 2019), para 4. 103 An additional 10 MHz in the 2100 MHz band held by Telstra is not to be renewed.
63
3519307.1
4.20 The spectrum held by Spark and to a lesser extent Vodafone in some of the higher
frequency bands (particularly the 2300-2600 MHz bands) has enabled them to
launch fixed-wireless broadband services while minimising disruption to their
mobile customers. Spark’s FWA service has been particularly successful, with the
number of Spark FWA subscribers increasing from 84,000 as of June 2017 to
129,000 as of December 2018.104
4.21 The ability to offer FWA services may have been a factor in Trustpower’s decision
to sign an MVNO agreement with Spark. Many of Trustpower’s rural customers are
unlikely to have access to fibre services in the near future, and these customers can
be served using FWA services.105
4.22 Significant disparities in spectrum holdings are likely to distort competition at both
the retail and the wholesale level. In allocating spectrum, it is important that
consideration is given to the likely competitive effects of any allocation. While we
recognise that there may be competing objectives that the Crown will likely need to
balance, we consider that promotion of competition should be an important
consideration in spectrum allocation for the long-term benefit of New Zealanders.
4.23 As we noted in the Issues Paper, the competition impacts of spectrum acquisitions
can be considered in two ways:
4.23.1 under the Commerce Act through the merger clearance process and the
ability for the Commission to undertake merger enforcement
investigations under section 47 of the Commerce Act; and
4.23.2 through tools applied as a matter of Government policy as part of auction
design to promote competition, including setting the reserve price for
spectrum allocations, spectrum caps (or acquisition limits), ‘use it or lose
it’ provisions, implementation requirements, and payment terms.106
104 Spark H1 FY19 Results Summary, page 3. In its submission on the Issues Paper, Spark said it serves over
125,000 fixed broadband customers using its mobile network. Spark submission on the Issues paper, (26
October 2018), para 48b. 105 Trustpower media release “Trustpower pleased to announce wireless broadband and mobile services on
the way for customers”, (20 November 2018). 106 These tools are discussed in the recent Cabinet Paper on 5G spectrum. See Cabinet Paper “Allocation of
Radio Spectrum for 5G Mobile”, (27 February 2019), para 49, 56, 76, and 78.

64
3519307.1
4.24 In considering whether an acquisition of spectrum would be likely to substantially
lessen competition under section 47, the Commission looks at the impact of the
acquisition on telecommunications markets. This is a relative test that examines
competition with and without the acquisition to see whether competition would
likely be substantially lessened as a result of the acquisition. The competitive
impact may not only depend on the particular band of spectrum being acquired,
but also on holdings in other spectrum bands which may be a close substitute.
4.25 The use of mechanisms such as spectrum caps as part of an auction for new
spectrum allocations may seek to further promote competitive conditions. RSM has
been consulting on the key issues surrounding the allocation of further spectrum to
support the deployment of 5G services, including the use of spectrum caps.
4.26 We consider that a key feature of the allocation process for this spectrum will be
the setting of acquisition limits that prevent any party or parties from dominating
spectrum holdings and distorting competition in downstream markets. The Cabinet
Paper issued in February 2019 also recommended that a limit be set on the amount
of national 5G spectrum given to any one operator, “to prevent stronger players in
the market from shutting out weaker incumbents or potential new entrants.”107
4.27 In its advice on spectrum limits in relation to 3.6 GHz spectrum, the ACCC noted it
may be appropriate to take into account existing holdings of spectrum in other
bands when considering how much new spectrum a party should be able to
acquire.108
4.28 In addition to looking at differences in the current spectrum holdings of the three
existing MNOs, it is also relevant to consider whether parties other than the
existing three MNOs should be able to participate in any future allocation of
spectrum.
4.29 Based on our analysis of the performance of the retail mobile market in New
Zealand, there does not appear to be a strong case for regulatory intervention to
facilitate a fourth MNO to enter the New Zealand market.
107 Cabinet Paper “Allocation of Radio Spectrum for 5G Mobile”, (27 February 2019), para 49. 108 ACCC “Allocation limits advice for the 3.6 GHz spectrum allocation”, (July 2018), p 2.

65
3519307.1
4.30 However, it may be appropriate in the upcoming 3.5 GHz spectrum allocation to
not foreclose the possibility of new entry if investors see a potential business case.
In our view, any entry decision should be up to investors, who should be able to
determine the merits of a business case for entry. Reserving the new spectrum
solely for the use of the existing three MNOs would erect an absolute barrier to
entry and would preclude the possibility of new entry into downstream markets.
4.31 Such entry may not necessarily be in the form of a fourth MNO that would compete
against the existing MNOs. For example, Dense Air has recently acquired 70 MHz of
spectrum in the 2.6 GHz band in New Zealand.109 Dense Air intends to use the
spectrum to offer network extension services to the existing MNOs, by using small-
cell technology at the edge of cells to enhance coverage.
4.32 Dense Air’s entry is more complementary to the existing MNOs, as Dense Air does
not intend to compete with existing mobile operators at the retail level.
4.33 The Dense Air business model is targeted at enhancing MNOs coverage and
capacity using Dense Air’s licenced spectrum to in-fill coverage gaps in urban areas
and extend capacity weak spots in more rural areas where it is not economically
efficient for MNOs to deploy this additional infrastructure themselves.
4.34 Potential interest in upcoming spectrum allocations in New Zealand may emerge
from regional wireless internet service providers (WISPs).
4.35 In its March 2018 discussion document on 5G spectrum, RSM referred to a total of
280 MHz of spectrum in the 3.5 GHz band as being available for 5G networks.110
Officials have since identified that 390 MHz of spectrum could be allocated in the
3.5 GHz band, which could in principle be sufficient to meet the needs of up to four
national network operators. As noted in the Cabinet Paper issued in February
2019,111
… the amount of spectrum actually available will depend on Treaty policy and any allocations for regional services. There will also need to be a gap, or "guard band", between the blocks allocated to the national 5G network operators and any other services in the 3.5 GHz band, to prevent interference. The required size of the guard band is still being worked out in consultation with industry.
109 http://denseair.net/dense-air-acquires-2-6-ghz-spectrum-assets-in-new-zealand/ 110 RSM “Preparing for 5G in New Zealand: Discussion document”, (March 2018), p 5. 111 Cabinet Paper “Allocation of Radio Spectrum for 5G Mobile”, (27 February 2019), para 27.

66
3519307.1
4.36 A number of submissions on the Issues Paper, for example InternetNZ, also referred
to the risk that a party who acquires spectrum may hoard it rather than use it to
roll out services. 2degrees also submitted that MBIE should impose implementation
conditions to dissuade speculative bidding.
4.37 In this regard, we note that the February 2019 Cabinet Paper proposes to include
obligations to use spectrum allocated in the 3.5 GHz band. Such obligations are to
ensure that spectrum is actually used, and to discourage hoarding and speculation,
which could also have an adverse impact on competition. The requirements
proposed by the Minister of Broadcasting, Communications, and Digital Media (the
Minister) would require the recipients of the spectrum rights to implement a
network within:112
4.37.1 five years in the case of a national network, extendable to seven years on
payment of a sum to be decided; and
4.37.2 two years in the case of a regional or local network.
4.38 We also note that the February 2019 Cabinet Paper refers to the option of allowing
recipients of spectrum to pay for the spectrum by instalments, and that the
Minister will consider the case for instalments as part of the design of the 3.5 GHz
auction.113 This approach could reduce the barriers for new entrants or allow
parties to secure viable spectrum allocations.
4.39 We will continue to monitor the design of the spectrum auction, and the timing and
amount of spectrum that is able to be released.
112 Cabinet Paper “Allocation of Radio Spectrum for 5G Mobile”, (27 February 2019), para 56.
113 Ibid, at para 78.

67
3519307.1
Preliminary Findings on spectrum
PF7
Spectrum is a scarce and critical input into the supply of mobile services. Significant asymmetries in spectrum holdings (including in terms of the amount and type of spectrum held) can affect competition in the mobile market, and the design of future allocation processes for spectrum should have regard to such asymmetries. In setting limits on the amount of spectrum that may be acquired, it may also be appropriate to have regard to existing holdings in other bands which represent a substitute for the spectrum being auctioned or allocated.
PF8
We do not believe there is a case for regulatory intervention to facilitate a fourth national MNO to enter the market. However, the design of the upcoming 3.5 GHz spectrum allocation process should not foreclose the possibility for new parties (including parties who may complement or compete with the existing MNOs) to obtain spectrum.
MVNOs
Introduction
4.40 This section sets out our analysis and preliminary findings on MVNOs including:
4.40.1 a brief outline of the potential benefits that MVNOs can bring for
consumers of mobile services;
4.40.2 describing the types of MVNO operating models and the gross margins
expected for each type of MVNO model;
4.40.3 examining the emergence of competition at the wholesale level for MVNO
services in New Zealand; and
4.40.4 summarising our preliminary findings on MVNOs.
Potential benefits to consumers from MVNOs
4.41 MVNO entry can provide consumers with more choice of standalone mobile
services as well as bundles that include mobile and other services. MVNOs can offer
some service innovation, product differentiation, and a more flexible set of tariff
arrangements which may better meet the needs of specific customer niches. In
some cases, they offer better value for money via competitive pressure on prices.
MVNOs often enter to target niche segments of the market that traditional MNOs
may not be willing or able to serve.

68
3519307.1
4.42 There are also benefits to consumers from being able to purchase bundled services.
Fixed-line service providers can use an MVNO model to provide bundled offers. For
example:
4.42.1 Vocus has been offering discounts on its fixed broadband services where a
mobile service is also purchased;114
4.42.2 Trustpower, when it launches, appears to be intent on offering its fixed
broadband and electricity customers the option of acquiring mobile
services in its bundles;115
4.42.3 The Wireless Internet Service Providers Association (WISPA) have indicated
that there would be strategic value for WISPs in being able to offer a full-
service bundle, including mobile, to rural consumers.116
MVNO operating models and margins
4.43 MVNOs typically provide the same or similar retail services as a traditional MNO.
They purchase capacity from an MNO, then in turn offer services to their own
customer base and acquire new customers from MNOs or other MVNOs.
4.44 There are different types of MVNO operating models. These are typically described
as ranging from a licensed reseller, which is the minimalist form of MVNO, through
intermediate models, to a ‘full’ MVNO (sometimes also referred to as ‘thick’).
Under a full MVNO model, the MVNO invests in more of the key components of a
mobile network apart from radio spectrum. The MVNO models offer the MNO the
opportunity to generate revenue from spare network capacity.
114 Slingshot website accessed May 2019 115 Trustpower media release “Trustpower pleased to announce wireless broadband and mobile services on
the way for customers”, (20 November 2018). 116 WISPA NZ submission on the Issues paper (26 October 2018), p 2.

69
3519307.1
4.45 Figure 10 illustrates the different MVNO operating models.
Figure 10 MVNO operating models
4.46 The number of key components carried out by the MVNO grows for each
progressive model, as does the expected margin discount typically offered by the
MNO.117 This is because the level of investment required by the MVNO increases as
it moves from a simple reseller with minimal investment through to a ‘full’ MVNO,
where the MVNO owns and operates core network elements. As a result, the
division of components between the MVNO and the host MNO will vary across the
operating models, and the level of discount will reflect this division.
117 The discounts expected under each of the MVNO operating models are further discussed below.

70
3519307.1
4.47 Table 7 below shows the typical range of gross margins (representing discounts off
retail prices) expected for each of the MVNO models illustrated in Figure 10. These
ranges are taken from the experience of Red Dawn Consulting (RDC) and its
involvement in approximately one hundred MVNO arrangements globally.118
Table 7 MVNO operating models and gross margin
MVNO Model Gross Margin Range
Licensed Reseller 10-20%
Service Provider 20-35%
Light MVNO 35-55%
Full MVNO 45-70%
Source: RDC “MVNO Landscape: Global perspectives and New Zealand
Applications” April 2019.
4.48 We note that the European Commission cleared a 4-to-3 merger in Austria on
condition that the merged entity meet a number of conditions to facilitate new
entry, including providing wholesale access to MVNOs. The pricing terms of that
wholesale access included retail minus 25%.119
4.49 We understand that the model operated by the Warehouse Mobile would sit
towards the left-hand side of Figure 10 (‘licensed reseller’). Vocus and Trustpower
appear to sit somewhere between ‘Service Provider’ and ‘light’ MVNOs.120
118 RDC “MVNO landscape: Global perspectives and New Zealand Applications”, (24 April 2019), p 12-13. 119 European Commission Decision, Case No M.6497 – Hutchison 3G Austria / Orange Austria, (12 December
2012), p 165 120 Informed by RDC “MVNO Landscape report” (24 April 2019), p30

71
3519307.1
4.50 As RDC has noted, the potential growth of MVNO models may be moderated by the
relatively small size of the New Zealand market and the set-up costs associated
with MVNO operating models. According to RDC:
4.50.1 for an MVNO based on a licensed reseller model, set-up costs for the
MVNO are low;
4.50.2 for a light MVNO, set-up costs incurred by the MVNO can be between $1
million and $2 million; and
4.50.3 for a full MVNO, set-up costs incurred by the MVNO can be between $2
million and $3 million.
4.51 RDC suggest that the full MVNO model is unlikely to be justified for a market the
size of New Zealand.121
Emerging competition at the wholesale level
4.52 Until recently, competition between the MNOs to supply wholesale mobile services
to MVNOs appears to have been limited. The MVNOs that emerged in New Zealand
prior to 2015 were hosted by either Vodafone or Spark, and market evidence
indicates that commercial arrangements may have been a factor in limiting the
ability of the MVNOs to expand in the retail market. As we noted in Chapter 3, the
share of the retail mobile market supplied by MVNOs is around 1%, which is
considerably lower than in comparable countries.122
4.53 Evidence collected during the study indicates that, until recently MNOs have shown
little interest in hosting MVNOs, with MVNO negotiations often being difficult and
protracted.
121 RDC “MVNO landscape: Global perspectives and New Zealand Applications”, (24 April 2019), p 14. 122 For example, in its final report on its Communications Sector Market Study, the ACCC reported the market
share of MVNOs as being greater than 10%. See ACCC “Communications Sector Market Study”, (April
2018), Figure 4.2.

72
3519307.1
4.54 Trustpower has previously submitted that competitive tension at the wholesale
level in New Zealand is likely to be low, due to the third MNO being a relatively late
entrant with more limited coverage than the other MNOs.123 2degrees has also
submitted that it had previously been limited in its ability to offer competitive
MVNO services:124
When pricing MVNOs, 2degrees offers a national service, including coverage in areas
where it purchases national roaming services. In the past, the blended rates it offers
on voice, SMS and data would have been higher due to the costs and risks
associated with national roaming, but these have improved over the last two years
as the reliance on national roaming has reduced. Now, in 2018, national roaming
accounts for a very small amount of network traffic.
4.55 2degrees also argued that in the past, two MNOs with broadly similar market
shares had little incentive to support MVNOs, “but the presence of a growth-
oriented third network will change behaviour.”125 2degrees pointed to similar
trends in overseas markets, where a third MNO pursues growth using MVNOs,
prompting a competitive response from incumbents.
4.56 There is some evidence to suggest that competitive conditions at the wholesale
level have recently been improving, along the lines suggested by 2degrees. For
example:
4.56.1 the Warehouse Mobile launched mobile services in late 2015, based on
2degrees’ network;
4.56.2 Spark submitted that it has improved the commercial terms it has been
offering for MVNO services;126
4.56.3 Trustpower received competing MVNO offers from 2degrees and Spark in
2018;127
123 Trustpower “Promoting a vibrant mobile market in New Zealand”, (3 November 2015), p 12. 124 2degrees submission on the Issues paper, (26 October 2018), p 17. 125 Ibid, at p 18. 126 Spark submission on the Issues paper, (26 October 2018), para 113. 127 2degrees submission on the issues paper, (26 October 2018), p 16

73
3519307.1
4.56.4 in November 2018, Trustpower announced it had signed an MVNO
agreement with Spark, enabling Trustpower to start offering mobile and
wireless broadband services. Trustpower said it had nearly 400,000
customers in total across all its services, including 91,000 fixed-line
telecommunications customers;128
4.56.5 Kogan Mobile, who supply mobile services in Australia, has announced
that they will enter the New Zealand market based on their partnership
agreement with Vodafone;129 and
4.56.6 MyRepublic has announced that it intends to enter as an MVNO in
Australia and New Zealand, following their entry into the Singapore
market.130
4.57 Although it did not secure Trustpower’s MVNO business, 2degrees is likely to
continue to compete for MVNO opportunities as:
4.57.1 it has invested in an MVNE platform that supports independent and
differentiated MVNO models;
4.57.2 it can now offer comparable levels of coverage as the other MNOs; and
4.57.3 having incurred the fixed costs of building its network, it can improve scale
and reduce unit costs through increased wholesale activities.
4.58 2degrees has noted that they are in discussion with several potential MVNOs.131
2degrees said that they would continue to pursue MVNO wholesale agreements as
they have invested in their own MVNE platform and have an incentive to recover
the cost of that investment.132
4.59 For MNOs, wholesale agreements must be commercially viable. In providing
wholesale MVNO access, an MNO will risk cannibalising some of its retail market
share to the MVNO, particularly if the MNO has established sub-brands which may
be vulnerable to the MVNO.
128 Based on its 30 September 2018 results. Also
https://www.nzherald.co.nz/business/news/article.cfm?c_id=3&objectid=12163254, 20 November 2018. 129 Australian Stock exchange announcement, Kogan.com to launch Kogan Mobile in New Zealand (1 June
2018)
130 Study of mobile telecommunications markets in New Zealand - Issues Paper – (31 August 2017), para 70,
and Commerce Commission correspondence with Kogan Mobile and MyRepublic. 131 2degrees submission on the Issues paper, (26 October 2018), p 2. 132 Ibid, at p 17, 18.

74
3519307.1
4.60 The MNO will need to balance this risk of cannibalisation against the risk that the
MVNO will secure a wholesale agreement with a rival MNO, enabling it to compete
at the retail level in which case the MNO would then still risk losing those
customers.
4.61 While recent activity in the market indicates competitive conditions for MVNOs are
improving, there are barriers to switching between MNOs that may impact the
willingness of MVNOs to change their host network. One barrier is the need for an
MVNO to have its customers switch out SIM cards for their service to continue on
another host network. The introduction and support of eSIMs by MNOs has the
potential to reduce this barrier significantly over time.
4.62 We note that MVNOs in other countries have emerged in a range of circumstances.
In some countries, MVNO access has been introduced via conditions on the award
of spectrum or as conditions imposed on mergers. In a small number of cases,
MVNO access is directly regulated. In countries such as the UK and Australia, there
is no MVNO regulation, with MVNOs emerging as a result of commercial
negotiations.
4.63 We agree with NERA’s submission (on behalf of Spark) that access regulation of
markets with multiple competing networks is not common, and that to do so would
require compelling evidence of a competition problem or market failure.133 NERA
also note that a lack of MVNOs may simply indicate there are not many profitable
niches for MVNOs to reach that are not already served by MNOs.134
4.64 Wholesale competition between the MNOs has recently strengthened and is likely
to be sustained, although as noted earlier in this chapter, this may be influenced by
the future allocation of spectrum. In this regard, we note that the increased
capacity available on 5G networks may further stimulate wholesale activity.
4.65 As a result, there is potential for further MVNO entry and expansion, as long as the
terms of MVNO access are competitive and the MVNO is able to add value to the
retail market. Competition, supported by spectrum allocation, should deliver this.
133 NERA submission on behalf of Spark “Competitive effects of MVNO’s and assessment of regulated MVNO
access”, (26 October 2018), para 3. 134 Ibid, at para 5a.

75
3519307.1
4.66 The competition that is developing at the wholesale level for MVNO services would
be expected to encompass multiple dimensions of MVNO contract terms, including
price and non-price terms. While the range of MVNO operating models vary
considerably, some of the key dimensions include the following:
4.66.1 pricing and margin protection;
4.66.2 branding and marketing;
4.66.3 devices and SIMs;
4.66.4 migration to other MVNO models;
4.66.5 service equivalence;
4.66.6 operations; and
4.66.7 contract termination.
Preliminary Findings on MVNOs
PF9 MVNOs currently serve just over 1% of the retail mobile market. Until recently, wholesale competition between MNOs to host MVNOs has been limited.
PF10
With three national mobile networks, sufficient competitive conditions at the wholesale level exist and we expect MVNOs should emerge if they are commercially viable. However, spectrum allocation decisions will be critical to support this competition.
PF11
There is some evidence that recent increased wholesale activity by 2degrees has prompted a response from Spark and Vodafone in offering MVNO access. Spark has recently signed an MVNO agreement with Trustpower, and Vodafone with Kogan Mobile.
PF12 In light of this, we do not consider MVNO access regulation to be appropriate at this time. There would need to be greater evidence of market failure to justify wholesale access regulation.

76
3519307.1
Consumer engagement and experience with mobile services
Introduction
4.67 Markets will best deliver benefits to New Zealanders when both the demand
(consumer) side of the market and the supply (provider) side of the market are
working well. Where active and well-informed consumers switch to those providers
who best meet their needs, suppliers are incentivised to innovate and efficiently
meet those needs. Active customers who are prepared to switch will also make it
easier for new suppliers to enter and expand by lowering customer acquisition
costs.
4.68 This section sets out our consideration of:
4.68.1 how effectively mobile consumers are able to engage in the mobile
market, following the three A’s (Access, Assess, and Act) approach to
evaluating the state of consumer engagement within the mobile
market;135
4.68.2 whether mobile consumers exhibit behavioural biases which may influence
competition between existing suppliers as well as the prospect for
potential suppliers to enter the mobile market; and
4.68.3 potential remedies and actions that could be taken to promote consumer
engagement in the mobile market.
4.69 We then summarise our preliminary views on consumer engagement in the mobile
market.
How easily can consumers access the information they need?
4.70 For consumers to be able to engage effectively in the mobile market and make
informed purchasing decisions, they need to have the right information available.
Consumers need to access both information on the key features of competing
offers and their own mobile usage in order to compare these offers with their
needs.
135 Office of Fair Trading, “What does Behavioural Economics mean for Competition Policy?”, (March 2010), p
10-17.

77
3519307.1
4.71 Consumers can freely access plan information on mobile provider websites (and comparison websites136). Consumers can also gain (often incomplete) plan information through advertising and word-of-mouth.
4.72 According to Consumer NZ’s survey of mobile consumers, most consumers appear
to find it easy to access their mobile usage information, as shown in
4.73 Figure 11.
4.74 The same survey also showed the ways in which consumers access their usage
information, with 58% of consumers accessing their usage via a mobile app, 18% via
their provider’s website, and 16% via their monthly bill (although we note that this
usage information is often limited to a short time period eg, one month). In their
submissions on the Issues Paper, the MNOs also noted that consumers can access
their usage information on their mobile provider’s app or website.
Figure 11 Ease of accessing mobile usage information
4.75 Along with plan information and their usage trends, consumers could benefit from
information on mobile performance ie, the quality of the mobile service they are
currently receiving or could possibly receive from another provider. While all three
MNOs have coverage maps on their websites there is no shared map for consumers
that compares coverage between the three MNOs.
4.76 In addition, even when there is nominal coverage there may be ‘holes’ in this
coverage caused by a range of factors eg, signal degradation caused by buildings
and/or topography, or network base stations being at or nearing capacity.137
How easily can consumers assess the information they have?
4.77 Even if consumers have access to usage and performance information, they also
need to be able to assess their options ie, the plans available in the market and
136 As discussed below, the utility of price comparison websites will depend on how the information is
presented.
137 See, for example, the earlier discussion of 3G and 4G availability in the context of quality of mobile service,
Chapter 3, p 51.

78
3519307.1
service quality against their mobile service needs. This assessment is complicated in
that consumers need to anticipate what their future usage will be.
4.78 The presence of complex choices and/or of non-transparent add-on costs may
make plan comparisons more difficult. This can lead to consumer confusion,
deterring consumers from actively comparing retail plans. Even where consumers
do compare plans, they may end up making poor choices.
4.79 As an example, where prices are advertised on a non-standardised basis, the ability
of consumers to correctly identify the cheapest option will be affected. In this
regard, Skinny offers bundles of mobile minutes, texts, and mobile data which
renew every 28 days. Other mobile providers offer bundles of minutes, texts, and
data on a monthly basis. In order to make a valid comparison, consumers would
have to adjust the prices and allowances of the Skinny offer to a monthly-
equivalent. For example, Skinny’s $77 plan (with unlimited minutes and texts, and
40GB data) is equivalent to $83.42 per month.
4.80 We also note that mobile providers typically offer a range of add on options which allow consumers to purchase additional minutes or data. Where a consumer is not aware of these additional charges, their ability to select the plan best suited to their needs will be diminished.
4.81 Such confusion may deter consumers from comparing retail plans. As shown in
Figure 12, most consumers do not compare mobile plans frequently.
Figure 12 Frequency of comparing plans
4.82 If many consumers ‘never’ or ‘rarely’ compare plans due to the difficulty of the
process, this would be a significant concern. As shown in Figure 13 below this does
not appear to be the case, as over half of respondents find it easy to compare
plans.
Figure 13 Ease of comparing providers and plans

79
3519307.1
4.83 It is worth noting that some consumer segments find it relatively more difficult to
compare plans. For example, 32% of consumers aged 65 or older in the Consumer
NZ survey found it ‘difficult’ to compare mobile providers and plans. It may also be
the case that although they generally perceive it to be easy to compare retail plans,
consumers may not actually end up on the plan that is best-suited to their needs.
4.84 The business segment covers a range of customers, with differing abilities and attitudes to reviewing competing mobile plans. Smaller enterprises may face similar search costs and challenges as residential customers when assessing retail offers. Larger corporate customers with higher level of spend on mobile services (often within a whole of business contract) or with more specific requirements are more likely to be better served due to the value of their business. Such customers will often have a procurement team to manage competitive tenders and contracts.
4.85 An important issue for consumers being able to make informed purchasing
decisions is whether accurate and clear information is available. The Commission
has investigated misleading claims from mobile providers in the past. These have
included:
4.85.1 misleading consumers over 2G network closures;
4.85.2 failure to identify the subscription nature of mobile add-ons until after the
customer has subscribed to the service; and
4.85.3 the clarity and visibility of contract terms and charges for SMS/MMS/data
when consumers send messages or exceed their data bundle allowances.
4.86 These are indicative of the issues consumers can face when trying to assess which
offers in the market may best meet their needs.
Bundling
4.87 While bundles may provide consumers with benefits in the form of discounts and
convenience (one bill, one point of contact), the presence of bundles adds another
factor the consumer must consider when comparing plans. This can make it more
difficult for consumers to assess different retail offers.

80
3519307.1
4.88 Bundling of services can also increase customer stickiness, for example:
4.88.1 Trustpower has reported that churn rates for bundled services (electricity,
gas and broadband) are materially lower than for energy services;138and
4.88.2 in our 2018 decision on the proposed merger between Sky and Vodafone, we noted evidence indicating that bundling reduces customer churn and increases customer acquisition costs.139
4.89 As discussed earlier, uptake of bundles that include mobile services is currently low
among residential consumers. Consumer NZ found that 73% of respondents in their
2018 survey do not bundle their mobile service with other services, and Analysys
Mason’s Connected Consumer Survey also found that when choosing a mobile plan,
the ability to bundle mobile connectivity with other services was ranked relatively
low by respondents.140 Of consumers who do bundle their mobile service, most
bundle it together with fixed-line broadband and/or streaming services.
4.90 The prevalence of business consumers buying mobile as part of a wider bundle is
likely to be higher than residential customers due to the importance of whole of
business connectivity. For example, in our 2015 business mobile market study, 78%
of businesses said that bundled solutions are important.141 As noted in the
preceding paragraph, Analysys Mason has found that bundling is ranked relatively
low by consumers.
4.91 Currently there are no bundles of mobile services with ‘must have’ products in New
Zealand. However, the Commission will continue to monitor the development of
bundles.
4.92 We will also continue monitoring the uptake of bundles that include mobile
services to assess whether firms may be using bundles strategically to raise barriers
to entry and to limit the market available to competitors.
138 Trustpower “Investor Briefing 2018 half Year Results”, (8 November 2018), slide 7. 139 Commerce Commission “Vodafone Europe B.V. and Sky Network Television Limited [2017] NZCC 1 Sky
Network Television Limited and Vodafone New Zealand Limited [2017] NZCC 2”, (22 February 2018), para
X26, 182 to 185. 140 Analysys Mason “Connected Consumer Survey 2018: mobile customer satisfaction in Australia and New
Zealand”, slide 11.
141 UMR “Competition for Business Customers in the Mobile industry: A Report for the Commerce
Commission”, (December 2015), p 28.

81
3519307.1
How easy is it for consumers to act?
4.93 The level of switching observed in a market may be indicative of the ability of consumers to act and take advantage of competing offers. Various types of costs consumers incur can impede switching.142
4.94 However, it is important to understand what underpins the level of switching – including the reasons for switching or not switching, and any barriers to switching – and the implications for consumers. For example:
4.94.1 a high level of switching may result in poorer consumer outcomes, if
consumers end up on plans that make them worse off. For example,
research in the UK has found that 17% of consumers switching electricity
suppliers ended up worse off; 143 and
4.94.2 a low level of switching may reflect a high level of satisfaction among
consumers with their current supplier, with suppliers competing to retain
their customers.144
4.95 Over the past four years the number of mobile subscribers who have ported their
number has stayed constant at around 5% per annum.145 The Consumer NZ 2018
survey indicates a slightly higher rate of switching (9% in the past 12 months) which
could be in part explained by customers relinquishing their number when they
switch. This is slightly lower than numbers for Australia at 10% and the average for
28 European countries at 13%.146
4.96 In our 2015 business mobile market study we found that 14% of businesses had
changed mobile provider within the previous two years, and that this was lower
than the percentage of businesses that had switched power company (26%) but
higher than the percentage that had switched banks (5%).147
142 For example, transaction costs, compatibility costs, learning costs, contractual costs or psychological costs,
see OFT655, “Switching Costs Economics Discussion Paper 5: Part One Economic models and policy
implications”, (April 2003), Ch 2. 143 Wilson, C., and Waddams Price, C., “Do Consumers Switch to the Best Supplier?”, (10 March 2010). 144 This may be by way of suppliers’ drip-feeding incremental improvements to their customers. 145 Porting numbers from the New Zealand Telecommunications Forum (TCF), overall subscriber numbers
from our Annual Monitoring Questionnaire. 146 ACCC, “Communications Sector Market Study Final Report”, (April 2018), p 120; European Commission,
“Consumer Markets Scoreboard 2018 Edition”, (2018), Fig 25. 147 UMR Research “Competition for Business Customers in the Mobile Industry: A Report for the Commerce
Commission” (December 2015), p 91, 96.

82
3519307.1
4.97 While the switching statistics show that some consumers are moving, over half of
residential consumers have not switched in the last five years (see Figure 14).
Figure 14 Time with current provider
4.98 There is no fixed proportion of the market that should be expected to switch.
Consumers not switching provider is not necessarily a concern if those consumers
do not face significant barriers to switching.
4.99 Figure 15 below shows that 19% of consumers think that it is difficult to switch.
Figure 15 Perceived ease of switching provider

83
3519307.1
4.100 A low level of switching could also reflect that consumers are generally satisfied
with their current provider. As shown in Figure 16 below, 70% of consumers, who
have not switched in the past 12 months, stayed with their current provider
because they are satisfied with the service they are receiving.
Figure 16 Main reason for staying with provider
4.101 Although satisfaction with current provider is the most common reason given for
not switching, a number of the other reasons given by mobile consumers for
remaining with their current provider relate to barriers to switching. These include
a lack of confidence of getting a better deal, perceptions around the effort involved
in changing providers, and the presence of fixed contracts.
Switching barriers
4.102 A number of barriers to switching suppliers have been reduced in the mobile
market. This is likely to explain why most consumers consider switching between
mobile suppliers to be easy.
4.103 Most importantly, the introduction of mobile number portability has reduced
switching costs by allowing consumers to retain their numbers when they change
suppliers.
4.104 Another example relates to handset locking. As previously noted the practice of
locking handsets increases switching costs and has led to the Commission raising
concerns over the practice in the past.148
148 While we raised concerns in the past we also noted that a transparent lock in period that reflects the
recovery of subsidised costs may not undermine competition.

84
3519307.1
4.105 We will continue to monitor the number of locked handsets and the break fees
attached to these phones. Even where break fees do not apply, the inconvenience
of having to unlock a device is likely to raise switching costs for the consumer.
4.106 There have been cases of consumers on fixed-term contracts that include a
handset, continuing to pay the same price for mobile services beyond the end of
their contract.149 As pointed out in submissions this is not a significant issue in New
Zealand as there has been a move away from fixed-term contracts which include
handsets in the residential market in recent years.
4.107 While the move away from fixed-term contracts for residential customers will have
made switching easier, there is likely a trade off in that contract plans can offer
considerably better value. As seen in Australia, twelve-month contracts often offer
better value in exchange for the commitment of a contract, particularly enabling
much higher data allowances.
4.108 In the business segment, our 2015 business study found that 73% of businesses
surveyed were on fixed term contracts. Our 2018 Annual Industry Questionnaire
found that 58% of business customers were on fixed term contracts. In place of
fixed-term contracts, the market has moved towards handset payment plans.
4.109 We note that while concerns may arise with fixed-term contracts that have
excessive terms, we are not opposed to the existence of fixed-term contracts per
se. The existence of twelve-month contracts alongside pay monthly plans may be
positive from a consumer choice perspective.
Behavioural biases
4.110 We have examined whether consumers, when faced with competing retail offers of
mobile services, may make decisions in which they fail to select an offer that would
better meet their needs than their current offer. Such decisions may result from
‘behavioural biases’ which inhibit consumers from making better choices.150
4.111 As discussed above, more than half of respondents to Consumer NZ’s mobile
consumer survey reported that they had been with their current provider for more
than five years. This may indicate a preference among the majority of mobile
consumers for the familiarity of their current supplier (a preference for the ‘status
quo’).
149 Behavioural Insights Team “Applying behavioural insights to regulated markets”, (26 May 2016), p 45.
150 Behavioural Insights Team “Behavioural Biases in Telecommunications: A review for the Commerce
Commission”, (May 2019).

85
3519307.1
4.112 Although a reason given by most mobile consumers for not switching is that they
are satisfied with their current provider, we note that mobile consumers tend to
compare alternative offers infrequently. As a result, such consumers may be
unaware if there are other retail offers available that might better meet their
needs.
4.113 It may also be the case that a consumer’s existing supplier offers incremental
improvements in value (such as additional data for the same monthly price) in
order to retain them and to reduce their propensity to shop around. This may
reinforce a ‘status quo’ bias, even if better offers were available elsewhere.
4.114 Even if consumers were aware of better competing offers, there is research that
indicates that consumers “value what they have more than what they might have”.
Such an aversion to losing what they currently have may result in consumers
missing out on benefits from switching, as competing suppliers would have to offer
substantial inducements to get a consumer to switch.151
4.115 Consumers may also be overconfident in their ability to forecasts their usage, for
example the number of minutes or the amount of data they will use each month.
This may be an issue where the costs of incorrectly forecasting usage are high. In
this regard, the cost of purchasing additional mobile data appear to be relatively
high; for example, Vodafone’s mobile data add-on costs $15 for 1 GB, and
2degrees’ data pack add-on costs $20 for 1 GB.152
4.116 Where a customer’s actual usage is higher than expected and results in the
customer having to purchase additional data, this can result in a monthly bill that is
significantly higher than expected (a form of ‘bill shock’).
4.117 Conversely, where customers overestimate their usage, they may end up with
unused minutes and data. Where unused allowances can be rolled over, the
customer can carry forward unused balances. However, where this persists, this
may indicate that the customer is on a more expensive plan that is necessary to
meet their usage.
4.118 We are currently undertaking some research into the extent to which mobile
consumers are on retail plans that do not best suit their needs. This is discussed
further below.
151 Lunn P. “Telecommunications Consumers: A Behavioural Economic Analysis”, (19 January 2012), p 10-11. 152 Operator websites accessed May 2019.

86
3519307.1
Are consumers on plans that are suited to their usage?
4.119 Although there is some evidence that mobile consumers find it easy to compare
retail plans, they only do so infrequently. Consumers may therefore be unaware if
there are other retail offers available that might better meet their needs. This is a
potentially important issue to ensure that suppliers face the correct incentives to
compete for customers. At this stage, we do not have robust evidence on whether
mobile subscribers are on plans that are well-suited to their usage.
4.120 We are currently undertaking some research into the extent to which mobile
consumers are ‘leaving money on the table’ by remaining on plans that are more
expensive than they need to be in order to satisfy their usage. There are two
situations where a consumer may be paying too much for mobile services:153
4.120.1 a customer’s actual usage (in terms of minutes, SMS, and mobile data used
per month) is lower than the allowance they are purchasing; or
4.120.2 a customer’s actual usage could be met using a cheaper plan (either with
the same operator or with a competing operator).
4.121 Consumers must anticipate their future needs to assess which plan best meets their
needs This can be difficult for consumers,154 although a number of plans currently
available (such as Vodafone’s MyFlex plan) provide consumers with flexibility to
adjust in light of their usage.155 This has been raised as an issue in other markets
(such as electricity) where consumers have not necessarily chosen the best plan.156
4.122 We will be looking to understand the best approaches to encourage consumers to
review their current plans and to consider switching to alternatives that may offer
better value. This work is being done as part of our wider section 9A monitoring
and consumer work, outside of this study.
153 We note that consumers may also be willing to pay more for improved service. 154 Dr P Xavier, “Behavioural Economics and Customer Complaints in Communications Markets” (May 2011),
Ch 5. 155 An example in the case of fixed broadband services is Spark’s ‘Unplan’ offers. 156 Wilson, Chris M. and Price, Catherine Waddams, “Do Consumers Switch to the Best Supplier?”, (10 March
2010). This found that 17% of consumers in the UK electricity market reduced their surplus by switching.

87
3519307.1
Potential remedies/actions
4.123 It appears that consumers can access information on mobile services, assess
alternatives, and switch relatively easily. However, consumers do not appear to
frequently compare mobile plans, and there are some features of mobile plans
which may reduce the ability of consumers to identify plans that are best suited to
their usage. We also note that a large proportion of mobile consumers have
remained with their current supplier for five years or more.
4.124 The recent passage of the Telecommunications (New Regulatory Framework)
Amendment Act 2018 introduced several new consumer provisions aimed at
improving retail service quality (RSQ) through increased information and added
consumer protections. These provisions apply to both fixed-line and mobile
telecommunications.
4.125 As no major issues have emerged so far, we are not advocating for the use of RSQ
codes as part of this study. Further RSQ work is underway separate to the Mobile
Study, which will cover both mobile and fixed-line telecommunications.
4.126 We noted in our Issues Paper the recent legislative change in Australia to introduce
a Consumer Data Right (CDR), which will first apply to banking, followed by energy
and then possibly telecommunications.157 MBIE is considering the role that CDR
initiatives could play in the New Zealand commercial and consumer environment.
The CDR is essentially a data portability right and has the potential to enable
greater levels of transparency and encourage competition between providers.
4.127 Establishing a CDR that achieves the desired outcomes is not easy.158 As noted
earlier, it appears that mobile consumers are already able to access information
about their usage of mobile services. Hence, we are proposing to continue to
monitor developments in Australia and other markets rather than recommending
the introduction of such a measure in New Zealand.
157 ACCC website, Consumer Data Right, (28 March 2019), https://www.accc.gov.au/focus-areas/consumer-
data-right-cdr-0 158 Behavioural Insights Team “Behavioural Biases in Telecommunications: A review for the Commerce
Commission”, (May 2019).

88
3519307.1
4.128 Price comparison websites can facilitate the comparison of different mobile service
plans and lower search costs for consumers. However, there may be concerns over
the independence of these websites and the accuracy of the information they
present.159 As price comparison websites cover both mobile and fixed
telecommunications services, we will evaluate them further, outside of this study,
as part of our wider consumer work.
Preliminary Findings on mobile consumers
PF13 Most consumers can easily access their mobile usage information, but information on mobile performance (speeds, actual quality of coverage etc) is harder to access.
PF14 Most consumers find it easy to compare available plans, but report that they only do so infrequently.
PF15
Our evidence shows that the process for residential consumers to switch between mobile suppliers is relatively easy, given that:
a) mobile number portability is available; b) there are low numbers of locked handsets; and c) long-term contracts for residential consumers are not prominent. Bundling of mobile and fixed line services, which can increase customer stickiness, does not appear to be widespread in the residential market.
PF16 While residential consumers report being able to easily access usage information and compare plans, and that the process of switching appears to be relatively easy, a significant proportion of consumers have not compared plans in the last 12 months and have remained with their current supplier for more than five years. This suggests that there is a degree of consumer inertia.
PF17 Switching in the business market appears to be more complex and more infrequent than residential mobile services. Businesses typically purchase mobile and fixed services as a package, often through fixed-term contracts, with brand reputation being an important driver. Larger business customers are more sophisticated buyers, and generally have more access to specialist advice and support and are more likely to have dedicated procurement resources.
159 Ofcom runs an accreditation scheme for price comparison websites to ensure that comparisons of services
are “accessible, accurate, transparent and comprehensive.” See https://www.ofcom.org.uk/consultations-
and-statements/category-2/price-calculator-accreditation

89
3519307.1
Chapter 5 State of competition in the mobile market
Purpose and structure of this chapter
Purpose
5.1 In this chapter, we set out our views on the state of competition in the mobile
market. This draws on our overview of the mobile market in Chapter 3 and on our
assessment of the key issues discussed in Chapter 4.
Structure
5.2 We first discuss how competition between the existing mobile suppliers has
evolved since the entry of the third MNO. We then consider the conditions for
further expansion by existing suppliers and for entry of new suppliers. We conclude
with our views on whether consumers have been able to take advantage of
competition between suppliers of mobile services.
Our view on the state of competition in the mobile market
Existing competition
5.3 Competition in the New Zealand mobile market has become more established with
the emergence of the third MNO.160 The entry of 2degrees, and the completion of
its own national network in recent years, has resulted in mobile consumers now
having the choice of three independent network-based competitors, each offering
similar levels of population and geographic coverage.
5.4 We have previously noted that the entry of 2degrees had a significant impact in
terms of improving consumer choice and competitive offerings. When 2degrees
first entered in 2009, it initially offered prepaid mobile services,161 with prices that
were significantly lower than those offered by Vodafone and Telecom at the
time.162
160 For a discussion of established competition, see Yarrow, G. “Report on the impact of maintaining price
regulation”, (January) 2008. 161 2degrees started offering on account mobile services in 2010. 162 Commerce Commission “New Zealand Retail Prices for Fixed Line and Mobile Services: A Benchmarking
Comparison”, (November 2010), p 23.

90
3519307.1
5.5 Both Vodafone and Spark have responded to the entry and expansion of 2degrees.
For example:
5.5.1 in early 2012, Spark launched its Skinny brand offering prepaid mobile
bundles, initially targeting the youth end of the market before refocusing
as a budget brand in 2013;163
5.5.2 in 2014, we noted that competition had been more intense in the low to
medium use and prepaid segments of the mobile market, as evidenced by
a reduction in prices in these segments compared to the OECD average;164
and
5.5.3 in 2016, Vodafone introduced its MyFlex prepaid plan, providing
customers with the flexibility to adjust the number of minutes, texts, and
data in their prepaid bundles.
5.6 The overall market shares of the three MNOs have been quite stable in recent
years. Over the five years to 2018, Spark’s share of mobile subscribers increased
from 34% to 38%, largely as a result of Skinny’s increase in the prepaid segment.
Vodafone’s share has dropped from 44% to 41%, with declines in the residential
segment and gains in the business segment.
5.7 2degrees’ overall market share has been flat in recent years, and it has a relatively
high proportion of prepaid customers, resulting in a lower ARPU. However, it has
been continuing to expand in the higher value residential on-account segment,
albeit at a growth rate that appears to be slowing.
5.8 As discussed in Chapter 3, prices of mobile services in New Zealand have been
falling, as evidenced by ARPU and usage trends. The volume of mobile voice
minutes and mobile data used by each mobile subscriber has continued to increase,
although average mobile data usage in New Zealand remains relatively low by
international standards. This may reflect the relatively high prices for higher usage
bundles.
163 Commerce Commission “Annual Telecommunications Monitoring Report 2014”, (June 2015), p 25.
164 Commerce Commission “International Price Comparison for Retail Mobile Telecommunications Services
2013”, (March 2014), p 17.

91
3519307.1
5.9 A number of submissions on the Issues Paper argued that the mobile market in
New Zealand is competitive and has been performing well.165 Other submitters put
forward a different view, that competition is not effective at the retail (and
wholesale) level, and that 2degrees had struggled to compete as a result of its
limited network coverage and its reliance on roaming.166
5.10 We note that as it was deploying and expanding its own network, 2degrees’
reliance on roaming may have constrained its ability to independently compete in
some segments. 2degrees entered by building its own mobile network in the main
centres (initially covering 47% of New Zealand’s population with its own network)
and relying on roaming on Vodafone’s mobile network in order to be able to offer
national coverage.
5.11 2degrees has since extended its own network coverage to reach levels similar to
the other MNOs. Figure 17 summarises the latest information available from our
2018 annual monitoring questionnaire, showing 3G and 4G coverage of each MNO.
Figure 17 Total national 3G and 4G coverage (2018)
165 Spark submission on the Issue paper, (26 October 2018), p 2; NERA “Competition in the New Zealand
Mobile Market”, (26 October 2018), para 29, 32, 34; 2degrees submission on the Issue paper, (26 October
2018), p 7; Vodafone submission on the Issue paper, (26 October 2018), p 3. 166 Trustpower submission on the Issues paper, (26 October 2018), para 3.1.1; Vocus submission on the Issues
paper, (26 October 2018), para 11; WISPA submission on the Issues paper, (26 October 2018), p 2.

92
3519307.1
5.12 As 2degrees invested in expanding its own network coverage, its reliance on
roaming on Vodafone’s network has diminished. 2degrees submitted that it relies
on roaming for less than 1.5% of its traffic.167 This is consistent with the responses
to our annual monitoring questionnaire.
5.13 There is some evidence that in the past, 2degrees’ smaller network footprint may
have created reputational challenges in serving some segments of the mobile
market. For example, in our 2015 study into the business segment of the mobile
market, we found a general perception among business customers that 2degrees
offered a lower service quality and less extensive coverage.
5.14 However, we also found that those business customers who subscribed to 2degrees
were the most satisfied (93% of business customers were satisfied with their
mobile service, compared to 77% for Spark and 81% for Vodafone).168
5.15 After 10 years in the mobile market, 2degrees has an established track record as an
MNO in New Zealand and a number of submissions on the Issues Paper
acknowledged that perceptions of 2degrees appear to be changing.169 We also note
that 2degrees is the only telecommunications provider to appear in Colmar
Brunton’s Corporate Reputation Index in 2019, which is a measure of New
Zealand’s most respected brands.170
5.16 According to 2degrees, the completion of its network build means that the
structure of the New Zealand mobile market is set for increased retail and
wholesale competition:171
Achieving a comparable footprint to its competitors means New Zealand now has
three truly national network operators. This creates enduring competitive tension
because 2degrees, as the newest entrant, is strongly incentivised to continue
growing to deliver a return on past investment – and fund upcoming 5G
deployment.
5.17 It therefore appears that 2degrees is well-positioned to compete in the supply of
mobile services across all customer segments.
5.18 However, as we discuss in Chapter 4, the ability of each MNO to compete going
forward will also depend on the amount and type of spectrum held by the MNOs.
167 2degrees submission on the Issues paper, (26 October 2018), p 2. 168 UMR Research “Competition for Business Customers in the Mobile Industry: A Report for the Commerce
Commission” (December 2015), p 87. 169 For example, WISPA submission on the Issues paper, (26 October 2018), p 2. 170 Colmar Brunton “Corporate reputation Index 2019”, available at https://www.colmarbrunton.co.nz/wp-
content/uploads/2019/04/Colmar-Brunton-Corporate-Reputation-Report-April-2019.pdf 171 2degrees submission on the Issues paper (26 October 2018), p 1.

93
3519307.1
Conditions for further expansion and entry
5.19 In considering the ability of existing suppliers of mobile services to expand further,
and new suppliers to enter, we have examined potential barriers to entry and
expansion which could influence competition in the New Zealand mobile market
going forward.
5.20 For MNOs, access to adequate spectrum will be an important issue to sustain
competition and to accommodate rapidly growing demand for services supplied
over mobile networks, particularly mobile data and wireless broadband services
which require significant capacity. We note that disparities in spectrum holdings
can potentially affect downstream competition, and that this may be a particularly
important issue for consideration in the upcoming allocation of 3.5 GHz spectrum.
5.21 As discussed in Chapter 4, there does not appear to be a case for regulatory
intervention to promote a fourth MNO to enter the market. However, we consider
it appropriate to allow parties other than the existing three MNOs to participate in
future spectrum acquisition processes.
5.22 The availability of national roaming is also important for an entrant as it builds out
its own network. National roaming allowed 2degrees to offer widespread coverage
as it invested in its own network. Currently roaming remains a specified service in
Schedule 1 of Telecommunications Act.
5.23 For MVNO-based competitors, the availability of MVNO access on competitive
terms will influence the ability of MVNOs to enter and evolve in the retail market.
We note that there are a range of MVNO operating models, and we have assessed
information on existing and potential MVNOs in New Zealand.
5.24 Until recently, competition between the MNOs to supply wholesale mobile services
to MVNOs appears to have been subdued. Absent competition from 2degrees, the
other MNOs appear to have shown little interest to offer MVNO access, suggesting
unsatisfactory wholesale market conditions for MVNOs.
5.25 There is some evidence to suggest that competitive conditions at the wholesale
level have recently been improving, with 2degrees more aggressively pursuing
wholesale opportunities. As discussed in Chapter 4, 2degrees has invested in the
platforms and systems to support more independent and differentiated MVNO
models. This is evidenced by its efforts to attract Trustpower’s MVNO business.

94
3519307.1
5.26 The other MNOs appear to have been responding. In its submission on the Issues
Paper, 2degrees noted that it understood that Trustpower had received a
competing MVNO offer from Spark. Trustpower subsequently announced that it
had selected Spark as its MVNO partner and that it intends to launch mobile
services in the near future.172
5.27 2degrees is likely to face ongoing incentives to attract MVNOs onto its network in
order to help it grow mobile volumes and achieve economies of scale. Its ability to
continue to do so is likely to depend on gaining adequate spectrum in future
allocations.
5.28 We therefore consider that competitive conditions are emerging that are likely to
support commercial MVNO activity where there is a market opportunity for such
services. The prospects for MVNO-based entry and expansion are also likely to
depend on whether consumers of mobile services are actively engaged and
prepared to switch between suppliers.
Consumer engagement
5.29 As competing suppliers emerge in a market, the increased range of choice and
offers can give rise to issues around the level of consumer engagement and
confidence. As we have noted, if consumers find it difficult to compare proliferating
offers and to choose the services that best meet their needs, this is likely to create
barriers to entry and expansion in the competitive supply of mobile services.
5.30 In Chapter 4, we examined the available evidence on the ability of consumers to
compare alternative offers and to switch between service providers.
5.31 It is important for consumers of mobile services to be able to easily access
information on their usage and to compare retail prices of mobile services. It
appears that most consumers can easily get information on their monthly usage,
such as the number of minutes and texts, and the amount of data they use.
Consumers also appear to find it easy to compare retail plans, but only do so
infrequently.
5.32 Non-price features of mobile services are less visible to consumers, including
information on speeds and the extent and quality of coverage.
172 Trustpower media release, “Trustpower pleased to announce wireless broadband and mobile services on
the way for customers”, (20 November 2018).

95
3519307.1
5.33 Switching between mobile suppliers appears to be relatively easy, given that
mobile number portability is available, there are low numbers of locked handsets,
and that long-term contracts for residential consumers are not prominent in New
Zealand. Despite this, a significant proportion of consumers have remained with
their current supplier for more than five years, suggesting a degree of customer
inertia.
5.34 A key reason why consumers state they remain with their current supplier is that
they are satisfied with their service. However, this does not generally reflect active
comparison by many consumers of alternatives and may simply reflect a status quo
bias encouraged by gradual improvements in plan content. Consumers give a
variety of reasons for remaining with their current supplier, including the customer
being unsure whether they could get a better deal elsewhere.

96
3519307.1
Preliminary Findings on the state of competition
PF18
Our preliminary view is that competition in the retail mobile market has become more established with three independent, national network-based competitors. This has resulted in mobile consumers benefitting from an increasingly competitive market environment.
PF19
There remain some areas where we anticipate competitive outcomes for consumers could improve further, such as pricing for higher usage bundles of mobile services. Average mobile data usage in New Zealand remains low by international standards, and this may reflect relatively high prices for larger bundles.
PF20
We believe that the conditions for effective competition exist, with the three MNOs each having a network of similar technology with similar geographic and population coverage metrics. We consider that:
a) spectrum must be allocated with wholesale and retail competition matters at the forefront of decisions;
b) with the pre-conditions for competition in place and the adequate allocation of spectrum, we would expect MVNO services to develop where market opportunities exist; and
c) there may be room for improved consumer engagement, to ensure that consumers are aware of and able to easily take advantage of competing offers to drive competition.
Proposed Actions on the state of competition
PA1 We will continue to engage with MBIE on the importance of the upcoming spectrum allocation/auctions for delivering competitive outcomes in the mobile market.
PA2 We will amend the Annual Monitoring Report to capture information on the development of MVNO market share and business sustainability.
PA3
We will undertake further work as part of our wider responsibilities under section 9A and Part 7 of the Telecommunications Act (outside of this study) to:
a) continue to improve our understanding of the extent to which consumers can and do access, assess and act on relevant information in the mobile and wider telecommunications markets;
b) assess consumers choice of mobile plan against their usage, including quantification of the potential savings mobile consumers could make if they were on plans that better match their usage; and
c) continue to assess the quality of services provided by mobile suppliers and the extent to which consumers are actively engaged in the mobile market, as part of our wider retail service quality programme, including the Commissions ability to review or create retail service quality codes if appropriate.

97
3519307.1
Chapter 6 Future developments in mobile services
Purpose of this chapter
6.1 This chapter sets out our consideration of some of the key issues relating to the
future development of the mobile market, in particular, those raised in the Issues
Paper and submissions throughout the study. These include potential future
developments in the supply of mobile services and our preliminary views on their
potential impacts on competition.
6.2 One of the original aims for this study was to gain a better understanding of how
mobile markets are currently performing and developing, and to consider how the
mobile landscape may evolve in the future.173 This chapter attempts to satisfy the
second part of that purpose statement.
6.3 The selection of future developments in this chapter is a subset of the potential
future developments in mobile technology and trends and is not intended to be
exhaustive. 5G and eSIMs are potentially transformative technologies, network
slicing and increased infrastructure sharing have the potential to alter the
investment profiles for MNOs and access conditions for MVNOs. For a fuller and
broader investigation of future trends please refer to the Red Dawn “Global
Industry Trends” Report.174
5th Generation (5G) mobile networks
6.4 5G is the next generation of mobile technology and will require mobile operators to
invest in spectrum and in key network infrastructure, including radio access
network equipment, backhaul and core networks.175
6.5 The competition between 5G networks in New Zealand and the timing of their
deployment will be heavily dependent on the upcoming spectrum allocations.
Operators must also navigate their proposed 5G infrastructure and network
deployment plans through the process administered by the Government
Communications Security Bureau (GCSB) before they are able to commence
deployment.176
173 Commerce Commission “Scope for our study of mobile telecommunications markets in New Zealand” ;(27
March 2018), para 2. 174 Red Dawn Consulting “Global mobile industry trends: Implications for New Zealand”, (April 2019). 175 Ferry Crijpink, Alexandre Ménard, Halldor Sigurdsson, and Nemanja Vucevic “The road to 5G: The
inevitable growth of infrastructure cost”, McKinsey & Company (February 2018). 176 This process is set out in the Telecommunications (Interception Capability and Security) Act 2013.

98
3519307.1
6.6 The legislative process relates to the identification and mitigation of any network
security risks that may arise in relation to public telecommunications networks. In
November 2018, following a media release by Spark, the GCSB confirmed177 that it
had identified a network security risk associated with Spark’s planned use of
Huawei’s equipment within its 5G radio access network.178 The GCSB process is
ongoing, and Spark has the opportunity to mitigate the concerns raised by the
GCSB.
6.7 In the event those concerns cannot be mitigated to GCSB’s satisfaction, the
ultimate decision will rest with the Minister responsible for the GCSB. Only the
Minister can issue a direction to prevent, sufficiently mitigate, or remove a network
security risk identified by the GCSB.
6.8 In making such a direction, the Minister must consult with the Minister for Trade
and Export Growth and the Minister for Broadcasting, Communications and Digital
Media, and must have regard to additional factors including:
6.8.1 the impact on the MNO of meeting the costs associated with the direction;
6.8.2 the potential consequences that the direction may have on competition
and innovation in telecommunications markets; and
6.8.3 the anticipated benefits to New Zealand from preventing, sufficiently
mitigating, or removing the network security risk.
6.9 The consequences of any decision that has the effect of excluding or restricting the
involvement of Huawei, or any equipment supplier, in the roll out of 5G networks
could potentially affect the development of competition and the costs of deploying
5G networks in New Zealand.
6.10 In commenting on the GCSB decision, 2degrees has referred to the importance of
multiple vendors to deliver price competition, and that if the GCSB decision is
confirmed and extended to 2degrees, ‘it will be a real disappointment for
competition.’179 Spark has also commented publicly that ‘Huawei had been a very
competitive provider of services that had helped keep the vendor market
honest.’180
177 GCSB statement, (28 November 2018); https://www.gcsb.govt.nz/news/gcsb-statement/ 178 Spark “GCSB declines Spark’s proposal to use Huawei 5G equipment”, (28 November 2018). 179 https://www.stuff.co.nz/business/108940155/gcsb-declines-huawei-proposal 180 https://www.stuff.co.nz/business/industries/108261662/kiwi-mobile-phone-users-would-pay-for-5g-ban-
on-chinas-huawei-2degrees-warns

99
3519307.1
6.11 The rollout of 5G networks will enable MNOs to further benefit from supply side
economies of scope by offering multiple services over the same infrastructure,
particularly fixed wireless, mobile services and IoT. While there is a lot of industry
and media interest about innovation and new applications using 5G technology in
areas such as production, smart devices, agriculture and entertainment, the initial
focus from MNOs in New Zealand appears to be in the enhanced capacity for
mobile and fixed wireless broadband.181
6.12 In its initial phase, 5G is likely to be a basic overlay on existing 4G technology
platforms. The 3rd Generation Partnership Project, which is the international body
that governs cellular standards, has completed the 5G technical standards, and
these have been published. This allows for the deployment of fully compliant 5G
networks, on top of existing legacy LTE networks.
6.13 Much like the transitions from 3G to 4G and 4.5G, the initial launch of 5G in New
Zealand is likely to involve the replacement of equipment on existing base stations.
If data usage continues to grow exponentially, and new use cases come online,
higher spectrum frequencies and additional cell sites are likely to be needed. This
may increase the cost of further 5G deployment compared to the initial phase and
potentially increase the complexities and scale for consenting, site sourcing, site
access and environmental consents.182
6.14 Spark, Vodafone and 2degrees have all indicated that they plan to roll out
competing 5G networks by leveraging their existing network infrastructure.183
Dense Air’s recent entry into New Zealand, and its wholesale small cell
infrastructure sharing approach potentially provides a complementary service to
the existing MNOs towards improved 4G and 5G services.
6.15 Spark and Vodafone have also leveraged their mobile infrastructures to deploy IoT
networks in New Zealand, in anticipation of the expected increase in demand for
IoT applications across a wide range of industry sectors including agriculture,
transport and horticulture. These networks compete with standalone IoT networks
that use different wireless technologies, that have also launched in New Zealand,
including Kotahinet and Thinkxtra.
181 Spark “5G: The evolution towards a revolution: Briefing Paper” (August 2018), p 11. 182 Land Access and the National Environmental Standard for Telecommunication Facilities (NESTF) concerns
were raised in a number of submissions to RSM’s “Preparing for 5G in New Zealand” discussion document. 183 Spark submission on “Preparing for 5G in New Zealand: Discussion Document” (30 April 2018) p 1,
Vodafone New Zealand submission on “Preparing for 5G in New Zealand: Discussion Document” (May
2018), p 2, and 2degrees submission on “Preparing for 5G in New Zealand: Discussion Document”, p 2.

100
3519307.1
eSIMs
6.16 An eSIM is a chip that is soldered directly onto a device’s circuit board and
performs the functions that are today undertaken by a physical SIM card. Instead of
the user having to physically switch SIMs in the device to change networks, this can
be conducted over-the-air or by electronic means instead.
6.17 eSIMs can be embedded in traditional handsets, tablets, wearable technology (eg,
smart watches) and IoT applications. 184 eSIMs offer the opportunity to eventually
make the switching experience seamless as there are no physical elements to
contend with; all aspects of switching can be done remotely.
6.18 eSIMs could benefit MVNOs who wish to bulk transfer their customer base in the
event of switching from one host MNO to another. eSIMs could also enable
MVNOs to differentiate further in niche markets and on pricing, allowing
consumers to seamlessly switch to the best offers available and to stimulate regular
switching.
6.19 eSIMs could also create opportunities for global handset makers or OTT players to
become ‘mega MVNOs’ and possibly leverage this position to get better deals from
MNOs. An early example of this is Google’s ProjectFi in the US.
6.20 There are three prerequisites for the benefits of eSIMs to be realised. Firstly, there
need to be eSIM devices. Secondly, carriers must support eSIMs. This is the most
critical requirement. Lastly, supporting systems are required to enable customers
to switch between providers.185
6.21 Spark is currently the only New Zealand MNO to support eSIMs on their network,
but this support is limited to a select few devices.186 Vodafone indicated that eSIMs
would be supported on their network by the first quarter of 2019, though this has
yet to happen.187 2degrees has stated their intention to support eSIMs but has not
given a concrete timeframe.
184 Apple iPhone XR, XS, and XS Max and Google Pixel 2 handsets are currently the only e-SIM capable
handsets 185 Wik Consult “Economic aspects of embedded SIM for the telecommunications consumer segment”,
(2017). 186 https://www.spark.co.nz/esim 187 https://www.nzherald.co.nz/business/news/article.cfm?c_id=3&objectid=12130793

101
3519307.1
6.22 Uptake of devices is predicted to be modest with the Red Dawn Emerging Trends
Report stating that:188
The number of eSIM devices could reach anywhere between 148 million to 420
million shipments in 2022…. Smartphones will contribute to nearly two-thirds of all
eSIM device shipments by 2022. Despite such spectacular growth, less than 5% of
smartphones sold globally in 2022 will be eSIM compatible.
6.23 As submissions noted, eSIMs may not just impact customers. Spark noted that
eSIMs could possibly alter the distribution channels of mobile providers and pave
the way for any service provider, including those that operate on-line only, to sell
mobile plans and services if they had agreement with an MVNO and an OTT
provider. 2degrees expects that modest cost savings could be realised from eSIMs
as the need to distribute physical SIM cards diminishes.
6.24 Given the potential of eSIMs to enhance retail and wholesale competition and to
lower switching barriers, the Commission could be concerned with behaviour that
sought to reduce the competitive benefits of eSIMs, for example:
6.24.1 eSIM locking that could increase switching costs for owners of carrier-
locked wearables;
6.24.2 exclusion of other mobile service providers, such as MVNOs; and
6.24.3 limited or restrictive enabling of eSIM devices that unduly restricted the
functionality of eSIM devices.
188 Red Dawn Consulting “Global mobile industry trends – Implications for New Zealand” (24 April 2019); p 32

102
3519307.1
Network slicing
6.25 Network slicing is a form of virtual networking architecture. In simple terms it
allows network owners to divide up their physical network into multiple virtual end
to end networks. This virtualisation enables a variety of different services to be
offered, each able to be carefully tailored. 189 Such services may include IoT, fixed
wireless services, mobile gaming and new forms of MVNO access, as shown in
Figure 18 below.
Figure 18 5G Network slices
6.26 Network slicing uses virtualisation technologies such as Network Function
Virtualisation or Software Defined Networking. These technologies offer an
effective way to exploit the benefits of a common network infrastructure, enabling
operators to establish and run multiple network services in parallel. 190 191
6.27 5G network slicing should enable network operators to develop a broader service
portfolio and thereby diversify, expand and increase on-going revenue streams by
providing higher quality innovative services that may have a higher ARPU.
189 Mohammad Asif Habibi et al, “Network Slicing in 5G Mobile Communications: Architecture, Profit,
Modelling and Challenges”, Conference Paper, (August 2017). 190 Matias Richart et al “Resource Slicing in Virtual Wireless Networks: A Survey”, IEEE Transactions on
Network and Service Management, Vol. 13 Issue 3, (September 2016), p 462. 191 Nokia “Dynamic end-to-end network slicing for 5G”, (June 2016).

103
3519307.1
6.28 This has the potential to enable non-traditional providers such as Apple and Google
to purchase dedicated network slices to run their services. These providers will still
be reliant on the MNO networks and may provide complementary services rather
than providing an additional competitive constraint on MNOs.192
Infrastructure sharing
6.29 Infrastructure sharing arrangements can result in cost efficiencies by lowering the
cost of network deployment. However, such arrangements can also produce a
range of detriments through reduced infrastructure-based competition. Such
detriments may include higher prices (leading to a reduction in allocative efficiency)
as well as lower levels of innovation (a loss of dynamic efficiency). As a result,
infrastructure sharing will involve a trade-off between different forms of
efficiencies.
6.30 Infrastructure sharing has the potential to affect the economics and speed of LTE
and then 5G deployments, although the overall impact is difficult to predict at this
early stage of development.
6.31 BEREC, the Body of European Regulators for Electronic Communications, has
recently produced a snapshot of infrastructure sharing arrangements across
European National Regulatory Authorities. They define infrastructure sharing as
follows:
Mobile infrastructure sharing (both passive and active) describes the process by
which operators share infrastructure to deliver a mobile service to end users.
"Passive sharing" is the sharing of the passive elements of network infrastructure
such as masts, sites, cabinet, power, and air conditioning. "Active sharing" is the
sharing of active elements in the radio access network such as antennas and radio
network controllers (RNC).193
6.32 The trade-off between the costs of deployment and infrastructure competition may
become more pronounced given the potential densification of cell sites required for
5G.
192 Matteo Vincenzi et al, “Multi-Tenant Slicing for spectrum Management on the Road to 5G”, IEEE Wireless
Communications Magazine, Vol. 24, No. 5, (October 2017), p 118- 125. Konstantinos Samdanis et al, “From
Network Sharing to Multi-tenancy: The 5G Network Slice Broker”, IEEE Communications Magazine, Vol.
54, Issue: 7, (July 2016). 193 BEREC “Report on Infrastructure sharing” (14 June 2018), BoR (18) 116, p 2

104
3519307.1
6.33 In this context, the infrastructure established by the Rural Connectivity Group
(RCG) could be relevant. The RCG plans to deploy 520 cell sites and share spectrum
to improve rural coverage and connectivity under the RBI2 and MBSF. According to
RCG:
The cell sites we build will be shared by New Zealand’s mobile network operators –
Vodafone, Spark, 2degrees – to provide mobile services from all three mobile
companies and ensure competitive broadband services to rural customers. The
towers will also be open access for wireless internet service providers to utilise. The
infrastructure will allow all operators to share the radio access network equipment
and one set of antennas, meaning the size of the infrastructure can be flexible to
suit the geographic location.194
6.34 Depending on its configuration, parts of the RCG infrastructure could be reused for
future deployment of 5G technology by MNOs, at lower cost than a greenfield
implementation. In this way, it is possible that it will be economic to provide 5G
services in areas where it might otherwise be uneconomic. In its submission on the
Issues Paper, 2degrees said it expects to use RCG infrastructure to deploy 5G.195
6.35 Most submissions on the Issues Paper noted that infrastructure sharing
arrangements are likely to facilitate 5G coverage, particularly in more rural areas.
For example, Vodafone submitted that 5G infrastructure sharing agreements are
likely to be similar to those that facilitated the 3G and 4G rollouts.196
6.36 2degrees also submitted that although the viability and form of 5G infrastructure
sharing in different regions is yet to be determined, it expects that 5G
infrastructure sharing will largely follow 4G:197
6.36.1 infrastructure competition in areas of high traffic/capacity demand;
6.36.2 passive infrastructure sharing and co-location in areas with moderate to
low traffic/capacity demand; and
6.36.3 active infrastructure sharing in areas of low traffic density, with access to
RCG facilities in RBI2 areas.
194 http://www.thercg.co.nz/why-is-rcg-unique/ 195 2degrees submission on the Issues paper, (26 October 2018), p 37. 196 Vodafone submission on the Issue paper, (26 October 2018), p 36. 197 2degrees submission on the Issues paper, (26 October 2018), p 31-32.

105
3519307.1
6.37 WISPA also submitted that infrastructure sharing may enable rural consumers to
benefit from 5G sooner than having separate networks, although it is too early to
say definitively. WISPA also note that RCG infrastructure is potentially important to
the roll-out of 5G in rural areas, although this depends on whether the location of
the RCG towers are suitable to support higher frequency transmissions, and
whether the quality of backhaul available at those towers is adequate to support
5G.198
6.38 In the case of the RCG joint venture which facilitated improved connectivity under
the RBI2 and the MBSF, the Telecommunications Act provides these programmes
with restrictive trade practices (RTP) authorisation under the Commerce Act.199
6.39 We note that any new infrastructure sharing arrangements could potentially
require RTP authorisation under the Commerce Act.
6.40 We also note that any new authorised infrastructure sharing to support 5G
deployments could include conditions relating to third-party access to shared
infrastructure. In the case of the RCG, it has a Deed of Open Access Undertakings
(the Deed) that includes non-discrimination obligations.
6.41 The non-discrimination provision in the Deed states that the “RCG will ensure there
is Non-discrimination in relation to the supply of a Relevant Service”.200 The
Relevant Services are Wholesale Tower Co-location and Wholesale Backhaul.
6.42 Where sharing extends to radio spectrum, there may be additional efficiency gains
in terms of spectrum usage. For example, where blocks of spectrum are awarded to
different parties, some spectrum must be used as guard bands to prevent
interference. Where a single block of spectrum is awarded and shared, the amount
of spectrum set aside as guard bands may be reduced, freeing up more spectrum to
be used.
198 WISPA submission on the Issues paper, (26 October 2018), p 3. 199 Section 156AZF of the Telecommunications Act 2001. 200 Deed of Open Access Undertakings, clause 5.1.

106
3519307.1
Preliminary Findings on future developments in the mobile market
PF21
5G will initially be an evolution over existing networks, and over time network densification will occur. Investment in 5G may alter the economics of mobile provision and raises the prospect of greater infrastructure sharing, and larger incentives to utilise network capacity through MVNO agreements.
PF22
eSIM capable devices are likely to become more prevalent, with the potential to reduce switching costs for both consumers, MNOs and MVNOs. However, there is the potential for competition to be suppressed if MNOs do not enable eSIMs or lock eSIMs devices to their network.
PF23
We may see more infrastructure sharing. Whether this enhances or suppresses competition will depend on how the arrangements are structured. We would expect to see infrastructure sharing proposals that raise potential competition concerns come to us for authorisation.

107
3519307.1
Chapter 7 Regulated services
Purpose of this chapter
7.1 This chapter sets out our preliminary findings and proposed actions for the five
regulated services that currently relate to the mobile market, considering
submissions received during the study, the completion of the Schedule 3 review of
Designated and Specified Services in June 2016, and National Roaming in
September 2018.
Mobile termination access services (MTAS)
7.2 MTAS are the termination services a fixed or mobile network operator needs to
purchase to allow its subscribers to communicate with the subscribers of a mobile
network. The MTAS service is shown in Figure 19.
Figure 19 Mobile termination access service
7.3 A mobile network needs to be able to interconnect with other networks to ensure
that its subscribers can communicate.
7.4 MTAS is a designated access service under Schedule 1 of the Telecommunications
Act, which allows us to determine the price and non-price terms of the service.
MTAS includes termination of voice calls and SMS.

108
3519307.1
7.5 In 2011, we finalised an STD in respect of the MTAS, in which we set mobile
termination rates (MTR) for voice calls and SMS. These are summarised in Table 8.
Table 8 Mobile termination rates
Effective from 6 May 2011 1 Oct 2011 1 Apr 2012 1 Apr 2013 1 Apr 2014
Voice (cpm) 7.48 5.88 3.97 3.72 3.56
SMS (cpSMS) 0.06
Source: Commerce Commission Decision 724
7.6 Every five years, we are required to review whether Schedule 1 services should
remain in Schedule 1. The MTAS service was last reviewed in 2015 and we
concluded that it should remain in Schedule 1.
7.7 Our reasons for retaining MTAS as a designated service included that each MNO
has a monopoly over the termination of calls on its network under the calling party
pays principle, and that the ability to increase MTAS prices can distort downstream
competition.201 Our next scheduled review of MTAS is September 2020.
7.8 Several submissions on our Terms of Reference for the mobile market study noted
that the regulated reductions in voice MTRs were set via benchmarking in 2011 and
the reductions finished in 2014, and that international evidence indicates that the
cost of mobile termination is decreasing.202 These submissions recommended that
a review of the MTAS STD should be undertaken.
7.9 Further support for this was provided by Chorus and Vocus in their submissions on
our Issues Paper, with Chorus noting that the MTAS rate was relatively high
compared to overseas, and that it was providing a distortion on the market
compared with the real costs of servicing mobile calls, particularly fixed to mobile
calling rates.203
201 Commerce Commission “Consideration of whether to commence an investigation into whether to omit
the Mobile Termination Access Services from Schedule 1 of the Telecommunications Act 2001” (23
September 2015), para 4. 202 Chorus “Submission in response to the Commerce Commission’s Mobile Market Study Terms of
Reference” (30 November 2017); Vocus Communications “Mobile Market Study Scoping” (30 November
2017). 203 Chorus submission on the Issues paper (26 October 2018), p 6.

109
3519307.1
7.10 In a number of overseas jurisdictions, MTRs are set on a pure long run incremental
cost (LRIC) pricing principle. Our current pricing principle is total service long run
incremental cost (TSLRIC), which may result in different pricing calculations.
7.11 We noted that overseas jurisdictions have significantly lowered their MTRs over the
past few years. For example, in Australia the ACCC set a new MTR for voice calls at
A1.7 cents per minute in 2015.204 By comparison, in our 2011 MTAS STD, Australia
was one of the comparators we used to set a benchmarked price for MTAS, and the
Australian benchmark rate was A5.8 cents per minute.205
7.12 However, prior to commencing a re-benchmarking of the prices in the MTAS STD,
we intend to first undertake the five-yearly review of MTAS scheduled for 2020. In
that review, we intend to consider the competition implications of emerging
services such as OTT communication services.
7.13 We have previously noted the development and adoption of OTT services utilising
Voice-over-Internet Protocol (VoIP). OTT services can potentially be a substitute for
conventional mobile services. OTT services incur no termination charges when both
parties have the OTT service on their device.
7.14 In our 2015 review of MTAS, we referred to evidence from Ofcom, the European
Commission, and the ACCC that although OTT services were emerging as a
potential constraint on MTAS, OTT services were not yet effective substitutes.206
We noted that mobile voice traffic in New Zealand continued to increase, although
SMS traffic had started to fall in recent years. We concluded that we do not yet
have enough evidence to indicate that OTT services are an effective substitute for
mobile services.
7.15 Since 2015, mobile voice traffic has continued to increase in New Zealand, and SMS
traffic has continued to decline. As we noted in our 2017 Annual Monitoring
Report, the decline in SMS volumes is expected to continue given the increasing
popularity of various OTT messaging services like Facebook Messenger, iMessage,
WhatsApp and Viber.207
204 ACCC “Mobile Terminating Access Service Final Access Determination: Final Decision”, (August 2015). 205 Commerce Commission, Decision 724, (5 May 2011), p 71. 206 Commerce Commission “Consideration of whether to commence an investigation into whether to omit
the Mobile Termination Access Services from Schedule 1 of the Telecommunications Act 2001”, (23
September 2015), para 46-49. 207 Commerce Commission “Annual Telecommunications Monitoring Report: 2017 Key Facts”, (20 December
2017), p 25.

110
3519307.1
7.16 Analysys Mason’s Connected Consumer Survey reported that 81% of New
Zealanders with a smartphone use OTT services, with messaging services being the
most common.
7.17 We note that the ACCC has recently proposed to retain the MTAS voice termination
service as a regulated service, but has proposed to deregulate the MTAS SMS
termination service, as OTT messaging services are now considered to be effective
substitutes.208
National roaming
7.18 National roaming allows customers of one mobile network to use another network
when they are outside their own service provider’s coverage area.
7.19 National roaming is a wholesale mobile access service, which allows customers on
one MNO to roam on the network of another MNO. Roaming is typically used by
new entrants or smaller MNOs to offer national coverage in the mobile markets.
7.20 When it first entered the mobile market in New Zealand, 2degrees had deployed a
mobile network which covered 47% of New Zealand’s population. To be able to
offer national coverage, 2degrees initially relied on roaming on Vodafone’s mobile
network, which it secured through a commercial agreement. 2degrees has since
invested in expanding the footprint of its own network, and now has coverage like
that of its competitors.
7.21 In 2018 we considered the roaming service as part of the five yearly reviews of
services in Schedule 1 of the Telecommunications Act. Our final decision was to
retain national roaming as a specified service.
7.22 We concluded that there may be potential competition issues arising from the
allocation of spectrum for 5G. A new entrant would likely require a roaming
arrangement to provide immediate coverage whilst it built out its physical
network.209
7.23 We also noted that the regulated service is specified only, which means that we do
not set price terms. This mitigates the risk that roaming will distort investment
incentives facing both the MVNO relying on roaming and the MNO supplying
roaming. However, roaming as a regulated service acts as an important backstop in
the event of commercial negotiations failing.
208 ACCC “Domestic Mobile terminating Access Service Declaration Inquiry: Draft Report”, (2 May 2019). 209 Commerce Commission “Review of National Roaming: Final decision on consideration of deregulation of
national roaming” (4 September 2018), p 7-8.

111
3519307.1
Mobile co-location
7.24 Mobile co-location is a service that enables an MNO to install mobile network
transmission and reception equipment on the mast of another MNO (see Figure 20
below).
Figure 20 Mobile co-location
7.25 In New Zealand mobile co-location is a specified service and has been subject to an
STD since 2008.210 We reviewed whether mobile co-location should remain a
specified service in 2016 and concluded that it should remain in Schedule 1.211
210 Commerce Commission, “Standard Terms Determination for Co-location on Cellular Mobile Transmission
Sites, Schedule 1 Mobile Co-location Service Description” (11 December 2008). 211 Commerce Commission “Review of Designated and Specified Services under Schedule 1 of the
Telecommunications Act 2001” (5 July 2016), para 154.

112
3519307.1
7.26 We noted that the ability to co-locate equipment on the infrastructure of another
MNO facilitates the efficient deployment of mobile technology by sharing the cost
of facilities such as towers and masts. The ability to share such costs is likely to
become increasingly important as a mechanism for reaching more remote areas
with current and new technology such as 4G LTE and 5G.212
7.27 We also noted that there had been increased use of co-location, particularly during
the period from 2012 to 2015, and that co-location had been occurring both on RBI
and non-RBI sites.
7.28 Under RBI1, Vodafone was appointed by the Government to upgrade existing cell
sites and build new cell sites in rural areas, with the support of Government
funding. Vodafone is required to offer co-location services in respect of cell sites
funded through RBI1. MBIE has reported that 154 new cell sites have been built
under RBI1, all of which allow for co-location by competing operators. In addition,
387 cell sites have been upgraded.213
7.29 Co-location on existing cell sites can be more challenging than on new cell sites, as
existing cell site infrastructure may have been built to accommodate a single set of
equipment. The installation of additional equipment may require strengthening of
the mast infrastructure and may also result in the equipment being located further
down the mast, leading to reduced coverage.
7.30 The second stage of the RBI programme (RBI2) is further extending mobile
coverage in rural areas, while the Government’s MBSF is providing greater mobile
coverage along state highways and in tourism destinations where no coverage
currently exists.
7.31 The RCG is a joint venture between the three MNOs appointed by the Government
to build the infrastructure to extend mobile coverage under the RBI2 and MBSF
programmes. This differs from the RBI1 scheme in that under the RCG model, the
three MNOs will share radio access network equipment and antennae on each site
constructed by RCG.
212 Commerce Commission “Review of Designated and Specified Services under Schedule 1 of the
Telecommunications Act 2001” (5 July 2016), para X28.1. 213 https://www.mbie.govt.nz/assets/aae2c79c33/december-18-broadband-quarterly-update.pdf

113
3519307.1
Number portability
7.32 Introduced in 2007, the designated local and mobile number portability service
allows customers to keep their number when switching between service providers.
We reviewed whether number portability should remain a specified service in 2016
and concluded that it should remain in Schedule 1.214
7.33 The scheme is administered by the New Zealand Telecommunications Forum Inc.
(TCF), and the number portability determination ensures that the process for
porting a fixed or mobile telephone number while switching providers is easy to
initiate, and that end-users are not left without communications for a long period.
7.34 Our next 5 yearly Schedule 3 review of the service is planned to be completed by
June 2021.
Backhaul
7.35 Backhaul services that support mobile networks are not currently regulated under
Schedule 1 of the Telecommunications Act.215
7.36 MNOs rely on backhaul services to connect cell sites and other network nodes.216
Such connectivity supports both mobile services and fixed wireless services and
may take the form of actively managed wholesale services (such as leased line
bandwidth service (eg, Ethernet)), or passive services (such as the direct fibre
access service (DFAS)).
7.37 We understand that Spark and Vodafone self-supply some of their backhaul
requirements, but also acquire backhaul from other parties such as Chorus. In
2017, 2degrees announced that it had selected Chorus as the provider of wholesale
backhaul services to support its fixed and mobile services.
7.38 Fibre based backhaul services are the predominant technology being used to
support the supply of high-speed mobile data services. The importance of fibre
backhaul is expected to increase with the deployment of 5G mobile networks
because of the need for low latency and high capacity backhaul.
214 Commerce Commission “Review of Designated and Specified Services under Schedule 1 of the
Telecommunications Act 2001” (5 July 2016), para 150. 215 The backhaul services regulated under Schedule 1 of the Telecommunications Act 2001 are specific to
copper regulated access service s UCLL, UCLFS and UBA. 216 Backhaul in this context refers to a class of services used to transport traffic between active elements (ie,
nods) of a mobile or fixed line network. Backhaul services may be used anywhere within the mobile or
fixed line operators’ network – nationally (eg, Chorus’ regional transport service (CRT)), regionally (eg,
ICABS) and within the locally (eg, DFAS).
114
3519307.1
7.39 We note that wireless backhaul may also be an alternative, particularly where fibre
is not available or impractical. The use of wireless backhaul will be dependent on
the availability of appropriate spectrum and local conditions.
7.40 The level of competitive intensity in the supply of backhaul services varies around
New Zealand. In some regions, there are a number of competing backhaul
networks, such as Chorus, Spark, Vodafone, Vocus, Vector, and the Local Fibre
Companies (LFCs). In other areas, the options are more limited, and the likely
development of small cell infrastructure to support some 5G use cases could
further challenge the competitive dynamic for backhaul services in New Zealand.
7.41 As noted above, the MNOs rely on backhaul services from Chorus and the other
LFCs to supply mobile and fixed wireless services. To the extent that mobile and
fixed wireless services emerge as a competitive threat to fibre-based access
services supplied by Chorus and the LFCs, the incentives to supply backhaul services
may change.
7.42 In effect, Chorus and the LFCs would be supplying an upstream input to
competitors in a downstream market. This may become increasingly significant in
the context of 5G, as fixed wireless services are expected to be an important early
use case supported by 5G deployments.
7.43 We also note that some backhaul products within the fibre candidate areas (eg,
DFAS, intra-candidate area backhaul (ICABS) and metropolitan ICABS) are likely to
be regulated fibre fixed line access services under Part 6 of the
Telecommunications Act and thus be subject to the maximum allowable revenue
set by the new regulatory regime for fibre.217
7.44 The Commission has been undertaking a section 9A study into backhaul services
and is scheduled to release its findings in June 2019.
7.45 In conclusion, our analysis of the current state of mobile market competition, likely
future developments and the work we have commissioned by external experts on
emerging trends in the mobile market, and which will be published separately, lead
us to the view that the current regulatory settings are fit for purpose. Therefore,
our preliminary findings on our regulated services are set out below.
217 The scope of the FFLAS that are regulated under Part 6 will be set in regulations that must still be made.
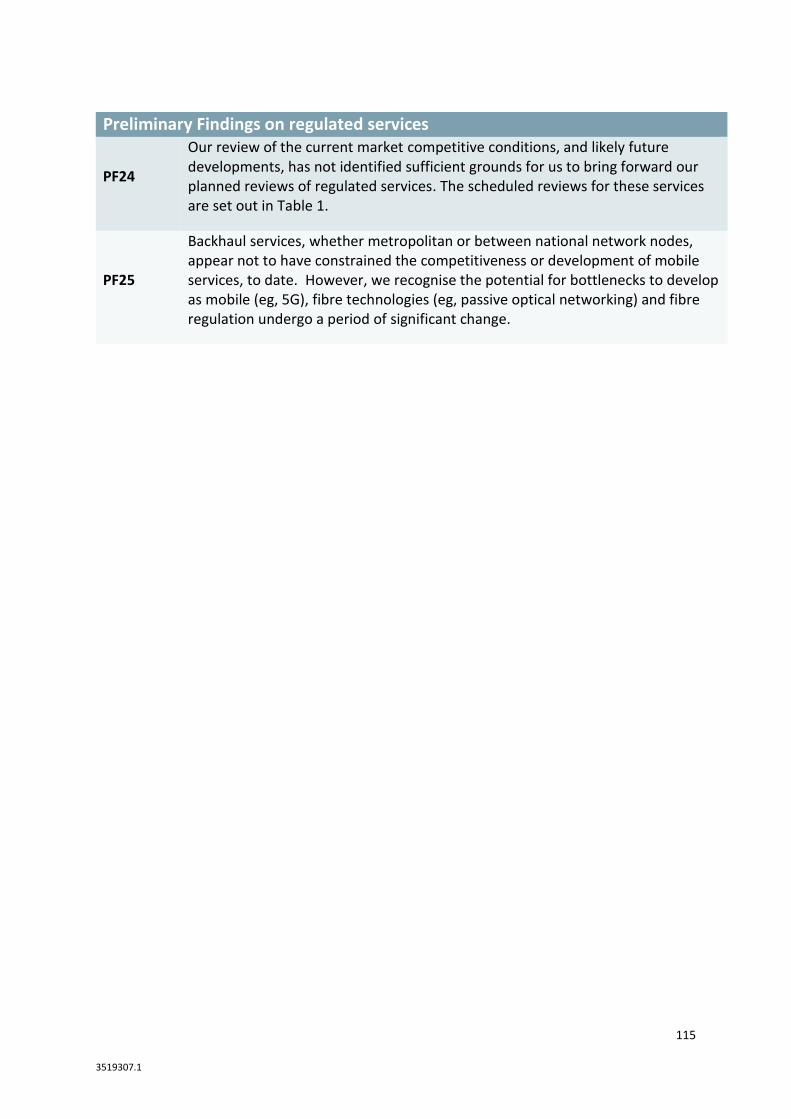
115
3519307.1
Preliminary Findings on regulated services
PF24
Our review of the current market competitive conditions, and likely future developments, has not identified sufficient grounds for us to bring forward our planned reviews of regulated services. The scheduled reviews for these services are set out in Table 1.
PF25
Backhaul services, whether metropolitan or between national network nodes, appear not to have constrained the competitiveness or development of mobile services, to date. However, we recognise the potential for bottlenecks to develop as mobile (eg, 5G), fibre technologies (eg, passive optical networking) and fibre regulation undergo a period of significant change.