Embed Size (px)
Citation preview

PREFILED DIRECT TESTIMONY OF ROBERT B. HEVERT Docket No. U-16-___: June 1, 2016 Page 1 of 68
STATE OF ALASKA
BEFORE THE REGULATORY COMMISSION OF ALASKA
Before Commissioners: Robert M. Pickett, Chairman Stephen McAlpine Rebecca L. Pauli Norman Rokeberg Janis W. Wilson
In the Matter of the Consideration of the Revenue Requirement Designated as TA 285-4 Filed by ENSTAR NATURAL GAS COMPANY, A DIVISION OF SEMCO ENERGY, INC.
) ) ) ) )
Docket No. U-16-____
PREFILED DIRECT TESTIMONY OF
ROBERT B. HEVERT

PREFILED DIRECT TESTIMONY OF ROBERT B. HEVERT Docket No. U-16-___: June 1, 2016 Page 2 of 68
TABLE OF CONTENTS
I. POSITION AND QUALIFICATIONS .........................................................................4
II. PURPOSE AND EXECUTIVE SUMMARY OF TESTIMONY .................................5
III. REGULATORY GUIDELINES AND FINANCIAL CONSIDERATIONS ................8
IV. BUSINESS RISKS ......................................................................................................10
A. Transmission and Distribution Utility Operations ...........................................11
B. Economic Conditions Risk ..............................................................................12
C. Declining Average Use Per Customer Risk .....................................................16
D. Weather Risk ....................................................................................................21
E. Structural Regulatory Lag Risk .......................................................................23
F. Operating Environment and Size Risk .............................................................25
G. Gas Supply Risk ...............................................................................................28
V. PROXY GROUP SELECTION ...................................................................................30
VI. COST OF EQUITY ESTIMATION ............................................................................35
A. Quarterly Growth DCF Model .........................................................................37
B. Constant Growth DCF Model ..........................................................................43
C. Discounted Cash Flow Model Results .............................................................45
D. CAPM Analysis ...............................................................................................46
E. Bond Yield Plus Risk Premium Approach ......................................................50
VII. OTHER CONSIDERATIONS.....................................................................................54
VIII. CAPITAL MARKET ENVIRONMENT ....................................................................56
A. Federal Reserve Market Intervention ...............................................................56
B. Interest Rate Environment ...............................................................................61
IX. CAPITAL STRUCTURE ............................................................................................63
X. COST OF DEBT ..........................................................................................................65
XI. CONCLUSIONS AND RECOMMENDATION ........................................................66
EXHIBITS
Exhibit RBH-1 Resume of Robert B. Hevert
Exhibit RBH-2 Quarterly Discounted Cash Flow Models
Exhibit RBH-3 Constant Growth Discounted Cash Flow Models
Exhibit RBH-4 Market Risk Premium Calculation – Bloomberg and Value Line
Exhibit RBH-5 Bloomberg and Value Line Beta Coefficients

PREFILED DIRECT TESTIMONY OF ROBERT B. HEVERT Docket No. U-16-___: June 1, 2016 Page 3 of 68
Exhibit RBH-6 Capital Asset Pricing Model Results (Bloomberg and Value Line Derived Market Risk Premium)
Exhibit RBH-7 Bond Yield Plus Risk Premium – Pipelines / Bond Yield Plus Risk Premium – Natural Gas Utilities
Exhibit RBH-8 Small Size Premium
Exhibit RBH-9 Summary of Revenue Stabilization Mechanisms
Exhibit RBH-10 Flotation Cost Adjustment
Exhibit RBH-11 Proxy Group Capital Structure
Exhibit RBH-12 Cost of Debt Comparison

PREFILED DIRECT TESTIMONY OF ROBERT B. HEVERT Docket No. U-16-___: June 1, 2016 Page 4 of 68
I. POSITION AND QUALIFICATIONS 1
Q. Please state your name, business address, and present position. 2
A. My name is Robert B. Hevert. My business address is 1900 West Park Drive, Suite 3
250, Westborough, Massachusetts 01581. I am Managing Partner of Sussex 4
Economic Advisors, LLC (“Sussex”). 5
Q. On whose behalf are you submitting this testimony? 6
A. I am submitting this direct testimony on behalf of ENSTAR Natural Gas Company 7
and Alaska Pipeline Company (collectively, “ENSTAR” or the “Company”), a 8
division of Semco Energy Inc. (“SEMCO”), which is a subsidiary of AltaGas Ltd. 9
(“AltaGas”). 10
Q. Briefly describe your professional experience in the energy and utilities 11
industries and your educational background. 12
A. I have worked in or with regulated industries for over twenty-five years, having 13
served as an executive and manager with consulting firms, a financial officer of a 14
publicly-traded natural gas utility (at the time, Bay State Gas Company), and an 15
analyst at a telecommunications utility. I hold a Bachelor’s degree in Business and 16
Economics from the University of Delaware and an MBA with a concentration in 17
Finance from the University of Massachusetts. I also hold the Chartered Financial 18
Analyst designation. 19
Q. Briefly describe your current professional responsibilities. 20
A. In my role as a consultant, I have advised numerous energy and utility clients on a 21
wide range of financial and economic issues, including corporate and asset-based 22
transactions, asset and enterprise valuation, transaction due diligence, and strategic 23
matters. As an expert witness, I have provided testimony in approximately 150 24

PREFILED DIRECT TESTIMONY OF ROBERT B. HEVERT Docket No. U-16-___: June 1, 2016 Page 5 of 68
proceedings regarding various financial and regulatory matters before numerous state 1
utility regulatory agencies and the Federal Energy Regulatory Commission. A 2
summary of my professional and educational background, including a list of my 3
testimony in prior proceedings, is included in my Exhibit RBH-1. 4
II. PURPOSE AND EXECUTIVE SUMMARY OF TESTIMONY 5
Q. What is the purpose of your direct testimony? 6
A. The purpose of my direct testimony is to present my expert analysis and related 7
opinions regarding an appropriate return on equity (“ROE”)1, capital structure, and 8
cost of debt for ENSTAR. My analyses and opinions are supported by the data 9
presented in my Exhibits RBH-2 through RBH-12. 10
Q. Please summarize the approach you used to determine an appropriate ROE for 11
ENSTAR. 12
A. All financial models are subject to various assumptions and constraints. To account 13
for this reality, equity analysts and investors tend to use multiple methods to develop 14
their return requirements. I used three widely accepted approaches to develop my 15
ROE recommendation: (1) the Discounted Cash Flow (“DCF”) model, including 16
Quarterly Growth and Constant Growth; (2) the Capital Asset Pricing Model 17
(“CAPM”); and (3) the Bond Yield Plus Risk Premium approach.2 In addition, my 18
recommendation considers a variety of factors such as prevailing capital market 19
conditions and the specific risks and circumstances faced by ENSTAR. Because the 20
1 Throughout my direct testimony I will interchangeably use the terms “ROE” and “Cost of Equity.” For purposes of my direct testimony those terms are synonymous.
2 See Exhibits RBH-2 through RBH-7.

PREFILED DIRECT TESTIMONY OF ROBERT B. HEVERT Docket No. U-16-___: June 1, 2016 Page 6 of 68
application of financial models and interpretation of their results often is the subject 1
of differences among analysts in regulatory proceedings, I believe that it is important 2
to review and consider a variety of data points; doing so enables us to put in context 3
quantitative analyses and ROE recommendations, which should reflect the specific 4
risks faced by ENSTAR. 5
As I will discuss later in my direct testimony, the Regulatory Commission of 6
Alaska (“RCA”) has historically approved ROEs for ENSTAR that are a premium 7
above ROEs for local gas distribution utilities in the United States. This is entirely 8
appropriate for a number of reasons. Importantly, ENSTAR is not simply a local gas 9
distribution company, but also a pipeline transmission company. This fact alone 10
distinguishes ENSTAR from most natural gas distribution utilities. Additionally, 11
ENSTAR faces specific risks and circumstances that, taken as a whole, create a 12
unique risk profile that is unlike any other gas utility in the United States. These 13
additional factors include: (1) the current and prospective local economic conditions 14
in Alaska; (2) the risk associated with declining average use per customer; (3) risk 15
associated with weather variations; (4) the structural regulatory lag that ENSTAR 16
faces; (5) ENSTAR’s relatively small operations in a remote environment; and (6) 17
ENSTAR’s natural gas supply risk given its limited supply options. It is entirely 18
appropriate for the RCA to consider these factors when approving an ROE for 19
ENSTAR, and I will discuss each of these factors in my direct testimony. ENSTAR 20
witnesses Messrs. Jared Green and Daniel Dieckgraeff also discuss certain of these 21
factors in their respective direct testimonies, and I rely on their testimony in support 22
of my analysis. Although I did not make explicit adjustments to my ROE estimates 23

PREFILED DIRECT TESTIMONY OF ROBERT B. HEVERT Docket No. U-16-___: June 1, 2016 Page 7 of 68
for these factors, I did take them into consideration in determining the range in which 1
the Company’s Cost of Equity likely falls. 2
Based on my analysis, I believe an ROE in the range of 12.50 percent to 14.00 3
percent is reasonable and appropriate for ENSTAR. As discussed throughout my 4
direct testimony, the Company’s overall risk profile is unlike any other gas utility in 5
the United States. In addition, as discussed in the direct testimony of ENSTAR 6
witness Mr. Green, the Company has made significant recent capital investment to 7
operate and maintain its pipeline system and must continue to attract capital for future 8
investment. The Company’s previously adjudicated ROE falls within the 9
recommended range, and any departure from the recommended range would not be 10
supported by the objective evidence and would be incompatible with the principles of 11
regulatory consistency. 12
In addition to my recommendation regarding the ROE for ENSTAR, I also 13
provide my assessment of ENSTAR’s capital structure and cost of debt. The 14
Company’s capital structure, which includes 51.68 percent common equity and 48.32 15
percent long-term debt, is consistent with those in place at comparable companies. I 16
conclude that the Company’s capital structure is consistent with industry practice and, 17
therefore, reasonable and appropriate. Lastly, I note that the Company’s 5.03 percent 18
cost of debt is consistent with the prevailing yields at the times of issuance and, 19
therefore, reasonable. 20
Q. How is the remainder of your direct testimony organized? 21
A. The remainder of my direct testimony is organized as follows: 22

PREFILED DIRECT TESTIMONY OF ROBERT B. HEVERT Docket No. U-16-___: June 1, 2016 Page 8 of 68
Section III – Regulatory guidelines and financial considerations pertinent to 1
the development of the cost of capital; 2
Section IV – Company’s specific business risks to consider when developing 3
Cost of Equity analyses; 4
Section V – Proxy group selection used to develop my analytical results; 5
Section VI – Analyses and the analytical bases for my ROE recommendation; 6
Section VII – Other considerations that have a direct bearing on the 7
Company’s Cost of Equity; 8
Section VIII – Current capital market conditions and their effect on the 9
Company’s Cost of Equity; 10
Section IX – Reasonableness of the Company’s capital structure; 11
Section X – Company’s cost of debt; and 12
Section XI – Conclusions and recommendations. 13
III. REGULATORY GUIDELINES AND FINANCIAL CONSIDERATIONS 14
Q. Please provide a brief summary of the guidelines established by the Supreme 15
Court of the United States (the “Court”) for the purpose of determining ROE. 16
A. The Court established the guiding principles for establishing a fair return for capital 17
in two cases: (1) Bluefield Water Works and Improvement Co. v. Public Service 18
Comm’n of West Virginia (Bluefield); and (2) Federal Power Comm’n v. Hope 19
Natural Gas Co. (Hope). In those cases, the Court recognized that the fair rate of 20
return on equity should be: (1) comparable to returns investors expect to earn on other 21
investments of similar risk; (2) sufficient to assure confidence in the company’s 22

PREFILED DIRECT TESTIMONY OF ROBERT B. HEVERT Docket No. U-16-___: June 1, 2016 Page 9 of 68
financial integrity; and (3) adequate to maintain and support the company’s credit and 1
to attract capital. 2
Q. Does Alaska precedent provide similar guidance? 3
A. Yes, the Commission cited the Hope and Bluefield decisions in its determination of 4
the Cost of Equity in prior cases.3 Based on those standards, the authorized ROE 5
should provide the Company with the opportunity to earn a fair and reasonable return 6
and should enable efficient access to external capital under a variety of market 7
conditions. 8
Q. Why is it important for a utility to be allowed the opportunity to earn a return 9
adequate to attract equity capital at reasonable terms? 10
A. A return that is adequate to attract capital at reasonable terms enables the utility to 11
provide safe and reliable service while maintaining its financial integrity. In keeping 12
with the Hope and Bluefield standards, that return should be commensurate with the 13
returns expected elsewhere in the market for investments of equivalent risk. The 14
intended consequence of the Commission’s order in this case, therefore, should be to 15
provide ENSTAR with the opportunity to earn a return on equity that is: (1) adequate 16
to attract capital at reasonable terms; (2) sufficient to ensure its financial integrity; 17
and (3) commensurate with returns on investments in enterprises having 18
corresponding risks. To the extent ENSTAR is provided a reasonable opportunity to 19
earn its market-based Cost of Equity, neither customers nor shareholders should be 20
3 See, e.g., Alaska Public Utilities Commission v. Greater Anchorage Area Borough, 534 P.2d 549, 558 n.26 (Alaska 1975); In the Matter of the Tariff Revision Designated as TA28-358 Filed by Potter Creek Water Company for an Increase in Rates for Its Water Service, Docket No. U-08-63, Order No. 6, July 14, 2009, at 20.

PREFILED DIRECT TESTIMONY OF ROBERT B. HEVERT Docket No. U-16-___: June 1, 2016 Page 10 of 68
disadvantaged. In fact, a return that is adequate to attract capital at reasonable terms 1
enables ENSTAR to provide safe, reliable natural gas utility service while 2
maintaining its financial integrity. ENSTAR witness Mr. Green further discusses the 3
need for ENSTAR to attract capital to Alaska. 4
IV. BUSINESS RISKS 5
Q. Please provide a summary profile of ENSTAR. 6
A. ENSTAR provides natural gas distribution service to approximately 141,000 7
customers in Alaska. ENSTAR purchased approximately 30 billion cubic feet of 8
natural gas from Cook Inlet producers in 2015 and delivered that gas through its 9
transmission and distribution system to residential, commercial, and industrial 10
customers in the areas served by the Company. ENSTAR also transports natural gas 11
through its transmission system for large users such as power generation facilities, 12
natural gas producers, and for the Fairbanks distribution utility. SEMCO, of which 13
ENSTAR is a division, issues debt to support ENSTAR’s investment and operations 14
and currently has long-term issuer (or corporate) rates from Moody’s Investors 15
Service (“Moody’s”) of Baa1 and Standard & Poor’s (“S&P”) of BBB.4 As noted in 16
the direct testimony of ENSTAR witness Mr. Green, since the last authorized ROE, 17
ENSTAR has made significant infrastructure investments designed to ensure the 18
ongoing safe and reliable delivery of natural gas. Much of this new investment has 19
been made in ENSTAR’s transmission system and, in fact, the Company’s current net 20
plant is comprised of approximately 42 percent transmission plant. 21
4 Sources: SNL Financial and Company provided data.

PREFILED DIRECT TESTIMONY OF ROBERT B. HEVERT Docket No. U-16-___: June 1, 2016 Page 11 of 68
Q. What ENSTAR specific risk factors did you consider when selecting your proxy 1
groups and performing your Cost of Equity analyses? 2
A. As I mentioned earlier, in selecting my proxy group I considered the fact that 3
ENSTAR is both a transmission pipeline utility and a local gas distribution utility. I 4
also considered: (1) the current and prospective local economic conditions in Alaska; 5
(2) the risk associated with declining average use per customer; (3) risk associated 6
with weather variations; (4) the structural regulatory lag that ENSTAR faces; (5) 7
ENSTAR’s relatively small operations in a remote, and sometimes unforgiving, 8
environment; and (6) ENSTAR’s natural gas supply risk given its limited supply 9
options. Although other gas utilities may face similar risk factors to one degree or 10
another, when taken as a whole, these risk factors create a unique risk profile that 11
must be considered if we are to arrive at an appropriate and compensatory Cost of 12
Equity for ENSTAR. 13
A. Transmission and Distribution Utility Operations 14
Q. Please summarize ENSTAR’s transmission and distribution utility operations 15
and the challenge of selecting a proxy group that is representative of its 16
operational characteristics. 17
A. As discussed in the direct testimony of ENSTAR witness Mr. Green, ENSTAR 18
functions as a natural gas transmission utility and as a natural gas local distribution 19
utility. It is my understanding that more than 40 percent of ENSTAR’s existing rate 20
base is invested in transmission-related assets. That factor affects my analysis in two 21
material ways. First, the diversity and complexity of operations are greater than those 22
of many utilities that are solely or principally dedicated to either long-haul 23
transmission service or to local distribution service. Although the Company’s 24

PREFILED DIRECT TESTIMONY OF ROBERT B. HEVERT Docket No. U-16-___: June 1, 2016 Page 12 of 68
transmission and distribution operations must operate together to provide quality 1
service to transportation, industrial, commercial, and residential customers, each 2
system has unique characteristics and challenges, the result of which is increased 3
operating risk. 4
Second, because ENSTAR is a hybrid transmission and distribution utility 5
operating in a challenging environment, it is difficult to find comparable gas utilities 6
with a similar risk profile. In establishing my proxy group, I have considered the 7
hybrid nature of ENSTAR and have developed a proxy group that, on balance, is 8
indicative of ENSTAR’s diverse operational characteristics. I will discuss the details 9
of my proxy group later in my direct testimony. It is important to note, however, that 10
even the hybrid proxy group does not fully encompass the risk factors unique to 11
ENSTAR, all of which must be considered. 12
B. Economic Conditions Risk 13
Q. Did you consider the current and prospective economic conditions in Alaska in 14
arriving at your ROE recommendation? 15
A. Yes, I did. 16
Q. Please summarize your analyses and conclusions. 17
A. I reviewed three different economic indicators relating to the Alaska economy in my 18
evaluation: unemployment rates; real gross domestic product; and population figures. 19
Whereas the rate of unemployment has fallen dramatically in the U.S. since 2010, the 20
unemployment rate in Alaska has remained fairly constant. By March 2016, Alaska’s 21
unemployment rate had only fallen by 18 percent since the 2010 peak, whereas the 22
national rate had fallen nearly 50 percent. (See Chart 1, below). In 2010, the 23
unemployment rate in the areas served by ENSTAR reached almost 8.80 percent 24

PREFILED DIRECT TESTIMONY OF ROBERT B. HEVERT Docket No. U-16-___: June 1, 2016 Page 13 of 68
(over 0.80 percentage points higher than the State-wide average); by March 2016, it 1
had decreased to approximately 7.01 percent (0.48 percentage points higher than the 2
State-wide average). 3
Chart 1: Unemployment Rates – Rolling Average5 4
5
Looking to Real Gross Domestic Product (“GDP”), since 2010, U.S. GDP 6
growth has remained fairly constant compared to the more volatile Alaskan GDP 7
growth (see Chart 2, below). The sharp decline in Alaska’s GDP growth in 2013 8
through 2014 primarily has been due to the struggling oil and gas sector.6 As a 9
consequence, the State of Alaska faces a significant budget shortfall. In 2012, oil 10
revenues represented 73 percent of all State revenue. However, as oil revenues 11
declined by approximately $2.5 billion in 2013, they represented only 47 percent of 12
5 Source: Bureau of Labor Statistics, St. Louis Federal Reserve.
6 Alaska Division of Economic Development. 2013 Alaska Economic Performance Report.

PREFILED DIRECT TESTIMONY OF ROBERT B. HEVERT Docket No. U-16-___: June 1, 2016 Page 14 of 68
all State revenue.7 More recently, sustained low oil prices have continued to drive 1
increases to an expected State budget deficit of $4.10 billion.8 2
Chart 2: Real GDP Growth Rate – Rolling Average9 3
4
The Company also faces the issue of serving a population whose growth rate 5
is declining. Alaska’s population is projected to grow at an average annual rate of 6
0.84 percent for the next ten years, despite growing at an average rate of 1.01 percent 7
for the previous ten years. By 2025, the population is expected to grow at a rate of 8
less than 0.75 percent annually. 9
7 Alaska Oil and Gas Association, The Role of the Oil and Gas Industry in Alaska’s Economy, May 2014, at 30.
8 Alaska Dispatch News. Alaska budget deficit just jumped $300M because of low oil prices, Walker administration says. March 21, 2016.
9 Source: Bureau of Economic Analysis.

PREFILED DIRECT TESTIMONY OF ROBERT B. HEVERT Docket No. U-16-___: June 1, 2016 Page 15 of 68
Chart 3: State Population Growth Rates10 1
2
Based on the data presented above, I observe the following: 3
Alaska’s unemployment rate has only decreased by 0.15 percentage points 4
since its peak in 2010, such that as of March 2016, it stood at 6.60 percent; 5
the unemployment rate in the areas served by ENSTAR remains above the 6
national and State-wide averages by a large margin: as of March 2016, the 7
unemployment rate in the areas served by ENSTAR was 3.03 percent higher 8
than the national average; 9
the State’s GDP has been more volatile than the U.S. GDP and is heavily 10
dependent on the oil and gas sector; and 11
Alaska’s population growth rate is declining, which could affect the 12
Company’s ability to expand its customer base. 13
10 Source: Alaska Department of Labor & Workforce Development. Alaska Population Projections 2015 to 2045. April 2016.
0.00%
0.50%
1.00%
1.50%
2.00%
2.50%
2010 2016 2022 2028 2034 2040

PREFILED DIRECT TESTIMONY OF ROBERT B. HEVERT Docket No. U-16-___: June 1, 2016 Page 16 of 68
In addition to these observations, I have reviewed the direct testimony of ENSTAR 1
witness Mr. Jared Green and his discussion of the current state of the Alaskan 2
economy. 3
Q. Have you considered the economic conditions of ENSTAR’s service territory in 4
your estimated Cost of Equity? 5
A. Yes, I have. Based on the indicators discussed above, and those discussed by 6
ENSTAR witness Mr. Green, Alaska as a whole as well as the areas solely contained 7
within ENSTAR’s service area face a deteriorating economic climate. These factors 8
are likely to decrease sales, increase the likelihood of the company under-recovering 9
its fixed distribution costs, and increase uncollectible and bad debt expenses. 10
Furthermore, attracting capital at reasonable terms will become increasingly more 11
difficult. 12
C. Declining Average Use Per Customer Risk 13
Q. Is the Company exposed to risks associated with declining average use per 14
customer? 15
A. Yes, it is. As shown in Charts 4a and 4b, below, ENSTAR’s average use per 16
customer has declined (on average) by approximately 38 percent from 2004 to 2014, 17
and their average use per residential customer has declined (on average) by 18
approximately 20 percent over the same period. Of particular importance, the 19
average use per residential customer has declined 16 percent over the last three years. 20

PREFILED DIRECT TESTIMONY OF ROBERT B. HEVERT Docket No. U-16-___: June 1, 2016 Page 17 of 68
Chart 4a: Average Usage per Customer11 1
2
Chart 4b: Average Usage per Residential Customer12 3
4
This long-term trend has been driven by energy efficiency and conservation 5
programs,13 the construction of more energy efficient housing stock, and increased 6
11 Source: SNL Financial
12 Source: SNL Financial
13 See, e.g., Alaska Housing Finance Corporation, “Home Energy Rebate” Program; Alaska Energy Authority, “Renewable Energy Grant Fund.”

PREFILED DIRECT TESTIMONY OF ROBERT B. HEVERT Docket No. U-16-___: June 1, 2016 Page 18 of 68
customer awareness regarding the importance of energy conservation. Because gas 1
distribution rates are established based, in part, on test year demand levels, absent 2
some form of revenue stabilization, declining use per customer would diminish 3
revenues and substantially decrease the prospect of a utility earning its authorized 4
return. It is not surprising therefore, that the majority of utility operating companies 5
in the natural gas distribution industry have some form of revenue stabilization 6
mechanism in place. 7
Q. Have credit rating agencies recognized the risk associated with declining average 8
use per customer for natural gas distribution companies? 9
A. Yes. In its June 2006 Special Report on Revenue Decoupling (“RD”) and Local Gas 10
Distribution Companies, Moody’s discusses the role revenue decoupling plays in 11
protecting a gas utility’s gross margin from the effect of declining customer usage. 12
Moody’s further notes: 13
While RD may have originally begun as a regional concept in 14 certain jurisdictions, it has quickly become a nationwide 15 phenomenon that will challenge regulators and gas utilities 16 alike, as they seek to correct a structural imbalance in their rate 17 design that has become increasingly difficult to ignore.14 18
Moreover, based on actual rating actions, it appears that rating agencies will 19
not necessarily upgrade the credit rating of a utility after the approval of a decoupling 20
mechanism; however, a company without full revenue decoupling stands a greater 21
risk of potential downgrade. For example, in 2006, Moody’s stated that: 22
LDCs that have, or soon expect to have, RD stand a better 23 chance than others in being able to maintain their credit ratings 24
14 Local Gas Distribution Companies: Update on Revenue Decoupling and Implications for Credit Ratings, Moody’s, June 2006, at 152.

PREFILED DIRECT TESTIMONY OF ROBERT B. HEVERT Docket No. U-16-___: June 1, 2016 Page 19 of 68
or stabilize their credit outlook in face of adversity. This 1 difference between those companies that have RD and those 2 that do not will tend to be further accentuated as the credit 3 demarcation reflected through rating actions becomes more 4 evident.15 5
It is apparent, therefore, that rating agencies have viewed, and continue to view 6
decoupling mechanisms as the status quo for natural gas utilities. The implication is 7
that some form of revenue stabilization is expected, and companies without such 8
protection may be susceptible to negative actions from the rating agencies. 9
Q. Are revenue stabilization mechanisms common in the industry? 10
A. Yes, they are. Natural gas utilities across the country have implemented various 11
forms of revenue decoupling mechanisms, fixed monthly charges, rate adjustment 12
mechanisms, and return stabilization structures as a means of addressing the financial 13
implications of the continued declining use per customer. Gas distribution utilities 14
lacking such structures are exposed to a comparatively higher level of risk. 15
As shown in Exhibit RBH-9, more than half of all investor-owned natural gas 16
utility companies have some form of revenue decoupling mechanism or straight 17
fixed-variable rate design for a portion of their natural gas operations. In addition, 18
approximately 79 percent of all investor-owned natural gas utilities employ other 19
forms of revenue stabilization mechanisms, such as adjustment clauses for 20
environmental compliance costs, conservation costs, or costs associated with the 21
construction of delivery infrastructure. In fact, 95 percent of investor-owned natural 22
15 Ibid, at 147.

PREFILED DIRECT TESTIMONY OF ROBERT B. HEVERT Docket No. U-16-___: June 1, 2016 Page 20 of 68
gas utilities have in place at least one revenue stabilization mechanism, whereas 1
ENSTAR has none. 2
To the extent the regulatory framework provides a degree of mitigation of a 3
given incremental risk, that framework serves to place the utility in the same position 4
it would be in absent that risk. Given the prevalence of revenue stabilization 5
mechanisms employed by natural gas utilities, and in light of the Company’s 6
historical inability to gain approval of comparable mechanisms, ENSTAR is 7
disadvantaged relative to other natural gas utilities in its ability to mitigate certain 8
risks through its regulatory framework. As such, the Company’s ability to mitigate 9
such risks is inconsistent with most natural gas utility companies, and therefore this 10
adversely affects the Company’s risk profile. 11
Q. What are your conclusions regarding the effect of declining average use per 12
customer on the Company’s risk profile relative to the industry? 13
A. First, the majority of natural gas distribution companies have some form of revenue 14
stabilization mechanism in place. As also mentioned earlier, ENSTAR’s use per 15
customer declined 38 percent from 2004 through 2014, which indicates that it is 16
exposed to considerable risk due to erosions in revenues, earnings, and cash flows. 17
All else being equal, that erosion would reduce the Company’s credit metrics (in 18
particular, the funds flow-based ratios), putting further pressure on its financial 19
profile and leading to potentially higher costs of debt. From the perspective of equity 20
investors, the incremental reduction in revenue and earnings resulting from declining 21
use per customer may reduce expected returns and cash flows relative to otherwise-22
comparable investments. 23

PREFILED DIRECT TESTIMONY OF ROBERT B. HEVERT Docket No. U-16-___: June 1, 2016 Page 21 of 68
D. Weather Risk 1
Q. Please summarize the risk posed by yearly weather variations. 2
A. Weather risk leads to cash flow and earnings variability from season to season and 3
year to year due to variability in temperatures. Because the demand for natural gas is 4
correlated to heating degree days (i.e., colder temperatures result in greater demand), 5
gas utility revenues and cash flows are dependent on weather. 6
Q. Do investors recognize the risks associated with weather? 7
A. Yes, investors are aware of the relationship between seasonal weather, heating degree 8
days and natural gas distribution operations. For example, in describing the natural 9
gas industry, Value Line stated: 10
Weather is a factor that affects demand for natural gas, 11 especially from small commercial businesses and consumers. 12 Of course, annual revenue and income are subject to seasonal 13 temperature patterns, with demand highest during the winter 14 heating months. Unseasonably warm (raising air conditioning 15 requirements) or cold weather can cause much volatility in 16 quarterly operating results.16 17
Q. How does ENSTAR’s weather risk compare to the natural gas distribution 18
industry? 19
A. The effect of weather risk for ENSTAR is more severe than other natural gas utilities 20
because the Company does not have a weather normalization clause or other form of 21
rate protection against extreme weather variation. Given the climate in which the 22
Company operates, that effect is more pronounced relative to natural gas utilities in 23
the Lower 48. To the extent the Company experiences a warmer than normal winter 24
heating season, it faces the risk of significant under-recovery of its fixed costs since a 25
16 Value Line Investment Survey, “Industry Overview: Natural Gas Utility” (accessed March 18, 2016).

PREFILED DIRECT TESTIMONY OF ROBERT B. HEVERT Docket No. U-16-___: June 1, 2016 Page 22 of 68
substantial portion of those costs continue to be recovered through volumetric 1
charges. Many natural gas utilities have existing or pending revenue stabilization 2
mechanisms in place to manage the fluctuations in sales volume due to weather. 3
According to a review undertaken by the American Gas Association (“AGA”), 4
natural gas utility companies in 22 states employ some form of revenue stabilization 5
mechanism to mitigate volumetric uncertainty due to weather.17 Again, ENSTAR 6
does not. As such, a significant portion of the Company’s fixed costs remain 7
vulnerable to under-recovery from volumetric uncertainty due to weather. 8
Q. What are your conclusions regarding the effect of the weather uncertainty on the 9
Company’s risk profile relative to the industry? 10
A. ENSTAR is exposed to the risk of under-recovering its fixed distribution costs due to 11
decreased sales attributable to abnormal weather and, therefore, is exposed to a 12
greater risk of not earning its required return. Consequently, investors would require 13
a higher return as compensation for the higher level of financial and operating 14
variability. That incremental risk and required return suggests that ENSTAR’s risk 15
profile is more similar to natural gas transmission companies, which share similar 16
levels of financial and operating variability. 17
17 See American Gas Association, Innovative Rates, Non-Volumetric Rates, and Tracking Mechanisms: Current List, February 2016.

PREFILED DIRECT TESTIMONY OF ROBERT B. HEVERT Docket No. U-16-___: June 1, 2016 Page 23 of 68
Q. Isn’t it possible that the weather risk could actually work to the advantage of the 1
Company, for example, in the event of a very cold winter? 2
A. Yes, it is. The important thing to remember, however, is that without some sort of 3
weather normalization, the risk is still there, and should be taken into account when 4
considering the overall risk profile of ENSTAR when comparing it to other utilities. 5
E. Structural Regulatory Lag Risk 6
Q. Please explain “regulatory lag” and its effect on capital attraction. 7
A. Regulatory lag refers to the length of time between the investment of funds on the 8
part of a utility, and the recovery of those funds through rates. When a utility invests 9
in assets needed to provide service, and that investment is not included in rate base 10
until a subsequent rate proceeding, absent growth in revenue or reduction in other 11
costs, the utility’s cash flows will be diminished as a result of regulatory lag. The 12
larger the capital expenditures, the larger the magnitude of the effect on cash flows 13
from regulatory lag. The use of an historical test year, or delays in determining 14
elements of the overall cost of service further exacerbate the effect of regulatory lag.15
As the lag period increases, the utility faces greater risk due to financial 16
uncertainty. Moody’s, for example, considers timely cost recovery as an important 17
determinant of credit quality, stating that: 18
The ability to recover prudently incurred costs on a timely 19 basis and to attract debt and equity capital are crucial credit 20 considerations […] In a sector that is typically free cash flow 21 negative (due to large capital expenditures and dividends) and 22 that routinely needs to refinance very large maturities of long-23 term debt, investor concerns about a lack of timely cost 24 recovery or the sufficiency of rates can, in an extreme scenario, 25

PREFILED DIRECT TESTIMONY OF ROBERT B. HEVERT Docket No. U-16-___: June 1, 2016 Page 24 of 68
strain access to capital markets and potentially lead to 1 insolvency of the utility.18 2
The effects of regulatory lag on earned equity returns can be viewed in the 3
context of the DuPont model and in particular, relative to the Return on Assets. That 4
is, to the extent that assets increase but revenues do not increase in a commensurate 5
fashion, the earned return on common equity will be diluted. Although that dilution 6
is a concern to debt investors, the effect on earnings, which is the basis of relative 7
valuation measures (for example, the Price/Earnings, and Price/Book ratios) may 8
have a more concentrated effect on equity investors. 9
Regulatory lag, if significant, can create a cycle in which earnings and cash 10
flows are diluted, thereby diminishing the ability to attract capital at reasonable terms. 11
Left unmitigated, those higher capital costs would further dilute returns. 12
Q. How does regulatory lag affect ENSTAR compared to other utilities? 13
A. All utilities are exposed to regulatory lag at one level or another. Due to certain 14
structural issues with how Alaska sets rates for utilities, however, ENSTAR and other 15
Alaska utilities face regulatory lag issues that, when taken as a whole, are more 16
challenging than most. These include: (1) use of historical, as opposed to projected, 17
test year data; (2) frequent use of a thirteen-month average rate base as opposed to 18
test year-end rate base; (3) absence of an investment tracker or similar mechanism to 19
facilitate timely recovery; and (4) the lengthy rate case process, which as a practical 20
matter, can take up to two years considering the time necessary to close test year 21
books and prepare a rate case for filing. While Alaska does provide for an 22
18 Moody’s Investor Service, Rating Methodology: Regulated Electric and Gas Utilities, December 23, 2013, at 15.

PREFILED DIRECT TESTIMONY OF ROBERT B. HEVERT Docket No. U-16-___: June 1, 2016 Page 25 of 68
opportunity to request interim rates in certain circumstances, interim rates only serve 1
to lessen, not eliminate, the overall structural regulatory lag. ENSTAR witnesses 2
Messrs. Green and Dieckgraeff, discuss certain of the factors relating to regulatory 3
lag in their respective direct testimonies. As noted by Mr. Green, since its last rate 4
case filing ENSTAR has made significant infrastructure investments designed to 5
ensure the ongoing safe and reliable delivery of natural gas. 6
Q. Please explain how the use of a historical year-end test period affects the 7
regulatory assessment of a utility. 8
A. A test period is intended to closely match the period for which rates are set. When 9
investments are placed in service subsequent to the test period, if economic 10
conditions have changed, investors may not fully recover costs until rates are 11
changed. The use of a future test period, or at the very least, a historical year-end test 12
period, is one method for reducing uncertainty and ensuring that rates are set based on 13
the most current information. To the extent ENSTAR’s ability to recover costs on a 14
timely basis differs from other utility companies, its risk profile likewise will differ, 15
which is a factor to be considered in establishing the Company’s ROE. 16
F. Operating Environment and Size Risk 17
Q. Please explain the risks associated with the Company’s operating environment 18
and small size. 19
A. ENSTAR’s geographically isolated location in a comparatively harsh climate 20
represents an incremental risk relative to natural gas utilities located elsewhere in the 21
United States. Given the Company’s comparatively remote geographic location and 22
uncertain weather, capital and maintenance projects are inherently complex. In 23
particular, supplies are more limited, more expensive due to shipping costs over long 24

PREFILED DIRECT TESTIMONY OF ROBERT B. HEVERT Docket No. U-16-___: June 1, 2016 Page 26 of 68
distances, and take longer to procure, causing supply chain disruptions that can be 1
difficult to resolve. Consequently, Alaska tends to be a higher cost environment 2
relative to elsewhere in the United States.19 These factors are exacerbated by the 3
current and prospective economic conditions described later in my testimony. 4
As to the Company’s size, both the financial and academic communities have 5
long accepted the proposition that the Cost of Equity for small firms is subject to a 6
“size effect.”20 While empirical evidence of the size effect often is based on studies 7
of industries beyond regulated utilities, utility analysts also have noted the risks 8
associated with small market capitalizations. Specifically, Ibbotson Associates noted: 9
“For small utilities, investors face additional obstacles, such as a smaller customer 10
base, limited financial resources, and a lack of diversification across customers, 11
energy sources, and geography. These obstacles imply a higher investor return.”21 12
Q. How does the operating environment and comparatively small size of ENSTAR 13
affect its business risks relative to the proxy group of companies? 14
A. In general, geographically isolated and smaller companies are less able to withstand 15
adverse events that affect their revenues and expenses. Capital expenditures for non-16
revenue producing investments such as system maintenance and replacements will 17
put proportionately greater pressure on customer costs, potentially leading to 18
19 See, e.g., United States Census Bureau, Cost of Living Index-Selected Urban Areas: Annual Average 2010.
20 See Mario Levis, The record on small companies: A review of the evidence, Journal of Asset Management, March 2002, at 368-397, for a review of literature relating to the size effect.
21 Michael Annin, Equity and the Small-Stock Effect, Public Utilities Fortnightly, October 15, 1995.

PREFILED DIRECT TESTIMONY OF ROBERT B. HEVERT Docket No. U-16-___: June 1, 2016 Page 27 of 68
customer attrition or demand reduction. These risks affect the return required by 1
investors for smaller companies. 2
Q. How does ENSTAR compare in size to the proxy companies you have selected? 3
A. ENSTAR is significantly smaller than the companies that make up the proxy group. 4
Exhibit RBH-8 estimates the implied market capitalization for ENSTAR (i.e., the 5
implied market capitalization if ENSTAR were a stand-alone, publicly traded entity). 6
Because ENSTAR is not a separately traded entity, an estimated stand-alone market 7
capitalization for ENSTAR must be calculated. The implied market capitalization of 8
ENSTAR is calculated by applying the median market-to-book ratios for the proxy 9
group of 1.86 to the Company’s implied total common equity of approximately $148 10
million.22 The implied market capitalization based on that calculation is $276 11
million, which is less than 9 percent of the proxy group median of $3.39 billion. 12
Q. How did you estimate the effect of the Company’s size on the Cost of Equity? 13
A. In its Risk Premia Over Time Report: 2015, Morningstar Inc. (“Morningstar”) 14
presents its calculation of the size premium for deciles of market capitalizations 15
relative to the S&P 500 Index. An estimate of the size premium associated with 16
ENSTAR, therefore, is the difference in the Morningstar size risk premiums for the 17
proxy group median market capitalization relative to the implied market capitalization 18
for ENSTAR. 19
As shown on Exhibit RBH-8, the median market capitalization of the proxy 20
group of $3.39 billion corresponds to the 5th decile of Morningstar’s market 21
22 Equity value of ENSTAR is estimated from proposed rate base and its capital structure.

PREFILED DIRECT TESTIMONY OF ROBERT B. HEVERT Docket No. U-16-___: June 1, 2016 Page 28 of 68
capitalization data and a size premium of 1.65 percent (or 165 basis points). The 1
implied market capitalization for ENSTAR is approximately $276 million, which 2
falls within the 10th decile and a size premium of 5.72 percent (or 572 basis points). 3
The difference between those size premiums is 407 basis points (4.07 percent). 4
Q. How does ENSTAR’s geographically isolated operating environment and 5
comparatively small size affect its Cost of Equity in your analysis? 6
A. While I have quantified the small size effect, rather than proposing a specific 7
adjustment I have considered both the operating environment and small size of 8
ENSTAR in my assessment of business risks in order to determine where, within a 9
reasonable range of returns, ENSTAR’s required ROE appropriately falls. In that 10
regard, ENSTAR’s geographic isolation and comparatively small size further suggest 11
that the Company’s risk profile is different from those of other natural gas utilities. 12
G. Gas Supply Risk 13
Q. Please describe the risks that can be associated with natural gas supply. 14
A. When all natural gas is sourced from a single geographic production area with no 15
connections to an interstate pipeline system or other natural gas sources, there is a 16
risk that supply will not be available when needed. Unlike natural gas companies in 17
other states, ENSTAR’s natural gas supply is entirely dependent on producers in a 18
single supply region, i.e., the Cook Inlet. This geographic isolation is of particular 19
concern because, to the extent that the Company’s supply needs are not met, 20
ENSTAR must seek alternative supply options such as importing natural gas or 21
constructing a pipeline to a new supply source. 22
Natural gas supply risks become more pronounced when customer 23
requirements change. For example, in 2006, Fairbanks Natural Gas (“FNG”) filed an 24

PREFILED DIRECT TESTIMONY OF ROBERT B. HEVERT Docket No. U-16-___: June 1, 2016 Page 29 of 68
Emergency Complaint for Service to request ENSTAR to provide natural gas service 1
to FNG.23 In the event that ENSTAR must meet the needs of unanticipated service 2
requests, gas supplied to other ENSTAR customers in such situations could be 3
curtailed or disrupted unless the Company is able to procure additional supplies. 4
Given the limited supply sources in the region, meeting emergency supply requests in 5
the future could have adverse effects on ENSTAR customers. 6
Q. What are the risks associated with the lack of geographic diversity in a utility’s 7
supply portfolio? 8
A. Geographic diversity in gas supply portfolios reduces the risk of gas supply 9
interruption and reduces the potential adverse effects of swings in prices due to 10
regional events. Because the Company’s gas supply is dependent on a single region, 11
the stand-alone risk of each gas supply contract is similar. Further, because the 12
Company cannot access other supply regions, its entire supply source is subject to the 13
same geographic risks and constraints; there is no diversification of risks over a 14
variety of supply sources. 15
Whereas natural gas utilities in the Lower 48 are able to access natural gas 16
supplies from various regions through liquid markets and an extensive pipeline 17
network, ENSTAR’s supply portfolio is dependent on a single production region and 18
contracts with limited natural gas producers. Because the Company operates in a 19
location that is geographically isolated, it does not have access to the diversification 20
benefits associated with access to a variety of sources of gas. Without a 21
23 See In the Matter of the Emergency Complaint for Service by Fairbanks Natural Gas, LLC, Against ENSTAR Natural Gas Company, a Division of Semco Energy Inc., Docket No. U-06-105, Emergency Complaint for Service, September 19, 2006.

PREFILED DIRECT TESTIMONY OF ROBERT B. HEVERT Docket No. U-16-___: June 1, 2016 Page 30 of 68
geographically diversified gas supply portfolio, the Company is dependent on 1
sustained investment from Cook Inlet natural gas producers. Absent sustained 2
production from these producers or a North Slope pipeline, the Company must seek 3
alternative supply options such as importing LNG, or investing in gas transportation 4
infrastructure to another supply region, which would represent a significant increase 5
in the delivered cost of gas. Increases to the cost of gas will increase the likelihood of 6
the Company under-recovering its distribution costs due to decreased sales. As such, 7
this represents a substantial risk to ENSTAR relative to other natural gas utilities. 8
ENSTAR witness Mr. Green further discusses the risks associated with a lack of 9
supplier diversity. 10
V. PROXY GROUP SELECTION 11
Q. As a preliminary matter, why is it necessary to select a group of proxy 12
companies to determine the Cost of Equity for the Company? 13
A. Since the ROE is a market-based concept, and ENSTAR is not a publicly-traded 14
entity, it is necessary to establish a group of comparable publicly-traded companies to 15
serve as its “proxy.” Even if ENSTAR were a publicly traded entity, short-term 16
events could bias its market value during a given period of time. A significant benefit 17
of using a proxy group is that it serves to moderate the effects of anomalous, 18
temporary events associated with any one company. 19
Q. Does the selection of a proxy group suggest that analytical results will be tightly 20
clustered around average (i.e., mean) results? 21
A. No. For example, the Constant Growth DCF approach defines the Cost of Equity as 22
the sum of the expected dividend yield and projected long-term growth. Despite the 23
care taken to ensure risk comparability, market expectations with respect to future 24

PREFILED DIRECT TESTIMONY OF ROBERT B. HEVERT Docket No. U-16-___: June 1, 2016 Page 31 of 68
risks and growth opportunities will vary from company to company. Therefore, even 1
within a group of similarly situated companies, it is common for analytical results to 2
reflect a seemingly wide range. Consequently, at issue is how to estimate a 3
Company’s ROE from within that range. That determination necessarily must 4
consider a wide range of both empirical and qualitative information. This is 5
especially important given the unique risks faced by ENSTAR. 6
Q. What are the implications of the Company’s business risks for its Cost of 7
Equity? 8
A. In Hope the Supreme Court stated that “the return to the equity owner should be 9
commensurate with the return on investments in other enterprises having 10
corresponding risks. That return, moreover, should be sufficient to assure confidence 11
in the financial integrity of the enterprise, so as to maintain its credit and to attract 12
capital.”24 13
As discussed above, and as discussed in the direct testimonies of Messrs. 14
Green and Dieckgraeff, ENSTAR’s operations are substantially different from natural 15
gas utilities located in the Lower 48. Section IV notes that ENSTAR faces 16
significantly higher business risks than any single natural gas distribution utility in the 17
Value Line universe of Natural Gas Distribution companies. For example (and as 18
discussed earlier), in addition to providing local distribution service, ENSTAR owns, 19
operates, and maintains pipelines for the purpose of providing transmission from the 20
Cook Inlet supply fields to its distribution system. Further, ENSTAR’s 21
24 Hope, 320 U.S. at 603. See Bluefield, 262 U.S. at 692.

PREFILED DIRECT TESTIMONY OF ROBERT B. HEVERT Docket No. U-16-___: June 1, 2016 Page 32 of 68
geographically isolated location in a comparatively harsh climate represents an 1
incremental risk relative to natural gas utilities located elsewhere in the United States. 2
As a result, comparing ENSTAR solely to other natural gas local distribution 3
companies in the United States, which do not have transmission assets, would be 4
inappropriate. 5
Consistent with the principles established in Hope, and in order to provide a 6
return to equity holders that is truly risk appropriate, it is reasonable to consider a 7
proxy group of companies with a commensurate level of risk. As noted above, the 8
Company’s risk profile is unique among natural gas utilities. As a consequence, 9
ENSTAR’s authorized ROE has consistently included a premium relative to natural 10
gas utilities located in the Lower 48 (see Chart 5, below), which is consistent with 11
ENSTAR’s specific risk profile. 12
Chart 5: Summary of Adjudicated ROEs25 13
14
25 Source: Regulatory Research Associates and Company-provided information.

PREFILED DIRECT TESTIMONY OF ROBERT B. HEVERT Docket No. U-16-___: June 1, 2016 Page 33 of 68
Q. How did you select the companies included in your proxy group? 1
A. I began with companies that Value Line classifies as Natural Gas Utilities, Oil/Gas 2
Distribution, Natural Gas Diversified, or Pipeline Master Limited Partnerships 3
(“MLPs”). I then applied the following screening criteria: 4
Companies were excluded that do not consistently pay quarterly cash 5
dividends; 6
All of the companies in the proxy group are covered by at least two utility 7
industry equity analysts; 8
All of the companies in the proxy group have investment grade senior 9
unsecured bond and/or corporate credit ratings from Standard & Poor’s 10
(“S&P”); 11
To ensure that the proxy group represents regulated natural gas transmission 12
or distribution operations, I included companies with at least 40 percent of 13
consolidated net operating income derived from United States based regulated 14
natural gas pipeline operations or natural gas utility operations; and 15
Companies were eliminated that are currently known to be party to a merger, 16
or other significant transaction. 17
Q. Are these the same proxy group selection criteria you applied in the Company’s 18
last rate case? 19
A. No, they are not. In ENSTAR’s last case (Docket No. U-14-111), I did not include 20
natural gas local distribution utilities in my proxy group because the Company’s risk 21
profile was substantially different from those utilities operating elsewhere in the 22
United States. While I still believe this to be the case, as demonstrated by the specific 23

PREFILED DIRECT TESTIMONY OF ROBERT B. HEVERT Docket No. U-16-___: June 1, 2016 Page 34 of 68
business risks I discussed previously, three other witnesses in ENSTAR’s last rate 1
case offered testimony on the Cost of Equity and considered (at least in part) the 2
analytical results of natural gas utility distribution companies in the Lower 48. Given 3
that ENSTAR is a hybrid system with both transmission and distribution assets and 4
functions, I don’t disagree that the consideration of other distribution companies has 5
some relevance. But, it is still critical to recognize the transmission component of 6
ENSTAR’s system, and also the specific risks it faces. Given this, I have selected a 7
proxy group that is a hybrid of transmission and distribution utilities, which on the 8
whole is more reflective of the actual investment and operating characteristics of 9
ENSTAR. 10
Q. Why did you choose 40 percent as the appropriate threshold for whether a given 11
company is primarily engaged in the regulated natural gas transmission or 12
distribution business? 13
A. The proxy group should consist of companies with risk profiles fundamentally 14
comparable to the subject company. As described above, ENSTAR’s risk profile is 15
most similar to companies with substantial regulated natural gas transmission or 16
distribution operations. In choosing the appropriate percentage threshold of net 17
operating income and assets, my objective was to balance the competing interests of 18
setting the percentage high enough such that it captures those companies that are 19
primarily engaged in gas transmission or distribution, while at the same time ensuring 20
that there is a sufficient number of companies in the proxy group. Based on these two 21
considerations, I determined that 40 percent was an appropriate percentage for that 22
screening criterion. 23

PREFILED DIRECT TESTIMONY OF ROBERT B. HEVERT Docket No. U-16-___: June 1, 2016 Page 35 of 68
Q. What companies met those screening criteria? 1
A. The criteria discussed above resulted in a proxy group of the following fourteen 2
companies: 3
Table 1: Proxy Group Screening Results 4
Company Ticker
Atmos Energy ATO
Boardwalk Pipeline Partners, L.P. BWP
Dominion Midstream Partners, L.P. DM
EnLink Midstream Partners, L.P. ENLK
EQT Midstream Partners, L.P. EQM
New Jersey Resources Corporation NJR
Northwest Natural Gas Company NWN
Kinder Morgan Inc. KMI
Spectra Energy Partners, L.P. SEP
South Jersey Industries, Inc. SJI
Spire Inc. SR
Southwest Gas Corporation SWX
TC Pipelines, L.P. TCP
WGL Holdings, Inc. WGL
VI. COST OF EQUITY ESTIMATION 5
Q. Please briefly discuss the ROE in the context of the regulated rate of return. 6
A. Regulated utilities primarily use common stock and long-term debt to finance their 7
capital investments. The overall rate of return (“ROR”) weighs the costs of the 8
individual sources of capital by their respective book values. While the cost of debt 9
can be directly observed, the Cost of Equity is market-based and, therefore, must be 10
estimated based on observable market information. 11

PREFILED DIRECT TESTIMONY OF ROBERT B. HEVERT Docket No. U-16-___: June 1, 2016 Page 36 of 68
Q. How is the required ROE determined? 1
A. I estimated the ROE using analyses based on market data to quantify a range of 2
investor expectations of required equity returns. By their very nature, quantitative 3
models produce a range of results from which the market required ROE must be 4
estimated. That estimation must be based on a comprehensive review of relevant data 5
and information, and does not necessarily lend itself to a strict mathematical solution. 6
Consequently, the key consideration in determining the ROE is to ensure that the 7
overall analysis reasonably reflects investors’ view of the financial markets in general 8
and the subject company (in the context of the proxy companies) in particular. 9
Because the Cost of Equity is not directly observable, it must be estimated 10
based on both quantitative and qualitative information. Although a number of 11
empirical models have been developed for that purpose, all are subject to limiting 12
assumptions or other constraints. Consequently, many finance texts recommend 13
using multiple approaches to estimate the Cost of Equity.26 When faced with the task 14
of estimating the Cost of Equity, analysts and investors are inclined to gather and 15
evaluate as much relevant data as reasonably can be analyzed and, therefore, rely on 16
multiple analytical approaches. 17
As a practical matter, no individual model is more reliable than all others 18
under all market conditions. Therefore, it is both prudent and appropriate to use 19
multiple methodologies in order to mitigate the effects of assumptions and inputs 20
associated with any single approach. 21
26 See, e.g., Eugene Brigham and Louis Gapenski, Financial Management: Theory and Practice, 7th Ed., 1994, at 341; Tom Copeland, Tim Koller and Jack Murrin, Valuation: Measuring and Managing the Value of Companies, 3rd ed., 2000, at 214.

PREFILED DIRECT TESTIMONY OF ROBERT B. HEVERT Docket No. U-16-___: June 1, 2016 Page 37 of 68
Q. Is this approach consistent with the Commission’s practice? 1
A. Yes. I am aware that the Commission considered establishing regulations for the 2
purpose of determining cost of capital policies. While the Commission ultimately did 3
not pursue establishing such policies,27 it did acknowledge its past practices. In 4
particular, the Commission noted: 5
Many commissions, including the Federal Energy Regulatory 6 Commission, have adopted policies or provided guidance to 7 regulated utilities regarding the methods which should be used 8 for computing a utility’s return on equity. We have no such 9 policy. We have relied on the single stage discounted cash flow 10 (DCF) method as well as the capital asset pricing mechanism 11 (CAPM) and in certain cases we have allowed other methods.28 12
As such, I have relied on two forms of a single-stage DCF model (the 13
Quarterly and Constant Growth forms), the CAPM, and a Risk Premium approach. 14
A. Quarterly Growth DCF Model 15
Q. Are DCF models widely used in regulatory proceedings? 16
A. Yes. In my experience, the DCF model is widely recognized in regulatory 17
proceedings, as well as in financial literature. Nonetheless, neither the DCF nor any 18
other model should be applied without considerable judgment in the selection of data 19
and the interpretation of results. 20
27 See In the Matter of Consideration of Regulations Establishing Cost of Capital Policies, Procedures, and Filing Requirements for Economically Regulated Public Utilities, Docket No. R-11-004, Order No. 4, September 6, 2013, at 2.
28 In the Matter of Consideration of Regulations Establishing Cost of Capital Policies, Procedures, and Filing Requirements for Economically Regulated Public Utilities, Docket No. R-11-004, Order No. 1, December 27, 2011, at 3.

PREFILED DIRECT TESTIMONY OF ROBERT B. HEVERT Docket No. U-16-___: June 1, 2016 Page 38 of 68
Q. Please describe the DCF approach. 1
A. The DCF approach is based on the theory that a stock’s current price represents the 2
present value of all expected future cash flows. In its simplest form, the DCF model 3
expresses the Cost of Equity as the sum of the expected dividend yield and long-term 4
growth rate, and is expressed as follows: 5
⋯ Equation [1] 6
where P represents the current stock price, D1 … D represent expected future 7
dividends, and k is the discount rate, or required ROE. Equation [1] is a standard 8
present value calculation that can be simplified and rearranged into the familiar form: 9
Equation [2] 10
Equation [2] often is referred to as the “Constant Growth DCF” model, in which the 11
first term is the expected dividend yield and the second term is g, the expected long-12
term annual growth rate. 13
In essence, the DCF model assumes that the total return received by investors 14
includes the dividend yield, and the rate of growth. As explained below, under the 15
model’s assumptions, the rate of growth equals the rate of capital appreciation. That 16
is, the model assumes that the investor’s return is the sum of the dividend yield and 17
the increase in the stock price. However, most dividend-paying companies, including 18
utilities, pay dividends on a quarterly (as opposed to an annual) basis. The yield 19
component of the Quarterly Growth DCF model, therefore, accounts for the quarterly 20
payment of dividends. Thus, the Quarterly Growth DCF model incorporates 21
investors’ expectation of the quarterly dividend payment, and the associated quarterly 22

PREFILED DIRECT TESTIMONY OF ROBERT B. HEVERT Docket No. U-16-___: June 1, 2016 Page 39 of 68
compounding of those dividends as they are reinvested at investors’ required ROE. 1
As noted by Dr. Roger Morin: 2
Clearly, given that dividends are paid quarterly and that the 3 observed stock price reflects the quarterly nature of dividend 4 payments, the market-required return must recognize quarterly 5 compounding, for the investor receives dividend checks and 6 reinvests the proceeds on a quarterly schedule ... The annual 7 DCF model inherently understates the investors’ true return 8 because it assumes all cash flows received by investors are paid 9 annually.29 10
Q. How is the dividend yield component of the Quarterly Growth DCF model 11
calculated? 12
A. The dividend yield is calculated such that it incorporates the time value of money 13
associated with quarterly compounding. To do so, the D component of the Constant 14
Growth DCF model is replaced with the following equation: 15
D = d1(1 + k).75 + d2(1+k).50 + d3(1+k).25 + d4(1+k)0 Equation [3] 16
where: 17
d1, d2, d3, d4 = expected quarterly dividends over the coming year 18
k = the required Return on Equity 19
Due to the fact that the required ROE (k) is a variable in the dividend calculation, the 20
Quarterly Growth DCF model is solved in an iterative fashion. 21
Q. What market data did you use to calculate the dividend yield in your Quarterly 22
Growth DCF model? 23
A. To calculate the expected dividends over the coming year for the proxy companies 24
(i.e., d1, d2, d3, and d4), I obtained the last four paid quarterly dividends for each 25
29 Roger A. Morin, New Regulatory Finance, Public Utility Reports, Inc., 2006 at 344.

PREFILED DIRECT TESTIMONY OF ROBERT B. HEVERT Docket No. U-16-___: June 1, 2016 Page 40 of 68
company, and multiplied them by one plus the growth rate (i.e., 1 + g). For the P0 1
component of the dividends yield, I obtained the closing stock prices over the 30-, 90-2
, and 180-trading days ended April 29, 2016 for each company in the proxy group. 3
Q. Why did you use three averaging periods to calculate an average stock price? 4
A. I did so to ensure that the model’s results are not skewed by anomalous events that 5
may affect stock prices on any given trading day. At the same time, the averaging 6
period should be reasonably representative of expected capital market conditions over 7
the long term. In my view, using 30, 90, and 180-day averaging periods reasonably 8
balances those concerns. 9
Q. Is it important to select appropriate measures of long-term growth in applying 10
the DCF model? 11
A. Yes. In its Constant Growth form, the DCF model (i.e., as presented in Equation [2] 12
above) assumes a single growth estimate in perpetuity. The same assumption is made 13
in the Quarterly Growth DCF model. Accordingly, in order to reduce the long-term 14
growth rate to a single measure, one must assume a fixed payout ratio, and the same 15
constant growth rate for earnings per share (“EPS”), dividends per share, and book 16
value per share. Since dividend growth can only be sustained by earnings growth, the 17
model should incorporate a variety of measures of long-term earnings growth. That 18
can be accomplished by averaging those measures of long-term growth that tend to be 19
least influenced by capital allocation decisions that companies may make in response 20
to near-term changes in the business environment. Since such decisions may directly 21
affect near-term dividend payout ratios, estimates of earnings growth are more 22
indicative of long-term investor expectations than are dividend growth estimates. 23

PREFILED DIRECT TESTIMONY OF ROBERT B. HEVERT Docket No. U-16-___: June 1, 2016 Page 41 of 68
Therefore, for the purposes of the Quarterly Growth DCF model, growth in EPS 1
represents the appropriate measure of long-term growth, especially in capital-2
intensive organizations such as ENSTAR. 3
Q. Please summarize the findings of academic research on the appropriate measure 4
for estimating equity returns using the DCF model. 5
A. The relationship between various growth rates and stock valuation metrics has been 6
the subject of much academic research.30 As noted over 40 years ago by Charles 7
Phillips in The Economics of Regulation: 8
For many years, it was thought that investors bought utility 9 stocks largely on the basis of dividends. More recently, 10 however, studies indicate that the market is valuing utility 11 stocks with reference to total per share earnings, so that the 12 earnings-price ratio has assumed increased emphasis in rate 13 cases.31 14
Philips’ conclusion continues to hold true. Subsequent academic research has 15
clearly and consistently indicated that measures of earnings and cash flow are 16
strongly related to returns, and that analysts’ forecasts of growth are superior to other 17
measures of growth in predicting stock prices.32 For example, Vander Weide and 18
Carleton state that, “[our] results…are consistent with the hypothesis that investors 19
use analysts’ forecasts, rather than historically oriented growth calculations, in 20
30 See, e.g., Robert Harris, Using Analysts’ Growth Forecasts to Estimate Shareholder Required Rate of Return, Financial Management, Spring 1986.
31 Charles F. Phillips, Jr., The Economics of Regulation, Revised Edition, 1969, Richard D. Irwin, Inc., at 285.
32 See, e.g., Christofi, Christofi, Lori and Moliver, Evaluating Common Stocks Using Value Line’s Projected Cash Flows and Implied Growth Rate, Journal of Investing (Spring 1999); Harris and Marston, Estimating Shareholder Risk Premia Using Analysts’ Growth Forecasts, Financial Management, 21 (Summer 1992); and Vander Weide and Carleton, Investor Growth Expectations: Analysts vs. History, The Journal of Portfolio Management, Spring 1988.

PREFILED DIRECT TESTIMONY OF ROBERT B. HEVERT Docket No. U-16-___: June 1, 2016 Page 42 of 68
making stock buy-and-sell decisions.”33 Other research specifically notes the 1
importance of analysts’ growth estimates in determining the Cost of Equity, and in 2
the valuation of equity securities. Dr. Robert Harris noted that “a growing body of 3
knowledge shows that analysts’ earnings forecast are indeed reflected in stock 4
prices.” Citing Cragg and Malkiel, Dr. Harris notes that those authors “found that the 5
evaluations of companies that analysts make are the sorts of ones on which market 6
valuation is based.”34 Similarly, Brigham, Shome and Vinson noted that “evidence in 7
the current literature indicates that (i) analysts’ forecasts are superior to forecasts 8
based solely on time series data; and (ii) investors do rely on analysts’ forecasts.”35 9
To that point, the research of Carleton and Vander Weide demonstrates that 10
earnings growth projections have a statistically significant relationship to stock 11
valuation levels, while dividend growth rates do not.36 Those findings suggest that 12
investors form their investment decisions based on expectations of growth in 13
earnings, not dividends. Consequently, earnings growth not dividend growth is the 14
appropriate estimate for the purpose of the Constant Growth DCF model. 15
Q. How did you calculate the high and low DCF results? 16
A. I calculated the proxy group mean high DCF results by using the maximum EPS 17
growth rate estimate as reported by Value Line, Zacks, and First Call for each proxy 18
33 Vander Weide and Carleton, Investor Growth Expectations: Analysts vs. History, The Journal of Portfolio Management, Spring 1988.
34 Robert S. Harris, Using Analysts’ Growth Forecasts to Estimate Shareholder Required Rate of Return, Financial Management, Spring 1986.
35 Eugene F. Brigham, Dilip K. Shome, and Steve R. Vinson, The Risk Premium Approach to Measuring a Utility’s Cost of Equity, Financial Management, Spring 1985.
36 See Vander Weide and Carleton, Investor Growth Expectations: Analysts vs. History, The Journal of Portfolio Management, Spring 1988.

PREFILED DIRECT TESTIMONY OF ROBERT B. HEVERT Docket No. U-16-___: June 1, 2016 Page 43 of 68
group company in combination with the dividend yield for each of the proxy 1
companies. The proxy group mean high results then reflect the average of the 2
maximum DCF results for the proxy group as a whole. I used a similar approach to 3
calculate the proxy group mean low results using instead the minimum of the Value 4
Line, Zacks, and First Call estimate for each proxy group company. 5
Q. What are the results of your Quarterly Growth DCF analysis? 6
A. My Quarterly Growth DCF results are summarized in Table 2, below (see also 7
Exhibit RBH-2). 8
Table 2: Proxy Group Quarterly Growth DCF Results37 9
Mean Low Mean Mean High
30-Day Average 11.23 percent 12.68 percent 14.11 percent
90-Day Average 11.54 percent 13.00 percent 14.43 percent
180-Day Average 11.28 percent 12.73 percent 14.16 percent
B. Constant Growth DCF Model 10
Q. What assumptions are required for the Constant Growth DCF model? 11
A. The Constant Growth DCF model assumes: (1) a constant average annual growth rate 12
for earnings and dividends; (2) a stable dividend payout ratio; (3) a constant price-to-13
earnings multiple; and (4) a discount rate greater than the expected growth rate. 14
Under those assumptions, dividends, earnings, book value, and the stock price all 15
grow at the same, constant rate. 16
37 DCF results presented in Table 2 are unadjusted (i.e., prior to any adjustment for flotation costs).

PREFILED DIRECT TESTIMONY OF ROBERT B. HEVERT Docket No. U-16-___: June 1, 2016 Page 44 of 68
Q. What market data did you use to calculate the dividend yield component of your 1
DCF model? 2
A. The dividend yield is based on the proxy companies’ current annualized dividend, 3
and average closing stock prices over the 30-, 90-, and 180-trading day periods 4
ending April 29, 2016. 5
Q. Did you make any adjustments to the dividend yield to account for periodic 6
growth in dividends? 7
A. Yes. Since utilities increase their quarterly dividends at different times throughout 8
the year, it is reasonable to assume that dividend increases will be evenly distributed 9
over calendar quarters. Therefore, assuming that utilities will increase dividends at 10
the mid-point of the year is reasonable. Given that assumption, it is appropriate to 11
calculate the expected dividend yield by applying one-half of the long-term growth 12
rate to the current dividend yield to reflect expected growth over the coming year.38 13
That adjustment ensures that the expected dividend yield is representative of the 14
coming twelve-month period, and does not overstate the dividends to be paid during 15
that time. 16
Q. What growth rates did you use in your Constant Growth DCF model analysis? 17
A. I used the same projected EPS growth rates applied in my Quarterly Growth DCF 18
model analysis. 19
Q. Please summarize your inputs to the Constant Growth DCF model. 20
A. I used the following inputs for the price and dividend terms: 21
38 See Exhibit RBH-3.

PREFILED DIRECT TESTIMONY OF ROBERT B. HEVERT Docket No. U-16-___: June 1, 2016 Page 45 of 68
1. The average daily closing prices for the 30-, 90-, and 180-trading days 1
ended April 29, 2016, for the term P0; and 2
2. The annualized dividend per share as of April 29, 2016, for the term 3
D0. 4
I then calculated my DCF results using each of the following growth terms: 5
1. The Zacks consensus long-term earnings growth estimates; 6
2. The First Call consensus long-term earnings growth estimates; and 7
3. The Value Line long-term earnings growth estimates. 8
Q. What are the results of your Constant Growth DCF analysis? 9
A. My Constant Growth DCF results are summarized in Table 3, below (see also Exhibit 10
RBH-3). 11
Table 3: Proxy Group Constant Growth DCF Results39 12
Mean Low Mean Mean High
30-Day Average 10.64 percent 12.05 percent 13.42 percent
90-Day Average 10.90 percent 12.31 percent 13.68 percent
180-Day Average 10.77 percent 12.17 percent 13.55 percent
C. Discounted Cash Flow Model Results 13
Q. Please summarize the results of your DCF analyses. 14
A. Table 4 (below) (see also Exhibit RBH-2 and Exhibit RBH-3) presents the results of 15
the Quarterly Growth and Constant Growth DCF analyses. The Quarterly Growth 16
DCF produces a range of results from 11.23 percent to 14.43 percent and the Constant 17
Growth DCF model produces a range of results from 10.64 percent to 13.68 percent. 18
39 DCF results presented in Table 3 are unadjusted (i.e., prior to any adjustment for flotation costs).

PREFILED DIRECT TESTIMONY OF ROBERT B. HEVERT Docket No. U-16-___: June 1, 2016 Page 46 of 68
Table 4: Proxy Group Summary of DCF Model Results40 1
Mean
Low Mean
Mean
High
Quarterly Growth DCF Results
30-Day Average 11.23 percent 12.68 percent 14.11 percent
90-Day Average 11.54 percent 13.00 percent 14.43 percent
180-Day Average 11.28 percent 12.73 percent 14.16 percent
Constant Growth DCF Results
30-Day Average 10.64 percent 12.05 percent 13.42 percent
90-Day Average 10.90 percent 12.31 percent 13.68 percent
180-Day Average 10.77 percent 12.17 percent 13.55 percent
Q. Did you undertake any additional analyses to support your recommendation? 2
A. Yes. As noted earlier, I also applied the CAPM and Risk Premium approaches. 3
D. CAPM Analysis 4
Q. Please briefly describe the general form of the CAPM analysis. 5
A. The CAPM analysis is a risk premium method that estimates the Cost of Equity for a 6
given security as a function of a risk-free return plus a risk premium (to compensate 7
investors for the non-diversifiable or “systematic” risk of that security). As shown in 8
Equation [4], the CAPM is defined by four components, each of which theoretically 9
must be a forward-looking estimate: 10
Equation [4] 11
where: 12
k = the required market ROE for a security; 13
β = the Beta coefficient of that security; 14
40 DCF results presented in Table 4 are unadjusted (i.e., prior to any adjustment for flotation costs).

PREFILED DIRECT TESTIMONY OF ROBERT B. HEVERT Docket No. U-16-___: June 1, 2016 Page 47 of 68
rf = the risk-free rate of return; and 1
rm = the required return on the market as a whole. 2
In Equation [4], the term (rm – rf) represents the Market Risk Premium.41 3
According to the theory underlying the CAPM, since unsystematic risk can be 4
diversified away by adding securities to their investment portfolio, investors should 5
be concerned only with systematic or non-diversifiable risk. Non-diversifiable risk is 6
measured by the Beta coefficient, which is defined as: 7
, Equation [5] 8
Where is the standard deviation of returns for company “j,” is the standard 9
deviation of returns for the broad market (as measured, for example, by the S&P 500 10
Index), and , is the correlation between returns in company j and the broad 11
market. The Beta coefficient therefore represents both relative volatility (i.e., the 12
standard deviation) of returns, and the correlation in returns between the subject 13
company and the overall market. 14
Intuitively, higher Beta coefficients indicate that the subject company’s 15
returns have been relatively volatile, and have moved in tandem with the overall 16
market. Consequently, if a company has a Beta coefficient of 1.00, it is as risky as 17
the market and does not provide any diversification benefit. 18
41 The Market Risk Premium is defined as the incremental return of the market over the risk-free rate.

PREFILED DIRECT TESTIMONY OF ROBERT B. HEVERT Docket No. U-16-___: June 1, 2016 Page 48 of 68
Q. What assumptions did you include in your CAPM analysis? 1
A. Since utility assets represent long-term investments, I used two different measures of 2
the risk-free rate: (1) the current 30-day average yield on 30-year Treasury bonds 3
(i.e., 2.64 percent); and (2) the projected 30-year Treasury yield (i.e., 3.22 percent). 4
Q. Why have you relied upon the 30-year Treasury yield for your CAPM analysis? 5
A. In determining the security most relevant to the application of the CAPM, it is 6
important to select the term (or maturity) that best matches the life of the underlying 7
investment. Natural gas companies typically are long-duration investments and as 8
such, the 30-year Treasury yield is more suitable for the purpose of calculating the 9
Cost of Equity. 10
Q. What Market Risk Premium did you use in your CAPM analysis? 11
A. For the reasons discussed above, I did not use a historical average; rather, I developed 12
forward-looking (ex-ante) estimates of the Market Risk Premium. 13
Q. Please describe your ex-ante approach to estimating the Market Risk Premium. 14
A. The approach is based on the market required return, less the current 30-year 15
Treasury yield. To estimate the market required return, I calculated the market 16
capitalization weighted average ROE based on the Constant Growth DCF model. To 17
do so, I relied on data from two sources: (1) Bloomberg; and (2) Value Line. With 18
respect to Bloomberg-derived growth estimates, I calculated the expected dividend 19
yield (using the same one-half growth rate assumption described earlier), and 20
combined that amount with the projected earnings growth rate to arrive at the market 21
capitalization weighted average DCF result. I performed that calculation for each of 22
the S&P 500 companies for which Bloomberg provided consensus growth rates. I 23

PREFILED DIRECT TESTIMONY OF ROBERT B. HEVERT Docket No. U-16-___: June 1, 2016 Page 49 of 68
then subtracted the current 30-year Treasury yield from that amount to arrive at the 1
market DCF-derived ex-ante market risk premium estimate. In the case of Value 2
Line, I performed the same calculation, again using all companies for which five-year 3
earnings growth rates were available. The results of those calculations are provided 4
in Exhibit RBH-4. 5
Q. How did you apply your expected Market Risk Premium and risk-free rate 6
estimates? 7
A. I relied on the ex-ante Market Risk Premia discussed above, together with the current 8
and near-term projected 30-year Treasury yields as inputs to my CAPM analyses. 9
Q. What Beta coefficients did you use in your CAPM model? 10
A. My approach includes the average reported Beta coefficient from Bloomberg and 11
Value Line for each of the proxy group companies. While both of those services 12
adjust their calculated (or raw) Beta coefficients to reflect the tendency of the Beta 13
coefficient to regress to the market mean of 1.00, Value Line calculates the Beta 14
coefficient over a five-year period, and Bloomberg’s calculation is based on two 15
years of data.42 16
Q. What are the results of your CAPM analysis? 17
A. As shown in Table 5, the proxy group CAPM analyses suggest an ROE range of 18
11.15 percent to 12.70 percent (see also Exhibit RBH-6). 19
42 See Exhibit RBH-5.

PREFILED DIRECT TESTIMONY OF ROBERT B. HEVERT Docket No. U-16-___: June 1, 2016 Page 50 of 68
Tables 5: Proxy Group Summary of CAPM Results 1
Bloomberg Derived
Market Risk Premium
Value Line Derived
Market Risk Premium
Average Bloomberg Beta Coefficient
Current 30-Year Treasury (2.64 percent) 12.00 percent 11.15 percent
Near Term Projected 30-Year Treasury (3.22 percent) 12.58 percent 11.73 percent
Average Value Line Beta Coefficient
Current 30-Year Treasury (2.64 percent) 12.12 percent 11.25 percent
Near Term Projected 30-Year Treasury (3.22 percent) 12.70 percent 11.83 percent
E. Bond Yield Plus Risk Premium Approach 2
Q. Please generally describe the Bond Yield Plus Risk Premium approach. 3
A. This approach is based on the basic financial tenet that, since equity investors bear the 4
residual risk associated with ownership, they require a premium over the return they 5
would have earned as a bondholder. Put another way, since returns to equity holders 6
are more risky than returns to bondholders, equity investors must be compensated for 7
bearing that risk. Risk Premium approaches, therefore, estimate the Cost of Equity as 8
the sum of the equity risk premium and the yield on a particular class of bonds. As 9
noted in my discussion of the CAPM, since the equity risk premium is not directly 10
observable, it typically is estimated using a variety of approaches, some of which 11
incorporate ex-ante, or forward-looking estimates of the Cost of Equity, and others 12
that consider historical, or ex-post, estimates. An alternative approach is to use actual 13
authorized returns for natural gas pipelines and utilities to estimate the Equity Risk 14
Premium. 15

PREFILED DIRECT TESTIMONY OF ROBERT B. HEVERT Docket No. U-16-___: June 1, 2016 Page 51 of 68
Q. Please explain how you performed your Bond Yield Plus Risk Premium analysis. 1
A. I first defined the Risk Premium as the difference between the authorized ROE and 2
the then-prevailing level of long-term (i.e., 30-year) Treasury yield. For pipeline 3
companies, I then gathered data for natural gas pipeline rate proceedings between 4
January 2006 and April 29, 2016. In order to reflect the prevailing level of interest 5
rates during the pendency of the proceedings, I calculated the average 30-year 6
Treasury yield over an assumed one-year lag period. For utility companies, I 7
gathered data for the 1,034 natural gas distribution rate proceedings between January 8
1980 and April 29, 2016 reported by Regulatory Research Associates.43 For the lag 9
period, I calculated the average period between the filing of the case and the date of 10
the final order, which was approximately 188 days. I did not limit the observations to 11
the proxy group companies, but rather included all natural gas pipeline and 12
distribution rate proceedings. 13
Because the data cover a number of economic cycles, the analysis also may be 14
used to assess the stability of the Equity Risk Premium. Prior research, for example, 15
has shown that the Equity Risk Premium is inversely related to the level of interest 16
rates. That analysis is particularly relevant given the relatively low, but increasing 17
level of current Treasury yields. 18
Q. How did you model the relationship between interest rates and the Equity Risk 19
Premium? 20
43 Excluding limited issue rate riders.

PREFILED DIRECT TESTIMONY OF ROBERT B. HEVERT Docket No. U-16-___: June 1, 2016 Page 52 of 68
A. The basic method used was regression analysis, in which the observed Equity Risk 1
Premium is the dependent variable, and the average 30-year Treasury yield is the 2
independent variable. To account for variability of interest rates over the analytical 3
period, I used the semi-log regression, in which the Equity Risk Premium is 4
expressed as a function of the natural log of the 30-year Treasury yield: 5
LN Equation [6] 6
As shown on Charts 6a and 6b (below), the semi-log form is useful when 7
measuring an absolute change in the dependent variable (in this case, the Risk 8
Premium) relative to a proportional change in the independent variable (the 30-year 9
Treasury yield). 10

PREFILED DIRECT TESTIMONY OF ROBERT B. HEVERT Docket No. U-16-___: June 1, 2016 Page 53 of 68
Chart 6a: Pipeline Equity Risk Premium 1
2
Chart 6b: Utility Equity Risk Premium 3
4
As Charts 6a and 6b illustrate, over time there has been a statistically 5
significant, negative relationship between the 30-year Treasury yield and the Equity 6
Risk Premium. Consequently, simply applying the long-term average Equity Risk 7
Premium to the current Treasury yield would significantly understate the Cost of 8
Equity. Based on the regression coefficients in Chart 6a, however, the implied ROE 9

PREFILED DIRECT TESTIMONY OF ROBERT B. HEVERT Docket No. U-16-___: June 1, 2016 Page 54 of 68
is between 12.81 percent and 13.10 percent for pipeline companies and 9.98 percent 1
and 10.39 percent for distribution companies (see Exhibit RBH-7 and Tables 6a and 2
6b, below). 3
Table 6a: Pipeline Bond Yield Plus Risk Premium Results 4
Treasury Yield Return on
Equity
Current 30-Year Treasury (2.64 percent) 12.85 percent
Near Term Projected 30-Year Treasury (3.22 percent)
12.81 percent
Long Term Projected 30-Year Treasury (4.65 percent)
13.10 percent
Table 6b: Utility Bond Yield Plus Risk Premium Results 5
Treasury Yield Return on
Equity
Current 30-Year Treasury (2.64 percent) 9.98 percent
Near Term Projected 30-Year Treasury (3.22 percent)
10.00 percent
Long Term Projected 30-Year Treasury (4.65 percent)
10.39 percent
VII. OTHER CONSIDERATIONS 6
Q. What additional information did you consider in assessing the analytical results 7
noted above? 8
A. As I have discussed previously, because the analytical methods discussed above 9
provide a range of estimates, there are additional factors that should be taken into 10
consideration when establishing a reasonable range for the Company’s Cost of 11
Equity. I discussed those factors at length in Section IV of my direct testimony. In 12
addition, I have considered the effect of flotation costs on ENSTAR’s Cost of Equity. 13

PREFILED DIRECT TESTIMONY OF ROBERT B. HEVERT Docket No. U-16-___: June 1, 2016 Page 55 of 68
Q. What are flotation costs? 1
A. Flotation costs are the costs associated with the sale of new issues of common stock. 2
These include out-of-pocket expenditures for preparation, filing, underwriting, and 3
other costs of issuance. Although the Company is a wholly-owned subsidiary of 4
AltaGas Ltd., it is appropriate to consider flotation costs because subsidiaries receive 5
equity capital from their parents and provide returns on the capital that roll up to the 6
parent, which is designated to attract and raise capital based on the returns of those 7
subsidiaries. To deny recovery of issuance costs associated with the capital that is 8
invested in the subsidiaries ultimately will penalize the investors that fund the utility 9
operations and will inhibit the utility’s ability to obtain new equity capital at a 10
reasonable cost. 11
Q. Are flotation costs part of the utility’s invested costs or part of the utility’s 12
expenses? 13
A. Flotation costs are part of capital costs, which are properly reflected on the balance 14
sheet under “paid in capital” rather than current expenses on the income statement. 15
Flotation costs are incurred over time, just as investments in rate base or debt 16
issuance costs. As a result, the great majority of flotation costs are incurred prior to 17
the test year, but remain part of the cost structure during the test year and beyond. 18
Q. How did you calculate the flotation cost recovery adjustment? 19
A. I modified the DCF calculation to provide a dividend yield that would reimburse 20
investors for issuance costs. My flotation cost adjustment recognizes the costs of 21
issuing equity that were incurred by ENSTAR’s parent company AltaGas Ltd. and the 22
proxy group companies in their two most recent issuances. As shown in Exhibit 23

PREFILED DIRECT TESTIMONY OF ROBERT B. HEVERT Docket No. U-16-___: June 1, 2016 Page 56 of 68
RBH-10, an adjustment of 0.12 percent (i.e., 12 basis points) reasonably represents 1
flotation costs for the Company. 2
Q. Are you proposing to adjust your recommended ROE by 12 basis points to 3
reflect the effect of flotation costs on ENSTAR’s ROE? 4
A. No. Rather, I have considered the effect of flotation costs, in addition to the 5
Company’s other business risks, in determining where the Company’s ROE falls 6
within the range of results. 7
VIII. CAPITAL MARKET ENVIRONMENT 8
Q. Do economic conditions influence the required cost of capital and required 9
return on common equity? 10
A. Yes. As discussed in Section VI, the models used to estimate the Cost of Equity are 11
meant to reflect, and therefore are influenced by, current and expected capital market 12
conditions. As to the analyses used to estimate the Cost of Equity, it is important to 13
assess the reasonableness of any financial model’s results in the context of observable 14
market data. To the extent that certain ROE estimates are incompatible with such 15
data or inconsistent with basic financial principles, it is appropriate to consider 16
whether alternative estimation techniques are likely to provide more meaningful and 17
reliable results. 18
A. Federal Reserve Market Intervention 19
Q. Do you have any general observations regarding the relationship between 20
Federal Reserve monetary policy, capital market conditions, and the Company’s 21
Cost of Equity? 22
A. Yes, I do. Much has been reported about the Federal Reserve’s Quantitative Easing 23
policy, and its effect on interest rates. Although the Federal Reserve completed its 24

PREFILED DIRECT TESTIMONY OF ROBERT B. HEVERT Docket No. U-16-___: June 1, 2016 Page 57 of 68
Quantitative Easing initiative in October 2014, it was not until December 2015 that it 1
raised the Federal Funds rate and began the process of rate normalization.44 A 2
significant issue, then, is how investors will react as that process continues and 3
eventually is completed. A viable outcome is that investors will perceive greater 4
chances for economic growth, which will increase the growth rates included in the 5
Constant Growth DCF model. At the same time, higher growth and the absence of 6
Federal market intervention could provide the opportunity for interest rates to 7
increase, thereby increasing the dividend yield portion of the DCF model. In that 8
case, both terms of the Constant Growth DCF model would increase, producing 9
increased ROE estimates. 10
At this time, however, market data is somewhat disjointed. As a consequence, 11
it is difficult to rely on a single model to estimate the Company’s Cost of Equity. A 12
more reasoned approach is to understand the relationships among Federal Reserve 13
policies, interest rates, and risk, and assess how those factors may affect different 14
models and their results. For the reasons discussed below, the current market is one 15
in which it is very important to consider a broad range of data and models when 16
determining the Cost of Equity. 17
44 See Federal Reserve Press Release (December 16, 2015).

PREFILED DIRECT TESTIMONY OF ROBERT B. HEVERT Docket No. U-16-___: June 1, 2016 Page 58 of 68
Q. Please summarize the effect of recent Federal Reserve policies on interest rates 1
and the cost of capital. 2
A. Beginning in 2008, the Federal Reserve proceeded on a steady path of initiatives 3
intended to lower long-term Treasury yields.45 The Federal Reserve’s policy actions 4
“were designed to put downward pressure on longer-term interest rates by having the 5
Federal Reserve take onto its balance sheet some of the duration and prepayment 6
risks that would otherwise have been borne by private investors.”46 Under that 7
policy, “Securities held outright” on the Federal Reserve’s balance sheet increased 8
from approximately $489 billion at the beginning of October 2008 to $4.24 trillion by 9
the end of April 2016.47 To put that increase in context, the securities held by the 10
Federal Reserve represented approximately 3.29 percent of GDP at the end of 11
September 2008 and had risen to approximately 23.28 percent of GDP in April 12
2016.48 As such, the Federal Reserve’s policy actions have represented a significant 13
source of liquidity and have had a substantial effect on capital markets. 14
Just as market intervention by the Federal Reserve has reduced interest rates, 15
it also has had the effect of reducing market volatility. As shown in Chart 7 (below), 16
each time the Federal Reserve began to purchase bonds (as evidenced by the increase 17
in “Securities Held Outright” on its balance sheet), volatility subsequently declined. 18
45 See Federal Reserve Press Release (June 19, 2013).
46 Federal Reserve Bank of New York, Domestic Open Market Operations During 2012, April 2013, at 29.
47 Source: Federal Reserve Board Schedule H.4.1. “Securities held outright” include U.S. Treasury securities, Federal agency debt securities, and mortgage-backed securities.
48 Source: Federal Reserve Board Schedule H.4.1; Bureau of Economic Analysis, 2013 data as of the fourth calendar quarter.

PREFILED DIRECT TESTIMONY OF ROBERT B. HEVERT Docket No. U-16-___: June 1, 2016 Page 59 of 68
In fact, in September 2012, when the Federal Reserve began to purchase long-term 1
securities at a pace of $85 billion per month, volatility (as measured by the CBOE 2
Volatility Index, known as the “VIX”) fell, and through October 2014 remained in a 3
relatively narrow range. The reason is quite straight-forward: investors became 4
confident that the Federal Reserve would intervene if markets were to become 5
unstable. 6
Chart 7: VIX and Federal Reserve Asset Purchases49 7
8
A further measure of market uncertainty is the volatility of the VIX itself. 9
That is, we can look to the volatility of volatility, as measured by the standard 10
deviation of the VIX. As Chart 8 (below) demonstrates, the volatility of the VIX 11
moved in a relatively narrow range prior to September 2014, but since then has 12
noticeably increased. Such volatility indicates that, although interest rates are still 13
49 Source: Federal Reserve Economic Data (FRED), Federal Reserve Bank of St. Louis; Federal Reserve Statistical Release H.4.1, Factors Affecting Reserve Balances. The dollar figures shown are in $000,000s.

PREFILED DIRECT TESTIMONY OF ROBERT B. HEVERT Docket No. U-16-___: June 1, 2016 Page 60 of 68
near historical lows, there remains significant, if not greater, uncertainty in today’s 1
equity markets, with investors requiring greater returns to bear that risk. 2
Chart 8: Standard Deviation (100 days) of VIX50 3
4
Those findings are consistent with the Chicago Board Options Exchange 5
VVIX Index (“VVIX”), which is a traded index of the expected volatility of the VIX. 6
Over the long-term, the VVIX has averaged approximately 87.00; its 2014 average 7
was somewhat below that level (83.01). In 2015, the VVIX increased to (on average) 8
94.82, and to date in 2016 has averaged 92.86; the 2015-2016 average has been 9
94.33. Just as the backward-looking standard deviation of the VIX indicates that 10
observed volatility increased considerably in 2015 and 2016, the VVIX indicates that 11
expected volatility also has been well above the 2013 levels.51 12
Given the negative relationship between the expansion of the Federal 13
Reserve’s balance sheet and the VIX, it is difficult to conclude that fundamental risk 14
50 Source: Bloomberg Professional.
51 Source: Bloomberg Professional.

PREFILED DIRECT TESTIMONY OF ROBERT B. HEVERT Docket No. U-16-___: June 1, 2016 Page 61 of 68
aversion and investor return requirements have fallen. In this respect, it appears that 1
the Constant Growth DCF results are at odds with market conditions, and it is 2
important to assess the reasonableness of those results relative to other alternative 3
estimation techniques. 4
Q. Has the Federal Reserve’s quantitative easing policy been associated with 5
changes in natural gas utility companies’ trading levels? 6
A. Yes, that appears to be the case. From January 2000 through the end of August 2012 7
(that is, immediately prior to the third round of Quantitative Easing), the proxy 8
group’s average P/E ratio traded at a 9 percent discount to the market. From 9
September 2012 through May 2013, when the Federal Reserve announced it would 10
begin to taper its asset purchases, the proxy group traded at a 13 percent premium to 11
the market. In fact, between September 2012 and April 29, 2016, the proxy group 12
P/E ratio traded at a 10 percent premium to the market. 13
B. Interest Rate Environment 14
Q. Does your recommendation also consider the interest rate environment? 15
A. Yes, it does. From an analytical perspective, it is important that the inputs and 16
assumptions used to arrive at an ROE recommendation, including assessments of 17
capital market conditions, are consistent with the recommendation itself. Although I 18
appreciate that all analyses require an element of judgment, the application of that 19
judgment must be made in the context of the quantitative and qualitative information 20
available to the analyst and the capital market environment in which the analyses 21
were undertaken. 22
Classic valuation theory assumes that investors trade securities rationally, with 23
prices reflecting their perceptions of value. Although central banks have the ability to 24

PREFILED DIRECT TESTIMONY OF ROBERT B. HEVERT Docket No. U-16-___: June 1, 2016 Page 62 of 68
set benchmark interest rates, they have been maintaining below normal rates to 1
stimulate continued economic and capital market recovery. It therefore is reasonable 2
to conclude that the Federal Reserve and other central banks have been acting as 3
market-movers, thereby having a significant effect on the market prices of both bonds 4
and stocks. 5
The low interest rate environment associated with central bank intervention 6
may lead some analysts to conclude that current capital costs, including the Cost of 7
Equity, are low and will remain as such. Putting aside the increases in volatility 8
discussed above, however, that conclusion only holds true under the hypothesis of 9
Perfectly Competitive Capital Markets (“PCCM”) and the classical valuation 10
framework which, under normal economic and capital market conditions, underpin 11
the traditional Cost of Equity models. PCCM are those in which no single trader, or 12
“market-mover,” would have the power to change the prices of goods or services, 13
including bond and common stock securities. In other words, under the PCCM 14
hypothesis, no single trader would have a significant effect on market prices. In the 15
current capital market environment, however, the presence of market-movers, such as 16
the Federal Reserve, runs counter to the PCCM hypothesis, which underlies 17
traditional Cost of Equity models. Consequently, the results of those models should 18
be considered in the context of both quantitative and qualitative information. 19
Q. Are interest rates expected to increase going forward? 20
A. Yes, they are. For example, the approximately 50 economists surveyed by Blue Chip 21
Financial Forecast see the 30-year Treasury yield as increasing to 4 percent by 22

PREFILED DIRECT TESTIMONY OF ROBERT B. HEVERT Docket No. U-16-___: June 1, 2016 Page 63 of 68
2017.52 Those projections are supported by the fact that investors currently are 1
willing to pay about twice the premium for the option to sell long-term Government 2
bonds in January 2018 (with an exercise price equal to the current price) than they are 3
willing to pay for the option to buy those bonds.53 Because the prices of bonds move 4
inversely to interest rates,54 those option prices indicate that investors believe it is 5
considerably more likely that interest rates will increase over the coming year, than it 6
is likely that they will decrease. 7
Q. What conclusions do you draw from those analyses? 8
A. These data clearly demonstrate that the current capital market is experiencing 9
increasing levels of risk aversion, volatility, and instability. Given that: (1) Federal 10
monetary policy has begun its process of “normalization”; (2) equity market volatility 11
has increased and is expected to remain elevated; and (3) market data indicate 12
expectations for increasing interest rates into 2017 and beyond, I believe that my 13
12.50 percent to 14.00 percent ROE recommendation properly reflects the current 14
capital market. 15
IX. CAPITAL STRUCTURE 16
Q. What is the Company’s capital structure? 17
A. The Company’s capital structure consists of 51.68 percent common equity and 48.32 18
percent long-term debt. In practice, the capital structure should enable the Company 19
to maintain or enhance its financial integrity, thereby enabling access to capital at 20
52 See Blue Chip Financial Forecast, Vol. 34 No. 12, December 1, 2015, at 14.
53 Source: http://www.nasdaq.com/symbol/tlt/option-chain?dateindex=7.
54 That is, as interest rates move up (down), bond prices move down (up).

PREFILED DIRECT TESTIMONY OF ROBERT B. HEVERT Docket No. U-16-___: June 1, 2016 Page 64 of 68
competitive rates under a variety of economic and financial market conditions. As 1
discussed below, it is important to consider the capital structure in light of industry 2
practice and investor requirements. 3
Q. How does the capital structure affect the Cost of Equity? 4
A. The capital structure relates to financial risk, which is a function of the percentage of 5
debt relative to equity (that relationship is often referred to as “financial leverage”). 6
As the percentage of debt in the capital structure increases, so do the fixed obligations 7
for the repayment of that debt and, therefore, the risk that cash flows may not be 8
sufficient to meet those obligations on a timely basis. Consequently, as the degree of 9
financial leverage increases, the risk of financial distress (i.e., financial risk) also 10
increases. Since the capital structure can affect the subject company’s overall level of 11
risk, it is an important consideration in establishing a just and reasonable rate of 12
return. 13
Q. Please describe your analysis of the Company’s capital structure relative to 14
industry practice. 15
A. As a measure of industry practice, I calculated the average capital structure for each 16
of the proxy companies over the last eight fiscal quarters for both proxy groups. As 17
shown in Exhibit RBH-11, the proxy group’s average capital structure over that 18
period includes 54.89 percent equity and 45.11 percent long-term debt; the average 19
equity ratios (on a company-specific basis) range from 37.13 percent to 68.88 20
percent. Based on that review, it is apparent that the Company’s capital structure is 21
consistent with those in place at the proxy companies. 22

PREFILED DIRECT TESTIMONY OF ROBERT B. HEVERT Docket No. U-16-___: June 1, 2016 Page 65 of 68
Q. What is the basis for using average capital components rather than a point-in-1
time measurement? 2
A. Measuring the capital components at a particular point in time can skew the capital 3
structure by the specific circumstances of a particular period. Therefore, it is more 4
appropriate to normalize the relative relationship between the capital components 5
over a period of time. 6
Q. What is your conclusion regarding an appropriate capital structure for 7
ENSTAR? 8
A. Considering the range of proxy company average equity ratios from 37.13 percent to 9
68.88 percent, I believe that ENSTAR’s 51.68 percent common equity ratio is 10
appropriate. In addition, as discussed in Mr. Dieckgraeff’s testimony, the Company’s 11
proposed capital structure is consistent with its currently authorized capital structure. 12
X. COST OF DEBT 13
Q. What is the Company’s cost of debt? 14
A. As noted in Dr. Fairchild’s testimony, the Company’s cost of debt of is 5.03 percent. 15
Q. Have you assessed the Company’s cost of debt relative to utility companies? 16
A. Yes, I reviewed the prevailing Bloomberg Fair Value Curves for A-rated and Baa-17
rated utility debt concurrent with the date of issuance of the Company’s debt 18
instruments. As shown Exhibit RBH-12, the Company’s debt issuances are 19
consistent with the prevailing yields at the times of issuance. As such, I believe the 20
Company’s 5.03 percent current cost of debt is reasonable. 21

PREFILED DIRECT TESTIMONY OF ROBERT B. HEVERT Docket No. U-16-___: June 1, 2016 Page 66 of 68
XI. CONCLUSIONS AND RECOMMENDATION 1
Q. What is your conclusion regarding the Company’s Cost of Equity? 2
A. As discussed earlier, I have performed several analyses to estimate the Company’s 3
Cost of Equity, and have considered several market-wide and Company-specific 4
issues. Based on my analysis, a rate of return on common equity in the range of 5
12.50 percent to 14.00 percent represents the range of equity investors’ required rate 6
of return for investment in natural gas companies similar to ENSTAR in today’s 7
capital markets. As discussed throughout my direct testimony, the Company faces 8
risks that natural gas utilities elsewhere in the United States do not. Consistent with 9
those factors, my recommended range coincides with the Company’s currently 10
authorized and requested ROE of 12.55 percent. 11
As discussed earlier in my testimony, my recommendation reflects analytical 12
results based primarily on a proxy group composed of both natural gas transmission 13
companies and natural gas distribution companies to reflect the hybrid nature of 14
ENSTAR’s system and operations. It is my opinion that natural gas distribution 15
utilities in the Lower 48 do not share the same risk profile and operational 16
characteristics as the Company, but with the inclusion of transmission utilities, the 17
proxy group is more representative of ENSTAR’s operations, particularly when the 18
other business risks I have identified are considered. Table 7 summarizes my 19
analytical results. 20

PREFILED DIRECT TESTIMONY OF ROBERT B. HEVERT Docket No. U-16-___: June 1, 2016 Page 67 of 68
Table 7: Summary of Analytical Results 1
Quarterly DCF Low Mean High
30-Day Average 11.23 percent 12.68 percent 14.11 percent
90-Day Average 11.54 percent 13.00 percent 14.43 percent
180-Day Average 11.28 percent 12.73 percent 14.16 percent
Constant Growth DCF Low Mean High
30-Day Average 10.64 percent 12.05 percent 13.42 percent
90-Day Average 10.90 percent 12.31 percent 13.68 percent
180-Day Average 10.77 percent 12.17 percent 13.55 percent
CAPM Results
Bloomberg Derived
Market Risk Premium
Value Line Derived
Market Risk Premium
Average Bloomberg Beta Coefficient
Current 30-Year Treasury (2.64 percent) 12.00 percent 11.15 percent
Near Term Projected 30-Year Treasury (3.22 percent) 12.58 percent 11.73 percent
Average Value Line Beta Coefficient
Current 30-Year Treasury (2.64 percent) 12.12 percent 11.25 percent
Near Term Projected 30-Year Treasury (3.22 percent) 12.70 percent 11.83 percent
Low Mid High
Bond Yield Plus Risk Premium - Pipelines
12.81 percent 12.85 percent 13.10 percent
Bond Yield Plus Risk Premium – Distribution Utilities
9.98 percent 10.00 percent 10.39 percent
Flotation Cost 0.12 percent
I also conclude that the Company’s capital structure, which consists of 51.68 2
percent common equity and 48.32 percent debt, is consistent with industry practice 3
and, therefore, is reasonable and appropriate. Lastly, I conclude that the Company’s 4
5.03 percent cost of debt is reasonable and appropriate. 5

PREFILED DIRECT TESTIMONY OF ROBERT B. HEVERT Docket No. U-16-___: June 1, 2016 Page 68 of 68
Q. Does this conclude your direct testimony? 1
A. Yes, it does. 2

Robert B. Hevert, CFA Managing Partner
Sussex Economic Advisors, LLC
Mr. Hevert is a financial and economic consultant with broad experience in the energy and utility industries. He has an extensive background in the areas of corporate finance, mergers and acquisitions, project finance, asset and business unit valuation, rate and regulatory matters, energy market assessment, and corporate strategic planning. Mr. Hevert has provided expert testimony on a wide range of financial, strategic and economic matters on over 100 occasions at both the state and federal levels.
REPRESENTATIVE PROJECT EXPERIENCE
Litigation Support and Expert Testimony
Provided expert testimony and support of litigation in various regulatory proceedings on a variety of energy and economic issues including: cost of capital for ratemaking purposes; the proposed transfer of power purchase agreements; procurement of residual service electric supply; the legal separation of generation assets; merger-related synergies; assessment of economic damages; and specific financing transactions. Services provided include collaborating with counsel, business and technical staff to develop litigation strategies, preparing and reviewing discovery and briefing materials, preparing presentation materials and participating in technical sessions with regulators and intervenors.
Financial and Economic Advisory Services
Retained by numerous leading energy companies and financial institutions throughout North America to provide services relating to the strategic evaluation, acquisition, sale or development of a variety of regulated and non-regulated enterprises. Specific services have included: developing strategic and financial analyses and managing multi-faceted due diligence reviews of proposed corporate M&A counter-parties; developing, screening and recommending potential M&A transactions and facilitating discussions between senior utility executives regarding transaction strategy and structure; performing valuation analyses and financial due diligence reviews of electric generation projects, retail marketing companies, and wholesale trading entities in support of significant M&A transactions.
Specific divestiture-related services have included advising both buy and sell-side clients in transactions for physical and contractual electric generation resources. Sell-side services have included: development and implementation of key aspects of asset divestiture programs such as marketing, offering memorandum development, development of transaction terms and conditions, bid process management, bid evaluation, negations, and regulatory approval process. Buy-side services have included comprehensive asset screening, selection, valuation and due diligence reviews. Both buy and sell-side services have included the use of sophisticated asset valuation techniques, and the development and delivery of fairness opinions.
Specific corporate finance experience while a Vice President with Bay State Gas included: negotiation, placement and closing of both private and public long-term debt, preferred and common equity; structured and project financing; corporate cash management; financial analysis, planning and forecasting; and various aspects of investor relations.
Regulatory Analysis and Ratemaking
On behalf of electric, natural gas and combination utilities throughout North America, provided services relating to energy industry restructuring including merchant function exit, residual energy supply obligations, and stranded cost assessment and recovery. Specific services provided include: performing strategic review and development of merchant function exit strategies including analysis of provider of last
Docket U-16-___ Exhibit RBH-1 Page 1 of 19

resort obligations in both electric and gas markets; and developing value optimizing strategies for physical generation assets.
Energy Market Assessment
Retained by numerous leading energy companies and financial institutions nationwide to manage or provide assessments of regional energy markets throughout the U.S. and Canada. Such assessments have included development of electric and natural gas price forecasts, analysis of generation project entry and exit scenarios, assessment of natural gas and electric transmission infrastructure, market structure and regulatory situation analysis, and assessment of competitive position. Market assessment engagements typically have been used as integral elements of business unit or asset-specific strategic plans or valuation analyses.
Resource Procurement, Contracting and Analysis
Assisted various clients in evaluating alternatives for acquiring fuel and power supplies, including the development and negotiation of energy contracts and tolling agreements. Assignments also have included developing generation resource optimization strategies. Provided advice and analyses of transition service power supply contracts in the context of both physical and contractual generation resource divestiture transactions.
Business Strategy and Operations
Retained by numerous leading North American energy companies and financial institutions nationwide to provide services relating to the development of strategic plans and planning processes for both regulated and non-regulated enterprises. Specific services provided include: developing and implementing electric generation strategies and business process redesign initiatives; developing market entry strategies for retail and wholesale businesses including assessment of asset-based marketing and trading strategies; and facilitating executive level strategic planning retreats. As Vice President, of Bay State was responsible for the company’s strategic planning and business development processes, played an integral role in developing the company’s non-regulated marketing affiliate, EnergyUSA, and managed the company’s non-regulated investments, partnerships and strategic alliances. PROFESSIONAL HISTORY Sussex Economic Advisors, LLC (2012 – Present) Managing Partner Concentric Energy Advisors, Inc. (2002 – 2012) President Navigant Consulting, Inc. (1997 – 2001) Managing Director (2000 – 2001) Director (1998 – 2000) Vice President, REED Consulting Group (1997 – 1998) Bay State Gas Company (now Columbia Gas Company of Massachusetts) (1987 – 1997) Vice President and Assistant Treasurer Boston College (1986 – 1987) Financial Analyst General Telephone Company of the South (1984 – 1986) Revenue Requirements Analyst
Docket U-16-___ Exhibit RBH-1 Page 2 of 19

EDUCATION M.B.A., University of Massachusetts at Amherst, 1984 B.S., University of Delaware, 1982 DESIGNATIONS AND PROFESSIONAL AFFILIATIONS Chartered Financial Analyst, 1991 Association for Investment Management and Research Boston Security Analyst Society PUBLICATIONS/PRESENTATIONS Has made numerous presentations throughout the United States and Canada on several topics, including:
• Generation Asset Valuation and the Use of Real Options • Retail and Wholesale Market Entry Strategies • The Use Strategic Alliances in Restructured Energy Markets • Gas Supply and Pipeline Infrastructure in the Northeast Energy Markets • Nuclear Asset Valuation and the Divestiture Process
AVAILABLE UPON REQUEST Extensive client and project listings, and specific references.
Docket U-16-___ Exhibit RBH-1 Page 3 of 19

SPONSOR DATE CASE/APPLICANT DOCKET NO. SUBJECT
Regulatory Commission of Alaska
ENSTAR Natural Gas Company
08/14 ENSTAR Natural Gas Company
Matter No. TA 262-4 Return on Equity
Alberta Utilities Commission
Altalink, L.P., and EPCOR Distribution & Transmission, Inc.
02/16 Altalink, L.P., and EPCOR Distribution & Transmission, Inc.
2016 General Cost of Capital, Proceeding ID. 20622
Rate of Return
Arizona Corporation Commission
Southwest Gas Corporation 11/10 Southwest Gas Corporation Docket No. G-01551A-10-0458
Return on Equity
Arkansas Public Service Commission
CenterPoint Energy Resources Corp. d/b/a CenterPoint Energy Arkansas Gas
11/15 CenterPoint Energy Resources Corp. d/b/a CenterPoint Energy Arkansas Gas
Docket No. 15-098-U Return on Equity
SourceGas Arkansas, Inc. 03/15 SourceGas Arkansas, Inc. Docket No. 15-011-U Return on Equity
CenterPoint Energy Resources Corp. d/b/a CenterPoint Energy Arkansas Gas
01/07 CenterPoint Energy Resources Corp. d/b/a CenterPoint Energy Arkansas Gas
Docket No. 06-161-U Return on Equity
California Public Utilities Commission
Southwest Gas Corporation 12/12 Southwest Gas Corporation Docket No. A-12-12-024 Return on Equity
Colorado Public Utilities Commission
Xcel Energy, Inc. 03/15 Public Service Company of Colorado
Docket No. 15AL-0135G Return on Equity (gas)
Xcel Energy, Inc. 06/14 Public Service Company of Colorado
Docket No. 14AL-0660E Return on Equity (electric)
Xcel Energy, Inc. 12/12 Public Service Company of Colorado
Docket No. 12AL-1268G Return on Equity (gas)
Xcel Energy, Inc. 11/11 Public Service Company of Colorado
Docket No. 11AL-947E Return on Equity (electric)
Docket U-16-___ Exhibit RBH-1 Page 4 of 19

SPONSOR DATE CASE/APPLICANT DOCKET NO. SUBJECT
Xcel Energy, Inc. 12/10 Public Service Company of Colorado
Docket No. 10AL-963G Return on Equity (electric)
Atmos Energy Corporation 07/09 Atmos Energy Colorado-Kansas Division
Docket No. 09AL-507G Return on Equity (gas)
Xcel Energy, Inc. 12/06 Public Service Company of Colorado
Docket No. 06S-656G Return on Equity (gas)
Xcel Energy, Inc. 04/06 Public Service Company of Colorado
Docket No. 06S-234EG Return on Equity (electric)
Xcel Energy, Inc. 08/05 Public Service Company of Colorado
Docket No. 05S-369ST Return on Equity (steam)
Xcel Energy, Inc. 05/05 Public Service Company of Colorado
Docket No. 05S-246G Return on Equity (gas)
Connecticut Public Utilities Regulatory Authority
Connecticut Light and Power Company
06/14 Connecticut Light and Power Company
Docket No. 14-05-06 Return on Equity
Southern Connecticut Gas Company
09/08 Southern Connecticut Gas Company
Docket No. 08-08-17 Return on Equity
Southern Connecticut Gas Company
12/07 Southern Connecticut Gas Company
Docket No. 05-03-17PH02
Return on Equity
Connecticut Natural Gas Corporation
12/07 Connecticut Natural Gas Corporation
Docket No. 06-03-04PH02
Return on Equity
Delaware Public Service Commission
Potomac Electric Power Company 05/16 Potomac Electric Power Company Case No. 16-649 (Electric)
Return on Equity
Potomac Electric Power Company 05/16 Potomac Electric Power Company Case No. 16-650 (Gas) Return on Equity
Delmarva Power & Light Company 03/13 Delmarva Power & Light Company
Case No. 13-115 Return on Equity
Delmarva Power & Light Company 12/12 Delmarva Power & Light Company
Case No. 12-546 Return on Equity
Docket U-16-___ Exhibit RBH-1 Page 5 of 19

SPONSOR DATE CASE/APPLICANT DOCKET NO. SUBJECT
Delmarva Power & Light Company 03/12 Delmarva Power & Light Company
Case No. 11-528 Return on Equity
District of Columbia Public Service Commission
Washington Gas Light Company 02/16 Washington Gas Light Company Formal Case No. FC1137 Return on Equity
Potomac Electric Power Company 03/13 Potomac Electric Power Company Formal Case No. FC1103-2013-E
Return on Equity
Potomac Electric Power Company 07/11 Potomac Electric Power Company Formal Case No. FC1087 Return on Equity
Federal Energy Regulatory Commission
Sabine Pipeline, LLC 09/15 Sabine Pipeline, LLC Docket No. RP15-1322-000
Return on Equity
Nextera Energy Transmission West, LLC
07/15 Nextera Energy Transmission West, LLC
Docket No. ER15-2239-000
Return on Equity
Maritimes & Northeast Pipeline, LLC
05/15 Maritimes & Northeast Pipeline, LLC
Docket No. RP15-1026-000
Return on Equity
Public Service Company of New Mexico
12/12 Public Service Company of New Mexico
Docket No. ER13-685-000
Return on Equity
Public Service Company of New Mexico
10/10 Public Service Company of New Mexico
Docket No. ER11-1915-000
Return on Equity
Portland Natural Gas Transmission System
05/10 Portland Natural Gas Transmission System
Docket No. RP10-729-000
Return on Equity
Florida Gas Transmission Company, LLC
10/09 Florida Gas Transmission Company, LLC
Docket No. RP10-21-000 Return on Equity
Maritimes and Northeast Pipeline, LLC
07/09 Maritimes and Northeast Pipeline, LLC
Docket No. RP09-809-000
Return on Equity
Spectra Energy 02/08 Saltville Gas Storage Docket No. RP08-257-000
Return on Equity
Docket U-16-___ Exhibit RBH-1 Page 6 of 19

SPONSOR DATE CASE/APPLICANT DOCKET NO. SUBJECT
Panhandle Energy Pipelines 08/07 Panhandle Energy Pipelines Docket No. PL07-2-000 Response to draft policy statement regarding inclusion of MLPs in proxy groups for determination of gas pipeline ROEs
Southwest Gas Storage Company 08/07 Southwest Gas Storage Company Docket No. RP07-541-000
Return on Equity
Southwest Gas Storage Company 06/07 Southwest Gas Storage Company Docket No. RP07-34-000 Return on Equity
Sea Robin Pipeline LLC 06/07 Sea Robin Pipeline LLC Docket No. RP07-513-000
Return on Equity
Transwestern Pipeline Company 09/06 Transwestern Pipeline Company Docket No. RP06-614-000
Return on Equity
GPU International and Aquila 11/00 GPU International Docket No. EC01-24-000 Market Power Study
Florida Public Service Commission
Florida Power & Light Company 03/16 Florida Power & Light Company Docket No. 160021-EI Return on Equity
Tampa Electric Company 04/13 Tampa Electric Company Docket No. 130040-EI Return on Equity
Georgia Public Service Commission
Atlanta Gas Light Company 05/10 Atlanta Gas Light Company Docket No. 31647-U Return on Equity
Hawaii Public Utilities Commission
Maui Electric Company, Limited 12/14 Maui Electric Company, Limited Docket No. 2014-0318 Return on Equity
Hawaiian Electric Company 06/14 Hawaiian Electric Light Company Docket No. 2013-0373 Return on Equity
Hawaii Electric Light Company 08/12 Hawaiian Electric Light Company Docket No. 2012-0099 Return on Equity
Illinois Commerce Commission
Ameren Illinois Company d/b/a Ameren Illinois
01/15 Ameren Illinois Company d/b/a Ameren Illinois
Docket No. 15-0142 Return on Equity
Liberty Utilities (Midstates Natural Gas) Corp. d/b/a Liberty Utilities
03/14 Liberty Utilities (Midstates Natural Gas) Corp. d/b/a Liberty Utilities
Docket No. 14-0371 Return on Equity
Ameren Illinois Company d/b/a Ameren Illinois
01/13 Ameren Illinois Company d/b/a Ameren Illinois
Docket No. 13-0192 Return on Equity
Docket U-16-___ Exhibit RBH-1 Page 7 of 19

SPONSOR DATE CASE/APPLICANT DOCKET NO. SUBJECT
Ameren Illinois Company d/b/a Ameren Illinois
02/11 Ameren Illinois Company d/b/a Ameren Illinois
Docket No. 11-0279 Return on Equity (electric)
Ameren Illinois Company d/b/a Ameren Illinois
02/11 Ameren Illinois Company d/b/a Ameren Illinois
Docket No. 11-0282 Return on Equity (gas)
Indiana Utility Regulatory Commission
Duke Energy Indiana, Inc. 12/15 Duke Energy Indiana, Inc. Cause No. 44720 Return on Equity
Duke Energy Indiana, Inc. 12/14 Duke Energy Indiana, Inc. Cause No. 44526 Return on Equity
Northern Indiana Public Service Company
05/09 Northern Indiana Public Service Company
Cause No. 43894 Assessment of Valuation Approaches
Kansas Corporation Commission
Kansas City Power & Light Company
01/15 Kansas City Power & Light Company
Docket No. 15-KCPE-116-RTS
Return on Equity
Maine Public Utilities Commission
Central Maine Power Company 06/11 Central Maine Power Company Docket No. 2010-327 Response to Bench Analysis provided by Commission Staff relating to the Company’s credit and collections processes
Maryland Public Service Commission
Potomac Electric Power Company 12/13 Potomac Electric Power Company Case No. 9336 Return on Equity
Delmarva Power & Light Company 03/13 Delmarva Power & Light Company
Case No. 9317 Return on Equity
Potomac Electric Power Company 11/12 Potomac Electric Power Company Case No. 9311 Return on Equity
Potomac Electric Power Company 12/11 Potomac Electric Power Company Case No. 9286 Return on Equity
Delmarva Power & Light Company 12/11 Delmarva Power & Light Company
Case No. 9285 Return on Equity
Delmarva Power & Light Company 12/10 Delmarva Power & Light Company
Case No. 9249 Return on Equity
Docket U-16-___ Exhibit RBH-1 Page 8 of 19

SPONSOR DATE CASE/APPLICANT DOCKET NO. SUBJECT
Massachusetts Department of Public Utilities
National Grid 11/15 Massachusetts Electric Company and Nantucket Electric Company d/b/a National Grid
DPU 15-155 Return on Equity
Fitchburg Gas and Electric Light Company d/b/a Unitil
06/15 Fitchburg Gas and Electric Light Company d/b/a Unitil
DPU 15-80 Return on Equity
NSTAR Gas Company 12/14 NSTAR Gas Company DPU 14-150 Return on Equity
Fitchburg Gas and Electric Light Company d/b/a Unitil
07/13 Fitchburg Gas and Electric Light Company d/b/a Unitil
DPU 13-90 Return on Equity
Bay State Gas Company d/b/a Columbia Gas of Massachusetts
04/12 Bay State Gas Company d/b/a Columbia Gas of Massachusetts
DPU 12-25 Capital Cost Recovery
National Grid 08/09 Massachusetts Electric Company d/b/a National Grid
DPU 09-39 Revenue Decoupling and Return on Equity
National Grid 08/09 Massachusetts Electric Company and Nantucket Electric Company d/b/a National Grid
DPU 09-38 Return on Equity – Solar Generation
Bay State Gas Company 04/09 Bay State Gas Company DPU 09-30 Return on Equity
NSTAR Electric 09/04 NSTAR Electric DTE 04-85 Divestiture of Power Purchase Agreement
NSTAR Electric 08/04 NSTAR Electric DTE 04-78 Divestiture of Power Purchase Agreement
NSTAR Electric 07/04 NSTAR Electric DTE 04-68 Divestiture of Power Purchase Agreement
NSTAR Electric 07/04 NSTAR Electric DTE 04-61 Divestiture of Power Purchase Agreement
NSTAR Electric 06/04 NSTAR Electric DTE 04-60 Divestiture of Power Purchase Agreement
Unitil Corporation 01/04 Fitchburg Gas and Electric DTE 03-52 Integrated Resource Plan; Gas Demand Forecast
Docket U-16-___ Exhibit RBH-1 Page 9 of 19

SPONSOR DATE CASE/APPLICANT DOCKET NO. SUBJECT
Bay State Gas Company 01/93 Bay State Gas Company DPU 93-14 Divestiture of Shelf Registration
Bay State Gas Company 01/91 Bay State Gas Company DPU 91-25 Divestiture of Shelf Registration
Minnesota Public Utilities Commission
Otter Tail Power Corporation 02/16 Otter Tail Power Company Docket No. E017/GR-15-
1033
Return on Equity
Minnesota Energy Resources Corporation
09/15 Minnesota Energy Resources Corporation
Docket No. G-011/GR-15-736
Return on Equity
CenterPoint Energy Resources Corp. d/b/a CenterPoint Energy Minnesota Gas
08/15 CenterPoint Energy Resources Corp. d/b/a CenterPoint Energy Minnesota Gas
Docket No. G-008/GR-15-424
Return on Equity
Xcel Energy, Inc. 11/13 Northern States Power Company Docket No. E002/GR-13-868
Return on Equity
CenterPoint Energy Resources Corp. d/b/a CenterPoint Energy Minnesota Gas
08/13 CenterPoint Energy Resources Corp. d/b/a CenterPoint Energy Minnesota Gas
Docket No. G-008/GR-13-316
Return on Equity
Xcel Energy, Inc. 11/12 Northern States Power Company Docket No. E002/GR-12-961
Return on Equity
Otter Tail Power Corporation 04/10 Otter Tail Power Company Docket No. E-017/GR-10-239
Return on Equity
Minnesota Power a division of ALLETE, Inc.
11/09 Minnesota Power Docket No. E-015/GR-09-1151
Return on Equity
CenterPoint Energy Resources Corp. d/b/a CenterPoint Energy Minnesota Gas
11/08 CenterPoint Energy Minnesota Gas
Docket No. G-008/GR-08-1075
Return on Equity
Otter Tail Power Corporation 10/07 Otter Tail Power Company Docket No. E-017/GR-07-1178
Return on Equity
Docket U-16-___ Exhibit RBH-1 Page 10 of 19

SPONSOR DATE CASE/APPLICANT DOCKET NO. SUBJECT
Xcel Energy, Inc. 11/05 Northern States Power Company -Minnesota
Docket No. E-002/GR-05-1428
Return on Equity (electric)
Xcel Energy, Inc. 09/04 Northern States Power Company - Minnesota
Docket No. G-002/GR-04-1511
Return on Equity (gas)
Mississippi Public Service Commission
CenterPoint Energy Resources, Corp. d/b/a CenterPoint Energy Entex and CenterPoint Energy Mississippi Gas
07/09 CenterPoint Energy Mississippi Gas
Docket No. 09-UN-334
Return on Equity
Missouri Public Service Commission
Kansas City Power & Light Company
02/16 Kansas City Power & Light Company
Case No. ER-2016-0156 Return on Equity (electric)
Kansas City Power & Light Company
10/14 Kansas City Power & Light Company
Case No. ER-2014-0370 Return on Equity (electric)
Union Electric Company d/b/a Ameren Missouri
07/14 Union Electric Company d/b/a Ameren Missouri
Case No. ER-2014-0258 Return on Equity (electric)
Union Electric Company d/b/a Ameren Missouri
06/14 Union Electric Company d/b/a Ameren Missouri
Case No. EC-2014-0223 Return on Equity (electric)
Liberty Utilities (Midstates Natural Gas) Corp. d/b/a Liberty Utilities
02/14 Liberty Utilities (Midstates Natural Gas) Corp. d/b/a Liberty Utilities
Case No. GR-2014-0152 Return on Equity
Laclede Gas Company 12/12 Laclede Gas Company Case No. GR-2013-0171 Return on Equity
Union Electric Company d/b/a Ameren Missouri
02/12 Union Electric Company d/b/a Ameren Missouri
Case No. ER-2012-0166 Return on Equity (electric)
Union Electric Company d/b/a AmerenUE
09/10 Union Electric Company d/b/a AmerenUE
Case No. ER-2011-0028 Return on Equity (electric)
Union Electric Company d/b/a AmerenUE
06/10 Union Electric Company d/b/a AmerenUE
Case No. GR-2010-0363 Return on Equity (gas)
Montana Public Service Commission
Northwestern Corporation 09/12 Northwestern Corporation d/b/a Northwestern Energy
Docket No. D2012.9.94 Return on Equity (gas)
Docket U-16-___ Exhibit RBH-1 Page 11 of 19

SPONSOR DATE CASE/APPLICANT DOCKET NO. SUBJECT
Nevada Public Utilities Commission
Southwest Gas Corporation 04/12 Southwest Gas Corporation Docket No. 12-04005 Return on Equity (gas)
Nevada Power Company 06/11 Nevada Power Company Docket No. 11-06006 Return on Equity (electric)
New Hampshire Public Utilities Commission
Liberty Utilities d/b/a EnergyNorth Natural Gas
08/14 Liberty Utilities d/b/a EnergyNorth Natural Gas
Docket No. DG 14-180 Return on Equity
Liberty Utilities d/b/a Granite State Electric Company
03/13 Liberty Utilities d/b/a Granite State Electric Company
Docket No. DE 13-063 Return on Equity
EnergyNorth Natural Gas d/b/a National Grid NH
02/10 EnergyNorth Natural Gas d/b/a National Grid NH
Docket No. DG 10-017 Return on Equity
Unitil Energy Systems, Inc. (“Unitil”), EnergyNorth Natural Gas, Inc. d/b/a National Grid NH, Granite State Electric Company d/b/a National Grid, and Northern Utilities, Inc. – New Hampshire Division
08/08 Unitil Energy Systems, Inc. (“Unitil”), EnergyNorth Natural Gas, Inc. d/b/a National Grid NH, Granite State Electric Company d/b/a National Grid, and Northern Utilities, Inc. – New Hampshire Division
Docket No. DG 07-072 Carrying Charge Rate on Cash Working Capital
New Jersey Board of Public Utilities
The Southern Company; AGL Resources Inc.; AMS Corp. and Pivotal Holdings, Inc. d/b/a Elizabethtown Gas
04/16 The Southern Company; AGL Resources Inc.; AMS Corp. and Pivotal Holdings, Inc. d/b/a Elizabethtown Gas
BPU Docket No. GM15101196
Merger Approval
Atlantic City Electric Company 03/16 Atlantic City Electric Company Docket No. ER16030252 Return on Equity
Pepco Holdings, Inc. 04/14 Atlantic City Electric Company Docket No. ER14030245 Return on Equity
Orange and Rockland Utilities 11/13 Rockland Electric Company Docket No. ER13111135 Return on Equity
Atlantic City Electric Company 12/12 Atlantic City Electric Company Docket No. ER12121071 Return on Equity
Atlantic City Electric Company 08/11 Atlantic City Electric Company Docket No. ER11080469 Return on Equity
Docket U-16-___ Exhibit RBH-1 Page 12 of 19

SPONSOR DATE CASE/APPLICANT DOCKET NO. SUBJECT
Pepco Holdings, Inc. 09/06 Atlantic City Electric Company Docket No. EM06090638
Divestiture and Valuation of Electric Generating Assets
Pepco Holdings, Inc. 12/05 Atlantic City Electric Company Docket No. EM05121058 Market Value of Electric Generation Assets; Auction
Conectiv 06/03 Atlantic City Electric Company Docket No. EO03020091 Market Value of Electric Generation Assets; Auction Process
New Mexico Public Regulation Commission
Public Service Company of New Mexico
08/15 Public Service Company of New Mexico
Case No. 15-00261-UT Return on Equity (electric)
Public Service Company of New Mexico
12/14 Public Service Company of New Mexico
Case No. 14-00332-UT Return on Equity (electric)
Public Service Company of New Mexico
12/14 Public Service Company of New Mexico
Case No. 13-00390-UT Cost of Capital and Financial Integrity
Southwestern Public Service Company
02/11 Southwestern Public Service Company
Case No. 10-00395-UT Return on Equity (electric)
Public Service Company of New Mexico
06/10 Public Service Company of New Mexico
Case No. 10-00086-UT Return on Equity (electric)
Public Service Company of New Mexico
09/08 Public Service Company of New Mexico
Case No. 08-00273-UT Return on Equity (electric)
Xcel Energy, Inc. 07/07 Southwestern Public Service Company
Case No. 07-00319-UT Return on Equity (electric)
New York State Public Service Commission
Consolidated Edison Company of New York, Inc.
01/15 Consolidated Edison Company of New York, Inc.
Case No. 15-E-0050 Return on Equity (electric)
Orange and Rockland Utilities, Inc. 11/14 Orange and Rockland Utilities, Inc.
Case Nos. 14-E-0493 and 14-G-0494
Return on Equity (electric and gas)
Docket U-16-___ Exhibit RBH-1 Page 13 of 19

SPONSOR DATE CASE/APPLICANT DOCKET NO. SUBJECT
Consolidated Edison Company of New York, Inc.
01/13 Consolidated Edison Company of New York, Inc.
Case No. 13-E-0030 Return on Equity (electric)
Niagara Mohawk Corporation d/b/a National Grid for Electric Service
04/12 Niagara Mohawk Corporation d/b/a National Grid for Electric Service
Case No. 12-E-0201 Return on Equity (electric)
Niagara Mohawk Corporation d/b/a National Grid for Gas Service
04/12 Niagara Mohawk Corporation d/b/a National Grid for Gas Service
Case No. 12-G-0202 Return on Equity (gas)
Orange and Rockland Utilities, Inc. 07/11 Orange and Rockland Utilities, Inc.
Case No. 11-E-0408 Return on Equity (electric)
Orange and Rockland Utilities, Inc. 07/10 Orange and Rockland Utilities, Inc.
Case No. 10-E-0362 Return on Equity (electric)
Consolidated Edison Company of New York, Inc.
11/09 Consolidated Edison Company of New York, Inc.
Case No. 09-G-0795 Return on Equity (gas)
Consolidated Edison Company of New York, Inc.
11/09 Consolidated Edison Company of New York, Inc.
Case No. 09-S-0794 Return on Equity (steam)
Niagara Mohawk Power Corporation
07/01 Niagara Mohawk Power Corporation
Case No. 01-E-1046 Power Purchase and Sale Agreement; Standard Offer Service Agreement
North Carolina Utilities Commission
Public Service Company of North Carolina, Inc.
03/16 Public Service Company of North Carolina, Inc.
Docket No. G-5, Sub 565 Return on Equity
Dominion North Carolina Power 03/16 Dominion North Carolina Power Docket No. E-22, Sub 532
Return on Equity
Duke Energy Carolinas, LLC 02/13 Duke Energy Carolinas, LLC Docket No. E-7, Sub 1026
Return on Equity
Docket U-16-___ Exhibit RBH-1 Page 14 of 19

SPONSOR DATE CASE/APPLICANT DOCKET NO. SUBJECT
Carolina Power & Light Company d/b/a Progress Energy Carolinas, Inc.
10/12 Carolina Power & Light Company d/b/a Progress Energy Carolinas, Inc.
Docket No. E-2, Sub 1023
Return on Equity
Virginia Electric and Power Company d/b/a Dominion North Carolina Power
03/12 Virginia Electric and Power Company d/b/a Dominion North Carolina Power
Docket No. E-22, Sub 479
Return on Equity (electric)
Duke Energy Carolinas, LLC 07/11 Duke Energy Carolinas, LLC Docket No. E-7, Sub 989 Return on Equity (electric)
North Dakota Public Service Commission
Otter Tail Power Company 11/08 Otter Tail Power Company Docket No. 08-862 Return on Equity (electric)
Oklahoma Corporation Commission
CenterPoint Energy Resources Corp., d/b/a CenterPoint Energy Oklahoma Gas
03/16 CenterPoint Energy Resources Corp., d/b/a CenterPoint Energy Oklahoma Gas
Cause No. PUD201600094
Return on Equity
Oklahoma Gas & Electric Company
12/15 Oklahoma Gas & Electric Company
Cause No. PUD201500273
Return on Equity
Public Service Company of Oklahoma
07/15 Public Service Company of Oklahoma
Cause No. PUD201500208
Return on Equity
Oklahoma Gas & Electric Company
07/11 Oklahoma Gas & Electric Company
Cause No. PUD201100087
Return on Equity
CenterPoint Energy Resources Corp., d/b/a CenterPoint Energy Oklahoma Gas
03/09 CenterPoint Energy Oklahoma Gas
Cause No. PUD200900055
Return on Equity
Pennsylvania Public Utility Commission
Pike County Light & Power Company
01/14 Pike County Light & Power Company
Docket No. R-2013-2397237
Return on Equity (electric & gas)
Veolia Energy Philadelphia, Inc. 12/13 Veolia Energy Philadelphia, Inc. Docket No. R-2013-2386293
Return on Equity (steam)
Docket U-16-___ Exhibit RBH-1 Page 15 of 19

SPONSOR DATE CASE/APPLICANT DOCKET NO. SUBJECT
Rhode Island Public Utilities Commission
The Narragansett Electric Company d/b/a National Grid
04/12 The Narragansett Electric Company d/b/a National Grid
Docket No. 4323 Return on Equity (electric & gas)
National Grid RI – Gas 08/08 National Grid RI – Gas Docket No. 3943 Revenue Decoupling and Return on Equity
South Carolina Public Service Commission
Duke Energy Carolinas, LLC 03/13 Duke Energy Carolinas, LLC Docket No. 2013-59-E Return on Equity
South Carolina Electric & Gas 06/12 South Carolina Electric & Gas Docket No. 2012-218-E Return on Equity
Duke Energy Carolinas, LLC 08/11 Duke Energy Carolinas, LLC Docket No. 2011-271-E Return on Equity
South Carolina Electric & Gas 03/10 South Carolina Electric & Gas Docket No. 2009-489-E Return on Equity
South Dakota Public Utilities Commission
Otter Tail Power Company 08/10 Otter Tail Power Company Docket No. EL10-011 Return on Equity (electric)
Northern States Power Company 06/09 South Dakota Division of Northern States Power
Docket No. EL09-009 Return on Equity (electric)
Otter Tail Power Company 10/08 Otter Tail Power Company Docket No. EL08-030 Return on Equity (electric)
Texas Public Utility Commission
Southwestern Public Service Company
02/16 Southwestern Public Service Company
Docket No. 44524 Return on Equity (electric)
Wind Energy Transmission Texas, LLC
05/15 Wind Energy Transmission Texas, LLC
Docket No. 44746 Return on Equity
Cross Texas Transmission 12/14 Cross Texas Transmission Docket No. 43950 Return on Equity
Southwestern Public Service Company
12/14 Southwestern Public Service Company
Docket No. 43695 Return on Equity (electric)
Sharyland Utilities, L.P. 05/13 Sharyland Utilities, L.P. Docket No. 41474 Return on Equity
Wind Energy Texas Transmission, LLC
08/12 Wind Energy Texas Transmission, LLC
Docket No. 40606 Return on Equity
Docket U-16-___ Exhibit RBH-1 Page 16 of 19

SPONSOR DATE CASE/APPLICANT DOCKET NO. SUBJECT
Southwestern Electric Power Company
07/12 Southwestern Electric Power Company
Docket No. 40443 Return on Equity
Oncor Electric Delivery Company, LLC
01/11 Oncor Electric Delivery Company, LLC
Docket No. 38929 Return on Equity
Texas-New Mexico Power Company
08/10 Texas-New Mexico Power Company
Docket No. 38480 Return on Equity (electric)
CenterPoint Energy Houston Electric LLC
06/10 CenterPoint Energy Houston Electric LLC
Docket No. 38339 Return on Equity
Xcel Energy, Inc. 05/10 Southwestern Public Service Company
Docket No. 38147 Return on Equity (electric)
Texas-New Mexico Power Company
08/08 Texas-New Mexico Power Company
Docket No. 36025 Return on Equity (electric)
Xcel Energy, Inc. 05/06 Southwestern Public Service Company
Docket No. 32766 Return on Equity (electric)
Texas Railroad Commission
Centerpoint Energy Resources Corp. d/b/a Centerpoint Energy Entex and Centerpoint Energy Texas Gas
03/15 Centerpoint Energy Resources Corp. d/b/a Centerpoint Energy Entex and Centerpoint Energy Texas Gas
GUD 10432 Return on Equity
CenterPoint Energy Resources Corp. d/b/a CenterPoint Energy Entex and CenterPoint Energy Texas Gas
07/12 CenterPoint Energy Resources Corp. d/b/a CenterPoint Energy Entex and CenterPoint Energy Texas Gas
GUD 10182 Return on Equity
Atmos Energy Corporation – West Texas Division
06/12 Atmos Energy Corporation – West Texas Division
GUD 10175 Return on Equity
Atmos Energy Corporation – Mid-Texas Division
06/12 Atmos Energy Corporation – Mid-Texas Division
GUD 10171 Return on Equity
CenterPoint Energy Resources Corp. d/b/a CenterPoint Energy Entex and CenterPoint Energy Texas Gas
12/10 CenterPoint Energy Resources Corp. d/b/a CenterPoint Energy Entex and CenterPoint Energy Texas Gas
GUD 10038 Return on Equity
Docket U-16-___ Exhibit RBH-1 Page 17 of 19

SPONSOR DATE CASE/APPLICANT DOCKET NO. SUBJECT
Atmos Pipeline – Texas 09/10 Atmos Pipeline - Texas GUD 10000 Return on Equity
CenterPoint Energy Resources Corp. d/b/a CenterPoint Energy Entex and CenterPoint Energy Texas Gas
07/09 CenterPoint Energy Resources Corp. d/b/a CenterPoint Energy Entex and CenterPoint Energy Texas Gas
GUD 9902 Return on Equity
CenterPoint Energy Resources Corp. d/b/a CenterPoint Energy Texas Gas
03/08 CenterPoint Energy Resources Corp. d/b/a CenterPoint Energy Texas Gas
GUD 9791 Return on Equity
Utah Public Service Commission
Questar Gas Company 12/07 Questar Gas Company Docket No. 07-057-13 Return on Equity
Vermont Public Service Board
Central Vermont Public Service Corporation; Green Mountain Power
02/12 Central Vermont Public Service Corporation; Green Mountain Power
Docket No. 7770 Merger Policy
Central Vermont Public Service Corporation
12/10 Central Vermont Public Service Corporation
Docket No. 7627 Return on Equity (electric)
Green Mountain Power 04/06 Green Mountain Power Docket Nos. 7175 and 7176
Return on Equity (electric)
Vermont Gas Systems, Inc. 12/05 Vermont Gas Systems Docket Nos. 7109 and 7160
Return on Equity (gas)
Virginia State Corporation Commission
Virginia Electric and Power Company
12/15 Virginia Electric and Power Company
Case Nos. PUE-2015-0058; PUE-2015-0059; PUE-2015-0060; PUE-2015-0061; PUE-2015-0075; PUE-2015-0089; PUE-2015-0102; PUE-2015-0104
Return on Equity
Virginia Electric and Power Company
03/15 Virginia Electric and Power Company
Case No. PUE-2015-00027
Return on Equity
Docket U-16-___ Exhibit RBH-1 Page 18 of 19

SPONSOR DATE CASE/APPLICANT DOCKET NO. SUBJECT
Virginia Electric and Power Company
03/13 Virginia Electric and Power Company
Case No. PUE-2013-00020
Return on Equity
Virginia Natural Gas, Inc. 02/11 Virginia Natural Gas, Inc. Case No. PUE-2010-00142
Capital Structure
Columbia Gas Of Virginia, Inc. 06/06 Columbia Gas Of Virginia, Inc. Case No. PUE-2005-00098
Merger Synergies
Dominion Resources 10/01 Virginia Electric and Power Company
Case No. PUE000584 Corporate Structure and Electric Generation Strategy
Expert Report
United States District Court, Western District of Texas, Austin Division
Southwestern Public Service Company
02/12 Southwestern Public Service Company
C.A. No. A-09-CA-917-SS PURPA and FERC regulations
Docket U-16-___ Exhibit RBH-1 Page 19 of 19

[1] [2] [3] [4] [5] [6] [7] [8] [9] [10] [11] [12] [13] [14] [15] [16]
Company TickerDividend
1Dividend
2Dividend
3Dividend
4
Expected Dividend
1
Expected Dividend
2
Expected Dividend
3
Expected Dividend
4 Stock Price
Zacks Earnings Growth
First Call Earnings Growth
Value Line Earnings Growth
Average Earnings Growth
LowROE
MeanROE
HighROE
Atmos Energy Corporation ATO $0.39 $0.39 $0.42 $0.42 $0.41 $0.41 $0.45 $0.45 $72.93 6.60% 6.40% 6.00% 6.33% 8.43% 8.77% 9.04%Boardwalk Pipeline Partners, LP BWP $0.10 $0.10 $0.10 $0.10 $0.11 $0.11 $0.11 $0.11 $15.01 NA 8.14% 10.00% 9.07% 11.14% 12.11% 13.07%Dominion Midstream Partners, LP DM $0.19 $0.20 $0.21 $0.22 $0.23 $0.24 $0.26 $0.27 $32.44 20.30% 23.00% NA 21.65% 23.61% 25.01% 26.41%EnLink Midstream Partners, LP ENLK $0.39 $0.39 $0.39 $0.39 $0.41 $0.41 $0.41 $0.41 $12.55 6.00% 6.00% NA 6.00% 20.09% 20.09% 20.09%EQT Midstream Partners, LP EQM $0.64 $0.68 $0.71 $0.75 $0.71 $0.74 $0.78 $0.82 $73.96 16.00% 4.47% NA 10.24% 8.50% 14.57% 20.65%Kinder Morgan Inc. KMI $0.49 $0.51 $0.13 $0.13 $0.54 $0.57 $0.14 $0.14 $18.03 NA 8.84% 13.00% 10.92% 17.04% 19.36% 21.69%New Jersey Resources Corporation NJR $0.23 $0.24 $0.24 $0.24 $0.24 $0.25 $0.25 $0.25 $35.79 6.50% 6.50% 1.50% 4.83% 4.22% 7.68% 9.41%Northwest Natural Gas Company NWN $0.47 $0.47 $0.47 $0.47 $0.49 $0.49 $0.49 $0.49 $51.99 4.00% 4.00% 5.00% 4.33% 7.84% 8.19% 8.89%South Jersey Industries, Inc. SJI $0.25 $0.26 $0.26 $0.26 $0.27 $0.28 $0.28 $0.28 $27.81 6.00% 6.00% 5.50% 5.83% 9.59% 9.94% 10.12%Southwest Gas Corporation SWX $0.41 $0.41 $0.41 $0.45 $0.43 $0.43 $0.43 $0.47 $64.77 5.00% 4.00% 7.00% 5.33% 6.74% 8.12% 9.85%Spectra Energy Partners, LP SEP $0.60 $0.61 $0.63 $0.64 $0.63 $0.65 $0.66 $0.67 $48.23 5.30% 5.61% NA 5.46% 10.93% 11.09% 11.26%Spire Inc SR $0.46 $0.49 $0.49 $0.49 $0.49 $0.52 $0.52 $0.52 $66.20 4.80% 4.70% 9.00% 6.17% 7.84% 9.37% 12.32%TC Pipelines, LP TCP $0.89 $0.89 $0.89 $0.89 $0.94 $0.94 $0.94 $0.94 $51.55 6.00% 5.70% NA 5.85% 13.36% 13.52% 13.69%WGL Holdings, Inc. WGL $0.46 $0.46 $0.46 $0.49 $0.49 $0.49 $0.49 $0.52 $69.31 7.30% 8.00% 5.00% 6.77% 7.92% 9.76% 11.04%
Mean 7.82% 7.24% 6.89% 7.77% 11.23% 12.68% 14.11%Median 6.00% 6.00% 6.00% 6.08% 9.05% 10.52% 11.79%
Notes:[1] Source: Bloomberg Professional Service[2] Source: Bloomberg Professional Service[3] Source: Bloomberg Professional Service[4] Source: Bloomberg Professional Service[5] Equals Col. [1] x (1 + Col. [13])[6] Equals Col. [2] x (1 + Col. [13])[7] Equals Col. [3] x (1 + Col. [13])[8] Equals Col. [4] x (1 + Col. [13])[9] Source: Bloomberg Professional, equals indicated number of trading day average as of April 29, 2016[10] Source: Zacks[11] Source: Yahoo! Finance[12] Source: Value Line[13] Equals Average (Cols. [10], [11], [12])[14] Implied Low DCF[15] Implied Mean DCF[16] Implied High DCF
Quarterly Discounted Cash Flow Model30 Day Average Stock Price
Docket U-16-___ Exhibit RBH-2 Page 1 of 3

[1] [2] [3] [4] [5] [6] [7] [8] [9] [10] [11] [12] [13] [14] [15] [16]
Company TickerDividend
1Dividend
2Dividend
3Dividend
4
Expected Dividend
1
Expected Dividend
2
Expected Dividend
3
Expected Dividend
4 Stock Price
Zacks Earnings Growth
First Call Earnings Growth
Value Line Earnings Growth
Average Earnings Growth
LowROE
MeanROE
HighROE
Atmos Energy Corporation ATO $0.39 $0.39 $0.42 $0.42 $0.41 $0.41 $0.45 $0.45 $69.19 6.60% 6.40% 6.00% 6.33% 8.56% 8.90% 9.18%Boardwalk Pipeline Partners, LP BWP $0.10 $0.10 $0.10 $0.10 $0.11 $0.11 $0.11 $0.11 $12.94 NA 8.14% 10.00% 9.07% 11.63% 12.60% 13.57%Dominion Midstream Partners, LP DM $0.19 $0.20 $0.21 $0.22 $0.23 $0.24 $0.26 $0.27 $30.21 20.30% 23.00% NA 21.65% 23.85% 25.26% 26.66%EnLink Midstream Partners, LP ENLK $0.39 $0.39 $0.39 $0.39 $0.41 $0.41 $0.41 $0.41 $11.88 6.00% 6.00% NA 6.00% 20.91% 20.91% 20.91%EQT Midstream Partners, LP EQM $0.64 $0.68 $0.71 $0.75 $0.71 $0.74 $0.78 $0.82 $71.60 16.00% 4.47% NA 10.24% 8.64% 14.72% 20.81%Kinder Morgan Inc. KMI $0.49 $0.51 $0.13 $0.13 $0.54 $0.57 $0.14 $0.14 $16.66 NA 8.84% 13.00% 10.92% 17.74% 20.09% 22.44%New Jersey Resources Corporation NJR $0.23 $0.24 $0.24 $0.24 $0.24 $0.25 $0.25 $0.25 $34.74 6.50% 6.50% 1.50% 4.83% 4.30% 7.77% 9.50%Northwest Natural Gas Company NWN $0.47 $0.47 $0.47 $0.47 $0.49 $0.49 $0.49 $0.49 $51.46 4.00% 4.00% 5.00% 4.33% 7.88% 8.23% 8.93%South Jersey Industries, Inc. SJI $0.25 $0.26 $0.26 $0.26 $0.27 $0.28 $0.28 $0.28 $25.97 6.00% 6.00% 5.50% 5.83% 9.89% 10.24% 10.42%Southwest Gas Corporation SWX $0.41 $0.41 $0.41 $0.45 $0.43 $0.43 $0.43 $0.47 $60.75 5.00% 4.00% 7.00% 5.33% 6.92% 8.31% 10.04%Spectra Energy Partners, LP SEP $0.60 $0.61 $0.63 $0.64 $0.63 $0.65 $0.66 $0.67 $46.03 5.30% 5.61% NA 5.46% 11.20% 11.37% 11.54%Spire Inc SR $0.46 $0.49 $0.49 $0.49 $0.49 $0.52 $0.52 $0.52 $63.87 4.80% 4.70% 9.00% 6.17% 7.96% 9.48% 12.44%TC Pipelines, LP TCP $0.89 $0.89 $0.89 $0.89 $0.94 $0.94 $0.94 $0.94 $47.17 6.00% 5.70% NA 5.85% 14.09% 14.25% 14.42%WGL Holdings, Inc. WGL $0.46 $0.46 $0.46 $0.49 $0.49 $0.49 $0.49 $0.52 $67.03 7.30% 8.00% 5.00% 6.77% 8.02% 9.86% 11.14%
Mean 7.82% 7.24% 6.89% 7.77% 11.54% 13.00% 14.43%Median 6.00% 6.00% 6.00% 6.08% 9.26% 10.81% 11.99%
Notes:[1] Source: Bloomberg Professional Service[2] Source: Bloomberg Professional Service[3] Source: Bloomberg Professional Service[4] Source: Bloomberg Professional Service[5] Equals Col. [1] x (1 + Col. [13])[6] Equals Col. [2] x (1 + Col. [13])[7] Equals Col. [3] x (1 + Col. [13])[8] Equals Col. [4] x (1 + Col. [13])[9] Source: Bloomberg Professional, equals indicated number of trading day average as of April 29, 2016[10] Source: Zacks[11] Source: Yahoo! Finance[12] Source: Value Line[13] Equals Average (Cols. [10], [11], [12])[14] Implied Low DCF[15] Implied Mean DCF[16] Implied High DCF
Quarterly Discounted Cash Flow Model90 Day Average Stock Price
Docket U-16-___ Exhibit RBH-2 Page 2 of 3

[1] [2] [3] [4] [5] [6] [7] [8] [9] [10] [11] [12] [13] [14] [15] [16]
Company TickerDividend
1Dividend
2Dividend
3Dividend
4
Expected Dividend
1
Expected Dividend
2
Expected Dividend
3
Expected Dividend
4 Stock Price
Zacks Earnings Growth
First Call Earnings Growth
Value Line Earnings Growth
Average Earnings Growth
LowROE
MeanROE
HighROE
Atmos Energy Corporation ATO $0.39 $0.39 $0.42 $0.42 $0.41 $0.41 $0.45 $0.45 $64.13 6.60% 6.40% 6.00% 6.33% 8.76% 9.11% 9.38%Boardwalk Pipeline Partners, LP BWP $0.10 $0.10 $0.10 $0.10 $0.11 $0.11 $0.11 $0.11 $12.84 NA 8.14% 10.00% 9.07% 11.65% 12.62% 13.60%Dominion Midstream Partners, LP DM $0.19 $0.20 $0.21 $0.22 $0.23 $0.24 $0.26 $0.27 $30.63 20.30% 23.00% NA 21.65% 23.80% 25.21% 26.61%EnLink Midstream Partners, LP ENLK $0.39 $0.39 $0.39 $0.39 $0.41 $0.41 $0.41 $0.41 $14.22 6.00% 6.00% NA 6.00% 18.36% 18.36% 18.36%EQT Midstream Partners, LP EQM $0.64 $0.68 $0.71 $0.75 $0.71 $0.74 $0.78 $0.82 $71.64 16.00% 4.47% NA 10.24% 8.63% 14.72% 20.81%Kinder Morgan Inc. KMI $0.49 $0.51 $0.13 $0.13 $0.54 $0.57 $0.14 $0.14 $21.95 NA 8.84% 13.00% 10.92% 15.53% 17.81% 20.09%New Jersey Resources Corporation NJR $0.23 $0.24 $0.24 $0.24 $0.24 $0.25 $0.25 $0.25 $32.18 6.50% 6.50% 1.50% 4.83% 4.53% 8.00% 9.74%Northwest Natural Gas Company NWN $0.47 $0.47 $0.47 $0.47 $0.49 $0.49 $0.49 $0.49 $48.96 4.00% 4.00% 5.00% 4.33% 8.08% 8.43% 9.13%South Jersey Industries, Inc. SJI $0.25 $0.26 $0.26 $0.26 $0.27 $0.28 $0.28 $0.28 $25.21 6.00% 6.00% 5.50% 5.83% 10.02% 10.37% 10.55%Southwest Gas Corporation SWX $0.41 $0.41 $0.41 $0.45 $0.43 $0.43 $0.43 $0.47 $58.68 5.00% 4.00% 7.00% 5.33% 7.03% 8.41% 10.15%Spectra Energy Partners, LP SEP $0.60 $0.61 $0.63 $0.64 $0.63 $0.65 $0.66 $0.67 $44.93 5.30% 5.61% NA 5.46% 11.35% 11.52% 11.69%Spire Inc SR $0.46 $0.49 $0.49 $0.49 $0.49 $0.52 $0.52 $0.52 $59.76 4.80% 4.70% 9.00% 6.17% 8.18% 9.72% 12.68%TC Pipelines, LP TCP $0.89 $0.89 $0.89 $0.89 $0.94 $0.94 $0.94 $0.94 $48.99 6.00% 5.70% NA 5.85% 13.77% 13.93% 14.10%WGL Holdings, Inc. WGL $0.46 $0.46 $0.46 $0.49 $0.49 $0.49 $0.49 $0.52 $62.75 7.30% 8.00% 5.00% 6.77% 8.23% 10.07% 11.36%
Mean 7.82% 7.24% 6.89% 7.77% 11.28% 12.73% 14.16%Median 6.00% 6.00% 6.00% 6.08% 9.39% 10.95% 12.18%
Notes:[1] Source: Bloomberg Professional Service[2] Source: Bloomberg Professional Service[3] Source: Bloomberg Professional Service[4] Source: Bloomberg Professional Service[5] Equals Col. [1] x (1 + Col. [13])[6] Equals Col. [2] x (1 + Col. [13])[7] Equals Col. [3] x (1 + Col. [13])[8] Equals Col. [4] x (1 + Col. [13])[9] Source: Bloomberg Professional, equals indicated number of trading day average as of April 29, 2016[10] Source: Zacks[11] Source: Yahoo! Finance[12] Source: Value Line[13] Equals Average (Cols. [10], [11], [12])[14] Implied Low DCF[15] Implied Mean DCF[16] Implied High DCF
Quarterly Discounted Cash Flow Model180 Day Average Stock Price
Docket U-16-___ Exhibit RBH-2 Page 3 of 3

Constant Growth Discounted Cash Flow Model30 Day Average Stock Price
[1] [2] [3] [4] [5] [6] [7] [8] [9] [10] [11]
Company TickerAnnualized Dividend
Average StockPrice
Dividend Yield
Expected Dividend
Yield
Zacks Earnings Growth
First Call Earnings Growth
Value Line Earnings Growth
Average Earnings Growth
LowROE
MeanROE
HighROE
Atmos Energy Corporation ATO $1.68 $72.93 2.30% 2.38% 6.60% 6.40% 6.00% 6.33% 8.37% 8.71% 8.98%Boardwalk Pipeline Partners, LP BWP $0.40 $15.01 2.67% 2.79% NA 8.14% 10.00% 9.07% 10.91% 11.86% 12.80%Dominion Midstream Partners, LP DM $0.90 $32.44 2.77% 3.07% 20.30% 23.00% NA 21.65% 23.35% 24.72% 26.09%EnLink Midstream Partners, LP ENLK $1.56 $12.55 12.43% 12.81% 6.00% 6.00% NA 6.00% 18.81% 18.81% 18.81%EQT Midstream Partners, LP EQM $2.98 $73.96 4.03% 4.24% 16.00% 4.47% NA 10.24% 8.59% 14.47% 20.35%Kinder Morgan Inc. KMI $0.50 $18.03 2.77% 2.92% NA 8.84% 13.00% 10.92% 11.74% 13.84% 15.95%New Jersey Resources Corporation NJR $0.96 $35.79 2.68% 2.75% 6.50% 6.50% 1.50% 4.83% 4.20% 7.58% 9.27%Northwest Natural Gas Company NWN $1.87 $51.99 3.60% 3.68% 4.00% 4.00% 5.00% 4.33% 7.67% 8.01% 8.69%South Jersey Industries, Inc. SJI $1.06 $27.81 3.79% 3.90% 6.00% 6.00% 5.50% 5.83% 9.40% 9.74% 9.91%Southwest Gas Corporation SWX $1.80 $64.77 2.78% 2.85% 5.00% 4.00% 7.00% 5.33% 6.83% 8.19% 9.88%Spectra Energy Partners, LP SEP $2.56 $48.23 5.30% 5.44% 5.30% 5.61% NA 5.46% 10.74% 10.90% 11.06%Spire Inc SR $1.96 $66.20 2.96% 3.05% 4.80% 4.70% 9.00% 6.17% 7.73% 9.22% 12.09%TC Pipelines, LP TCP $3.56 $51.55 6.91% 7.11% 6.00% 5.70% NA 5.85% 12.80% 12.96% 13.11%WGL Holdings, Inc. WGL $1.95 $69.31 2.81% 2.91% 7.30% 8.00% 5.00% 6.77% 7.88% 9.68% 10.93%
Mean 4.13% 4.28% 7.82% 7.24% 6.89% 7.77% 10.64% 12.05% 13.42%Median 2.89% 3.06% 6.00% 6.00% 6.00% 6.08% 8.99% 10.32% 11.58%
Notes:[1] Source: Bloomberg Professional Service[2] Source: Bloomberg Professional, equals indicated number of trading day average as of April 29, 2016[3] Equals [1] / [2][4] Equals [3] x (1 + 0.5 x [8])[5] Source: Zacks[6] Source: Yahoo! Finance[7] Source: Value Line[8] Equals Average([5], [6], [7])[9] Equals [3] x (1 + 0.5 x Minimum([5], [6], [7])) + Minimum([5], [6], [7])[10] Equals [4] + [8][11] Equals [3] x (1 + 0.5 x Maximum([5], [6], [7])) + Maximum([5], [6], [7])
Docket U-16-___ Exhibit RBH-3 Page 1 of 3

Constant Growth Discounted Cash Flow Model90 Day Average Stock Price
[1] [2] [3] [4] [5] [6] [7] [8] [9] [10] [11]
Company TickerAnnualized Dividend
Average StockPrice
Dividend Yield
Expected Dividend
Yield
Zacks Earnings Growth
First Call Earnings Growth
Value Line Earnings Growth
Average Earnings Growth
LowROE
MeanROE
HighROE
Atmos Energy Corporation ATO $1.68 $69.19 2.43% 2.50% 6.60% 6.40% 6.00% 6.33% 8.50% 8.84% 9.11%Boardwalk Pipeline Partners, LP BWP $0.40 $12.94 3.09% 3.23% NA 8.14% 10.00% 9.07% 11.36% 12.30% 13.25%Dominion Midstream Partners, LP DM $0.90 $30.21 2.97% 3.29% 20.30% 23.00% NA 21.65% 23.57% 24.94% 26.31%EnLink Midstream Partners, LP ENLK $1.56 $11.88 13.13% 13.52% 6.00% 6.00% NA 6.00% 19.52% 19.52% 19.52%EQT Midstream Partners, LP EQM $2.98 $71.60 4.16% 4.38% 16.00% 4.47% NA 10.24% 8.73% 14.61% 20.50%Kinder Morgan Inc. KMI $0.50 $16.66 3.00% 3.17% NA 8.84% 13.00% 10.92% 11.97% 14.09% 16.20%New Jersey Resources Corporation NJR $0.96 $34.74 2.76% 2.83% 6.50% 6.50% 1.50% 4.83% 4.28% 7.66% 9.35%Northwest Natural Gas Company NWN $1.87 $51.46 3.63% 3.71% 4.00% 4.00% 5.00% 4.33% 7.71% 8.05% 8.72%South Jersey Industries, Inc. SJI $1.06 $25.97 4.06% 4.18% 6.00% 6.00% 5.50% 5.83% 9.67% 10.01% 10.18%Southwest Gas Corporation SWX $1.80 $60.75 2.96% 3.04% 5.00% 4.00% 7.00% 5.33% 7.02% 8.38% 10.07%Spectra Energy Partners, LP SEP $2.56 $46.03 5.55% 5.70% 5.30% 5.61% NA 5.46% 11.00% 11.16% 11.32%Spire Inc SR $1.96 $63.87 3.07% 3.16% 4.80% 4.70% 9.00% 6.17% 7.84% 9.33% 12.21%TC Pipelines, LP TCP $3.56 $47.17 7.55% 7.77% 6.00% 5.70% NA 5.85% 13.46% 13.62% 13.77%WGL Holdings, Inc. WGL $1.95 $67.03 2.91% 3.01% 7.30% 8.00% 5.00% 6.77% 7.98% 9.77% 11.03%
Mean 4.38% 4.54% 7.82% 7.24% 6.89% 7.77% 10.90% 12.31% 13.68%Median 3.08% 3.26% 6.00% 6.00% 6.00% 6.08% 9.20% 10.59% 11.76%
Notes:[1] Source: Bloomberg Professional Service[2] Source: Bloomberg Professional, equals indicated number of trading day average as of April 29, 2016[3] Equals [1] / [2][4] Equals [3] x (1 + 0.5 x [8])[5] Source: Zacks[6] Source: Yahoo! Finance[7] Source: Value Line[8] Equals Average([5], [6], [7])[9] Equals [3] x (1 + 0.5 x Minimum([5], [6], [7])) + Minimum([5], [6], [7])[10] Equals [4] + [8][11] Equals [3] x (1 + 0.5 x Maximum([5], [6], [7])) + Maximum([5], [6], [7])
Docket U-16-___ Exhibit RBH-3 Page 2 of 3

Constant Growth Discounted Cash Flow Model180 Day Average Stock Price
[1] [2] [3] [4] [5] [6] [7] [8] [9] [10] [11]
Company TickerAnnualized Dividend
Average StockPrice
Dividend Yield
Expected Dividend
Yield
Zacks Earnings Growth
First Call Earnings Growth
Value Line Earnings Growth
Average Earnings Growth
LowROE
MeanROE
HighROE
Atmos Energy Corporation ATO $1.68 $64.13 2.62% 2.70% 6.60% 6.40% 6.00% 6.33% 8.70% 9.04% 9.31%Boardwalk Pipeline Partners, LP BWP $0.40 $12.84 3.12% 3.26% NA 8.14% 10.00% 9.07% 11.38% 12.33% 13.27%Dominion Midstream Partners, LP DM $0.90 $30.63 2.93% 3.25% 20.30% 23.00% NA 21.65% 23.53% 24.90% 26.27%EnLink Midstream Partners, LP ENLK $1.56 $14.22 10.97% 11.30% 6.00% 6.00% NA 6.00% 17.30% 17.30% 17.30%EQT Midstream Partners, LP EQM $2.98 $71.64 4.16% 4.37% 16.00% 4.47% NA 10.24% 8.72% 14.61% 20.49%Kinder Morgan Inc. KMI $0.50 $21.95 2.28% 2.40% NA 8.84% 13.00% 10.92% 11.22% 13.32% 15.43%New Jersey Resources Corporation NJR $0.96 $32.18 2.98% 3.06% 6.50% 6.50% 1.50% 4.83% 4.51% 7.89% 9.58%Northwest Natural Gas Company NWN $1.87 $48.96 3.82% 3.90% 4.00% 4.00% 5.00% 4.33% 7.90% 8.24% 8.91%South Jersey Industries, Inc. SJI $1.06 $25.21 4.18% 4.31% 6.00% 6.00% 5.50% 5.83% 9.80% 10.14% 10.31%Southwest Gas Corporation SWX $1.80 $58.68 3.07% 3.15% 5.00% 4.00% 7.00% 5.33% 7.13% 8.48% 10.17%Spectra Energy Partners, LP SEP $2.56 $44.93 5.69% 5.84% 5.30% 5.61% NA 5.46% 11.14% 11.30% 11.46%Spire Inc SR $1.96 $59.76 3.28% 3.38% 4.80% 4.70% 9.00% 6.17% 8.06% 9.55% 12.43%TC Pipelines, LP TCP $3.56 $48.99 7.27% 7.48% 6.00% 5.70% NA 5.85% 13.17% 13.33% 13.48%WGL Holdings, Inc. WGL $1.95 $62.75 3.11% 3.21% 7.30% 8.00% 5.00% 6.77% 8.19% 9.98% 11.23%
Mean 4.25% 4.40% 7.82% 7.24% 6.89% 7.77% 10.77% 12.17% 13.55%Median 3.20% 3.32% 6.00% 6.00% 6.00% 6.08% 9.26% 10.72% 11.94%
Notes:[1] Source: Bloomberg Professional Service[2] Source: Bloomberg Professional, equals indicated number of trading day average as of April 29, 2016[3] Equals [1] / [2][4] Equals [3] x (1 + 0.5 x [8])[5] Source: Zacks[6] Source: Yahoo! Finance[7] Source: Value Line[8] Equals Average([5], [6], [7])[9] Equals [3] x (1 + 0.5 x Minimum([5], [6], [7])) + Minimum([5], [6], [7])[10] Equals [4] + [8][11] Equals [3] x (1 + 0.5 x Maximum([5], [6], [7])) + Maximum([5], [6], [7])
Docket U-16-___ Exhibit RBH-3 Page 3 of 3

Ex-Ante Market Risk PremiumMarket DCF Method Based - Bloomberg
[1] [2] [3]S&P 500
Est. RequiredMarket Return
Current 30-Year Treasury (30-day
average)Implied Market Risk Premium
13.21% 2.64% 10.58%
[4] [5] [6] [7] [8] [9]
Company TickerMarket
Capitalization Weight in IndexEstimated
Dividend YieldLong-Term Growth Est. DCF Result
WeightedDCF Result
AGILENT TECHNOLOGIES INC A 13,412.35 0.07% 1.12% 11.70% 12.88% 0.0093%ALCOA INC AA 14,686.83 0.08% 1.08% 5.00% 6.11% 0.0048%AMERICAN AIRLINES GROUP INC AAL 20,056.78 0.11% 1.25% -15.24% -14.09% -0.0152%ADVANCE AUTO PARTS INC AAP 11,479.08 0.06% 0.16% 11.60% 11.76% 0.0073%APPLE INC AAPL 513,453.82 2.76% 2.33% 11.56% 14.03% 0.3872%ABBVIE INC ABBV 98,681.85 0.53% 3.77% 10.57% 14.53% 0.0771%AMERISOURCEBERGEN CORP ABC 19,183.67 0.10% 1.61% 12.50% 14.21% 0.0147%ABBOTT LABORATORIES ABT 57,309.11 0.31% 2.67% 11.51% 14.34% 0.0442%ACCENTURE PLC-CL A ACN 73,808.68 0.40% 2.03% 9.72% 11.85% 0.0470%ADOBE SYSTEMS INC ADBE 47,129.74 0.25% 0.00% 20.29% 20.29% 0.0514%ANALOG DEVICES INC ADI 17,460.28 0.09% 2.94% 9.48% 12.56% 0.0118%ARCHER-DANIELS-MIDLAND CO ADM 23,450.98 0.13% 3.02% 1.24% 4.28% 0.0054%AUTOMATIC DATA PROCESSING ADP 40,456.98 0.22% 2.34% 10.33% 12.79% 0.0278%ALLIANCE DATA SYSTEMS CORP ADS 12,017.84 0.06% 0.00% 13.83% 13.83% 0.0089%AUTODESK INC ADSK 13,429.18 0.07% 0.00% 12.48% 12.48% 0.0090%ADT CORP/THE ADT 6,949.62 0.04% 2.07% 6.27% 8.40% 0.0031%AMEREN CORPORATION AEE 11,646.47 0.06% 3.62% 5.81% 9.53% 0.0060%AMERICAN ELECTRIC POWER AEP 31,198.40 0.17% 3.56% 4.60% 8.24% 0.0138%AES CORP AES 7,362.62 0.04% 3.95% 4.85% 8.90% 0.0035%AETNA INC AET 39,361.86 0.21% 0.89% 11.11% 12.05% 0.0255%AFLAC INC AFL 28,901.22 0.16% 2.42% 8.09% 10.61% 0.0165%ALLERGAN PLC AGN 85,568.26 0.46% 0.00% 12.22% 12.22% 0.0562%AMERICAN INTERNATIONAL GROUP AIG 63,289.67 0.34% 2.29% 9.92% 12.33% 0.0419%APARTMENT INVT & MGMT CO -A AIV 6,273.60 0.03% 3.30% 11.92% 15.41% 0.0052%ASSURANT INC AIZ 5,370.80 0.03% 2.35% 10.37% 12.84% 0.0037%AKAMAI TECHNOLOGIES INC AKAM 8,970.47 0.05% 0.00% 17.33% 17.33% 0.0084%ALLSTATE CORP ALL 24,425.80 0.13% 2.02% 9.62% 11.73% 0.0154%ALLEGION PLC ALLE 6,265.77 0.03% 0.74% 13.72% 14.52% 0.0049%ALEXION PHARMACEUTICALS INC ALXN 31,297.15 0.17% 0.00% 26.38% 26.38% 0.0444%APPLIED MATERIALS INC AMAT 23,145.93 0.12% 2.01% 13.57% 15.71% 0.0196%AMETEK INC AME 11,268.34 0.06% 0.81% 10.38% 11.24% 0.0068%AFFILIATED MANAGERS GROUP AMG 9,165.17 0.05% 0.00% 13.56% 13.56% 0.0067%AMGEN INC AMGN 118,730.18 0.64% 2.53% 8.28% 10.91% 0.0696%AMERIPRISE FINANCIAL INC AMP 15,996.12 0.09% 3.02% 11.67% 14.86% 0.0128%AMERICAN TOWER CORP AMT 44,528.32 0.24% 2.05% 18.27% 20.51% 0.0491%AMAZON.COM INC AMZN 311,213.00 1.67% 0.00% 48.71% 48.71% 0.8149%AUTONATION INC AN 5,222.20 0.03% 0.00% 8.64% 8.64% 0.0024%ANTHEM INC ANTM 37,015.89 0.20% 1.82% 8.91% 10.81% 0.0215%AON PLC AON 28,390.99 0.15% 1.26% 10.57% 11.90% 0.0182%APACHE CORP APA 20,591.09 0.11% 1.85% 7.00% 8.91% 0.0099%ANADARKO PETROLEUM CORP APC 27,223.35 0.15% 0.38% 0.95% 1.33% 0.0019%AIR PRODUCTS & CHEMICALS INC APD 31,524.08 0.17% 2.24% 8.13% 10.47% 0.0177%AMPHENOL CORP-CL A APH 17,172.59 0.09% 1.04% 9.26% 10.34% 0.0095%AIRGAS INC ARG 10,316.71 N/A 1.68% N/A N/A N/AACTIVISION BLIZZARD INC ATVI 25,441.50 0.14% 0.73% 11.74% 12.51% 0.0171%AVALONBAY COMMUNITIES INC AVB 24,248.95 0.13% 3.06% 6.19% 9.34% 0.0122%BROADCOM LTD AVGO 56,907.79 0.31% 1.27% 15.28% 16.65% 0.0509%AVERY DENNISON CORP AVY 6,485.83 0.03% 2.17% 8.20% 10.46% 0.0036%AMERICAN WATER WORKS CO INC AWK 12,940.50 0.07% 2.03% 7.39% 9.49% 0.0066%AMERICAN EXPRESS CO AXP 62,226.10 0.33% 1.85% 8.20% 10.13% 0.0339%AUTOZONE INC AZO 22,848.92 0.12% 0.00% 13.08% 13.08% 0.0161%BOEING CO/THE BA 85,869.10 0.46% 3.24% 12.22% 15.66% 0.0723%BANK OF AMERICA CORP BAC 150,341.83 0.81% 1.84% 7.90% 9.81% 0.0793%BAXTER INTERNATIONAL INC BAX 24,328.69 0.13% 1.06% 10.50% 11.61% 0.0152%BED BATH & BEYOND INC BBBY 7,358.39 0.04% 0.55% 6.76% 7.33% 0.0029%BB&T CORP BBT 28,730.27 0.15% 3.19% 7.53% 10.84% 0.0167%BEST BUY CO INC BBY 10,372.99 0.06% 3.73% 10.44% 14.36% 0.0080%CR BARD INC BCR 15,556.03 0.08% 0.46% 14.28% 14.78% 0.0124%BECTON DICKINSON AND CO BDX 34,157.53 0.18% 1.64% 11.50% 13.23% 0.0243%FRANKLIN RESOURCES INC BEN 21,841.34 0.12% 1.93% 6.19% 8.18% 0.0096%BROWN-FORMAN CORP-CLASS B BF/B 19,893.37 0.11% 1.37% 6.92% 8.34% 0.0089%BAKER HUGHES INC BHI 21,175.84 0.11% 1.41% 9.48% 10.95% 0.0125%BIOGEN INC BIIB 60,236.97 0.32% 0.00% 9.45% 9.45% 0.0306%BANK OF NEW YORK MELLON CORP BK 43,298.25 0.23% 1.83% 9.57% 11.49% 0.0267%BLACKROCK INC BLK 58,856.48 0.32% 2.57% 12.48% 15.21% 0.0481%BALL CORP BLL 10,116.93 0.05% 0.72% 4.40% 5.13% 0.0028%BRISTOL-MYERS SQUIBB CO BMY 120,490.60 0.65% 2.12% 20.44% 22.77% 0.1475%
Docket U-16-___ Exhibit RBH-4 Page 1 of 14

[4] [5] [6] [7] [8] [9]
Company TickerMarket
Capitalization Weight in IndexEstimated
Dividend YieldLong-Term Growth Est. DCF Result
WeightedDCF Result
BERKSHIRE HATHAWAY INC-CL B BRK/B 359,275.10 N/A N/A 7.10% N/A N/ABOSTON SCIENTIFIC CORP BSX 29,684.46 0.16% 0.00% 9.27% 9.27% 0.0148%BORGWARNER INC BWA 7,816.88 0.04% 1.46% 11.45% 12.99% 0.0055%BAXALTA INC BXLT 28,655.31 0.15% 0.67% 8.00% 8.69% 0.0134%BOSTON PROPERTIES INC BXP 19,793.10 0.11% 2.65% 6.52% 9.26% 0.0099%CITIGROUP INC C 136,119.83 0.73% 0.84% 8.93% 9.81% 0.0718%CA INC CA 12,361.18 0.07% 3.40% 5.50% 8.99% 0.0060%CONAGRA FOODS INC CAG 19,446.65 0.10% 2.24% 7.75% 10.08% 0.0105%CARDINAL HEALTH INC CAH 25,839.15 0.14% 1.99% 8.73% 10.80% 0.0150%CATERPILLAR INC CAT 45,380.06 0.24% 4.00% 7.23% 11.37% 0.0277%CHUBB LTD CB 54,708.81 0.29% 2.35% 7.97% 10.42% 0.0306%CBRE GROUP INC - A CBG 9,903.62 N/A N/A 7.00% N/A N/ACBS CORP-CLASS B NON VOTING CBS 25,609.30 0.14% 1.16% 15.17% 16.42% 0.0226%COCA-COLA ENTERPRISES CCE 11,962.43 0.06% 2.29% 7.58% 9.96% 0.0064%CROWN CASTLE INTL CORP CCI 29,327.19 0.16% 4.13% 11.20% 15.56% 0.0245%CARNIVAL CORP CCL 37,022.75 0.20% 2.51% 17.01% 19.73% 0.0393%CELGENE CORP CELG 80,098.15 0.43% 0.00% 21.04% 21.04% 0.0906%CERNER CORP CERN 18,968.81 0.10% 0.00% 17.13% 17.13% 0.0175%CF INDUSTRIES HOLDINGS INC CF 7,708.06 0.04% 3.65% 8.00% 11.79% 0.0049%CITIZENS FINANCIAL GROUP CFG 12,061.51 0.06% 2.04% 9.00% 11.13% 0.0072%CHURCH & DWIGHT CO INC CHD 11,889.88 0.06% 1.53% 9.29% 10.89% 0.0070%CHESAPEAKE ENERGY CORP CHK 4,675.52 0.03% 0.00% 1.44% 1.44% 0.0004%C.H. ROBINSON WORLDWIDE INC CHRW 10,370.21 0.06% 2.46% 10.16% 12.74% 0.0071%CIGNA CORP CI 35,433.95 0.19% 0.03% 9.71% 9.74% 0.0186%CINCINNATI FINANCIAL CORP CINF 10,857.30 N/A N/A N/A N/A N/ACOLGATE-PALMOLIVE CO CL 63,332.81 0.34% 2.18% 8.90% 11.18% 0.0381%CLOROX COMPANY CLX 16,210.47 0.09% 2.48% 6.36% 8.92% 0.0078%COMERICA INC CMA 7,764.54 0.04% 1.95% 4.04% 6.03% 0.0025%COMCAST CORP-CLASS A CMCSA 147,476.40 0.79% 1.83% 11.07% 13.01% 0.1031%CME GROUP INC CME 31,123.73 0.17% 5.81% 11.74% 17.90% 0.0299%CHIPOTLE MEXICAN GRILL INC CMG 12,292.92 0.07% 0.00% 17.02% 17.02% 0.0112%CUMMINS INC CMI 19,935.59 0.11% 3.42% 4.96% 8.47% 0.0091%CMS ENERGY CORP CMS 11,388.84 0.06% 3.05% 6.40% 9.55% 0.0058%CENTENE CORP CNC 10,562.51 0.06% 0.00% 16.57% 16.57% 0.0094%CENTERPOINT ENERGY INC CNP 9,236.69 0.05% 4.80% 4.75% 9.67% 0.0048%CAPITAL ONE FINANCIAL CORP COF 37,575.58 0.20% 2.34% 6.74% 9.16% 0.0185%CABOT OIL & GAS CORP COG 11,112.46 0.06% 0.34% 40.79% 41.20% 0.0246%COACH INC COH 11,182.83 0.06% 3.35% 10.96% 14.50% 0.0087%ROCKWELL COLLINS INC COL 11,481.83 0.06% 1.54% 8.32% 9.92% 0.0061%CONOCOPHILLIPS COP 59,181.52 0.32% 2.09% 6.67% 8.83% 0.0281%COSTCO WHOLESALE CORP COST 65,034.26 0.35% 1.14% 9.28% 10.47% 0.0366%CAMPBELL SOUP CO CPB 19,077.46 0.10% 2.18% 7.60% 9.86% 0.0101%COLUMBIA PIPELINE GROUP CPGX 10,257.82 N/A 2.20% N/A N/A N/ASALESFORCE.COM INC CRM 51,425.30 0.28% 0.00% 27.09% 27.09% 0.0749%CISCO SYSTEMS INC CSCO 138,333.01 0.74% 3.42% 8.77% 12.34% 0.0917%CSRA INC CSRA 4,211.50 0.02% 41.22% 10.00% 53.28% 0.0121%CSX CORP CSX 26,066.50 0.14% 2.74% 5.84% 8.66% 0.0121%CINTAS CORP CTAS 9,606.75 0.05% 1.18% 11.95% 13.20% 0.0068%CENTURYLINK INC CTL 16,903.83 0.09% 6.98% -1.23% 5.71% 0.0052%COGNIZANT TECH SOLUTIONS-A CTSH 35,554.36 0.19% 0.00% 15.06% 15.06% 0.0288%CITRIX SYSTEMS INC CTXS 12,690.59 0.07% 0.00% 16.70% 16.70% 0.0114%CABLEVISION SYSTEMS-NY GRP-A CVC 9,237.67 0.05% 0.91% 8.10% 9.04% 0.0045%CVS HEALTH CORP CVS 109,774.88 0.59% 1.64% 14.03% 15.79% 0.0932%CHEVRON CORP CVX 192,578.89 1.04% 4.22% 7.38% 11.75% 0.1217%CONCHO RESOURCES INC CXO 15,283.36 0.08% 0.00% 25.00% 25.00% 0.0205%DOMINION RESOURCES INC/VA D 44,038.26 0.24% 3.88% 6.36% 10.36% 0.0245%DELTA AIR LINES INC DAL 32,151.80 0.17% 1.37% 18.50% 19.99% 0.0346%DU PONT (E.I.) DE NEMOURS DD 57,573.18 0.31% 2.39% 7.40% 9.88% 0.0306%DEERE & CO DE 26,522.05 0.14% 2.85% 7.68% 10.64% 0.0152%DISCOVER FINANCIAL SERVICES DFS 23,195.92 0.12% 2.12% 8.52% 10.72% 0.0134%DOLLAR GENERAL CORP DG 23,481.13 0.13% 0.97% 13.76% 14.80% 0.0187%QUEST DIAGNOSTICS INC DGX 10,633.34 0.06% 2.11% 11.00% 13.23% 0.0076%DR HORTON INC DHI 11,150.02 0.06% 1.06% 15.28% 16.43% 0.0098%DANAHER CORP DHR 66,631.28 0.36% 0.64% 11.98% 12.66% 0.0453%WALT DISNEY CO/THE DIS 168,475.93 0.91% 1.39% 10.13% 11.58% 0.1049%DISCOVERY COMMUNICATIONS-A DISCA 16,896.92 0.09% 0.00% 17.25% 17.25% 0.0157%DELPHI AUTOMOTIVE PLC DLPH 20,321.88 0.11% 1.55% 10.24% 11.87% 0.0130%DOLLAR TREE INC DLTR 18,746.42 0.10% 0.00% 17.67% 17.67% 0.0178%DUN & BRADSTREET CORP DNB 3,999.08 0.02% 1.68% 7.35% 9.09% 0.0020%DIAMOND OFFSHORE DRILLING DO 3,327.74 0.02% 0.00% -9.70% -9.70% -0.0017%DOVER CORP DOV 10,193.27 0.05% 2.62% 10.48% 13.23% 0.0073%DOW CHEMICAL CO/THE DOW 59,071.98 0.32% 3.54% 6.00% 9.64% 0.0306%DR PEPPER SNAPPLE GROUP INC DPS 16,892.17 0.09% 2.29% 13.24% 15.69% 0.0142%DARDEN RESTAURANTS INC DRI 7,888.68 0.04% 3.33% 13.38% 16.94% 0.0072%DTE ENERGY COMPANY DTE 15,998.14 0.09% 3.37% 5.63% 9.09% 0.0078%DUKE ENERGY CORP DUK 54,263.11 0.29% 4.31% 4.54% 8.95% 0.0261%DAVITA HEALTHCARE PARTNERS I DVA 15,261.74 0.08% 0.00% 11.65% 11.65% 0.0096%DEVON ENERGY CORP DVN 18,169.17 0.10% 1.21% 8.88% 10.14% 0.0099%
Docket U-16-___ Exhibit RBH-4 Page 2 of 14

[4] [5] [6] [7] [8] [9]
Company TickerMarket
Capitalization Weight in IndexEstimated
Dividend YieldLong-Term Growth Est. DCF Result
WeightedDCF Result
ELECTRONIC ARTS INC EA 19,130.79 0.10% 0.00% 11.70% 11.70% 0.0120%EBAY INC EBAY 28,067.73 0.15% 0.00% 9.33% 9.33% 0.0141%ECOLAB INC ECL 33,762.35 0.18% 1.22% 12.56% 13.85% 0.0251%CONSOLIDATED EDISON INC ED 21,923.32 0.12% 3.59% 3.50% 7.16% 0.0084%EQUIFAX INC EFX 14,311.42 0.08% 1.10% 9.21% 10.35% 0.0080%EDISON INTERNATIONAL EIX 23,038.11 0.12% 2.76% 4.85% 7.68% 0.0095%ESTEE LAUDER COMPANIES-CL A EL 35,335.40 0.19% 1.19% 11.79% 13.05% 0.0248%EMC CORP/MA EMC 50,989.67 0.27% 1.85% 10.78% 12.73% 0.0349%EASTMAN CHEMICAL CO EMN 11,299.52 0.06% 2.18% 5.70% 7.94% 0.0048%EMERSON ELECTRIC CO EMR 35,133.42 0.19% 3.50% 7.20% 10.83% 0.0204%ENDO INTERNATIONAL PLC ENDP 6,011.84 0.03% 0.00% 6.03% 6.03% 0.0019%EOG RESOURCES INC EOG 45,432.20 0.24% 0.81% -16.56% -15.82% -0.0386%EQUINIX INC EQIX 22,935.90 0.12% 2.12% 27.85% 30.27% 0.0373%EQUITY RESIDENTIAL EQR 24,879.45 0.13% 17.33% 6.26% 24.14% 0.0323%EQT CORP EQT 11,257.64 0.06% 0.17% 25.00% 25.19% 0.0152%EVERSOURCE ENERGY ES 17,903.17 0.10% 3.16% 6.67% 9.94% 0.0096%EXPRESS SCRIPTS HOLDING CO ESRX 46,636.88 0.25% 0.00% 14.79% 14.79% 0.0371%ESSEX PROPERTY TRUST INC ESS 14,420.73 0.08% 2.87% 5.84% 8.79% 0.0068%E*TRADE FINANCIAL CORP ETFC 7,038.38 0.04% 0.04% 18.07% 18.11% 0.0069%EATON CORP PLC ETN 28,977.66 0.16% 3.65% 8.47% 12.27% 0.0191%ENTERGY CORP ETR 13,483.36 0.07% 4.56% 2.00% 6.61% 0.0048%EDWARDS LIFESCIENCES CORP EW 22,491.32 0.12% 0.00% 17.60% 17.60% 0.0213%EXELON CORP EXC 32,342.27 0.17% 3.60% 5.18% 8.87% 0.0154%EXPEDITORS INTL WASH INC EXPD 9,056.87 0.05% 1.52% 9.15% 10.74% 0.0052%EXPEDIA INC EXPE 17,261.72 0.09% 0.74% 22.43% 23.25% 0.0216%EXTRA SPACE STORAGE INC EXR 10,629.74 0.06% 2.97% 5.91% 8.97% 0.0051%FORD MOTOR CO F 53,871.64 0.29% 5.11% 8.93% 14.27% 0.0413%FASTENAL CO FAST 13,516.85 0.07% 2.57% 13.68% 16.43% 0.0119%FACEBOOK INC-A FB 336,655.73 1.81% 0.00% 30.41% 30.41% 0.5504%FREEPORT-MCMORAN INC FCX 17,528.36 0.09% 0.00% -71.50% -71.50% -0.0674%FEDEX CORP FDX 44,319.45 0.24% 0.61% 14.31% 14.96% 0.0357%FIRSTENERGY CORP FE 13,841.38 0.07% 4.42% -0.44% 3.97% 0.0030%F5 NETWORKS INC FFIV 7,016.29 0.04% 0.00% 13.18% 13.18% 0.0050%FIDELITY NATIONAL INFO SERV FIS 21,434.86 0.12% 1.66% 11.98% 13.74% 0.0158%FISERV INC FISV 21,790.76 0.12% 0.00% 12.74% 12.74% 0.0149%FIFTH THIRD BANCORP FITB 14,351.48 0.08% 3.00% 3.53% 6.58% 0.0051%FOOT LOCKER INC FL 8,361.64 0.04% 1.80% 11.49% 13.39% 0.0060%FLIR SYSTEMS INC FLIR 4,155.66 0.02% 1.52% 12.50% 14.12% 0.0032%FLUOR CORP FLR 7,609.21 0.04% 1.55% 5.60% 7.19% 0.0029%FLOWSERVE CORP FLS 6,363.21 0.03% 1.54% 8.22% 9.82% 0.0034%FMC CORP FMC 5,785.79 0.03% 1.54% 10.30% 11.92% 0.0037%TWENTY-FIRST CENTURY FOX-A FOXA 57,925.92 0.31% 1.06% 13.79% 14.93% 0.0465%FEDERAL REALTY INVS TRUST FRT 10,776.58 0.06% 2.56% 5.30% 7.92% 0.0046%FIRST SOLAR INC FSLR 5,709.37 0.03% 0.00% 5.50% 5.50% 0.0017%FMC TECHNOLOGIES INC FTI 6,901.58 0.04% 0.00% -12.97% -12.97% -0.0048%FRONTIER COMMUNICATIONS CORP FTR 6,517.15 0.04% 7.55% 21.29% 29.64% 0.0104%AGL RESOURCES INC GAS 7,928.51 0.04% 3.22% 6.35% 9.67% 0.0041%GENERAL DYNAMICS CORP GD 42,949.51 0.23% 2.11% 7.75% 9.94% 0.0229%GENERAL ELECTRIC CO GE 285,517.77 1.53% 3.04% 9.98% 13.17% 0.2022%GENERAL GROWTH PROPERTIES GGP 24,746.93 0.13% 2.77% 6.80% 9.67% 0.0129%GILEAD SCIENCES INC GILD 119,492.96 0.64% 2.09% 2.11% 4.22% 0.0271%GENERAL MILLS INC GIS 36,460.59 0.20% 2.88% 10.16% 13.19% 0.0258%CORNING INC GLW 20,076.76 0.11% 2.91% 12.34% 15.42% 0.0166%GENERAL MOTORS CO GM 48,966.45 0.26% 4.76% 9.58% 14.57% 0.0384%ALPHABET INC-CL C GOOG 481,059.44 2.59% 0.00% 17.38% 17.38% 0.4494%GENUINE PARTS CO GPC 14,359.33 0.08% 2.71% 6.03% 8.82% 0.0068%GLOBAL PAYMENTS INC GPN 11,115.77 0.06% 0.07% 13.44% 13.52% 0.0081%GAP INC/THE GPS 9,222.70 0.05% 4.01% 7.77% 11.93% 0.0059%GARMIN LTD GRMN 8,059.36 0.04% 4.81% 4.54% 9.46% 0.0041%GOLDMAN SACHS GROUP INC GS 71,808.79 0.39% 1.66% 9.16% 10.89% 0.0420%GOODYEAR TIRE & RUBBER CO GT 7,704.40 0.04% 0.98% 7.00% 8.01% 0.0033%WW GRAINGER INC GWW 14,381.28 0.08% 2.09% 10.12% 12.31% 0.0095%HALLIBURTON CO HAL 35,465.37 0.19% 1.74% 12.23% 14.08% 0.0268%HARMAN INTERNATIONAL HAR 5,415.78 0.03% 1.84% 17.50% 19.50% 0.0057%HASBRO INC HAS 10,572.98 0.06% 2.41% 10.40% 12.94% 0.0074%HUNTINGTON BANCSHARES INC HBAN 8,036.61 0.04% 2.90% 5.88% 8.86% 0.0038%HANESBRANDS INC HBI 10,959.33 0.06% 1.51% 16.58% 18.21% 0.0107%HCA HOLDINGS INC HCA 31,906.84 0.17% 0.00% 11.00% 11.00% 0.0189%WELLTOWER INC HCN 24,736.61 0.13% 4.96% 5.49% 10.58% 0.0141%HCP INC HCP 15,790.45 0.08% 6.77% 2.72% 9.58% 0.0081%HOME DEPOT INC HD 167,562.42 0.90% 2.03% 13.20% 15.36% 0.1384%HESS CORP HES 18,883.79 0.10% 1.67% -19.49% -17.99% -0.0183%HARTFORD FINANCIAL SVCS GRP HIG 17,458.42 0.09% 1.97% 9.00% 11.06% 0.0104%HARLEY-DAVIDSON INC HOG 8,774.49 0.05% 2.90% 12.08% 15.15% 0.0071%HOLOGIC INC HOLX 9,365.89 0.05% 0.00% 11.57% 11.57% 0.0058%HONEYWELL INTERNATIONAL INC HON 87,086.93 0.47% 2.14% 9.32% 11.56% 0.0541%STARWOOD HOTELS & RESORTS HOT 13,818.06 0.07% 1.91% 6.33% 8.30% 0.0062%HELMERICH & PAYNE HP 7,141.66 0.04% 4.16% 10.00% 14.37% 0.0055%
Docket U-16-___ Exhibit RBH-4 Page 3 of 14

[4] [5] [6] [7] [8] [9]
Company TickerMarket
Capitalization Weight in IndexEstimated
Dividend YieldLong-Term Growth Est. DCF Result
WeightedDCF Result
HEWLETT PACKARD ENTERPRIS HPE 28,597.96 0.15% 1.35% 6.36% 7.76% 0.0119%HP INC HPQ 21,186.09 0.11% 4.18% 3.71% 7.97% 0.0091%H&R BLOCK INC HRB 4,541.97 0.02% 4.02% 11.00% 15.24% 0.0037%HORMEL FOODS CORP HRL 20,428.32 0.11% 1.69% 6.20% 7.95% 0.0087%HARRIS CORP HRS 9,973.58 N/A 2.52% N/A N/A N/AHENRY SCHEIN INC HSIC 13,858.33 0.07% 0.00% 11.52% 11.52% 0.0086%HOST HOTELS & RESORTS INC HST 11,822.53 0.06% 5.36% 5.00% 10.49% 0.0067%HERSHEY CO/THE HSY 19,867.15 0.11% 2.53% 9.18% 11.82% 0.0126%HUMANA INC HUM 26,386.58 0.14% 0.67% 13.89% 14.61% 0.0207%INTL BUSINESS MACHINES CORP IBM 140,096.83 0.75% 3.67% 4.91% 8.66% 0.0653%INTERCONTINENTAL EXCHANGE IN ICE 28,573.82 0.15% 1.42% 13.93% 15.45% 0.0237%INTL FLAVORS & FRAGRANCES IFF 9,520.06 0.05% 1.86% 9.40% 11.35% 0.0058%ILLUMINA INC ILMN 19,853.98 0.11% 0.00% 14.43% 14.43% 0.0154%INTEL CORP INTC 142,842.91 0.77% 3.42% 9.16% 12.74% 0.0978%INTUIT INC INTU 25,910.69 0.14% 1.19% 17.26% 18.56% 0.0259%INTERNATIONAL PAPER CO IP 17,790.89 0.10% 4.12% 5.62% 9.85% 0.0094%INTERPUBLIC GROUP OF COS INC IPG 9,231.18 0.05% 2.52% 6.50% 9.10% 0.0045%INGERSOLL-RAND PLC IR 16,874.17 0.09% 1.96% 8.27% 10.31% 0.0094%IRON MOUNTAIN INC IRM 7,742.61 0.04% 5.20% 9.40% 14.85% 0.0062%INTUITIVE SURGICAL INC ISRG 23,839.49 0.13% 0.00% 12.45% 12.45% 0.0160%ILLINOIS TOOL WORKS ITW 37,716.69 0.20% 2.18% 7.85% 10.12% 0.0205%INVESCO LTD IVZ 12,939.43 0.07% 3.65% 11.28% 15.13% 0.0105%HUNT (JB) TRANSPRT SVCS INC JBHT 9,336.79 0.05% 1.06% 13.98% 15.11% 0.0076%JOHNSON CONTROLS INC JCI 26,842.52 0.14% 2.76% 9.20% 12.09% 0.0174%JACOBS ENGINEERING GROUP INC JEC 5,462.70 0.03% 0.00% 7.92% 7.92% 0.0023%JOHNSON & JOHNSON JNJ 309,155.24 1.66% 2.77% 6.02% 8.87% 0.1474%JUNIPER NETWORKS INC JNPR 9,039.83 0.05% 1.81% 9.38% 11.28% 0.0055%JPMORGAN CHASE & CO JPM 231,426.81 1.24% 2.92% 4.21% 7.19% 0.0894%NORDSTROM INC JWN 8,841.41 0.05% 3.07% 9.63% 12.85% 0.0061%KELLOGG CO K 27,055.29 0.15% 2.72% 8.98% 11.82% 0.0172%KEYCORP KEY 10,177.97 0.05% 2.74% 6.02% 8.84% 0.0048%KRAFT HEINZ CO/THE KHC 94,869.85 0.51% 3.08% 39.95% 43.64% 0.2226%KIMCO REALTY CORP KIM 11,800.53 0.06% 3.66% 5.57% 9.33% 0.0059%KLA-TENCOR CORP KLAC 10,890.24 0.06% 3.01% 5.55% 8.64% 0.0051%KIMBERLY-CLARK CORP KMB 45,084.40 0.24% 2.94% 7.18% 10.22% 0.0248%KINDER MORGAN INC KMI 39,632.43 0.21% 2.82% 14.65% 17.67% 0.0377%CARMAX INC KMX 10,263.25 N/A N/A 14.74% N/A N/ACOCA-COLA CO/THE KO 193,813.70 1.04% 3.12% 5.53% 8.74% 0.0911%MICHAEL KORS HOLDINGS LTD KORS 9,269.40 0.05% 0.00% 4.85% 4.85% 0.0024%KROGER CO KR 34,062.18 0.18% 1.24% 10.48% 11.78% 0.0216%KOHLS CORP KSS 8,202.98 0.04% 4.54% 6.30% 10.98% 0.0048%KANSAS CITY SOUTHERN KSU 10,231.83 0.06% 1.43% 7.78% 9.26% 0.0051%LOEWS CORP L 13,451.81 N/A 0.63% N/A N/A N/AL BRANDS INC LB 22,469.54 0.12% 4.88% 11.67% 16.84% 0.0203%LEGGETT & PLATT INC LEG 6,647.96 N/A 2.65% N/A N/A N/ALENNAR CORP-A LEN 9,435.77 0.05% 0.35% 8.75% 9.12% 0.0046%LABORATORY CRP OF AMER HLDGS LH 12,794.38 0.07% 0.00% 11.57% 11.57% 0.0080%L-3 COMMUNICATIONS HOLDINGS LLL 10,121.59 0.05% 2.16% 9.94% 12.21% 0.0066%LINEAR TECHNOLOGY CORP LLTC 10,646.10 0.06% 2.79% 6.91% 9.80% 0.0056%ELI LILLY & CO LLY 83,372.81 0.45% 2.70% 13.30% 16.18% 0.0725%LEGG MASON INC LM 3,458.51 0.02% 2.85% 16.70% 19.79% 0.0037%LOCKHEED MARTIN CORP LMT 70,748.79 0.38% 2.92% 8.95% 12.00% 0.0456%LINCOLN NATIONAL CORP LNC 10,385.36 0.06% 2.35% 10.13% 12.61% 0.0070%LOWE'S COS INC LOW 68,223.28 0.37% 1.56% 16.32% 18.01% 0.0661%LAM RESEARCH CORP LRCX 12,193.26 0.07% 1.51% 9.72% 11.30% 0.0074%LEUCADIA NATIONAL CORP LUK 6,043.65 0.03% 1.50% 18.00% 19.63% 0.0064%SOUTHWEST AIRLINES CO LUV 28,491.82 0.15% 0.77% 9.08% 9.88% 0.0151%LEVEL 3 COMMUNICATIONS INC LVLT 18,657.10 0.10% 0.00% 1.62% 1.62% 0.0016%LYONDELLBASELL INDU-CL A LYB 35,277.53 0.19% 3.95% 4.28% 8.31% 0.0158%MACY'S INC M 12,342.77 0.07% 3.92% 8.37% 12.45% 0.0083%MASTERCARD INC-CLASS A MA 106,596.70 0.57% 0.78% 15.26% 16.11% 0.0923%MACERICH CO/THE MAC 11,360.98 0.06% 6.24% 5.88% 12.30% 0.0075%MARRIOTT INTERNATIONAL -CL A MAR 17,819.10 0.10% 1.50% 10.61% 12.19% 0.0117%MASCO CORP MAS 10,218.63 0.05% 1.25% 14.48% 15.81% 0.0087%MATTEL INC MAT 10,584.46 0.06% 4.89% 10.10% 15.24% 0.0087%MCDONALD'S CORP MCD 111,017.08 0.60% 2.89% 10.50% 13.55% 0.0808%MICROCHIP TECHNOLOGY INC MCHP 10,386.52 0.06% 2.90% 7.72% 10.72% 0.0060%MCKESSON CORP MCK 38,361.47 0.21% 0.64% 12.70% 13.38% 0.0276%MOODY'S CORP MCO 18,654.16 0.10% 1.57% 12.00% 13.66% 0.0137%MONDELEZ INTERNATIONAL INC-A MDLZ 66,676.53 0.36% 1.59% 12.99% 14.68% 0.0526%MEDTRONIC PLC MDT 110,892.57 0.60% 1.92% 8.49% 10.49% 0.0625%METLIFE INC MET 49,637.81 0.27% 3.65% 8.08% 11.87% 0.0317%MOHAWK INDUSTRIES INC MHK 14,270.28 N/A N/A 11.10% N/A N/AMEAD JOHNSON NUTRITION CO MJN 16,267.76 0.09% 2.02% 10.24% 12.37% 0.0108%MCCORMICK & CO-NON VTG SHRS MKC 11,899.07 0.06% 1.82% 9.10% 11.00% 0.0070%MARTIN MARIETTA MATERIALS MLM 10,744.09 0.06% 0.99% 21.88% 22.98% 0.0133%MARSH & MCLENNAN COS MMC 32,923.10 0.18% 2.08% 12.12% 14.33% 0.0254%3M CO MMM 101,399.92 0.55% 2.65% 9.10% 11.87% 0.0647%
Docket U-16-___ Exhibit RBH-4 Page 4 of 14

[4] [5] [6] [7] [8] [9]
Company TickerMarket
Capitalization Weight in IndexEstimated
Dividend YieldLong-Term Growth Est. DCF Result
WeightedDCF Result
MALLINCKRODT PLC MNK 6,996.92 0.04% 0.00% 9.11% 9.11% 0.0034%MONSTER BEVERAGE CORP MNST 29,282.81 0.16% 0.00% 20.80% 20.80% 0.0327%ALTRIA GROUP INC MO 122,687.40 0.66% 3.79% 7.86% 11.80% 0.0778%MONSANTO CO MON 40,923.64 0.22% 2.33% 9.08% 11.51% 0.0253%MOSAIC CO/THE MOS 9,796.56 0.05% 3.95% 3.10% 7.11% 0.0037%MARATHON PETROLEUM CORP MPC 20,682.05 0.11% 3.38% 5.18% 8.64% 0.0096%MERCK & CO. INC. MRK 151,890.96 0.82% 3.37% 5.99% 9.45% 0.0772%MARATHON OIL CORP MRO 11,944.65 0.06% 1.42% -3.29% -1.90% -0.0012%MORGAN STANLEY MS 52,485.84 0.28% 2.52% 9.50% 12.14% 0.0343%MICROSOFT CORP MSFT 392,001.48 2.11% 2.83% 9.27% 12.23% 0.2578%MOTOROLA SOLUTIONS INC MSI 13,134.60 0.07% 2.17% 9.00% 11.26% 0.0080%M & T BANK CORP MTB 18,825.88 0.10% 2.40% 5.60% 8.06% 0.0082%MICRON TECHNOLOGY INC MU 11,148.21 0.06% 0.00% 6.10% 6.10% 0.0037%MURPHY OIL CORP MUR 6,154.13 N/A 3.89% N/A N/A N/AMYLAN NV MYL 20,466.59 0.11% 0.00% 9.65% 9.65% 0.0106%NAVIENT CORP NAVI 4,518.12 N/A 4.73% N/A N/A N/ANOBLE ENERGY INC NBL 15,656.91 0.08% 1.11% 6.00% 7.14% 0.0060%NASDAQ INC NDAQ 10,113.51 0.05% 1.87% 7.92% 9.86% 0.0054%NEXTERA ENERGY INC NEE 54,256.81 0.29% 2.97% 6.39% 9.46% 0.0276%NEWMONT MINING CORP NEM 18,552.67 0.10% 0.30% 6.13% 6.44% 0.0064%NETFLIX INC NFLX 38,559.74 0.21% 0.00% 33.71% 33.71% 0.0699%NEWFIELD EXPLORATION CO NFX 7,182.49 0.04% 0.00% 17.21% 17.21% 0.0066%NISOURCE INC NI 7,283.60 N/A 2.84% N/A N/A N/ANIKE INC -CL B NKE 99,297.50 0.53% 1.04% 13.69% 14.81% 0.0790%NIELSEN HOLDINGS PLC NLSN 18,812.37 0.10% 2.33% 12.33% 14.81% 0.0150%NORTHROP GRUMMAN CORP NOC 37,219.95 0.20% 1.65% 6.90% 8.60% 0.0172%NATIONAL OILWELL VARCO INC NOV 13,589.46 0.07% 2.33% -6.00% -3.74% -0.0027%NRG ENERGY INC NRG 4,769.85 0.03% 1.13% -27.35% -26.37% -0.0068%NORFOLK SOUTHERN CORP NSC 26,648.94 0.14% 2.68% 6.36% 9.13% 0.0131%NETAPP INC NTAP 6,833.92 0.04% 3.05% 8.80% 11.98% 0.0044%NORTHERN TRUST CORP NTRS 16,217.88 0.09% 2.11% 12.41% 14.66% 0.0128%NUCOR CORP NUE 15,821.71 0.09% 3.02% 8.20% 11.34% 0.0096%NVIDIA CORP NVDA 19,347.81 0.10% 1.26% 8.74% 10.06% 0.0105%NEWELL BRANDS INC NWL 22,399.73 0.12% 1.67% 9.50% 11.25% 0.0135%NEWS CORP - CLASS A NWSA 7,316.63 0.04% 1.61% 7.54% 9.21% 0.0036%REALTY INCOME CORP O 14,864.62 0.08% 4.06% 3.75% 7.88% 0.0063%OWENS-ILLINOIS INC OI 2,988.81 0.02% 0.00% 6.35% 6.35% 0.0010%ONEOK INC OKE 7,595.01 0.04% 6.80% 6.63% 13.66% 0.0056%OMNICOM GROUP OMC 19,818.37 0.11% 2.59% 6.45% 9.12% 0.0097%ORACLE CORP ORCL 165,413.62 0.89% 1.44% 7.69% 9.18% 0.0817%O'REILLY AUTOMOTIVE INC ORLY 25,487.79 0.14% 0.00% 15.54% 15.54% 0.0213%OCCIDENTAL PETROLEUM CORP OXY 58,540.72 0.31% 3.95% 10.27% 14.42% 0.0454%PAYCHEX INC PAYX 18,769.51 0.10% 3.22% 9.78% 13.15% 0.0133%PEOPLE'S UNITED FINANCIAL PBCT 4,816.43 N/A 4.37% N/A N/A N/APITNEY BOWES INC PBI 3,976.70 0.02% 3.58% 14.00% 17.83% 0.0038%PACCAR INC PCAR 20,706.95 0.11% 3.50% 6.63% 10.24% 0.0114%P G & E CORP PCG 28,832.66 0.16% 3.29% 5.36% 8.74% 0.0135%PRICELINE GROUP INC/THE PCLN 66,696.21 0.36% 0.00% 18.36% 18.36% 0.0658%PATTERSON COS INC PDCO 4,295.51 0.02% 2.06% 8.43% 10.58% 0.0024%PUBLIC SERVICE ENTERPRISE GP PEG 23,361.85 0.13% 3.56% 3.23% 6.84% 0.0086%PEPSICO INC PEP 148,717.18 0.80% 2.88% 6.36% 9.33% 0.0746%PFIZER INC PFE 202,283.22 1.09% 3.67% 5.44% 9.21% 0.1001%PRINCIPAL FINANCIAL GROUP PFG 12,402.09 0.07% 3.73% 9.76% 13.67% 0.0091%PROCTER & GAMBLE CO/THE PG 213,267.57 1.15% 3.35% 6.28% 9.73% 0.1116%PROGRESSIVE CORP PGR 19,005.73 0.10% 2.02% 8.84% 10.95% 0.0112%PARKER HANNIFIN CORP PH 15,674.60 0.08% 2.17% 8.21% 10.47% 0.0088%PULTEGROUP INC PHM 6,363.53 0.03% 1.96% 14.04% 16.14% 0.0055%PERKINELMER INC PKI 5,555.73 0.03% 0.56% 19.18% 19.79% 0.0059%PROLOGIS INC PLD 23,843.92 0.13% 3.71% 5.18% 8.98% 0.0115%PHILIP MORRIS INTERNATIONAL PM 152,210.06 0.82% 4.23% 8.09% 12.49% 0.1022%PNC FINANCIAL SERVICES GROUP PNC 43,987.01 0.24% 2.43% 6.80% 9.31% 0.0220%PENTAIR PLC PNR 10,496.00 0.06% 2.31% 8.66% 11.07% 0.0062%PINNACLE WEST CAPITAL PNW 8,074.32 0.04% 3.48% 4.44% 8.00% 0.0035%PPG INDUSTRIES INC PPG 29,370.74 0.16% 1.38% 8.50% 9.94% 0.0157%PPL CORP PPL 25,436.18 0.14% 4.05% 4.97% 9.13% 0.0125%PERRIGO CO PLC PRGO 13,843.37 0.07% 0.60% 9.70% 10.33% 0.0077%PRUDENTIAL FINANCIAL INC PRU 34,493.99 0.19% 3.68% 10.53% 14.40% 0.0267%PUBLIC STORAGE PSA 42,388.40 0.23% 2.86% 4.96% 7.88% 0.0180%PHILLIPS 66 PSX 43,155.49 0.23% 2.87% 6.38% 9.35% 0.0217%PVH CORP PVH 7,770.03 0.04% 0.16% 6.77% 6.93% 0.0029%QUANTA SERVICES INC PWR 3,805.60 0.02% 0.00% 2.60% 2.60% 0.0005%PRAXAIR INC PX 33,507.22 0.18% 2.58% 10.60% 13.32% 0.0240%PIONEER NATURAL RESOURCES CO PXD 27,166.75 0.15% 0.05% 20.00% 20.06% 0.0293%PAYPAL HOLDINGS INC PYPL 47,487.20 N/A N/A 16.08% N/A N/AQUALCOMM INC QCOM 74,209.59 0.40% 3.91% 10.50% 14.61% 0.0583%QORVO INC QRVO 6,173.82 0.03% 0.00% 14.55% 14.55% 0.0048%RYDER SYSTEM INC R 3,701.24 0.02% 2.48% 7.15% 9.72% 0.0019%REYNOLDS AMERICAN INC RAI 70,796.13 0.38% 3.38% 11.06% 14.63% 0.0557%
Docket U-16-___ Exhibit RBH-4 Page 5 of 14

[4] [5] [6] [7] [8] [9]
Company TickerMarket
Capitalization Weight in IndexEstimated
Dividend YieldLong-Term Growth Est. DCF Result
WeightedDCF Result
ROYAL CARIBBEAN CRUISES LTD RCL 16,713.47 0.09% 2.05% 26.25% 28.57% 0.0257%REGENERON PHARMACEUTICALS REGN 39,584.16 0.21% 0.00% 21.35% 21.35% 0.0454%REGIONS FINANCIAL CORP RF 11,979.13 0.06% 2.80% 4.15% 7.02% 0.0045%ROBERT HALF INTL INC RHI 5,042.86 0.03% 2.26% 10.62% 13.01% 0.0035%RED HAT INC RHT 13,311.96 0.07% 0.00% 17.70% 17.70% 0.0127%TRANSOCEAN LTD RIG 4,044.93 0.02% 0.00% -6.20% -6.20% -0.0013%RALPH LAUREN CORP RL 7,831.01 0.04% 2.16% 10.23% 12.50% 0.0053%ROCKWELL AUTOMATION INC ROK 14,912.58 0.08% 2.71% 6.93% 9.73% 0.0078%ROPER TECHNOLOGIES INC ROP 17,817.87 0.10% 0.66% 11.43% 12.13% 0.0116%ROSS STORES INC ROST 22,814.45 0.12% 0.95% 12.60% 13.61% 0.0167%RANGE RESOURCES CORP RRC 7,487.48 0.04% 0.25% -44.22% -44.02% -0.0177%REPUBLIC SERVICES INC RSG 16,187.28 0.09% 2.59% 6.09% 8.76% 0.0076%RAYTHEON COMPANY RTN 37,523.42 0.20% 2.28% 7.65% 10.02% 0.0202%STARBUCKS CORP SBUX 82,371.33 0.44% 1.45% 18.51% 20.09% 0.0890%SCANA CORP SCG 9,816.96 0.05% 3.34% 5.80% 9.23% 0.0049%SCHWAB (CHARLES) CORP SCHW 37,540.86 0.20% 0.90% 16.06% 17.03% 0.0344%SPECTRA ENERGY CORP SE 21,851.77 0.12% 5.21% 8.57% 14.00% 0.0164%SEALED AIR CORP SEE 9,316.68 0.05% 1.21% 4.27% 5.50% 0.0028%SHERWIN-WILLIAMS CO/THE SHW 26,574.77 0.14% 1.17% 16.47% 17.73% 0.0253%SIGNET JEWELERS LTD SIG 8,509.42 0.05% 0.96% 14.00% 15.03% 0.0069%JM SMUCKER CO/THE SJM 15,197.51 0.08% 2.10% 14.50% 16.75% 0.0137%SCHLUMBERGER LTD SLB 111,771.20 0.60% 2.47% 8.04% 10.61% 0.0637%SL GREEN REALTY CORP SLG 10,647.61 0.06% 2.81% 4.40% 7.27% 0.0042%SNAP-ON INC SNA 9,261.55 0.05% 2.57% 3.40% 6.02% 0.0030%SANDISK CORP SNDK 15,102.22 0.08% 1.30% 9.75% 11.12% 0.0090%SCRIPPS NETWORKS INTER-CL A SNI 8,035.37 0.04% 1.59% 11.58% 13.27% 0.0057%SOUTHERN CO/THE SO 46,035.61 0.25% 4.44% 3.97% 8.49% 0.0210%SIMON PROPERTY GROUP INC SPG 62,245.38 0.33% 3.26% 7.92% 11.30% 0.0378%S&P GLOBAL INC SPGI 28,272.51 0.15% 1.36% 10.00% 11.43% 0.0174%STAPLES INC SPLS 6,591.95 0.04% 4.74% 1.36% 6.13% 0.0022%STERICYCLE INC SRCL 8,104.93 0.04% 0.00% 14.34% 14.34% 0.0062%SEMPRA ENERGY SRE 25,765.17 0.14% 2.91% 8.33% 11.36% 0.0157%SUNTRUST BANKS INC STI 21,078.63 0.11% 2.43% 6.88% 9.40% 0.0107%ST JUDE MEDICAL INC STJ 21,615.62 0.12% 1.64% 10.63% 12.35% 0.0143%STATE STREET CORP STT 25,014.95 0.13% 2.30% 8.63% 11.03% 0.0148%SEAGATE TECHNOLOGY STX 6,453.11 0.03% 10.83% 5.04% 16.14% 0.0056%CONSTELLATION BRANDS INC-A STZ 31,197.46 0.17% 1.01% 12.96% 14.03% 0.0235%STANLEY BLACK & DECKER INC SWK 16,801.05 0.09% 2.03% 10.33% 12.46% 0.0113%SKYWORKS SOLUTIONS INC SWKS 12,704.11 0.07% 1.59% 16.67% 18.39% 0.0126%SOUTHWESTERN ENERGY CO SWN 5,273.51 0.03% 0.00% -21.89% -21.89% -0.0062%SYNCHRONY FINANCIAL SYF 25,492.95 0.14% 0.81% 7.16% 8.00% 0.0110%STRYKER CORP SYK 40,767.68 0.22% 1.41% 10.41% 11.90% 0.0261%SYMANTEC CORP SYMC 10,856.24 0.06% 24.07% 7.87% 32.89% 0.0192%SYSCO CORP SYY 26,011.27 0.14% 2.67% 9.76% 12.56% 0.0176%AT&T INC T 238,789.93 1.28% 4.96% 3.98% 9.04% 0.1161%MOLSON COORS BREWING CO -B TAP 20,534.41 0.11% 1.81% 23.00% 25.02% 0.0276%TERADATA CORP TDC 3,261.61 0.02% 0.00% 7.69% 7.69% 0.0013%TECO ENERGY INC TE 6,539.69 0.04% 3.32% 6.20% 9.63% 0.0034%TE CONNECTIVITY LTD TEL 21,271.01 0.11% 2.29% 12.20% 14.63% 0.0167%TEGNA INC TGNA 5,106.90 0.03% 2.40% 6.50% 8.98% 0.0025%TARGET CORP TGT 47,379.52 0.25% 2.89% 10.44% 13.49% 0.0343%TIFFANY & CO TIF 8,988.96 0.05% 2.34% 9.60% 12.05% 0.0058%TJX COMPANIES INC TJX 50,237.67 0.27% 1.34% 11.52% 12.94% 0.0350%TORCHMARK CORP TMK 7,019.16 0.04% 0.99% 7.48% 8.50% 0.0032%THERMO FISHER SCIENTIFIC INC TMO 56,758.42 0.31% 0.42% 13.80% 14.24% 0.0435%TRIPADVISOR INC TRIP 9,410.62 N/A N/A 17.51% N/A N/AT ROWE PRICE GROUP INC TROW 18,687.21 0.10% 2.87% 10.91% 13.94% 0.0140%TRAVELERS COS INC/THE TRV 32,134.17 0.17% 2.37% 7.13% 9.58% 0.0166%TRACTOR SUPPLY COMPANY TSCO 12,620.18 0.07% 0.88% 15.79% 16.74% 0.0114%TYSON FOODS INC-CL A TSN 25,999.19 0.14% 0.98% 11.65% 12.69% 0.0177%TESORO CORP TSO 9,554.08 0.05% 2.61% -1.51% 1.07% 0.0006%TOTAL SYSTEM SERVICES INC TSS 9,367.25 0.05% 0.78% 11.00% 11.83% 0.0060%TIME WARNER CABLE TWC 60,388.00 0.32% 1.42% 8.50% 9.98% 0.0324%TIME WARNER INC TWX 59,372.20 0.32% 2.13% 13.48% 15.75% 0.0503%TEXAS INSTRUMENTS INC TXN 57,339.90 0.31% 2.70% 10.00% 12.83% 0.0396%TEXTRON INC TXT 10,398.41 0.06% 0.21% 7.31% 7.53% 0.0042%TYCO INTERNATIONAL PLC TYC 16,390.17 0.09% 2.27% 11.00% 13.40% 0.0118%UNDER ARMOUR INC-CLASS A UA 18,383.00 0.10% 0.00% 22.54% 22.54% 0.0223%UNITED CONTINENTAL HOLDINGS UAL 15,429.87 0.08% 0.00% -11.42% -11.42% -0.0095%UDR INC UDR 9,328.43 0.05% 3.36% 5.58% 9.04% 0.0045%UNIVERSAL HEALTH SERVICES-B UHS 13,006.58 0.07% 0.30% 8.88% 9.20% 0.0064%ULTA SALON COSMETICS & FRAGR ULTA 13,045.19 0.07% 0.00% 19.22% 19.22% 0.0135%UNITEDHEALTH GROUP INC UNH 125,123.57 0.67% 1.59% 13.02% 14.71% 0.0989%UNUM GROUP UNM 8,133.73 0.04% 2.28% 7.60% 9.97% 0.0044%UNION PACIFIC CORP UNP 73,363.42 0.39% 2.62% 8.77% 11.50% 0.0454%UNITED PARCEL SERVICE-CL B UPS 92,850.72 0.50% 2.96% 9.83% 12.93% 0.0645%URBAN OUTFITTERS INC URBN 3,559.60 0.02% 0.00% 13.00% 13.00% 0.0025%UNITED RENTALS INC URI 5,923.47 0.03% 0.00% 12.80% 12.80% 0.0041%
Docket U-16-___ Exhibit RBH-4 Page 6 of 14

[4] [5] [6] [7] [8] [9]
Company TickerMarket
Capitalization Weight in IndexEstimated
Dividend YieldLong-Term Growth Est. DCF Result
WeightedDCF Result
US BANCORP USB 74,106.26 0.40% 2.53% 5.96% 8.56% 0.0341%UNITED TECHNOLOGIES CORP UTX 87,343.67 0.47% 2.51% 9.53% 12.16% 0.0571%VISA INC-CLASS A SHARES V 184,210.21 0.99% 0.73% 16.44% 17.24% 0.1707%VARIAN MEDICAL SYSTEMS INC VAR 7,752.90 0.04% 0.00% 12.05% 12.05% 0.0050%VF CORP VFC 26,697.56 0.14% 2.40% 10.77% 13.30% 0.0191%VIACOM INC-CLASS B VIAB 16,347.95 0.09% 3.89% 8.29% 12.34% 0.0108%VALERO ENERGY CORP VLO 27,655.84 0.15% 4.11% 3.97% 8.16% 0.0121%VULCAN MATERIALS CO VMC 14,381.92 0.08% 0.75% 22.99% 23.83% 0.0184%VORNADO REALTY TRUST VNO 18,070.97 0.10% 2.70% 3.39% 6.13% 0.0060%VERISK ANALYTICS INC VRSK 13,020.77 0.07% 0.00% 12.33% 12.33% 0.0086%VERISIGN INC VRSN 9,372.29 0.05% 0.00% 9.85% 9.85% 0.0050%VERTEX PHARMACEUTICALS INC VRTX 20,861.49 0.11% 0.00% 51.20% 51.20% 0.0574%VENTAS INC VTR 20,885.14 0.11% 4.74% 4.78% 9.64% 0.0108%VERIZON COMMUNICATIONS INC VZ 207,646.11 1.12% 4.48% 3.64% 8.21% 0.0916%WATERS CORP WAT 10,541.03 0.06% 0.00% 8.59% 8.59% 0.0049%WALGREENS BOOTS ALLIANCE INC WBA 85,641.88 0.46% 1.84% 13.50% 15.46% 0.0712%WESTERN DIGITAL CORP WDC 9,512.15 0.05% 4.96% 3.60% 8.64% 0.0044%WEC ENERGY GROUP INC WEC 18,374.11 0.10% 3.38% 5.43% 8.90% 0.0088%WELLS FARGO & CO WFC 252,761.13 1.36% 3.12% 9.00% 12.26% 0.1666%WHOLE FOODS MARKET INC WFM 9,439.83 0.05% 1.86% 8.59% 10.53% 0.0053%WHIRLPOOL CORP WHR 13,228.87 0.07% 2.21% 17.04% 19.44% 0.0138%WILLIS TOWERS WATSON PLC WLTW 17,289.65 0.09% 1.54% 22.00% 23.71% 0.0220%WASTE MANAGEMENT INC WM 26,118.14 0.14% 2.79% 7.76% 10.66% 0.0150%WILLIAMS COS INC WMB 14,543.77 0.08% 13.27% -17.20% -5.07% -0.0040%WAL-MART STORES INC WMT 209,889.70 1.13% 2.99% 1.72% 4.73% 0.0534%WESTROCK CO WRK 10,623.60 0.06% 3.58% 0.57% 4.17% 0.0024%WESTERN UNION CO WU 9,911.96 0.05% 3.24% 6.72% 10.07% 0.0054%WEYERHAEUSER CO WY 24,542.66 0.13% 3.94% 5.50% 9.55% 0.0126%WYNDHAM WORLDWIDE CORP WYN 7,942.97 0.04% 2.82% 7.65% 10.58% 0.0045%WYNN RESORTS LTD WYNN 8,984.52 0.05% 2.31% 24.70% 27.30% 0.0132%CIMAREX ENERGY CO XEC 10,323.67 0.06% 0.42% -5.97% -5.56% -0.0031%XCEL ENERGY INC XEL 20,333.35 0.11% 3.40% 4.87% 8.35% 0.0091%XL GROUP PLC XL 9,558.35 0.05% 2.53% 9.00% 11.64% 0.0060%XILINX INC XLNX 11,008.66 0.06% 3.02% 8.25% 11.40% 0.0067%EXXON MOBIL CORP XOM 366,881.33 1.97% 3.41% 11.52% 15.13% 0.2983%DENTSPLY SIRONA INC XRAY 14,025.30 0.08% 0.52% 10.48% 11.03% 0.0083%XEROX CORP XRX 9,724.72 0.05% 3.26% 11.60% 15.05% 0.0079%XYLEM INC XYL 7,469.48 0.04% 1.48% 15.00% 16.60% 0.0067%YAHOO! INC YHOO 34,653.30 0.19% 0.00% 6.92% 6.92% 0.0129%YUM! BRANDS INC YUM 32,415.99 0.17% 2.38% 11.87% 14.39% 0.0251%ZIMMER BIOMET HOLDINGS INC ZBH 23,020.52 0.12% 0.81% 10.42% 11.27% 0.0139%ZIONS BANCORPORATION ZION 5,628.84 0.03% 1.11% 11.00% 12.17% 0.0037%ZOETIS INC ZTS 23,355.28 0.13% 0.81% 10.10% 10.95% 0.0137%
Total Market Capitalization: 18,601,020.57$ 13.21%Notes:[1] Equals sum of Col. [9][2] Source: Bloomberg Professional[3] Equals [1] − [2][4] Source: Bloomberg Professional[5] Equals weight in S&P 500 based on market capitalization [6] Source: Bloomberg Professional[7] Source: Bloomberg Professional[8] Equals ([6] x (1 + (0.5 x [7]))) + [7][9] Equals Col. [5] x Col. [8]
Docket U-16-___ Exhibit RBH-4 Page 7 of 14

[1] [2] [3]S&P 500
Est. RequiredMarket Return
Current 30-Year Treasury (30-day
average)Implied Market Risk Premium
12.25% 2.64% 9.62%
[4] [5] [6] [7] [8] [9]
Company TickerMarket
Capitalization Weight in IndexEstimated
Dividend YieldLong-Term Growth Est. DCF Result
WeightedDCF Result
AGILENT TECHNOLOGIES INC A 13,507.04 0.08% 1.12% 4.50% 5.65% 0.0043%ALCOA INC AA 14,608.28 0.08% 1.08% 11.50% 12.64% 0.0105%AMERICAN AIRLINES GROUP INC AAL 22,467.65 N/A 1.11% N/A N/A N/AADVANCE AUTO PARTS INC AAP 11,427.45 0.06% 0.15% 11.50% 11.66% 0.0076%APPLE INC AAPL 525,783.70 2.99% 2.40% 11.50% 14.04% 0.4192%ABBVIE INC ABBV 98,525.45 0.56% 3.73% 13.00% 16.97% 0.0950%AMERISOURCEBERGEN CORP ABC 17,829.83 0.10% 1.57% 13.50% 15.18% 0.0154%ABBOTT LABORATORIES ABT 60,295.32 0.34% 2.57% 1.00% 3.58% 0.0123%ACCENTURE PLC-CL A ACN 73,934.70 0.42% 1.98% 8.00% 10.06% 0.0422%ADOBE SYSTEMS INC ADBE 46,884.89 0.27% 0.00% 37.50% 37.50% 0.0999%ANALOG DEVICES INC ADI 17,937.70 0.10% 2.90% 11.00% 14.06% 0.0143%ARCHER-DANIELS-MIDLAND CO ADM 23,841.65 0.14% 3.00% 6.00% 9.09% 0.0123%AUTOMATIC DATA PROCESSING ADP 40,870.17 0.23% 2.58% 9.00% 11.70% 0.0271%ALLIANCE DATA SYSTEMS CORP ADS 12,248.45 0.07% 0.00% 11.50% 11.50% 0.0080%AUTODESK INC ADSK 13,775.92 0.08% 0.00% 13.50% 13.50% 0.0106%ADT CORP/THE ADT 6,934.08 0.04% 2.10% 9.00% 11.19% 0.0044%AMEREN CORPORATION AEE 11,571.22 0.07% 3.63% 5.00% 8.72% 0.0057%AMERICAN ELECTRIC POWER AEP 30,965.74 0.18% 3.65% 4.50% 8.23% 0.0145%AES CORP AES 7,414.92 0.04% 3.96% 3.50% 7.53% 0.0032%AETNA INC AET 39,971.48 0.23% 0.87% 10.00% 10.91% 0.0248%AFLAC INC AFL 29,286.46 0.17% 2.43% 4.50% 6.98% 0.0116%ALLERGAN PLC AGN 86,226.90 0.49% 0.00% 15.00% 15.00% 0.0735%AMERICAN INTERNATIONAL GROUP AIG 69,608.57 0.40% 2.29% 5.00% 7.35% 0.0290%APARTMENT INVT & MGMT CO -A AIV - N/A 3.30% N/A N/A N/AASSURANT INC AIZ 5,570.25 0.03% 2.36% 3.50% 5.90% 0.0019%AKAMAI TECHNOLOGIES INC AKAM 9,287.68 0.05% 0.00% 13.00% 13.00% 0.0069%ALLSTATE CORP ALL 24,745.95 0.14% 2.03% 6.50% 8.60% 0.0121%ALLEGION PLC ALLE 6,262.45 0.04% 0.74% 10.50% 11.28% 0.0040%ALEXION PHARMACEUTICALS INC ALXN 32,161.47 0.18% 0.00% 27.50% 27.50% 0.0502%APPLIED MATERIALS INC AMAT 23,530.39 0.13% 1.92% 15.00% 17.06% 0.0228%AMETEK INC AME 11,328.27 0.06% 0.75% 6.00% 6.77% 0.0044%AFFILIATED MANAGERS GROUP AMG 9,348.83 0.05% 0.00% 13.00% 13.00% 0.0069%AMGEN INC AMGN 121,062.20 0.69% 2.55% 8.50% 11.16% 0.0767%AMERIPRISE FINANCIAL INC AMP 16,783.47 0.10% 2.73% 13.50% 16.41% 0.0156%AMERICAN TOWER CORP AMT 44,098.75 0.25% 2.04% 12.50% 14.67% 0.0367%AMAZON.COM INC AMZN 283,542.00 N/A 0.00% N/A N/A N/AAUTONATION INC AN 5,617.76 0.03% 0.00% 9.00% 9.00% 0.0029%ANTHEM INC ANTM 37,618.27 0.21% 1.81% 7.00% 8.87% 0.0190%AON PLC AON 27,832.57 0.16% 1.28% 13.50% 14.87% 0.0235%APACHE CORP APA 20,954.43 0.12% 1.80% 5.00% 6.85% 0.0081%ANADARKO PETROLEUM CORP APC 27,041.56 N/A 0.38% N/A N/A N/AAIR PRODUCTS & CHEMICALS INC APD 32,032.65 0.18% 2.32% 12.00% 14.46% 0.0263%AMPHENOL CORP-CL A APH 17,374.28 0.10% 0.99% 8.00% 9.03% 0.0089%AIRGAS INC ARG 10,295.86 0.06% 1.85% 8.00% 9.92% 0.0058%ACTIVISION BLIZZARD INC ATVI 24,899.62 0.14% 0.77% 8.00% 8.80% 0.0124%AVALONBAY COMMUNITIES INC AVB - N/A 3.07% N/A N/A N/ABROADCOM LTD AVGO 40,883.57 0.23% 1.32% 23.00% 24.47% 0.0568%AVERY DENNISON CORP AVY 6,690.53 0.04% 2.07% 9.50% 11.67% 0.0044%AMERICAN WATER WORKS CO INC AWK 12,905.83 0.07% 2.07% 8.00% 10.15% 0.0074%AMERICAN EXPRESS CO AXP 63,798.96 0.36% 1.90% 3.50% 5.43% 0.0197%AUTOZONE INC AZO 23,101.61 0.13% 0.00% 11.50% 11.50% 0.0151%BOEING CO/THE BA 89,860.91 0.51% 3.32% 10.00% 13.49% 0.0688%BANK OF AMERICA CORP BAC 154,219.80 0.88% 1.62% 27.00% 28.84% 0.2526%BAXTER INTERNATIONAL INC BAX 24,202.21 0.14% 1.04% -7.00% -6.00% -0.0082%BED BATH & BEYOND INC BBBY 7,891.44 0.04% 1.04% 3.00% 4.06% 0.0018%BB&T CORP BBT 27,780.00 0.16% 3.29% 6.50% 9.90% 0.0156%BEST BUY CO INC BBY 10,571.38 0.06% 3.43% 8.00% 11.57% 0.0069%CR BARD INC BCR 15,787.37 0.09% 0.48% 9.00% 9.50% 0.0085%BECTON DICKINSON AND CO BDX 34,299.52 0.19% 1.70% 9.50% 11.28% 0.0220%FRANKLIN RESOURCES INC BEN 22,361.01 0.13% 1.97% 8.50% 10.55% 0.0134%BROWN-FORMAN CORP-CLASS B BF/B 19,192.01 0.11% 1.45% 8.00% 9.51% 0.0104%BAKER HUGHES INC BHI 20,914.82 0.12% 1.42% 30.00% 31.63% 0.0376%BIOGEN INC BIIB 61,444.09 0.35% 0.00% 10.50% 10.50% 0.0366%BANK OF NEW YORK MELLON CORP BK 44,417.61 0.25% 1.67% 11.50% 13.27% 0.0335%BLACKROCK INC BLK 58,654.71 0.33% 2.55% 8.50% 11.16% 0.0372%BALL CORP BLL 10,377.14 0.06% 0.71% 11.00% 11.75% 0.0069%BRISTOL-MYERS SQUIBB CO BMY 120,023.90 0.68% 2.10% 17.50% 19.78% 0.1349%
Ex-Ante Market Risk PremiumMarket DCF Method Based - Value Line
Docket U-16-___ Exhibit RBH-4 Page 8 of 14

[4] [5] [6] [7] [8] [9]
Company TickerMarket
Capitalization Weight in IndexEstimated
Dividend YieldLong-Term Growth Est. DCF Result
WeightedDCF Result
BERKSHIRE HATHAWAY INC-CL B BRK/B 182.30 N/A 0.00% N/A N/A N/ABOSTON SCIENTIFIC CORP BSX 29,358.36 0.17% 0.00% 15.00% 15.00% 0.0250%BORGWARNER INC BWA 8,170.09 0.05% 1.43% 8.00% 9.49% 0.0044%BAXALTA INC BXLT N/A N/A 0.00% N/A N/A N/ABOSTON PROPERTIES INC BXP - N/A 2.01% N/A N/A N/ACITIGROUP INC C 139,208.20 0.79% 0.43% 13.50% 13.96% 0.1104%CA INC CA 12,418.63 0.07% 3.45% 5.00% 8.54% 0.0060%CONAGRA FOODS INC CAG 19,503.39 0.11% 2.24% 6.00% 8.31% 0.0092%CARDINAL HEALTH INC CAH 25,908.30 0.15% 2.23% 14.00% 16.39% 0.0241%CATERPILLAR INC CAT 45,268.70 0.26% 3.96% 2.50% 6.51% 0.0167%CHUBB LTD CB 37,976.83 0.22% 2.29% 7.50% 9.88% 0.0213%CBRE GROUP INC - A CBG 10,319.08 0.06% 0.00% 11.00% 11.00% 0.0064%CBS CORP-CLASS B NON VOTING CBS 25,960.41 0.15% 1.07% 13.00% 14.14% 0.0208%COCA-COLA ENTERPRISES CCE 12,253.36 0.07% 2.26% 4.50% 6.81% 0.0047%CROWN CASTLE INTL CORP CCI 29,084.80 0.17% 4.20% 21.00% 25.64% 0.0424%CARNIVAL CORP CCL 36,776.05 0.21% 2.87% 15.50% 18.59% 0.0388%CELGENE CORP CELG 84,976.40 0.48% 0.00% 24.00% 24.00% 0.1158%CERNER CORP CERN 19,598.58 0.11% 0.00% 14.50% 14.50% 0.0161%CF INDUSTRIES HOLDINGS INC CF 7,999.34 0.05% 3.93% 8.00% 12.09% 0.0055%CITIZENS FINANCIAL GROUP CFG 12,262.29 N/A 2.07% N/A N/A N/ACHURCH & DWIGHT CO INC CHD 12,153.53 0.07% 1.53% 7.50% 9.09% 0.0063%CHESAPEAKE ENERGY CORP CHK 4,497.57 0.03% 0.00% -13.00% -13.00% -0.0033%C.H. ROBINSON WORLDWIDE INC CHRW 10,207.17 0.06% 2.43% 6.00% 8.50% 0.0049%CIGNA CORP CI 36,048.41 0.20% 0.03% 12.50% 12.53% 0.0257%CINCINNATI FINANCIAL CORP CINF 10,828.82 0.06% 2.90% 7.50% 10.51% 0.0065%COLGATE-PALMOLIVE CO CL 63,527.31 0.36% 2.22% 13.50% 15.87% 0.0573%CLOROX COMPANY CLX 16,139.87 0.09% 2.49% 8.00% 10.59% 0.0097%COMERICA INC CMA 7,959.53 0.05% 1.96% 6.00% 8.02% 0.0036%COMCAST CORP-CLASS A CMCSA 149,352.60 0.85% 1.80% 10.00% 11.89% 0.1009%CME GROUP INC CME 31,109.76 0.18% 2.60% 9.50% 12.22% 0.0216%CHIPOTLE MEXICAN GRILL INC CMG 13,207.12 0.08% 0.00% 15.00% 15.00% 0.0113%CUMMINS INC CMI 20,712.38 0.12% 3.34% 6.50% 9.95% 0.0117%CMS ENERGY CORP CMS 11,189.07 0.06% 3.12% 6.00% 9.21% 0.0059%CENTENE CORP CNC 7,583.57 0.04% 0.00% 27.00% 27.00% 0.0116%CENTERPOINT ENERGY INC CNP 9,190.40 N/A 4.87% N/A N/A N/ACAPITAL ONE FINANCIAL CORP COF 38,685.06 0.22% 2.18% 3.50% 5.72% 0.0126%CABOT OIL & GAS CORP COG 9,752.12 0.06% 0.34% 20.50% 20.87% 0.0116%COACH INC COH 11,444.02 0.06% 3.28% 4.50% 7.85% 0.0051%ROCKWELL COLLINS INC COL 11,700.79 0.07% 1.54% 8.00% 9.60% 0.0064%CONOCOPHILLIPS COP 58,919.93 0.33% 2.10% 6.50% 8.67% 0.0290%COSTCO WHOLESALE CORP COST 66,520.93 0.38% 1.19% 9.00% 10.24% 0.0387%CAMPBELL SOUP CO CPB 19,000.41 0.11% 2.03% 5.50% 7.59% 0.0082%COLUMBIA PIPELINE GROUP CPGX 10,247.92 N/A 2.03% N/A N/A N/ASALESFORCE.COM INC CRM 50,574.63 N/A 0.00% N/A N/A N/ACISCO SYSTEMS INC CSCO 141,253.90 0.80% 3.72% 6.00% 9.83% 0.0789%CSRA INC CSRA 4,324.09 N/A 1.50% N/A N/A N/ACSX CORP CSX 26,162.08 0.15% 2.63% 7.00% 9.72% 0.0144%CINTAS CORP CTAS 9,558.67 0.05% 1.18% 11.00% 12.24% 0.0066%CENTURYLINK INC CTL 17,053.57 0.10% 6.89% 13.50% 20.86% 0.0202%COGNIZANT TECH SOLUTIONS-A CTSH 36,375.57 0.21% 0.00% 15.50% 15.50% 0.0320%CITRIX SYSTEMS INC CTXS 12,620.68 0.07% 0.00% 14.00% 14.00% 0.0100%CABLEVISION SYSTEMS-NY GRP-A CVC 9,236.55 0.05% 0.00% 6.00% 6.00% 0.0031%CVS HEALTH CORP CVS 112,343.10 0.64% 1.68% 12.00% 13.78% 0.0879%CHEVRON CORP CVX 192,800.10 1.10% 4.18% -1.50% 2.65% 0.0290%CONCHO RESOURCES INC CXO 15,371.18 0.09% 0.00% 9.50% 9.50% 0.0083%DOMINION RESOURCES INC/VA D 42,286.50 0.24% 4.03% 8.00% 12.19% 0.0293%DELTA AIR LINES INC DAL 33,378.68 0.19% 1.45% 14.50% 16.06% 0.0304%DU PONT (E.I.) DE NEMOURS DD 57,866.16 0.33% 2.41% 7.00% 9.49% 0.0312%DEERE & CO DE 26,465.31 N/A 2.86% N/A N/A N/ADISCOVER FINANCIAL SERVICES DFS 24,345.02 0.14% 1.98% 4.00% 6.02% 0.0083%DOLLAR GENERAL CORP DG 23,210.75 0.13% 1.30% 13.50% 14.89% 0.0196%QUEST DIAGNOSTICS INC DGX 10,847.52 0.06% 2.12% 9.00% 11.22% 0.0069%DR HORTON INC DHI 11,255.39 0.06% 1.05% 13.50% 14.62% 0.0093%DANAHER CORP DHR 66,173.19 0.38% 0.66% 13.00% 13.70% 0.0515%WALT DISNEY CO/THE DIS 176,851.00 1.00% 1.37% 10.00% 11.44% 0.1149%DISCOVERY COMMUNICATIONS-A DISCA 15,088.40 0.09% 0.00% 17.00% 17.00% 0.0146%DELPHI AUTOMOTIVE PLC DLPH 20,862.82 0.12% 1.65% 14.50% 16.27% 0.0193%DOLLAR TREE INC DLTR 18,813.89 0.11% 0.00% 21.00% 21.00% 0.0224%DUN & BRADSTREET CORP DNB 4,007.10 0.02% 1.74% 4.00% 5.77% 0.0013%DIAMOND OFFSHORE DRILLING DO 3,331.59 0.02% 0.00% 11.50% 11.50% 0.0022%DOVER CORP DOV 10,233.89 0.06% 2.54% 2.00% 4.57% 0.0027%DOW CHEMICAL CO/THE DOW 59,666.98 0.34% 3.59% 9.50% 13.26% 0.0449%DR PEPPER SNAPPLE GROUP INC DPS 17,020.27 0.10% 2.36% 8.00% 10.45% 0.0101%DARDEN RESTAURANTS INC DRI 8,002.75 0.05% 3.17% 11.00% 14.34% 0.0065%DTE ENERGY COMPANY DTE 15,802.33 0.09% 3.45% 4.50% 8.03% 0.0072%DUKE ENERGY CORP DUK 53,897.92 0.31% 4.33% 5.00% 9.44% 0.0289%DAVITA HEALTHCARE PARTNERS I DVA 15,779.33 0.09% 0.00% 10.50% 10.50% 0.0094%DEVON ENERGY CORP DVN 15,093.98 0.09% 0.67% 1.50% 2.18% 0.0019%
Docket U-16-___ Exhibit RBH-4 Page 9 of 14

[4] [5] [6] [7] [8] [9]
Company TickerMarket
Capitalization Weight in IndexEstimated
Dividend YieldLong-Term Growth Est. DCF Result
WeightedDCF Result
ELECTRONIC ARTS INC EA 19,319.20 0.11% 0.00% 17.00% 17.00% 0.0187%EBAY INC EBAY 29,150.08 0.17% 0.00% 3.00% 3.00% 0.0050%ECOLAB INC ECL 34,128.80 0.19% 1.21% 9.50% 10.77% 0.0209%CONSOLIDATED EDISON INC ED 21,758.18 0.12% 3.64% 2.50% 6.19% 0.0076%EQUIFAX INC EFX 14,233.86 0.08% 1.10% 8.00% 9.14% 0.0074%EDISON INTERNATIONAL EIX 22,842.61 0.13% 2.84% 3.50% 6.39% 0.0083%ESTEE LAUDER COMPANIES-CL A EL 35,875.54 0.20% 1.24% 8.00% 9.29% 0.0189%EMC CORP/MA EMC 50,887.17 0.29% 1.76% 3.50% 5.29% 0.0153%EASTMAN CHEMICAL CO EMN 11,556.47 0.07% 2.35% 9.50% 11.96% 0.0079%EMERSON ELECTRIC CO EMR 35,383.36 0.20% 3.45% 2.00% 5.48% 0.0110%ENDO INTERNATIONAL PLC ENDP 6,279.45 0.04% 0.00% 39.00% 39.00% 0.0139%EOG RESOURCES INC EOG 45,027.87 N/A 0.92% N/A N/A N/AEQUINIX INC EQIX 20,383.70 0.12% 2.13% 24.50% 26.89% 0.0311%EQUITY RESIDENTIAL EQR - N/A 2.97% N/A N/A N/AEQT CORP EQT 10,686.95 0.06% 0.17% 8.50% 8.68% 0.0053%EVERSOURCE ENERGY ES 17,781.73 0.10% 3.23% 7.00% 10.34% 0.0104%EXPRESS SCRIPTS HOLDING CO ESRX 50,675.15 0.29% 0.00% 15.50% 15.50% 0.0446%ESSEX PROPERTY TRUST INC ESS - N/A 2.91% N/A N/A N/AE*TRADE FINANCIAL CORP ETFC 7,382.68 0.04% 0.00% 17.50% 17.50% 0.0073%EATON CORP PLC ETN 29,244.33 0.17% 3.61% 4.50% 8.19% 0.0136%ENTERGY CORP ETR 13,277.34 0.08% 4.62% 2.50% 7.18% 0.0054%EDWARDS LIFESCIENCES CORP EW 23,101.65 0.13% 0.00% 15.00% 15.00% 0.0197%EXELON CORP EXC 32,344.53 0.18% 3.61% 6.50% 10.23% 0.0188%EXPEDITORS INTL WASH INC EXPD 9,281.22 0.05% 1.44% 11.50% 13.02% 0.0069%EXPEDIA INC EXPE 16,076.21 0.09% 0.90% 22.00% 23.00% 0.0210%EXTRA SPACE STORAGE INC EXR - N/A 3.11% N/A N/A N/AFORD MOTOR CO F 54,919.69 0.31% 4.68% 7.00% 11.84% 0.0369%FASTENAL CO FAST 13,688.54 0.08% 2.54% 7.00% 9.63% 0.0075%FACEBOOK INC-A FB 332,096.80 1.89% 0.00% 34.50% 34.50% 0.6507%FREEPORT-MCMORAN INC FCX 15,774.36 0.09% 0.00% 36.50% 36.50% 0.0327%FEDEX CORP FDX 52,679.88 0.30% 0.60% 12.50% 13.14% 0.0393%FIRSTENERGY CORP FE 13,752.99 0.08% 4.44% 7.50% 12.11% 0.0095%F5 NETWORKS INC FFIV 7,166.61 0.04% 0.00% 9.00% 9.00% 0.0037%FIDELITY NATIONAL INFO SERV FIS 21,309.91 0.12% 1.58% 12.50% 14.18% 0.0172%FISERV INC FISV 22,156.00 0.13% 0.00% 10.50% 10.50% 0.0132%FIFTH THIRD BANCORP FITB 14,516.13 0.08% 3.03% 3.50% 6.58% 0.0054%FOOT LOCKER INC FL 8,419.98 0.05% 1.79% 9.00% 10.87% 0.0052%FLIR SYSTEMS INC FLIR 4,223.51 0.02% 1.59% 8.00% 9.65% 0.0023%FLUOR CORP FLR 7,545.90 0.04% 1.55% 1.50% 3.06% 0.0013%FLOWSERVE CORP FLS 6,050.45 0.03% 1.62% 2.50% 4.14% 0.0014%FMC CORP FMC 5,816.67 0.03% 1.56% 4.50% 6.10% 0.0020%TWENTY-FIRST CENTURY FOX-A FOXA 59,288.73 0.34% 0.98% 10.50% 11.53% 0.0388%FEDERAL REALTY INVS TRUST FRT - N/A 2.59% N/A N/A N/AFIRST SOLAR INC FSLR 5,802.75 0.03% 0.00% 8.50% 8.50% 0.0028%FMC TECHNOLOGIES INC FTI 6,854.05 0.04% 0.00% -1.00% -1.00% -0.0004%FRONTIER COMMUNICATIONS CORP FTR 6,483.51 0.04% 7.57% 16.00% 24.18% 0.0089%AGL RESOURCES INC GAS 7,911.18 0.04% 3.23% 5.00% 8.31% 0.0037%GENERAL DYNAMICS CORP GD 43,923.49 0.25% 2.15% 7.00% 9.23% 0.0230%GENERAL ELECTRIC CO GE 312,375.50 1.77% 2.98% 9.50% 12.62% 0.2239%GENERAL GROWTH PROPERTIES GGP - N/A 2.71% N/A N/A N/AGILEAD SCIENCES INC GILD 137,934.00 0.78% 1.77% 10.00% 11.86% 0.0929%GENERAL MILLS INC GIS 36,363.94 0.21% 3.00% 5.00% 8.08% 0.0167%CORNING INC GLW 21,345.70 0.12% 2.86% 6.50% 9.45% 0.0115%GENERAL MOTORS CO GM 51,904.00 0.29% 4.69% 10.00% 14.92% 0.0440%ALPHABET INC-CL C GOOG 474,971.20 2.70% 0.00% 16.50% 16.50% 0.4451%GENUINE PARTS CO GPC 14,675.27 0.08% 2.70% 6.50% 9.29% 0.0077%GLOBAL PAYMENTS INC GPN 9,411.35 0.05% 0.06% 13.50% 13.56% 0.0073%GAP INC/THE GPS 9,341.41 0.05% 3.95% 1.50% 5.48% 0.0029%GARMIN LTD GRMN 8,207.37 N/A 4.72% N/A N/A N/AGOLDMAN SACHS GROUP INC GS 68,916.38 0.39% 1.58% 7.00% 8.64% 0.0338%GOODYEAR TIRE & RUBBER CO GT 7,981.17 0.05% 1.00% 8.50% 9.54% 0.0043%WW GRAINGER INC GWW 14,636.36 0.08% 2.07% 6.00% 8.13% 0.0068%HALLIBURTON CO HAL 35,130.24 0.20% 1.75% 8.00% 9.82% 0.0196%HARMAN INTERNATIONAL HAR 5,482.61 0.03% 1.82% 17.00% 18.97% 0.0059%HASBRO INC HAS 10,647.51 0.06% 2.39% 11.00% 13.52% 0.0082%HUNTINGTON BANCSHARES INC HBAN 8,044.67 0.05% 2.96% 7.50% 10.57% 0.0048%HANESBRANDS INC HBI 11,565.48 0.07% 1.49% 11.50% 13.08% 0.0086%HCA HOLDINGS INC HCA 33,819.81 0.19% 0.00% 11.50% 11.50% 0.0221%WELLTOWER INC HCN - N/A 5.01% N/A N/A N/AHCP INC HCP - 0.00% 6.78% 74.00% 83.29% 0.0000%HOME DEPOT INC HD 166,178.00 0.94% 2.08% 13.00% 15.22% 0.1436%HESS CORP HES 16,931.22 0.10% 1.69% -14.00% -12.43% -0.0120%HARTFORD FINANCIAL SVCS GRP HIG 17,999.10 0.10% 1.92% 13.50% 15.55% 0.0159%HARLEY-DAVIDSON INC HOG 8,865.38 0.05% 2.92% 9.00% 12.05% 0.0061%HOLOGIC INC HOLX 9,617.58 0.05% 0.00% 24.50% 24.50% 0.0134%HONEYWELL INTERNATIONAL INC HON 88,303.24 0.50% 2.08% 8.50% 10.67% 0.0535%STARWOOD HOTELS & RESORTS HOT 13,729.83 0.08% 1.84% 5.50% 7.39% 0.0058%HELMERICH & PAYNE HP 7,026.42 0.04% 4.24% -6.00% -1.89% -0.0008%
Docket U-16-___ Exhibit RBH-4 Page 10 of 14
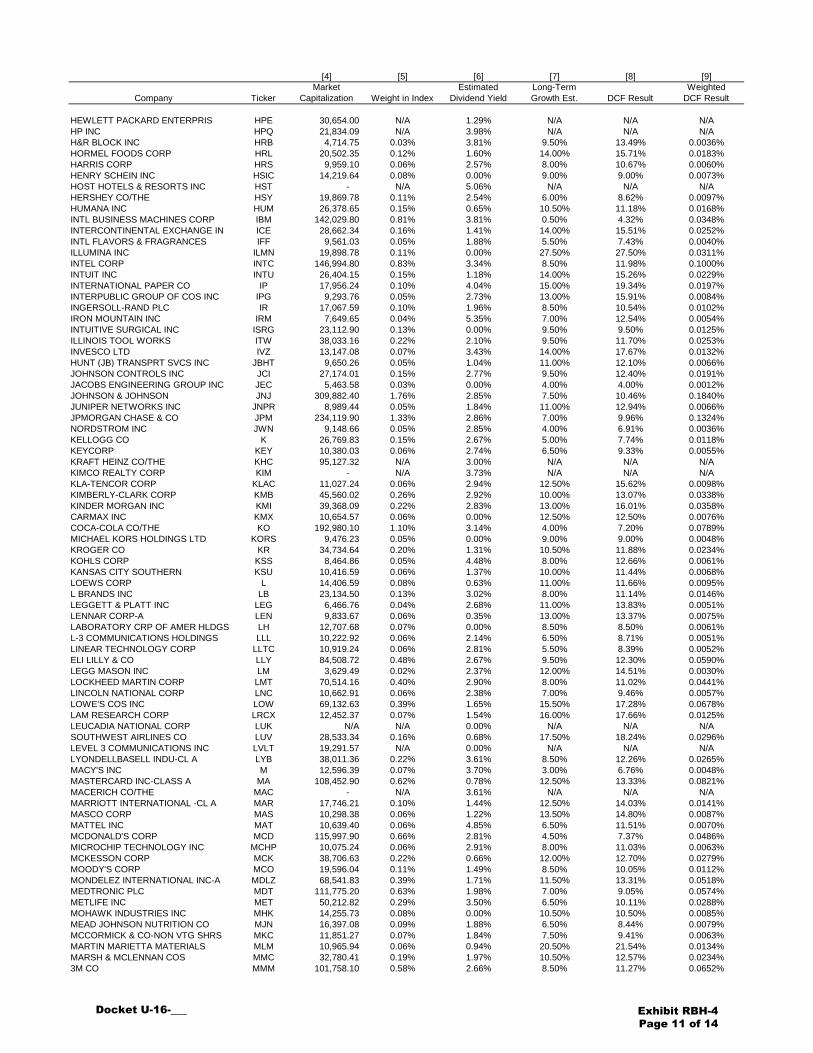
[4] [5] [6] [7] [8] [9]
Company TickerMarket
Capitalization Weight in IndexEstimated
Dividend YieldLong-Term Growth Est. DCF Result
WeightedDCF Result
HEWLETT PACKARD ENTERPRIS HPE 30,654.00 N/A 1.29% N/A N/A N/AHP INC HPQ 21,834.09 N/A 3.98% N/A N/A N/AH&R BLOCK INC HRB 4,714.75 0.03% 3.81% 9.50% 13.49% 0.0036%HORMEL FOODS CORP HRL 20,502.35 0.12% 1.60% 14.00% 15.71% 0.0183%HARRIS CORP HRS 9,959.10 0.06% 2.57% 8.00% 10.67% 0.0060%HENRY SCHEIN INC HSIC 14,219.64 0.08% 0.00% 9.00% 9.00% 0.0073%HOST HOTELS & RESORTS INC HST - N/A 5.06% N/A N/A N/AHERSHEY CO/THE HSY 19,869.78 0.11% 2.54% 6.00% 8.62% 0.0097%HUMANA INC HUM 26,378.65 0.15% 0.65% 10.50% 11.18% 0.0168%INTL BUSINESS MACHINES CORP IBM 142,029.80 0.81% 3.81% 0.50% 4.32% 0.0348%INTERCONTINENTAL EXCHANGE IN ICE 28,662.34 0.16% 1.41% 14.00% 15.51% 0.0252%INTL FLAVORS & FRAGRANCES IFF 9,561.03 0.05% 1.88% 5.50% 7.43% 0.0040%ILLUMINA INC ILMN 19,898.78 0.11% 0.00% 27.50% 27.50% 0.0311%INTEL CORP INTC 146,994.80 0.83% 3.34% 8.50% 11.98% 0.1000%INTUIT INC INTU 26,404.15 0.15% 1.18% 14.00% 15.26% 0.0229%INTERNATIONAL PAPER CO IP 17,956.24 0.10% 4.04% 15.00% 19.34% 0.0197%INTERPUBLIC GROUP OF COS INC IPG 9,293.76 0.05% 2.73% 13.00% 15.91% 0.0084%INGERSOLL-RAND PLC IR 17,067.59 0.10% 1.96% 8.50% 10.54% 0.0102%IRON MOUNTAIN INC IRM 7,649.65 0.04% 5.35% 7.00% 12.54% 0.0054%INTUITIVE SURGICAL INC ISRG 23,112.90 0.13% 0.00% 9.50% 9.50% 0.0125%ILLINOIS TOOL WORKS ITW 38,033.16 0.22% 2.10% 9.50% 11.70% 0.0253%INVESCO LTD IVZ 13,147.08 0.07% 3.43% 14.00% 17.67% 0.0132%HUNT (JB) TRANSPRT SVCS INC JBHT 9,650.26 0.05% 1.04% 11.00% 12.10% 0.0066%JOHNSON CONTROLS INC JCI 27,174.01 0.15% 2.77% 9.50% 12.40% 0.0191%JACOBS ENGINEERING GROUP INC JEC 5,463.58 0.03% 0.00% 4.00% 4.00% 0.0012%JOHNSON & JOHNSON JNJ 309,882.40 1.76% 2.85% 7.50% 10.46% 0.1840%JUNIPER NETWORKS INC JNPR 8,989.44 0.05% 1.84% 11.00% 12.94% 0.0066%JPMORGAN CHASE & CO JPM 234,119.90 1.33% 2.86% 7.00% 9.96% 0.1324%NORDSTROM INC JWN 9,148.66 0.05% 2.85% 4.00% 6.91% 0.0036%KELLOGG CO K 26,769.83 0.15% 2.67% 5.00% 7.74% 0.0118%KEYCORP KEY 10,380.03 0.06% 2.74% 6.50% 9.33% 0.0055%KRAFT HEINZ CO/THE KHC 95,127.32 N/A 3.00% N/A N/A N/AKIMCO REALTY CORP KIM - N/A 3.73% N/A N/A N/AKLA-TENCOR CORP KLAC 11,027.24 0.06% 2.94% 12.50% 15.62% 0.0098%KIMBERLY-CLARK CORP KMB 45,560.02 0.26% 2.92% 10.00% 13.07% 0.0338%KINDER MORGAN INC KMI 39,368.09 0.22% 2.83% 13.00% 16.01% 0.0358%CARMAX INC KMX 10,654.57 0.06% 0.00% 12.50% 12.50% 0.0076%COCA-COLA CO/THE KO 192,980.10 1.10% 3.14% 4.00% 7.20% 0.0789%MICHAEL KORS HOLDINGS LTD KORS 9,476.23 0.05% 0.00% 9.00% 9.00% 0.0048%KROGER CO KR 34,734.64 0.20% 1.31% 10.50% 11.88% 0.0234%KOHLS CORP KSS 8,464.86 0.05% 4.48% 8.00% 12.66% 0.0061%KANSAS CITY SOUTHERN KSU 10,416.59 0.06% 1.37% 10.00% 11.44% 0.0068%LOEWS CORP L 14,406.59 0.08% 0.63% 11.00% 11.66% 0.0095%L BRANDS INC LB 23,134.50 0.13% 3.02% 8.00% 11.14% 0.0146%LEGGETT & PLATT INC LEG 6,466.76 0.04% 2.68% 11.00% 13.83% 0.0051%LENNAR CORP-A LEN 9,833.67 0.06% 0.35% 13.00% 13.37% 0.0075%LABORATORY CRP OF AMER HLDGS LH 12,707.68 0.07% 0.00% 8.50% 8.50% 0.0061%L-3 COMMUNICATIONS HOLDINGS LLL 10,222.92 0.06% 2.14% 6.50% 8.71% 0.0051%LINEAR TECHNOLOGY CORP LLTC 10,919.24 0.06% 2.81% 5.50% 8.39% 0.0052%ELI LILLY & CO LLY 84,508.72 0.48% 2.67% 9.50% 12.30% 0.0590%LEGG MASON INC LM 3,629.49 0.02% 2.37% 12.00% 14.51% 0.0030%LOCKHEED MARTIN CORP LMT 70,514.16 0.40% 2.90% 8.00% 11.02% 0.0441%LINCOLN NATIONAL CORP LNC 10,662.91 0.06% 2.38% 7.00% 9.46% 0.0057%LOWE'S COS INC LOW 69,132.63 0.39% 1.65% 15.50% 17.28% 0.0678%LAM RESEARCH CORP LRCX 12,452.37 0.07% 1.54% 16.00% 17.66% 0.0125%LEUCADIA NATIONAL CORP LUK N/A N/A 0.00% N/A N/A N/ASOUTHWEST AIRLINES CO LUV 28,533.34 0.16% 0.68% 17.50% 18.24% 0.0296%LEVEL 3 COMMUNICATIONS INC LVLT 19,291.57 N/A 0.00% N/A N/A N/ALYONDELLBASELL INDU-CL A LYB 38,011.36 0.22% 3.61% 8.50% 12.26% 0.0265%MACY'S INC M 12,596.39 0.07% 3.70% 3.00% 6.76% 0.0048%MASTERCARD INC-CLASS A MA 108,452.90 0.62% 0.78% 12.50% 13.33% 0.0821%MACERICH CO/THE MAC - N/A 3.61% N/A N/A N/AMARRIOTT INTERNATIONAL -CL A MAR 17,746.21 0.10% 1.44% 12.50% 14.03% 0.0141%MASCO CORP MAS 10,298.38 0.06% 1.22% 13.50% 14.80% 0.0087%MATTEL INC MAT 10,639.40 0.06% 4.85% 6.50% 11.51% 0.0070%MCDONALD'S CORP MCD 115,997.90 0.66% 2.81% 4.50% 7.37% 0.0486%MICROCHIP TECHNOLOGY INC MCHP 10,075.24 0.06% 2.91% 8.00% 11.03% 0.0063%MCKESSON CORP MCK 38,706.63 0.22% 0.66% 12.00% 12.70% 0.0279%MOODY'S CORP MCO 19,596.04 0.11% 1.49% 8.50% 10.05% 0.0112%MONDELEZ INTERNATIONAL INC-A MDLZ 68,541.83 0.39% 1.71% 11.50% 13.31% 0.0518%MEDTRONIC PLC MDT 111,775.20 0.63% 1.98% 7.00% 9.05% 0.0574%METLIFE INC MET 50,212.82 0.29% 3.50% 6.50% 10.11% 0.0288%MOHAWK INDUSTRIES INC MHK 14,255.73 0.08% 0.00% 10.50% 10.50% 0.0085%MEAD JOHNSON NUTRITION CO MJN 16,397.08 0.09% 1.88% 6.50% 8.44% 0.0079%MCCORMICK & CO-NON VTG SHRS MKC 11,851.27 0.07% 1.84% 7.50% 9.41% 0.0063%MARTIN MARIETTA MATERIALS MLM 10,965.94 0.06% 0.94% 20.50% 21.54% 0.0134%MARSH & MCLENNAN COS MMC 32,780.41 0.19% 1.97% 10.50% 12.57% 0.0234%3M CO MMM 101,758.10 0.58% 2.66% 8.50% 11.27% 0.0652%
Docket U-16-___ Exhibit RBH-4 Page 11 of 14

[4] [5] [6] [7] [8] [9]
Company TickerMarket
Capitalization Weight in IndexEstimated
Dividend YieldLong-Term Growth Est. DCF Result
WeightedDCF Result
MALLINCKRODT PLC MNK 7,182.13 N/A 0.00% N/A N/A N/AMONSTER BEVERAGE CORP MNST 25,938.73 0.15% 0.00% 13.50% 13.50% 0.0199%ALTRIA GROUP INC MO 121,896.10 0.69% 3.67% 9.50% 13.34% 0.0924%MONSANTO CO MON 41,171.20 0.23% 2.29% 6.00% 8.36% 0.0195%MOSAIC CO/THE MOS 10,071.35 0.06% 4.20% 5.00% 9.31% 0.0053%MARATHON PETROLEUM CORP MPC 21,760.38 0.12% 3.12% 7.00% 10.23% 0.0126%MERCK & CO. INC. MRK 155,020.10 0.88% 3.30% 6.00% 9.40% 0.0828%MARATHON OIL CORP MRO 9,714.95 0.06% 1.39% 9.00% 10.45% 0.0058%MORGAN STANLEY MS 53,331.80 0.30% 2.20% 14.50% 16.86% 0.0511%MICROSOFT CORP MSFT 392,713.00 2.23% 2.89% 8.00% 11.01% 0.2455%MOTOROLA SOLUTIONS INC MSI 13,305.04 0.08% 2.18% 8.00% 10.27% 0.0078%M & T BANK CORP MTB 15,882.67 0.09% 2.35% 5.50% 7.91% 0.0071%MICRON TECHNOLOGY INC MU 12,665.80 0.07% 0.00% 1.00% 1.00% 0.0007%MURPHY OIL CORP MUR 6,904.95 N/A 3.96% N/A N/A N/AMYLAN NV MYL 20,900.28 0.12% 0.00% 20.50% 20.50% 0.0243%NAVIENT CORP NAVI 4,883.91 N/A 4.75% N/A N/A N/ANOBLE ENERGY INC NBL 15,436.60 N/A 1.12% N/A N/A N/ANASDAQ INC NDAQ 10,329.41 0.06% 2.04% 10.00% 12.14% 0.0071%NEXTERA ENERGY INC NEE 53,692.67 0.30% 3.12% 7.00% 10.23% 0.0312%NEWMONT MINING CORP NEM 17,473.15 0.10% 0.30% -1.00% -0.70% -0.0007%NETFLIX INC NFLX 38,634.42 0.22% 0.00% 37.50% 37.50% 0.0823%NEWFIELD EXPLORATION CO NFX 6,755.24 0.04% 0.00% 6.00% 6.00% 0.0023%NISOURCE INC NI 7,195.93 0.04% 2.75% 1.50% 4.27% 0.0017%NIKE INC -CL B NKE 98,639.90 0.56% 1.09% 15.00% 16.17% 0.0906%NIELSEN HOLDINGS PLC NLSN 18,761.86 0.11% 2.40% 9.50% 12.01% 0.0128%NORTHROP GRUMMAN CORP NOC 37,277.71 0.21% 1.56% 7.50% 9.12% 0.0193%NATIONAL OILWELL VARCO INC NOV 12,437.79 0.07% 0.60% -9.00% -8.43% -0.0060%NRG ENERGY INC NRG 4,796.03 0.03% 0.80% 19.50% 20.38% 0.0056%NORFOLK SOUTHERN CORP NSC 27,391.18 0.16% 2.57% 7.00% 9.66% 0.0150%NETAPP INC NTAP 7,074.21 0.04% 2.96% 1.50% 4.48% 0.0018%NORTHERN TRUST CORP NTRS 16,557.66 0.09% 2.01% 8.50% 10.60% 0.0100%NUCOR CORP NUE 15,961.52 0.09% 3.00% 19.00% 22.29% 0.0202%NVIDIA CORP NVDA 19,475.60 0.11% 1.27% 10.00% 11.33% 0.0125%NEWELL BRANDS INC NWL 11,601.82 0.07% 1.75% 17.00% 18.90% 0.0125%NEWS CORP - CLASS A NWSA 7,288.94 0.04% 1.60% 27.50% 29.32% 0.0121%REALTY INCOME CORP O - N/A 4.02% N/A N/A N/AOWENS-ILLINOIS INC OI 2,958.48 0.02% 0.00% 6.50% 6.50% 0.0011%ONEOK INC OKE 7,458.03 0.04% 7.59% 7.50% 15.37% 0.0065%OMNICOM GROUP OMC 19,938.24 0.11% 2.72% 7.50% 10.32% 0.0117%ORACLE CORP ORCL 169,708.60 0.96% 1.49% 7.00% 8.54% 0.0823%O'REILLY AUTOMOTIVE INC ORLY 25,903.24 0.15% 0.00% 11.00% 11.00% 0.0162%OCCIDENTAL PETROLEUM CORP OXY 58,219.59 0.33% 3.98% -3.00% 0.92% 0.0030%PAYCHEX INC PAYX 19,021.59 0.11% 3.35% 9.50% 13.01% 0.0141%PEOPLE'S UNITED FINANCIAL PBCT 4,815.85 0.03% 4.38% 10.50% 15.11% 0.0041%PITNEY BOWES INC PBI 4,160.69 0.02% 3.52% 5.00% 8.61% 0.0020%PACCAR INC PCAR 21,067.49 0.12% 3.69% 7.00% 10.82% 0.0129%P G & E CORP PCG 28,419.37 0.16% 3.19% 12.00% 15.38% 0.0248%PRICELINE GROUP INC/THE PCLN 65,366.96 0.37% 0.00% 16.50% 16.50% 0.0613%PATTERSON COS INC PDCO 4,316.32 0.02% 2.20% 9.50% 11.80% 0.0029%PUBLIC SERVICE ENTERPRISE GP PEG 23,384.45 0.13% 3.54% 4.00% 7.61% 0.0101%PEPSICO INC PEP 148,894.60 0.85% 2.91% 7.00% 10.01% 0.0847%PFIZER INC PFE 203,219.30 1.15% 3.65% 12.00% 15.87% 0.1832%PRINCIPAL FINANCIAL GROUP PFG 12,775.26 0.07% 3.55% 6.50% 10.17% 0.0074%PROCTER & GAMBLE CO/THE PG 212,309.30 1.21% 3.36% 6.50% 9.97% 0.1202%PROGRESSIVE CORP PGR 18,990.35 0.11% 2.74% 10.00% 12.88% 0.0139%PARKER HANNIFIN CORP PH 15,596.29 0.09% 2.18% 5.50% 7.74% 0.0069%PULTEGROUP INC PHM 6,466.22 0.04% 1.94% 10.50% 12.54% 0.0046%PERKINELMER INC PKI 5,695.81 0.03% 0.55% 6.50% 7.07% 0.0023%PROLOGIS INC PLD - N/A 3.68% N/A N/A N/APHILIP MORRIS INTERNATIONAL PM 150,828.60 0.86% 4.19% 5.00% 9.29% 0.0796%PNC FINANCIAL SERVICES GROUP PNC 47,798.98 0.27% 2.31% 4.50% 6.86% 0.0186%PENTAIR PLC PNR 10,593.54 0.06% 2.25% 12.50% 14.89% 0.0090%PINNACLE WEST CAPITAL PNW 7,943.95 0.05% 3.58% 4.00% 7.65% 0.0035%PPG INDUSTRIES INC PPG 30,789.82 0.17% 1.42% 9.50% 10.99% 0.0192%PPL CORP PPL 25,114.65 0.14% 4.08% 3.00% 7.14% 0.0102%PERRIGO CO PLC PRGO 14,120.28 0.08% 0.60% 15.00% 15.65% 0.0125%PRUDENTIAL FINANCIAL INC PRU 34,847.05 0.20% 3.59% 2.00% 5.63% 0.0111%PUBLIC STORAGE PSA - N/A 2.89% N/A N/A N/APHILLIPS 66 PSX 46,830.70 0.27% 2.78% 3.00% 5.82% 0.0155%PVH CORP PVH 7,782.82 0.04% 0.16% 5.50% 5.66% 0.0025%QUANTA SERVICES INC PWR 3,689.26 0.02% 0.00% 6.50% 6.50% 0.0014%PRAXAIR INC PX 33,685.89 0.19% 2.58% 6.00% 8.66% 0.0166%PIONEER NATURAL RESOURCES CO PXD 24,645.88 0.14% 0.05% 18.50% 18.55% 0.0260%PAYPAL HOLDINGS INC PYPL 49,045.68 N/A 0.00% N/A N/A N/AQUALCOMM INC QCOM 76,474.70 0.43% 3.68% 4.50% 8.26% 0.0359%QORVO INC QRVO 6,281.05 N/A 0.00% N/A N/A N/ARYDER SYSTEM INC R 3,775.55 0.02% 2.32% 9.50% 11.93% 0.0026%REYNOLDS AMERICAN INC RAI 70,382.18 0.40% 3.41% 10.00% 13.58% 0.0543%
Docket U-16-___ Exhibit RBH-4 Page 12 of 14

[4] [5] [6] [7] [8] [9]
Company TickerMarket
Capitalization Weight in IndexEstimated
Dividend YieldLong-Term Growth Est. DCF Result
WeightedDCF Result
ROYAL CARIBBEAN CRUISES LTD RCL 16,571.83 0.09% 1.97% 16.50% 18.63% 0.0175%REGENERON PHARMACEUTICALS REGN 40,949.15 0.23% 0.00% 27.00% 27.00% 0.0628%REGIONS FINANCIAL CORP RF 12,220.86 0.07% 2.87% 6.00% 8.96% 0.0062%ROBERT HALF INTL INC RHI 5,152.20 0.03% 2.29% 11.00% 13.42% 0.0039%RED HAT INC RHT 13,448.06 0.08% 0.00% 15.50% 15.50% 0.0118%TRANSOCEAN LTD RIG 4,040.79 0.02% 0.00% -19.00% -19.00% -0.0044%RALPH LAUREN CORP RL 7,896.84 0.04% 2.23% 4.50% 6.78% 0.0030%ROCKWELL AUTOMATION INC ROK 15,011.14 0.09% 2.54% 3.00% 5.58% 0.0048%ROPER TECHNOLOGIES INC ROP 17,833.81 0.10% 0.68% 7.00% 7.70% 0.0078%ROSS STORES INC ROST 23,263.49 0.13% 0.98% 9.00% 10.02% 0.0132%RANGE RESOURCES CORP RRC 6,899.63 0.04% 0.20% 12.00% 12.21% 0.0048%REPUBLIC SERVICES INC RSG 16,329.60 0.09% 2.62% 8.50% 11.23% 0.0104%RAYTHEON COMPANY RTN 38,125.23 0.22% 2.30% 9.00% 11.40% 0.0247%STARBUCKS CORP SBUX 82,627.09 0.47% 1.52% 16.50% 18.15% 0.0852%SCANA CORP SCG 9,690.05 0.06% 3.39% 4.50% 7.97% 0.0044%SCHWAB (CHARLES) CORP SCHW 38,148.89 0.22% 0.97% 12.00% 13.03% 0.0282%SPECTRA ENERGY CORP SE 20,941.91 0.12% 5.19% 5.50% 10.83% 0.0129%SEALED AIR CORP SEE 9,477.23 0.05% 1.32% 16.00% 17.43% 0.0094%SHERWIN-WILLIAMS CO/THE SHW 26,715.65 0.15% 1.19% 12.00% 13.26% 0.0201%SIGNET JEWELERS LTD SIG 8,629.99 0.05% 0.96% 15.00% 16.03% 0.0079%JM SMUCKER CO/THE SJM 15,293.35 0.09% 2.17% 7.00% 9.25% 0.0080%SCHLUMBERGER LTD SLB 100,233.00 0.57% 2.51% 10.00% 12.64% 0.0719%SL GREEN REALTY CORP SLG - N/A 2.73% N/A N/A N/ASNAP-ON INC SNA 9,355.50 0.05% 1.51% 10.00% 11.59% 0.0062%SANDISK CORP SNDK 15,374.43 0.09% 0.00% -0.50% -0.50% -0.0004%SCRIPPS NETWORKS INTER-CL A SNI 8,185.91 0.05% 1.57% 9.00% 10.64% 0.0049%SOUTHERN CO/THE SO 45,540.46 0.26% 4.48% 2.50% 7.04% 0.0182%SIMON PROPERTY GROUP INC SPG - N/A 3.14% N/A N/A N/AS&P GLOBAL INC SPGI 28,538.17 0.16% 1.34% 11.00% 12.41% 0.0201%STAPLES INC SPLS 6,702.62 0.04% 4.62% -2.00% 2.57% 0.0010%STERICYCLE INC SRCL 10,340.84 0.06% 0.00% 10.50% 10.50% 0.0062%SEMPRA ENERGY SRE 25,597.04 0.15% 2.99% 10.00% 13.14% 0.0191%SUNTRUST BANKS INC STI 21,401.51 0.12% 2.76% 9.00% 11.88% 0.0144%ST JUDE MEDICAL INC STJ 22,049.57 0.13% 1.59% 5.00% 6.63% 0.0083%STATE STREET CORP STT 25,102.08 0.14% 2.26% 6.50% 8.83% 0.0126%SEAGATE TECHNOLOGY STX 7,969.34 0.05% 9.37% 0.50% 9.89% 0.0045%CONSTELLATION BRANDS INC-A STZ 30,995.42 0.18% 1.04% 16.50% 17.63% 0.0310%STANLEY BLACK & DECKER INC SWK 16,830.70 0.10% 1.96% 8.50% 10.54% 0.0101%SKYWORKS SOLUTIONS INC SWKS 13,753.05 0.08% 1.45% 18.00% 19.58% 0.0153%SOUTHWESTERN ENERGY CO SWN 4,913.99 0.03% 0.00% -5.50% -5.50% -0.0015%SYNCHRONY FINANCIAL SYF 25,823.65 N/A 0.00% N/A N/A N/ASTRYKER CORP SYK 41,194.56 0.23% 1.39% 15.50% 17.00% 0.0398%SYMANTEC CORP SYMC 11,077.02 0.06% 2.67% -3.50% -0.88% -0.0006%SYSCO CORP SYY 26,211.94 0.15% 2.72% 10.50% 13.36% 0.0199%AT&T INC T 237,440.50 1.35% 5.00% 6.50% 11.66% 0.1573%MOLSON COORS BREWING CO -B TAP 17,651.12 0.10% 1.71% 8.00% 9.78% 0.0098%TERADATA CORP TDC 3,385.13 0.02% 0.00% 3.50% 3.50% 0.0007%TECO ENERGY INC TE 6,531.93 0.04% 3.35% 5.50% 8.94% 0.0033%TE CONNECTIVITY LTD TEL 21,492.96 0.12% 2.20% 8.50% 10.79% 0.0132%TEGNA INC TGNA 5,170.81 0.03% 2.38% 1.00% 3.39% 0.0010%TARGET CORP TGT 48,979.12 0.28% 2.90% 11.00% 14.06% 0.0391%TIFFANY & CO TIF 9,135.94 0.05% 2.33% 7.50% 9.92% 0.0051%TJX COMPANIES INC TJX 51,016.21 0.29% 1.35% 10.00% 11.42% 0.0331%TORCHMARK CORP TMK 7,099.91 0.04% 0.97% 7.00% 8.00% 0.0032%THERMO FISHER SCIENTIFIC INC TMO 57,996.93 0.33% 0.41% 8.00% 8.43% 0.0278%TRIPADVISOR INC TRIP 9,237.46 0.05% 0.00% 18.50% 18.50% 0.0097%T ROWE PRICE GROUP INC TROW 18,978.04 0.11% 2.90% 9.50% 12.54% 0.0135%TRAVELERS COS INC/THE TRV 32,291.57 0.18% 2.46% 3.50% 6.00% 0.0110%TRACTOR SUPPLY COMPANY TSCO 12,747.25 0.07% 0.97% 14.00% 15.04% 0.0109%TYSON FOODS INC-CL A TSN 23,783.76 0.14% 0.98% 12.50% 13.54% 0.0183%TESORO CORP TSO 10,171.09 0.06% 2.35% 10.50% 12.97% 0.0075%TOTAL SYSTEM SERVICES INC TSS 9,413.37 0.05% 0.78% 11.50% 12.32% 0.0066%TIME WARNER CABLE TWC 59,716.81 0.34% 1.42% 6.50% 7.97% 0.0270%TIME WARNER INC TWX 61,016.25 0.35% 2.10% 11.50% 13.72% 0.0475%TEXAS INSTRUMENTS INC TXN 59,351.32 0.34% 2.59% 7.50% 10.19% 0.0343%TEXTRON INC TXT 10,777.16 0.06% 0.20% 15.50% 15.72% 0.0096%TYCO INTERNATIONAL PLC TYC 16,711.83 0.09% 2.08% 9.50% 11.68% 0.0111%UNDER ARMOUR INC-CLASS A UA 19,301.70 0.11% 0.00% 24.50% 24.50% 0.0269%UNITED CONTINENTAL HOLDINGS UAL 17,961.46 0.10% 0.00% 21.00% 21.00% 0.0214%UDR INC UDR - N/A 3.35% N/A N/A N/AUNIVERSAL HEALTH SERVICES-B UHS 13,284.99 0.08% 0.30% 12.00% 12.32% 0.0093%ULTA SALON COSMETICS & FRAGR ULTA 13,152.14 0.07% 0.00% 18.00% 18.00% 0.0134%UNITEDHEALTH GROUP INC UNH 125,862.70 0.71% 1.51% 12.50% 14.10% 0.1008%UNUM GROUP UNM 8,275.50 0.05% 2.15% 11.00% 13.27% 0.0062%UNION PACIFIC CORP UNP 75,163.66 0.43% 2.49% 8.50% 11.10% 0.0474%UNITED PARCEL SERVICE-CL B UPS 93,474.81 0.53% 2.97% 9.00% 12.10% 0.0643%URBAN OUTFITTERS INC URBN 3,648.68 0.02% 0.00% 13.50% 13.50% 0.0028%UNITED RENTALS INC URI 6,201.77 0.04% 0.00% 13.00% 13.00% 0.0046%
Docket U-16-___ Exhibit RBH-4 Page 13 of 14

[4] [5] [6] [7] [8] [9]
Company TickerMarket
Capitalization Weight in IndexEstimated
Dividend YieldLong-Term Growth Est. DCF Result
WeightedDCF Result
US BANCORP USB 75,270.04 0.43% 2.44% 4.00% 6.49% 0.0277%UNITED TECHNOLOGIES CORP UTX 87,380.59 0.50% 2.53% 6.50% 9.11% 0.0452%VISA INC-CLASS A SHARES V 170,119.20 0.97% 0.77% 13.00% 13.82% 0.1335%VARIAN MEDICAL SYSTEMS INC VAR 7,913.20 0.04% 0.00% 7.50% 7.50% 0.0034%VF CORP VFC 26,731.63 0.15% 2.36% 11.00% 13.49% 0.0205%VIACOM INC-CLASS B VIAB 16,794.64 0.10% 3.77% 5.00% 8.86% 0.0085%VALERO ENERGY CORP VLO 28,812.81 0.16% 3.94% 8.50% 12.61% 0.0206%VULCAN MATERIALS CO VMC 14,473.13 0.08% 0.74% 33.50% 34.36% 0.0282%VORNADO REALTY TRUST VNO 18,066.00 0.10% 2.63% 22.50% 25.43% 0.0261%VERISK ANALYTICS INC VRSK 13,330.28 0.08% 0.00% 12.00% 12.00% 0.0091%VERISIGN INC VRSN 10,005.29 0.06% 0.00% 11.00% 11.00% 0.0063%VERTEX PHARMACEUTICALS INC VRTX 21,309.79 N/A 0.00% N/A N/A N/AVENTAS INC VTR - N/A 4.72% N/A N/A N/AVERIZON COMMUNICATIONS INC VZ 207,600.40 1.18% 4.43% 5.00% 9.54% 0.1125%WATERS CORP WAT 10,749.75 0.06% 0.00% 8.00% 8.00% 0.0049%WALGREENS BOOTS ALLIANCE INC WBA 86,739.88 0.49% 1.79% 13.50% 15.41% 0.0759%WESTERN DIGITAL CORP WDC 10,685.92 0.06% 4.34% -0.50% 3.83% 0.0023%WEC ENERGY GROUP INC WEC 18,334.87 0.10% 3.46% 6.00% 9.56% 0.0100%WELLS FARGO & CO WFC 257,518.20 1.46% 3.13% 5.50% 8.72% 0.1275%WHOLE FOODS MARKET INC WFM 9,771.12 0.06% 1.88% 8.00% 9.96% 0.0055%WHIRLPOOL CORP WHR 13,632.84 0.08% 2.29% 11.50% 13.92% 0.0108%WILLIS TOWERS WATSON PLC WLTW N/A N/A 0.00% N/A N/A N/AWASTE MANAGEMENT INC WM 26,074.89 0.15% 2.81% 7.50% 10.42% 0.0154%WILLIAMS COS INC WMB 14,710.36 0.08% 13.04% 10.50% 24.22% 0.0202%WAL-MART STORES INC WMT 217,893.40 1.24% 2.90% 2.00% 4.93% 0.0610%WESTROCK CO WRK 10,729.75 N/A 3.59% N/A N/A N/AWESTERN UNION CO WU 10,108.29 0.06% 3.18% 6.00% 9.28% 0.0053%WEYERHAEUSER CO WY 16,345.66 0.09% 3.87% 12.00% 16.10% 0.0149%WYNDHAM WORLDWIDE CORP WYN 8,150.64 0.05% 2.79% 5.50% 8.37% 0.0039%WYNN RESORTS LTD WYNN 9,062.25 0.05% 2.24% 6.50% 8.81% 0.0045%CIMAREX ENERGY CO XEC 10,384.47 0.06% 0.29% 3.00% 3.29% 0.0019%XCEL ENERGY INC XEL 20,270.95 0.12% 3.46% 5.50% 9.06% 0.0104%XL GROUP PLC XL 8,354.69 0.05% 2.44% 8.50% 11.04% 0.0052%XILINX INC XLNX 11,047.00 0.06% 3.05% 7.00% 10.16% 0.0064%EXXON MOBIL CORP XOM 365,852.70 2.08% 3.41% 5.00% 8.50% 0.1765%DENTSPLY SIRONA INC XRAY 8,434.13 0.05% 0.51% 9.00% 9.53% 0.0046%XEROX CORP XRX 9,956.18 0.06% 3.15% 5.50% 8.74% 0.0049%XYLEM INC XYL 7,523.13 0.04% 1.47% 9.50% 11.04% 0.0047%YAHOO! INC YHOO 34,608.79 0.20% 0.00% 1.50% 1.50% 0.0029%YUM! BRANDS INC YUM 32,739.08 0.19% 2.29% 10.00% 12.40% 0.0231%ZIMMER BIOMET HOLDINGS INC ZBH 23,345.00 0.13% 0.84% 10.50% 11.38% 0.0151%ZIONS BANCORPORATION ZION 5,623.51 0.03% 0.95% 10.00% 11.00% 0.0035%ZOETIS INC ZTS 23,472.31 0.13% 0.81% 11.00% 11.85% 0.0158%
Total Market Capitalization: 17,606,924.72 12.25%Notes:[1] Equals sum of Col. [9][2] Source: Bloomberg Professional[3] Equals [1] − [2][4] Source: Value Line[5] Equals weight in S&P 500 based on market capitalization [6] Source: Value Line[7] Source: Value Line[8] Equals ([6] x (1 + (0.5 x [7]))) + [7][9] Equals Col. [5] x Col. [8]
Docket U-16-___ Exhibit RBH-4 Page 14 of 14

[1] [2]Company Ticker Bloomberg Value Line
Atmos Energy Corporation ATO 0.643 0.800Boardwalk Pipeline Partners, LP BWP 1.232 0.800Dominion Midstream Partners, LP DM N/A N/AEnLink Midstream Partners, LP ENLK 1.379 1.250EQT Midstream Partners, LP EQM 1.012 1.300Kinder Morgan Inc. KMI 1.226 1.100New Jersey Resources Corporation NJR 0.721 0.800Northwest Natural Gas Company NWN 0.626 0.650South Jersey Industries, Inc. SJI 0.656 0.850Southwest Gas Corporation SWX 0.572 0.800Spectra Energy Partners, LP SEP 0.983 0.850Spire Inc SR 0.673 0.700TC Pipelines, LP TCP 1.126 0.950WGL Holdings, Inc. WGL 0.662 0.800
Mean 0.885 0.896
Notes:[1] Source: Bloomberg Professional[2] Source: Value Line
Bloomberg and Value Line Beta Coefficients
Docket U-16-___ Exhibit RBH-5 Page 1 of 1

[1] [2] [3] [4] [5] [6]
Risk-Free Rate
Average Beta Coefficient
Bloomberg Market DCF
Derived
Value LineMarket DCF
Derived
Bloomberg Market DCF
Derived
Value Line Market DCF
Derived
PROXY GROUP AVERAGE BLOOMBERG BETA COEFFICIENTCurrent 30-Year Treasury (30-day average) [7] 2.64% 0.885 10.58% 9.62% 12.00% 11.15%Near-Term Projected 30-Year Treasury [8] 3.22% 0.885 10.58% 9.62% 12.58% 11.73%Mean 12.29% 11.44%
Risk-Free Rate
Average Beta Coefficient
Bloomberg Market DCF
Derived
Value Line Market DCF
Derived
Bloomberg Market DCF
Derived
Value Line Market DCF
Derived
PROXY GROUP AVERAGE VALUE LINE AVERAGE BETA COEFFICIENTCurrent 30-Year Treasury (30-day average) [7] 2.64% 0.896 10.58% 9.62% 12.12% 11.25%Near-Term Projected 30-Year Treasury [8] 3.22% 0.896 10.58% 9.62% 12.70% 11.83%Mean 12.41% 11.54%
Notes:[1] See Notes [7] and [8][2] Source: Exhibit RBH-5[3] Source: Exhibit RBH-4[4] Source: Exhibit RBH-4[5] Equals Col. [1] + (Col. [2] x Col. [3])[6] Equals Col. [1] + (Col. [2] x Col. [4])[7] Source: Bloomberg Professional[8] Source: Blue Chip Financial Forecasts, Vol. 35, No. 4, April 1, 2016, at 2
Capital Asset Pricing Model ResultsBloomberg and Value Line Derived Market Risk Premium
Docket U-16-___ Exhibit RBH-6 Page 1 of 1

Bond Yield Plus Risk Premium - Pipelines
[1] [2] [3] [4] [5]
Constant Slope
30-YearTreasury
YieldRisk
PremiumReturn on
Equity
Current -1.13% -3.12% 2.64% 10.22% 12.85%Near-Term Projected -1.13% -3.12% 3.22% 9.60% 12.81%Long-Term Projected -1.13% -3.12% 4.65% 8.45% 13.10%
Notes:[1] Constant of regression equation[2] Slope of regression equation[3] Source: Current = Bloomberg Professional[3] Source: Near-Term Projected = Blue Chip Financial Forecasts, Vol. 35, No. 4, April 1, 2016, at 2[4] Source: Long Term Projected = Blue Chip Financial Forecasts, Vol. 34, No. 12, December 1, 2015, at 14[4] Equals [1] + LN[3] x [2][5] Equals [3] + [4][6] Source: Review of FERC cases[7] Source: Review of FERC cases[8] Source: Bloomberg Professional, equals 250-trading day average (i.e. lag period) as of April 29, 2016[9] Equals [7] - [8]
y = -0.031ln(x) - 0.0113R² = 0.1956
4.00%
5.00%
6.00%
7.00%
8.00%
9.00%
10.00%
11.00%
12.00%
2.00% 2.50% 3.00% 3.50% 4.00% 4.50% 5.00% 5.50%
Eq
uit
y R
isk
Pre
miu
m
30-Year Treasury Yield
Docket U-16-___ Exhibit RBH-7 Page 1 of 17

[6] [7] [8] [9]Date of
Authorized ROE
Return on Equity
30-Year Treasury
YieldRisk
Premium2/6/2006 14.00% 4.56% 9.44%
5/22/2006 14.00% 4.64% 9.36%6/15/2006 14.00% 4.70% 9.30%6/16/2006 13.00% 4.70% 8.30%6/19/2006 14.00% 4.71% 9.29%6/20/2006 12.75% 4.71% 8.04%7/20/2006 12.70% 4.78% 7.92%7/20/2006 12.50% 4.78% 7.72%9/8/2006 11.75% 4.86% 6.89%
9/21/2006 13.00% 4.87% 8.13%10/6/2006 14.00% 4.87% 9.13%
10/19/2006 11.20% 4.88% 6.32%12/21/2006 12.50% 4.88% 7.62%12/21/2006 14.00% 4.88% 9.12%2/21/2007 13.42% 4.93% 8.49%3/15/2007 14.00% 4.92% 9.08%4/4/2007 14.00% 4.91% 9.09%
4/10/2007 11.20% 4.91% 6.29%4/20/2007 11.20% 4.90% 6.30%4/23/2007 11.75% 4.90% 6.85%5/17/2007 13.50% 4.87% 8.63%6/1/2007 12.75% 4.87% 7.88%6/7/2007 14.00% 4.87% 9.13%
7/10/2007 14.00% 4.87% 9.13%7/17/2007 13.00% 4.87% 8.13%9/20/2007 14.00% 4.87% 9.13%
12/14/2007 14.00% 4.85% 9.15%1/31/2008 13.60% 4.79% 8.81%4/30/2008 13.50% 4.70% 8.80%5/2/2008 11.50% 4.69% 6.81%
5/30/2008 13.00% 4.65% 8.35%7/17/2008 12.00% 4.58% 7.42%7/18/2008 11.20% 4.58% 6.62%8/1/2008 13.00% 4.57% 8.43%
8/28/2008 11.50% 4.54% 6.96%9/2/2008 14.00% 4.54% 9.46%
9/18/2008 14.00% 4.51% 9.49%1/15/2009 14.00% 4.20% 9.80%1/15/2009 11.55% 4.20% 7.35%2/19/2009 14.00% 4.09% 9.91%6/4/2009 13.25% 3.90% 9.35%9/4/2009 14.00% 3.89% 10.11%
11/19/2009 13.00% 3.93% 9.07%11/19/2009 12.75% 3.93% 8.82%12/17/2009 14.00% 4.05% 9.95%12/17/2009 14.00% 4.05% 9.95%
4/7/2010 14.00% 4.41% 9.59%4/9/2010 14.00% 4.42% 9.58%
5/14/2010 11.50% 4.45% 7.05%9/16/2010 11.55% 4.31% 7.24%1/20/2011 13.50% 4.23% 9.27%2/17/2011 12.99% 4.23% 8.76%4/8/2011 12.56% 4.21% 8.35%
7/22/2011 14.00% 4.25% 9.75%11/14/2011 13.50% 4.08% 9.42%1/19/2012 11.55% 3.79% 7.76%2/16/2012 12.75% 3.67% 9.08%5/17/2012 12.50% 3.34% 9.16%6/21/2012 12.99% 3.19% 9.80%6/21/2012 12.99% 3.19% 9.80%9/20/2012 12.99% 2.97% 10.02%3/14/2013 12.20% 2.91% 9.29%3/21/2013 11.59% 2.90% 8.69%5/31/2013 11.59% 2.92% 8.67%6/5/2013 12.99% 2.93% 10.06%
10/17/2013 10.55% 3.27% 7.28%11/18/2013 10.41% 3.35% 7.06%11/26/2013 13.90% 3.37% 10.53%2/11/2014 12.75% 3.54% 9.21%3/12/2014 12.78% 3.58% 9.20%5/8/2014 15.34% 3.67% 11.67%6/6/2014 14.00% 3.67% 10.33%
Bond Yield Plus Risk Premium
Docket U-16-___ Exhibit RBH-7 Page 2 of 17

[6] [7] [8] [9]Date of
Authorized ROE
Return on Equity
30-Year Treasury
YieldRisk
Premium6/19/2014 14.00% 3.67% 10.33%12/2/2014 14.00% 3.40% 10.60%12/2/2014 12.75% 3.40% 9.35%
12/18/2014 14.50% 3.35% 11.15%4/6/2015 14.00% 3.02% 10.98%
1/21/2016 11.50% 2.89% 8.61%
Average 8.81%Count 78
Docket U-16-___ Exhibit RBH-7 Page 3 of 17

Bond Yield Plus Risk Premium - Natural Gas Utilities
[1] [2] [3] [4] [5]
Constant Slope
30-Year Treasury
YieldRisk
PremiumReturn on
Equity
Current -2.96% -2.84% 2.64% 7.35% 9.98%Near-Term Projected -2.96% -2.84% 3.22% 6.78% 10.00%Long-Term Projected -2.96% -2.84% 4.65% 5.74% 10.39%
Notes:[1] Constant of regression equation[2] Slope of regression equation[3] Source: Current = Bloomberg Professional[3] Source: Near-Term Projected = Blue Chip Financial Forecasts, Vol. 35, No. 4, April 1, 2016, at 2[4] Source: Long Term Projected = Blue Chip Financial Forecasts, Vol. 34, No. 12, December 1, 2015, at 14[4] Equals [1] + LN[3] x [2][5] Equals [3] + [4][6] Source: SNL Financial[7] Source: SNL Financial[8] Source: Bloomberg Professional, equals 188-trading day average (i.e. lag period) as of April 29, 2016[9] Equals [7] - [8]
y = -0.028ln(x) - 0.0296R² = 0.761
-4.00%
-2.00%
0.00%
2.00%
4.00%
6.00%
8.00%
10.00%
0.00% 2.00% 4.00% 6.00% 8.00% 10.00% 12.00% 14.00% 16.00%
Ris
k P
rem
ium
Treasury Yield
Docket U-16-___ Exhibit RBH-7 Page 4 of 17

[6] [7] [8] [9]Date of
Authorized ROE
Return on Equity
30-Year Treasury
YieldRisk
Premium1/3/1980 12.55% 9.40% 3.15%1/4/1980 13.75% 9.40% 4.35%
1/14/1980 13.20% 9.45% 3.75%1/18/1980 14.00% 9.48% 4.52%1/31/1980 12.61% 9.56% 3.05%2/8/1980 14.50% 9.63% 4.87%
2/14/1980 13.00% 9.68% 3.32%2/15/1980 13.00% 9.69% 3.31%2/29/1980 14.00% 9.86% 4.14%3/5/1980 14.00% 9.91% 4.09%3/7/1980 13.50% 9.95% 3.55%
3/14/1980 14.00% 10.04% 3.96%3/27/1980 12.69% 10.21% 2.48%4/1/1980 14.75% 10.27% 4.48%
4/29/1980 12.50% 10.51% 1.99%5/7/1980 14.27% 10.56% 3.71%5/8/1980 13.75% 10.57% 3.18%
5/19/1980 15.50% 10.63% 4.87%5/27/1980 14.60% 10.66% 3.94%5/29/1980 16.00% 10.68% 5.32%6/10/1980 13.78% 10.72% 3.06%6/25/1980 14.25% 10.74% 3.51%7/9/1980 14.51% 10.78% 3.73%
7/17/1980 12.90% 10.79% 2.11%7/18/1980 13.80% 10.80% 3.00%7/22/1980 14.10% 10.80% 3.30%7/23/1980 14.19% 10.79% 3.40%8/1/1980 12.50% 10.80% 1.70%
8/11/1980 14.85% 10.82% 4.03%8/21/1980 13.03% 10.85% 2.18%8/28/1980 13.61% 10.88% 2.73%8/28/1980 14.00% 10.88% 3.12%9/4/1980 14.00% 10.90% 3.10%
9/24/1980 15.00% 10.99% 4.01%10/9/1980 14.50% 11.06% 3.44%10/9/1980 14.50% 11.06% 3.44%
10/24/1980 14.00% 11.09% 2.91%10/27/1980 15.20% 11.10% 4.10%10/27/1980 15.20% 11.10% 4.10%10/28/1980 12.00% 11.10% 0.90%10/28/1980 13.00% 11.10% 1.90%10/31/1980 14.50% 11.12% 3.38%11/4/1980 15.00% 11.12% 3.88%11/6/1980 14.35% 11.13% 3.22%
11/10/1980 13.25% 11.14% 2.11%11/17/1980 15.50% 11.14% 4.36%11/19/1980 13.50% 11.13% 2.37%12/5/1980 14.60% 11.13% 3.47%12/8/1980 16.40% 11.13% 5.27%
12/12/1980 15.45% 11.14% 4.31%12/17/1980 14.20% 11.15% 3.05%12/17/1980 14.40% 11.15% 3.25%12/18/1980 14.00% 11.16% 2.84%12/22/1980 13.45% 11.15% 2.30%12/26/1980 14.00% 11.14% 2.86%12/30/1980 14.50% 11.13% 3.37%12/31/1980 14.56% 11.13% 3.43%
1/7/1981 14.30% 11.13% 3.17%1/12/1981 14.95% 11.14% 3.81%1/26/1981 15.25% 11.20% 4.05%1/30/1981 13.25% 11.24% 2.01%2/11/1981 14.50% 11.34% 3.16%2/20/1981 14.50% 11.40% 3.10%3/12/1981 15.65% 11.61% 4.04%3/25/1981 15.30% 11.75% 3.55%4/1/1981 15.30% 11.83% 3.47%4/9/1981 15.00% 11.92% 3.08%
4/29/1981 13.50% 12.13% 1.37%4/29/1981 14.25% 12.13% 2.12%4/30/1981 13.60% 12.15% 1.45%4/30/1981 15.00% 12.15% 2.85%5/21/1981 14.00% 12.38% 1.62%6/3/1981 14.67% 12.46% 2.21%
6/22/1981 16.00% 12.58% 3.42%6/25/1981 14.75% 12.61% 2.14%7/2/1981 14.00% 12.65% 1.35%
7/10/1981 16.00% 12.70% 3.30%7/14/1981 16.90% 12.72% 4.18%7/21/1981 15.78% 12.78% 3.00%
Bond Yield Plus Risk Premium
Docket U-16-___ Exhibit RBH-7 Page 5 of 17

[6] [7] [8] [9]Date of
Authorized ROE
Return on Equity
30-Year Treasury
YieldRisk
Premium7/27/1981 13.77% 12.83% 0.94%7/27/1981 15.50% 12.83% 2.67%7/31/1981 13.50% 12.87% 0.63%7/31/1981 14.20% 12.87% 1.33%8/12/1981 13.72% 12.94% 0.78%8/12/1981 13.72% 12.94% 0.78%8/12/1981 14.41% 12.94% 1.47%8/25/1981 15.45% 13.02% 2.43%8/27/1981 14.43% 13.05% 1.38%8/28/1981 15.00% 13.06% 1.94%9/23/1981 14.34% 13.25% 1.09%9/24/1981 16.25% 13.26% 2.99%9/29/1981 14.50% 13.31% 1.19%9/30/1981 15.94% 13.33% 2.61%10/2/1981 14.80% 13.37% 1.43%
10/12/1981 16.25% 13.43% 2.82%10/20/1981 15.25% 13.51% 1.74%10/20/1981 16.50% 13.51% 2.99%10/20/1981 17.00% 13.51% 3.49%10/23/1981 15.50% 13.55% 1.95%10/26/1981 13.50% 13.56% -0.06%10/29/1981 16.50% 13.60% 2.90%11/4/1981 15.33% 13.63% 1.70%11/6/1981 15.17% 13.64% 1.53%
11/12/1981 15.00% 13.65% 1.35%11/25/1981 15.25% 13.66% 1.59%11/25/1981 16.10% 13.66% 2.44%11/25/1981 16.10% 13.66% 2.44%11/30/1981 16.75% 13.66% 3.09%12/1/1981 15.70% 13.66% 2.04%12/1/1981 16.00% 13.66% 2.34%
12/15/1981 15.81% 13.70% 2.11%12/17/1981 14.75% 13.71% 1.04%12/22/1981 15.70% 13.72% 1.98%12/22/1981 16.00% 13.72% 2.28%12/30/1981 16.00% 13.75% 2.25%12/30/1981 16.25% 13.75% 2.50%
1/4/1982 15.50% 13.75% 1.75%1/14/1982 11.95% 13.81% -1.86%1/25/1982 16.25% 13.84% 2.41%1/27/1982 16.84% 13.85% 2.99%1/31/1982 14.00% 13.86% 0.14%2/2/1982 16.24% 13.86% 2.38%2/8/1982 15.50% 13.88% 1.62%2/9/1982 14.95% 13.88% 1.07%2/9/1982 15.75% 13.88% 1.87%
2/11/1982 16.00% 13.89% 2.11%3/1/1982 15.96% 13.91% 2.05%3/3/1982 15.00% 13.92% 1.08%3/8/1982 17.10% 13.92% 3.18%
3/26/1982 16.00% 13.97% 2.03%3/31/1982 16.25% 13.98% 2.27%4/1/1982 16.50% 13.98% 2.52%4/6/1982 15.00% 13.99% 1.01%4/9/1982 16.50% 13.99% 2.51%
4/12/1982 15.10% 13.99% 1.11%4/12/1982 16.70% 13.99% 2.71%4/18/1982 14.70% 13.99% 0.71%4/27/1982 15.00% 13.97% 1.03%5/10/1982 14.57% 13.94% 0.63%5/14/1982 15.80% 13.92% 1.88%5/20/1982 15.82% 13.91% 1.91%5/21/1982 15.50% 13.90% 1.60%5/25/1982 16.25% 13.89% 2.36%6/2/1982 14.50% 13.86% 0.64%6/7/1982 16.00% 13.85% 2.15%
6/23/1982 15.50% 13.81% 1.69%6/25/1982 16.50% 13.81% 2.69%7/1/1982 15.55% 13.79% 1.76%7/1/1982 16.00% 13.79% 2.21%7/2/1982 15.10% 13.78% 1.32%
7/13/1982 16.80% 13.75% 3.05%7/22/1982 14.50% 13.71% 0.79%7/28/1982 16.10% 13.67% 2.43%7/30/1982 14.82% 13.66% 1.16%8/4/1982 15.58% 13.64% 1.94%8/6/1982 16.50% 13.63% 2.87%
8/11/1982 17.11% 13.62% 3.49%8/25/1982 16.00% 13.59% 2.41%8/30/1982 16.25% 13.58% 2.67%9/3/1982 15.50% 13.57% 1.93%9/9/1982 16.04% 13.55% 2.49%
Docket U-16-___ Exhibit RBH-7 Page 6 of 17

[6] [7] [8] [9]Date of
Authorized ROE
Return on Equity
30-Year Treasury
YieldRisk
Premium9/15/1982 16.04% 13.52% 2.52%9/17/1982 15.25% 13.51% 1.74%9/29/1982 14.50% 13.43% 1.07%9/30/1982 14.74% 13.42% 1.32%9/30/1982 15.50% 13.42% 2.08%9/30/1982 16.50% 13.42% 3.08%9/30/1982 16.70% 13.42% 3.28%10/1/1982 16.50% 13.40% 3.10%10/8/1982 15.00% 13.33% 1.67%
10/15/1982 15.90% 13.25% 2.65%10/19/1982 15.90% 13.22% 2.68%10/27/1982 17.00% 13.12% 3.88%10/28/1982 14.75% 13.10% 1.65%11/2/1982 16.25% 13.07% 3.18%11/4/1982 15.75% 13.02% 2.73%11/5/1982 14.73% 13.00% 1.73%
11/17/1982 16.00% 12.86% 3.14%11/23/1982 15.50% 12.79% 2.71%11/24/1982 14.50% 12.77% 1.73%11/24/1982 16.02% 12.77% 3.25%11/30/1982 12.98% 12.72% 0.26%11/30/1982 15.50% 12.72% 2.78%11/30/1982 15.50% 12.72% 2.78%11/30/1982 15.65% 12.72% 2.93%11/30/1982 16.00% 12.72% 3.28%11/30/1982 16.10% 12.72% 3.38%12/3/1982 15.33% 12.68% 2.65%12/8/1982 15.75% 12.63% 3.12%
12/13/1982 16.00% 12.58% 3.42%12/14/1982 16.40% 12.56% 3.84%12/17/1982 16.25% 12.52% 3.73%12/20/1982 15.00% 12.50% 2.50%12/21/1982 15.70% 12.49% 3.21%12/28/1982 15.25% 12.42% 2.83%12/28/1982 15.25% 12.42% 2.83%12/29/1982 16.25% 12.40% 3.85%12/29/1982 16.25% 12.40% 3.85%1/11/1983 15.90% 12.25% 3.65%1/12/1983 15.50% 12.24% 3.26%1/18/1983 15.00% 12.18% 2.82%1/24/1983 15.50% 12.13% 3.37%1/24/1983 16.00% 12.13% 3.87%1/28/1983 14.90% 12.07% 2.83%1/31/1983 15.00% 12.06% 2.94%2/10/1983 15.00% 11.97% 3.03%2/25/1983 15.70% 11.83% 3.87%3/2/1983 15.25% 11.78% 3.47%
3/16/1983 16.00% 11.61% 4.39%3/21/1983 14.96% 11.55% 3.41%3/23/1983 15.40% 11.52% 3.88%3/23/1983 16.10% 11.52% 4.58%3/24/1983 15.00% 11.50% 3.50%4/12/1983 13.25% 11.29% 1.96%4/29/1983 15.05% 11.08% 3.97%5/3/1983 15.40% 11.05% 4.35%5/9/1983 15.50% 10.99% 4.51%
5/19/1983 14.85% 10.89% 3.96%5/31/1983 14.00% 10.83% 3.17%6/2/1983 14.50% 10.81% 3.69%6/7/1983 14.50% 10.79% 3.71%6/9/1983 14.85% 10.78% 4.07%
6/20/1983 14.15% 10.73% 3.42%6/20/1983 16.50% 10.73% 5.77%6/27/1983 14.50% 10.71% 3.79%6/30/1983 14.80% 10.70% 4.10%6/30/1983 15.90% 10.70% 5.20%7/1/1983 14.80% 10.69% 4.11%7/5/1983 15.00% 10.69% 4.31%7/8/1983 15.50% 10.69% 4.81%
7/19/1983 15.00% 10.70% 4.30%7/19/1983 15.10% 10.70% 4.40%8/18/1983 15.30% 10.81% 4.49%8/19/1983 15.79% 10.82% 4.97%8/29/1983 16.00% 10.85% 5.15%8/31/1983 14.75% 10.87% 3.88%8/31/1983 15.25% 10.87% 4.38%9/8/1983 14.75% 10.90% 3.85%
9/16/1983 15.51% 10.93% 4.58%9/26/1983 14.50% 10.96% 3.54%9/28/1983 14.25% 10.97% 3.28%9/30/1983 16.15% 10.98% 5.17%9/30/1983 16.25% 10.98% 5.27%
Docket U-16-___ Exhibit RBH-7 Page 7 of 17

[6] [7] [8] [9]Date of
Authorized ROE
Return on Equity
30-Year Treasury
YieldRisk
Premium10/1/1983 16.25% 10.98% 5.27%
10/13/1983 15.52% 11.02% 4.50%10/19/1983 15.20% 11.04% 4.16%10/26/1983 14.75% 11.07% 3.68%10/27/1983 14.88% 11.07% 3.81%10/27/1983 15.33% 11.07% 4.26%11/9/1983 14.82% 11.10% 3.72%11/9/1983 16.51% 11.10% 5.41%11/9/1983 16.51% 11.10% 5.41%12/1/1983 14.50% 11.17% 3.33%12/8/1983 15.90% 11.21% 4.69%12/9/1983 15.30% 11.21% 4.09%
12/12/1983 14.50% 11.22% 3.28%12/12/1983 15.50% 11.22% 4.28%12/20/1983 15.40% 11.26% 4.14%12/20/1983 16.00% 11.26% 4.74%12/22/1983 15.75% 11.27% 4.48%12/29/1983 15.00% 11.30% 3.70%12/30/1983 15.00% 11.30% 3.70%1/10/1984 15.90% 11.34% 4.56%1/13/1984 15.50% 11.37% 4.13%1/18/1984 15.53% 11.39% 4.14%1/26/1984 15.90% 11.42% 4.48%2/14/1984 14.25% 11.52% 2.73%2/28/1984 14.50% 11.59% 2.91%3/20/1984 16.00% 11.70% 4.30%3/23/1984 15.50% 11.73% 3.77%4/9/1984 15.20% 11.81% 3.39%
4/18/1984 16.20% 11.86% 4.34%4/27/1984 15.85% 11.90% 3.95%5/15/1984 13.35% 11.99% 1.36%5/16/1984 15.00% 12.00% 3.00%5/22/1984 14.40% 12.04% 2.36%6/13/1984 15.50% 12.19% 3.31%7/10/1984 16.00% 12.37% 3.63%8/7/1984 16.69% 12.51% 4.18%8/9/1984 15.33% 12.52% 2.81%
8/17/1984 14.82% 12.54% 2.28%8/21/1984 14.64% 12.55% 2.09%8/27/1984 14.52% 12.57% 1.95%8/28/1984 14.75% 12.57% 2.18%8/30/1984 15.60% 12.58% 3.02%9/12/1984 15.60% 12.60% 3.00%9/12/1984 15.90% 12.60% 3.30%9/25/1984 16.25% 12.62% 3.63%10/2/1984 14.80% 12.63% 2.17%10/9/1984 14.75% 12.64% 2.11%
10/10/1984 15.50% 12.64% 2.86%10/18/1984 15.00% 12.65% 2.35%10/24/1984 15.50% 12.65% 2.85%11/7/1984 15.00% 12.64% 2.36%
11/20/1984 15.92% 12.63% 3.29%11/30/1984 15.50% 12.60% 2.90%12/18/1984 15.00% 12.55% 2.45%12/20/1984 15.00% 12.54% 2.46%12/28/1984 15.75% 12.51% 3.24%12/28/1984 16.25% 12.51% 3.74%
1/2/1985 16.00% 12.50% 3.50%1/31/1985 14.75% 12.37% 2.38%2/7/1985 14.85% 12.32% 2.53%
2/15/1985 15.00% 12.26% 2.74%2/20/1985 14.50% 12.24% 2.26%2/22/1985 14.86% 12.24% 2.62%3/14/1985 15.50% 12.15% 3.35%3/28/1985 14.80% 12.08% 2.72%4/9/1985 15.50% 12.01% 3.49%
4/16/1985 15.70% 11.96% 3.74%6/10/1985 15.75% 11.58% 4.17%6/26/1985 14.82% 11.46% 3.36%7/9/1985 15.00% 11.38% 3.62%
7/26/1985 14.50% 11.26% 3.24%8/29/1985 14.50% 11.11% 3.39%8/30/1985 14.38% 11.10% 3.28%9/12/1985 15.25% 11.07% 4.18%9/23/1985 15.30% 11.03% 4.27%9/25/1985 14.50% 11.02% 3.48%9/26/1985 13.80% 11.01% 2.79%9/26/1985 14.50% 11.01% 3.49%
10/25/1985 15.25% 10.91% 4.34%11/8/1985 12.94% 10.85% 2.09%
11/20/1985 14.90% 10.81% 4.09%11/25/1985 13.30% 10.79% 2.51%
Docket U-16-___ Exhibit RBH-7 Page 8 of 17

[6] [7] [8] [9]Date of
Authorized ROE
Return on Equity
30-Year Treasury
YieldRisk
Premium12/6/1985 12.00% 10.71% 1.29%
12/11/1985 14.90% 10.67% 4.23%12/20/1985 14.88% 10.58% 4.30%12/20/1985 15.00% 10.58% 4.42%12/20/1985 15.00% 10.58% 4.42%12/30/1985 15.75% 10.52% 5.23%12/31/1985 14.00% 10.51% 3.49%12/31/1985 14.50% 10.51% 3.99%1/17/1986 14.50% 10.37% 4.13%2/11/1986 12.50% 10.20% 2.30%2/12/1986 15.20% 10.19% 5.01%3/11/1986 14.00% 9.97% 4.03%4/2/1986 12.90% 9.76% 3.14%
4/28/1986 13.01% 9.46% 3.55%5/21/1986 13.25% 9.17% 4.08%5/28/1986 14.00% 9.11% 4.89%5/29/1986 13.90% 9.10% 4.80%6/2/1986 13.00% 9.07% 3.93%
6/11/1986 14.00% 8.96% 5.04%6/13/1986 13.55% 8.93% 4.62%6/27/1986 11.88% 8.76% 3.12%7/14/1986 12.60% 8.57% 4.03%7/30/1986 13.30% 8.37% 4.93%8/14/1986 13.50% 8.21% 5.29%9/5/1986 13.30% 8.01% 5.29%
9/23/1986 12.75% 7.90% 4.85%10/30/1986 13.00% 7.66% 5.34%10/31/1986 13.75% 7.65% 6.10%11/10/1986 14.00% 7.60% 6.40%11/19/1986 13.75% 7.56% 6.19%11/25/1986 13.15% 7.54% 5.61%12/22/1986 13.80% 7.47% 6.33%12/30/1986 13.90% 7.47% 6.43%1/20/1987 12.75% 7.47% 5.28%1/23/1987 13.55% 7.47% 6.08%1/27/1987 12.16% 7.47% 4.69%2/13/1987 12.60% 7.47% 5.13%2/24/1987 12.00% 7.47% 4.53%3/30/1987 12.20% 7.46% 4.74%3/31/1987 13.00% 7.47% 5.53%5/5/1987 12.85% 7.60% 5.25%
5/28/1987 13.50% 7.73% 5.77%6/15/1987 13.20% 7.81% 5.39%6/30/1987 12.60% 7.85% 4.75%7/10/1987 12.90% 7.88% 5.02%7/27/1987 13.50% 7.94% 5.56%8/25/1987 11.40% 8.09% 3.31%9/18/1987 13.00% 8.28% 4.72%
10/20/1987 12.60% 8.55% 4.05%10/20/1987 12.98% 8.55% 4.43%11/12/1987 12.75% 8.68% 4.07%11/13/1987 12.75% 8.69% 4.06%11/24/1987 12.50% 8.74% 3.76%12/8/1987 12.50% 8.82% 3.68%
12/22/1987 12.00% 8.91% 3.09%12/31/1987 12.85% 8.95% 3.90%12/31/1987 13.25% 8.95% 4.30%1/15/1988 13.15% 8.99% 4.16%1/20/1988 12.75% 8.99% 3.76%1/29/1988 13.20% 8.99% 4.21%2/4/1988 12.60% 8.99% 3.61%
3/23/1988 13.00% 8.95% 4.05%5/27/1988 13.18% 9.02% 4.16%6/14/1988 13.50% 9.00% 4.50%6/17/1988 11.72% 8.98% 2.74%6/24/1988 11.50% 8.97% 2.53%7/1/1988 12.75% 8.94% 3.81%7/8/1988 12.00% 8.93% 3.07%
7/18/1988 12.00% 8.90% 3.10%7/20/1988 13.40% 8.89% 4.51%8/8/1988 12.74% 8.90% 3.84%
9/20/1988 12.90% 8.93% 3.97%9/26/1988 12.40% 8.93% 3.47%9/27/1988 13.65% 8.93% 4.72%9/30/1988 13.25% 8.94% 4.31%
10/13/1988 13.10% 8.93% 4.17%10/21/1988 12.80% 8.94% 3.86%10/25/1988 13.25% 8.94% 4.31%10/26/1988 13.50% 8.94% 4.56%10/27/1988 12.95% 8.95% 4.00%10/28/1988 13.00% 8.95% 4.05%11/15/1988 12.00% 8.98% 3.02%
Docket U-16-___ Exhibit RBH-7 Page 9 of 17

[6] [7] [8] [9]Date of
Authorized ROE
Return on Equity
30-Year Treasury
YieldRisk
Premium11/29/1988 12.75% 9.02% 3.73%12/19/1988 13.00% 9.05% 3.95%12/21/1988 12.90% 9.05% 3.85%12/22/1988 13.50% 9.06% 4.44%1/26/1989 12.60% 9.06% 3.54%1/27/1989 13.00% 9.06% 3.94%2/8/1989 13.37% 9.05% 4.32%3/8/1989 13.00% 9.04% 3.96%5/4/1989 13.00% 9.04% 3.96%6/8/1989 13.50% 8.96% 4.54%
7/19/1989 11.80% 8.84% 2.96%7/25/1989 12.80% 8.82% 3.98%7/31/1989 13.00% 8.81% 4.19%8/14/1989 12.50% 8.76% 3.74%8/22/1989 12.80% 8.73% 4.07%8/23/1989 12.90% 8.72% 4.18%9/21/1989 12.10% 8.62% 3.48%10/6/1989 13.00% 8.57% 4.43%
10/17/1989 12.41% 8.54% 3.87%10/18/1989 13.25% 8.54% 4.71%10/20/1989 12.90% 8.53% 4.37%10/31/1989 13.60% 8.49% 5.11%11/3/1989 12.93% 8.48% 4.45%11/5/1989 13.20% 8.48% 4.72%11/9/1989 12.60% 8.45% 4.15%11/9/1989 13.00% 8.45% 4.55%
11/28/1989 12.75% 8.37% 4.38%12/7/1989 13.25% 8.32% 4.93%
12/15/1989 13.00% 8.27% 4.73%12/20/1989 12.90% 8.25% 4.65%12/21/1989 12.80% 8.25% 4.55%12/21/1989 12.90% 8.25% 4.65%12/27/1989 12.50% 8.23% 4.27%
1/9/1990 13.00% 8.19% 4.81%1/18/1990 12.50% 8.16% 4.34%1/26/1990 12.10% 8.14% 3.96%3/21/1990 12.80% 8.15% 4.65%3/28/1990 13.00% 8.16% 4.84%4/5/1990 12.20% 8.17% 4.03%
4/12/1990 13.25% 8.19% 5.06%4/30/1990 12.45% 8.24% 4.21%5/31/1990 12.40% 8.31% 4.09%6/15/1990 13.20% 8.33% 4.87%6/27/1990 12.90% 8.34% 4.56%6/29/1990 13.25% 8.35% 4.90%7/6/1990 12.10% 8.36% 3.74%
7/19/1990 11.70% 8.39% 3.31%8/31/1990 12.50% 8.53% 3.97%8/31/1990 12.50% 8.53% 3.97%9/13/1990 12.50% 8.58% 3.92%9/18/1990 12.75% 8.60% 4.15%9/20/1990 12.50% 8.61% 3.89%10/2/1990 13.00% 8.65% 4.35%
10/17/1990 11.90% 8.68% 3.22%10/31/1990 12.95% 8.70% 4.25%11/9/1990 13.25% 8.71% 4.54%
11/19/1990 13.00% 8.70% 4.30%11/21/1990 12.10% 8.70% 3.40%11/21/1990 12.50% 8.70% 3.80%11/28/1990 12.75% 8.70% 4.05%11/29/1990 12.75% 8.70% 4.05%12/18/1990 13.10% 8.68% 4.42%12/20/1990 12.50% 8.67% 3.83%12/21/1990 12.50% 8.67% 3.83%12/21/1990 13.00% 8.67% 4.33%12/21/1990 13.60% 8.67% 4.93%
1/3/1991 13.02% 8.66% 4.36%1/16/1991 13.25% 8.63% 4.62%1/25/1991 11.70% 8.60% 3.10%2/15/1991 12.70% 8.56% 4.14%2/15/1991 12.80% 8.56% 4.24%4/3/1991 13.00% 8.51% 4.49%
4/30/1991 12.45% 8.47% 3.98%4/30/1991 13.00% 8.47% 4.53%6/25/1991 11.70% 8.34% 3.36%6/28/1991 12.50% 8.33% 4.17%7/1/1991 11.70% 8.33% 3.37%
7/19/1991 12.10% 8.30% 3.80%7/19/1991 12.30% 8.30% 4.00%7/22/1991 12.90% 8.30% 4.60%8/15/1991 12.25% 8.27% 3.98%8/29/1991 13.30% 8.26% 5.04%
Docket U-16-___ Exhibit RBH-7 Page 10 of 17

[6] [7] [8] [9]Date of
Authorized ROE
Return on Equity
30-Year Treasury
YieldRisk
Premium9/27/1991 12.50% 8.23% 4.27%9/30/1991 12.40% 8.23% 4.17%10/3/1991 11.30% 8.22% 3.08%10/9/1991 11.70% 8.21% 3.49%
10/15/1991 13.40% 8.20% 5.20%11/1/1991 12.90% 8.20% 4.70%11/8/1991 12.75% 8.20% 4.55%
11/26/1991 11.60% 8.18% 3.42%11/26/1991 12.00% 8.18% 3.82%11/27/1991 12.70% 8.18% 4.52%12/6/1991 12.70% 8.16% 4.54%
12/10/1991 11.75% 8.15% 3.60%12/19/1991 12.60% 8.14% 4.46%12/19/1991 12.80% 8.14% 4.66%12/30/1991 12.10% 8.11% 3.99%1/22/1992 12.84% 8.05% 4.79%1/31/1992 12.00% 8.03% 3.97%2/20/1992 13.00% 8.00% 5.00%2/27/1992 11.75% 7.98% 3.77%3/18/1992 12.50% 7.94% 4.56%5/15/1992 12.75% 7.86% 4.89%6/24/1992 12.20% 7.85% 4.35%6/29/1992 11.00% 7.85% 3.15%7/14/1992 12.00% 7.83% 4.17%7/22/1992 11.20% 7.82% 3.38%8/10/1992 12.10% 7.79% 4.31%8/26/1992 12.43% 7.75% 4.68%9/30/1992 11.60% 7.72% 3.88%10/6/1992 12.25% 7.72% 4.53%
10/13/1992 12.75% 7.71% 5.04%10/23/1992 11.65% 7.71% 3.94%10/28/1992 12.25% 7.71% 4.54%10/29/1992 12.75% 7.70% 5.05%10/30/1992 11.40% 7.70% 3.70%11/9/1992 10.60% 7.70% 2.90%
11/25/1992 11.00% 7.67% 3.33%11/25/1992 12.00% 7.67% 4.33%12/3/1992 11.85% 7.66% 4.19%
12/16/1992 11.90% 7.63% 4.27%12/22/1992 12.30% 7.62% 4.68%12/22/1992 12.40% 7.62% 4.78%12/30/1992 12.00% 7.61% 4.39%12/31/1992 12.00% 7.60% 4.40%1/12/1993 12.00% 7.58% 4.42%1/12/1993 12.00% 7.58% 4.42%2/2/1993 11.40% 7.53% 3.87%
2/22/1993 11.60% 7.47% 4.13%4/23/1993 11.75% 7.27% 4.48%5/3/1993 11.50% 7.25% 4.25%5/3/1993 11.75% 7.25% 4.50%6/3/1993 12.00% 7.20% 4.80%6/7/1993 11.50% 7.20% 4.30%
6/22/1993 11.75% 7.16% 4.59%7/21/1993 11.78% 7.06% 4.72%7/21/1993 11.90% 7.06% 4.84%7/23/1993 11.50% 7.05% 4.45%7/29/1993 11.50% 7.03% 4.47%8/12/1993 10.75% 6.97% 3.78%8/24/1993 11.50% 6.91% 4.59%8/31/1993 11.90% 6.88% 5.02%9/1/1993 11.25% 6.87% 4.38%9/1/1993 11.47% 6.87% 4.60%
9/27/1993 10.50% 6.74% 3.76%9/29/1993 11.00% 6.72% 4.28%9/30/1993 11.60% 6.71% 4.89%10/8/1993 11.50% 6.67% 4.83%
10/14/1993 11.20% 6.65% 4.55%10/15/1993 11.75% 6.64% 5.11%10/25/1993 11.55% 6.60% 4.95%10/28/1993 11.50% 6.58% 4.92%10/29/1993 10.10% 6.57% 3.53%10/29/1993 10.20% 6.57% 3.63%10/29/1993 11.25% 6.57% 4.68%11/2/1993 10.80% 6.56% 4.24%
11/12/1993 11.80% 6.53% 5.27%11/23/1993 12.50% 6.50% 6.00%11/26/1993 11.00% 6.50% 4.50%12/1/1993 11.45% 6.49% 4.96%
12/16/1993 10.60% 6.45% 4.15%12/16/1993 11.20% 6.45% 4.75%12/21/1993 11.30% 6.44% 4.86%12/22/1993 11.00% 6.44% 4.56%
Docket U-16-___ Exhibit RBH-7 Page 11 of 17

[6] [7] [8] [9]Date of
Authorized ROE
Return on Equity
30-Year Treasury
YieldRisk
Premium12/23/1993 10.10% 6.43% 3.67%
1/5/1994 11.50% 6.41% 5.09%1/10/1994 11.00% 6.40% 4.60%1/25/1994 12.00% 6.37% 5.63%2/2/1994 10.40% 6.35% 4.05%2/9/1994 10.70% 6.33% 4.37%4/6/1994 11.24% 6.34% 4.90%
4/25/1994 11.00% 6.39% 4.61%6/16/1994 10.50% 6.64% 3.86%6/23/1994 10.60% 6.68% 3.92%7/19/1994 10.70% 6.84% 3.86%9/29/1994 10.90% 7.21% 3.69%9/29/1994 11.00% 7.21% 3.79%10/7/1994 11.87% 7.26% 4.61%
10/18/1994 11.50% 7.32% 4.18%10/18/1994 11.50% 7.32% 4.18%10/24/1994 11.00% 7.36% 3.64%11/22/1994 12.12% 7.53% 4.59%11/29/1994 11.30% 7.55% 3.75%12/1/1994 11.00% 7.57% 3.43%12/8/1994 11.50% 7.59% 3.91%12/8/1994 11.70% 7.59% 4.11%
12/12/1994 11.82% 7.60% 4.22%12/14/1994 11.50% 7.61% 3.89%12/19/1994 11.50% 7.62% 3.88%4/19/1995 11.00% 7.72% 3.28%9/11/1995 11.30% 7.16% 4.14%9/15/1995 10.40% 7.13% 3.27%9/29/1995 11.50% 7.06% 4.44%
10/13/1995 10.76% 6.98% 3.78%11/7/1995 12.50% 6.86% 5.64%11/8/1995 11.10% 6.85% 4.25%11/8/1995 11.30% 6.85% 4.45%
11/17/1995 10.90% 6.80% 4.10%11/20/1995 11.40% 6.80% 4.60%11/27/1995 13.60% 6.76% 6.84%12/14/1995 11.30% 6.67% 4.63%12/20/1995 11.60% 6.64% 4.96%1/31/1996 11.30% 6.45% 4.85%3/11/1996 11.60% 6.40% 5.20%4/3/1996 11.13% 6.40% 4.73%
4/15/1996 10.50% 6.40% 4.10%4/17/1996 10.77% 6.40% 4.37%4/26/1996 10.60% 6.40% 4.20%5/10/1996 11.00% 6.40% 4.60%5/13/1996 11.25% 6.40% 4.85%7/3/1996 11.25% 6.49% 4.76%
7/22/1996 11.25% 6.54% 4.71%10/3/1996 10.00% 6.77% 3.23%
10/29/1996 11.30% 6.85% 4.45%11/26/1996 11.30% 6.86% 4.44%11/27/1996 11.30% 6.86% 4.44%11/29/1996 11.00% 6.86% 4.14%12/12/1996 11.96% 6.85% 5.11%12/17/1996 11.50% 6.85% 4.65%1/22/1997 11.30% 6.83% 4.47%1/27/1997 11.25% 6.83% 4.42%1/31/1997 11.25% 6.83% 4.42%2/13/1997 11.00% 6.82% 4.18%2/13/1997 11.80% 6.82% 4.98%2/20/1997 11.80% 6.81% 4.99%3/27/1997 10.75% 6.79% 3.96%4/29/1997 11.70% 6.81% 4.89%7/17/1997 12.00% 6.77% 5.23%
10/29/1997 10.75% 6.70% 4.05%10/31/1997 11.25% 6.70% 4.55%12/24/1997 10.75% 6.53% 4.22%4/28/1998 10.90% 6.10% 4.80%4/30/1998 12.20% 6.10% 6.10%6/30/1998 11.00% 5.94% 5.06%8/26/1998 10.93% 5.82% 5.11%9/3/1998 11.40% 5.80% 5.60%
9/15/1998 11.90% 5.77% 6.13%10/7/1998 11.06% 5.70% 5.36%
10/30/1998 11.40% 5.63% 5.77%12/10/1998 12.20% 5.51% 6.69%12/17/1998 12.10% 5.49% 6.61%2/19/1999 11.15% 5.31% 5.84%3/1/1999 10.65% 5.31% 5.34%3/1/1999 10.65% 5.31% 5.34%6/8/1999 11.25% 5.36% 5.89%
11/12/1999 10.25% 5.92% 4.33%
Docket U-16-___ Exhibit RBH-7 Page 12 of 17

[6] [7] [8] [9]Date of
Authorized ROE
Return on Equity
30-Year Treasury
YieldRisk
Premium12/14/1999 10.50% 6.00% 4.50%1/28/2000 10.71% 6.16% 4.55%2/17/2000 10.60% 6.20% 4.40%5/25/2000 10.80% 6.20% 4.60%6/19/2000 11.05% 6.18% 4.87%6/22/2000 11.25% 6.18% 5.07%7/17/2000 11.06% 6.15% 4.91%7/20/2000 12.20% 6.14% 6.06%8/11/2000 11.00% 6.11% 4.89%9/27/2000 11.25% 6.00% 5.25%9/29/2000 11.16% 5.99% 5.17%10/5/2000 11.30% 5.98% 5.32%
11/28/2000 12.90% 5.87% 7.03%11/30/2000 12.10% 5.86% 6.24%
2/5/2001 11.50% 5.75% 5.75%3/15/2001 11.25% 5.66% 5.59%5/8/2001 10.75% 5.61% 5.14%
10/24/2001 10.30% 5.54% 4.76%10/24/2001 11.00% 5.54% 5.46%
1/9/2002 10.00% 5.50% 4.50%1/30/2002 11.00% 5.47% 5.53%1/31/2002 11.00% 5.47% 5.53%4/17/2002 11.50% 5.44% 6.06%4/29/2002 11.00% 5.44% 5.56%6/11/2002 11.77% 5.47% 6.30%6/20/2002 12.30% 5.48% 6.82%8/28/2002 11.00% 5.49% 5.51%9/11/2002 11.20% 5.45% 5.75%9/12/2002 12.30% 5.45% 6.85%
10/28/2002 11.30% 5.34% 5.96%10/30/2002 10.60% 5.34% 5.26%11/1/2002 12.60% 5.34% 7.26%11/7/2002 11.40% 5.33% 6.07%11/8/2002 10.75% 5.33% 5.42%
11/20/2002 10.00% 5.30% 4.70%11/20/2002 10.50% 5.30% 5.20%12/4/2002 10.75% 5.26% 5.49%
12/30/2002 11.20% 5.18% 6.02%1/6/2003 11.25% 5.16% 6.09%
2/28/2003 12.30% 5.00% 7.30%3/7/2003 9.96% 4.98% 4.98%
3/12/2003 11.40% 4.97% 6.43%3/20/2003 12.00% 4.95% 7.05%4/3/2003 12.00% 4.92% 7.08%5/2/2003 11.40% 4.88% 6.52%
5/15/2003 11.05% 4.87% 6.18%6/26/2003 11.00% 4.80% 6.20%7/1/2003 11.00% 4.80% 6.20%
7/29/2003 11.71% 4.78% 6.93%8/22/2003 10.20% 4.81% 5.39%9/17/2003 9.90% 4.85% 5.05%9/25/2003 10.25% 4.85% 5.40%
10/17/2003 10.54% 4.87% 5.67%10/22/2003 10.46% 4.87% 5.59%10/22/2003 10.71% 4.87% 5.84%10/30/2003 11.00% 4.88% 6.12%10/31/2003 10.20% 4.88% 5.32%10/31/2003 10.75% 4.88% 5.87%11/10/2003 10.60% 4.89% 5.71%12/9/2003 10.50% 4.93% 5.57%
12/18/2003 10.50% 4.94% 5.56%12/19/2003 12.00% 4.94% 7.06%12/19/2003 12.00% 4.94% 7.06%1/13/2004 10.25% 4.95% 5.30%1/13/2004 12.00% 4.95% 7.05%2/9/2004 11.25% 4.99% 6.26%
3/16/2004 10.90% 5.05% 5.85%3/16/2004 10.90% 5.05% 5.85%5/25/2004 10.00% 5.06% 4.94%6/2/2004 11.22% 5.07% 6.15%
6/30/2004 10.50% 5.10% 5.40%7/8/2004 10.00% 5.10% 4.90%
7/22/2004 10.25% 5.10% 5.15%8/26/2004 10.50% 5.10% 5.40%8/26/2004 10.50% 5.10% 5.40%9/9/2004 10.40% 5.10% 5.30%
9/21/2004 10.50% 5.09% 5.41%9/27/2004 10.30% 5.09% 5.21%9/27/2004 10.50% 5.09% 5.41%
10/20/2004 10.20% 5.08% 5.12%11/30/2004 10.60% 5.08% 5.52%12/8/2004 9.90% 5.09% 4.81%
Docket U-16-___ Exhibit RBH-7 Page 13 of 17

[6] [7] [8] [9]Date of
Authorized ROE
Return on Equity
30-Year Treasury
YieldRisk
Premium12/21/2004 11.50% 5.09% 6.41%12/22/2004 11.50% 5.09% 6.41%12/28/2004 10.25% 5.09% 5.16%2/18/2005 10.30% 4.95% 5.35%3/29/2005 11.00% 4.86% 6.14%4/13/2005 10.60% 4.83% 5.77%4/28/2005 11.00% 4.80% 6.20%5/17/2005 10.00% 4.76% 5.24%6/8/2005 10.18% 4.71% 5.47%
6/10/2005 10.90% 4.71% 6.19%7/6/2005 10.50% 4.65% 5.85%
7/19/2005 11.50% 4.63% 6.87%8/11/2005 10.40% 4.60% 5.80%9/19/2005 9.45% 4.53% 4.92%9/30/2005 10.51% 4.52% 5.99%10/4/2005 9.90% 4.52% 5.38%10/4/2005 10.75% 4.52% 6.23%
10/14/2005 10.40% 4.51% 5.89%10/31/2005 10.25% 4.53% 5.72%11/2/2005 9.70% 4.53% 5.17%
11/30/2005 10.00% 4.53% 5.47%12/9/2005 9.70% 4.53% 5.17%
12/12/2005 11.00% 4.53% 6.47%12/20/2005 10.13% 4.52% 5.61%12/21/2005 10.40% 4.52% 5.88%12/21/2005 11.00% 4.52% 6.48%12/22/2005 10.20% 4.52% 5.68%12/22/2005 11.00% 4.52% 6.48%12/28/2005 10.00% 4.52% 5.48%
1/5/2006 11.00% 4.52% 6.48%1/25/2006 11.20% 4.52% 6.68%1/25/2006 11.20% 4.52% 6.68%2/3/2006 10.50% 4.52% 5.98%
2/15/2006 9.50% 4.53% 4.97%4/26/2006 10.60% 4.65% 5.95%7/24/2006 9.60% 4.87% 4.73%7/24/2006 10.00% 4.87% 5.13%9/20/2006 11.00% 4.93% 6.07%9/26/2006 10.75% 4.94% 5.81%
10/20/2006 9.80% 4.96% 4.84%11/2/2006 9.71% 4.97% 4.74%11/9/2006 10.00% 4.98% 5.02%
11/21/2006 11.00% 4.98% 6.02%12/5/2006 10.20% 4.97% 5.23%1/5/2007 10.40% 4.95% 5.45%1/9/2007 11.00% 4.94% 6.06%
1/11/2007 10.90% 4.94% 5.96%1/19/2007 10.80% 4.93% 5.87%1/26/2007 10.00% 4.92% 5.08%2/8/2007 10.40% 4.91% 5.49%
3/14/2007 10.10% 4.85% 5.25%3/20/2007 10.25% 4.84% 5.41%3/21/2007 11.35% 4.84% 6.51%3/22/2007 10.50% 4.84% 5.66%3/29/2007 10.00% 4.83% 5.17%6/13/2007 10.75% 4.82% 5.93%6/29/2007 9.53% 4.84% 4.69%6/29/2007 10.10% 4.84% 5.26%7/3/2007 10.25% 4.85% 5.40%
7/13/2007 9.50% 4.86% 4.64%7/24/2007 10.40% 4.87% 5.53%8/1/2007 10.15% 4.88% 5.27%
8/29/2007 10.50% 4.91% 5.59%9/10/2007 9.71% 4.92% 4.79%9/19/2007 10.00% 4.91% 5.09%9/25/2007 9.70% 4.92% 4.78%10/8/2007 10.48% 4.92% 5.56%
10/19/2007 10.50% 4.91% 5.59%10/25/2007 9.65% 4.91% 4.74%11/15/2007 10.00% 4.89% 5.11%11/20/2007 9.90% 4.89% 5.01%11/27/2007 10.00% 4.89% 5.11%11/29/2007 10.90% 4.88% 6.02%12/14/2007 10.80% 4.87% 5.93%12/18/2007 10.40% 4.86% 5.54%12/19/2007 9.80% 4.86% 4.94%12/19/2007 9.80% 4.86% 4.94%12/19/2007 10.20% 4.86% 5.34%12/21/2007 9.10% 4.86% 4.24%
1/8/2008 10.75% 4.83% 5.92%1/17/2008 10.75% 4.81% 5.94%1/17/2008 10.75% 4.81% 5.94%
Docket U-16-___ Exhibit RBH-7 Page 14 of 17

[6] [7] [8] [9]Date of
Authorized ROE
Return on Equity
30-Year Treasury
YieldRisk
Premium2/5/2008 9.99% 4.77% 5.22%2/5/2008 10.19% 4.77% 5.42%
2/13/2008 10.20% 4.76% 5.44%3/31/2008 10.00% 4.63% 5.37%5/28/2008 10.50% 4.53% 5.97%6/24/2008 10.00% 4.52% 5.48%6/27/2008 10.00% 4.52% 5.48%7/31/2008 10.70% 4.50% 6.20%7/31/2008 10.82% 4.50% 6.32%8/27/2008 10.25% 4.50% 5.75%9/2/2008 10.25% 4.50% 5.75%
9/19/2008 10.70% 4.48% 6.22%9/24/2008 10.68% 4.48% 6.20%9/24/2008 10.68% 4.48% 6.20%9/24/2008 10.68% 4.48% 6.20%9/30/2008 10.20% 4.48% 5.72%10/3/2008 10.30% 4.48% 5.82%10/8/2008 10.15% 4.47% 5.68%
10/20/2008 10.06% 4.47% 5.59%10/24/2008 10.60% 4.46% 6.14%10/24/2008 10.60% 4.46% 6.14%11/21/2008 10.50% 4.42% 6.08%11/21/2008 10.50% 4.42% 6.08%11/21/2008 10.50% 4.42% 6.08%11/24/2008 10.50% 4.41% 6.09%12/3/2008 10.39% 4.38% 6.01%
12/24/2008 10.00% 4.26% 5.74%12/26/2008 10.10% 4.24% 5.86%12/29/2008 10.20% 4.23% 5.97%1/13/2009 10.45% 4.14% 6.31%2/2/2009 10.05% 4.03% 6.02%3/9/2009 10.30% 3.89% 6.41%
3/25/2009 10.17% 3.83% 6.34%4/2/2009 10.75% 3.80% 6.95%5/5/2009 10.75% 3.71% 7.04%
5/15/2009 10.20% 3.70% 6.50%5/29/2009 9.54% 3.70% 5.84%6/3/2009 10.10% 3.70% 6.40%
6/22/2009 10.00% 3.73% 6.27%6/29/2009 10.21% 3.73% 6.48%6/30/2009 9.31% 3.74% 5.57%7/17/2009 9.26% 3.75% 5.51%7/17/2009 10.50% 3.75% 6.75%
10/16/2009 10.40% 4.09% 6.31%10/26/2009 10.10% 4.11% 5.99%10/28/2009 10.15% 4.12% 6.03%10/28/2009 10.15% 4.12% 6.03%10/30/2009 9.95% 4.13% 5.82%11/20/2009 9.45% 4.19% 5.26%12/14/2009 10.50% 4.25% 6.25%12/16/2009 10.75% 4.26% 6.49%12/17/2009 10.30% 4.26% 6.04%12/18/2009 10.40% 4.27% 6.13%12/18/2009 10.40% 4.27% 6.13%12/18/2009 10.50% 4.27% 6.23%12/22/2009 10.20% 4.28% 5.92%12/22/2009 10.40% 4.28% 6.12%12/28/2009 10.85% 4.30% 6.55%12/29/2009 10.38% 4.30% 6.08%1/11/2010 10.24% 4.34% 5.90%1/21/2010 10.23% 4.37% 5.86%1/21/2010 10.33% 4.37% 5.96%1/26/2010 10.40% 4.37% 6.03%2/10/2010 10.00% 4.39% 5.61%2/23/2010 10.50% 4.40% 6.10%3/9/2010 9.60% 4.40% 5.20%
3/24/2010 10.13% 4.42% 5.71%3/31/2010 10.70% 4.43% 6.27%4/1/2010 9.50% 4.43% 5.07%4/2/2010 10.10% 4.44% 5.66%4/8/2010 10.35% 4.44% 5.91%
4/29/2010 9.19% 4.46% 4.73%4/29/2010 9.40% 4.46% 4.94%4/29/2010 9.40% 4.46% 4.94%5/17/2010 10.55% 4.46% 6.09%5/24/2010 10.05% 4.46% 5.59%6/3/2010 11.00% 4.46% 6.54%
6/16/2010 10.00% 4.46% 5.54%6/18/2010 10.30% 4.46% 5.84%8/9/2010 12.55% 4.41% 8.14%
8/17/2010 10.10% 4.40% 5.70%9/16/2010 9.60% 4.31% 5.29%
Docket U-16-___ Exhibit RBH-7 Page 15 of 17

[6] [7] [8] [9]Date of
Authorized ROE
Return on Equity
30-Year Treasury
YieldRisk
Premium9/16/2010 10.00% 4.31% 5.69%9/16/2010 10.00% 4.31% 5.69%9/16/2010 10.30% 4.31% 5.99%
10/21/2010 10.40% 4.20% 6.20%11/2/2010 9.75% 4.17% 5.58%11/2/2010 9.75% 4.17% 5.58%11/3/2010 10.75% 4.17% 6.58%
11/19/2010 10.20% 4.14% 6.06%12/1/2010 10.00% 4.12% 5.88%12/6/2010 9.56% 4.12% 5.44%12/6/2010 10.09% 4.12% 5.97%12/9/2010 10.25% 4.12% 6.13%
12/14/2010 10.33% 4.11% 6.22%12/17/2010 10.10% 4.11% 5.99%12/20/2010 10.10% 4.11% 5.99%12/23/2010 9.92% 4.10% 5.82%
1/6/2011 10.35% 4.09% 6.26%1/12/2011 10.30% 4.08% 6.22%1/13/2011 10.30% 4.08% 6.22%3/10/2011 10.10% 4.16% 5.94%3/31/2011 9.45% 4.20% 5.25%4/18/2011 10.05% 4.24% 5.81%5/26/2011 10.50% 4.32% 6.18%6/21/2011 10.00% 4.36% 5.64%6/29/2011 8.83% 4.38% 4.45%8/1/2011 9.20% 4.41% 4.79%9/1/2011 10.10% 4.32% 5.78%
11/14/2011 9.60% 3.93% 5.67%12/13/2011 9.50% 3.76% 5.74%12/20/2011 10.00% 3.71% 6.29%12/22/2011 10.40% 3.70% 6.70%1/10/2012 9.06% 3.59% 5.47%1/10/2012 9.45% 3.59% 5.86%1/10/2012 9.45% 3.59% 5.86%1/23/2012 10.20% 3.52% 6.68%1/31/2012 10.00% 3.48% 6.52%4/24/2012 9.50% 3.15% 6.35%4/24/2012 9.75% 3.15% 6.60%5/7/2012 9.80% 3.13% 6.67%
5/22/2012 9.60% 3.10% 6.50%5/24/2012 9.70% 3.09% 6.61%6/7/2012 10.30% 3.06% 7.24%
6/15/2012 10.40% 3.05% 7.35%6/18/2012 9.60% 3.05% 6.55%7/2/2012 9.75% 3.04% 6.71%
10/24/2012 10.30% 2.92% 7.38%10/26/2012 9.50% 2.92% 6.58%10/31/2012 9.30% 2.91% 6.39%10/31/2012 9.90% 2.91% 6.99%10/31/2012 10.00% 2.91% 7.09%11/1/2012 9.45% 2.91% 6.54%11/8/2012 10.10% 2.91% 7.19%11/9/2012 10.30% 2.90% 7.40%
11/26/2012 10.00% 2.88% 7.12%11/28/2012 10.40% 2.88% 7.52%11/28/2012 10.50% 2.88% 7.62%12/4/2012 10.00% 2.87% 7.13%12/4/2012 10.50% 2.87% 7.63%
12/20/2012 9.50% 2.84% 6.66%12/20/2012 10.10% 2.84% 7.26%
Docket U-16-___ Exhibit RBH-7 Page 16 of 17

[6] [7] [8] [9]Date of
Authorized ROE
Return on Equity
30-Year Treasury
YieldRisk
Premium12/20/2012 10.25% 2.84% 7.41%12/20/2012 10.30% 2.84% 7.46%12/20/2012 10.40% 2.84% 7.56%12/20/2012 10.50% 2.84% 7.66%12/26/2012 9.80% 2.83% 6.97%2/22/2013 9.60% 2.86% 6.74%3/14/2013 9.30% 2.89% 6.41%3/27/2013 9.80% 2.92% 6.88%4/23/2013 9.80% 2.96% 6.84%5/10/2013 9.25% 2.96% 6.29%6/13/2013 9.40% 3.02% 6.38%6/18/2013 9.28% 3.02% 6.26%6/18/2013 9.28% 3.02% 6.26%6/25/2013 9.80% 3.04% 6.76%9/23/2013 9.60% 3.33% 6.27%11/6/2013 10.20% 3.42% 6.78%
11/13/2013 9.84% 3.44% 6.40%11/14/2013 10.25% 3.45% 6.80%11/22/2013 9.50% 3.47% 6.03%12/5/2013 10.20% 3.50% 6.70%
12/13/2013 9.60% 3.52% 6.08%12/16/2013 9.73% 3.53% 6.20%12/17/2013 10.00% 3.53% 6.47%12/18/2013 9.08% 3.54% 5.54%12/23/2013 9.72% 3.55% 6.17%12/30/2013 10.00% 3.58% 6.42%1/21/2014 9.65% 3.66% 5.99%1/22/2014 9.18% 3.66% 5.52%2/20/2014 9.30% 3.72% 5.58%2/21/2014 9.85% 3.72% 6.13%2/28/2014 9.55% 3.73% 5.82%3/16/2014 9.72% 3.74% 5.98%4/21/2014 9.50% 3.73% 5.77%4/22/2014 9.80% 3.73% 6.07%5/8/2014 9.10% 3.71% 5.39%5/8/2014 9.59% 3.71% 5.88%6/6/2014 10.40% 3.66% 6.74%
6/12/2014 10.10% 3.66% 6.44%6/12/2014 10.10% 3.66% 6.44%6/12/2014 10.10% 3.66% 6.44%7/7/2014 9.30% 3.63% 5.67%
7/25/2014 9.30% 3.60% 5.70%7/31/2014 9.90% 3.59% 6.31%9/4/2014 9.10% 3.50% 5.60%
9/24/2014 9.35% 3.46% 5.89%9/30/2014 9.75% 3.44% 6.31%
10/29/2014 10.80% 3.37% 7.43%11/6/2014 10.20% 3.35% 6.85%
11/14/2014 10.20% 3.33% 6.87%11/14/2014 10.30% 3.33% 6.97%11/26/2014 10.20% 3.30% 6.90%12/3/2014 10.00% 3.28% 6.72%1/13/2015 10.30% 3.16% 7.14%1/21/2015 9.05% 3.13% 5.92%1/21/2015 9.05% 3.13% 5.92%4/9/2015 9.50% 2.88% 6.62%
5/11/2015 9.80% 2.81% 6.99%6/17/2015 9.00% 2.79% 6.21%8/21/2015 9.75% 2.78% 6.97%10/7/2015 9.55% 2.82% 6.73%
10/13/2015 9.75% 2.83% 6.92%10/15/2015 9.00% 2.84% 6.16%10/30/2015 9.80% 2.87% 6.93%11/19/2015 10.00% 2.90% 7.10%12/3/2015 10.00% 2.91% 7.09%12/9/2015 9.60% 2.92% 6.68%
12/11/2015 9.90% 2.93% 6.97%12/18/2015 9.50% 2.94% 6.56%
1/6/2016 9.50% 2.97% 6.53%1/6/2016 9.50% 2.97% 6.53%
1/28/2016 9.40% 2.97% 6.43%2/10/2016 9.60% 2.95% 6.65%2/16/2016 9.50% 2.94% 6.56%2/29/2016 9.40% 2.92% 6.48%4/29/2016 9.80% 2.83% 6.97%
Average 4.53%Count 1034
Docket U-16-___ Exhibit RBH-7 Page 17 of 17

Small Size Premium
[1]($Bil)
ENSTAR Natural Gas Company $0.148Median Market to Book for Comp Group 1.86ENSTAR Implied Market Cap $0.276
[2] [3]
Company Name Ticker Market Cap
($Bil) Market to Book
Ratio Atmos Energy Corporation ATO $7.45 2.28Boardwalk Pipeline Partners, LP BWP $3.76 0.87Dominion Midstream Partners, LP DM $2.52 1.18EnLink Midstream Partners, LP ENLK $4.17 0.94EQT Midstream Partners, LP EQM $5.84 3.63Kinder Morgan Inc. KMI $40.24 1.18New Jersey Resources Corporation NJR $3.07 2.68Northwest Natural Gas Company NWN $1.43 1.83South Jersey Industries, Inc. SJI $1.98 1.90Southwest Gas Corporation SWX $3.07 1.92Spectra Energy Partners, LP SEP $14.03 1.30Spire Inc SR $2.88 1.80TC Pipelines, LP TCP $3.32 2.96WGL Holdings, Inc. WGL $3.46 2.68Median $3.39 1.86Mean $6.94 1.94
Market Capitalization ($Mil) [4]
Decile Low High Size Premium 2 10,170.746$ 24,272.837$ 0.65%3 5,864.266$ 10,105.622$ 0.94%4 3,724.624$ 5,844.592$ 1.05%5 2,552.441$ 3,724.186$ 1.65%6 1,688.895$ 2,542.913$ 1.63%7 1,011.278$ 1,686.860$ 1.77%8 549.056$ 1,010.634$ 2.18%9 300.752$ 548.839$ 2.64%
10 3.037$ 300.725$ 5.72%
Proxy Group Median 3,385$ 1.65%10th Decile Size Premium 276$ 5.72%Difference from Proxy Group Median 4.07% [5]
Notes:[1] Company provided data[2] Source: Bloomberg, 30-day average[3] Source: Bloomberg, 30-day average[4] Source: Ibbotson Associates, 2015 Ibbotson SBBI Market Report[5] Equals 5.72% - 1.65%
Docket U-16-___ Exhibit RBH-8 Page 1 of 1

Company Parent State
Fuel Adjustment
ClauseConservation
ExpenseDecoupling
(Full)Decoupling
(Partial)Environmental
ComplianceNew Capital Investment Other
Formula-Based Rates
Price Freeze/Cap
Earnings Sharing
Formula-Based ROE
Rate Base Additions
Service Quality/
Management Performance
Merger Savings
Enstar Natural Gas -- Alaska
Alabama Gas SR Alabama Mobile Gas SRE Alabama Southwest Gas SWX Arizona UNS Gas UNS Arizona Arkansas Oklahoma Gas -- Arkansas CenterPoint Energy Resources CNP Arkansas SourceGas Arkansas -- Arkansas Pacific Gas & Electric PCG California San Diego Gas & Electric SRE California Southern California Gas SRE California Southwest Gas SWX California Public Service Co. of Colorado XEL Colorado SourceGas Distribution -- Colorado Conn. Natural Gas UIL Connecticut Southern Conn. Gas UIL Connecticut Yankee Gas Service ES Connecticut Chesapeake Utilities CPK Delaware Delmarva Power & Light EXC Delaware Washington Gas Light WGL District of Columbia Florida Public Utilities CPK Florida Peoples Gas System TE Florida Pivotal Utility Holdings GAS Florida Atlanta Gas Light GAS Georgia Liberty Energy (Georgia) -- Georgia Avista Corp. AVA Idaho Ameren Illinois AEE Illinois Mid-American Energy BRK.A Illinois North Shore Gas WEC Illinois Northern Illinois Gas GAS Illinois Peoples Gas Light & Coke WEC Illinois Indiana Gas VVC Indiana Northern Indiana Public Service NI Indiana Southern Indiana Gas & Electric VVC Indiana Black Hills Iowa Gas Utility BKH Iowa Interstate Power & Light LNT Iowa MidAmerican Energy BRK.A Iowa Atmos Energy ATO Kansas Black Hills/Kansas Gas Utility BKH Kansas Kansas Gas Service OGS Kansas n/a n/a n/a n/a n/a n/a n/aAtmos Energy ATO Kentucky Columbia Gas of Kentucky NI Kentucky Delta Natural Gas DGAS Kentucky Duke Energy Kentucky DUK Kentucky Louisville Gas & Electric PPL Kentucky Entergy New Orleans ETR Louisiana Atmos Energy ATO Louisiana CenterPoint Energy Resources CNP Louisiana Entergy Gulf States Louisiana ETR Louisiana Maine Natural Gas -- Maine n/a n/a n/a n/a n/a n/a n/aNorthern Utilities UTL Maine Baltimore Gas & Electric EXC Maryland Columbia Gas of Maryland NI Maryland Washington Gas Light WGL Maryland Bay State Gas NI Massachusetts Berkshire Gas UIL Massachusetts Boston Gas/ Colonial Gas -- Massachusetts Fitchburg Gas & Electric UTL Massachusetts Liberty Utilities (New England Gas) -- Massachusetts NSTAR Gas ES Massachusetts Consumers Energy CMS Michigan DTE Gas DTE Michigan Michigan Gas Utilities TEG Michigan SEMCO Energy Gas -- Michigan CenterPoint Energy Resources CNP Minnesota Minnesota Energy Resources WEC Minnesota Northern States Power-Minnesota XEL Minnesota Atmos Energy ATO Mississippi Empire District Gas EDE Missouri Laclede Gas SR Missouri Liberty Energy (Midstates) -- Missouri Missouri Gas Energy SR Missouri Union Electric AEE Missouri MDU Resources MDU Montana Northwestern Energy NWE Montana Black Hills Nebraska Gas BKH Nebraska Northwestern Energy NWE Nebraska SourceGas Distribution -- Nebraska Sierra Pacific Power BRK.A Nevada
Summary of Revenue Stabilization Mechanisms Summary of Revenue Stabilization MechanismsAdjustment Clauses Alternative Regulation / Incentive Plans
Docket U-16-___ Exhibit RBH-9 Page 1 of 2

Company Parent State
Fuel Adjustment
ClauseConservation
ExpenseDecoupling
(Full)Decoupling
(Partial)Environmental
ComplianceNew Capital Investment Other
Formula-Based Rates
Price Freeze/Cap
Earnings Sharing
Formula-Based ROE
Rate Base Additions
Service Quality/
Management Performance
Merger Savings
Summary of Revenue Stabilization Mechanisms Summary of Revenue Stabilization MechanismsAdjustment Clauses Alternative Regulation / Incentive Plans
Southwest Gas SWX Nevada EnergyNorth Natural Gas -- New Hampshire Northern Utilities UTL New Hampshire New Jersey Natural Gas NJR New Jersey Pivotal Utility Holdings GAS New Jersey Public Service Electric & Gas PEG New Jersey South Jersey Gas SJI New Jersey New Mexico Gas TE New Mexico Brooklyn Union Gas -- New York Central Hudson Gas & Electric -- New York Consolidated Edison of New York ED New York KeySpan Gas East -- New York National Fuel Gas Distribution NFG New York New York State Electric & Gas -- New York Niagara Mohawk Power -- New York Orange & Rockland Utilities ED New York Rochester Gas & Electric -- New York Piedmont Natural Gas PNY North Carolina Public Service Co. of North Carolina SCG North Carolina MDU Resources MDU North Dakota Northern States Power-Minnesota XEL North Dakota Columbia Gas NI Ohio Duke Energy Ohio DUK Ohio East Ohio Gas D Ohio Vectren Energy Delivery of Ohio VVC Ohio CenterPoint Energy Resources CNP Oklahoma Oklahoma Natural Gas OGS Oklahoma Avista Corp. AVA Oregon Cascade Natural Gas MDU Oregon Northwest Natural Gas NWN Oregon Columbia Gas of Pennsylvania NI Pennsylvania Equitable Gas -- Pennsylvania National Fuel Gas Distribution NFG Pennsylvania PECO Energy EXC Pennsylvania Peoples Natural Gas -- Pennsylvania UGI Central Penn Gas UGI Pennsylvania UGI Penn Natural Gas UGI Pennsylvania UGI Utilities UGI Pennsylvania Narragansett Electric -- Rhode Island Piedmont Natural Gas PNY South Carolina South Carolina Electric & Gas SCG South Carolina Atmos Energy ATO Tennessee Chattanooga Gas GAS Tennessee Piedmont Natural Gas PNY Tennessee Atmos Energy ATO Texas CenterPoint Energy Resources CNP Texas Texas Gas Service OGS Texas Questar STR Utah Vermont Gas Systems -- Vermont Columbia Gas of Virginia NI Virginia Virginia Natural Gas GAS Virginia Washington Gas Light WGL Virginia Avista Corp. AVA Washington Cascade Natural Gas MDU Washington Northwest Natural Gas NWN Washington Puget Sound Energy -- Washington Hope Gas D West Virginia Mountaineer Gas -- West Virginia Madison Gas & Electric MGEE Wisconsin Northern States Power-Wisconsin XEL Wisconsin Wisconsin Electric Power WEC Wisconsin Wisconsin Gas WEC Wisconsin Wisconsin Power & Light LNT Wisconsin Wisconsin Public Service WEC Wisconsin Cheyenne Light Fuel & Power BKH Wyoming SourceGas Distribution -- Wyoming
Source: Regulatory Research Associates, Regulatory Focus "Adjustment Clauses A State-by-State Overview," October 2, 2015.
Source: Regulatory Research Associates, Regulatory Focus "Alternative Regulation/Incentive Plans A State-by-State Overview," November 19, 2013.
Docket U-16-___ Exhibit RBH-9 Page 2 of 2

Flotation Cost Adjustment
Two most recent open market common stock issuances per company, if available
Company DateSharesIssued
OfferingPrice
Underwriting Discount
OfferingExpense
NetProceeds Per
ShareTotal Flotation
Costs
Gross Equity Issue Before
Costs Net Proceeds
Flotation Cost
Percentage
AltaGas Ltd. 9/23/2015 10,074,000 $25.78 $1.0212 $372,717 $24.76 $10,660,729 $259,678,304 $249,017,575 4.105%AltaGas Ltd. 8/21/2014 9,027,500 $46.59 $1.9986 $489,859 $44.59 $18,532,437 $420,612,530 $402,080,093 4.406%
Atmos Energy Corporation 2/11/2014 9,200,000 $44.00 $1.5400 $350,000 $42.46 $14,518,000 $404,800,000 $390,282,000 3.586%Atmos Energy Corporation 12/7/2006 6,325,000 $31.50 $1.1025 $400,000 $30.40 $7,373,313 $199,237,500 $191,864,188 3.701%Boardwalk Pipeline Partners, LP 5/31/2013 12,650,000 $30.12 $0.9500 $275,000 $29.17 $12,292,500 $381,018,000 $368,725,500 3.226%Boardwalk Pipeline Partners, LP 10/5/2012 11,500,000 $26.99 $0.9100 $250,000 $26.08 $10,715,000 $310,385,000 $299,670,000 3.452%Dominion Midstream Partners, LP 10/15/2014 20,125,000 $21.00 $1.2600 $2,900,000 $19.74 $28,257,500 $422,625,000 $394,367,500 6.686%EnLink Midstream Partners, LP 3/25/2015 26,220,000 $25.71 $0.7700 $400,000 $24.94 $20,589,400 $674,116,200 $653,526,800 3.054%EnLink Midstream Partners, LP 11/17/2014 12,075,000 $28.37 $0.8500 $300,000 $27.52 $10,563,750 $342,567,750 $332,004,000 3.084%EQT Midstream Partners, LP 11/12/2015 6,497,500 $75.76 $4.9000 $500,000 $70.86 $32,337,750 $492,250,600 $459,912,850 6.569%EQT Midstream Partners, LP 3/23/2015 9,487,500 $76.00 $2.4700 $1,200,000 $73.53 $24,634,125 $721,050,000 $696,415,875 3.416%Kinder Morgan Inc. 10/16/2012 69,296,921 $34.15 $0.2500 $500,000 $33.90 $17,824,230 $2,366,489,852 $2,348,665,622 0.753%Kinder Morgan Inc. 8/14/2012 66,700,000 $34.75 $0.2400 $500,000 $34.51 $16,508,000 $2,317,825,000 $2,301,317,000 0.712%Northwest Natural Gas Company 3/30/2004 1,290,000 $31.00 $1.0100 $175,000 $29.99 $1,477,900 $39,990,000 $38,512,100 3.696%Spectra Energy Partners, L.P. 4/3/2013 5,175,000 $37.25 $0.6000 $350,000 $36.65 $3,455,000 $192,768,750 $189,313,750 1.792%Spectra Energy Partners, L.P. 11/15/2012 5,462,500 $27.60 $1.0000 $350,000 $26.54 $5,812,500 $150,765,000 $144,952,500 3.855%Spire Inc 6/5/2014 10,350,000 $46.25 $1.7113 $1,000,000 $44.44 $18,711,438 $478,687,500 $459,976,063 3.909%Spire Inc 5/22/2013 10,005,000 $44.50 $1.7244 $1,000,000 $42.68 $18,252,372 $445,222,500 $426,970,128 4.100%TC Pipelines, L.P. 5/17/2013 8,855,000 $43.85 $1.6882 $2,000,000 $41.94 $16,949,277 $388,291,750 $371,342,473 4.365%TC Pipelines, L.P. 4/29/2011 7,245,000 $47.58 $1.9100 $500,000 $45.60 $14,337,950 $344,717,100 $330,379,150 4.159%WGL Holdings, Inc. 6/20/2001 2,058,500 $26.73 $0.8950 $56,218 $25.81 $1,898,576 $55,023,705 $53,125,130 3.450%
Mean $14,557,226 $543,243,907WEIGHTED AVERAGE FLOTATION COSTS: 2.680%
[1] [2] [3] [4] [5] [6] [7] [8] [9] [10] [11]Average Expected Dividend Yield Zacks First Call Value Line Average Flotation
Annualized Stock Dividend Adjusted for Earnings Earnings Earnings Earnings AdjustedCompany Ticker Dividend Price Yield Current Flot. Costs Growth Growth Growth Growth DCF k(e) DCF k(e)
Atmos Energy Corporation ATO $1.68 $72.93 2.30% 2.38% 2.44% 6.60% 6.40% 6.00% 6.33% 8.71% 8.78%Boardwalk Pipeline Partners, LP BWP $0.40 $15.01 2.67% 2.79% 2.86% NA 8.14% 10.00% 9.07% 11.86% 11.93%Dominion Midstream Partners, LP DM $0.90 $32.44 2.77% 3.07% 3.15% 20.30% 23.00% NA 21.65% 24.72% 24.80%EnLink Midstream Partners, LP ENLK $1.56 $12.55 12.43% 12.81% 13.16% 6.00% 6.00% NA 6.00% 18.81% 19.16%EQT Midstream Partners, LP EQM $2.98 $73.96 4.03% 4.24% 4.35% 16.00% 4.47% NA 10.24% 14.47% 14.59%Kinder Morgan Inc. KMI $0.50 $18.03 2.77% 2.92% 3.00% NA 8.84% 13.00% 10.92% 13.84% 13.92%New Jersey Resources Corporation NJR $0.96 $35.79 2.68% 2.75% 2.82% 6.50% 6.50% 1.50% 4.83% 7.58% 7.66%Northwest Natural Gas Company NWN $1.87 $51.99 3.60% 3.68% 3.78% 4.00% 4.00% 5.00% 4.33% 8.01% 8.11%South Jersey Industries, Inc. SJI $1.06 $27.81 3.79% 3.90% 4.01% 6.00% 6.00% 5.50% 5.83% 9.74% 9.85%Southwest Gas Corporation SWX $1.80 $64.77 2.78% 2.85% 2.93% 5.00% 4.00% 7.00% 5.33% 8.19% 8.27%Spectra Energy Partners, LP SEP $2.56 $48.23 5.30% 5.44% 5.59% 5.30% 5.61% NA 5.46% 10.90% 11.05%Spire Inc SR $1.96 $66.20 2.96% 3.05% 3.14% 4.80% 4.70% 9.00% 6.17% 9.22% 9.30%TC Pipelines, LP TCP $3.56 $51.55 6.91% 7.11% 7.30% 6.00% 5.70% NA 5.85% 12.96% 13.15%WGL Holdings, Inc. WGL $1.95 $69.31 2.81% 2.91% 2.99% 7.30% 8.00% 5.00% 6.77% 9.68% 9.76%
PROXY GROUP MEAN 4.13% 4.28% 4.40% 12.05% 12.17%
DCF Result Adjusted For Flotation Costs: 12.17%DCF Result Unadjusted For Flotation Costs: 12.05%
Difference (Flotation Cost Adjustment): 0.12% [12]Notes:
[1] Source: Bloomberg Professional[2] Source: Bloomberg Professional[3] Equals [1] / [2][4] Equals [3] x (1 + 0.5 x [9])[5] Equals [4] / (1 - 0.0268)[6] Source: Zacks[7] Source: Yahoo! Finance[8] Source: Value Line[9] Equals Average([6], [7], [8])[10] Equals [4] + [9][11] Equals [5] + [9][12] Equals average [11] - average [10]
Constant Growth Discounted Cash Flow Model Adjusted for Flotation Costs - 30 Day Average Stock Price
The proxy group DCF result is adjusted for flotation costs by dividing each company's expected dividend yield by (1 - flotation cost). The flotation cost adjustment is derived as the difference between the unadjusted DCF result and the DCF result adjusted for flotation costs.Stock issuances for AltaGas Ltd. were provided in Canadian Dollars, and converted to US Dollars by SNL Financial.Overallotment reflects shares exercised.
Docket U-16-___ Exhibit RBH-10 Page 1 of 1

Company Ticker 2015Q4 2015Q3 2015Q2 2015Q1 2014Q4 2014Q3 2014Q2 2014Q1 Average
Atmos Energy Corporation ATO 57.13% 56.54% 56.88% 56.12% 55.52% 55.68% 55.93% 55.99% 56.22%Boardwalk Pipeline Partners, LP BWP 55.08% 54.90% 54.58% 53.95% 52.24% 54.07% 54.49% 54.12% 54.18%Dominion Midstream Partners, LP DM NA NA NA NA NA NA NA NA NAEnLink Midstream Partners, LP ENLK 57.50% 63.45% 67.25% 70.73% 74.04% 71.55% 73.54% 73.01% 68.88%EQT Midstream Partners, LP EQM 70.33% 63.26% 61.53% 60.79% 61.75% 51.87% 82.81% 84.85% 67.15%Kinder Morgan Inc. KMI 44.83% 44.31% 44.12% 43.63% 44.32% 24.85% 25.36% 25.59% 37.13%New Jersey Resources Corporation NJR 57.11% 56.43% 55.97% 61.02% 59.92% 60.43% 61.42% 61.52% 59.23%Northwest Natural Gas Company NWN 56.45% 54.98% 55.55% 54.26% 53.64% 53.20% 51.65% 51.24% 53.87%South Jersey Industries, Inc. SJI 50.04% 48.26% 50.64% 49.04% 48.02% 46.12% 49.47% 54.19% 49.47%Southwest Gas Corporation SWX 50.37% 49.84% 50.16% 50.47% 47.42% 50.09% 51.36% 51.62% 50.17%Spectra Energy Partners, LP SEP 63.10% 64.00% 63.56% 63.03% 66.91% 66.17% 65.91% 63.76% 64.55%Spire Inc SR 46.36% 45.94% 46.97% 47.01% 45.31% 44.90% 61.10% 57.06% 49.33%TC Pipelines, LP TCP 37.09% 40.54% 42.88% 41.60% 46.45% 47.01% 45.62% 45.82% 43.38%WGL Holdings, Inc. WGL 57.05% 56.19% 55.99% 56.70% 55.52% 64.06% 67.15% 67.63% 60.04%
Mean 54.03% 53.74% 54.31% 54.49% 54.70% 53.08% 57.37% 57.42% 54.89%
Company Ticker 2015Q4 2015Q3 2015Q2 2015Q1 2014Q4 2014Q3 2014Q2 2014Q1 Average
Atmos Energy Corporation ATO 42.87% 43.46% 43.12% 43.88% 44.48% 44.32% 44.07% 44.01% 43.78%Boardwalk Pipeline Partners, LP BWP 44.92% 45.10% 45.42% 46.05% 47.76% 45.93% 45.51% 45.88% 45.82%Dominion Midstream Partners, LP DM NA NA NA NA NA NA NA NA NAEnLink Midstream Partners, LP ENLK 42.50% 36.55% 32.75% 29.27% 25.96% 28.45% 26.46% 26.99% 31.12%EQT Midstream Partners, LP EQM 29.67% 36.74% 38.47% 39.21% 38.25% 48.13% 17.19% 15.15% 32.85%Kinder Morgan Inc. KMI 55.17% 55.69% 55.88% 56.37% 55.68% 75.15% 74.64% 74.41% 62.87%New Jersey Resources Corporation NJR 42.89% 43.57% 44.03% 38.98% 40.08% 39.57% 38.58% 38.48% 40.77%Northwest Natural Gas Company NWN 43.55% 45.02% 44.45% 45.74% 46.36% 46.80% 48.35% 48.76% 46.13%South Jersey Industries, Inc. SJI 49.96% 51.74% 49.36% 50.96% 51.98% 53.88% 50.53% 45.81% 50.53%Southwest Gas Corporation SWX 49.63% 50.16% 49.84% 49.53% 52.58% 49.91% 48.64% 48.38% 49.83%Spectra Energy Partners, LP SEP 36.90% 36.00% 36.44% 36.97% 33.09% 33.83% 34.09% 36.24% 35.45%Spire Inc SR 53.64% 54.06% 53.03% 52.99% 54.69% 55.10% 38.90% 42.94% 50.67%TC Pipelines, LP TCP 62.91% 59.46% 57.12% 58.40% 53.55% 52.99% 54.38% 54.18% 56.62%WGL Holdings, Inc. WGL 42.95% 43.81% 44.01% 43.30% 44.48% 35.94% 32.85% 32.37% 39.96%
Mean 45.97% 46.26% 45.69% 45.51% 45.30% 46.92% 42.63% 42.58% 45.11%
Source: SNL Financial
Proxy Group Capital Structure
% Common Equity
% Long-Term Debt
Docket U-16-___ Exhibit RBH-11 Page 1 of 1

Issuance Issuance Date Amount Weighted Cost Cost Term A-Rated Utility Debt BBB-Rated Utility Debt2.55% Intercompany Loan 1,994,000 50,847 2.55%2.55% SHC Term Loan Due 2017 8/30/2012 19,371,000 493,961 2.55% 5-Years 1.58% 2.37%5.15% Senior Notes Due 2020 4/20/2010 129,135,000 6,650,453 5.15% 10-Years 5.11% 5.39%Amortization of Debt Expense (680,365) 157,007 Amortization of Loss on Reacquired Debt 184,376 Total Cost of Debt 149,819,635$ 7,536,643$ 5.03% Weighted Average 4.90% 5.25%
ENSTAR Cost of Debt: 5.03% Bloomberg Fair-Value Curve Average: 5.08%
Sources: Company provided data and Bloomberg Professional
Bloomberg Fair Value Curve:30-Day Average Cost of Debt at Issuance
Cost of Debt Comparison
ENSTAR Cost of Debt
Docket U-16-___ Exhibit RBH-12 Page 1 of 1