Embed Size (px)
Citation preview
Standing Water Detection Using Radar
S. Elhassana, X. Wua and J. P. Walkera
a Department of Civil Engineering, Monash University, Victoria, Australia Email: [email protected]
Abstract: Mapping of natural and man-made water bodies is a critical component of environmental studies, including climate change, agriculture, flood forecasting and groundwater recharge estimation. Moreover, standing water heavily impacts the ability to accurately estimate soil moisture from satellite, particularly from low resolution passive microwave data using a radiometer. NASA’s soil moisture dedicated mission, the Soil Moisture Active Passive (SMAP), will use 3km resolution L-band radar to downscale 36km resolution L-band radiometer observations to 9km. These brightness temperature estimates are subsequently interpreted for soil moisture content. Consequently, the 3km resolution radar that will be on-board the SMAP affords the opportunity to also detect dynamic standing water, and thus correct the radiometer signals accordingly prior to downscaling.
The objective of this study was to develop and validate a standing water detection method, using radar observations collected from the Soil Moisture Active Passive Experiments (SMAPEx) undertaken near the township of Yanco in the Murrumbidgee Catchment in southeast New South Wales, Australia. There were three water detection methods put forward in this study, including: i) difference in backscatter at different polarizations; ii) direct backscatter threshold; and iii) the ratios between backscatter at different polarizations. These three methods were all applied to the data collected over a known flooding area, so as to compare the feasibility of each method and thus determine the criteria of water body detection.
The direct backscatter threshold method had the best performance for detecting water bodies, which was subsequently applied to radar data over the entire SMAPEx site. In order to validate the capability of this detection method, the derived water map across the SMAPEx site was compared against a range of reference maps, including 1km resolution brightness temperature data, Land Remote Sensing Satellite (Landsat) derived farm dam maps, and aerial photographs taken during the regional flights of the study site area.
To analyze the influence from incidence angle normalization on the backscatter, both normalized and non-normalized data were tested in this study. It was found that the water map derived from non-normalized backscatter was more accurate, due to the residual normalization error when using the backscatter data at its highest spatial resolution (10m). Consequently, the standing water map had the best estimation of water locations when used at coarser resolution (100m) due to the reduction in speckle as compared to data at high resolution (10m). Moreover, some areas were mis-identified as water, especially in grasslands, meaning that the method needs to be used with caution, and that radar is going to be a challenging approach to identify standing water in vegetated fields.
Keywords: Soil moisture, water bodies, SMAPEx, radar observations
20th International Congress on Modelling and Simulation, Adelaide, Australia, 1–6 December 2013 www.mssanz.org.au/modsim2013
3085

Elhassan et al., Standing water detection using radar
1. INTRODUCTION
Although the earth is composed of 97.5% water, it is primarily of saline composition and ultimately unusable by the human population. Moreover, the rapid increase in population has placed unprecedented strain on the hydrological cycle, due to our need for access to a clean fresh water supply for agriculture and consumptive use. Addressing the issue demands that the global community is capable of monitoring the quantity and quality of surface and ground water. Social benefits that are associated with such a water monitoring capability include, but are not limited to, the maintenance of human health, irrigation, protection of the environment, climate change, dry-land agriculture, flood forecasting and groundwater recharge, which in turn will aid in the development of a sustainable water inventory system worldwide (Toll et al., 2010) .
The ability to accurately map standing water is crucial to the dependent monitoring of such a water system on a global scale. In the past, different mapping techniques have been implemented to obtain qualitative maps showing water (Solbo et al., 2003). These studies have included the optical sensors during the early stages of remote sensing research. For example, the Moderate Resolution Imaging Spectroradiometer (MODIS) has been used to map standing water at resolutions of 250 and 500m. However, such data are susceptible to the presence of clouds in the atmosphere (Guerschman et al., 2011). The Land Remote Sensing Satellite (Landsat) provides similar data with a higher spatial resolution than MODIS, but its temporal revisit time is reduced to fortnightly and has the same limitations as MODIS. Other techniques for detection of standing water bodies including radar, which produces backscatter over the site being studied at a high resolution. It has a reduced influence from the atmosphere compared to the optical sensors, however it is limited by its sensitivity to ground structure and vegetation (Melrose et al., 2012).
Information on standing water is also important for accurate mapping of soil moisture, as it adversely impacts the satellite signals if not taken into account during interpretation. The Soil Moisture Active Passive (SMAP) mission of NASA will be launched in October 2014, and it will provide 36km resolution microwave radiometer brightness temperature and 3km resolution radar backscatter data simultaneously and globally, with 2-3 days’ revisit frequency. The radar onboard the SMAP will potentially allow the standing water to be detected by the radar due to its finer spatial resolution, thus providing the opportunity to applying a correction to the brightness temperature data prior to retrieval of soil moisture. Consequently, the purpose of this research is to assess the ability to map standing water using radar observations from the Soil Moisture Active Passive Experiment (SMAPEx) conducted in Australia.
2. DATA
In collaboration with the SMAP mission, a series of experiments (SMAPEx) have been carried out in the Murrumbidgee Catchment in southeast New South Wales, with the objective of mapping near-surface soil moisture (Panciera et al., 2013), as shown in Figure 1. Data collected from the flights during the SMAPEx field campaigns are used in the development and validation of a water detection method. The Polarimetric L-Band Imaging Synthetic aperture radar (PLIS) used in these experiments observed the surface backscatter at 10m resolution. Radar data from PLIS collected over a flooding area were used to derive a water detection algorithm, which was subsequently applied to the radar data collected over the entire SMAPEx site (38km×36km) and validated against a range of reference data. For example, the reference data from Polarimetric L-Band Multi-beam Radiometer (PLMR), onboard the same aircraft as PLIS, provided 1km resolution brightness temperature with high accuracy. Other reference data, such as aerial
Figure 1. Overview of SMAPEx study site in Yanco of the Murrumbidgee Catchment, NSW, Australia, and flood
flights conducted along the Murrumbidgee River, NSW.
3086

Elhassan et al., Standing water detection using radar
photographs collected from the same flights and farm dam maps from Landsat, are used as the reference water body maps.
There were three SMAPEx field campaigns conducted at different seasons across approximately a one year time frame: SMAPEx-1 from 5th to 10th July 2010, SMAPEx-2 from 4th to 8th December 2010, and SMAPEx-3 from 5th to 23rd September 2011. Of the three experiments conducted, the backscatter data obtained from SMAPEx-2 and SMAPEx-3 were used for the purpose of this study. Additionally, flood flights conducted along a stretch of the Murrumbidgee River during SMAPEx-2 were also used, as shown in Figure 1. Both the SMAPEx flights and the supplementary flood flights were conducted at 3,000m flying height, and provide brightness temperature at 1km resolution from PLMR and backscatter at 10m resolution from PLIS. Using the collected backscatter data in conjunction with brightness temperature from PLMR, aerial images of the study site, and maps of farm dams from Landsat, an algorithm of standing water was derived.
3. METHODOLOGY
The backscatter data at HH, VV and HV polarization collected on 8th December 2010 from SMAPEx-2 and 23rd September 2011 from SMAPEx-3 respectively were used in this study, as well as the data collected from the flood flights. An algorithm is developed from the flood flights and subsequently used to produce a binary water map displaying standing water bodies within the site. The techniques that have been applied include: 1) applying different logic and algorithms to the backscatter data; 2) scaling up the data to reduce noise through reduced spatial resolution; and 3) using angle normalized and non-normalized data. Initially, a visual analysis was performed for a series of seven flood transect-flights conducted over a stretch of the Murrumbidgee River during December 2011, in order to determine the location of substantial standing water bodies. By extracting latitudinal cross sections from the studied water bodies, graphs showing the backscatter relationship to water were produced. Through comparison with the known water body location in visual images, threshold values, differencing and ratios of the HH, HV & VV polarizations were extracted and analyzed to determine their utility in detecting standing water bodies. Throughout the following sections, a sample of the data extractions of a water body identified in the F6 Flight is shown. The initial analysis undertaken for this study was to determine the existence of a relationship between standing water bodies and differences between backscatter at various polarizations. Consequently,
Δ = σHH – σVV < ΔThreshold , (1)
where σHH and σVV are the co-horizontal and co-vertical polarizations respectively, and ΔThreshold is the differenced threshold. In an attempt to improve the results, a further restriction was placed on the above algorithm using a threshold at HV polarization such that
Δ = σHH – σVV < ΔThreshold & σHV > x, (2)
where σHV is the HV polarization threshold indicative of background vegetation, and is HV backscatter value. In this study the value of x was varied between -25dB and -15 dB at increments of 1 dB.
The second analysis technique was a direct threshold of the backscatter. By generating the grayscale PLIS backscatter image and locating substantial water bodies in each flight, a series of backscatter values describing the presence of water were recorded and used to determine the effectiveness of using threshold values to effectively remotely sense water according to
σHH < Threshold; σVV < Threshold; σHV < Threshold, (3)
The final data analysis technique tested on the backscatter data was taking the ratios between the different polarizations, in attempt to determine whether a significant relation existed. The ratios taken were
σHH /σVV; σHH /σHV; σVV /σHV. (4)
To reduce speckle in the generated binary water maps, the best performing algorithm from the above was applied to the backscatter data after up-scaling to lower resolutions of 30m and 100m. Since the radar backscatter was observed over a range of incidence angles, i.e. from 15˚ to 45˚, they were normalized to the constant 40˚ of the SMAP. As shown in Wu et al (2013), the error of incidence angle normalization for the radar observations from SMAPEx is around 3.5dB at 10m resolution and reduces to 1.7dB at 100m resolution. Since this may influence the accuracy of the water detection results, both normalized and non-normalized backscatter data were applied to the water detection method so as to evaluate the impact from normalization and thus obtain a better result.
3087
Elhassan et al., Standing water detection using radar
4. RESULTS AND DISCUSSION
4.1. Algorithm development using data from flood flights
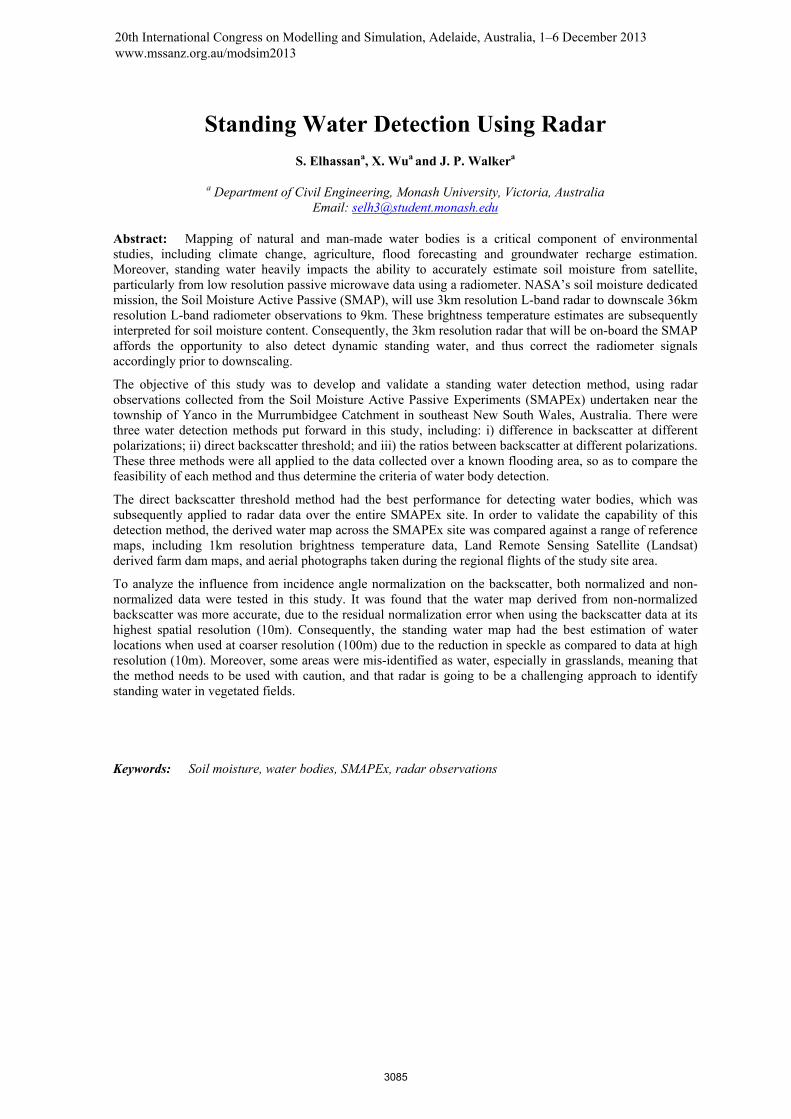
The above techniques for remote mapping of standing water bodies were tested with flood flights stretching along the length of Murrumbidgee River, prior to selection of the preferred approach for further testing on the SMAPEx flights. Figure 2 shows backscatter differences, values and ratios as required for the three proposed water detection algorithms, for data from a cross section of the F6 flood flight with incidence angle normalized. Through comparison with the aerial photo, it was determined that according to the three data analysis techniques tested, the best approach was the direct backscatter threshold. The analysis was performed on the three polarizations and yielded average backscatter values of -29 dB, -29 dB and -38 dB for the HH, VV and HV polarizations respectively over the flooding area. This is comparable with a HH class threshold of -26 dB determined in a study conducted using a dual L-band (HH/HV) synthetic aperture radar (SAR) over flood plains located along Paroo River, Northern NSW, Australia (Melrose et al., 2012).
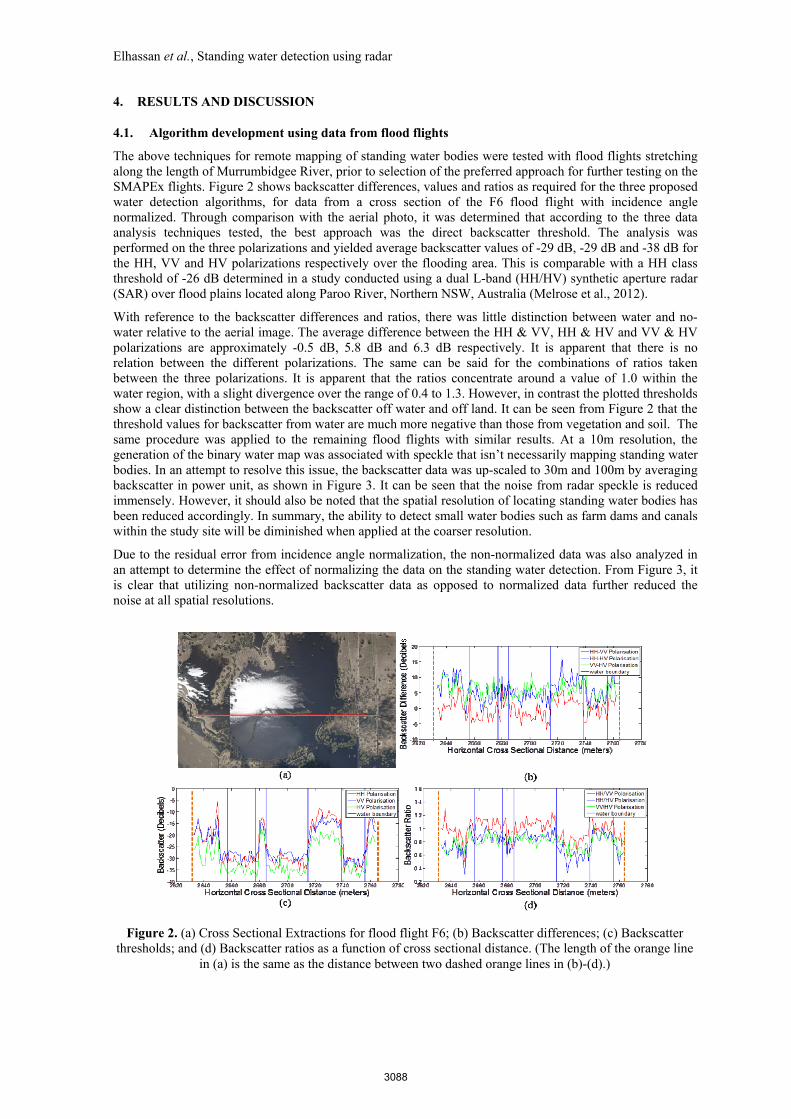
With reference to the backscatter differences and ratios, there was little distinction between water and no-water relative to the aerial image. The average difference between the HH & VV, HH & HV and VV & HV polarizations are approximately -0.5 dB, 5.8 dB and 6.3 dB respectively. It is apparent that there is no relation between the different polarizations. The same can be said for the combinations of ratios taken between the three polarizations. It is apparent that the ratios concentrate around a value of 1.0 within the water region, with a slight divergence over the range of 0.4 to 1.3. However, in contrast the plotted thresholds show a clear distinction between the backscatter off water and off land. It can be seen from Figure 2 that the threshold values for backscatter from water are much more negative than those from vegetation and soil. The same procedure was applied to the remaining flood flights with similar results. At a 10m resolution, the generation of the binary water map was associated with speckle that isn’t necessarily mapping standing water bodies. In an attempt to resolve this issue, the backscatter data was up-scaled to 30m and 100m by averaging backscatter in power unit, as shown in Figure 3. It can be seen that the noise from radar speckle is reduced immensely. However, it should also be noted that the spatial resolution of locating standing water bodies has been reduced accordingly. In summary, the ability to detect small water bodies such as farm dams and canals within the study site will be diminished when applied at the coarser resolution.
Due to the residual error from incidence angle normalization, the non-normalized data was also analyzed in an attempt to determine the effect of normalizing the data on the standing water detection. From Figure 3, it is clear that utilizing non-normalized backscatter data as opposed to normalized data further reduced the noise at all spatial resolutions.
Figure 2. (a) Cross Sectional Extractions for flood flight F6; (b) Backscatter differences; (c) Backscatter thresholds; and (d) Backscatter ratios as a function of cross sectional distance. (The length of the orange line
in (a) is the same as the distance between two dashed orange lines in (b)-(d).)
3088
Elhassan et al., Standing water detection using radar
4.2. Validation using data over SMAPEx site
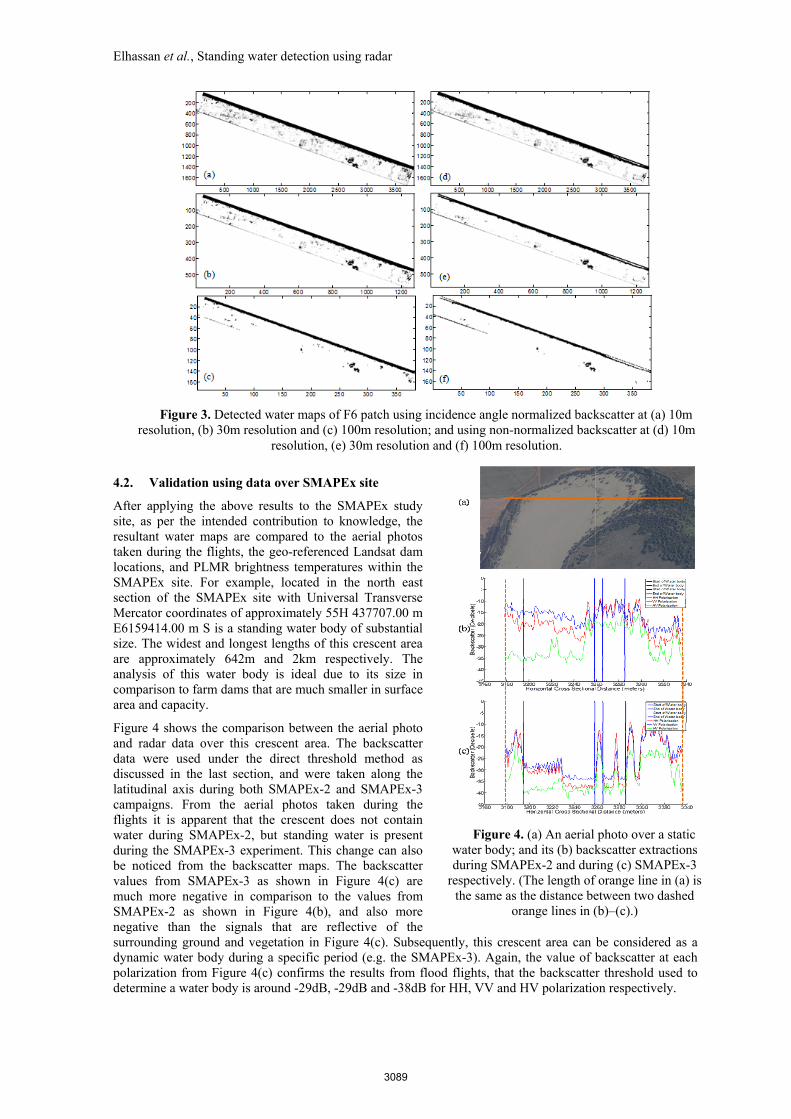
After applying the above results to the SMAPEx study site, as per the intended contribution to knowledge, the resultant water maps are compared to the aerial photos taken during the flights, the geo-referenced Landsat dam locations, and PLMR brightness temperatures within the SMAPEx site. For example, located in the north east section of the SMAPEx site with Universal Transverse Mercator coordinates of approximately 55H 437707.00 m E6159414.00 m S is a standing water body of substantial size. The widest and longest lengths of this crescent area are approximately 642m and 2km respectively. The analysis of this water body is ideal due to its size in comparison to farm dams that are much smaller in surface area and capacity.
Figure 4 shows the comparison between the aerial photo and radar data over this crescent area. The backscatter data were used under the direct threshold method as discussed in the last section, and were taken along the latitudinal axis during both SMAPEx-2 and SMAPEx-3 campaigns. From the aerial photos taken during the flights it is apparent that the crescent does not contain water during SMAPEx-2, but standing water is present during the SMAPEx-3 experiment. This change can also be noticed from the backscatter maps. The backscatter values from SMAPEx-3 as shown in Figure 4(c) are much more negative in comparison to the values from SMAPEx-2 as shown in Figure 4(b), and also more negative than the signals that are reflective of the surrounding ground and vegetation in Figure 4(c). Subsequently, this crescent area can be considered as a dynamic water body during a specific period (e.g. the SMAPEx-3). Again, the value of backscatter at each polarization from Figure 4(c) confirms the results from flood flights, that the backscatter threshold used to determine a water body is around -29dB, -29dB and -38dB for HH, VV and HV polarization respectively.
Figure 4. (a) An aerial photo over a static water body; and its (b) backscatter extractions during SMAPEx-2 and during (c) SMAPEx-3
respectively. (The length of orange line in (a) is the same as the distance between two dashed
orange lines in (b)–(c).)
Figure 3. Detected water maps of F6 patch using incidence angle normalized backscatter at (a) 10m resolution, (b) 30m resolution and (c) 100m resolution; and using non-normalized backscatter at (d) 10m
resolution, (e) 30m resolution and (f) 100m resolution.
3089
Elhassan et al., Standing water detection using radar
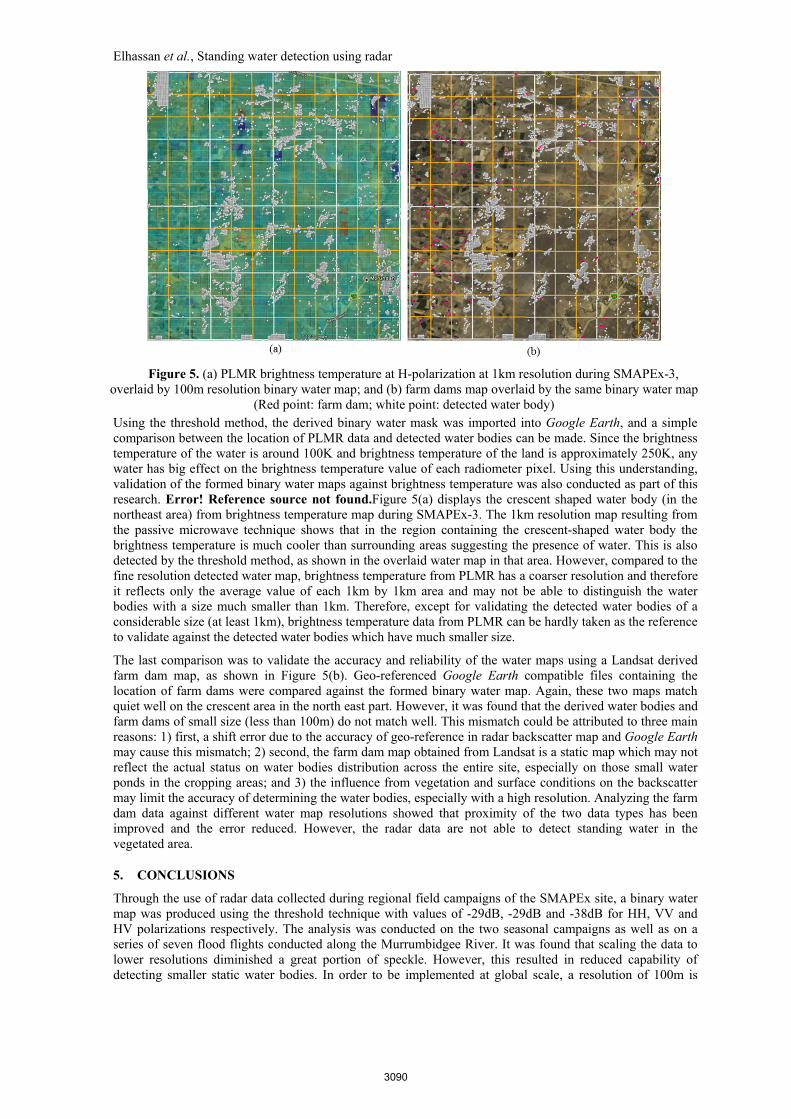
Using the threshold method, the derived binary water mask was imported into Google Earth, and a simple comparison between the location of PLMR data and detected water bodies can be made. Since the brightness temperature of the water is around 100K and brightness temperature of the land is approximately 250K, any water has big effect on the brightness temperature value of each radiometer pixel. Using this understanding, validation of the formed binary water maps against brightness temperature was also conducted as part of this research. Error! Reference source not found.Figure 5(a) displays the crescent shaped water body (in the northeast area) from brightness temperature map during SMAPEx-3. The 1km resolution map resulting from the passive microwave technique shows that in the region containing the crescent-shaped water body the brightness temperature is much cooler than surrounding areas suggesting the presence of water. This is also detected by the threshold method, as shown in the overlaid water map in that area. However, compared to the fine resolution detected water map, brightness temperature from PLMR has a coarser resolution and therefore it reflects only the average value of each 1km by 1km area and may not be able to distinguish the water bodies with a size much smaller than 1km. Therefore, except for validating the detected water bodies of a considerable size (at least 1km), brightness temperature data from PLMR can be hardly taken as the reference to validate against the detected water bodies which have much smaller size.
The last comparison was to validate the accuracy and reliability of the water maps using a Landsat derived farm dam map, as shown in Figure 5(b). Geo-referenced Google Earth compatible files containing the location of farm dams were compared against the formed binary water map. Again, these two maps match quiet well on the crescent area in the north east part. However, it was found that the derived water bodies and farm dams of small size (less than 100m) do not match well. This mismatch could be attributed to three main reasons: 1) first, a shift error due to the accuracy of geo-reference in radar backscatter map and Google Earth may cause this mismatch; 2) second, the farm dam map obtained from Landsat is a static map which may not reflect the actual status on water bodies distribution across the entire site, especially on those small water ponds in the cropping areas; and 3) the influence from vegetation and surface conditions on the backscatter may limit the accuracy of determining the water bodies, especially with a high resolution. Analyzing the farm dam data against different water map resolutions showed that proximity of the two data types has been improved and the error reduced. However, the radar data are not able to detect standing water in the vegetated area.
5. CONCLUSIONS
Through the use of radar data collected during regional field campaigns of the SMAPEx site, a binary water map was produced using the threshold technique with values of -29dB, -29dB and -38dB for HH, VV and HV polarizations respectively. The analysis was conducted on the two seasonal campaigns as well as on a series of seven flood flights conducted along the Murrumbidgee River. It was found that scaling the data to lower resolutions diminished a great portion of speckle. However, this resulted in reduced capability of detecting smaller static water bodies. In order to be implemented at global scale, a resolution of 100m is
Figure 5. (a) PLMR brightness temperature at H-polarization at 1km resolution during SMAPEx-3, overlaid by 100m resolution binary water map; and (b) farm dams map overlaid by the same binary water map
(Red point: farm dam; white point: detected water body)
3090
Elhassan et al., Standing water detection using radar
sufficient in detecting substantial water bodies; however, if required to determine the presence of smaller water bodies such as farm dams, a resolution of better than 30m should be adopted.
An analysis was carried out to determine the effect of using normalized backscatter data as opposed to raw data. It was found that although the approach with non-normalized data reduced speckle it also diminished the definition of the water bodies due to a widely varying angle of incidence, and therefore a better detection of water bodies could be expected by using an incidence angle dependent threshold method. In an attempt to validate the results, the binary water map over the SMAPEx site was compared against an aerial photo, a Landsat derived farm dam map and microwave brightness temperature data. Results showed that the binary water map had a good agreement with reference maps on the crescent area with a considerable size in the north east part of the SMAPEx site. However, the detected water bodies of small size (<100m) did not match well with the reference maps, likely due to the lack of high resolution and dynamic water body reference, and the influence from vegetation heterogeneity. It is expected that by using the radar data from the SMAP mission, a more accurate standing water map can be detected through the threshold technique because of the reduced heterogeneity in vegetation at 3km resolution when compared to ~100m resolution in this study, thus providing the opportunity to retrieve a more accurate soil moisture product by correcting the brightness temperature data.
ACKNOWLEDGEMENTS
The SMAPEx field campaigns have been funded by an Australian Research Council Discovery grant (DP0984586). The authors acknowledge the participants to the SMAPEx Experiments, and in particular of key personnel from SMAP which provided significant contribution to the campaign’s design and execution.
REFERENCES
Guerschman, J. P., Warren, G., Byrne, G., Lymburner, L., Mueller, N. & van Dijk, A. 2011. MODIS-based standing water detection for flood and large reservoir mapping: algorithm development and applications for the Australian continent. CSIRO.
Jackson, T. J. 2001. Multiple resolution analysis of L-band brightness temperature for soil moisture. Geoscience and Remote Sensing, IEEE Transactions on, 39, 151-164.
Melrose, R., Kingsford, R. & Milne, A. Using radar to detect flooding in arid wetlands and rivers. Geoscience and Remote Sensing Symposium (IGARSS), IEEE International, 22-27 July 2012. 5242-5245.
Panciera, R., Walker, J., Jackson, T., Gray, D., Tanase, M., Ryu, D., Monerris, A., Yardley, H., Rudiger, C., Wu, X., Gao, Y. & Hacker, J. 2013. The Soil Moisture Active Passive Experiments (SMAPEx): Toward Soil Moisture Retrieval From the SMAP Mission. Geoscience and Remote Sensing, IEEE Transactions on, PP, 1-18.
Panciera, R., Walker, J., O'Neill, P., Wu, X., Gao, Y., Monerris, A., Jackson, T., Gray, D. & Ryu, D. An airborne simulation of the SMAP data stream. Geoscience and Remote Sensing Symposium (IGARSS), IEEE International, 22-27 July 2012. 5-7.
Peischl, S., Walker, J., Rüdiger, C., Ye, N., Kerr, Y., Kim, E., Bandara, R. & Allahmoradi, M. 2012. The AACES field experiments: SMOS calibration and validation across the Murrumbidgee River catchment. Hydrol. Earth Syst. Sci., 16, 1697-1708.
Solbo, S., Malnes, E., Guneriussen, T., Solheim, I. & Eltoft, T. Mapping surface-water with Radarsat at arbitrary incidence angles. Geoscience and Remote Sensing Symposium (IGARSS), IEEE International, 21-25 July 2003. 2517-2519 vol.4.
Toll, D., Doorn, B. & Engman, E. NASA's water resources element within the Applied Sciences Program. Geoscience and Remote Sensing Symposium (IGARSS), IEEE International, 25-30 July 2010. 918-921.
Wu, X., Walker, J.P., Rüdiger , C., Panciera, R., 2013. Simulation of the SMAP Data Stream from SMAPEx Field Campaigns in Australia. IEEE Transaction on Geoscience and Remote Sensing. In Review
3091