Embed Size (px)
Citation preview

Dynamical Seasonal Prediction of Climate Extremes inthe Pacific
A. Charles , a E. Miles , b A. Griesser b, R. de Wit a, K. Shelton b, A. Cottrill b, C. Spillman b, H. Hendon b, P. McIntosh , T. Nakaegawa , c T. Atalifo , d B. Prakash d, S. Seuseu , e S. Nihmei , f g
J.Church , h D. Jones a and Y. Kuleshov a
aNational Climate Centre, Bureau of Meteorology, Melbourne, AustraliabCentre for Australian Weather and Climate Research, Bureau of Meteorology, Melbourne, Australia
cMeteorological Research Institute, Japan Meteorological Agency, Tsukuba, JapandRSMC Nadi, Fiji Meteorological Service, FijieSamoa Meteorology Division, Apia, Samoa
fVanuatu Meteorological and Geo-Hazard Department, Port Vila, VanuatugSecretariat of the Pacific Regional Environment Programm (SPREP), Apia, SamoahCommonwealth Scientific and Industrial Research Organisation, Hobart, Australia
Email: [email protected]
Abstract: The vulnerability of Pacific Island Countries to climate extremes is exacerbated by a changingclimate. Many of the early impacts of climate change are being felt through seasonal variability. Drought andcoastal inundation are two examples of events which occur as seasonal variability but are made more severe byincreased mean temperatures and rising sea levels. Early warnings of extreme climate events from dynamicalcoupled ocean-atmosphere global climate models (CGCMs) can increase resilience by providing a lead timein which action can be taken.
Dynamical seasonal forecasting systems are now competitive with the best statistical forecasting techniques,with the advantage that they implicitly include the effects of a changing climate, reducing concerns aboutthe effects of climate change and decadal variability on forecasts. Dynamical models have the advantage ofproviding information at a range of timescales from weeks to seasons and for a range of physical quantitiesincluding extreme ocean temperatures, tropical cyclone activity and sea level.
We have developed dynamical model based seasonal forecasts for Pacific Island Countries, including monthlyto seasonal forecasts of extreme sea levels, extreme ocean temperatures and tropical cyclone activity. Thesenew forecasts of extreme climate events work in concert with more traditional seasonal outlooks for rainfall,temperature and climate indices to provide rich foresight of near-future climate variability.
Outlooks are delivered via interactive web-based geospatial apps, providing broad scale and local informationabout climate risk to National Meteorological Services in 15 partner countries. Investing development timein open-source geospatial data infrastructure and re-usable user interface frameworks has enabled rapid de-velopment of new tools for forecasts of new predictands. Extension of prediction research to the responsibleagencies has involved training of users and continuing support.
Keywords: Seasonal prediction, Climate extremes, Dynamical climate model
20th International Congress on Modelling and Simulation, Adelaide, Australia, 1–6 December 2013 www.mssanz.org.au/modsim2013
2841

Charles et al Dynamical Seasonal Prediction of Climate Extremes
1 INTRODUCTION
The countries of the Pacific Ocean are exposed to climate risk across a range of sectors, most notably in waterresources, agriculture and disaster preparedness. Small changes in the mean state of the climate system canlead to large changes in the frequency and magnitude of extreme events (Corti et al., 1999). A recently com-pleted global analysis has found a near 50-fold increase in the frequency of extremely hot temperatures duringthe northern hemisphere summer (Hansen et al., 2012). Evidence is accumulating to support the hypothesisthat global warming has intensified the hydrological cycle, causing more extreme flooding and droughts (Hunt-ington, 2006). In this changing climate, the historical frequencies of extreme events such as droughts, tropicalcyclones and coastal inundation are less useful as predictive probabilities (Rahmstorf and Coumou, 2011).
Considerable uncertainties remain about the impact of climate change on extreme weather events. In the faceof these uncertainties, an effective and low cost option to reduce vulnerability to climate change is to improvethe accuracy, availability and use of forecasts (Lubchenco and Karl, 2012).
While many climate anomalies are essentially chaotic and not predictable, the large-scale coupling between theatmosphere and the ocean imparts a degree of predictability to variations of seasonal climate in the atmosphere-ocean-land surface system. The most significant manifestation of this coupling, and the physical source ofmuch of this predictability is the El Nino Southern Oscillation (ENSO). This predictability is utilised bycoupled ocean-atmosphere General Circulation Models (CGCMs) which form the basis of modern seasonalforecasting systems. Integral to the forecast capability of such models are ocean and atmospheric data assim-ilation systems, which provide an estimate of the state of the system as measured by satellite observations,buoys such as the TOGA-TAO in the equatorial Pacific Ocean and other instruments.
In this paper, the CGCM-based seasonal prediction system is described. Experimental outlooks for extremesea levels, extreme ocean temperatures, seasonal tropical cyclone activity, rainfall and temperature are thendescribed. Finally the web application used to deliver the outlooks to users in National Meteorological andHydrological Services (NMSs) is described.
2 DYNAMICAL MODEL PROBABILITY OUTLOOKS
The operational Predictive Ocean Atmosphere Model for Australia ’multi-week’ (POAMA-M24) system isdescribed in detail in a Bureau of Meteorlogoy technical bulletin (National Meteorological and OceanographicCentre, 2013). It comprises a T47 spectral atmospheric model with 17 vertical levels, coupled using the OceanAtmosphere Sea Ice Soil coupler (OASIS) to an ocean model with 25 vertical levels, 2◦ zonal resolution and0.5◦ meridional resolution at the equator increasing to 1.5◦ near the poles. Land surface initial conditions aregenerated by a nudging scheme. An ensemble of 10 ocean and atmospheric states perturbed around a centralanalysis is generated using a coupled breeding scheme (Hudson et al., 2013).
Seasonal climate prediction is inherently probabilistic because the evolution of the climate system is highlysensitive to initial conditions. The nonlinear nature of the coupled ocean-atmosphere system means that prob-abilities of extreme events may not be well estimated from a single best guess deterministic forecast. Toestimate the range of physically plausible outcomes, GCMs are typically run as an ensemble with perturbedinitial conditions. The economic value of ensemble forecasts is greater than that of individual models or simpleensemble means (Palmer and Raisanen, 2002).
Because the numerical integration of equations of motion does not change under global warming, dynamicalmodels are less influenced by climate change than statistical models. GCMs explicitly take into accountclimate processes that are important for seasonal climate prediction such as equatorial oceanic waves andatmospheric convection driven by ocean temperatures and are not constrained by what has occurred in thepast. GCMs implicitly include the effects of a changing climate whatever its character or cause and canpredict outcomes not seen previously. Dynamical models are of course subject errors and biases, and to thefundamental limits to predictability of the ocean-atmosphere system. Such errors and limitations are assessedover a hindcast (retrospective forecast) period in order to provide information about the likely skill of theoutlooks.
3 SEA LEVEL
Sea level rise is expected to have some of the most profound impacts on islands in the Western Pacific throughcoastal erosion, damage to physical assets and loss of agricultural productivity due to salt water intrusion andincreasing salinity.
2842

Charles et al Dynamical Seasonal Prediction of Climate Extremes
a)
b)
Figure 1. a) Sea level anomaly outlook for October to December 2013, published at http://poama.bom.gov.au/experimental/pasap/sla.shtml. b) Correlation skill for October to December predictions of three monthly meansea level anomalies,
Outlooks for three monthly mean sea level anomalies, and of the probability of seasonal sea levels falling intothe lowest or highest tercile, are generated directly from the POAMA-M24 ocean model ensemble. Forecasts ata range of lead times are published, along with the associated verification scores. Figure 1a shows an exampleforecast, while Figure 1b shows the correlation coefficient between the model outlook for three monthly meansea level anomaly and a realtime analysis of sea level (Yin et al., 2011). Hindcast analysis shows that at shortlead times the sea level anomaly outlooks are quite skillful as shown in Figure 1b. The sea level outlooks aredescribed further in (Miles et al., 2013).
4 OCEAN TEMPERATURE
Coral bleaching is largely a result of anomalously warm water temperatures. Degraded coral reefs presentmany potential social and economic problems for Pacific island countries, including long-term loss of tourism,potential loss or degradation of fisheries and reduction in coastal protection, as well as the environmentaldegradation itself. Monitoring and prediction of thermal stress events enables the support of adaptive andmanagement activities that could improve reef resilience to extreme conditions. Forecasts of the probabilityof temperatures exceeding key coral sensitivity thresholds can be used to plan reef management activities.
2843
Charles et al Dynamical Seasonal Prediction of Climate Extremes
a)
b)
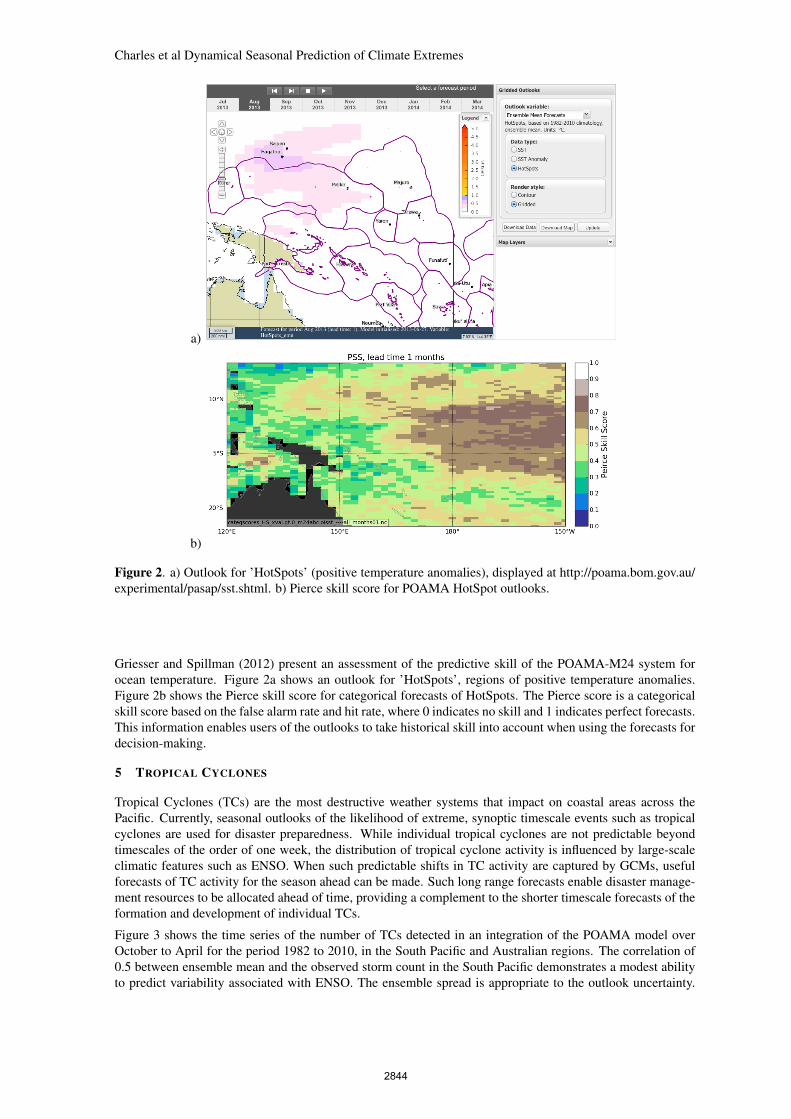
Figure 2. a) Outlook for ’HotSpots’ (positive temperature anomalies), displayed at http://poama.bom.gov.au/experimental/pasap/sst.shtml. b) Pierce skill score for POAMA HotSpot outlooks.
Griesser and Spillman (2012) present an assessment of the predictive skill of the POAMA-M24 system forocean temperature. Figure 2a shows an outlook for ’HotSpots’, regions of positive temperature anomalies.Figure 2b shows the Pierce skill score for categorical forecasts of HotSpots. The Pierce score is a categoricalskill score based on the false alarm rate and hit rate, where 0 indicates no skill and 1 indicates perfect forecasts.This information enables users of the outlooks to take historical skill into account when using the forecasts fordecision-making.
5 TROPICAL CYCLONES
Tropical Cyclones (TCs) are the most destructive weather systems that impact on coastal areas across thePacific. Currently, seasonal outlooks of the likelihood of extreme, synoptic timescale events such as tropicalcyclones are used for disaster preparedness. While individual tropical cyclones are not predictable beyondtimescales of the order of one week, the distribution of tropical cyclone activity is influenced by large-scaleclimatic features such as ENSO. When such predictable shifts in TC activity are captured by GCMs, usefulforecasts of TC activity for the season ahead can be made. Such long range forecasts enable disaster manage-ment resources to be allocated ahead of time, providing a complement to the shorter timescale forecasts of theformation and development of individual TCs.
Figure 3 shows the time series of the number of TCs detected in an integration of the POAMA model overOctober to April for the period 1982 to 2010, in the South Pacific and Australian regions. The correlation of0.5 between ensemble mean and the observed storm count in the South Pacific demonstrates a modest abilityto predict variability associated with ENSO. The ensemble spread is appropriate to the outlook uncertainty.
2844

Charles et al Dynamical Seasonal Prediction of Climate Extremes
Figure 3. Time series of numbers of tropical cyclones in Australian and eastern South Pacific regions peryear. Red: min/max and ensemble mean TC counts from the POAMA-M24 seasonal prediction system.Black: observed counts from southern hemisphere tropical cyclone archive (Kuleshov et al., 2010). For theAustralian region, the correlation coefficient between observed and modelled counts is 0.57. For the easternSouth Pacific it is 0.5.
Figure 4. Top: Observed TC tracks in the Southern Hemisphere in 1985. Bottom: TC track density from tenensemble members of the POAMA system. Units are storms/area, normalised.
Figure 4 shows observed Southern Hemisphere tracks for 1985, compared to the track density computed overan ensemble of ten model runs of the POAMA seasonal forecasting system. This track density is calculatedusing a radially symmetric fourth order polynomial smoothing kernel with a cutoff of approximately 500km.
2845
Charles et al Dynamical Seasonal Prediction of Climate Extremes
The use of this smoothing enables the ensemble of forecasts to be presented as a field, summarising the risk ofstorms in particular areas.
6 RAINFALL AND TEMPERATURE
Rainfall and temperature tercile probability outlooks are presented at monthly climate outlook forum meetingsinvolving staff from NMSs across the Pacific region (Cottrill et al., 2013). The provision of an ensemblemean forecast provides a further indication of potential extreme conditions such as drought and flood. Withadditional work this could be extend to quantitative predictions of extreme categories of rainfall.
7 USER INTERFACES, TOOLS AND INFRASTRUCTURE
These predictions of climate extremes are delivered via web-based applications which display the outlooks asoverlays on navigable maps. The map allows outlooks for a variety of predictands along with information aboutoutlook skill to be selected and displayed. Time series information is displayed for sites or regions via theirselection on the map. Contextual information is displayed and forecast data and figures can be downloaded.
Two factors driving innovation in the software used to distribute climate forecasts are the increasing amountof forecast data and expectations from users for richer applications. The amount of gridded and time seriesforecast data made available by dynamical models is large and increasing. At the same time geospatial soft-ware frameworks are developing rapidly. Users demand a richer experience and developers expect consistentapplication programming interfaces (APIs) for accessing and using data.
The software tools described above provide this rich experience. In the design of our system architecture weincorporated two key design principles: the use of open standards and interoperable sub-systems. Four distinctlayers are defined as components of the overall process of turning the outputs of GCMs into seasonal outlookssuitable for use by decision-makers. This is a generalisation of the software architecture for seasonal forecastproduction and delivery described in Charles et al. (2011).
The model layer comprises the POAMA seasonal prediction system, simulating the evolution of the coupledocean-atmosphere system and the systems for the ingestion of observational data and assimilation of theseobservations into the model, the construction of an ensemble of initial states and the output of variables ofinterest.
In the forecast generation layer, forecast products are generated from dynamical model output. This processinvolves statistical corrections for model biases and may involve the use of outputs from different models.Analysis of model performance over a historical period guides the decisions made at this level. The resultingderived forecast products are stored in self-describing files with additional metadata. Careful metadata curationin this layer enables downstream users of the data to understand its provenance and is considered a best practicefor public data.
At the data service layer forecast data is exposed using interfaces such as OPEnDAP (Cornillon et al., 2003).The format of the output is not dependent on the particular dynamical model, or even that the model is dynam-ical: the forecast is simply a time series of gridded data with descriptive metadata. Clearly defined APIs fordata access reduce the burden on application and product developers.
The outlook product layer provides the means for the majority of users to access forecasts, typically in theform of maps and graphs presented as images, data tables and expert commentary. The application presentingthe extremes outlooks uses the BOM.Map JavaScript mapping library and Python based web services gener-ating artifacts such as images and data tables. The objective is to present a seamless interface that hides thetechnical complexity from the end user, providing direct access to future climate information.
The climate extremes outlook tools described above were presented at a capacity building science symposiumin Honiaria in February 2013, attended by representatives from 14 Pacific Island and East Timor NMSs, andsubsequently at a training workshop for NMS staff. NMS staff are involved in ongoing work to verify theoutlooks against observations.
8 CONCLUSIONS
The potential of dynamical seasonal forecasting for providing foresight of extreme climatic events has beenexplored, and developed into a suite of experimental forecast products targetted at Pacific NMSs. Much workremains to be done in connecting decision-makers with information, and in the research and development ofoutlooks for other extremes. Seasonal predictions are published experimentally at the following URLs:
2846

Charles et al Dynamical Seasonal Prediction of Climate Extremes
• Sea level predictions: http://poama.bom.gov.au/experimental/pasap/sla.shtml
• Extreme ocean temperature predictions: http://poama.bom.gov.au/experimental/pasap/sst.shtml
• Rainfall and temperature (WMO Global Producing Centre for Long Range Forecasts, Melbourne):http://poama.bom.gov.au/experimental/pasap/
ACKNOWLEDGEMENT
The research discussed in this paper was conducted with the support of the Pacific Australia Climate ChangeScience and Adaptation Planning Program (PACCSAP), a program supported by AusAID, in collaborationwith the Department of Climate Change and Energy Efficiency, and delivered by the Bureau of Meteorologyand the Commonwealth Scientific and Industrial Research Organisation (CSIRO).
REFERENCES
Charles, A., D. McClymont, R. de Wit, and D. Jones (2011). A software architecture for seasonal climateforecasts in the tropical Pacific. In In Chan, F., Marinova, D. and Anderssen, R.S. (eds) MODSIM2011,19th International Congress on Modelling and Simulation. Modelling and Simulation Society of Australiaand New Zealand, December 2011, pp. 1188–1194.
Cornillon, P., J. Gallagher, and T. Sgouros (2003). OPeNDAP: accessing data in a distributed, heterogeneousenvironment. Data Science Journal 2, 164–174.
Corti, S., F. Molteni, and T. N. Palmer (1999, April). Signature of recent climate change in frequencies ofnatural atmospheric circulation regimes. Nature 398(6730), 799–802.
Cottrill, A., H. H. Hendon, E.-P. Lim, S. Langford, K. Shelton, A. Charles, D. McClymont, D. Jones, andY. Kuleshov (2013, February). Seasonal forecasting in the Pacific using the coupled model POAMA–2.Weather and Forecasting, 130225133541001.
Griesser, A. and C. Spillman (2012). SST forecast skill of the new intra-seasonal configuration of POAMA-2.CAWCR Research Letters Issue 8 (8), 10–16.
Hansen, J., M. Sato, and R. Ruedy (2012, August). Perception of climate change. Proceedings of the NationalAcademy of Sciences.
Hudson, D., A. G. Marshall, Y. Yin, O. Alves, and H. H. Hendon (2013, July). Improving intraseasonalprediction with a new ensemble generation strategy. Monthly Weather Review, 130731140004007.
Huntington, T. G. (2006, March). Evidence for intensification of the global water cycle: Review and synthesis.Journal of Hydrology 319(1–4), 83–95.
Kuleshov, Y., R. Fawcett, L. Qi, B. Trewin, D. Jones, J. McBride, and H. Ramsay (2010). Trends in trop-ical cyclones in the south Indian Ocean and the south Pacific Ocean. Journal of Geophysical Research:Atmospheres 115(D1).
Lubchenco, J. and T. R. Karl (2012). Predicting and managing extreme weather events. Physics Today 65(3),31.
Miles, E., C. M. Spillman, J. A. Church, and P. C. Mcintosh (2013). Seasonal prediction of global sea-levelanomalies using an ocean-atmosphere dynamical model. In preparation.
National Meteorological and Oceanographic Centre (2013, March). Operational upgrade to Predictive OceanAtmosphere Model for Australia (POAMA-M24). NMOC Operations Bulletin 96, Bureau of Meteorology.
Palmer, T. N. and J. Raisanen (2002, January). Quantifying the risk of extreme seasonal precipitation eventsin a changing climate. Nature 415(6871), 512–514.
Rahmstorf, S. and D. Coumou (2011, November). Increase of extreme events in a warming world. Proceedingsof the National Academy of Sciences 108(44), 17905–17909.
Yin, Y., O. Alves, and P. R. Oke (2011, March). An ensemble ocean data assimilation system for seasonalprediction. Monthly Weather Review 139(3), 786–808.
2847