Embed Size (px)
Citation preview

Chapter 5 Standardization
Md Sarfaraj Hussain Ph D Thesis (2013) Integral University 134
STANDARDIZATION
51 Introduction
Plant materials and herbal remedies derived from them represent substantial portion of
global market and in this respect internationally recognized guidelines for their quality
control are necessary WHO has recognized the need to ensure quality control of
medicinal plant products by using modern techniques and by applying suitable standards
Several Pharmacopoeia including Indian Pharmacopoeia British Pharmacopoeia
Pharmacopoeia of Republic of China Japanese Pharmacopoeia United State
Pharmacopoeia do cover monograph and quality control test for few of medicinal plants
used in the respective countries but basically these pharmacopoeia are designed to cater
to chemical based medicine and pharmaceutical necessities by giving their standards test
methods For pharmaceutical purpose the quality of medicinal plant materials must be as
high as that of other medicinal preparations However it is impossible to assay for
specific chemical entity when the bioactive ingredient is not known Further problem
posed by those preparations which contain heterogeneous mixtures Directive on the
analytical control of vegetable drug must take account of the fact that material to be
examined has complex and inconsistent composition Therefore the analytical limits
cannot be as precise as for the pure chemical compound Vegetable drugs are inevitably
inconsistent because of their composition and hence the purity and authenticity of plant
material may be influenced by several factors such as age and origins harvesting period
method of drying and so on To eliminate some of the causes of inconsistency one
should use cultivated rather than wild plant which are often heterogeneous in respect of
the factors and consequently in their content of active principles Some problems facing
purity and authenticity of plant material of crude drugs include the confusion existing
over the identity of source material the impossibility to assay for a specific chemical
entity when the bioactive ingredient is not known and the problem posed by those
preparations which contain heterogeneous mixtures The purpose of purity and
authenticity of medicinal plant products is obviously to ensure therapeutic efficacy and to
check any adulteration or non-deliberate mixing in commercial batches [1] Following
protocol for purity and authenticity of raw material has been prepared
Chapter 5 Standardization
Md Sarfaraj Hussain Ph D Thesis (2013) Integral University 135
1 Authentication
2 Preliminary Phytochemical Screening
3 fluorescence analysis
4 Foreign matter
5 Ash value
Total ash
Acid insoluble ash
Water soluble ash
6 Extractive value
Alcohal soluble extractive value
Water soluble extractive
7 Loss on drying
8 Chromatographic profiles
9 Qunatitative estimation of phytoconstituents
Total phenol content
Total flavonoids content
Total proanthocyanidin content
Total saponin content
Total alkaloidal content
Chapter 5 Standardization
Md Sarfaraj Hussain Ph D Thesis (2013) Integral University 136
52 EXPERIMENTAL
MATERIALS amp METHODS
Collection and authentication of plant material
The fresh plants of Abutilon indicum Hygrophila auriculata and Trichosanthes dioica
were collected from the field area of Baryahi Saharsa District Bihar India in January
and May 2009 The plant specimens were authenticated by Prof (Dr) Anjani Kumar
Sinha Principal M L T Saharsa College Saharsa Bihar A voucher specimen no SHC
55012009 560509 and 570509 has been deposited at the herbarium Department of
Botany M L T Saharsa College Saharsa- 852201
Preparation of extract
The plants A indicum H auriculata and T dioica were air-dried and powdered 500 g of
the powdered material were packed in muslin cloth and subjected to soxhlet extractor for
continuous hot extraction with methanol for 72 hrs separately Thereafter methanolic
extracts of each plants were filtered through Whatman paper no 42 and the resultant
filtrates were concentrated under reduced pressure and finally vacuum dried The yields
of the methanolic extract were 132 173 and 143 ww respectively
Preliminary phytochemical screening
The preliminary phytochemical screening was carried out using different plant extracts
for their content of different classes of compounds The extract obtained then subjected to
qualitative chemical tests for identification of various plant constituents present in the
crude drug The extract should be subjected to preliminary phytochemical investigation
for detection of following [2-5]
Alkaloids
Carbohydrates
Glycosides
Phenolic compounds
Flavonoids
Protein and amino acids
Chapter 5 Standardization
Md Sarfaraj Hussain Ph D Thesis (2013) Integral University 137
Saponins
Sterols
Acidic compounds
Mucilage
Resins
LipidsFats
Tests for alkaloids
Each of the extract were taken separately in 5 ml of 15 hydrochloric acid and Filtered
The filtrate was then tested with following reagents
a) Dragendorffrsquos reagent
Few drop of dragendroff‟s reagent (potassium iodide+ bismuth nitrate) were
added in each of the extract and observed for formation of orange yellow
precipitate
b) Hagerrsquos reagent
Few drops of Hager‟s reagent (a saturated solution of picric acid in cold water)
were added in extract and observed for the formation of yellow precipitate
c) Wagnerrsquos reagent
Few drops of Wagner‟s reagent (iodine solution) were added in extract and
observed for formation of precipitate
d) Mayerrsquos reagent
Few drops of Mayer‟s reagent (potassium mercuric iodide solution) were added in
extract and observed for formation of white or cream colored precipitate
Test for Carbohydrates
a) Molisch test
Small quantities of alcoholic and aqueous extracts were dissolved separately in 5
ml of distilled water and filtered To this solution 2-3 drops of α-naphthol
Chapter 5 Standardization
Md Sarfaraj Hussain Ph D Thesis (2013) Integral University 138
solutions were added followed by about 1ml of concentrated sulphuric acid along
the sides of inclined test tube so as to form two layers and observed for formation
of violet colored ring at the interface
b) Fehling reagent (Detection of reducing sugar)
Few drops of Fehling solution (alkaline solution of cupric ion complexed with
tartrate ion) were added in dilute extracts and heated for 30 minutes and observed
for formation of brink red colored precipitate
Test for Glycosides
About 2 ml of methanolic extract were taken amp subjected to following tests
a) Killer-Killani test
One ml of glacial acetic acid containing traces of ferric chloride and one ml of
concentrated sulphuric acid were added to the extract and observed for formation
of reddish brown color at the junction of two layers and the upper layer turned
bluish green in presence of glycoside
b) Borntragerrsquos test
One ml of benzene and 05 ml of dilute ammonia solution were added to the
methanolic extract and observed for formation of reddish pink color
c) Legal test
Concentrated methanolic extract was made alkaline with few drops of 10
sodium hydroxide solution and then freshly prepared sodium nitroprusside
solution were added to the solution and observed for the formation of blue color
d) Baljet test
To the concentrated methanolic extract sodium picrate reagent were added and
observed for the formation of orange and yellow color
Test for phenolic compounds
a) Ferric chloride solution
The extracts were taken in water and warmed to this 2ml of ferric chloride
solution was added and observed for the formation of green and blue color
Chapter 5 Standardization
Md Sarfaraj Hussain Ph D Thesis (2013) Integral University 139
b) Lead acetate solution
To the extract (2 ml) lead acetate solution was added and observed for the
formation of precipitate
c) Gelatin solution
A few ml of Gelatin Solution was added to the aqueous extract and observed for
the formation of precipitate or turbidity
Test for flavonoids
a) Ammonia test
Filter paper strips were dipped in alcoholic solution of extract ammoniated and
observed for color change from white to yellow
b) Shinoda test
A small quantity of extract was dissolved in 5 ml of ethanol and treated with few
drops of concentrated hydrochloric acid 05 gm of magnesium turning and
observed for the formation of pink color
Test for protein and amino acids
a) MillIonrsquos test
To a few ml of methanolic extract 5 ml of distilled water was added and filtered
To two ml of this filtrate 5-6 drops of Million‟s reagent (Solution of mercury
nitrate and nitrous acid) were added and observed for the formation of red
precipitate
b) Xanthoprotein test
To 2 ml of extract few drops of nitric acid were added by the sides of test tube and
observed for formation of yellow color
c) Biuret test
To the ammoniated alkaline filtrate of the extract 2-4 drops of 002 copper
sulphate solution were added and observed for the formation of red and violet
colour
Chapter 5 Standardization
Md Sarfaraj Hussain Ph D Thesis (2013) Integral University 140
d) Ninhydrine test
To the extract lead acetate solution was added to precipitate tannins The
precipitate was spotted on a paper chromatogram sprayed with ninhydrin reagent
and heated at 110 degC for 5 minutes and observed for the formation of red and
violet colour
Test for Saponins
a) Foam test
Few mg of residue was taken in test tube with small amount of water and shaken
vigorously for one minute and observed for formation of rich lather which was
stable for more than ten minutes To the alcoholic extract few drops of sodium
bicarbonate were added shaken well and observed for formation of Honeycomb
like frothing
Test for Sterols
The methanolic extract was evaporated to dryness and the residue was extracted with
petroleum ether and acetone The insoluble residue left after extraction with
petroleum ether amp acetone was tested for sterols as
a) Salkowski reaction
To the extract two ml of concentrated sulphuric acid were added amp observed for
formation of yellow ring at the junction which turns red after one minute
b) Herchersquos reaction
To the residue 2-3 ml of trichloroacetic acid were added heated and observed for
the formation of red and violet color
c) Libermann - Burchards reaction
To a few mg of the residue in a test ndash tube few ml of acetic anhydride was added
and gently heated The contents of the test ndash tube were cooled Few drops of
concentrated sulphuric acid were added from the side of the test ndash tube A blue
colour gave the evidence of presence of sterols
Chapter 5 Standardization
Md Sarfaraj Hussain Ph D Thesis (2013) Integral University 141
Test for terpenoids
Nollers test
A few mg of extract is taken in a dry test tube and is treated with a bit of tin foil and 05
ml of thionyl chloride It is heated gently if necessary The formation of pink colour
shows the presence of terpenoids
Test for acidic compounds
a) To the methanolic extract sodium bicarbonate solution was added and observed
for the production of effervescence
b) A small amount of alcoholic extract was taken in warm water and filtered The
filtrate was then tested with litmus paper and methyl orange and observed for
appearance of blue color
Test for Mucilage
The extract was heated with ruthenium red solution in lead acetate and observed
for the formation of pink color
Test for Resins
a) Distilled water (50 ml) was added to the extract and observed for turbidity
b) A mixture of extract in acetone (3 ml) and HCl (3 ml) was heated on a water
bath for 30 minutes and observed for pink color
Fluorescence analysis
Many herbs fluoresce when cut surface or powder is exposed to UV light and this can
help in their identification The powder drug was treated with different reagents and was
examined under UV light (254 and 366 nm) [6 7]
Ash value
Ash value is an important parameter for the purpose of evaluation of crude drugs The ash
of any organic material is composed of their non-volatile inorganic components The ash
remaining following ignition of medicinal plant materials is determined by three different
methods which measure total ash acid-insoluble ash and water-soluble ash [8 9]
Chapter 5 Standardization
Md Sarfaraj Hussain Ph D Thesis (2013) Integral University 142
Total ash
1 The total ash is designed to measure the total amount of material remaining
after ignition
2 Indian pharmacopoeia 1996 and WHO prescribes suitable methods for
determination of ash values
3 About 2-3 gm of air dried crude drug was placed in the tarred platinum or
silica dish and was incinerated at a temperature not exceeding 450 degC until
free from carbon cooled and weighed to get the total ash content
Acid insoluble ash
1 Acid insoluble ash is the residue obtained after boiling the total ash with dilute
hydrochloric acid and igniting the remaining insoluble matter This measures
the amount of silica present especially as sand and siliceous earth
2 Ash was boiled with 25 ml of hydrochloric acid for 5 minutes The insoluble
matter was collected on ash less filter paper washed with hot water and
ignited at a temperature not exceeding 450 oC to a constant weight
Water soluble ash
Water soluble ash is the difference in weight between the total ash and the
residue after treatment of total ash with water It is a good indicator of either
previous extraction of water-soluble salts in the drug or in corrected
preparation Ash was dissolved in distilled water and the insoluble part
collected on an ash less filter paper and was ignited at 450 0C to a constant
weight By subtracting the weight of insoluble part from that of ash the
weight of the soluble part of ash was obtained
Extractive value
This method determines the amount of active constituents extracted with solvents
from a given amount of medicinal plant material According to Indian Pharmacopoeia
1996 British Pharmacopoeia 1980 and WHO guideline the determination of water
soluble and alcohol soluble extractives is used as a means of evaluating crude drugs
which are not readily estimated by other means The extraction of any crude drug
with particular solvent yields a solution containing different phyto-constituents that‟s
Chapter 5 Standardization
Md Sarfaraj Hussain Ph D Thesis (2013) Integral University 143
why such extractive value provide an indication of the extent of polar medium polar
and non polar components present in the plant material [8 9]
Loss on drying
This parameter determines the amount of moisture as well as volatile components
present in a particular sample The powdered drug sample (10 gm) was placed on
a tarred evaporating dish and dried at 105 degC for 6 hours and weighed The drying
was continued until two successive reading matches each other or the difference
between two successive weighing was not more than 025 of constant weight
[10]
Foreign matter
It is the matter present in the drug Its presence may be due to faulty collection of
crude drug or due to deliberate mixing It is separated from the drug so that results
obtained from analysis of the drug gives accuracy Its percentage in the crude
drug is calculated [11]
Determination of total phenolic content
Reagents -10 FC reagent in distilled water Na2CO3 (1 M) in distilled water
and Standard (Gallic acid) 1mgml solution in methanol was prepared Different
dilutions of standard gallic acid (25 μg ml to 300 μg ml) was made in methanol
Samples preparation ndash Prepared 10 mgml solution of drug in methanol
followed by addition of 5 ml FC reagent and 4 ml Na2CO3 solution Absorbance
was taken at 765 nm after 15 minutes
Preparation of standard- 05 ml of each std dilutions was taken and added 5 ml
FC reagent and 4 ml Na2CO3 solution Absorbance was taken at 765 nm after 15
minutes
Blank solutionndash Take 05 ml methanol and 5 ml FC reagent to this add 4 ml
Na2CO3 solution
Chapter 5 Standardization
Md Sarfaraj Hussain Ph D Thesis (2013) Integral University 144
After taking the absorbance of standard dilutions as mentioned above calibration
curve was plotted (Fig 51) Phenolic contents in drug were calculated by using
standard calibration [12]
Determination of total flavonoid content
Reagents- AlCl3 (01 gmml) and CH3COONa (1M) were prepared Prepared
dilutions for quercetin (standard) from 10 μg ml to 100 μgml
Samples preparationndash 10 mgml solution of drug was prepared in methanol05
ml of solution was taken and added 15 ml methanol added To this 01 ml of
AlCl3 01 ml of CH3COONa reagents and 28 ml distilled water were added and
kept for 30 minutes After that absorbance was taken at 415 nm
Preparation of Standardndash 05 ml of standard dilution of quercetin were taken
and 15 ml methanol added To this added 01 ml of AlCl3 and 01 ml of
CH3COONa reagents were mixed followed by 28 ml distilled water and kept for
30 minutes after that absorbance was taken at 415 nm
Blank solutions- To 2 ml of methanol 01 ml of AlCl3 + 01 ml of CH3COONa
reagents and 28 ml distilled water were added
After taking the absorbance of standard dilutions as mentioned above calibration
curve was plotted (Fig 52) Flavonoidal contents in drug were calculated by
using standard calibration curve [13]
Determination of total proanthocyanidins contents
Contents of proanthocyanidins were determined by the procedure of Sun et al
1998 Five hundred microliters of extract and different fractions solution were
mixed with 3 mL of 4 vanillinndashmethanol solution and 15 mL hydrochloric acid
The mixture was allowed to stand for 15 min The absorbance was measured at
500 nm while the final result was expressed as mg catechin equivalent (CE)g dry
basis [14]
Chapter 5 Standardization
Md Sarfaraj Hussain Ph D Thesis (2013) Integral University 145
Determination of total saponins content
The method used was that of Obadoni and Ochuko (2001) The samples were
ground and 20 g of each were put into a conical flask and 100 ml of 20 aqueous
ethanol were added The samples were heated over a hot water bath for 4 h with
continuous stirring at about 55 degC The mixture was filtered and the residue re-
extracted with another 200 ml 20 ethanol The combined extracts were reduced
to 40 ml over water bath at about 90degC The concentrate was transferred into a
250 ml separatory funnel and 20 ml of diethyl ether was added and shaken
vigorously The aqueous layer was recovered while the ether layer was discarded
The purification process was repeated 60 ml of n-butanol were added The
combined n-butanol extracts were washed twice with 10 ml of 5 aqueous
sodium chloride The remaining solution was heated in a water bath After
evaporation the samples were dried in the oven to a constant weight the saponin
content was calculated as percentage [15]
Determination of Total alkaloidal content
5 g of the sample were weighed into a 250 ml beaker and 200 ml of 10 acetic
acid in ethanol were added and covered and allowed to stand for 4 h This was
filtered and the extract was concentrated on a water bath to one-quarter of the
original volume Concentrated ammonium hydroxide was added dropwise to the
extract until the precipitation was complete The whole solution was allowed to
settle and the precipitated was collected and washed with dilute ammonium
hydroxide and then filtered The residue is the alkaloid which was dried and
weighed [16]
Thin Layer Chromatography (TLC profile)
The plant drug extracts were subjected to thin layer chromatography to find out the
number of compounds present in them The detail of the procedure followed is given
below
Chapter 5 Standardization
Md Sarfaraj Hussain Ph D Thesis (2013) Integral University 146
Preparation of the plates
The adsorbent used for thin layer chromatography was silica gel G 25 g of silica gel G
were taken in a glass mortar and about 35 ml of distilled water was added to it The
mixture was stirred with glass rod until it became homogeneous This mixture was then
allowed to swell for about 15 minutes Then an additional 15 ml of distilled water was
added to it with stirring The suspension was then transferred to a 150 ml flask fitting
with a plastic stopper and was shaken vigorously for about 2 minutes This suspension
was then spread immediately on thin layer chromatographic plates with the help of a thin
layer chromatography (TLC) applicator (SUPERFIT) of continental instruments
Bombay
Drying and storage of the plates
The freshly coated plates were then air dried until the transparence of the layer had
disappeared The plates were then stacked in a drying rack and were heated in an oven for
30 min at 110 0C The activated plates were kept in a desiccator till required for further
use
Application of the sample
For applying test samples on TLC plate glass capillaries were used The spots were
applied with the help of a transparent template keeping a minimum distance of 1 cm
between the two adjacent spots The spots of the samples were marked on the top of the
plate to know their identity
Chromatographic chamber conditions of saturation and the development of TLC
plates
Chromatographic rectangular glass chamber (165cm x 295cm) was used in the
experiments To avoid insufficient chamber saturation and the undesirable edge effect a
smooth sheet of filter paper approximately of 15 x 40 cm size was placed in the
chromatographic chamber in a bdquoU‟ shape and was allowed to be soaked in the developing
solvent After being thus moistened the paper was then pressed against the walls of the
chamber so that it adhered to the walls The experiments were carried out at room
temperature in diffused daylight
Chapter 5 Standardization
Md Sarfaraj Hussain Ph D Thesis (2013) Integral University 147
Spraying equipments
Compressed air sprayer with a fine nozzle was used to detect the different constituents
present on TLC plates Air compressor was attached to a glass sprayer The sprayer was
filled with about 50 ml of the detecting reagent and then used After each spray the
sprayer was washed separately with water chromic acid and distilled water and then
with acetone [17]
HIGH PERFORMANCE THIN LAYER CHROMATOGRAPHY
High performance thin layer chromatography (HPTLC) is a modern powerful analytical
technique with separation power performance and reproducibility superior to class TLC
HPTLC is still a better means to separate the various components of a mixture HPTLC is
rapidly gaining importance in biochemistry of natural products and in analysis of bio-
fluid in the field of pharmacokinetics The analytical profiles for carotenoids tropane
alkaloids flavonoids steroidal compounds anthracene aglycones and lipids have been
developed by using this technique TLCHPTLC technique is applied for the compilation
of profiles pertaining to varied range of bioconstituents such as berberine quinine and
related alkaloids opium alkaloids and eugenols [18]
For analysis of herbal drugs HPTLC offers a number of advantages the technique is
especially suitable for comparison of sample based on finger prints Fingerprint analysis
by HPTLC is one of the most powerful tools to link the botanical identity to the chemical
constituent‟s profile of the plants In combination with the microscopic investigations the
fingerprint provides the means for a convenient identity check It can be used to detect
adulteration in raw materials From the constituents profile a number of marker
compounds can be chosen which might be used to further describe the quality of the herb
or herbal preparation High performance thin layer chromatography can also be employed
for quantitative determination of such marker compounds
The production of most herbal preparation includes some extraction process It is
essential for quality assurance that this extraction is standardized The quantity of marker
compounds of their relative abundance assayed by HPTLC or HPLC is the principal
method of monitoring the production process When choosing marker compounds for a
particular herb or herbal preparation it is of critical importance that chemically well-
Chapter 5 Standardization
Md Sarfaraj Hussain Ph D Thesis (2013) Integral University 148
characterized standards are available for their quantification It is often impossible to
separate all components of a plant extract completely Therefore it must be proven with
an independent method that a given marker compound in the extract is not condasheluting
with any other substance Thus HPTLC is now a day applied to obtain fingerprint pattern
of herbal formulations quantification of active ingredients and also detection of
adulteration
Principle
High performance thin layer chromatography enables the most complicated separations
The HPTLC plates are prepared from optimized (eg particle size and particle size
distribution) absorbent layers and extremely even surfaces These plates offer greater
separation efficacy through smaller plate heights than the conventional TLC plates
Shorter analysis time detection limits in nanogram with UV absorption detection and in
pictogram range with fluorimetric detection are some additional advantages with these
plates The greater efficacy of these plates is demonstrated by fact that they can provide
typically about 4000 theoretical plates over a distance of 3 cm in ten minutes compared
with 2000 theoretical plates over 12 cm in 25 minutes for conventional TLC plates [19-
21] There are three main steps of TLC procedure (1) the samples to be analyzed are
applied to the chromatogram layer Volume precision and exact positioning are ensured
by the use of a suitable instrument (2) the solvent (mobile phase) migrates the planned
distance in the layer (stationary phase) by capillary action In the process the sample is
separated into its components After evaporation of the mobile phase the fraction remains
stored on the layer and (3) the separating track are scanned in the densitometer either in
the light beam in the visible or UV range of the spectrum Absorbance or florescence is
measured by the diffused reflectance
Steps involved in HPTLC
o Selection of chromatographic layer
o Sample and standard preparation
o Layer pre-washing
o Layer pre-conditioning
Chapter 5 Standardization
Md Sarfaraj Hussain Ph D Thesis (2013) Integral University 149
o Application of the sample and standard
o Chromatographic development
o Detection of the spots
o Scanning and documentation of chromatographic plates
53 QUANTITATIVE ESTIMATION OF BIOACTIVE
PHYTOPHARMACEUTICALS BY HPTLC METHOD
HPTLC is one of the most widely used modern sophisticated and automated form of
separation technique to establish reference fingerprints of herbs against which raw
materials can be evaluated and finished products can be assayed HPTLC provides the
means for not only for flexible screening procedures and qualitative analysis but also for
demanding quantitative determinations
531 Development and validation of HPTLC method for simultaneous estimation of
bioactive ldquoLupeol and Stigmasterolrdquo and ldquoQuercetin and Gallic acidrdquo in
methanolic extracts of A indicum H auriculata and T dioica separately
EXPERIMENTAL WORK
Materials and Equipments
Materials
Lupeol Natural Remedies Bangalore
Stigmasterol Natural Remedies Bangalore
Quercetin Natural Remedies Bangalore
Gallic acid Natural Remedies Bangalore
Ammonia Merck Ltd Mumbai
Acetone Merck Ltd Mumbai
Ethyl acetate Merck Ltd Mumbai
Methanol Merck Ltd Mumbai
Ethanol Merck Ltd Mumbai
Formic acid SD fine Chem Ltd Mumbai
Toluene SD fine Chem Ltd Mumbai
Chapter 5 Standardization
Md Sarfaraj Hussain Ph D Thesis (2013) Integral University 150
Diethyl ether SD fine Chem Ltd Mumbai
Chloroform
Acetonitrile
Merck Ltd Mumbai
Sisco Research Lab Ltd Mumbai
Dicholoromethane SD fine chem Ltd Mumbai
Acetic acid Merck India Ltd Mumbai
n-Hexane Merck India Ltd Mumbai
Equipments
Double beam UV spectrophotometer 1601 Shimadzu Japan
Melting point apparatus Remi equipments India
pH meter ndash HI84240 Microconm Italy
Stability oven Nirmal International India
Electronic balance Sartorious India
Micropippetes Tarsons India
Incubator Scientific laboratory India
Magnetic stirrer Metrex Delhi
Centrifuge Remi equipments Delhi
Deep freezer Westfrost India
Vortex mixer Nirmal international India
Viscometer Brookfield DV III ultra V60 RV
cone and plate rheometer
HPTLC
Applicator CAMAG Linomat V Switzerland
Scanner CAMAG TLC Scanner III
Switzerland
Pre-coated HPTLC plates E Merck India ltd Germany
Description of plate used
Sorbent Silica Gel 60
Support Aluminium sheets
Chapter 5 Standardization
Md Sarfaraj Hussain Ph D Thesis (2013) Integral University 151
Layer thickness 200 m
Pore size (nm) 6
Pore vol (mlg) 08
Particle size distribution (m) 4-8
Plate size 20 x 20 cm
F254 Fluroscent indicator
Preparation of standard and quality control (QC) samples
Stock solutions of standards Lupeol (LP) Stigmasterol (ST) Quercetin (QE) and Gallic
acid (GA) (10 mg mLminus1
) were separately prepared in methanol and dilutions were made
in the concentration range of 01 to 10 mg mLminus1
For calibration LP standard solution
(1-10 μL) was applied to a HPTLC plate to furnish amounts in the range 100ndash1000 ng
band-1
ST standard solution (05-5 μL) was applied to furnish amounts in the range 50ndash
500 ng band-1
Gallic acid (GA) standard solution (1-10 μL) was applied to a HPTLC
plate to furnish amounts in the range 100ndash1000 ng band-1
however Quercetin (QE)
standard solution (05-5 μL) was applied to furnish amounts in the range 150ndash900 ng
band-1
Peak area and amounts applied were treated by linear least-squares regression
Each amount was applied six times QC samples as low medium and high at
concentration level of 200 400 and 800 ng band-1
were taken for LP and 100 200 and
400 for ST and 150 300 and 600 ng band-1
were taken for Gallic acid (GA) and 200 400
and 800 were considered for Quercetin (QE) to carry out validation of the method
Chromatography
Chromatography was performed as described previously [22-26] on 20 cm times 10 cm
aluminum Lichrosphere HPTLC plates precoated with 200-μm layers of silica gel 60F254
(E Merck Darmstadt Germany) Samples were applied as bands 6 mm wide and 10 mm
apart by means of Camag (Muttenz Switzerland) Linomat V sample applicator equipped
with a 100-μL syringe The constant application rate was 160 nL sminus1
Linear ascending
development with toluenendashmethanolndashformic acid (702703 vvv) for LP and ST and
Chapter 5 Standardization
Md Sarfaraj Hussain Ph D Thesis (2013) Integral University 152
toulene ethyl acetate formic acid (541 vvv) for QE and GA as mobile phase was
performed in a 20 cm times 10 cm twin-trough glass chamber (Camag) previously saturated
with mobile phase for 15 min at room temperature (25plusmn2degC) and relative humidity
60plusmn5 The development distance was 8 cm (development time 10 min) and 20 mL
mobile phase was used The plates were dried at room temperature in air and derivatized
with anisaldehyde-sulphuric acid reagent for LP and ST and warmed (at 75degC for 5 min)
to identify compact bands Densitometric analysis for LP and ST was performed at 530
nm and 270 nm for QE and GA in reflectance mode with a Camag TLC scanner III
operated by WinCATS software (Version 120) The slit dimensions were 5 mm times 045
mm and the scanning speed of 20 mm sminus1
HPTLC-UV530nm fingerprinting and image analysis
The protocol for preparing sample solutions was optimized for high quality fingerprinting
and also to extract the marker compounds efficiently Since the marker compounds were
soluble in methanol therefore methanol was used for extraction The fingerprinting of
methanolic extracts of A indicum H auriculata and T dioica were executed by spotting
10 microL of suitably diluted sample solution of the methanolic extract of each plant on a
HPTLC plate Each amount was applied six times Peak area and amounts applied were
treated by linear least-squares regression The plates were developed and scanned as
same discussed above The peak areas were recorded and the amount of ST and LP and
QE and GA were calculated using the calibration curve respectively
Method validation
Validation of the developed method has been carried out as per ICH guidelines for
linearity range precision accuracy limits of detection (LOD) and quantification (LOQ)
and recovery
a) Precision and accuracy
Precision (inter and intraday) and accuracy of the assay were evaluated by performing
replicate analyses (n=6) of QC samples at low medium and high QC levels of 200 400
and 800 ng band-1
for LP 100 200 and 400 ng band-1
for ST and 150 300 and 600 ng
band-1
for GA and 200 400 and 800 ng band-1
for QE respectively Inter-day precision
Chapter 5 Standardization
Md Sarfaraj Hussain Ph D Thesis (2013) Integral University 153
and accuracy were determined by repeating the intra-day assay on three different days
Precision was expressed as the coefficient of variation (CV ) of measured
concentrations for each calibration level whereas accuracy was expressed as percentage
recovery [(Drug founddrug applied) times 100]
b) Robustness
Robustness was studied in triplicate at 400 ng bandminus1
by making small changes to mobile
phase composition mobile phase volume and duration of mobile phase saturation and
activation of TLC plates the effect on the results were examined by calculation of RSD
() and SE of peak areas Mobile phases prepared from toluenendashmethanolndashformic acid in
different proportions (65 32 03 vvv 68 29 03 vvv 72 25 03 vvv and 70
27 03 vvv) keeping the volume formic acid constant were used for chromatography
for LP and ST and for QE and GA toluene ethyl acetate formic acid (541 vvv) in
different proportions (55351 vvv 54505 vvv 55405 vvv and 631 vvv)
were used separately for chromatography Mobile phase volume and duration of
saturation investigated were 20 plusmn 2 mL (18 20 and 22 mL) and 20 plusmn 10 min (10 20 and
30 min) respectively The plates were activated at 60 plusmn 5degC for 2 5 and 7 min before
chromatography
c) Sensitivity
To estimate the limits of detection (LOD) and quantification (LOQ) blank methanol was
applied six times and the standard deviation (σ) of the analytical response was
determined The LOD was expressed as 3σslope of the calibration plot and LOQ was
expressed as 10σslope of the calibration plot
d) Recovery studies
Recovery was studied by applying the method to drug samples to which known amounts
of marker corresponding to 50 100 and 150 of the LP or ST and QE and GA had been
added Each level was analyzed in triplicates This was to check the recovery of LP or ST
and QE and GA at different levels in the extracts Recovery of the markers at different
levels in the samples was determined
Chapter 5 Standardization
Md Sarfaraj Hussain Ph D Thesis (2013) Integral University 154
54 RESULT AND DISCUSSION
Preliminary phytochemical screening
Result The results of preliminary phytochemical investigation are summarized in Table
52 for A indicum H auriculata and T diocia
Table 51 Phytochemical Screening of A indicum Hauriculata and T dioica
SNo Constituents A indicum H auriculata T dioica
1 Alkaloids + + +
2 Carbohydrates + + -
3 Glycosides + + +
4 Phenolic compounds and tannins + + +
5 Flavonoids + + +
6 Terpenoids + + +
7 Saponins + + +
8 Sterols + + +
9 Proteins _ - +
10 Resins + - -
11 Lipids Fats - - -
12 Mucilage - - -
+ = Present - = Absent
Chapter 5 Standardization
Md Sarfaraj Hussain Ph D Thesis (2013) Integral University 155
Fluorescence analysis
Result The result of Fluorescence analysis for A indicum H auriculata and T diocia
are tabulated in Tables 52 53 and 54 respectively
Table 52 Flourescence analysis of A indicum
Solvent used Day light U V light
254 nm 366 nm
Powder as such Light green Green colour Green colour
1N HCl Dark green Green colour Cream colour
50 HCl Light green Green colour Dark green
50HNO3 Dark green Light green Buff colour
50H2SO4 Blackish brown Slight green Light green
1N NaOH Light yellow Greenish brown Moderate green
Alcoholic NaOH Light green Green colour Dark green
Methanol Light green Dark green Green colour
Benzene Yellow Slight buff Green colour
FeCl3 Brownish yellow Light green Green colour
1 KOH Light greenish Green Dark green
Lead acetate White White Florescent white
Distilled water Clear Green Green colour
Powder as such Light green Green colour Green colour
1N HCl Dark green Green colour Cream colour
Chapter 5 Standardization
Md Sarfaraj Hussain Ph D Thesis (2013) Integral University 156
Table 53 Flourescence analysis of H auriculata
Solvent used Day light U V light
254 nm 366 nm
Powder as such Light brown Light green Green
1N HCl Light green Green colour Dark green
50 HCl Light green Green colour Dark green
50HNO3 Light brown Dark green Blackish green
50H2SO4 Slightly red Slight green Light green
1N NaOH Light yellow Dark green Moderate green
Alcoholic NaOH Light green Green colour Dark green
Methanol Light green Dark green Slightly pink
Benzene Yellow Slight buff Green
Ethyl acetate Light brown Dark green Light yellow
FeCl3 Brownish yellow White Green
1 KOH Brown Green Dark green
Lead acetate White Florescent white White
Distilled water Clear Green Green
Chapter 5 Standardization
Md Sarfaraj Hussain Ph D Thesis (2013) Integral University 157
Table 54 Flourescence analysis of T dioica
Solvent used Day light U V light
254 nm 366 nm
Powder as such Dark green Slight green Blackish green
1N HCl Greenish brown Brownish green Dark green
50 HCl Light green Green colour Dark green
50HNO3 Green Brownish green Blackish green
50H2SO4 Slightly green Brownish green Light green
1N NaOH Light yellow Green colour Moderate green
Alcoholic NaOH Light green Green colour Dark green
Methanol Light green Dark green Dark green
Benzene Slightly yellow Slight buff Green
FeCl3 Brownish yellow White Green
1 KOH Brownish black Light buff Dark green
Lead acetate White Florescent white White
Distilled water Clear Green Green
Powder as such Dark green Slight green Blackish green
1N HCl Greenish brown Brownish green Dark green
Chapter 5 Standardization
Md Sarfaraj Hussain Ph D Thesis (2013) Integral University 158
Ash Value
Result The results of ash value of A indicum H auriculata and T diocia are
mentioned in Tables 55 56 and 57 respectively
Table 55 Ash value of A indicum
S No Total ash () Acid insoluble ash () Water soluble ash ()
1 95 28 865
2 95 27 865
3 93 27 860
Mean 943 273 863
Total ash acid insoluble and water soluble ash values of A indicum were found to be
943 273 and 863 ww respectively with respect to air-dried crude drug
Table 56 Ash value of H auriculata
S No Total ash () Acid insoluble ash () Water soluble ash ()
1 99 147 85
2 98 146 80
3 99 149 81
Mean 986 147 82
Total ash acid insoluble and water soluble ash values of H auriculata were found to be
986 147 and 820 ww respectively with respect to air-dried crude drug
Chapter 5 Standardization
Md Sarfaraj Hussain Ph D Thesis (2013) Integral University 159
Table 57 Ash value of T dioica
S No Total ash () Acid insoluble ash () Water soluble ash ()
1 655 171 798
2 665 185 795
3 665 175 795
Mean 661 177 796
Total ash acid insoluble and water soluble ash values of T dioica were found to be 661
177 and 796 ww respectively with respect to air-dried crude drug
Extractive value
Result Both alcohol soluble and water soluble extractive values of A indicum H
auriculata and T diocia have been determined and results are given in Tables 58 59
and 510 respectively
Table 58 Extractive values of A indicum
S No Alcohal soluble extractive () Water soluble extractive ()
1 352 114
2 352 112
3 360 112
Mean 352 112
Alcohal soluble and water soluble extractive values of A indicum were found to be 352
and 112 ww respectively
Chapter 5 Standardization
Md Sarfaraj Hussain Ph D Thesis (2013) Integral University 160
Table 59 Extractive values of H auriculata
S No Alcohal soluble extractive () Water soluble extractive ()
1 780 1680
2 796 1600
3 796 1620
Mean 790 1600
Alcohal soluble and water soluble extractive values of H auriculata were found to be
790 and160 ww respectively
Table 510 Extractive values of T dioica
S No Alcohal soluble extractive () Water soluble extractive ()
1 2232 2704
2 2192 2672
3 2224 2695
Mean 2216 2690
Alcohal soluble and water soluble extractive values of T dioica were found to be 2216
and 2690 ww respectively
Foreign matter
Result The results of foreign matter are given in Tables 511 512 and 513
respectively A indicum H auriculata and T diocia
Chapter 5 Standardization
Md Sarfaraj Hussain Ph D Thesis (2013) Integral University 161
Table 511 Foreign matter of A indicum
Wt of Crude
Drug (g)
Wt of drug after
removal of foreign
matter (g)
Wt of foreign
matter (g)
Foreign matter
()
10000 8390 0161 116
10000 8390 0161 116
10000 8390 0161 116
Mean 8390 0161 116
A indicum containing the foreign matter 116 ww
Table 512 Foreign matter of H auriculata
Wt of Crude
Drug (g)
Wt of drug after
removal of foreign
matter (g)
Wt of foreign
matter (g)
Foreign matter
()
10000 9890 0110 110
10000 9900 0100 100
10000 9850 0150 150
Mean 9880 0120 120
H auriculata containing the foreign matter 120 ww
Table 513 Foreign matter of T diocia
Wt of Crude
Drug (g)
Wt of drug after
removal of foreign
matter (g)
Wt of foreign
matter (g)
Foreign matter
()
10000 8520 0148 148
10000 8520 0148 148
10000 8520 0148 148
Mean 8520 0148 148
T diocia containing the foreign matter 148 ww
Chapter 5 Standardization
Md Sarfaraj Hussain Ph D Thesis (2013) Integral University 162
Loss on drying
Result The Loss on drying of A indicum H auriculata and T diocia have been
determined and results were given in Table 514 515 and 516 respectively
Table 514 Loss on drying in A indicum powder (10 gm)
Wt of drug + Petri
dish (Before drying)
(g) A
Wt of drug+Petri
dish (After drying)
(g) B
A-B
(g)
Loss on Drying ()
(ww)
5974 +10000
59740
59740
59740
0157
0157
0157
785
785
785
Mean 59740 0157 785
Moisture content of A indicum powder was found to be 785 ww
Table 515 Loss on drying in H auriculata powder (10 gm)
Wt of drug + Petri
dish (Before drying)
(g) A
Wt of drug+Petri
dish (After drying)
(g) B
A-B
(g)
Loss on Drying ()
(ww)
4174 +10000
51740
51740
51740
0630
0630
0627
630
630
627
Mean 51773 0629 630
Moisture content of H auriculata powder was found to be 630 ww
Table 516 Loss on drying in T dioica powder (10gm)
Wt of drug + Petri
dish (Before drying)
(g) A
Wt of drug+Petri
dish (After drying)
(g) B
A-B
(g)
Loss on Drying ()
(ww)
5974 +10000
69524
69524
69524
0216
0216
0216
785
785
785
Mean 69524 0216 785
Moisture content of T dioica powder was found to be 785 ww
Chapter 5 Standardization
Md Sarfaraj Hussain Ph D Thesis (2013) Integral University 163
Total phenol content
Result The of Total phenolic content in the methanolic extract of A indicum H
auriculata and T diocia have been estimated and results were given in Tables 517 518
and 519
Figure 51 Calibration curve of gallic acid for total phenolic content
Table 517 Content of total phenolic in methanolic extract of A indicum
S No Absorbance Intercept Slope Conc (microgmL) Mean
1 0785 0004 0008 9810
9859 plusmn0255
2 0792 0004 0008 9871
3 0796 0004 0008 9896
Total phenolic content in the methanolic extract of Aindicum was found to be 9859
plusmn0255 microgmL
Table 518 Content of total phenolic in methanolic extract of H auriculata
S No Absorbance Intercept Slope Conc (microgmL) Mean
1 08032 0004 0008 10170
10111 plusmn72 2 07921 0004 0008 9967
3 08069 0004 0008 10197
Total phenolic content in the methanolic extract of H auriculata was found to be
10111plusmn072 microgmL
Chapter 5 Standardization
Md Sarfaraj Hussain Ph D Thesis (2013) Integral University 164
Table 519 Content of total phenolic in methanolic extract of T dioica
S No Absorbance Intercept Slope Conc (microgmL) Mean
1 08321 0004 0008 10531
10328 plusmn122 2 08034 0004 0008 10108
3 08219 0004 0008 10347
Total phenolic content in the methanolic extract of T dioica was found to be 10328
plusmn122microgmL
Total flavonoid content
Result The of Total flavonoidal content in the methanolic extract of A indicum H
auriculata and T diocia have been estimated and results were given in Tables 520 521
and 522 respectively
Figure 52 Calibration curve of quercetin for total flavonoid content
Chapter 5 Standardization
Md Sarfaraj Hussain Ph D Thesis (2013) Integral University 165
Table 520 Content of total flavonoids in methanolic extract of A indicum
S No Absorbance Intercept Slope Conc (microgml) Mean
1 0541 0079 0006 10333
10238plusmn1007 2 0534 0079 0006 10037
3 0543 0079 0006 10345
Total flavonoids content in the methanolic extract of A indicum was found to be
10238plusmn1007 microgmL
Table 521 Content of total flavonoids in methanolic extract of H auriculata
S No Absorbance Intercept Slope Conc (microgmL) Mean
1 05126 0079 0006 925
9719 plusmn 239 2 05341 0079 0006 10037
3 05213 0079 0006 9871
Total flavonoids content in the methanolic extract of H auriculata was found to be 9719
plusmn 239 microgmL
Table 522 Content of total flavonoids in methanolic extract of T dioica
S No Absorbance Intercept Slope Conc (microgmL) Mean
1 05636 0079 0006 10710
10890plusmn377 2 06219 0079 0006 11615
3 0543 0079 0006 10345
Total flavonoids content in the methanolic extract of T dioica was found to be
10890plusmn377microgmL
Chapter 5 Standardization
Md Sarfaraj Hussain Ph D Thesis (2013) Integral University 166
Total proanthocyanidin content
Result The of Total proanthocyanidin content in the methanolic extract of A indicum
H auriculata and T diocia have been estimated and results were given in Tables 523
524 and 525 respectively
Figure 53 Calibration curve of catechin for total proanthocyanidin content
Table 523 Content of total proanthocyanidin in methanolic extract of A indicum
S No Absorbance Intercept Slope Conc (microgmL) Mean
1 00629 0013 0004 1858
1902 plusmn 0012 2 00693 0013 0004 2032
3 00611 0013 0004 1817
Total proanthocyanidin content in the methanolic extract of A indicum was found to be
1902 plusmn 0012 microgmL
Table 524 Content of total proanthocyanidin in methanolic extract of Hauriculata
S No Absorbance Intercept Slope Conc (microgml) Mean
1 00521 0013 0004 1629
1677 plusmn 070 2 00517 0013 0004 1587
3 00610 0013 0004 1817
Total proanthocyanidin content in the methanolic extract of H auriculata was found to
be 1677 plusmn 070 microgmL
Chapter 5 Standardization
Md Sarfaraj Hussain Ph D Thesis (2013) Integral University 167
Table 525 Content of total proanthocyanidin in methanolic extract of T dioica
S No Absorbance Intercept Slope Conc (microgml) Mean
1 004293 0013 0004 1353
1267 plusmn 0430 2 003997 0013 0004 1232
3 003945 0013 0004 1217
Total proanthocyanidin content in the methanolic extract of T dioica was found to be
1267 plusmn 0430 microgmL
Total saponins content
Result The Total saponin of A indicum H auriculata and T diocia have been
estimated and results were given in Tables 526 527 and 528 respectively
Table 526 Total saponins content of A indicum
SNo Amount of drug
taken (g)
Amount of product
obtained (g)
Saponins content
( ww)
1 20 0367 183
2 20 0391 195
3 20 0378 189
Mean 189plusmn0034
Total saponin content in A indicum was found to be 189plusmn0034 ww
Table 527 Total saponins content of H auriculata
SNo Amount of drug
taken (g)
Amount of product
obtained (g)
Saponins content
( ww)
1 20 0158 079
2 20 0157 078
3 20 0161 080
Mean 079plusmn0057
Total saponin content in H auriculata was found to be 079plusmn0057 ww
Chapter 5 Standardization
Md Sarfaraj Hussain Ph D Thesis (2013) Integral University 168
Table 528 Total saponins content of Tdioica
SNo Amount of drug
taken (g)
Amount of product
obtained (g)
Saponins content
( ww)
1 20 0176 088
2 20 0177 088
3 20 0178 089
Mean 088plusmn0003
Total saponin content in T dioica was found to be 088plusmn0003 ww
Total alkaloidal content
Result The Total alkaloidal content of A indicum H auriculata and T diocia have
been estimated and results were given in Tables 529 530 and 531 respectively
Table 529 Total alkaloidal content of A indicum
SNo Amount of drug
taken (g)
Amount of product
obtained (g)
Alkaloidal content
( ww)
1 5 0123 246
2 5 0129 258
3 5 0128 256
Mean 253plusmn0037
Total alkaloidal content in Aindicum was found to be 253plusmn0037 ww
Table 530 Total alkaloidal content of H auriculata
SNo Amount of drug
taken (g)
Amount of product
obtained (g)
Alkaloidal content
( ww)
1 5 0135 270
2 5 0139 278
3 5 0143 286
Mean 278plusmn0046
Total alkaloidal content in H auriculata was found to be 278plusmn0046 ww
Chapter 5 Standardization
Md Sarfaraj Hussain Ph D Thesis (2013) Integral University 169
Table 531 Total alkaloidal content of T dioica
SNo Amount of drug
taken (g)
Amount of product
obtained (g)
Alkaloidal content
( ww)
1 5 0113 226
2 5 0112 224
3 5 0114 228
Mean 226plusmn0011
Total alkaloidal content in T dioica was found to be 226plusmn0011 ww
TLC profile
Table 532 TLC profile of the methanolic extract of A indicum
Extract Solvent system No of spots Rf values Visualizing
agent
Methanolic Dichloromethane
Methanol (9505)
08 024 026 029
034 041 052
062 070
1 Sulpuhric
acid in
methanol
Table 533 TLC profile of the methanolic extract of H auriculata
Extract Solvent system No of spots Rf values Visualizing
agent
Methanolic Dichloromethane
Methanol (9505)
07 027 033 039
051 062 076
084
1 Sulpuhric
acid in
methanol
Chapter 5 Standardization
Md Sarfaraj Hussain Ph D Thesis (2013) Integral University 170
Table 534 TLC profile of the methanolic extract of T dioica
Extract Solvent system No of spots Rf values Visualizing
agent
Methanolic Dichloromethane
Methanol (9505)
07 025 030 041
053 056 065
073
1 Sulpuhric
acid in
methanol
Development amp validation of HPTLC method for simultaneous estimation of
bioactive ldquoLupeol and Stigmasterolrdquo and ldquoQuercetin and Gallic acidrdquo in methanolic
extracts of H auriculata
Chromatography
Chromatogram were developed under chamber saturation conditions using toluenendash
methanolndashformic acid (702703 vvv) for LP and ST and toluene ethyl acetate
formic acid (541 vvv) for QE and GA as mobile phase or solvent system separately
(Fig 54 55 and 514 515) The both the mobile phases have been also employed for
the separation of methanolic extracts of A indicum H auriculata and T dioica
separately (Fig 58 510 512 and 514 515 516) The optimized saturation time was
found to be 10 min UV Densitometric analysis was performed at 530 nm for LP and ST
and 270 nm for QE and GA in the reflectance mode as HPTLC-UV Compact bands as
sharp symmetrical and with high resolution were obtained at RF 052plusmn002 and 028plusmn005
for LP and ST and RF 031plusmn002 and 050plusmn004 for QE and GA respectively (Fig 5) The
plates were visualized at different wavelengths 254 366 and 530 nm for LP and ST and
254 and 270 nm for QE and GA as the compounds were found to absorb at variable
spectrum range In addition this helped in the generating a better fingerprint data
whereby species could be well differentiated on enhanced visual identification of
individual compounds The methods developed here were found to be quite selective with
good baseline resolution of each compound (Fig 56 and 519) The identity of the bands
of compounds in the sample extracts was confirmed by overlaying their UV absorption
Chapter 5 Standardization
Md Sarfaraj Hussain Ph D Thesis (2013) Integral University 171
spectra with those of the standards at 530 nm and 270 nm separately (Tables 535 and
541)
Calibration
Linearity of compounds LP and ST and QE and GA was validated by the linear
regression equation and correlation coefficient The six-point calibration curves for LP
and ST were found to be linear in the range of 100-1000 ng bandminus1
and 50-500 ng bandminus1
for QE and GA were found to be linear in the range of 100ndash1000 ng bandminus1
and 150ndash900
ng bandminus1
separately Regression equation and correlation coefficient for the reference
compound were Y = 00059x (r2=09994) for LP and Y = 0013x -0037 for ST
(r2=09941) and Y=00048X+0012 (r
2=09991) for GA and Y=0033-0017 (r
2=09941)
for QE which revealed a good linearity response for developed method and are presented
in Tables 535 and 541 The mean values (plusmn sd) of the slope were 00059 plusmn 00008 and
0013plusmn0006 and intercept was zero and 0037 plusmn 0004 for LP and ST and 00048plusmn00003
and 0033plusmn0008 and intercept were 0012plusmn0007 and 0017plusmn0002 for GA and QE
respectively No significant difference was observed in the slopes of standard plots
(ANOVA P gt 005)
Method validation
a) Precision and accuracy
Intra-day and inter-day precision (as coefficient of variation CV) and accuracy of the
assay for LP and ST at three QC levels (200 400 and 800 ng band-1
) and (150 300 and
600 ng band-1
for GA and QE Intra-day precisions (n = 6) for LP and ST were le180
and le184 however the inter-day precisions were le218 and le191 and for GA and
QE intra-day precisions were le170 and le189 and the inter-day precisions were
le198 and le197 respectively which demonstrated the good precision of proposed
method Intra-day accuracy for LP and ST were 991ndash1002 and 975ndash1005 and
inter-day accuracy were 981ndash997 and 957ndash992 and intra-day accuracy for GA and
QE were 988ndash1000 and 987ndash1001 and inter-day accuracy were 994ndash997 and
988ndash998 of GA and QE respectively These values are within the acceptable range so
the method was accurate reliable and reproducible
Chapter 5 Standardization
Md Sarfaraj Hussain Ph D Thesis (2013) Integral University 172
b) Robustness
The SD and RSD was calculated for LP and ST and GA and QE separately The low
values of SD and RSD (˂2) were obtained after introducing small deliberate changes
in the method indicated that the method was robust (Table 538 and 544)
c) Sensitivity
LOD and LOQ values were 45 and 18 ng band-1
and 135 and 54 ng band-1
for LP and ST
and 23 and 41 ng band-1
and 69 and 123 ng band-1
for GA and QE respectively (Tables
536 and 542) indicating adequate assay sensitivity The LOD and LOQ were
determined from the slope of the lowest part of the calibration plot This indicated that
the proposed method exhibited a good sensitivity for the quantification of above
compounds
d) Recovery studies
Good recoveries were obtained by the fortification of the sample at three QC levels for
LP and ST The percent recoveries for both markers after sample processing and applying
were in the range of 982ndash997 (LP) and 972ndash996 (ST) and 994ndash999 (GA) and
987- 994 (QE) for as shown in Tables 539 and 545
HPTLC-UV530nm analysis of bioactive LP ST and GA QE in A indicum H
auriculata and T dioica extracts
The content of LP and ST and GA and QE was estimated in the A indicum H auriculata
and T dioica methanolic extracts by the proposed method and the results obtained are
summarized in tables 540 and 546 The percentage of LP and ST and GA and QE
obtained in the methanolic extract of each plant were given in tables 540 and 546
respectively with RSD It is for the first time a simple accurate and rapid HPTLC
method has been developed for the simultaneous quantification of bioactive compounds
in A indicum H auriculata and T dioica
Chapter 5 Standardization
Md Sarfaraj Hussain Ph D Thesis (2013) Integral University 173
Figure 54 Chromatogram of standard lupeol at RF 052
Figure 55 Chromatogram of standard stigmasterol at RF 028
Chapter 5 Standardization
Md Sarfaraj Hussain Ph D Thesis (2013) Integral University 174
Figure 56 Chromatogram of LP and ST simultaneously determined in methanolic
extract of each plant by using toluenendashmethanolndashformic acid (70 27 03 vvv) as
solvent system and scanned at 530 nm [LP (052) and ST (028)]
Figure 57 TLC image of methanolic extract of A indicum (Lanes 1ndash3) showing
superimposed tracks at of A indicum extracts at various concentrations
Chapter 5 Standardization
Md Sarfaraj Hussain Ph D Thesis (2013) Integral University 175
Figure 58 HPTLC chromatogram of methanolic extract of A indicum scanned at 530
nm [peak 1-11 LP (052) and ST (028)]
Figure 59 TLC image of methanolic extract of H auriculata (Lanes 1ndash3) showing
superimposed tracks at of HA extracts at various concentrations
Chapter 5 Standardization
Md Sarfaraj Hussain Ph D Thesis (2013) Integral University 176
Figure 510 HPTLC chromatogram of methanolic extract of H auriculata scanned at
530 nm [peak 1-9 LP (052) and ST (028)]
Figure 511 TLC image of methanolic extract of T dioica (Lanes 1ndash3) showing
superimposed tracks at of T dioica extracts at various concentrations
Chapter 5 Standardization
Md Sarfaraj Hussain Ph D Thesis (2013) Integral University 177
Figure 512 HPTLC chromatogram of methanolic extract of T dioica scanned at 530
nm [peak 1-10 LP (052) and ST (028)]
Table 535 TLC fingerprints (Rf value) of methanolic extracts of Aindicum H
auriculata and T dioica (
A Indicum H auriculata T dioica
014 013 011
024 022 019
028 (ST) 028 (ST) 028 (ST)
036 039 039
039 052 (LP) 045
045 059 052 (LP)
052 (LP) 064 065
066 069 069
085 078 078
091 - 087
094 - -
Solvent system toluenendashmethanolndashformic acid (702703 vvv)
Chapter 5 Standardization
Md Sarfaraj Hussain Ph D Thesis (2013) Integral University 178
Table 536 Rf linear regression data for the calibration curve and sensitivity parameter
for LP and ST
Parameter LP ST
RF 052 028
Linearity range (ng band-1
) 100ndash1000 50ndash500
Regression equation Y=00059X+0 Y=0013-0037
Correlation coefficient (r2) 09994 09941
Slopeplusmnsd 00059plusmn00008 0013plusmn0006
Interceptplusmnsd Nil 0037plusmn0004
Standard error of slope 00011 0003
Standard error of intercept - 0014
LOD 45 18
LOQ 135 54
Chapter 5 Standardization
Md Sarfaraj Hussain Ph D Thesis (2013) Integral University 179
Table 537 Precision and accuracy of the method
Lupeol Stigmasterol
Nominal
conca
Obtained
ab
Precision
c
Recoveryd
Nominal
conca
Obtained
ab
Precisionc
Recovery
d
Intraday batch
200 1983 180 991 100 975 173 975
400 3968 175 992 200 1986 184 993
800 8014 153 1001 400 4022 137 1005
Interday batch
200 1962 218 981 100 957 191 957
400 3928 186 982 200 1969 178 984
800 7983 170 997 400 3967 155 992
aConcentration in ng band
-1 b
Mean from six determinations (n=6) cPrecision as
coefficient of variation (CV ) = [(standard deviation)(concentration found)] times 100
dAccuracy () = [concentration found)(nominal concentration)] times 100
Chapter 5 Standardization
Md Sarfaraj Hussain Ph D Thesis (2013) Integral University 180
Table 538 Robustness of the method
Optimisation condition LP ST
SD RSD SD RSD
Mobile phase (toluenendashmethanolndashformic acid (65 32
03 vvv 68 29 03 vvv 72 25 03 vvv and
70 27 03 vvv)
163 152 159 135
Mobile-phase volume (18 20 and 22 mL) 138 127 112 098
Duration of saturation (10 20 and 30 min) 192 183 107 091
Activation of TLC plates (2 5 and 7 min) 119 108 143 122
Table 539 Recovery studies of LP and ST
Conc added
to analyte ()
Theoretical
(ng)
Added (ng) Detected
(ng)
Recovery () RSD ()
Lupeol
50
400
200 5893 982 192
100 400 7936 992 151
150 600 9968 997 149
Stigmasterol
50
200
100 2915 972 114
100 200 3952 988 189
150 300 4978 996 117
Chapter 5 Standardization
Md Sarfaraj Hussain Ph D Thesis (2013) Integral University 181
Table 540 LP and ST contents estimated in methanolic extract of A indicum H
auriculata and Tdioica by developed method
Plant Drug
Lupeol Stigmasterol
Content (ng spot-1
) RSD Content (ng spot-1
) RSD
A indicum 590 143 830 129
H auriculata 197 171 470 103
T dioica roxb 670 122 346 115
Volume applied in each replicate was ten microlitres
Figure 513 Display of all tracks of methanolic extract of A indicum H auriculata and
Tdioica at 270 nm
Chapter 5 Standardization
Md Sarfaraj Hussain Ph D Thesis (2013) Integral University 182
Figure 514 HPTLC chromatogram of standard gallic acid at RF 031
Figure 515 HPTLC chromatogram of standard Quercetin at RF 050
Chapter 5 Standardization
Md Sarfaraj Hussain Ph D Thesis (2013) Integral University 183
Figure 516 HPTLC chromatogram of methanolic extract of A indicum scanned at 270
nm [peak 1-15 GA (031) and QA (050)]
Figure 517 HPTLC chromatogram of methanolic extract of H auriculata scanned at
270 nm [peak 1-15 GA (031) and QA (050)]
Chapter 5 Standardization
Md Sarfaraj Hussain Ph D Thesis (2013) Integral University 184
Figure 518 HPTLC chromatogram of methanolic extract of T diocia scanned at 270
nm [peak 1-14 GA (031) and QA (050)]
Figure 519 Chromatogram of GA and QA simultaneously determined in by using
toluenendashethyl acetatendashformic acid (541 vvv) as solvent system scanned at 270 nm
[GA (031) and QA (050)]
Chapter 5 Standardization
Md Sarfaraj Hussain Ph D Thesis (2013) Integral University 185
Table 541 TLC fingerprints (RF value) of A Indicum H auriculata and T dioica
extracts at 270 nm for GA and QE
A Indicum H auriculata T dioica
001 003 003
006 006 015
010 010 023
015 014 028
019 020 031(GA)
023 023 037
031 (GA) 031 (GA) 046
037 043 050 (QE)
043 046 056
046 050 (QE) 065
050 (QE) 056 068
056 065 079
065 068 083
073 079 089
079 082 -
082 - -
Solvent system toluene ethyl acetate formic acid (541 vvv)
Chapter 5 Standardization
Md Sarfaraj Hussain Ph D Thesis (2013) Integral University 186
Table 542 Rf linear regression data for the calibration curve and sensitivity parameter
for gallic acid and quercetin
Parameters Gallic acid Quercetin
Rf 031 050
Linearity range (ng band-1
) 100ndash1000 150ndash900
Regression equation Y=00048X+0012 Y=0033-0017
Correlation coefficient (r2) 09991 09956
Slopeplusmnsd 00048plusmn00003 0033plusmn0008
Interceptplusmnsd 0012plusmn0007 0017plusmn0002
Standard error of slope 000017 00046
Standard error of intercept 00040 00011
LOD 23 41
LOQ 69 123
Table 543 Precision and accuracy of the method
Gallic acid Quercetin
Nominal
conca
Obtained
ab
Precision
c
Accuracy
d
Nominal
conca
Obtained
ab
Precisio
nc
Accuracy
d
Intraday batch
150 1483 170 988 200 1975 173 987
300 2991 165 997 400 3986 189 996
600 6004 155 1000 800 8013 137 1001
Interday batch
150 1492 198 994 200 1977 194 988
300 2998 176 999 400 3969 197 992
600 5983 170 997 800 7988 195 998
aConcentration in ng band
-1
bMean from six determinations (n=6)
cPrecision as
coefficient of variation (CV ) = [(standard deviation)(concentration found)] times 100
dAccuracy () = [concentration found)(nominal concentration)] times 100
Chapter 5 Standardization
Md Sarfaraj Hussain Ph D Thesis (2013) Integral University 187
Table 544 Robustness of the method
Optimisation condition Gallic acid Quercetin
SD RSD SD RSD
Mobile phase
(Toulene ethyl acetateformic acid 55351
vvv 54505 vvv 55405 vvv and
631 vvv)
179 182 191 165
Mobile-phase volume (18 20 and 22 mL) 125 177 162 089
Duration of saturation (10 20 and 30 min) 198 163 109 101
Activation of TLC plates (2 5 and 7 min) 189 178 153 122
Table 545 Recovery studies of gallic acid and quercetin
Concentration added
to analyte ()
Theoretical
(ng)
Added
(ng)
Detected
(ng)
Recovery
()
RSD
()
Gallic acid
50
300
200 4973 994 192
100 400 6986 998 151
150 600 8991 999 149
Quercetin
50
100
100 1975 987 174
100 200 2982 994 192
150 300 3974 993 127
Chapter 5 Standardization
Md Sarfaraj Hussain Ph D Thesis (2013) Integral University 188
Table 546
Gallic acid and quercetin contents estimated in A indicum H auriculata and T dioica
extracts by developed method
Plant drug
Gallic acid Quercetin
Content (ng spot-1
) RSD Content (ng spot-1
) RSD
A indicum 693 143 579 138
H auriculata 280 111 410 106
T dioica 317 112 396 115
Volume applied in each replicate was ten microlitres
Chapter 5 Standardization
Md Sarfaraj Hussain Ph D Thesis (2013) Integral University 189
55 References
[1] Raskin I Ribnicky D M Komarnytsky S Ilic N Poulev A Borisjuk N
Brinker A Moreno D A Ripoll C Yakoby N O‟Neal J M Cornwell T
Pastor I and Fridlender B (2002) Plants and Human health in the twenty
first century Trends in Biotechnology 20(12) 522-531
[2] Ali M (1997) Textbook of Pharmacognosy CBS Publishers and Distributors
New Delhi
[3] Malome M H (1983) The pharmacological evaluation of natural products -
general and specific approaches to screening ethnopharmaceuticals Journal
of Ethnopharmacology 8 127
[4] Jeong Sei-Joon Miyamoto T Inagaki M Kim Youn-Chul and Higuchi
R(2000) Rotundines A-C three novel sesquiterpene alkaloids from Cyperus
rotundus Journal of Natural Product 65 616-618
[5] Trease G E and Evans M C (1983) Text book of Pharmacognosy 12th
ed
Balliere Tindall London 343-383
[6] Chase J A and Pratt R J (1949) Fluorescence of powdered vegetable drugs
with particular reference to development of a system of identification Journal
of American Pharmaceutical Association 38 324-331
[7] Kokoshi C J Kokoski R J and Sharma P J (1958) Fluorescence of
powdered vegetable drugs under UV radiation Journal of American
Pharmaceutical Association 47 561-570
[8] Choudhry R D (1996) A Practical apporoach to industrial Pharmacognosy
Herbal drug Industries first edition 353-356
[9] The Ayurvedic Pharmacopoeia of India (1999) part ndashI Vol II 1st edition New
Delhi Government of India ministry of Health and Familr Welfare Department
of Indian system of Medicine amp Homeopathy 189-196
Chapter 5 Standardization
Md Sarfaraj Hussain Ph D Thesis (2013) Integral University 190
[10] Gupta A K (2003) Quality standards of Indian medicinal plants vol 1
published by ICMR 57-81
[11] Anonymous (1998) Quality control methods for medicinal plants WHO
Geneva
[12] Singleton V L Orthofer R and Lamuela-Raventos R M (1999) Analysis of
total phenols and other oxidation substrates and antioxidants by means of
FolinndashCiocalteau reagent Methods of Enzymology 299 152ndash178
[13] Chang C Yang M Wen H Chern J (2002) Estimation of total flavonoid
content in propolis by two complementary colorimetric methods Journal of
Food Drug Analysis 10 178-182
[14] Obdoni B O and Ochuko P O (2001) Phytochemical studies and
comparative efficacy of the crude extracts of some Homostatic plants in Edo
and Delta States of Nigeria Global Journal of Pure Appllied Sciences 8b 203-
208
[15] Harborne J B (1973) Phytochemical methods London Chapman and Hall
Ltd 49-188
[16] Sun B S Ricardo-Da-Silva J M and Spranger M I (1998) Critical factors of
vanillin assay for catechins and proanthocyanidins Journal of Agriculture and
Food Chemistry 46 4267ndash4274
[17] Stahl E (2005) Thin layer Chromatography-A Laboratory handbook
Springer India private limited 2nd
ed 53-83
[18] Mukherjee P K (2002) Quality Control of Herbal Drugs (Business Horizon‟s
Pharmaceutical Publishers New Delhi) 138ndash141
[19] Ali M (1998) High performance thin layer chromatography for herbal and
pharmaceutical product analysis Indian Journal of Pharmaceutical Education
32(1) 15-19
Chapter 5 Standardization
Md Sarfaraj Hussain Ph D Thesis (2013) Integral University 191
[20] Mukherjee P K (2002) Quality control of herbal drugs an application to
evaluation of botanical HPTLC Printed at syndicate binders New Delhi 494-
95
[21] Sethi P D (2006) HPTLC Quantitative analysis of pharmaceutical
formulations CBS publishers and distributers New Delhi 126-127 140-141
[22] Kaul N Agrawal H Patil B Kakad A and Dhaneshwar S R (2005)
Application of stability-indicating HPTLC method for quantitative
determination of metadoxine in pharmaceutical dosage form IL Farmaco 60
351ndash360
[23] Faiyazuddin Md Baboota S Ali J Ahuja A Ahmad S and Akhtar J (2009)
Validated HPTLC method for simultaneous quantitation of bioactive citral
isomers in lemongrass oil encapsulated solid lipid nanoparticle formulation
International Journal of Essential Oil Therapy 3 142ndash146
[24] Faiyazuddin M d Ahmad N Baboota S Ali J Ahmad S and Akhtar J
(2010) Chromatographic Analysis of trans and cis-Citral in Lemongrass Oil
and in a Topical Phytonanocosmeceutical Formulation and Validation of the
Method Journal of Planar Chromatography 23 233ndash236
[25] Faiyazuddin M d Ahmad S Iqbal Z Talegaonkar S Ahmad F J
Bhatnagar A Khar R K (2010) Stability indicating HPTLC method for
determination of terbutaline Sulfate in bulk and from Submicronized dry
Powder inhalers Analytical Science 26 1ndash5
[26] Faiyazuddin M d Rauf A Ahmad N Ahmad S Iqbal Z Talegaonkar S
Bhatnagar A Khar R K andAhmad F J (2011) A validated HPTLC
method for determination of terbutaline sulfate in biological samples
Application to pharmacokinetic study Saudi Pharmaceutical Journal 19 185ndash
191

Chapter 5 Standardization
Md Sarfaraj Hussain Ph D Thesis (2013) Integral University 174
Figure 56 Chromatogram of LP and ST simultaneously determined in methanolic
extract of each plant by using toluenendashmethanolndashformic acid (70 27 03 vvv) as
solvent system and scanned at 530 nm [LP (052) and ST (028)]
Figure 57 TLC image of methanolic extract of A indicum (Lanes 1ndash3) showing
superimposed tracks at of A indicum extracts at various concentrations
Chapter 5 Standardization
Md Sarfaraj Hussain Ph D Thesis (2013) Integral University 175
Figure 58 HPTLC chromatogram of methanolic extract of A indicum scanned at 530
nm [peak 1-11 LP (052) and ST (028)]
Figure 59 TLC image of methanolic extract of H auriculata (Lanes 1ndash3) showing
superimposed tracks at of HA extracts at various concentrations
Chapter 5 Standardization
Md Sarfaraj Hussain Ph D Thesis (2013) Integral University 176
Figure 510 HPTLC chromatogram of methanolic extract of H auriculata scanned at
530 nm [peak 1-9 LP (052) and ST (028)]
Figure 511 TLC image of methanolic extract of T dioica (Lanes 1ndash3) showing
superimposed tracks at of T dioica extracts at various concentrations
Chapter 5 Standardization
Md Sarfaraj Hussain Ph D Thesis (2013) Integral University 177
Figure 512 HPTLC chromatogram of methanolic extract of T dioica scanned at 530
nm [peak 1-10 LP (052) and ST (028)]
Table 535 TLC fingerprints (Rf value) of methanolic extracts of Aindicum H
auriculata and T dioica (
A Indicum H auriculata T dioica
014 013 011
024 022 019
028 (ST) 028 (ST) 028 (ST)
036 039 039
039 052 (LP) 045
045 059 052 (LP)
052 (LP) 064 065
066 069 069
085 078 078
091 - 087
094 - -
Solvent system toluenendashmethanolndashformic acid (702703 vvv)
Chapter 5 Standardization
Md Sarfaraj Hussain Ph D Thesis (2013) Integral University 178
Table 536 Rf linear regression data for the calibration curve and sensitivity parameter
for LP and ST
Parameter LP ST
RF 052 028
Linearity range (ng band-1
) 100ndash1000 50ndash500
Regression equation Y=00059X+0 Y=0013-0037
Correlation coefficient (r2) 09994 09941
Slopeplusmnsd 00059plusmn00008 0013plusmn0006
Interceptplusmnsd Nil 0037plusmn0004
Standard error of slope 00011 0003
Standard error of intercept - 0014
LOD 45 18
LOQ 135 54
Chapter 5 Standardization
Md Sarfaraj Hussain Ph D Thesis (2013) Integral University 179
Table 537 Precision and accuracy of the method
Lupeol Stigmasterol
Nominal
conca
Obtained
ab
Precision
c
Recoveryd
Nominal
conca
Obtained
ab
Precisionc
Recovery
d
Intraday batch
200 1983 180 991 100 975 173 975
400 3968 175 992 200 1986 184 993
800 8014 153 1001 400 4022 137 1005
Interday batch
200 1962 218 981 100 957 191 957
400 3928 186 982 200 1969 178 984
800 7983 170 997 400 3967 155 992
aConcentration in ng band
-1 b
Mean from six determinations (n=6) cPrecision as
coefficient of variation (CV ) = [(standard deviation)(concentration found)] times 100
dAccuracy () = [concentration found)(nominal concentration)] times 100
Chapter 5 Standardization
Md Sarfaraj Hussain Ph D Thesis (2013) Integral University 180
Table 538 Robustness of the method
Optimisation condition LP ST
SD RSD SD RSD
Mobile phase (toluenendashmethanolndashformic acid (65 32
03 vvv 68 29 03 vvv 72 25 03 vvv and
70 27 03 vvv)
163 152 159 135
Mobile-phase volume (18 20 and 22 mL) 138 127 112 098
Duration of saturation (10 20 and 30 min) 192 183 107 091
Activation of TLC plates (2 5 and 7 min) 119 108 143 122
Table 539 Recovery studies of LP and ST
Conc added
to analyte ()
Theoretical
(ng)
Added (ng) Detected
(ng)
Recovery () RSD ()
Lupeol
50
400
200 5893 982 192
100 400 7936 992 151
150 600 9968 997 149
Stigmasterol
50
200
100 2915 972 114
100 200 3952 988 189
150 300 4978 996 117
Chapter 5 Standardization
Md Sarfaraj Hussain Ph D Thesis (2013) Integral University 181
Table 540 LP and ST contents estimated in methanolic extract of A indicum H
auriculata and Tdioica by developed method
Plant Drug
Lupeol Stigmasterol
Content (ng spot-1
) RSD Content (ng spot-1
) RSD
A indicum 590 143 830 129
H auriculata 197 171 470 103
T dioica roxb 670 122 346 115
Volume applied in each replicate was ten microlitres
Figure 513 Display of all tracks of methanolic extract of A indicum H auriculata and
Tdioica at 270 nm
Chapter 5 Standardization
Md Sarfaraj Hussain Ph D Thesis (2013) Integral University 182
Figure 514 HPTLC chromatogram of standard gallic acid at RF 031
Figure 515 HPTLC chromatogram of standard Quercetin at RF 050
Chapter 5 Standardization
Md Sarfaraj Hussain Ph D Thesis (2013) Integral University 183
Figure 516 HPTLC chromatogram of methanolic extract of A indicum scanned at 270
nm [peak 1-15 GA (031) and QA (050)]
Figure 517 HPTLC chromatogram of methanolic extract of H auriculata scanned at
270 nm [peak 1-15 GA (031) and QA (050)]
Chapter 5 Standardization
Md Sarfaraj Hussain Ph D Thesis (2013) Integral University 184
Figure 518 HPTLC chromatogram of methanolic extract of T diocia scanned at 270
nm [peak 1-14 GA (031) and QA (050)]
Figure 519 Chromatogram of GA and QA simultaneously determined in by using
toluenendashethyl acetatendashformic acid (541 vvv) as solvent system scanned at 270 nm
[GA (031) and QA (050)]
Chapter 5 Standardization
Md Sarfaraj Hussain Ph D Thesis (2013) Integral University 185
Table 541 TLC fingerprints (RF value) of A Indicum H auriculata and T dioica
extracts at 270 nm for GA and QE
A Indicum H auriculata T dioica
001 003 003
006 006 015
010 010 023
015 014 028
019 020 031(GA)
023 023 037
031 (GA) 031 (GA) 046
037 043 050 (QE)
043 046 056
046 050 (QE) 065
050 (QE) 056 068
056 065 079
065 068 083
073 079 089
079 082 -
082 - -
Solvent system toluene ethyl acetate formic acid (541 vvv)
Chapter 5 Standardization
Md Sarfaraj Hussain Ph D Thesis (2013) Integral University 186
Table 542 Rf linear regression data for the calibration curve and sensitivity parameter
for gallic acid and quercetin
Parameters Gallic acid Quercetin
Rf 031 050
Linearity range (ng band-1
) 100ndash1000 150ndash900
Regression equation Y=00048X+0012 Y=0033-0017
Correlation coefficient (r2) 09991 09956
Slopeplusmnsd 00048plusmn00003 0033plusmn0008
Interceptplusmnsd 0012plusmn0007 0017plusmn0002
Standard error of slope 000017 00046
Standard error of intercept 00040 00011
LOD 23 41
LOQ 69 123
Table 543 Precision and accuracy of the method
Gallic acid Quercetin
Nominal
conca
Obtained
ab
Precision
c
Accuracy
d
Nominal
conca
Obtained
ab
Precisio
nc
Accuracy
d
Intraday batch
150 1483 170 988 200 1975 173 987
300 2991 165 997 400 3986 189 996
600 6004 155 1000 800 8013 137 1001
Interday batch
150 1492 198 994 200 1977 194 988
300 2998 176 999 400 3969 197 992
600 5983 170 997 800 7988 195 998
aConcentration in ng band
-1
bMean from six determinations (n=6)
cPrecision as
coefficient of variation (CV ) = [(standard deviation)(concentration found)] times 100
dAccuracy () = [concentration found)(nominal concentration)] times 100
Chapter 5 Standardization
Md Sarfaraj Hussain Ph D Thesis (2013) Integral University 187
Table 544 Robustness of the method
Optimisation condition Gallic acid Quercetin
SD RSD SD RSD
Mobile phase
(Toulene ethyl acetateformic acid 55351
vvv 54505 vvv 55405 vvv and
631 vvv)
179 182 191 165
Mobile-phase volume (18 20 and 22 mL) 125 177 162 089
Duration of saturation (10 20 and 30 min) 198 163 109 101
Activation of TLC plates (2 5 and 7 min) 189 178 153 122
Table 545 Recovery studies of gallic acid and quercetin
Concentration added
to analyte ()
Theoretical
(ng)
Added
(ng)
Detected
(ng)
Recovery
()
RSD
()
Gallic acid
50
300
200 4973 994 192
100 400 6986 998 151
150 600 8991 999 149
Quercetin
50
100
100 1975 987 174
100 200 2982 994 192
150 300 3974 993 127
Chapter 5 Standardization
Md Sarfaraj Hussain Ph D Thesis (2013) Integral University 188
Table 546
Gallic acid and quercetin contents estimated in A indicum H auriculata and T dioica
extracts by developed method
Plant drug
Gallic acid Quercetin
Content (ng spot-1
) RSD Content (ng spot-1
) RSD
A indicum 693 143 579 138
H auriculata 280 111 410 106
T dioica 317 112 396 115
Volume applied in each replicate was ten microlitres
Chapter 5 Standardization
Md Sarfaraj Hussain Ph D Thesis (2013) Integral University 189
55 References
[1] Raskin I Ribnicky D M Komarnytsky S Ilic N Poulev A Borisjuk N
Brinker A Moreno D A Ripoll C Yakoby N O‟Neal J M Cornwell T
Pastor I and Fridlender B (2002) Plants and Human health in the twenty
first century Trends in Biotechnology 20(12) 522-531
[2] Ali M (1997) Textbook of Pharmacognosy CBS Publishers and Distributors
New Delhi
[3] Malome M H (1983) The pharmacological evaluation of natural products -
general and specific approaches to screening ethnopharmaceuticals Journal
of Ethnopharmacology 8 127
[4] Jeong Sei-Joon Miyamoto T Inagaki M Kim Youn-Chul and Higuchi
R(2000) Rotundines A-C three novel sesquiterpene alkaloids from Cyperus
rotundus Journal of Natural Product 65 616-618
[5] Trease G E and Evans M C (1983) Text book of Pharmacognosy 12th
ed
Balliere Tindall London 343-383
[6] Chase J A and Pratt R J (1949) Fluorescence of powdered vegetable drugs
with particular reference to development of a system of identification Journal
of American Pharmaceutical Association 38 324-331
[7] Kokoshi C J Kokoski R J and Sharma P J (1958) Fluorescence of
powdered vegetable drugs under UV radiation Journal of American
Pharmaceutical Association 47 561-570
[8] Choudhry R D (1996) A Practical apporoach to industrial Pharmacognosy
Herbal drug Industries first edition 353-356
[9] The Ayurvedic Pharmacopoeia of India (1999) part ndashI Vol II 1st edition New
Delhi Government of India ministry of Health and Familr Welfare Department
of Indian system of Medicine amp Homeopathy 189-196
Chapter 5 Standardization
Md Sarfaraj Hussain Ph D Thesis (2013) Integral University 190
[10] Gupta A K (2003) Quality standards of Indian medicinal plants vol 1
published by ICMR 57-81
[11] Anonymous (1998) Quality control methods for medicinal plants WHO
Geneva
[12] Singleton V L Orthofer R and Lamuela-Raventos R M (1999) Analysis of
total phenols and other oxidation substrates and antioxidants by means of
FolinndashCiocalteau reagent Methods of Enzymology 299 152ndash178
[13] Chang C Yang M Wen H Chern J (2002) Estimation of total flavonoid
content in propolis by two complementary colorimetric methods Journal of
Food Drug Analysis 10 178-182
[14] Obdoni B O and Ochuko P O (2001) Phytochemical studies and
comparative efficacy of the crude extracts of some Homostatic plants in Edo
and Delta States of Nigeria Global Journal of Pure Appllied Sciences 8b 203-
208
[15] Harborne J B (1973) Phytochemical methods London Chapman and Hall
Ltd 49-188
[16] Sun B S Ricardo-Da-Silva J M and Spranger M I (1998) Critical factors of
vanillin assay for catechins and proanthocyanidins Journal of Agriculture and
Food Chemistry 46 4267ndash4274
[17] Stahl E (2005) Thin layer Chromatography-A Laboratory handbook
Springer India private limited 2nd
ed 53-83
[18] Mukherjee P K (2002) Quality Control of Herbal Drugs (Business Horizon‟s
Pharmaceutical Publishers New Delhi) 138ndash141
[19] Ali M (1998) High performance thin layer chromatography for herbal and
pharmaceutical product analysis Indian Journal of Pharmaceutical Education
32(1) 15-19
Chapter 5 Standardization
Md Sarfaraj Hussain Ph D Thesis (2013) Integral University 191
[20] Mukherjee P K (2002) Quality control of herbal drugs an application to
evaluation of botanical HPTLC Printed at syndicate binders New Delhi 494-
95
[21] Sethi P D (2006) HPTLC Quantitative analysis of pharmaceutical
formulations CBS publishers and distributers New Delhi 126-127 140-141
[22] Kaul N Agrawal H Patil B Kakad A and Dhaneshwar S R (2005)
Application of stability-indicating HPTLC method for quantitative
determination of metadoxine in pharmaceutical dosage form IL Farmaco 60
351ndash360
[23] Faiyazuddin Md Baboota S Ali J Ahuja A Ahmad S and Akhtar J (2009)
Validated HPTLC method for simultaneous quantitation of bioactive citral
isomers in lemongrass oil encapsulated solid lipid nanoparticle formulation
International Journal of Essential Oil Therapy 3 142ndash146
[24] Faiyazuddin M d Ahmad N Baboota S Ali J Ahmad S and Akhtar J
(2010) Chromatographic Analysis of trans and cis-Citral in Lemongrass Oil
and in a Topical Phytonanocosmeceutical Formulation and Validation of the
Method Journal of Planar Chromatography 23 233ndash236
[25] Faiyazuddin M d Ahmad S Iqbal Z Talegaonkar S Ahmad F J
Bhatnagar A Khar R K (2010) Stability indicating HPTLC method for
determination of terbutaline Sulfate in bulk and from Submicronized dry
Powder inhalers Analytical Science 26 1ndash5
[26] Faiyazuddin M d Rauf A Ahmad N Ahmad S Iqbal Z Talegaonkar S
Bhatnagar A Khar R K andAhmad F J (2011) A validated HPTLC
method for determination of terbutaline sulfate in biological samples
Application to pharmacokinetic study Saudi Pharmaceutical Journal 19 185ndash
191
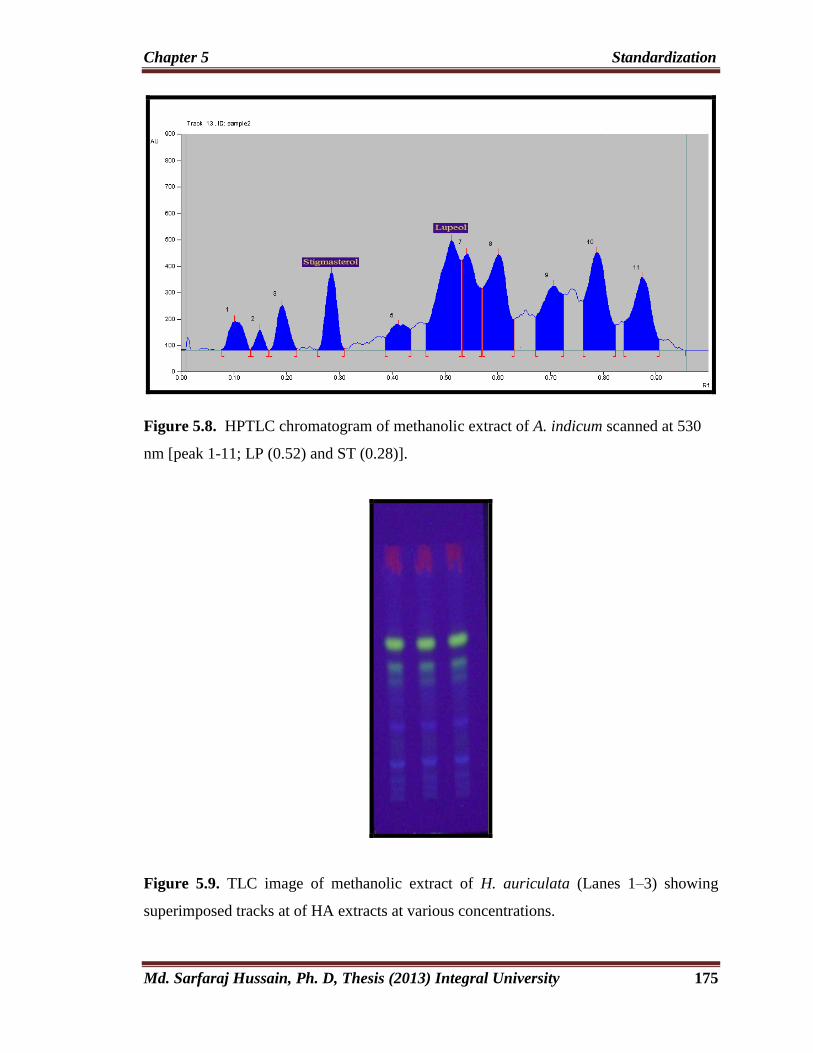
Chapter 5 Standardization
Md Sarfaraj Hussain Ph D Thesis (2013) Integral University 191
[20] Mukherjee P K (2002) Quality control of herbal drugs an application to
evaluation of botanical HPTLC Printed at syndicate binders New Delhi 494-
95
[21] Sethi P D (2006) HPTLC Quantitative analysis of pharmaceutical
formulations CBS publishers and distributers New Delhi 126-127 140-141
[22] Kaul N Agrawal H Patil B Kakad A and Dhaneshwar S R (2005)
Application of stability-indicating HPTLC method for quantitative
determination of metadoxine in pharmaceutical dosage form IL Farmaco 60
351ndash360
[23] Faiyazuddin Md Baboota S Ali J Ahuja A Ahmad S and Akhtar J (2009)
Validated HPTLC method for simultaneous quantitation of bioactive citral
isomers in lemongrass oil encapsulated solid lipid nanoparticle formulation
International Journal of Essential Oil Therapy 3 142ndash146
[24] Faiyazuddin M d Ahmad N Baboota S Ali J Ahmad S and Akhtar J
(2010) Chromatographic Analysis of trans and cis-Citral in Lemongrass Oil
and in a Topical Phytonanocosmeceutical Formulation and Validation of the
Method Journal of Planar Chromatography 23 233ndash236
[25] Faiyazuddin M d Ahmad S Iqbal Z Talegaonkar S Ahmad F J
Bhatnagar A Khar R K (2010) Stability indicating HPTLC method for
determination of terbutaline Sulfate in bulk and from Submicronized dry
Powder inhalers Analytical Science 26 1ndash5
[26] Faiyazuddin M d Rauf A Ahmad N Ahmad S Iqbal Z Talegaonkar S
Bhatnagar A Khar R K andAhmad F J (2011) A validated HPTLC
method for determination of terbutaline sulfate in biological samples
Application to pharmacokinetic study Saudi Pharmaceutical Journal 19 185ndash
191
![seasideukestrummers.weebly.comseasideukestrummers.weebly.com/uploads/2/5/5/6/... · The Bare Necessities Look for the [Cl bare necessities, the [F] simple bare necessities, [Cl Forget](https://img.dokumen.tips/doc/110x75/5ac76ba77f8b9aa1298b6c99/bare-necessities-look-for-the-cl-bare-necessities-the-f-simple-bare-necessities.jpg)