Embed Size (px)
Citation preview

Acta Bot. Croat. 61 (1), 11–26, 2002 CODEN: ABCRA25ISSN 0365–0588
Standardisation of instrumentation in plant
DNA image cytometry
BARBARA VILHAR*, MARINA DERMASTIA
University of Ljubljana, Biotechnical Faculty, Department of Biology, Ve~na pot 111,1001 Ljubljana, Slovenia
DNAimage cytometry is a relatively new technique for densitometric measurement of nu-clear DNA content, which has only rarely been used in botany and thus no methodologicalstandards exist for this method to be applied to the measurement of plant material. In thepresent paper we address several problems related to standardisation of DNA imagecytometry, such as stability of the measuring system, linearity of optical density measure-ments, correction of uneven illumination of the field of view, and uniformity of integratedoptical density measurement over the entire field of view. Furthermore, image processingprocedures are described for mitigation of the effects of electronic noise (image averag-ing) and for densitometric calibration of the measuring system. We have developed amacro for plant DNA image cytometry, using a general image analysis software package.The described quality control procedures, adopted from international medical standardsfor diagnostic DNA image cytometry, were used during software development to test per-formance of our measurement system. Until a specific botanical consensus is reached, werecommend that the quality control standards for instrumentation described in the presentpaper are considered when DNA image cytometry is used for measurement of plant ge-nome size as well as for any other image analysis-related densitometric measurementbased on light microscopy.
Key words: DNA image cytometry, standardisation, instrumentation, nuclear DNA con-tent, plant material
Abbreviations: CV – coefficient of variation, IOD – integrated optical density, ND filter– neutral density filter, OD – optical density
Introduction
The international meeting on genome size in angiosperms held at The Royal BotanicGardens Kew in 1997 addressed aspects of best practice for measurement of genome size,including standardisation of measurement protocols (BENNETT 1998). Several burningquestions concerning the methodology for nuclear DNA content measurement in plants,however, still remain unresolved.
ACTA BOT. CROAT. 61 (1), 2002 11
* Corresponding author: Fax +386 1 257 33 90, e-mail: [email protected]

In general, two densitometric methods are used to evaluate plant genome size: photo-metric cytometry and image cytometry (BENNETT and LEITCH 1995, BENNETT and LEITCH
1997, BENNETT et al. 2000). In both methods, DNA is usually quantitatively stained withthe Feulgen reaction. The intensity of staining in the nuclei is measured according to classi-cal protocols with a cytophotometer or, more recently, with DNA image cytometry(BÖCKING et al. 1995) using an image analysis system (a microscope linked to a personalcomputer via a camera (JARVIS 1986, SÁNCHEZ et al. 1990, CHIECO et al. 1994, BÖCKING etal. 1995). In this case, an image analysis software package is used to process the grabbedimages and calculate the integrated optical density of the nuclei. Using a standard specieswith a known genome size (nuclear DNA amount expressed as the C-value), the arbitraryunits of the integrated optical density (IOD) measurement are converted to picogram (pg)DNA.
With the rapid development of digital imaging technologies, image analysis systemsare bound to replace classical cytophotometers. Although DNA image cytometry is rou-tinely used in medical science for diagnostic purposes, mostly to evaluate the ploidy statusof a cell population, this method has only rarely been applied in botany for measurement ofnuclear DNAamount (TEMSCH et al. 1998, TEMSCH et al. 1999, DIMITROVAet al. 1999, YU etal. 1999, VILHAR et al. 2001a, b).
Whereas medical scientists have recently published a number of papers aiming atreaching an international consensus on the methodology of nuclear DNA content measure-ments (BÖCKING et al. 1995, PUECH and GIROUD 1999, ORMEROD et al. 1998, and refs.therein), few botanists have comprehensively addressed these questions (for example,BENNETT and SMITH 1976, DOLE@EL et al. 1998, JOHNSTON et al. 1999, GREILHUBER andTEMSCH 2001, VILHAR et al. 2001a). To some extent, image cytometry has been comparedto other methods used for plant genome size measurement (TEMSCH et al. 1998, TEMSCH etal. 1999, DIMITROVA et al. 1999, VILHAR et al. 2001a), but methodological standards forquality control of instrumentation have not yet been discussed in botanical literature.
Several DNA image cytometry software packages designed for routine medical diag-nostics are commercially available. These image analysis systems can also be used formeasurements of plant material (VILHAR et al. 2001a). In our laboratory, we developed aDNA image cytometry macro, based on a general image analysis package. We have re-cently demonstrated that such user-defined macros can give results comparable to thoseobtained with medical software packages, flow cytometry and photometric cytometry(VILHAR et al. 2001a).
In the present paper, we address several problems that need to be solved appropriatelyfor accurate densitometric measurement of nuclear DNA content with an image analysissystem. The performance of our measurement system was evaluated against set or pro-posed international medical standards (BÖCKING et al. 1995, PUECH and GIROUD 1999) andthe presented results may serve as an example of standardisation procedures. Where appli-cable, plant nuclei were used at different stages of software development and testing. Wepropose that the medical methodological standards for DNA image cytometry be adoptedfor measurement of plant material until such time as international botanical standards areagreed.
12 ACTA BOT. CROAT. 61 (1), 2002
VILHAR B., DERMASTIA M.

Materials and methods
The image analysis system
A light microscope (Axioskop MOT, Carl Zeiss) was connected to a personal computervia a colour CCD camera (Sony DXC–950P). A green filter was inserted in the light pathfor densitometric measurements (band pass interference filter, 540 nm, width at half-peaktransmission 90 nm) and Köhler illumination was used, with objective magnification 40 �
(Plan-Neofluar, Carl Zeiss). Grey images were grabbed using the green camera channelwith the frame grabber Matrox Meteor (image size 760 � 560 pixels) and processed usingmacros based on the software package KS 400 version 3.0 (Carl Zeiss Vision).
General conditions for the quality control procedures
For all quality control procedures, the microscope and image acquisition settings werethe same as those used for genome size measurements (VILHAR et al. 2001a). The image ofnuclei was focused, then the field of view was moved to an empty field, and the image wasgrabbed. Aset of neutral density (ND) filters with known transmission (T = 1.5, 6, 9, 25, 40,45 and 80%) was used where indicated. The theoretical optical density (OD) value for eachfilter was calculated from T as OD = log (1/T). The settings of the system were not changedduring the whole measurement session. All the quality evaluation procedures were re-peated several times with similar results.
Evaluation of instrumentation warming-up period
The mean grey value of the entire field of view was recorded every 2 min after the sys-tem had been switched on (PIRARD et al. 1999). The measured grey values were plottedagainst time.
Evaluation of electronic noise and drift over time
During both quality control procedures, an ND filter (T = 0.4) was inserted in the lightpath in order to obtain measurements in the intermediate grey value scale. For evaluation ofelectronic noise, the grey value of the pixel in the centre of each of the five fields of the im-age shown in Figure 1Awas measured every 2 min during 1 h (PUECH and GIROUD 1999). Inaddition, a set of 100 images was grabbed at the maximum speed of the measuring systemand the grey values of the same pixels were recorded on each image. For evaluation of driftover time, the mean grey value of the whole image was measured every 2 min during 8 h(PUECH and GIROUD 1999). The coefficient of variation (CV) of each measurement serieswas calculated as the standard deviation of grey values divided by the mean grey value(PUECH and GIROUD 1999).
Evaluation of linearity
The OD of a 10 � 10 pixel field positioned in the centre of the image was measured us-ing a set of ND filters. OD was measured at four additional 10 � 10 pixel fields positionedat midpoint between the centre and each of the corners of the image (Fig. 1A). The mea-sured OD values were compared to the theoretical OD of each filter. The slope of the linear
ACTA BOT. CROAT. 61 (1), 2002 13
STANDARDISATION IN DNA IMAGE CYTOMETRY

regression (theoretical vs. measured OD) and the coefficient of determination (r2) were cal-culated for each field (PUECH and GIROUD 1999). Finally, the coefficient of variation of thefive slopes was calculated (PUECH and GIROUD 1999).
Evaluation of shading
The image was divided into five fields according to PUECH and GIROUD (1999) as shownin Figure 1B. The OD of the five fields of the image was measured and evaluated with thesame procedures as those described for linearity evaluation.
Evaluation of measurement uniformity over the entire field of view
Root tips of Allium cepa L. were fixed, stained with the Feulgen reaction and squashedto obtain a monolayer of cells on a microscope slide as described in VILHAR et al. (2001a).The same nucleus was placed at 30 different positions in the field of view (a grid with sixhorizontal and five vertical lines, Fig. 1C), and the integrated optical density (IOD) of thenucleus was measured. The coefficient of variation was calculated for the 30 IOD values(BÖCKING et al. 1995).
14 ACTA BOT. CROAT. 61 (1), 2002
VILHAR B., DERMASTIA M.
A
1 2
3 4
1 2
3 4
5
5
B
C
Fig. 1. Definition of measurement fields used for quality control tests. The outline represents thewhole image (760 �570 pixels). A – evaluation of electronic noise and linearity (10 �10pixel fields); B – evaluation of shading; C – 30 positions of the nucleus (shown as circles) forevaluation of uniformity of measurement over the entire field of view. For evaluation ofelectronic noise, the grey value of the pixel in the centre of each of the five fields shown in Awas measured.

Results and discussion
The microscope can be converted into a precise densitometric instrument, given thatevery step of the measurement, from image acquisition to calculation of IOD, is optimisedand standardised (BÖCKING et al. 1995, OBERHOLZER et al. 1996, PUECH and GIROUD 1999,PIRARD et al. 1999). In the present study, we address the following topics that need to bethoroughly examined in DNA image cytometry:
1. evaluation of stability of the measuring system (system warming up period, elec-tronic noise, drift over time) and procedures to reduce the effects of electronic noise
2. evaluation of linearity3. evaluation of uneven illumination of the field of view (shading)4. densitometric calibration of the image analysis system5. the procedure for calculation of nuclear IOD6. uniformity of IOD measurement over the entire field of view
The general aim of DNA image cytometry is to measure the true grey value of eachpixel as defined by GOLDSTEIN (1970) for photometric cytometry. The true grey value is thegrey value related to the optical properties of the measured object, whereas the apparentgrey value corresponds to the grey value of the same pixel in the original grabbed image.Image processing procedures can be used to convert the apparent grey value to the true greyvalue. Thus, a linear relationship is established between grey values and transmission, andthe precision of this relationship can be tested with quality control standards for instrumen-tation. Measurement of the true grey value is prerequisite for accurate OD calculation.
Evaluation of system stability
The test of the stability of the system comprised the warming-up test (PIRARD et al.1999) and a separate evaluation of electronic noise and drift over time (PUECH and GIROUD
1999).
Warming up
At the beginning of each measurement session, the system needs to be allowed suffi-cient time to warm up. In the absence of a cooling device, the camera slowly warms up andthe rising temperature provokes an undesired electron excitation leading to fluctuations ofthe recorded grey values under constant illumination (PIRARD et al. 1999). Figure 2 showsthe time course of grey value measurements after the system had been switched on. Thedata indicate that the response of our system stabilises after approx. 90 min. Similar warmingup times have been reported for other types of cameras (PIRARD et al. 1999). The same testwas used with different ND filters inserted to record different grey values with similar results(data not shown). The 90 min warming-up period was regularly used in our experiments.
Electronic noise
Electronic noise leads to scattering of the electrical signal coming out of a photodiodesubmitted to a constant amount of photons. Several major sources of electronic noise canbe identified in a CCD, such as photon noise, dark current noise and digitisation noise(CHIECO et al. 1994, PIRARD et al. 1999). The effects of electronic noise are illustrated inFigure 3.
ACTA BOT. CROAT. 61 (1), 2002 15
STANDARDISATION IN DNA IMAGE CYTOMETRY

In the standard electronic noise test, the grey values of single pixels were measured at 2min intervals over 1 h (PUECH and GIROUD 1999). For the system to qualify for DNA imagecytometry, the CV of grey values for a single pixel should not exceed 2% (PUECH andGIROUD 1999). Using our system, the CV was about 1.6% (Tab. 1).
The noise of the electronic system was further examined by grabbing a set of 100 im-ages of the same field of view at the maximum speed of the system (Tab. 1). Such a rapidmeasurement reveals fluctuations in measurements due to electronic noise (PIRARD et al.1999), while eliminating the effects of drift over time that may occur during the one hourmeasuring period. For this test, grey values of single pixels at the centre of the five fieldsshown in Figure 1A were recorded with different ND filters to give different values on the
16 ACTA BOT. CROAT. 61 (1), 2002
VILHAR B., DERMASTIA M.
0 10 20 30122
124
126
128
130
132
134
136
138
140
142
Image serial number
Gre
yva
lue
Fig. 3. Electronic noise of the measuring system.� – the grey value of a single pixel measured froma series of 32 images grabbed at maximum system speed;� – the grey value of a single pixelmeasured every 2 min over 1 h. The number on the x-axis indicates the serial number of theimage for each measurement.
0 50 100 150 200100
102
104
106
108
110
112
114
116
Time (min)
Gre
yva
lue
Fig. 2. Stability of the measuring system during the warming-up period. Mean grey value of thewhole field of view at various times after switching the system on is shown (green channel ofthe camera). The ND filter with T = 40% was used to record intermediate values on the greyvalue scale.

grey value scale (Tab. 1). The single pixel measurement showed an increasing CV of thegrey values with increasing OD. Similar results were obtained for all five pixels measured(only data for the central pixel of the image are shown in Table 1).
The CV of the grey values was markedly reduced when the average grey value wasmeasured for a series of 32 images (Tab. 1). In this averaging procedure, images number1–32, 33–64 and 65–96 were used to get the mean grey value of the pixel. The CV of themean grey values for the three averaged images was calculated (Tab. 1). Compared to theprotocol using one grabbed image, with the averaging procedure the CVs of the mean greyvalues were relatively low even for pixels with a high OD.
For precise densitometric purposes, every care should be taken to mitigate the influenceof electronic noise on the measurement. According to PIRARD et al. (1999), a fluctuationrange of 2 to 8 grey values for single pixels is not uncommon in standard video cameras.This problem is particularly acute in the dark range of the greyscale (Tab. 1), where the OD
ACTA BOT. CROAT. 61 (1), 2002 17
STANDARDISATION IN DNA IMAGE CYTOMETRY
Tab. 1. Evaluation of electronic noise and drift over time. Noise (measurement every 2 min over 1h): the grey value of the central pixel of the image was measured every 2 min over 1 h (N =30). Noise (measurement of a series of 100 images): the grey value of the central pixel of theimage was measured in a series of 100 images taken at maximum system speed (N = 100);central pixel – measurements represent variation in the 100 images; averaged images – thegrey values of the central pixel were averaged for 32 serial images (images 1–32, 33–64,65–96) to give three central pixel values – the variation of these three values is shown (N =3). Drift over time: the mean grey value of the entire field of view was recorded every 2 minover 8 h (N = 240). The mean grey value and the coefficient of variation (CV expressed in %)are shown. A set of ND filters (T = 1.5, 6, 9, 25, 40, 45, 80%) was used as indicated in the ta-ble legend. The standards are quoted from PUECH and GIROUD (1999).
Filter T (%)
100* 80 45 40 25 9 6 1.5 0**
Noise (measurement every 2 min over 1 h)
Standard CV<2%
Central pixel
mean grey value 136.7 103.1
CV (%) 1.6 1.6
Noise (measurement of a series of 100 images)
Central pixel
mean grey value 243.8 216.1 141.9 127.2 92.0 31.8 20.1 4.4 1.1
CV (%) 0.6 0.7 1.3 1.4 1.9 6.6 9.9 22.2 27.4
Averaged images
mean grey value 243.7 216.1 141.9 127.1 92.0 31.8 20.1 4.4 1.1
CV (%) 0.1 0.0 0.1 0.1 0.3 0.9 2.8 2.2 4.5
Drift over time
Standard CV<2%
mean grey value 121.0
CV (%) 0.3
* An empty field of view on the slide was measured;** The black image (blocked light path) was measured.

curve plotted against the available grey values is very steep. However, the effects of elec-tronic noise can be reduced by taking the arithmetic average of a sequence of images (Tab.1, PIRARD et al. 1999, CHIECO et al. 1994). In our densitometric measurements, the imageaveraging procedure is routinely applied.
A lower electronic noise as well as a higher resolution can be achieved with replace-ment of a video camera with a digital camera (John C. Russ, pers. comm.). However, digitalcameras are a relatively new and expensive technology, some software packages have notyet been converted to the higher resolution range, and video cameras are presently still fre-quently purchased to support microscope-based image analysis.
The halogen lamp used to illuminate the field of view in a microscope is a potentialsource of electronic noise that should be considered in image densitometry. While it givesrelatively stable illumination at the middle of its life time, a new halogen lamp and, in par-ticular, a lamp approaching the end of its life time can flicker, thus substantially contribut-ing to the overall electronic noise of the measurement system. Hence, regular checking ofstability of measurement is recommended.
Drift over time
According to the standards for the drift over time evaluation, the CV of the mean greyvalue of the entire field of view should not exceed 1% during an 8 h test period (PUECH andGIROUD 1999). For our system, the CV was 0.3% at the mean grey value 121.0 (maximum121.9, minimum 120.4; Tab. 1).
Since the temperature affects the sensitivity of the camera (Fig. 2), temperature fluctua-tions during measuring session (such as variation in ambient temperature) may lead to driftof the instrument and should therefore be avoided.
Evaluation of linearity
Theoretically, photodiodes have a linear response with respect to incident light inten-sity (transmission). Nevertheless, this has to be verified experimentally for each individualcamera (PIRARD et al. 1999, CHIECO et al. 1994, PUECH and GIROUD 1999).
For the evaluation of linearity, five fields (10 � 10 pixels) were defined on the image asshown in figure 1A. OD was measured for each field using a set of ND filters. According tothe medical standards, the slope of the regression line plotted over a series of measurementswith different ND filters for one field should fall between 0.9 and 1.1. In addition, the coef-ficient of determination (r2) should be higher than 0.99 for the image analysis system toqualify for precise DNA measurement, and the standard error of estimate (SEyx, expressedin %) lower than 5% (PUECH and GIROUD 1999).
With our system, the average regression slope was 1.082 (lowest 1.078, highest 1.084),r2 was 0.993 and SEyx was between 6.0 and 6.3% (Tab. 2). Hence, the system showed lin-earity that was within the standard limits, except for a slightly too high SEyx. This error wascorrected for with densitometric calibration (see below).
Evaluation of shading
In image cytometry, the measured area covers a large portion of the microscopic field ofview. Optical lenses generally pass more light in the centre, thus causing a shadow effect
18 ACTA BOT. CROAT. 61 (1), 2002
VILHAR B., DERMASTIA M.

(shading) at the edges of the image (CHIECO et al. 1994). Illumination defects may also becaused by camera properties (OBERHOLZER et al. 1996).
The effect of shading on OD measurement was tested with a procedure similar to thatfor evaluation of linearity, except that the measured fields of the image were defined asshown in Figure 1B (PUECH and GIROUD 1999).
For medical applications, the standard for coefficient of variation of OD regressionslopes for the five fields measured with different ND filters is CV < 2% (PUECH and GIROUD
1999). The CV of regression line slopes in the five fields measured with our system was0.2% (Tab. 2), thus falling well within the limits of acceptable values.
Shading correction procedures may be used during image processing to decrease shad-ing effects. Such procedures are listed among standard methods used to measure nuclearDNA content for medical purposes (BÖCKING et al. 1995). Several algorithms available forshading correction procedures are applicable to densitometry (CHIECO et al. 1994, PIRARD
et al. 1999, OBERHOLZER et al. 1996). The procedure described by PIRARD et al. (1999) wasapplied during measurement of nuclear DNA content in nine plant species, with satisfac-tory results (VILHAR et al. 2001a). Nevertheless, shading correction involves the process ofsubtracting or dividing images by another (depending on whether the camera has a linear orlogarithmic response), during which some information contained in the original image getslost (RUSS 1998). Hence, all practical steps should be taken to make illumination of thegrabbed image uniform before resorting to processing methods (OBERHOLZER et al. 1996).
ACTA BOT. CROAT. 61 (1), 2002 19
STANDARDISATION IN DNA IMAGE CYTOMETRY
Tab. 2. Evaluation of linearity and shading. A set of ND filters (T = 1.5, 6, 9, 25, 40, 45, 80%, blankfield of view T=100%) was used to plot a regression line (theoretical OD vs. measured OD; y= kx + n) for each of the fields shown in Figure 1A for linearity test and Figure 1B for shadingtest. The images were processed with two different procedures: without densitometric cali-bration (the gamma correction of the camera switched off) and with densitometric calibra-tion (the gamma correction of the camera switched on). The same system settings were usedfor both procedures. r2 – coefficient of determination, SEyx – standard error of estimate, CVk– coefficient of variation of regression slopes. The standards are quoted from PUECH andGIROUD (1999).
Procedure without densitometric calibration(gamma correction off)
with densitometric calibration(gamma correction on)
Test Slope(k)
Const.(n)
r2 SEyx
(%)CVk
(%)Slope(k)
Const.(n)
r2 SEyx
(%)CVk
(%)
Linearity
Standard 0.9-1.1 >0.990 <5% 0.9-1.1 >0.990 <5%
mean values(for five fields)
1.08 0.993 6.2 0.3 0.99 0.999 1.5 0.1
maximum slope 1.08 0.007 0.093 6.0 0.99 0.004 0.999 1.6
minimum slope 1.08 0.008 0.993 6.3 0.99 0.002 1.000 1.3
Shading
Standard <2% <2%
mean values(for five fields)
1.08 0.993 6.1 0.2 0.99 0.999 1.5 0.1
maximum slope 1.08 0.007 0.994 5.9 0.99 0.003 0.999 1.5
minimum slope 1.08 0.007 0.993 6.2 0.99 0.002 1.000 1.4

Densitometric calibration
As shown in Table 2, our system showed relatively good linearity with the settings usedin a typical genome size experiment with the gamma correction of the camera switched off.However, in some cases these settings may be changed for a better resolution of veryweakly or strongly stained nuclei. For example, the use of gamma correction of the cameraprovides additional grey values at high absorbance values, thus extending the dynamicrange of the system (Fig. 4; CHIECO et al. 1994). This effect proved beneficial for measure-ment of darkly stained nuclei, such as those found in Allium cepa. It is important to notethat in some cameras, when the gamma correction is applied, some automatic functions ofthe camera may also be switched on, hence the relationship between grey values and trans-mission should be thoroughly tested before the gamma correction is used in densitometricmeasurements (John C. Russ, pers. comm.).
Any departures from linearity can be adequately corrected for during image processing,when a densitometric calibration procedure is applied prior to OD measurement. The greyvalues for a set of ND filters are recorded with the procedure used for linearity evaluation(measurement of the central 10 � 10 pixel field or the whole image). A calibration curve isplotted as shown in Figure 4 and the resulting regression curve used to generate a look-uptable which is then used to transform the images prior to densitometric measurements(CHIECO et al. 1994). With this procedure, new grey values are assigned to each pixel andthe linearity of the system is recovered (Fig. 4). With the camera gamma correctionswitched on, a two or three degree polynomial function representing the relationship be-tween transmission and grey values is sufficient to obtain linearity for OD values 0 – 1.6(CHIECO et al. 1994).
20 ACTA BOT. CROAT. 61 (1), 2002
VILHAR B., DERMASTIA M.
0.0 0.2 0.4 0.6 0.8 1.00.0
0.2
0.4
0.6
0.8
1.0
Measured grey value (norm.)
Th
eo
retica
ltr
an
sm
issio
n
Fig. 4. Densitometric calibration curve for genome size measurement. In order to get calibrationpoints, the mean grey values of the entire field of view (empty field of view on the micro-scope slide) were measured using a set of ND filters with known transmission values. � –measured transmission values with the gamma correction switched off; ------ – the ideal lin-ear relationship between theoretical and measured transmission values;� – measured trans-mission values with the gamma correction switched on; �� – the polynomial regressioncurve used to calibrate the system with the gamma correction switched on (equation of theregression curve: y = 0.597x3 – 0.380x2 + 0.770x + 0.005; r2 = 0.999). The grey values werenormalised to assign value 1.0 to the mean grey value of an empty field of view.
The quality control procedures for linearity and shading evaluation were performedagain under the same conditions as described above for the uncalibrated system, but withimages subjected to the densitometric calibration procedure prior to OD measurement. Inthis case, the gamma correction of the camera was switched on.
In the linearity evaluation test, the uncalibrated and the calibrated system gave similarresults (Tab. 2). The high SEyx observed for the uncalibrated system was corrected whendensitometric calibration was applied (Tab. 2), and the CV of the five slopes decreasedfrom 0.3% to 0.1%. In addition, the regression line passed closer to the zero intercept whenthe densitometric calibration procedure was applied, and the coefficient of determination r2
increased from 0.993 to 0.999 (Tab. 2). In the shading evaluation test, the resulting CV ofthe regression slopes for the five image fields improved from 0.2% for the uncalibrated to0.1% for the calibrated system (Tab. 2).
In general, an appropriate densitometric calibration that accounts for the use of thegamma correction yields results comparable to those of the uncalibrated system with thegamma correction switched off in terms of linearity and shading (Tabs. 2 and 3). Further-more, good results were obtained from densitometric measurements of plant nuclei whenthe gamma correction was switched on and the system was densitometrically calibrated(data not shown).
According to PUECH and GIROUD (1999), colour cameras have a poor performance com-pared to black-and-white cameras. Our system using a colour camera has given satisfactoryresults during the quality control tests, indicating that a colour camera can show a good per-formance, given that only one channel of a 3CCD camera is used (John C. Russ, pers.comm.). Nevertheless, it is important to examine different settings of the camera and theframe grabber to achieve optimal quality of the grabbed image (PIRARD et al. 1999).
For quality control procedures and densitometric calibration, a reference slide withmounted ND filters can be used instead of a set of ND filters (PUECH and GIROUD 1999).However, the reference slide can currently only be ordered in batches over 30 slides, andeach slide is relatively expensive. Alternatively, ND filters can be cut and mounted on aslide (PUECH and GIROUD 1999). During the presented tests, ND filters were inserted in thelight path, hence ND shading was applied over a true measuring field, with the microscopeslide inserted but shifted to an empty field of view.
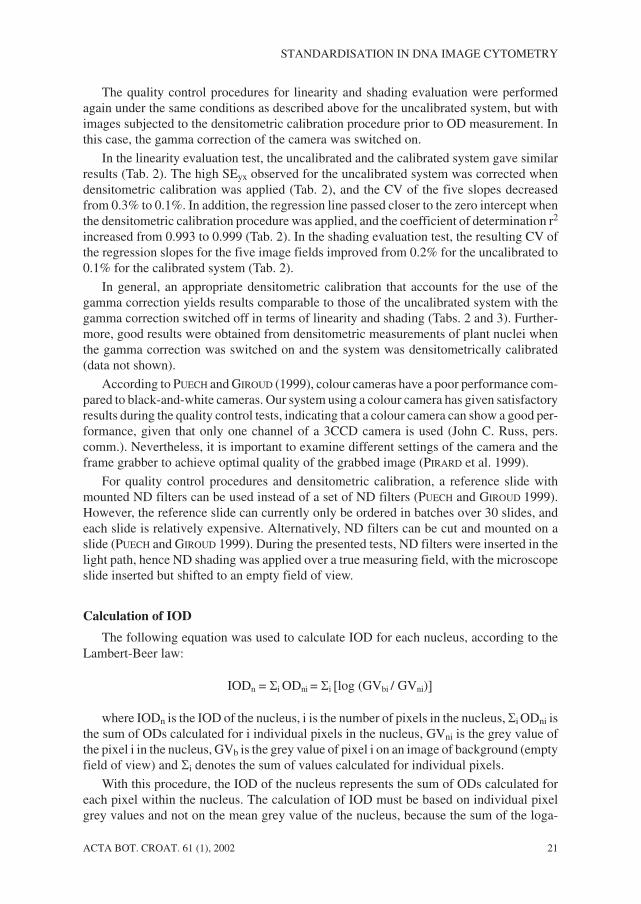
Calculation of IOD
The following equation was used to calculate IOD for each nucleus, according to theLambert-Beer law:
IODn = �i ODni = �i �log (GVbi / GVni)�
where IODn is the IOD of the nucleus, i is the number of pixels in the nucleus, �i ODni isthe sum of ODs calculated for i individual pixels in the nucleus, GVni is the grey value ofthe pixel i in the nucleus, GVb is the grey value of pixel i on an image of background (emptyfield of view) and �i denotes the sum of values calculated for individual pixels.
With this procedure, the IOD of the nucleus represents the sum of ODs calculated foreach pixel within the nucleus. The calculation of IOD must be based on individual pixelgrey values and not on the mean grey value of the nucleus, because the sum of the loga-
ACTA BOT. CROAT. 61 (1), 2002 21
STANDARDISATION IN DNA IMAGE CYTOMETRY

rithms of transmission values does not equal the logarithm of the mean transmission valuemultiplied by the number of pixels.
The DNAimage cytometry system presented in this study has a resolution of approx. 24pixels per �m2. The cytophotometers typically give a resolution of 4 measurements overone �m2 of the object when a 0.5 �m scanning step is used. Thus, the resolution of our in-strument, which represents a typical system for DNA image cytometry, is higher than inphotometric cytometry.
The Lambert-Beer law is valid only when photometric readings are taken with mono-chromatic light, hence filters are applied during DNA image cytometry to limit the wave-length range used for the measurement. The absorption maximum for Feulgen-stained nu-clear DNA lies at 565 nm (BEDI and GOLDSTEIN 1976). The medical standards recommendapplication of a 560 � 10 nm interference filter (BÖCKING et al. 1995, CHIECO et al. 1994),although band-pass gelatine filters can give similar results (CHIECO et al. 1994).
Evaluation of uniformity of IOD measurements over the entire field of view
According to medical DNA image cytometry standards, for measurement of one dip-loid nucleus at 30 different sites of the digitised image a CV of IOD values lower than 3% isacceptable (BÖCKING et al. 1995). With our system, the CV of IOD values for 30 positions(Fig. 1C) of Feulgen-stained Allium cepa nuclei was below 1% (Tab. 3).
Specific problems of nuclear DNA content measurement in plant material
In the present study, we illustrate one of the possible approaches to the application ofDNA image cytometry to plant nuclear DNA measurement, that is, the development ofuser-defined macros for densitometric purposes based on a general image analysis soft-ware package. Arguably it is less cumbersome to purchase one of the commercially soldmedical DNAimage cytometry software packages, keeping in mind that these packages arerelatively expensive, can do little else in terms of image analysis than nuclear DNA amountmeasurement and that they often contain medical diagnostic tools which are useless in bot-any. On the other hand, a general programmable image analysis package can be adapted for
22 ACTA BOT. CROAT. 61 (1), 2002
VILHAR B., DERMASTIA M.
Tab. 3. Evaluation of uniformity of measurement over the entire field of view with nuclei placed at30 different positions on the image. The 30 positions of the nucleus (Allium cepa) on the imageare shown in Figure 1C. The images were processed with two different procedures: withoutdensitometric calibration (the gamma correction of the camera switched off) and withdensitometric calibration (the gamma correction of the camera switched on). The measuredIOD is shown as the mean value � standard error of the mean (SEM). The standard is quotedfrom BÖCKING et al. (1995).
Procedure without densitometric calibration(gamma correction off)
with densitometric calibration(gamma correction on)
Nucleus Size(�m2)
IOD (a.u.)mean � SEM
CV(%)
Size(�m2)
IOD (a.u.)mean � SEM
CV(%)
Standard <3% <3%
large 287 3533 � 3 0.5 256 3138 � 3 0.6
small 118 1834 � 2 0.5 113 1581 � 1 0.5

applications other than nuclear DNA measurements, and can thus serve as an effective ver-satile instrument in a laboratory involved predominantly in research rather than in routinemeasurements.
Measurement of nuclear DNA amount over a range of plant species with variable ge-nome sizes requires a wide dynamic range of the measuring system. During developmentof the DNA image cytometry macro presented in this study, we have tested performance ofour measurement system in nine plant species over a 100–fold genome size range (2C nu-clear DNA content approx. 0.3 – 33 pg DNA; VILHAR et al. 2001a). The results obtainedwith DNA image cytometry were compared to those recorded with accepted methods forplant genome size measurement, namely with flow cytometry and with photometriccytometry. Furthermore, stringent standards for quality control of the microscope slideswere applied to test performance of the system (VILHAR et al. 2001a).
In applying densitometry to cytological preparations, a standardisation of the opticaldensity (OD) of the background is implied (OBERHOLZER et al. 1996). The presence of thecell wall in plant cells may pose a problem in terms of accurate measurement of the back-ground grey value. In our measurements, an empty field of view was used as the back-ground reference (VILHAR et al. 2001a). The image of the background was reconstructed asthe average of four images grabbed at different empty fields of view (32 averaged imageseach) on a slide. Alternatively, the background grey value can be determined locally foreach individual nucleus as the mean grey value of a narrow band (a few pixels wide) sur-rounding the segmented nucleus. This approach is recommended in the medical standards(BÖCKING et al. 1995) and may further increase precision of the measurement.
Apart from the cell walls, other structures and substances specific to the plant cell maycompromise the accuracy of DNA amount measurements. For example, starch grains maycause optical defects and different secondary metabolites interfere with the quantitativestaining of DNA (GREILHUBER 1986). Hence, choice of appropriate tissue and rigorouslycontrolled conditions of fixation and staining procedures (GREILHUBER and TEMSCH 2001)are prerequisite for measurement accuracy.
In our experience, when using DNA image cytometry in various plant species, it is rela-tively easy to get results which seem reliable, when in fact a systematical error may still beinfluencing the measurement, and hence biased nuclear DNA amount estimates are mea-sured with relatively high precision (small variation of the measurement). Therefore, werecommend that quality control standards described in the present paper and in VILHAR etal. (2001a) are considered before any DNA image cytometry system is declared reliable interms of plant nuclear DNA content measurement. Furthermore, we recommend that theDNA image cytometry system is tested over a wide range of plant genome sizes (same orsimilar to the species series described in VILHAR et al. 2001a) prior to its acceptance as anaccurate tool for plant genome size measurement.
Conclusion
Several aspects of image acquisition and processing that need to be considered for ac-curate densitometry are not addressed in this paper, such as grey level working range ad-justment, blooming and grey level clipping, segmentation (CHIECO et al. 1994, OBER-
ACTA BOT. CROAT. 61 (1), 2002 23
STANDARDISATION IN DNA IMAGE CYTOMETRY

HOLZER et al. 1996, PIRARD et al. 1999, PUECH and GIROUD 1999). Another procedure thatmay improve precision of IOD measurements is glare or stray light correction (GOLDSTEIN
1970, KINDERMANN and HILGERS 1994, PUECH and GIROUD 1999).
Given that reliability of DNA image cytometry in plant genome size measurement hasonly been systematically tested in two measurement systems (VILHAR et al. 2001a), the im-age analysis-related problems discussed in this paper should be addressed in other labora-tories in order to standardise these methods applied to plant science. With application of thedescribed standardisation procedures, it is possible to detect systematical errors in the mea-surement methods and to optimise DNA image cytometry. Only in this way can DNA im-age cytometry be accepted as a routine measurement method in botany. Furthermore, simi-lar quality control procedures should be used when a microscope-based image analysissystem is applied to any densitometric measurements (e.g. quantitative evaluation ofimmunostaining).
Finally, regardless of the method used for plant genome size measurement, an interna-tional consensus should be reached to provide standards for staining as well as measuringprocedures. In our opinion, the medical standards for DNA image cytometry should be ap-plied in botany until specific botanical standards are agreed.
Acknowledgements
The presented work was supported by the grant no. J1–1579–0487–99 from the Minis-try of Science and Technology of Slovenia and a travel grant from the Austrian Science andResearch Liaison. We thank Prof. Johann Greilhuber (University of Vienna) for valuablediscussions and encouragement, and Prof. Terry M. Mayhew (University of Nottingham)for critical comments on the manuscript.
References
BEDI, K. S., GOLDSTEIN, D. J., 1976: Apparent anomalies in nuclear Feulgen-DNA con-tents. Role of systematic microdensitometric errors. J. Cell Biol. 71, 68–88.
BENNETT, M. D., 1998: Plant genome values: how much do we know? Proc. Natl. Acad.Sci. U.S.A. 95, 2011–2016.
BENNETT, M. D., BHANDOL, P., LEITCH, I. J., 2000: Nuclear DNA amounts in angiospermsand their modern uses – 807 new estimates. Ann. Bot. 86, 859–909.
BENNETT, M. D., LEITCH, I. J., 1995: Nuclear DNA amounts in angiosperms. Ann. Bot. 76,113–176.
BENNETT, M. D., LEITCH, I. J., 1997: Nuclear DNA amounts in angiosperms – 583 new esti-mates. Ann. Bot. 80, 169–196.
BENNETT, M. D., SMITH, J. B., 1976: Nuclear DNA amounts in angiosperms. Philos. Trans.R. Soc. Lond. B Biol. Sci. 334, 309–345.
BÖCKING, A., GIROUD, F., REITH, A., 1995: Consensus report of the ESACP task force onstandardisation of diagnostic DNA image cytometry. Anal. Cell. Pathol. 8, 67–74.
24 ACTA BOT. CROAT. 61 (1), 2002
VILHAR B., DERMASTIA M.

CHIECO, P., JONKER, A., MELCHIORRI, C., VANNI, G., VAN NOORDEN, C. J. F., 1994: A user’sguide for avoiding errors in absorbance image cytometry: a review with original experi-mental observations. Histochem. J. 26, 1–19.
DIMITROVA, D., EBERT, I., GREILHUBER, J., KOZHUHAROV, S., 1999: Karyotype constancyand genome size variation in Bulgarian Crepis foetida s. l. (Asteraceae). Plant Syst.Evol. 217, 245–257.
DOLE@EL, J., GREILHUBER, J., LUCRETTI, S., MEISTER, A., LYSÁK, M. A., NARDI, L.,OBERMAYER, R., 1998: Plant genome size estimation by flow cytometry: inter-labora-tory comparison. Ann. Bot. 82 (Suppl. A), 17–26.
GOLDSTEIN, D. J., 1970: Aspects of scanning microdensitometry. I. Stray light (glare). J.Microsc. 92, 1–16.
GREILHUBER, J., 1986: Severely distorted Feulgen-DNA amounts in Pinus (Conifero-
phytina) after non additive fixations as a result of self-tanning with vacuole contents.Can. J. Genet. Cytol. 28, 409–415.
GREILHUBER, J., TEMSCH, E. M., 2001: Feulgen densitometry: some observations relevantto best practice in quantitative nuclear DNAcontent determination. Acta Bot. Croat. 60,285–298.
JARVIS, L. R., 1986: A microcomputer system for video image analysis and diagnosticmicrodensitometry. Anal. Quant. Cytol. Histol. 8, 201–209.
JOHNSTON, J. S., BENNETT, M. D., RAYBURN, A. L., GALBRAITH, D. W., PRICE, H. J., 1999:Reference standards for determination of DNA content of plant nuclei. Am. J. Bot. 86,609–613.
KINDERMANN, D., HILGERS, C. H., 1994: Glare-correction in DNA image cytometry. Anal.Cell. Pathol. 6, 165–180.
OBERHOLZER, M., ÖSTREICHER, M., CHRISTEN, H., BRÜHLMANN, M., 1996: Methods inquantitative image analysis. Histochem. Cell Biol. 105, 333–355.
ORMEROD, M. G., TRIBUKAIT, B., GIARRETTI, W., 1998: Consensus report of the task forceon standardisation of DNA flow cytometry in clinical pathology. Anal. Cell. Pathol. 17,103–110.
PIRARD, E., LEBRUN, V., NIVART, J. F., 1999: Optimal acquisition of video images in re-flected light microscopy. European Microscopy and Analysis 60, 9–11.
PUECH, M., GIROUD, F., 1999: Standardisation of DNA quantitation by image analysis:quality control of instrumentation. Cytometry 36, 11–17.
RUSS, J. C., 1998: The image processing handbook. 3rd edn. CRC Press, Boca Raton.
SÁNCHEZ, L., REGH, M., BIESTERFELD, S., CHATELAIN, R., BÖCKING, A., 1990: Performanceof a TV image analysis system as a microdensitometer. Anal. Quant. Cytol. Histol. 12,279–284.
TEMSCH, E. M., GREILHUBER, J., KRISAI, R., 1998: Genome size in Sphagnum (peat moss).Bot. Acta 111, 325–330.
TEMSCH, E. M., GREILHUBER, J., VOGLMAYR, H., KRISAI, R., 1999: Genomgrößen-Bestim-mung bei Sphagnum: ein Methodenvergleich. In: Zechmeister HG, Hrsg. BryologischeForschung in Österreich, Abhandlungen der Zoologisch-Botanischen Gesellschaft inÖsterreich 30, 159–167.
ACTA BOT. CROAT. 61 (1), 2002 25
STANDARDISATION IN DNA IMAGE CYTOMETRY

VILHAR, B., GREILHUBER, J., DOLENC KOCE, J., TEMSCH, E. M., DERMASTIA, M., 2001a:Plant genome size measurement with DNA image cytometry. Ann. Bot. 87,719–728.
VILHAR, B., VIDIC, T., JOGAN, N., DERMASTIA, M., 2001b: Genome size and the nucleolarnumber as estimators of ploidy level in Dactylis glomerata in the Slovenian Alps. PlantSyst. Evol., in press.
YU, F., DRISS-ECOLE, D., REMBUR, J., LEGUÉ, V., PERBAL, G., 1999: Effect of microgravityon the cell cycle in the lentil root. Physiol. Plant. 105, 171–178.
26 ACTA BOT. CROAT. 61 (1), 2002
VILHAR B., DERMASTIA M.