Embed Size (px)
Citation preview
1
STA301- Statistics and Probability Solved Subjective
From Final term Papers
Feb 16,2013
MC100401285 [email protected] [email protected] PSMD01
STA301- Statistics and Probability Final Term Examination - Spring 2012
1- A sample of size n=3 drawn without replacement experiment from a population N=5 items whose
values 0,2,3,6,7 draw possible samples
Answer:-
Sample without replacement = 5
103
N
n
(0,2,3), (0,2,6), (0,2,7), (0,3,6), (0,3,7), (0,6,7), (2,3,6), (2,3,7), (2,6,7), (3,6,7).
2- Calculate sampling error if sample mean is 102 and population mean is 100
Answer:- (Page 14)
Sampling error X
102 100
2
3- Define Unbiased estimator
Answer:- (Page 258) An estimator is defined to be unbiased if the statistic used as an estimator has its expected value equal to the
true value of the population parameter being estimated. E
4- Quartile deviation
Answer:- (Page 84) The quartile deviation is defined as half of the difference between the third and first quartiles.
3 1.2
Q QQ D

2
STA301- Statistics and Probability Final Term Examination - Spring 2012
Q1.decribe about significance level
Answer:
The significance level is the criterion used for rejecting the null hypothesis. It show you how likely a result is
due to chance. The most frequently used values of α, the significance level, are 0.05 and 0.01, i.e. 5 percent and
1 percent.
Q2 .discuss about center limit theorem
Answer:- (Page 243)
“If a variable X from a population has mean μ and finite variance σ/2, then the sampling distribution of the
sample mean⎯X approaches a normal distribution with mean μ and variance σ2/n as the sample size n
approaches infinity.”
Q3. What is difference between constant and random variable
Answer:
A variable whose value cannot be changed once it has been assigned a value while those variable whose values
changes when we assign value to it.
STA301- Statistics and Probability Final Term Examination - Spring 2012
Q: Define an Un-Biased estimator? 2 Marks
Answer: Rep
Q: Briefly Explain an experiment design? 2 Marks
Answer:- (Page 320)
By an experimental design, we mean a plan used to collect the data relevant to the problem under study in such
a way as to provide a basis for valid and objective inference about the stated problem.
Q: Define an independent and dependent variable in regression? 2 Marks
Answer:- (Page 121)
In regression Y represents the dependent variable and X represents the independent variable
3
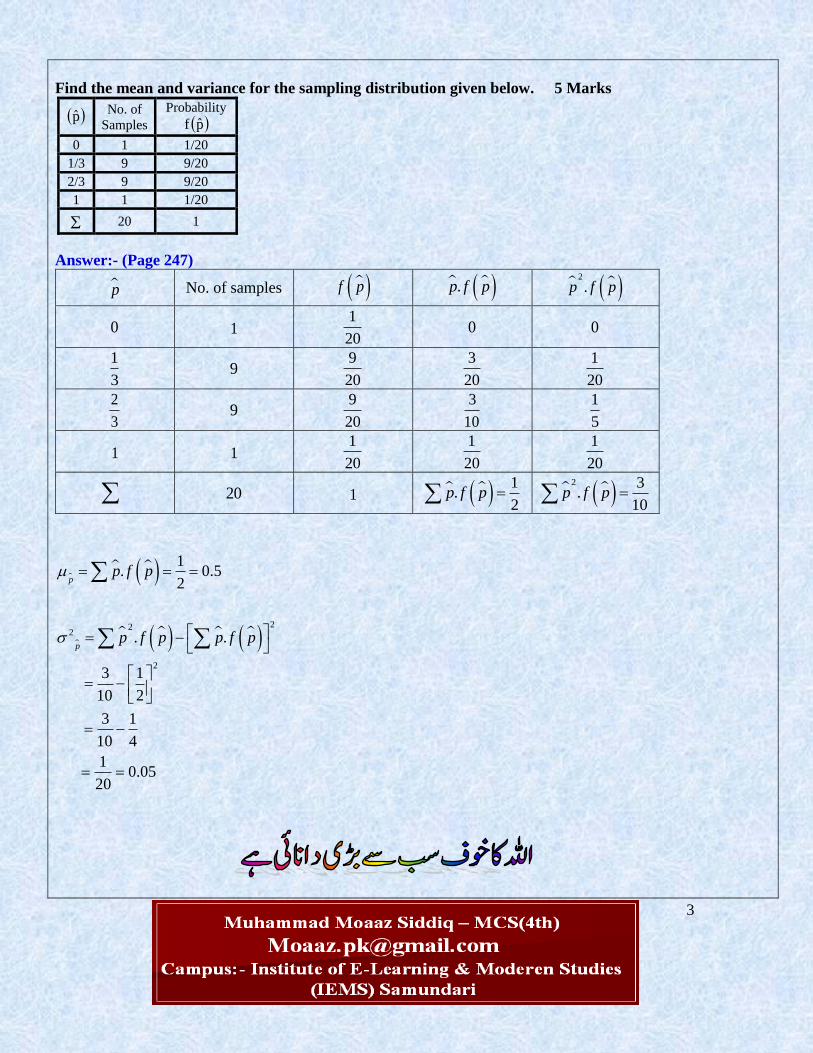
Find the mean and variance for the sampling distribution given below. 5 Marks
Answer:- (Page 247)
p No. of samples f p .p f p 2
.p f p
0 1 1
20 0 0
1
3 9
9
20
3
20
1
20
2
3 9
9
20
3
10
1
5
1 1 1
20
1
20
1
20
20 1 1.
2p f p
2 3.
10p f p
222
2
1. 0.5
2
. .
3 1
10 2
3 1
10 4
10.05
20
p
p
p f p
p f p p f p
p̂
No. of
Samples
Probability
p̂f
0 1 1/20
1/3 9 9/20
2/3 9 9/20
1 1 1/20
20 1
4
STA301- Statistics and Probability Final Term Examination - Spring 2012
What is the difference between an outcome and an event? (2)
Answer:- (Page 145)
An outcome is a result of a single trial of an experiment while an event is an individual outcome or any number
of outcomes.
The mean of a Poisson distribution is 5 while its standard deviation is 4. Comment on it (2)
Answer:- (Page 223)
In Poisson distribution mean and variance are always equal but this statement is not satisfying this property of
Poisson distribution.
If an automobile is driven on the average no more than 16000 Km per year, then formulate the null and
alternative hypothesis. (2)
Answer:
16000
1 16000
H
H
Q: Discuss three properties of normal distribution? 3 Marks
Answer:- (Page 227)
1. Normal distribution is absolutely symmetrical, hence , 3 the third moment about the mean is zero
2. The normal curve is asymptotic to the x-axis as x → ± ∞.
3. For the normal distribution, it can be mathematically proved that 4 43
Q: The 90% confidence interval for the population mean is 11 to 20, interpret this result? 3 Marks
Answer: - We are 90% sure that our Population mean lie between 11 – 20.
Q: Define LSD test? 3 Marks
Answer:- (Page 330)
According to this procedure, we compute the smallest difference that would be judged significant, and compare
the absolute values of all differences of means with it. This smallest difference is called the least significant
difference or
LSD. And is given by
,
2
2
v
MSELSD t
r
5
How many parameters are associated with F- distribution and what is the range of the distribution? (3)
Answer:- (Page 312) It has two parameters v1 and v2 which are known as the degrees of freedom and it ranging from zero to plus
infinity.
Which of the following statement represents continuous data and discrete data? (5) i) Number of shopes in a plaza. Discrete data
ii) Hourly temperature recorded by whether bureau. Continuous data
iii) Inches of rainfall in a city. Continuous data
iv) Number of passengers carried by rail every year. Discrete data
v) Height measurements of boys studying in a college. Discrete data
If the population proportions are gives as: P1 = 0.4, P2 = 0.20
find sigma^2 P-hat 1 - P-hat 2 , where n = 12.
Answer:- (Page 256)
1 1 2 2
1 21 2
1 1
2 2
1 2
1 1 0.40 0.6
1 1 0.20 0.8
0.4 0.6 0.20 0.80
10 10
0.024 0.016
0.04
p p
p p
p q p q
n n
q p
q p
STA301- Statistics and Probability Final Term Examination - Spring 2012
what are steps involved in statistical research
Answer: (Page 11)
STEPS INVOLVED IN ANY STATISTICAL RESEARCH
• Topic and significance of the study
• Objective of your study
• Methodology for data-collection
� Source of your data
� Sampling methodology
� Instrument for collecting data
6
STA301- Statistics and Probability Final Term Examination - Spring 2012
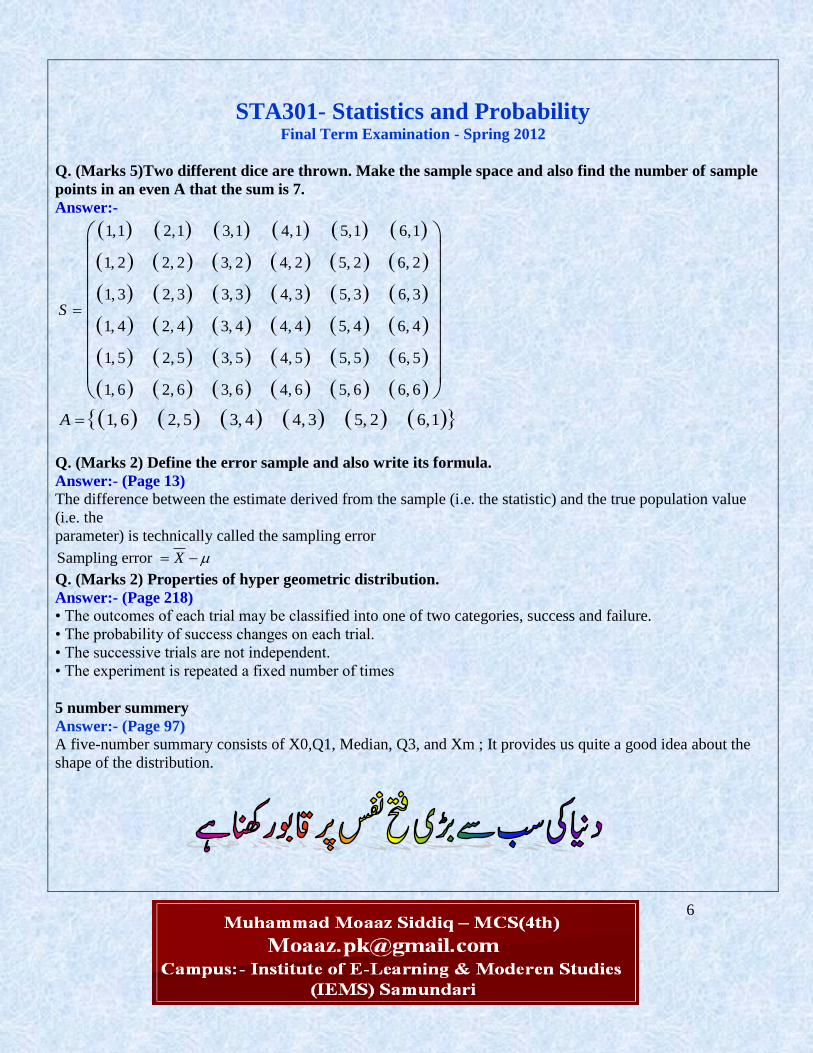
Q. (Marks 5)Two different dice are thrown. Make the sample space and also find the number of sample
points in an even A that the sum is 7.
Answer:-
1,1 2,1 3,1 4,1 5,1 6,1
1, 2 2, 2 3, 2 4, 2 5, 2 6, 2
1, 3 2, 3 3, 3 4, 3 5, 3 6, 3
1, 4 2, 4 3, 4 4, 4 5, 4 6, 4
1, 5 2, 5 3, 5 4, 5 5, 5 6, 5
1, 6 2, 6 3, 6 4, 6 5, 6 6, 6
S
1, 6 2, 5 3, 4 4, 3 5, 2 6,1A
Q. (Marks 2) Define the error sample and also write its formula.
Answer:- (Page 13)
The difference between the estimate derived from the sample (i.e. the statistic) and the true population value
(i.e. the
parameter) is technically called the sampling error
Sampling error X
Q. (Marks 2) Properties of hyper geometric distribution.
Answer:- (Page 218)
• The outcomes of each trial may be classified into one of two categories, success and failure.
• The probability of success changes on each trial.
• The successive trials are not independent.
• The experiment is repeated a fixed number of times
5 number summery
Answer:- (Page 97)
A five-number summary consists of X0,Q1, Median, Q3, and Xm ; It provides us quite a good idea about the
shape of the distribution.

7
STA301- Statistics and Probability Final Term Examination - Spring 2012
1.what s bias?(2)
Answer:- (Page 258)
E(θˆ )≠ θ, the statistic is said to be a biased estimator
2.advantages and disadvantages of median?(3)
Answer:- Click here for detail
Advantages
(1) It is very simple to understand and easy to calculate. In some cases it is obtained simply by inspection.
(2) Median lies at the middle part of the series and hence it is not affected by the extreme values.
(3) In grouped frequency distribution it can be graphically located by drawing ogives.
(4) It is especially useful in open-ended distributions.
Disadvantages
(1) In simple series, the item values have to be arranged. If the series contains large number of items, then the
process becomes tedious.
(2) It is a less representative average because it does not depend on all the items in the series.
3. Mathematical expectation of discrete random variable?(3)
Answer:- (Page 179)
In probability theory the expected value (or mathematical expectation) of a random variable is the sum of the
product of the values within the range of the discrete random variable and their respective probabilities of
occurrence.
1
n
i i
i
E X x f x
4.any two properties of mathematical expectation?(2)
Answer:- (Page 202)
The important properties of the expected values of a random variable are as follows:
• If c is a constant, then E(c) = c. Thus the expected value of a constant is constant itself. This point can be
understood easily by considering the following interesting example: Suppose that a very difficult test was given
to students by a professor, and that every student obtained 2 marks out of 20! It is obvious that the mean mark
is also 2. Since the variable ‘marks’ was a constant, therefore its expected value was equal to itself.
• If X is a discrete random variable and if a and b are constants, then E(aX + b) = a E(X) + b.
5.what s statistical test?(2)
Answer:- (Page 279)
A statistic, which provides a basis for testing a null hypothesis, is called a test-statistic. Every test-statistic has a
probability distribution (i.e. sampling distribution) which gives the probability that our test-statistic will assume
a value greater than or equal to a specified value OR a value less than or equal to a specified value when the
null hypothesis is true.
8
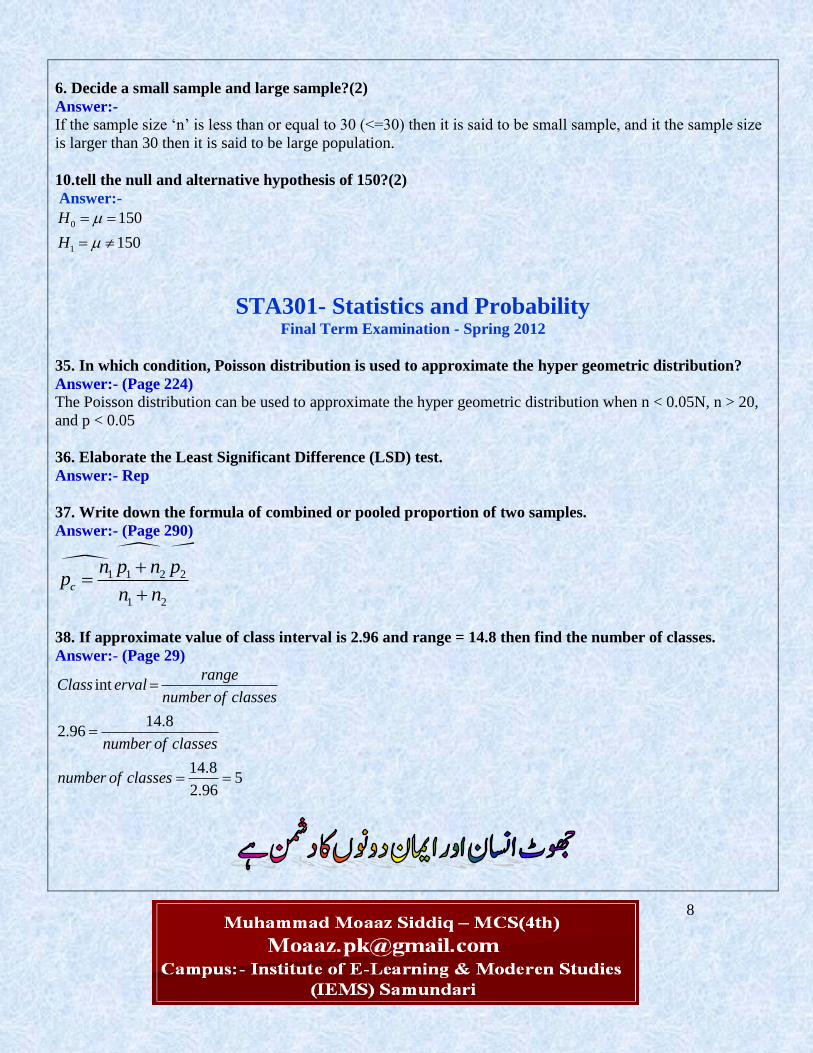
6. Decide a small sample and large sample?(2)
Answer:-
If the sample size ‘n’ is less than or equal to 30 (<=30) then it is said to be small sample, and it the sample size
is larger than 30 then it is said to be large population.
10.tell the null and alternative hypothesis of 150?(2)
Answer:-
0
1
150
150
H
H
STA301- Statistics and Probability Final Term Examination - Spring 2012
35. In which condition, Poisson distribution is used to approximate the hyper geometric distribution?
Answer:- (Page 224)
The Poisson distribution can be used to approximate the hyper geometric distribution when n < 0.05N, n > 20,
and p < 0.05
36. Elaborate the Least Significant Difference (LSD) test.
Answer:- Rep
37. Write down the formula of combined or pooled proportion of two samples.
Answer:- (Page 290)
1 1 2 2
1 2
c
n p n pp
n n
38. If approximate value of class interval is 2.96 and range = 14.8 then find the number of classes.
Answer:- (Page 29)
int
14.82.96
14.85
2.96
rangeClass erval
number of classes
number of classes
number of classes
9
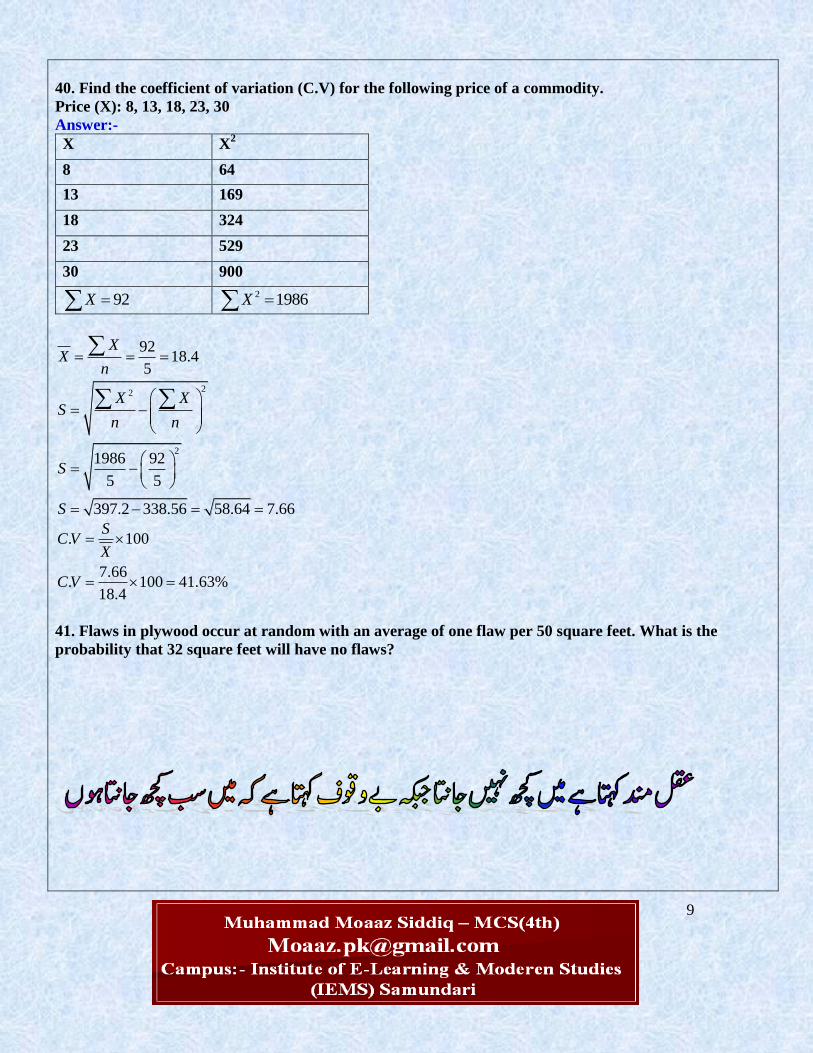
40. Find the coefficient of variation (C.V) for the following price of a commodity.
Price (X): 8, 13, 18, 23, 30
Answer:-
X X2
8 64
13 169
18 324
23 529
30 900
92X 2 1986X
9218.4
5
XX
n
22
21986 92
5 5
397.2 338.56 58.64 7.66
X XS
n n
S
S
. 100
7.66. 100 41.63%
18.4
SC V
X
C V
41. Flaws in plywood occur at random with an average of one flaw per 50 square feet. What is the
probability that 32 square feet will have no flaws?
10
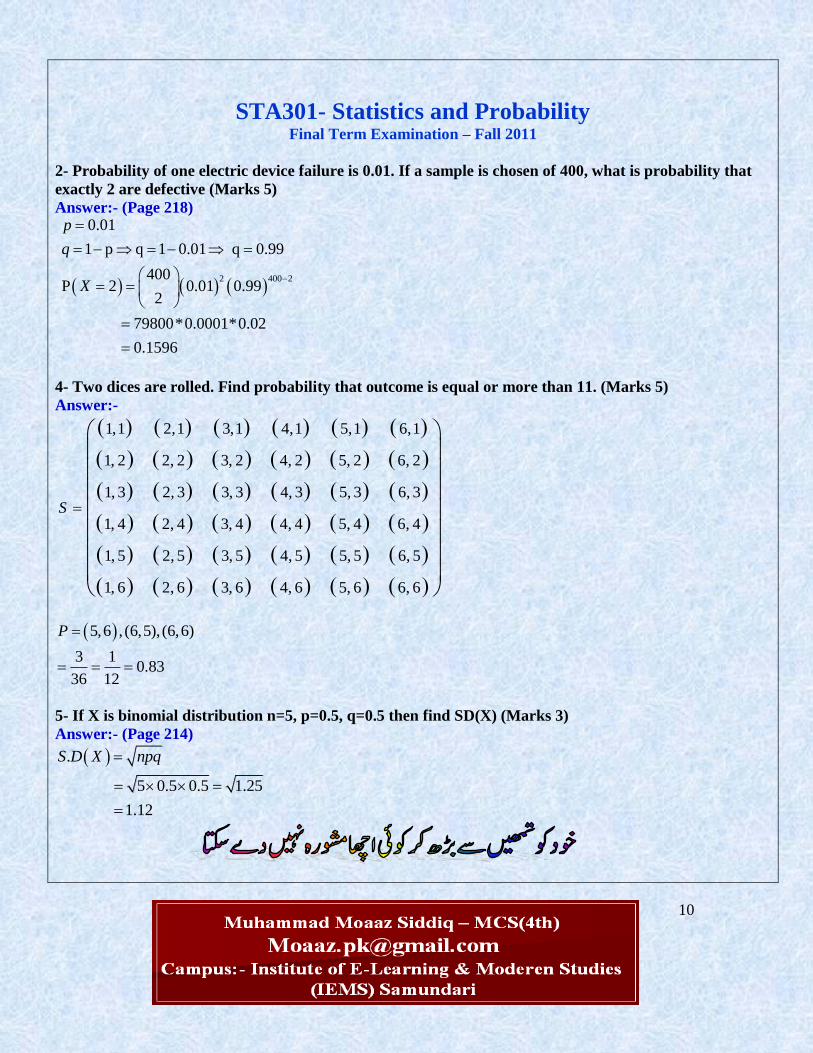
STA301- Statistics and Probability Final Term Examination – Fall 2011
2- Probability of one electric device failure is 0.01. If a sample is chosen of 400, what is probability that
exactly 2 are defective (Marks 5)
Answer:- (Page 218)
2 400 2
0.01
1 p q 1 0.01 q 0.99
400P 2 0.01 0.99
2
79800*0.0001*0.02
0.1596
p
q
X
4- Two dices are rolled. Find probability that outcome is equal or more than 11. (Marks 5)
Answer:-
1,1 2,1 3,1 4,1 5,1 6,1
1, 2 2, 2 3, 2 4, 2 5, 2 6, 2
1, 3 2, 3 3, 3 4, 3 5, 3 6, 3
1, 4 2, 4 3, 4 4, 4 5, 4 6, 4
1, 5 2, 5 3, 5 4, 5 5, 5 6, 5
1, 6 2, 6 3, 6 4, 6 5, 6 6, 6
S
5,6 , (6,5), (6,6)
3 10.83
36 12
P
5- If X is binomial distribution n=5, p=0.5, q=0.5 then find SD(X) (Marks 3)
Answer:- (Page 214)
.
5 0.5 0.5 1.25
1.12
S D X npq
11
6- n=24, Mean=33, s=15, x=40.4. Compute t statistic (Marks 3)
7- 90% confidence interval of population mean is 11 to 20. Interpret result (Marks 3)
Answer:- Rep
8- E(XY)=421, E(X)=42, E(Y)=15. Check independence (Marks 3)
Answer:-
,
421 42 15
209
Cov X Y E XY E X E Y
It is not independent.
9- Difference between statistics and statistic (Marks 3)
Answer:-
Statistics is the plural of statistic, the science that deals with the collection, classification, analysis, and
interpretation of numerical facts or data. While the statistic is a single value or piece of data.
10- Why we call standard deviation the standard error (Marks 2)
Answer:- (Page 240)
The square root of the variance is the standard deviation, and the standard deviation of a sampling distribution
is termed as its standard error.
11- if E(Y)=0.5 then find E(10.5+2Y) ... (Marks 2)
Answer:-
10.5 2
10.5 2
10.5 2*0.5
11.5
E Y
E Y
12- What is the meaning of 'b' in Y=a+bX (Marks 2)
Answer:- (Page 121)
b represents the slope of the line
13- Explain level of significance (Marks 2)
Answer:- rep
12
STA301- Statistics and Probability Final Term Examination – Fall 2011
Q# 28: can all deciles be expressed as percentile? Explain (2) Answer: Yes all deciles cab be expressed as percentiles
As the D1 is 10 percent of data and P10 is 10% of data.
D2 is 20% of data whereas in percentile it is P20 and so on …
Q# 29: what is meant by sampling distribution? (2)
Answer: Page 237 The probability distribution of any statistic (such as the mean, the standard deviation, the proportion of
successes in a sample, etc.) is known as its sampling distribution.
Q# 30: The department claims that the exceeds Rs. 2500 at the 0.05 level, then formulate null alternative
hypothesis?(2)
Answer: Page 283
0
1
: 2500
: 2500
H
H
Q# 31: How we decide that the drawn sample is “Small Sample ” or a “Large Sample”?(2)
Answer: rep
Q# 32: If E(X)=0.7 then find E(2X)? (2)
Answer:
2 2
2*0.7
1.4
E X E X
Q# 33: State the Baye‟s theorem? (3)
Answer: Page 166 If events A1, A2… Ak form a PARTITION of a sample space S (that is, the events Ai are mutually exclusive
and exhaustive (i.e. their union is S)),
and if B is any other event of S such that it can occur ONLY IF ONE OF THE Ai OCCURS, then for any i,
1
//
/
i i
i k
i i
i
P A P B AP A B
P A P B A
Q# 35: “The 95% confidence interval for population mean is 1.3 to 4.7”. Interrupt this result (3) Answer: We are 95% sure that the population mean lies between 1.3 to 4.7
13
Q# 37: If E(XY)=045 E(X)=0.50 and E(Y)=0.90 then X and Y are independent?(3)
Answer:
,
0.45 0.50 0.90
0.45 0.45
0 Therefore it is independent
Cov X Y E XY E X E Y
STA301- Statistics and Probability Final Term Examination – Fall 2011
2 Marks
2) If we draw a card from an ordinary deck of 52 cards. Can king and diamond be mutually exclusive
events? Give reason to support your answer.
Answer:- (Page 146)
No, because If the two events can occur at the same time, they are not mutually exclusive, Therefore, kings and
diamonds are not mutually exclusive.
3) Suppose that we toss a fair coin three times. What is its sample space?
Answer:- {(H,H,H),(H,T,H),(H,H,T),(T,H,H),(T,T,H),(T,H,T),(H,T,T),(T,T,T)}
4) Why we take B2 =3 as the criteria for measuring the kurtosis of any distribution?
Answer:- (Page 228)
For the normal distribution, β2 comes out to be 3, this is why this value has been taken as a criterion for
measuring the kurtosis of any distribution.
5) Define level of significance?
Answer:- rep
6) How we decide that the drawn sample is “Small sample” or a “large sample”?
Answer:- Rep

14
3 Marks
7) If mean of a distribution is 0.925 and standard deviation is 0.132. Find out the limits by applying
chebychev‟s inequality for k=2. How much fraction of data will lie between the two limits?
Answer:- (Page 95)
,
0.925 2 0.132 ,0.925 2 0.132
0.925 0.264,0.925 0.264
0.661,1.189
X kS X kS
95% of the measurements will fall within these limits.
8) If E(XY)=7.5, E(X)=2.4 and E(Y)=4.3, calculate covariance of X and Y.
Answer:-
,
7.5 2.4 4.3
7.5 10.32
2.82
Cov X Y E XY E X E Y
11) Write down the two properties of sampling distribution of proportion p‟, when the sampling is
performed with replacement?
Answer:- (Page 241)
Property 1: X
Property 2: In case of sampling with replacement:
Xn
12) What is natural pairing in observations? Give example.
Answer:- (Page 302)
Natural pairing occurs whenever measurement is taken on the same unit or individual at two different times.
For example, suppose ten young recruits are given a strenuous physical training programme by the Army. Their
weights are recorded before they begin and after they complete the training. The two observations obtained for
each recruit i.e. the before-and-after measurement constitute natural pairing. The above is natural pairing.
15
5 Marks
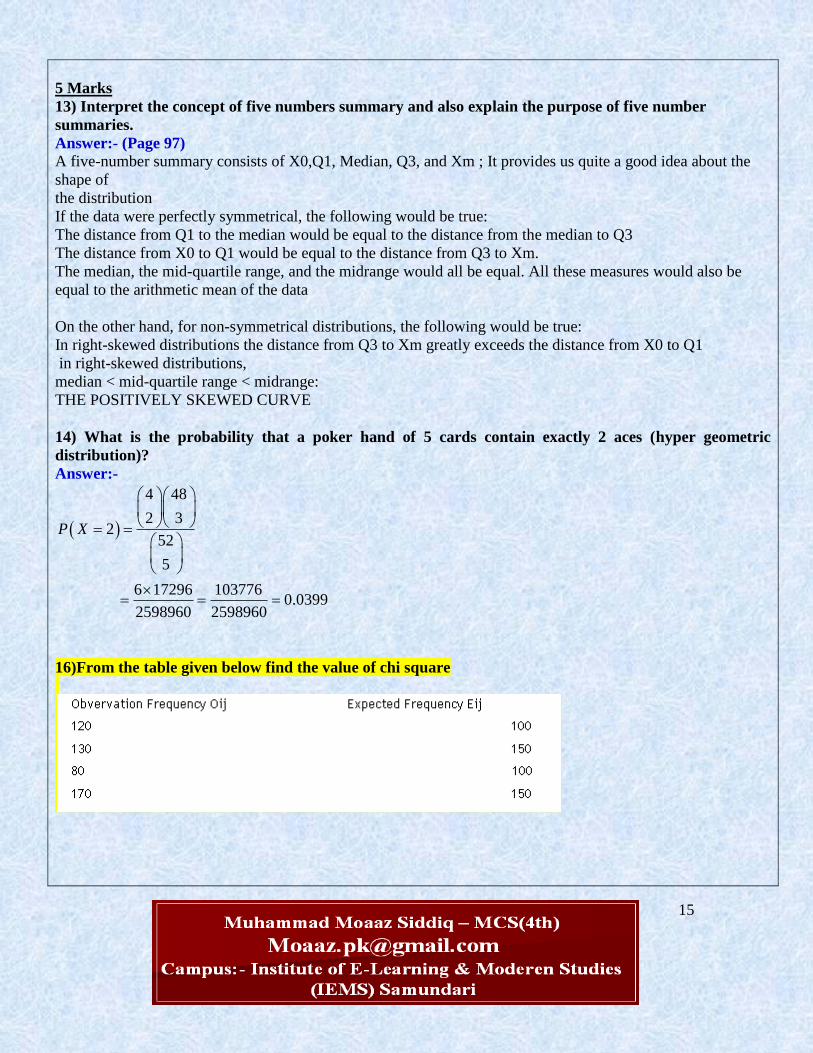
13) Interpret the concept of five numbers summary and also explain the purpose of five number
summaries.
Answer:- (Page 97)
A five-number summary consists of X0,Q1, Median, Q3, and Xm ; It provides us quite a good idea about the
shape of
the distribution
If the data were perfectly symmetrical, the following would be true:
1. The distance from Q1 to the median would be equal to the distance from the median to Q3
2. The distance from X0 to Q1 would be equal to the distance from Q3 to Xm.
3. The median, the mid-quartile range, and the midrange would all be equal. All these measures would also be
equal to the arithmetic mean of the data
On the other hand, for non-symmetrical distributions, the following would be true:
1. In right-skewed distributions the distance from Q3 to Xm greatly exceeds the distance from X0 to Q1
2. in right-skewed distributions,
median < mid-quartile range < midrange:
THE POSITIVELY SKEWED CURVE
14) What is the probability that a poker hand of 5 cards contain exactly 2 aces (hyper geometric
distribution)?
Answer:-
4 48
2 32
52
5
6 17296 1037760.0399
2598960 2598960
P X
16)From the table given below find the value of chi square
16
STA301- Statistics and Probability Final Term Examination – Fall 2011
the mean of a population is 6 a sample of size '20' is taken with replacement from this population.which
one of the following is the mean of sampling distribution of mean.
1) 2 2) 8 3) 6 4) 3
Answer:-
6
Q no 2 Write down the significance of experimental design? marks :2
Answer:- Rep
Q No: 03 Explain the formula of hyper geometric probability distribution. marks :2
Answer:- (Page 219)
k N k
n n xP X x
N
n
Where
N = number of units in the population,
n = number of units in the sample, and
k = number of successes in the population.
The hyper geometric probability distribution has three parameters N, n and k.
Q no 5
Suppose that we toss a fair coin three times. What is the sample space? marks :2
Answer:- Rep
Compute the following formula which is used to find the sample size. Answer:- For finding sample space of coin the formula is: 2
n =2
3 = 8
If x is a passion random variable with parameter value „4.5‟, find p(x=1)? Marks: 03
Answer:- (Page 222)
14.5 4.51
1!
0.0499
eP X
17
Q no: 09
When the value of chi-square is equal to zero? Marks : 03
Answer:- (Page 338) If the observed frequencies are exactly equal to the expected ones, then chi-square will be exactly equal to zero.
Q no: 10 If x= 255, n=634, Po=0.60 then find the z-test statistics for probability. Marks: 03
Answer:- (Page 289)
0
0 0
0
0
0
0 0
1
2
1
634*0.60 380.4
1
2
1
2
1
1225 380.4
2
380.4 1 0.60
154.9
12.34
12.55
X np
Znp p
np
here X np therefore weuse X
X np
Znp p
Z
Z
Z
STA301- Statistics and Probability Final Term Examination – Fall 2010
Describe the formula for hypergeometric distribution? 2 marks
Answer:- Rep
What is graphical representation? 2 marks
Answer:-
The plot of the points in the plane which constitute the graph of a given real function or a pictorial diagram
depicting interdependence of variables.
18
What is the t formula for paired distribution? 3marks.
Answer:- (Page 302)
/
d
d
dt
s n
What is the probability that at least one head occurs if a coin tossed 6 times successively? 5 marks
Answer:- 1 6 1
1 5
6 1 1( 1) . .
1 2 2
6 1 1. .
1 2 2
3.03
P X
Find first 2 moments for function with respect to mean? 5 marks
Answer:- (Page 192)
16)From the table given below find the value of chi square
Obvervation Frequency Oij Expected Frequency Eij
120 100
130 150
80 100
170 150
Answer:- Rep
STA301- Statistics and Probability Final Term Examination – Fall 2010
Q no 5
Suppose that we toss a fair coin three times. what is the sample space? marks :2
Answer: Rep

19
Compute the following formula which is used to find the sample size.
/ 2Zn
e
Page 276
FINALTERM EXAMINATION
Spring 2010
STA301- Statistics and Probability (Session - 4)
Question No: 31 ( Marks: 2 )
What is the mean and variance of Poisson distribution?
Answer:- (Page 233)
If the random variable X has a Poisson distribution with parameter μ, then its mean and variance are given by
E(X) = μ and Var(X) = μ.
Question No: 32 ( Marks: 2 )
Explain the Chi-square test of goodness of fit.
Answer:- (Page 332)
The chi-square test of goodness-of-fit is a test of hypothesis concerned with the comparison of observed
frequencies of a sample, and the corresponding expected frequencies based on a theoretical distribution.
Question No: 33 ( Marks: 2 )
Define level of significance?
Answer:- Rep
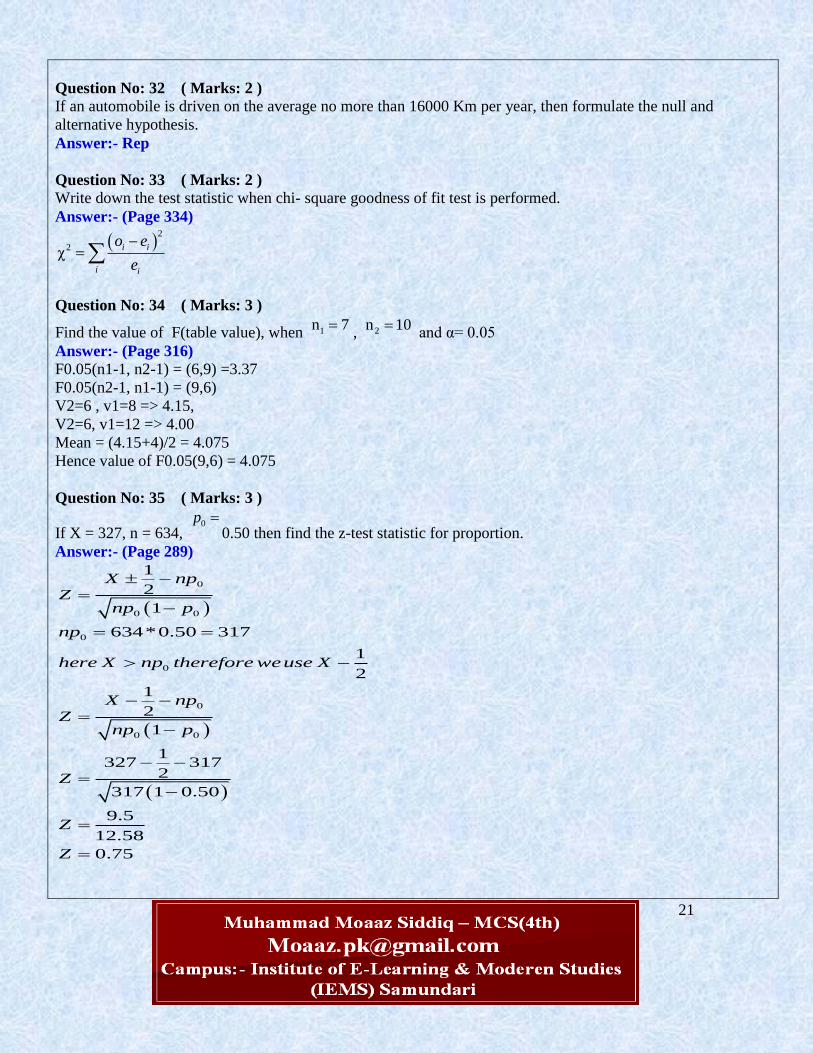
Question No: 34 ( Marks: 3 )
Find the value of F(table value), when , and α= 0.05
Answer:- (Page 316)
Question No: 35 ( Marks: 3 )
Define Null and Alternative hypothesis.
Answer:- Rep
1n 7 2n 10
20
Question No: 36 ( Marks: 3 )
A random sample of 100 is taken from a population with mean 30 and standard deviation 5. The probability
distribution of the parent population is unknown, find the mean and standard error of the sampling distribution
of X .
Question No: 37 ( Marks: 5 )
What is the probability that a poker hand of 5 cards contain exactly 2 aces (hypergeometric distribution)?
Answer:- Rep
Question No: 38 ( Marks: 5 )
A random sample of size n is drawn from normal population with mean 5 and variance2.
If n=25, s=10 and t=2, what is the values of x
?
Question No: 39 ( Marks: 5 )
Describe the main steps of General Procedure for Testing Hypothesis.
Answer:- (Page 281)
Step-1:
Formulation of the Null and Alternative Hypotheses:
Step-2:
Decision Regarding the Level of Significance
Step-3:
Test Statistic (that statistic that will enable us to test our hypothesis):
Step-4:
Calculations:
Step-5:
Critical Region (that portion of the X-axis which compels us to reject the null hypothesis):
Step-6:
Conclusion:
FINALTERM EXAMINATION
Spring 2010
STA301- Statistics and Probability (Session - 4)
Question No: 31 ( Marks: 2 )
How many parameters are involved in hyper geometric distribution?
Answer:- (Page 291)
The hyper geometric probability distribution has three parameters N, n and k.
21
Question No: 32 ( Marks: 2 )
If an automobile is driven on the average no more than 16000 Km per year, then formulate the null and
alternative hypothesis.
Answer:- Rep
Question No: 33 ( Marks: 2 )
Write down the test statistic when chi- square goodness of fit test is performed.
Answer:- (Page 334)
2
2χi i
i i
o e
e
Question No: 34 ( Marks: 3 )
Find the value of F(table value), when , and α= 0.05
Answer:- (Page 316)
F0.05(n1-1, n2-1) = (6,9) =3.37
F0.05(n2-1, n1-1) = (9,6)
V2=6 , v1=8 => 4.15,
V2=6, v1=12 => 4.00
Mean = (4.15+4)/2 = 4.075
Hence value of F0.05(9,6) = 4.075
Question No: 35 ( Marks: 3 )
If X = 327, n = 634, 0.50 then find the z-test statistic for proportion.
Answer:- (Page 289)
0
0 0
0
0
0
0 0
1
2
1
634*0.50 317
1
2
1
2
1
1327 317
2
317 1 0.50
9.5
12.58
0.75
X np
Znp p
np
here X np therefore weuse X
X np
Znp p
Z
Z
Z
1n 7 2n 10
0p
22
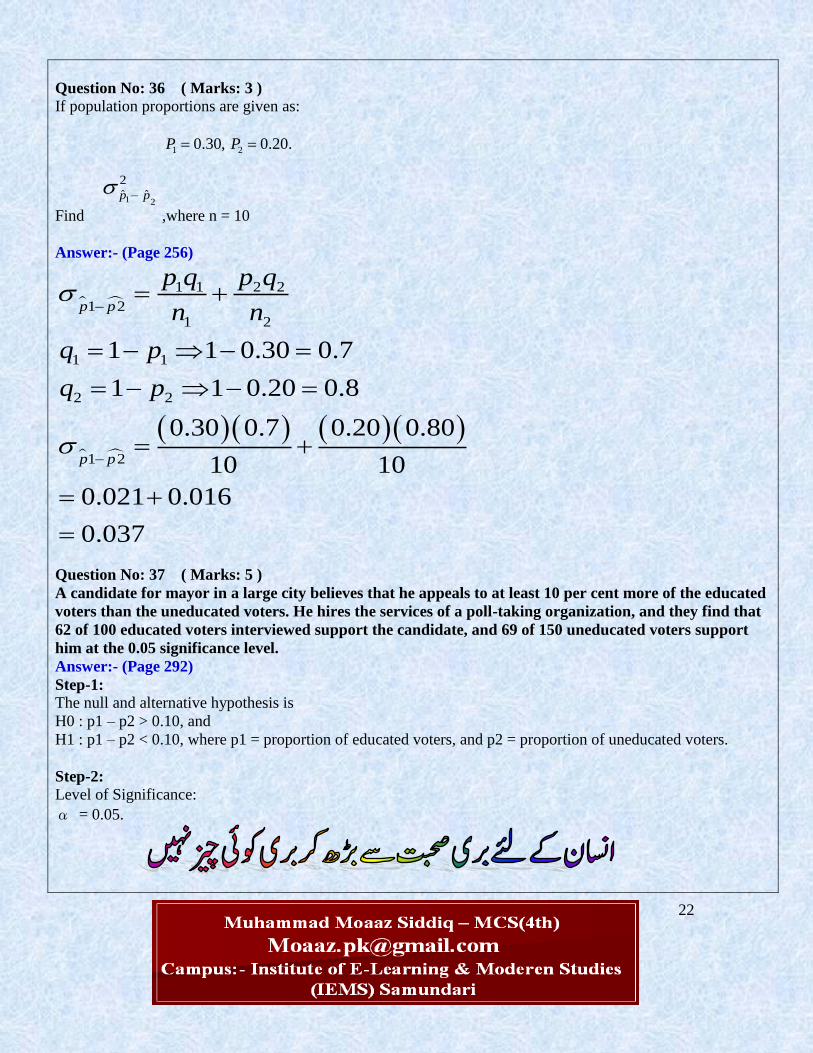
Question No: 36 ( Marks: 3 )
If population proportions are given as:
Find ,where n = 10
Answer:- (Page 256)
1 1 2 2
1 21 2
1 1
2 2
1 2
1 1 0.30 0.7
1 1 0.20 0.8
0.30 0.7 0.20 0.80
10 10
0.021 0.016
0.037
p p
p p
p q p q
n n
q p
q p
Question No: 37 ( Marks: 5 )
A candidate for mayor in a large city believes that he appeals to at least 10 per cent more of the educated
voters than the uneducated voters. He hires the services of a poll-taking organization, and they find that
62 of 100 educated voters interviewed support the candidate, and 69 of 150 uneducated voters support
him at the 0.05 significance level.
Answer:- (Page 292)
Step-1:
The null and alternative hypothesis is
H0 : p1 – p2 > 0.10, and
H1 : p1 – p2 < 0.10, where p1 = proportion of educated voters, and p2 = proportion of uneducated voters.
Step-2:
Level of Significance:
α = 0.05.
1 2
2
ˆ ˆp p
1 20.30, 0.20.P P
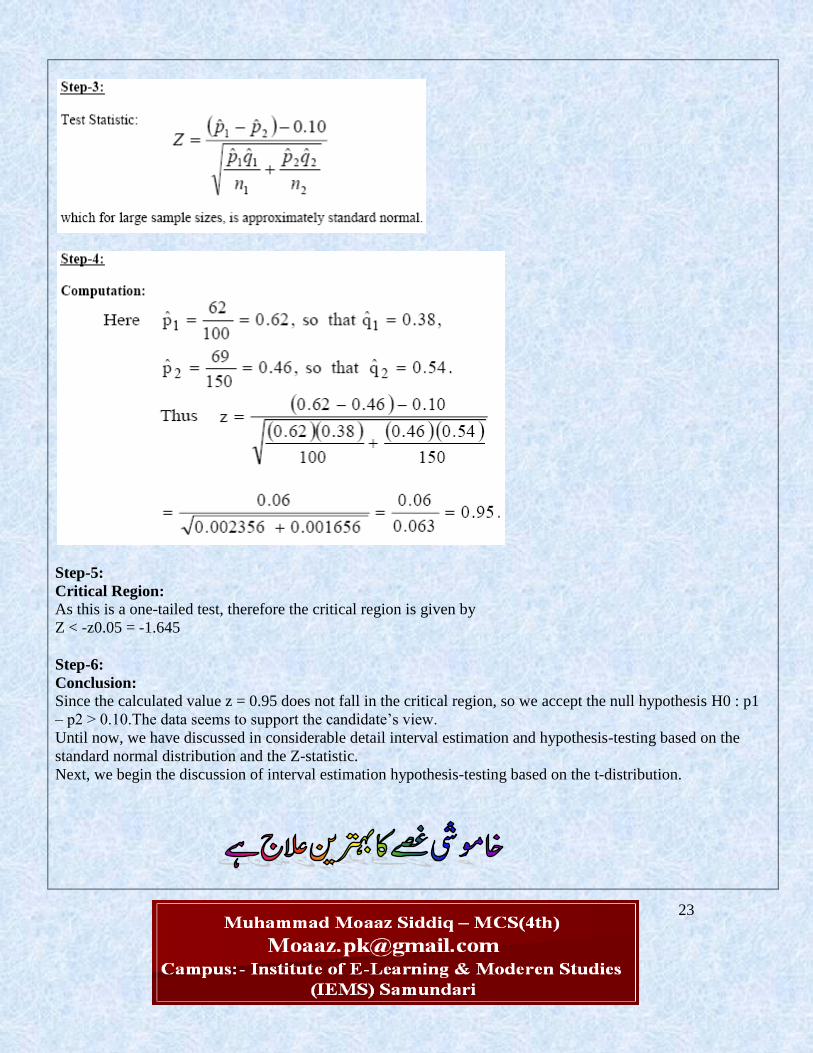
23
Step-5:
Critical Region:
As this is a one-tailed test, therefore the critical region is given by
Z < -z0.05 = -1.645
Step-6:
Conclusion:
Since the calculated value z = 0.95 does not fall in the critical region, so we accept the null hypothesis H0 : p1
– p2 > 0.10.The data seems to support the candidate’s view.
Until now, we have discussed in considerable detail interval estimation and hypothesis-testing based on the
standard normal distribution and the Z-statistic.
Next, we begin the discussion of interval estimation hypothesis-testing based on the t-distribution.

24
Question No: 38 ( Marks: 5 )
If we have RCBD with MSE=3.19, no.of.treatments = 4, no.of.blocks = 5; then find the value of LSD
(least significant difference) for treatments by using α=0.05 and error degrees of freedom is 12.
Answer:- Rep
Question No: 39 ( Marks: 5 )
Find the mean and variance for the sampling distribution given below.
Answer:- Rep
FINALTERM EXAMINATION
Spring 2010
STA301- Statistics and Probability (Session - 3)
Question No: 31 ( Marks: 2 )
Define normal distribution.
Answer:- (Page 226)
A continuous random variable is said to be normally distributed with mean μ and standard deviation σ if its
probability
density function is given by
21
21
2
x
f x e
Question No: 32 ( Marks: 2 )
Fill up the missing values in the formula.
p̂
No. of
Samples
Probability
p̂f
0 1 1/20
1/3 9 9/20
2/3 9 9/20
1 1 1/20
20 1
2
/2 ˆˆ pq n

25
Answer:- (Page 277)
2
/2
2
z p qn
e
Question No: 33 ( Marks: 2 )
Explain the Chi-square test of goodness of fit.
Answer:- Rep
Question No: 34 ( Marks: 3 )
What is natural pairing in observations? Also give an example.
Answer:- Rep
Question No: 35 ( Marks: 3 )
If population proportions are given as:
Find
1 2
2
ˆ ˆp p
,where n = 10
Answer:- Rep
Question No: 36 ( Marks: 3 )
Explain the method of Maximum Likelihood in Point Estimation?
Answer:- Page 263
The method of maximum likelihood is regarded as the MOST important method of estimation, and is the most
widely used method. This method was introduced in 1922 by Sir Ronald A. Fisher (1890-1962).The
mathematical technique of finding Maximum Likelihood Estimators is a bit advanced, and involves the concept
of the Likelihood Function.
Question No: 37 ( Marks: 5 )
The following data was obtained for a randomized block design involving five treatments and three blocks
SST=430, SSTR=310, SSB=85, Setup the ANOVA table.
Answer:- (Page 332)
Source d.f SS MS
Between
treatments
4 430 107.5
Between
Blocks
2 85 42.5
Error 8 310 38.75
Total 14 825 188.75
1 20.30, 0.20.P P
26
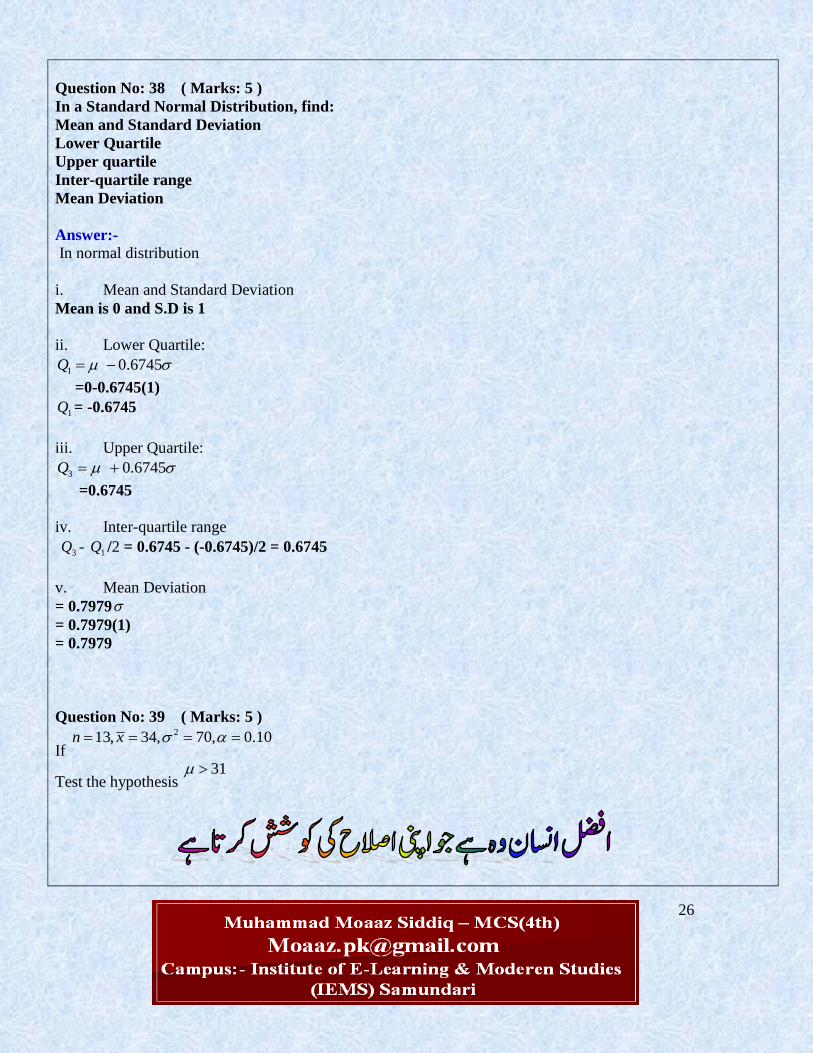
Question No: 38 ( Marks: 5 )
In a Standard Normal Distribution, find:
i. Mean and Standard Deviation
ii. Lower Quartile
iii. Upper quartile
iv. Inter-quartile range
v. Mean Deviation
Answer:-
In normal distribution
i. Mean and Standard Deviation
Mean is 0 and S.D is 1
ii. Lower Quartile:
1 0.6745Q
=0-0.6745(1)
1Q = -0.6745
iii. Upper Quartile:
3 0.6745Q
=0.6745
iv. Inter-quartile range
3Q - 1Q /2 = 0.6745 - (-0.6745)/2 = 0.6745
v. Mean Deviation
= 0.7979
= 0.7979(1)
= 0.7979
Question No: 39 ( Marks: 5 )
If
213, 34, 70, 0.10n x
Test the hypothesis 31

27
Answer:-
0
1
30
30
H
H
Level of significance =0.10
/2=0.05
Critical region=z>1.645
Xz
n
Z=34 31
2.32
Z=1.29
Conclusion: Since the value Z=1.29 is less than the value of critical region so we accepted 0H at 0.10 Level of
significance.
FINALTERM EXAMINATION
Fall 2009
STA301- Statistics and Probability (Session - 4)
Question No: 21 ( Marks: 1 )
Write down the formula for binomial distribution.
Answer:- (Page 212)
x n xn
P X x p qx
Question No: 22 ( Marks: 2 )
Write down the formula for testing the equality of two population proportions.
Answer:- (Page 290)
1 2
1 2
0
1 1c c
p pZ
p qn n

28
Question No: 23 ( Marks: 3 )
Define moment ratios. In which unit they are expressed?
Answer:- (Page 119)
2
3 41 23 2
2 2
m mb and b
m m
They are independent of origin and units of measurement, i.e. they are pure numbers.