Embed Size (px)
DESCRIPTION
IT Budget Study 2014
Citation preview

2014 IT Budget Report 1You Back, Union Jack? 1
2014 State of IT Budget ReportA microscopic view of North America IT spend in 2014.
J a n u a r y 2 0 1 4 | # I T B u d g e t s
Fre e I T re p o r t s o n to d ay ’s h o t te s t te c h to p i c s a n d t re n d s.
$$
$$$$
$$$$$$$$$$
$$
$$
$
$
$$ $$
$$
$$
$$
$$$
$$
$$
$$
$
$
$$ $
$
SPICELABP R O P E R T Y O F T H E

2 Spiceworks VoIT Report: January 2014 | #ITBudgets
$$
$$
$$
$$$
$$
$$
$$
$
$
$$ $
$
$
$$
$$
$
$
$
$
$$
$
$$$
$$$$
$$
$$
$
$
$$

TABLE OF CONTENTS
01 2014: THE THEORY OF POSITIVITY
02 PERIODIC TABLEOF TECH
03 ATOMIC MASS: HARDWARE
05 ATOMIC MASS: CLOUD
06 ATOMIC MASS:MANAGED SERVICES
PAGE 06
PAGE 08
PAGE 10
PAGE 16
PAGE 20
$$
$$
$$
$$$
$$
$$
$$
$
$
$$ $
$
$
$$
$$
$
$
$
$
$$
$
$$$
$$$$
$$
$$
$
$
$$
04 ATOMIC MASS: SOFTWAREPAGE 14
07 IT PURCHASING,MAGNIFIEDPAGE 22
08 EVALUATING ITPAGE 24

4 Spiceworks VoIT Report: January 2014 | #ITBudgets
ADDING IT UP
According to Forrester, IT budgets in North America are estimated to reach $976 billion in 2014. So how do IT pros plan to divvy up the dough over the coming year?
And how should savvy tech marketers laser focus their campaigns? We threw on our trusty lab coats and peered deep into the inner workings of 2014 IT budget plans.
After careful examination of our one-of-a-kind user base, we refined our data to give you the essence of IT investment.
North American IT pros plan to spend an
average of $302,000 on hardware, software,
and hosted & managed services in 2014.
We broke down the elements to see what
technologies will get the mass of IT dollars.
2014 IT Budget Report 5
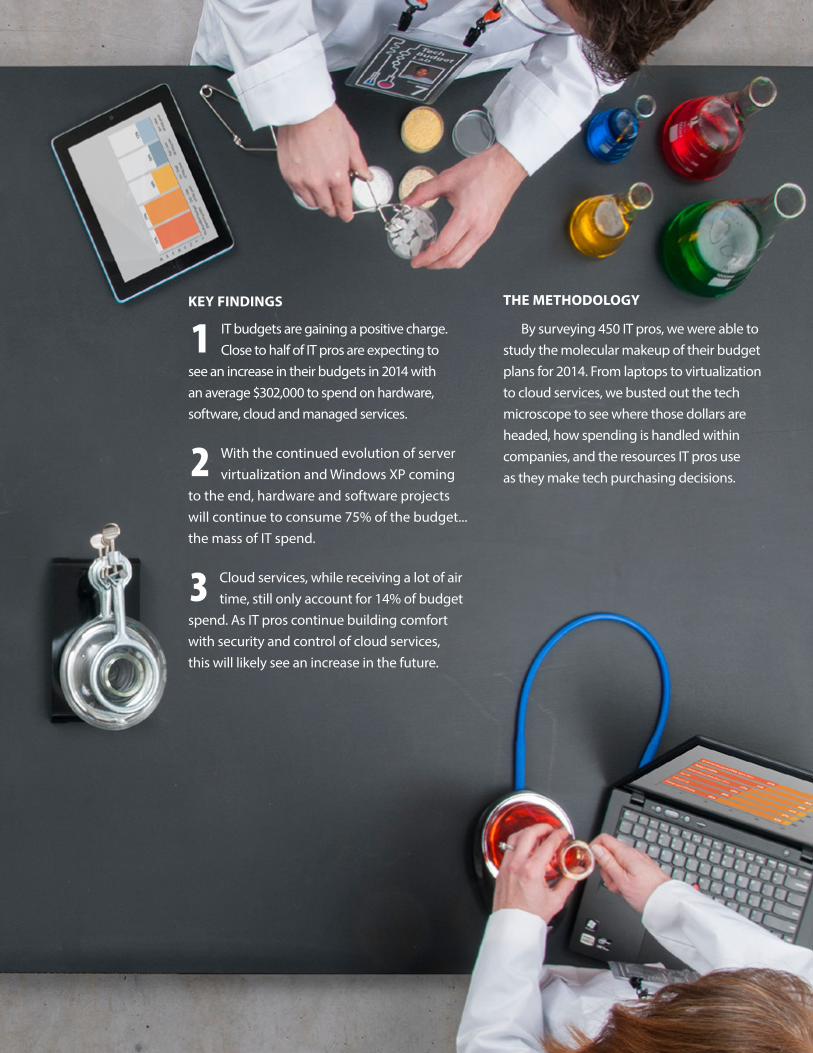
THE METHODOLOGYKEY FINDINGS
IT budgets are gaining a positive charge. Close to half of IT pros are expecting to
see an increase in their budgets in 2014 with an average $302,000 to spend on hardware, software, cloud and managed services.
With the continued evolution of server virtualization and Windows XP coming
to the end, hardware and software projects will continue to consume 75% of the budget... the mass of IT spend.
Cloud services, while receiving a lot of air time, still only account for 14% of budget
spend. As IT pros continue building comfort with security and control of cloud services, this will likely see an increase in the future.
By surveying 450 IT pros, we were able to study the molecular makeup of their budget plans for 2014. From laptops to virtualization to cloud services, we busted out the tech microscope to see where those dollars are headed, how spending is handled within companies, and the resources IT pros use as they make tech purchasing decisions.
1
2
3

6 Spiceworks VoIT Report: January 2014 | #ITBudgets
012014: THE THEORYOF POSITIVITY IT pros have chimed in with an edu-cated hunch: 2014 revenues, budgets and headcounts are likely to increase in the coming year for many compared to 2013. Over half of respondents predict revenues will increase, nearly half foresee budgets getting a boost, and almost half predict headcount… to head up.
What’s with the positive outlook? The atmosphere of confidence is likely due to broader North American economic trends. With unemployment down, the stock market up, and credit expansions to both businesses and households, there appears to be momentum toward good old-fashioned growth.

2014 IT Budget Report 7
Let’s start planning our IT budgets now! Actually, how about two months from now? On second thought, five months ago sounds about right. When it comes to a concrete start date for tech budget planning, well… a few variables factor in. So, what’s the deal with IT pros being a little… uncertain on the science of timely budgeting?
According to our research, smaller organiza-tions seem to operate on a less structured calendar than their larger counterparts. What’s that mean for tech marketers? Knowing when to make contact might be more art than science, but IT pros do have a preference.
TECH BUDGET PLANNING: UNPREDICTABLE ELEMENTS
Revenue change
IT Budget change
Headcount change
Increase Stay the same Decrease Don’t know
57%
20%
10%
13%
47%
32%
16%
5%
45%
10%5%
39%
COMPANY REVENUE, BUDGET & HEADCOUNT CHANGES FROM 2013 TO 2014:
0
5
10
15
20
25
30
3531%
No standard budget
planning date
Oct - Decof 2013
July - Septof 2013
Apr - Jun of 2013
Jan - Marof 2013
31%
16%
10%12%
WHEN 2014 IT BUDGET PLANNING KICKED OFF
Subatomic Insight: Find out when it’s best to engage with IT pros.
8 Spiceworks VoIT Report: January 2014 | #ITBudgets
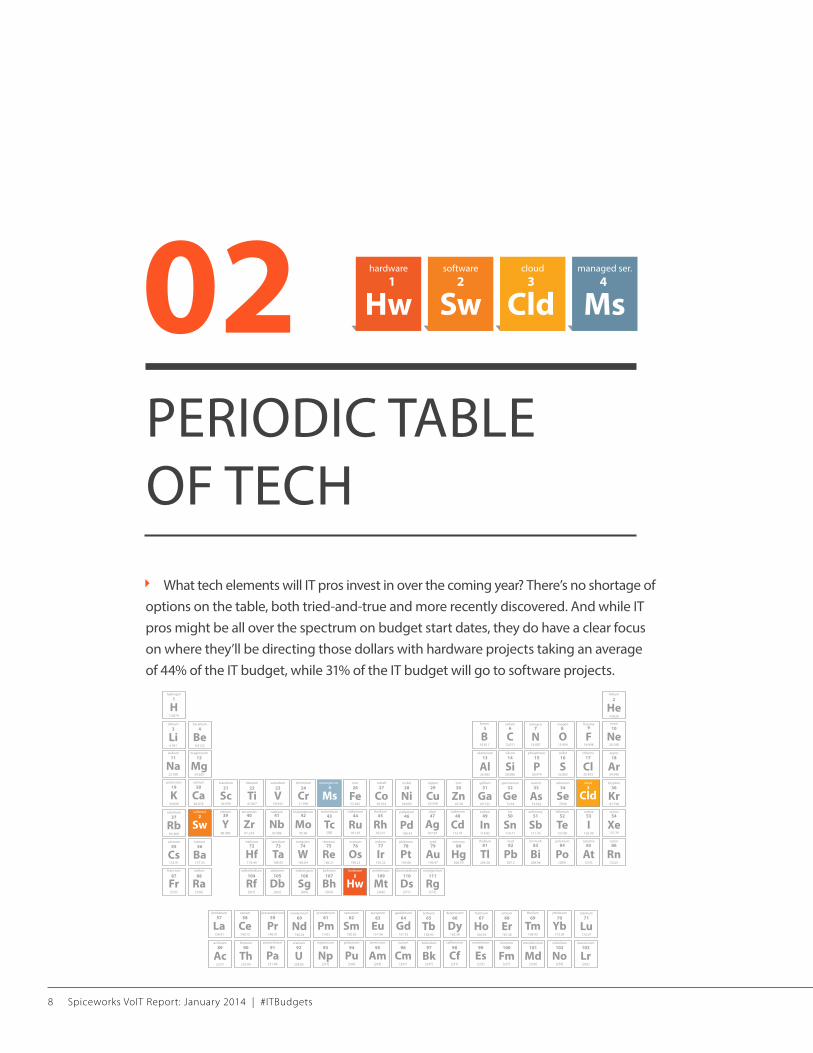
02PERIODIC TABLE OF TECH What tech elements will IT pros invest in over the coming year? There’s no shortage of options on the table, both tried-and-true and more recently discovered. And while IT pros might be all over the spectrum on budget start dates, they do have a clear focus on where they’ll be directing those dollars with hardware projects taking an average of 44% of the IT budget, while 31% of the IT budget will go to software projects.
hardware
Hw1
software
Sw2
cloud
Cld3
managed ser.
Ms4
nitrogen
14.007N
7
helium
He4.0026
2
neon
Ne20.180
10�uorine
F18.998
9oxygen
O15.999
8carbon
C12.011
6boron
B10.811
5
argon
Ar39.948
18chlorine
Cl35.453
17sulfur
S32.065
16phosphorus
P30.974
15silicon
Si28.086
14aluminium
Al26.982
13
krypton
Kr83.798
36cloud
Cld3
selenium
Se78.96
34arsenic
As74.922
33germanium
Ge72.64
32gallium
Ga69.723
31zinc
Zn65.38
30copper
Cu63.546
29nickel
Ni58.693
28cobalt
Co58.933
27iron
Fe55.845
26managed ser.
Ms4
chromium
Cr51.996
24vanadium
V50.942
23titanium
Ti47.867
22scandium
Sc44.956
21calcium
Ca40.078
20potassium
K39.098
19
magnesium
Mg24.305
12sodium
Na22.990
11
beryllium
Be9.0122
4lithium
Li6.941
3
hydrogen
H1.0079
1
xenon
Xe131.29
54iodine
I126.90
53tellurium
Te127.60
52antimony
Sb121.76
51tin
Sn118.71
50indium
In114.82
49cadmium
Cd112.41
48silver
Ag107.87
47palladium
Pd106.42
46rhodium
Rh102.91
45ruthenium
Ru101.07
44technetium
Tc[98]
43molybdenum
Mo95.96
42niobium
Nb92.906
41zirconium
Zr91.224
40yttrium
Y88.906
39software
Sw2
rubidium
Rb85.468
37
radon
Rn[222]
86astatine
At[210]
85polonium
Po[209]
84bismuth
Bi208.98
83lead
Pb207.2
82
dysprosium
Dy162.50
66terbium
Tb158.93
65gadolinium
Gd157.25
64europium
Eu151.96
63samarium
Sm150.36
62promethium
Pm[145]
61neodymium
Nd144.24
60praseodymium
Pr140.91
59cerium
Ce140.12
58lanthanum
La138.91
57
barium
Ba137.33
56caesium
Cs132.91
55
roentgenium
Rg[272]
111darmstadtium
Ds[271]
110meitnerium
Mt[268]
109hardware
Hw1
bohrium
Bh[264]
107seaborgium
Sg[266]
106dubnium
Db[262]
105rutherfordium
Rf[261]
104radium
Ra[226]
88francium
Fr[223]
87
lutetium
Lu174.97
71ytterbium
Yb173.05
70thulium
Tm168.93
69erbium
Er167.26
68holmium
Ho164.93
67
thallium
Tl204.38
81mercury
Hg200.59
80gold
Au196.97
79platinum
Pt195.08
78iridium
Ir192.22
77osmium
Os190.23
76rhenium
Re186.21
75tungsten
W183.84
74tantalum
Ta180.95
73hafnium
Hf178.49
72
berkelium
Bk[247]
97lawrencium
Lr[262]
103nobelium
No[259]
102mendelevium
Md[258]
101fermium
Fm[257]
100einsteinium
Es[252]
99californium
Cf[251]
98curium
Cm[247]
96americium
Am[243]
95plutonium
Pu[244]
94neptunium
Np[237]
93uranium
U238.03
92protactinium
Pa231.04
91thorium
Th232.04
90actinium
Ac[227]
89

2014 IT Budget Report 9
Despite the hype surrounding cloud it’s considerably lower on the periodic tech scale, though still in the top three at 14%. A few reasons cloud is further down the rung: IT pros are hesitant to make infrastructure changes, they still have lingering security concerns, and they haven’t worked out some compliance issues.
ALLOCATION OF 2014 ANNUAL BUDGET
Subatomic Insight: See why cloud isn’t topping the IT budget priority list.
Managed services projects
11%
Hosted/cloud-basedservices projects
14%
Software projects
31%
Hardware projects
44%
(What percentage of your annual IT budget do you plan to allocate to each of the following areas?)
Average annual North American budget = $302,000
10 Spiceworks VoIT Report: January 2014 | #ITBudgets
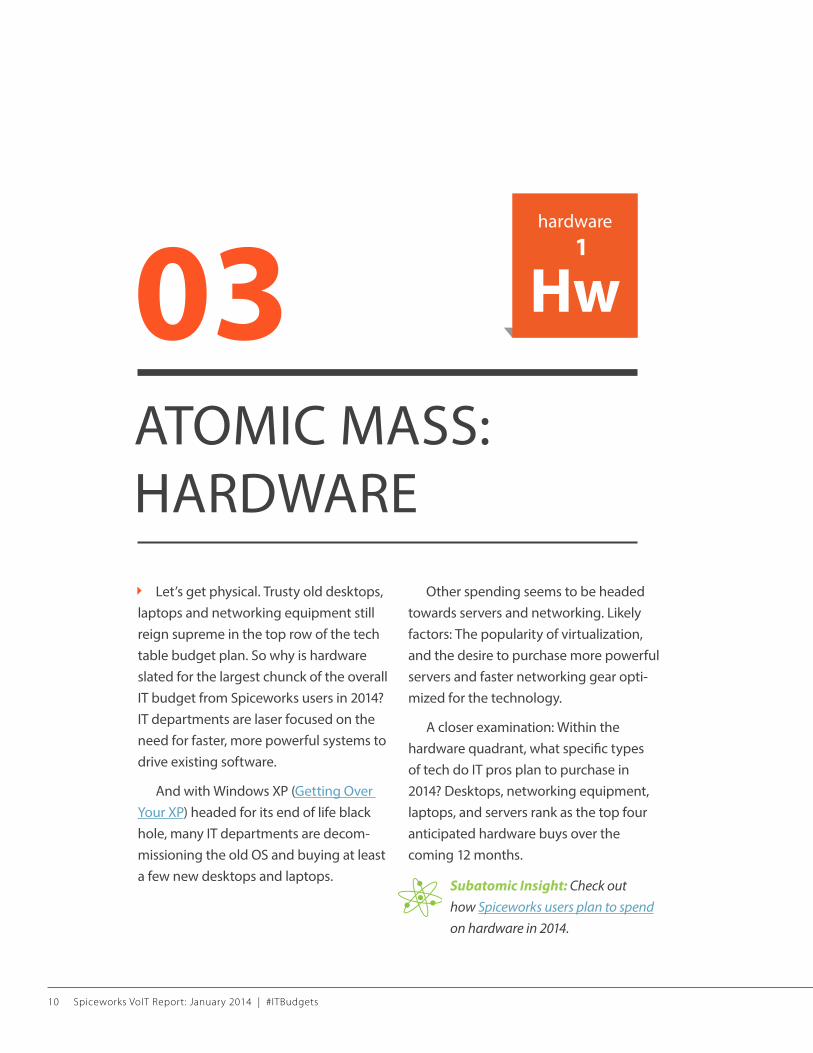
03ATOMIC MASS: HARDWARE
Let’s get physical. Trusty old desktops, laptops and networking equipment still reign supreme in the top row of the tech table budget plan. So why is hardware slated for the largest chunck of the overall IT budget from Spiceworks users in 2014? IT departments are laser focused on the need for faster, more powerful systems to drive existing software.
And with Windows XP (Getting Over Your XP) headed for its end of life black hole, many IT departments are decom-missioning the old OS and buying at least a few new desktops and laptops.
Other spending seems to be headed towards servers and networking. Likely factors: The popularity of virtualization, and the desire to purchase more powerful servers and faster networking gear opti-mized for the technology.
A closer examination: Within the hardware quadrant, what specific types of tech do IT pros plan to purchase in 2014? Desktops, networking equipment, laptops, and servers rank as the top four anticipated hardware buys over the coming 12 months.
hardware
Hw1
Subatomic Insight: Check out how Spiceworks users plan to spend on hardware in 2014.

2014 IT Budget Report 11
These categories map fairly closely to how companies will budget in 2014. Desktops top the chart with IT pros stating they’ll spend an average of 26% of their hardware budget on these devices. Servers rank second with an average of 19%, laptops place third with an average of 14%, and networking equipment is close behind on the scale with an average of 13% of the hardware budget.
TOP 5 PLANNED HARDWARE PURCHASES IN 2014(Percentage of respondents)
TOP 5 HARDWARE INVESTMENTS(As a percentage of hardware budget)
10 20 30 40 50 60 70 80
73%Networking (wireless, routers, switches, �rewall)
71%Laptop
69%Server
50%Printers
79%Desktop
Printers
26%
Server
Laptop
Networking (wireless, routers, switches, firewall)
Desktop
13%
14%
19%
6%

12 Spiceworks VoIT Report: January 2014 | #ITBudgets
For the top five hardware purchases IT departments plan to spend big bucks on in 2014, how much of it will go to refreshing existing infrastructure vs. adding new devices? Check out the chart to the right for the (chemical) breakdown.
HARDWARE REFRESH OR REPLACE?
Subatomic Insight: See what tradeoffs IT pros consider when refreshing hardware vs. replacing.

2014 IT Budget Report 13
NEW VS. RECURRING HARDWARE IN 2014(Percentage of respondents)
New Recurring Don’t know
0 20 40 60 80 100
2%Desktop 31% 67%
5%Server 49% 46%
3%Laptop 30% 67%
3%Networking 51% 46%
3%Printers 28% 69%

14 Spiceworks VoIT Report: January 2014 | #ITBudgets
04ATOMIC MASS:SOFTWARE
Another major component getting its fair share of IT budget love in 2014: software. And with Windows XP down to its last electron (Getting Over Your XP), it’s no surprise that OS purchases top
the list of upcoming software invest-ments. Other big focuses for 2014: Productivity software, virtualization and security all appear to be active within the tech budget nucleus in the coming year.
software
Sw2
50%
49%
36%
0 10 20 30 40 50 60
Productivity
Virtualization
Security
Database
OS 60%
60%
TOP 5 PLANNED SOFTWARE PURCHASES IN 2014 (Percentage of respondents)

2014 IT Budget Report 15
The dollars line up closely with software that’ll be purchased: An average of 22% of software budgets will go to productivity, 21% to OSs, 15% to virtualization, and 13% to security software.
For the software that IT departments are slot-ting for purchase in 2014, the majority of spend will be toward upgrade and maintenance.
In terms of new spend, close to 40% will put dollars toward virtualization, and 30% will put new spend toward productivity. OSs and security tie for third, both anticipating 28% new spend in the coming year.
TOP 5 SOFTWARE INVESTMENTS (As a percentage of software budget)
0 5 10 15 20 25
21%
22%
15%
13%
10%
OS
Productivity
Virtualization
Security
Database
SOFTWARE UPGRADE VS. NEW IN 2014
0
20
40
60
80
100
Virtualization
39%
Productivity OS Security Database
30% 28% 28%
7%
61% 68% 70% 71% 91%2%1%2%2%0%
New Upgrade/maintenance Don’t know
NEW SOFTWARE OR AN UPGRADE?

16 Spiceworks VoIT Report: January 2014 | #ITBudgets
05ATOMIC MASS:CLOUD
While hosted services aren’t at the top of the budgetary wish-list, up in the stratosphere with hardware and software, it still counts for an average of 14% of the IT budget. But, where should marketers of cloud-based solutions aim their efforts in the coming year?
The top services IT pros plan to purchase: Web hosting, followed by email hosting, online backup, and content filtering.
cloud
Cld3
Subatomic Insight: Find out what IT pros consider when purchasing web hosting solutions.
2014 IT Budget Report 17
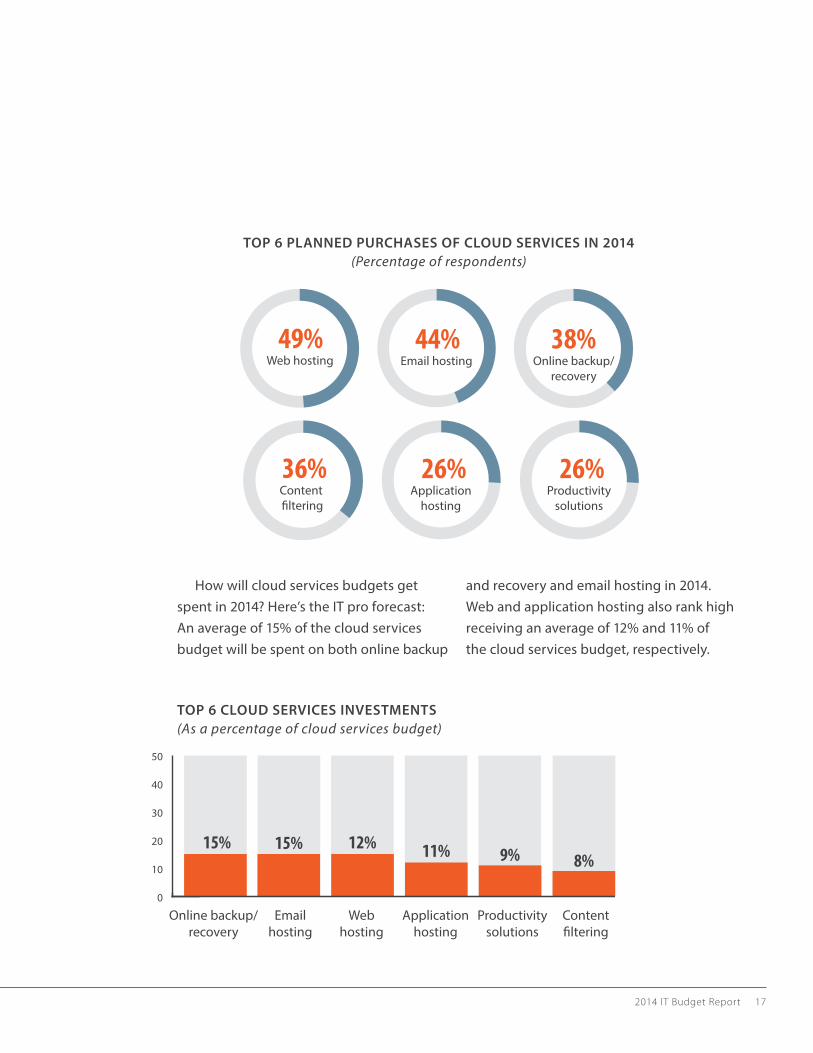
How will cloud services budgets get spent in 2014? Here’s the IT pro forecast: An average of 15% of the cloud services budget will be spent on both online backup
and recovery and email hosting in 2014. Web and application hosting also rank high receiving an average of 12% and 11% of the cloud services budget, respectively.
TOP 6 PLANNED PURCHASES OF CLOUD SERVICES IN 2014 (Percentage of respondents)
TOP 6 CLOUD SERVICES INVESTMENTS (As a percentage of cloud services budget)
49%Web hosting
44%Email hosting
38%Online backup/
recovery
36%Content �ltering
26%Application
hosting
26%Productivity
solutions
Online backup/recovery
Emailhosting
Webhosting
Applicationhosting
Productivitysolutions
Content�ltering
0
10
20
30
40
50
9%11%12%15%15%8%

18 Spiceworks VoIT Report: January 2014 | #ITBudgets
The answer: Recurring. The answer: Recurring. The answer… you get the idea. The majority of hosted services purchased will be, that’s right, recurring dollars. But what about new money? The service that will capture the most new dollars among the top areas IT pros plan to invest in: Productivity solutions and online backup and recovery.
CLOUD SERVICES NEW OR RECURRING?

2014 IT Budget Report 19
NEW VS. RECURRING CLOUD SERVICES IN 2014 (Percentage of respondents)
0 20 40 60 80 100
32% 68% 0%
31% 69% 0%
81% 4%15%
83% 4%13%
93% 1%6%
Productivity solutions
Online backup/recovery
84% 0%16%
Content �ltering
Application hosting
Email hosting
Web hosting
New Recurring Don’t know
Subatomic Insight: Learn all about cloud service trends in a few previous Data Gone Spicy Reports: Catching up to the Cloud, The Cloudification of the Network and Look Ma, No Hardware.

20 Spiceworks VoIT Report: January 2014 | #ITBudgets
06ATOMIC MASS:MANAGED SERVICES
Albeit a smaller atomic weight, managed services are getting their fair share of spend in 2014. The top projects getting the lion’s share of the cash? Connectivity/bandwidth, storage and backup, hosting, and IT services.
managed ser.
Ms4
Subatomic Insight: Check out what IT pros look for with an MSP.
TOP PLANNED PURCHASES OF MANAGED SERVICES IN 2014 (Percentage of respondents)
53%
0 10 20 30 40 50 60
Storage/backup/archiving
Hosting
IT service providers
Consulting
Connectivity/bandwidth
49%
47%
44%
40%

2014 IT Budget Report 21
Breaking up the particles, where exactly are those dollars heading? An average of 17% of the managed services budget will go to storage/backup/archiving, IT service providers will see an average of 16% of their budget, hosting is slated to get an average of 15% of the budget, and email/collaboration rounds out the managed services spend of the top five planned purchases with an average of 10% of the budget.
The majority of managed services spend will be recurring; although the areas that are more likely to get new dollars will be storage/backup, consulting and email/collaboration.
TOP 5 MANAGED SERVICES INVESTMENTS(Average percentage of managed services budget)
0 5 10 15 20
17%
16%
15%
14%
12%
Storage/backup/archiving
IT service providers
Hosting
Connectivity/bandwidth
Consulting
0 20 40 60 80 100
Connectivity/bandwidth
10% 88% 2%
Storage/backup/archiving
0%36% 64%
Hosting
2%84%14%
IT services (service providers)
3%88%9%
Consulting
1%32% 67%
NEW VS. RECURRING MANAGED SERVICES IN 2014

22 Spiceworks VoIT Report: January 2014 | #ITBudgets
07IT PURCHASING,MAGNIFIED
A bit of peer insight can go a long way. It turns out IT pros are just like the rest of us when it comes to tech research and vendor consideration: They consult the masses using a variety of different resources.
From Google search to Spiceworks to ratings and reviews, the pros are using multiple resources as they make their tech purchasing decisions.
$
$
$
$$

2014 IT Budget Report 23
TOP 5 RESOURCES USED WHEN CONSIDERING VENDORS
TOP 5 RESOURCES TO JUSTIFY A LARGE PURCHASE
0 20 40 60 80 100
67%
70%
79%
79%
81%
Ratings and reviews
Peer recommendations
Manufacturer/vendor website
Google search
Spiceworks
0 10 20 30 40 50
44%
43%
43%
42%
40%
Ratings and reviews
Manufacturer/vendor website
Case studies/ROI studies
Peer recommendations
Spiceworks
TOP 5 RESOURCES USED WHEN RESEARCHING A NEW PRODUCT
0 20 40 60 80 100
92%
88%
86%
84%
82%
Google search
Spiceworks
Manufacturer/vendor website
IT forums
Peer recommendations

24 Spiceworks VoIT Report: January 2014 | #ITBudgets
08EVALUATING IT
Through careful observation, the Spice Lab was able to break down the tech mon-ey molecules and peer deep into the struc-ture of 2014 IT spending. The conclusion: IT pros in North America are major players in how 2014 IT budgets will get spent. And they’ve got a clear read on where those dollars are headed.
Whether IT pros are spending their (company’s) hard-earned cash on hardware purchases, shelling out some software bucks, or setting aside cloud coinage, our numbers give a clear read on how to direct your marketing efforts over the next 12 months. And when it comes to where IT pros look for a little extra guidance… our Spice Lab gadgets tell the tale.
In order to make it into the tech bud-get lab (and under our powerful lens), respondents had to have some level of involvement in developing and managing their company’s IT budget.
The majority of respondents in this study make recommendations on how to spend their company’s budget (72%) and are responsible for spending it (77%). In other words, they’re big players.
THE TECH SPECIMENS: REAL IT DECISION-MAKERS
$$$
$

2014 IT Budget Report 25
36% 60% 44% 72% 77%
ROLE IN MANAGING YOUR COMPANY’S IT BUDGET
I spend the budget
I make recommendations how we spend our budget
I provide input in developing the the budget
I manage the budget
I create the budget
From asking the right questions to knocking out killer research to studying the variables, Spiceworks helps tech marketers break IT down. Like to see some of that 2014 IT spend? Check out Spiceworks, where IT goes to work – and where savvy tech marketers get the tools they need… to generate a positive charge from their IT buyers.
THE TECH MARKETING METHODOLOGY:

26 Spiceworks VoIT Report: January 2014 | #ITBudgets
You’ve just read Spiceworks’ version of data gone spicy: Our answer to hum-drum data. We tackle the tech issues of today... and what’s coming soon to a server room near you. And we deliver it all with more originality and spice than your typical run-of-the-mill reports.
Drawing from a user base of more than 4 million IT pros, it’s a glimpse into tech you can’t get anywhere else! Data in this report comes from a Spiceworks survey conducted with 450 IT pros (and Spiceworks users) across North America.
Details on the data
$$
$$$
$$$
$$
$$
$
$
$
$$
$$
$$$$
$$$$$$$$$$
$$
$$
$
$
$$ $$

2014 IT Budget Report 27
INDUSTRY (Top 12 industries shown)
COMPANY SIZE
Less than 19 employees
20-99 employees
100-149 employees
150-249 employees
250-499 employees
500-999 employees
12%
36%
11%
6%5%
15%
1,000 or more employees
15%
Manufacturing
14% 8%12% 7%10%
6%
EducationHealthcare IT ServiceProvider
Non Pro�t
Finance Construction
4%
7%
4% 2%3%
Government
Consulting SoftwareEngineeringRetail
4%

28 Spiceworks VoIT Report: January 2014 | #ITBudgets
“A Better But Still Subpar Global TechMarket in 2014 And 2015,” Forrester Research, January 2, 2014
SOURCES
Drew Sollberger, Demand Generation Manager, Spiceworks Kayle Milian, Web Program Manager, Spiceworks
PHOTO CREDITS

2014 IT Budget Report 29
The contents in this report are a result of primary research performed by Spiceworks. Unless otherwise noted, the entire contents distributed as part of this report are copyrighted by Spiceworks. As such any information made available by any means in this report may not be copied, reproduced, duplicated, published, displayed, transmitted, distributed, given, sold, traded, resold, marketed, offered for sale, modified to create derivative works or otherwise exploited for valuable consideration without prior written consent by Spiceworks. For more information visit www.spiceworks.com/voice-of-it/terms.
This report contains information of fact relating to parties other than Spiceworks. Although the information have been obtained from, and are based on sources that Spiceworks believes to be reliable, Spiceworks does not guarantee the accuracy, and any such information might be incomplete or condensed. Any estimates included in this report constitute Spiceworks’ judgment as of the date of compilation, and are subject to change without notice. This report is for information purposes only. All responsibility for any interpretations or actions based on the information or commentary contained within this report lie solely with the recipient. All rights reserved. 2014.
About Spiceworks Voice of IT®
The Spiceworks Voice of IT market insights program publishes stats, trends and opinions collected from technology professionals that are among the more than 4 million users of Spiceworks. Survey panelists opt-in to answer questions on technology trends important to them. To find out more about our research capabilities, email [email protected].
About Spiceworks
Spiceworks, is the vertical network for IT that more than 4 million IT professionals use to connect with one another and over 2,700 technology brands. The company simplifies how IT professionals discover, buy and manage more than $500 billion in technology products and services each year. Headquartered in Austin, Texas, Spiceworks is backed by Adams Street Partners, Tenaya Capital, Institutional Venture Partners (IVP), Shasta Ventures and Austin Ventures. For more information visit www.spiceworks.com.
For more information visit: For other Spiceworks Voice of IT reports visit: www.spiceworks.com/ www.spiceworks.com/marketing/resources/
Voice of IT ®

30 Spiceworks VoIT Report: January 2014 | #ITBudgets