Embed Size (px)
Citation preview

SMC-TR-01 -18 AEROSPACE REPORT NO.TR-2001 (8570)-5
Spacecraft Charging. Observations andRelationship to Satellite Anomalies
1 August 2001
Prepared by
J. F. FENNELL, H. C. KOONS, J. L. ROEDER, and J. B. BLAKESpace Science Applications LaboratoryLaboratory Operations
Prepared for
SPACE AND MISSILE SYSTEMS CENTERAIR FORCE MATERIEL COMMAND2430 E. El Segundo BoulevardLos Angeles Air Force Base, CA 90245
Engineering and Technology Group
APPROVED FOR PUBLIC RELEASE;~ . DISTRIBUTION UNLIMITED
-. ~ a -20041011 14b9

This report was submitted by The Aerospace Corporation, El Segundo, CA 90245-4691, under Con-tract No. F04701-00-C-0009 with the Space and Missile Systems Center, 2430 E. El Segundo Blvd.,Los Angeles Air Force Base, CA 90245. It was reviewed and approved for The Aerospace Corpora-tion by J. A. Hackwell, Principal Director, Space Science Applications Laboratory. MichaelZambrana was the project officer for the Mission-Oriented Investigation and Experimentation(MOIE) program.
This report has been reviewed by the Public Affairs Office (PAS) and is releasable to the NationalTechnical Information Service (NTIS). At NTIS, it will be available to the general public, includingforeign nationals.
This technical report has been reviewed and is approved for publication. Publication of this reportdoes not constitute Air Force approval of the report's findings or conclusions. It is published only forthe exchange and stimulation of ideas.
Michael Zam"6ranaSMC/AXE

I Form ApprovedREPORT DOCUMENTATION PAGE OMB No. 0704-0188
Public reporting burden for this collection of information is estimated to average 1 hour per response, including the time for reviewing instructions, searching existing data sources,gathering and maintaining the data needed, and completing and reviewing this coltection of information. Send comments regarding this burden estimate or any other aspect of this
col ection of information, including suggestions for reducing this burden to Department of Defense, Washington Headquarters Services, Directorate for Information Operations andReports (0704-0188), 1215 Jefferson Davis Highway, Suite 1204, Arlington, VA 22202-4302. Respondents should be aware that notwithstanding any other provision of law, no personshall be subject to any penalty for failing to comply with a collection of information if it does not display a currently valid OMB control number. PLEASE DO NOT RETURN YOUR FORMTO THE ABOVE ADDRESS.
1. REPORT DATE (DD-MM-YYYY) 2. REPORT TYPE 3. DATES COVERED (From - To)
1 August 20014. TITLE AND SUBTITLE Sa. CONTRACT NUMBER
F04701-00-C-0009
Spacecraft Charging: Observations and Relationilship to Satellite Anomalies 5b. GRANT NUMBER
"5c. PROGRAM ELEMENT NUMBER
6. AUTHOR(S) 5d. PROJECT NUMBER
J. F. Fennell, H. C. Koons, J. L. Roeder, and J. B. Blake 5e. TASK NUMBER
5f. WORK UNIT NUMBER
7. PERFORMING ORGANIZATION NAME(S) AND ADDRESS(ES) 8. PERFORMING ORGANIZATIONREPORT NUMBER
The Aerospace CorporationLaboratory OperationsEl Segundo, CA 90245-4691 TR-2001(8570)-5
9. SPONSORING / MONITORING AGENCY NAME(S) AND ADDRESS(ES) 10. SPONSOR/MONITOR'S ACRONYM(S)
Space and Missile Systems Center SMCAir Force Materiel Command2430 E. El Segundo Blvd. 11. SPONSOR/MONITOR'S REPORTLos Angeles Air Force Base, CA 90245 NUMBER(S)
SMC-TR-01-18
12. DISTRIBUTION/AVAILABILITY STATEMENT
Approved for public release; distribution unlimited.
13. SUPPLEMENTARY NOTES
14. ABSTRACTMany studies have shown that satellite charging can cause anomalies on spacecraft. The SCATHA (Spacecraft ChargingAT High Altitude) satellite was flown to determine the conditions and document the existence of satellite charging. It wasinstrumented to measure charging and to detect electrostatic discharges that occurred. Discharges were observed andcould be characterized as either surface or internal charging related. More recently, observations were made of chargingon a high-inclination Earth-orbiting (HEO) satellite. Both the HEO and SCATHA charging data show occurrence patternsthat are consistent with the expected motions of substorm-injected plasma electrons. The SCATHA data was taken in thenear-geosynchronous orbit and the HEO data was taken over a wide range of altitudes in a 630 inclination orbit. TheSCATHA data showed that the internal discharge rates were related to the intensities of energetic electrons (Ee >100 keV)and that, statistically, their occurrence peaked near local noon. These results can be understood in terms of the flux levelsof electrons that can penetrate shielding. The HEO energetic particle data have been combined with CRRES, GOES, andGPS data to estimate some worst-case levels of internal charging fluxes.
15. SUBJECT TERMSCharging, Anomalies, Satellite environment
16. SECURITY CLASSIFICATION OF: 17. LIMITATION 18. NUMBER 19a. NAME OFOF ABSTRACT OF PAGES RESPONSIBLE PERSON
Joseph Fennel
a. REPORT b. ABSTRACT c. THIS PAGE 19b. TELEPHONE
18 NUMBER (include areaUNCLASSIFIED UNCLASSIFIED UNCLASSIFIED code)
(310)336-7075
Standard Form 298 (Rev. 8-98)Prescribed by ANSI Std. 239.18

Acknowledgement
This work was supported by The Aerospace Corporation investment program.

Contents
1. Introduction 1
2. Satellite Surface Charging .................................................................................. 3
2.1 Surface Charging Environment........................................................................ 4
2.1.1 Equatorial Satellite Surface Charging........................................................ 4
2.1.2 High-Altitude Off-Equator Satellite Surface Charging..................................... 6
2.1.3 Complexities of Surface Charging ........................................................... 9
2.2 Internal Charging....................................................................................... 10
2.2.1 Internal Charging Observations.............................................................. 10
2.2.2 Causes of Internal Charging-Magnetic Storms ........................................... 11
2.2.3 Causes of Internal Charging-Energetic Electron Variability ............................ 11
2.2.4 Relation between Internal Charging ESD and Penetrating Electron Fluxes............. 12
2.2.5 Internal Charging Specifications ............................................................. 12
3. Discussion.................................................................................................... 15
References........................................................................................................ 17
Figures
1. Local time dependence of anomalies observed on geosynchronous satellites .................... 3
2 SCATHA plasma spectrogram showing evidence of satellite chargingin both electrons and ions............................................................................... 5
3 Example of sub storm-related charging near midnight............................................... 5
4. Location of surface charging as determined by SCATHA .......................................... 6
5. Anomaly occurrence versus Kp........................................................................ 7
6. HEO anomalies mapped to magnetic equator......................................................... 8
V

7 Occurrence of >100 V satellite frame potentials in HEO/Molniya orbit .................................. 8
8. Comparison of a "Worst-Case" plasma electron spectrumand an average electron spectrum .............................................................................................. 9
9. Local time distribution of internal ESD on SCATHA ............................................................... 10
10. Variation in geosynchronous energetic electron fluxes during a periodof successive high-speed solar wind streams in 1994 ................................................................ 11
11. Comparison of SCATHA anomalies with energetic electron fluxes ........................................ 12
12. Examples of worst-case 10-hour-average electron spectra for three different orbits ............... 13
Tables
1. Distribution of Records by Anomaly Diagnosis ........................................................................ 1
vi

1. Introduction
Satellite charging is a simple concept, and its analog is easily experienced by anyone who shuffles hisor her feet across a rug on a dry day. The charge transferred by friction causes the person to becomecharged relative to their surroundings. The result can be a surprising or painful electric dischargefrom the person to a nearby object. The same kind of discharge, called an electrostatic discharge orESD, can occur on a satellite when its surfaces or interior elements build up extreme levels of excesscharge relative to the space plasma or to neighboring satellite components. The electromagneticenergy from ESD can be coupled into electronics causing upsets and damage
The problems caused by charging on satellites have been compared to other environmental effects ina recent Aerospace Corporation study. Some of the main results of this study are summarized inTable 1, which indicates that satellite charging is responsible for more than half (161 out of 198) ofthe documented environment-related anomalies. The study results also showed (Table 2 of Ref. 1)that ESD caused about 50% of the lost or terminated missions associated with environmental effects.Thus, the issue of satellite charging is very serious from the perspective of the threat it poses for sat-ellites in the inner magnetosphere.
Table 1. Distribution of Records by Anomaly Diagnosis
Diagnosis Number of Records
ESD-Internal Charging 74
ESD-Surface Charging 59
ESD-Uncategorized 28
Single-Event Effects 85
Damage 16
Micrometeoroid/Debris Impact 10
Miscellaneous 26

This Page IntentionalyLeft Blank
2. Satellite Surface Charging
In the early 1970's, it became clear that many of the anomalies on geosynchronous satellites occurredin the near midnight to dawn region of the magnetosphere,2 as shown in Figure 1. This was reminis-cent of the path that the hot substorm-injected electrons from the magnetotail take as they drift aroundthe magnetosphere. Thus, it was thought that the anomalies might be substorm related and could becaused by satellite charging.
As we know, tens of keV electrons do not penetrate the satellite surface materials but reside near thesurface. The incident plasma and the solar UV also interact with materials to generate secondaryelectrons. The satellite's surface materials will take on a charge such that the net current between thesurfaces and the plasma is zero under quiescent conditions. The result is that the surface voltageswould not be zero. The sunlit areas are usually slightly positive and the shadowed areas are usuallynegative relative to the plasma at "infinity. If the surface was a conductor, the potential of the surfacewould be uniform and either positive or negative relative to the plasma.
Electrons are the dominant source of initial plasma current to a satellite because of their higher speed.The photo- and secondary-electron currents from a surface are often higher than the plasma-electroncurrent to it during average conditions. In a "hot" plasma (average electron energy >1 keV), a satel-lite's shadowed regions will generally charge negative to significant potentials, sometimes severalkilovolts. If the "hot" plasma is also relatively dense, then even the sunlit regions of a satellite cancharge to significant levels.
16 15 14 13 12 11 10 9
18v I
19 q T 5
20 / 0 4
22 223 "
V DSP LOGIC UPSETS v INTELSAT IVo DSCS 11 RGA UPSETS o INTELSAT I11
Figure 1. Local time dependence of anomaliesobserved on geosynchronous satellites.
3

Because the secondary and photoelectron currents are different for every material, satellites generallyhave a range of surface potentials. The differences in potential between adjacent materials, such asthermal blankets and metallic structure, can lead to local electrical stress. This can result in vacuumarcs. It is also possible for a surface material to discharge into space (a so-called "blow-off' dis-charge) or to structure ground. The resulting ESD currents can electromagnetically couple into elec-tronic circuits and subsystems, causing mischief or damage.
2.1 Surface Charging Environment.
The plasma electrons are the primary source of current that causes high levels of charging. They usu-ally have energies of a few hundred to a several thousand eV, but generally less than 50 keV. Above25 to 30 keV, the electrons start to penetrate thin materials, such as monolayer thermal blankets orpaints, and generate internal charging of thick materials or the underlying structure. In the regionswhere the magnetospheric plasma is very dense, it is usually "cold" and doesn't cause significantcharging. The equatorial ionosphere and the plasmasphere are such regions. If the plasma is verydilute (density < 0.05 cm-3), photoemission dominates, and a satellite may have a positive potential.This occurs, for example, in the near-Earth tail lobes.
During substorms, a hot plasma is injected from the magnetotail into the nightside, high-altitude,equatorial regions. These freshly injected electrons cause dramatic changes in the satellite charginglevels. They gradient-curvature drift towards dawn. This leads one to predict that the greatest nega-tive charging levels will be observed beyond the plasmasphere in the midnight through dawn regionsof the magnetosphere.
2.1.1 Equatorial Satellite Surface Charging. • 2Figure 1 shows the local time distribution of early geosynchronous satellite anomalies. (The radialposition is arbitrary.) Most of the anomalies occurred in the 2300 to 0600 LT region. Such plotsconvinced the scientific and engineering communities that satellite charging was a problem thatneeded to be understood, and that mitigation strategies needed to be found. Such observations havesince been linked to substorm plasma injections specifically and magnetic activity in general.
An example of a substorm injection of hot plasma and the subsequent charging of the SCATHA sat-ellite4 is shown in Figures 2 and 3. Figure 2 shows spectrograms of the plasma data from SCATHA.The substorm plasma injection occurred near 0040 UT. The satellite structure potential is identifiedby the fact that "cold" ions (bottom) were accelerated into the instrument, creating a bright, low-energy feature in the spectrogram. These ion "acceleration" features show that the satellite wascharged negatively. The electron fluxes (top) were reduced, and the spectrum shifted by the effective"retarding" potential of the satellite.
These data were used to generate a temporal profile of satellite potential relative to the plasma, asshown in Figure 3 (top). Figure 3 (bottom) shows the potential of a Kapton thermal blanket sample.The Kapton sample started to charge with the substorm onset, and its potential relative to the satelliteframe continued to increase while the frame potential stayed low, initially. As SCATHA entered theEarth's penumbra near 0046 UT, its frame charged to high levels (Ref. Figs. 2 and 3). Upon enteringthe umbra, the differential potential between the Kapton and the satellite frame decreased rapidly.
4

SCATHA SC2 Plasma April 23,1981
l1:11Charging Signatures
>1o_
S10°-•l~
UT 0039 0049 0059 0109 0119 0129L 6.9 7.0 7.1 7.1 7.2 7.3MLT 23.7 23.9 0.0 0.2 0.4 0.5
Figure 2. SCATHA plasma spectrogram showing evidence of satellitecharging in both electrons (top panel) and ions (bottom panel).
Sunlight Penumbra Umbra Penumbra Sunlight
12Spacecraft frame potential
10
S 8
4
2 -
1.6Kapton potential
1.2
O> 0.8-0.
0.4- scharges
00:30 01:00 01:30Universal time, hr:min
Figure 3. Example of substorm-related charging near midnight. Thespacecraft frame potential is shown in the top panel, andpotential of a Kapton thermal blanket in the bottom panel. Thepotentials were negative.

The sequence reversed as SCATHA exited the eclipse. ESDs were detected during the periods ofrapid change in potential associated with the eclipse entry and exit. This example contains many ofthe common features of surface charging observed by SCATHA. These are: (1) each dielectric mate-rial and the satellite frame responded differently; (2) ESD tended to occur when the potentials werechanging rapidly; and (3) the potentials were never stable during an event.
Data similar to the Figure 3 Kapton potentials were used to produce statistical maps of surfacecharging for the SCATHA orbit. One such map is shown in Figure 4. It shows that surface chargingin the near-geosynchronous orbit region follows the same pattern as that expected for the drift of afew to tens of keV electrons. Figure 4 shows local time features similar to those observed in geosyn-chronous satellite anomaly maps, like Figure 1.
2.1.2 High-Altitude Off-Equator Satellite Surface Charging
Observers recognized that the auroral displays were associated with disturbances in the high-latitudegeomagnetic field. The events associated with the auroral forms and magnetic disturbances weredenoted "auroral substorms or magnetic substorms." Over time, it was recognized that the auroralsubstorm, magnetic substorm, and plasma injections were different aspects of the same process calleda magnetospheric substorm.
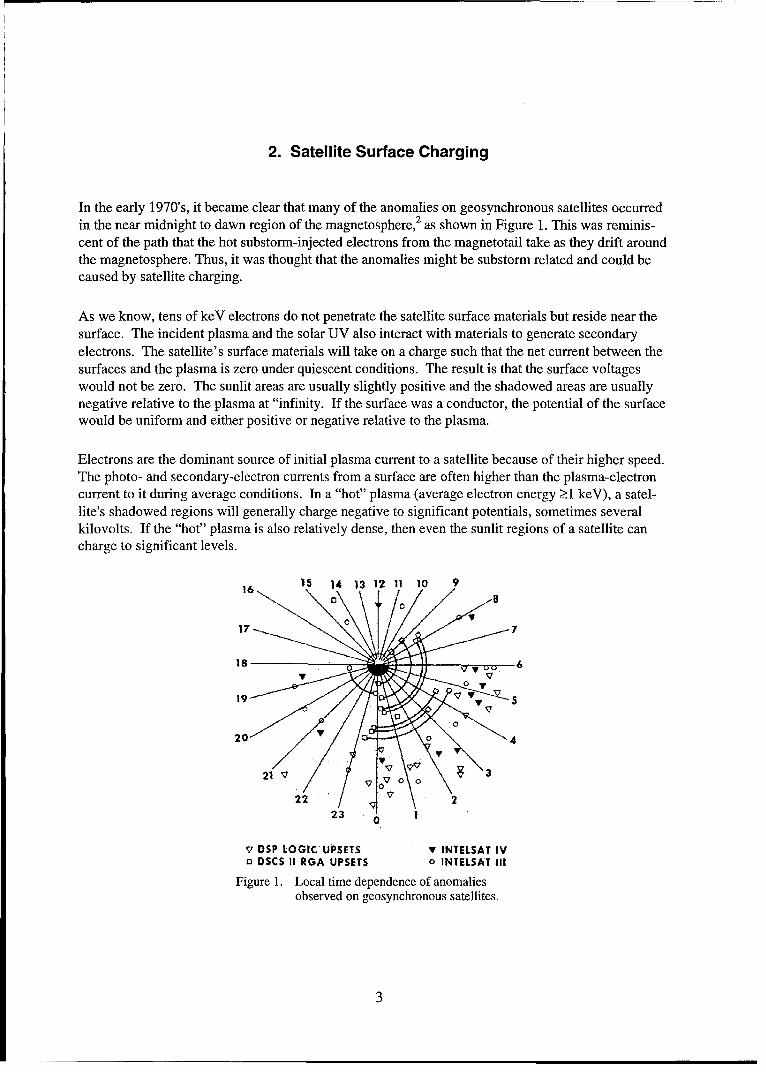
The correlation between magnetic activity and satellite charging becomes clear when one examinesthe relationship between satellite anomalies and a magnetic disturbance index like Kp. Figure 556shows such a comparison for a set of HEO (Highly Elliptical Orbit) satellite anomalies. ' Theincrease in anomaly occurrence with increasing Kp means that the HEO anomalies were preferen-tially associated with the high levels of magnetic activity. [The normal Kp distribution peaks near Kp
2 and falls steeply toward smaller and larger values.]. The local time pattern of the anomalies and
Location of Surface ChargingDuring Disturbed Times
50% (>100 volts) 6 550% (>100 volts) 4 5
10% (>100 volts) 89 \•3
SCATHA coverage limits /
L-hell !
12~ -J2
13 -\ . "23
14 22
15 /•21 10% (>1000 volts)
Geosynchronous orbit 16 I 2017 18 19
Figure 4. Location of surface charging as determined by SCATHA.
6
4.0 I I
3.5
S 3.00)
2.5
o 2.01 1.5a)•-E 1.0-
z0.5-
0,0+ 1-,1,1+ 2-,2,2+ 3-,3,3+ 4-,4,4+ ->5-
Kp Bin
Figure 5. Anomaly occurrence versus Kp.
charging, the Kp dependence of the anomalies, and the direct observation of satellite charging inresponse to substorms links the satellite charging and anomalies to the substorm process. However,we must make it clear that while surface charging can be tied to substorms, not all substorms will leadto such satellite charging.
The auroral extension of the plasma sheet, from a few hundred km upwards, contains a mixed plasma,combining low-density, high-temperature electrons from the equator with cool, high-density iono-spheric electrons. During substorms, density cavities can appear at ionospheric altitudes, and theaverage electron energies rise. This combination of lower background density and raised electronenergies can cause satellites to charge in the low-altitude auroral regions.3 This has been borne outby the fact that some DMSP satellites have charged to fairly high levels,7 and one has experienced ananomaly associated with such charging.3
The plasma sheet, plasma that maps to the auroral regions, exists all along high-latitude field lines.Any satellite that intercepts these field lines is connected to equatorial charging regions and can expe-rience surface charging. This was borne out by the occurrence of anomalies on HEO satellites. 5
[HEO orbits have high apogees and latitudes (-40,000 km and 630, respectively).] They cross mag-netic-field lines that map to the equator from well inside to well beyond geosynchronous orbit. If oneuses a magnetic-field model to project the position of the satellites along the field lines to the mag-netic equator for each anomaly observed, one obtains a local time and equatorial distance pattern forthe anomalies like that shown in Figure 6. It is immediately obvious that the spatial distribution ofthese HEO anomalies mirrors the pattern expected for substorm-injected electrons and satellitecharging near the magnetic equator. This pattern convinced us that the HEO satellites were sufferingsurface charging-related anomalies.
7

-20 1
So , ,2 1-, ,-2 0 -,-3 -- -- or --- -- -- -- m2+
'• 3"' •'- GEOSYNCHOOSALTITUDE 5 5 4", 4, 4+10 .4 6 LE "
20c .
10 0 -10 -20 -30 -40 -50
XGSM (RE)
Figure 6. H-EG anomalies mapped to magnetic equator. Symbols indi-cate the associated Kp value.
One of the authors flew a plasma analyzer on a I-EO satellite. 5'6 Figure 7 shows where the HEO sat-ellite structure experienced charging to less than -100 V. The squares [U] and dots [0] correspond tothe lower and upper bounds in L, respectively, of charging observed during satellite traversals. Thelocal time pattern of charging is consistent with that observed by SCATLIA (Figure 4), except itextends to higher L. The lower L bound of the charging starts just outside the nominal plasmapause,extending somewhat lower in L than the region covered by SCATHA. The upper L range of chargingextends well into the auroral field line regions. This would be consistent with our present under-standing of which spatial regions are accessible to substorrn injected electrons in the nightside innermagnetosphere.
HEO 95-034 Charging102
3L 112
Potential < -100 V
MLTFigure 7. Occurrence of >100 V satellite frame potentials in
HEO/Molniya orbit. The symbols mark the upper and lowerbounds in L for each charging interval.
loaltiepatenofchrgn i cnisen wt tatoseve b CAHA(igre4) xcpti

2.1.3 Complexities of Surface ChargingFigures 3 and 4 showed both the apparent simplicity and inherent complexity of the surface chargingprocess. The correlation of the satellite frame charging with the increased mean energy of the elec-trons caused by substorm injections is, at first look, quite simple. However, Figure 3 shows thattracking the satellite frame potential is not the whole answer. The potential of the materials on thesatellite do not track the frame potential but respond in their own way. The differential potentials thatdevelop between the satellite's surface materials and the grounded structure are complex, in fact,more complex than even these figures indicate. 8'9 The hazards caused by spacecraft charging resultfrom complex interactions between the space environment and the materials and the ESD and elec-tronics on a spacecraft.
There is some evidence that the shape of the distribution function is important to surface charging. Atlow energies, the secondary-electron yield from surfaces is high. Thus, if the low-energy flux islarge, it may prevent spacecraft from charging. This makes it difficult to predict charging periods andto understand whether satellites with mixed surface materials will charge and to what degree. Moreimportantly, will ESD occur, and will the satellite's electronics respond? Figure 8 provides a goodexample of what the space weather community is up against in trying to predict satellite charging. Itshows, as the solid line, the electron spectrum that was observed during a sunlight charging event. Itproduced the most and largest discharges on SCATHA for any single day. 10An "average" electronspectrum, taken on 15 non-charging days, is also shown. The vertical bars represent the range of fluxvariability during the 15 days. The extreme charging environment differs little from the maximum innormal daily variations. It is only slightly higher in the 10-100 keV range. Yet, the response ofSCATHA to this difference was quite extraordinary.
Thus, a link has been forged between observations of surface charging, predictions of how injectedelectrons drift, observations of ESD noise, and satellite anomalies.
10O8
7 108
104
- Set 2,98
103
1021E 2 1- 0 0 0 0
Septgy 22,198
Figure 8. Comparison of a "worst-case" plasma electron spectrumand an average electron spectrum.
9
2.2 Internal ChargingWhat is internal charging? It is simply the deposition of charge on the internal elements of a satelliteby electrons with sufficient energy to penetrate through the satellite skin. In some cases, the electronsdeposit their charge in thick dielectrics near the surface of the satellite, in the interior, or on isolatedconducting structures inside the satellite. In any case, if the leakage path to ground is sufficientlyresistive, the charge can build up over time until arcing or ESD occurs. The energy in the dischargecan be coupled into electronics as a fast signal or can over-voltage devices and damage them. Inter-nal charging can lead to satellite anomalies by this mechanism. Most of the time, the satellites canrecover from the anomaly. In rare cases, the anomaly can cause vehicle operations to be suspended orcan even be fatal.
As was shown in Table 1, internal charging causes a significant fraction of charging-related anoma-lies. Once surface charging was established as a serious and real threat to satellites, the question ofwhether the space radiation was sufficiently intense to actually charge items in the interior of satel-lites was raised. Initially, the high-energy component of the space environment was examined toassess how the radiation dose it gave to surface materials might affect the performance of the materi-als from the surface charging perspective. Later, it was realized that, in the heart of the inner magne-tosphere, the energetic electrons that can penetrate significant thickness of satellite materials couldcause internal charging of satellites.
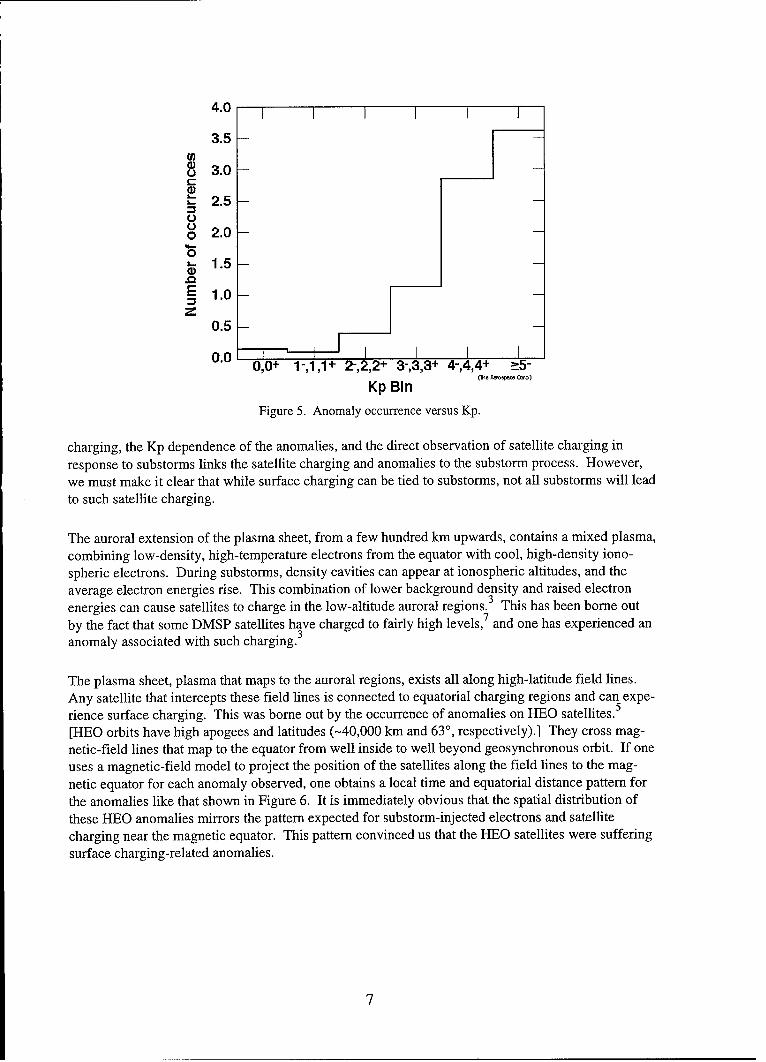
2.2.1 Internal Charging ObservationsSome of the first evidence of internal charging came from the SCATHA satellite.1 Figure 9showsthe local time distribution of ESD pulses on SCATHA that were determined to be from internal dis-charges. The noise pulses were not associated with satellite or instrument operations. They occurredwhen neither the satellite nor any of the monitored surface materials were charged. Note that theoccurrence of internal discharges peaked near local noon. This may result from the fact that a near-geosynchronous satellite is on lower L values near noon than near midnight because of the asymmet-ric magnetospheric magnetic field. The penetrating electron fluxes tend to peak at L < 6.6. Thus, theinterior of a near-geo synchronous satellite would charge more rapidly when it was near local noon.
30
20-
0310-
01

Once one accepts that internal charging occurs and can lead to ESD, a reexamination of Figures 1 and6 leads one to suspect that some of the anomalies plotted there may have been caused by internalcharging. For example, in both figures, there are a few anomalies in the noon sector. In addition,there have not been observations of significant surface charging in the noon sector. This is consistentwith the fact that the keV plasma electrons are much reduced in flux by the time they drift to noon. Itis most likely that there were internal charging effects on satellites from the beginning, but that theywere not recognized as such initially.
2.2.2 Causes of Internal Charging-Magnetic StormsMagnetic storms are often generated by coronal mass ejections (CMEs) from the sun. Earthward-directed CMEs often appear as "magnetic clouds" with high bulk speed and a southward directedmagnetic field on their leading edge. This combination efficiently couples the solar-wind energy intothe magnetosphere. The geoeffectiveness of a CME or magnetic-cloud-associated magnetic stormcan, in some sense, be quantified by the magnitude of the ring current disturbance it causes, as meas-ured by the DST index. As DsT rapidly drops, the energetic electron fluxes are often reduced signifi-cantly in the inner magnetosphere. As DST recovers, the energetic electron fluxes also recover. Ifthe interplanetary conditions are just right, the energetic electron fluxes will increase by orders ofmagnitude over their pre-storm values. It is these event-related enhancements in the energetic elec-trons that can cause internal charging problems for satellites.
2.2.3 Causes of Internal Charging-Energetic Electron VariabilityThe energetic electron fluxes (Ee > 300 keV) in the inner magnetosphere are highly variable, and theirvariability is tied to the variability of the solar wind velocity.12 More recently, it has been shown thatthe enhancements in the energetic electrons require not only an enhanced solar-wind velocity but alsoa southward component of the interplanetary magnetic field at the same time.12 Figure 10 shows anexample of the energetic electron-flux variability at geosynchronous orbit. During the intervalshown, there was a nearly periodic arrival of high-speed solar wind streams at Earth. The energeticelectron fluxes varied by orders of magnitude. In particular, they exceeded the long-term averagelevels by more than an order of magnitude for days at a time. Some satellites experienced anomaliesduring this period that were ascribed to internal charging.
AE8 Flux Ee>2UMeV
1/1111994 2/7/1994 3/1t6/1 994 4/22/1 994 .5/30/1994
: • Date
Figure 10. Variation in geosynchronous energetic electron fluxes during aperiod of successive high-speed solar wind streams in 1994
11

2.2.4 Relation between Internal Charging ESD and Penetrating Electron Fluxes
Both SCATHA4 and CRRES 13 carried science and engineering instrumentation that could measurecharging-related ESD, as well as the electron fluxes that could cause it. Figure 11 shows one exampleof the kind of data obtained. It shows the increased frequency of internal discharges detected bySCATHA with increasing average energetic electron flux. SCATHA and CRRES both showed thatwhen average fluxes of 300 keV electrons were greater than 105 electrons/(cm2 s sr), the rate of inter-nal discharges increased dramatically. I,'14 Frederickson et al.14 indicated that a ten-hour-average5 2•
penetrating-electron flux greater than 10 /(cm s) was a possible reference level for the onset of dis-charges from internal charging. This level has been adopted14 as the maximum average flux thatshould be allowed to penetrate into the interior of a satellite.
Whether discharges from internal charging occur or not depends on the amount of shielding a satellitehas to protect its sensitive circuitry. The peak levels of electron fluxes depend on the effectiveness ofthe magnetic storm for enhancing the fluxes. The maximum average electron flux experienced by asatellite also depends on its orbit. A satellite that spends a long time in the heart of the radiation belts,as the GPS satellites do, will experience very high fluxes and require very thick shielding to protectthem from internal charging.
2.2.5 Internal Charging SpecificationsThe major unknown in the problem of internal charging is what the worst electron fluxes may be. Forexample, what is the result of a "100-year" magnetic storm? It is only in the last decade or so that wehave had continuous measurements of the energetic particle fluxes in the inner magnetosphere andthen only for L > 4 at the magnetic equator. To date, the energetic particle measurements needed tospecify the extreme conditions have not been routinely taken throughout the inner magnetospherewhere internal charging is a problem.
50 Frequency of Internal Discharges
S40o
S30
20o
10.LL
0103 104 10-5 106
300 keV Electron Flux [e/cm 2 -s-sr]
Figure 11. Comparison of SCATHA anomalies with energetic electron fluxes.
12

One can inter-compare measurements taken by different satellites to try to infer what the worst-casefluxes could be. Fennell et al.14 have done this using CRRES, HEO, GPS, and geosynchronous ener-getic electron data. The storm time data from these spacecraft were examined, and it was found thatthe great magnetic storm of March 1991 was a good representation of a worst-case storm. They usedthe data to generate worst-case average spectra for the satellite orbits identified in Figure 13. Theyselected a 10-h interval as the averaging interval based on the work of Frederickson et al. 13 The orbitswere geosynchronous (GEO), HEO, and a lunar transfer-phasing trajectory (MAP). The level ofshielding required to protect satellites in such orbits can be derived from the spectra in Figure 12.
Internal Charging Specification Spectra108 1 1 1 1 1
"" ~MAP) 4.74 x 10⁷ e-2 02 Ee(MeV)S107 47
E
W 106 GEO0 2.34 x 167 e1 EeMeV)
S104 X,0 -- 5 nthp ec
a)0
--HEO IntChgSpec--- MAP IntChgSpec
102 1 1 1 1 1 I0 1 2 3 4 5 6 7
Electron Energy, MeV
Figure 12. Examples of worst-case 10-hour-average electron spectra for threedifferent orbits.
13

This Page IntentionalyLeft Blank

3. Discussion
The linkage of substorms with surface charging and magnetic storms with internal charging is clear,as noted above. Where the difficulty lies is in (1) predicting when storms and substorms will occur,(2) predicting the particle environment that will result, and (3) predicting whether the environmentwill cause a problem for a given satellite.
Predicting substorms seems to be impossible at the present stage of our knowledge. We also cannotpredict the changes in the particle distributions that, in turn, cause the surface charging. Finally, wecannot predict whether a specific satellite will suffer problems from a given substorm environment.There are too many imponderables.
The recent work with SOHO has taken us a long way in predicting whether a CME will strike theEarth's magnetosphere. Future advances in tracking CMEs will raise our success rate for predictingthe arrival of their effects at Earth. However, we still do not know how to predict which events willbe geoeffective. At present, all Earthward-directed halo-CMEs are presumed to have large effects,according to news releases. That is obviously not true. Since magnetic storms also have many asso-ciated substorms, they are, in some sense, also a source of surface charging events.
For geosynchronous satellites, one could use near-real-time measurements to make near-continuousestimates of the flux behind different shielding thickness. Then individual satellite operators couldtrack the levels that they feel are important to them based on how their system responds to theenvironment.
It is clear that we are making steady progress in understanding the relationship between magneto-spheric processes and charging-related effects on satellites. We are also making progress toward pre-dicting the occurrence of storms and being able to predict and now-cast whether the storm-relatedenvironment changes are approaching problem-causing levels. We have also made progress inlearning how the charging can affect real systems. We still have a long way to go in providing usefulpredictions to the satellite operators at the high level of confidence they require. This is especiallytrue for surface charging where we cannot predict substorm onsets and resultant environmentalchanges with any degree of accuracy. The substorm-related surface charging problems are big chal-lenges for the whole space weather community and are likely to remain so for the near future.
15

This Page IntentionalyLeft Blank

References
1. Koons, H. C., et al., "The impact of the space environment on space systems," in Proceedingsof the 6th Spacecraft Charging Technology Conference, Air Force Research Laboratory, inpress, 2000.
2. McPherson, D. A., and W. R. Schober, "Spacecraft charging at high altitudes: the SCATHAsatellite program," in Spacecraft Charging by Magnetospheric Plasmas, A. Rosen Ed., Pro-gress in Astronautics and Aeronautics, 47, p. 15, 1975.
3. Anderson, P. C., and H. C. Koons, "Spacecraft charging anomaly on a low-altitude satellite inan aurora," J. Spacecraft Rockets, 33, 734, 1996.
4. Fennell, J. F., "Description of P78-2 (SCATHA) Satellite and Experiments," in The IMS SourceBook, C. T. Russell and D. J. Southwood, editors, American Geophysical Union, Washington,D. C., 1982.
5. Spence, H. E., J. B. Blake, J. F. Fennell, "Surface Charging Analysis of High-Inclination, High-Altitude Spacecraft: Identification and Physics of the Plasma Source Region," IEEE Trans.Nucl. Sci., 40, 1521-1524, 1993.
6. Fennell, J. F., J. B. Blake, J. L. Roeder, R. Sheldon, and H. Spence, "Tail Lobe and Open FieldLine Region Entries at Mid to High Latitudes," Adv. Space Res, 20, 431-435, 1997.
7. Gussenhoven, M. S., et al., "High level charging in the low-altitude polar auroral environment,"J. Geophys. Res., 90, 11,000, 1985.
8. Mizera, P. F., et al., "First results of material charging in the space environment," Appl. Phys.Lett., 37, 276, 1980.
9. Fennell, J. F., et al., "Laboratory and Space Measurements of Materals," Proceedings of the AirForce Geophysics Laboratory Workshop on Natural Charging of Large Space Structures inNear Earth Polar Orbits: 14-15 September 1982, AFGL-TR-83-0046, January 1983.
10. Koons, H. C., et al., "Severe Spacecraft-Charging Event on SCATHA in September 1982," J.Spacecraft and Rockets, 25, 239, 1988.
11. Koons, H. C., "Summary of environmentally induced electrical discharges on the P78-2 (SCA-THA) satellite," J. Spacecraft Rockets, 20, 425, Sept. 1983.
12. Blake, J. B., et al., "Correlation of changes in the outer-zone relativistic-electron populationwith upstream solar wind and magnetic field measurements," Geophys. Res. Lett., 24, 927,1997.
17

13. Frederickson, A. R., et al., "Characteristics of spontaneous electrical discharging of variousinsulators in space radiation," IEEE Trans. on Nuclear Science, 39, 1773, December 1992.
14. Fennell, I. F., et al., "Internal charging: A preliminary environmental specification for satel-lites," IEEE Trans. on Plasma Science, 28, 2029, December 2000.
18

LABORATORY OPERATIONS
The Aerospace Corporation functions as an "architect-engineer" for national security programs, spe-cializing in advanced military space systems. The Corporation's Laboratory Operations supports theeffective and timely development and operation of national security systems through scientific researchand the application of advanced technology. Vital to the success of the Corporation is the technicalstaff's wide-ranging expertise and its ability to stay abreast of new technological developments andprogram support issues associated with rapidly evolving space systems. Contributing capabilities areprovided by these individual organizations:
Electronics and Photonics Laboratory: Microelectronics, VLSI reliability, failure analy-sis, solid-state device physics, compound semiconductors, radiation effects, infrared andCCD detector devices, data storage and display technologies; lasers and electro-optics, solidstate laser design, micro-optics, optical communications, and fiber optic sensors; atomicfrequency standards, applied laser spectroscopy, laser chemistry, atmospheric propagationand beam control, LIDAR/LADAR remote sensing; solar cell and array testing and evalua-tion, battery electrochemistry, battery testing and evaluation.
Space Materials Laboratory: Evaluation and characterizations of new materials andprocessing techniques: metals, alloys, ceramics, polymers, thin films, and composites;development of advanced deposition processes; nondestructive evaluation, component fail-ure analysis and reliability; structural mechanics, fracture mechanics, and stress corrosion;analysis and evaluation of materials at cryogenic and elevated temperatures; launch vehiclefluid mechanics, heat transfer and flight dynamics; aerothermodynamics; chemical andelectric propulsion; environmental chemistry; combustion processes; space environmenteffects on materials, hardening and vulnerability assessment; contamination, thermal andstructural control; lubrication and surface phenomena.
Space Science Applications Laboratory: Magnetospheric, auroral and cosmic ray phys-ics, wave-particle interactions, magnetospheric plasma waves; atmospheric and ionosphericphysics, density and composition of the upper atmosphere, remote sensing using atmos-pheric radiation; solar physics, infrared astronomy, infrared signature analysis; infrared sur-veillance, imaging, remote sensing, and hyperspectral imaging; effects of solar activity,magnetic storms and nuclear explosions on the Earth's atmosphere, ionosphere and magne-tosphere; effects of electromagnetic and particulate radiations on space systems; spaceinstrumentation, design fabrication and test; environmental chemistry, trace detection;atmospheric chemical reactions, atmospheric optics, light scattering, state-specific chemicalreactions and radiative signatures of missile plumes.
Center for Microtechnology: Microelectromechanical systems (MEMS) for spaceapplications; assessment of microtechnology space applications; laser micromachining;laser-surface physical and chemical interactions; micropropulsion; micro- and nanosatel-lite mission analysis; intelligent microinstruments for monitoring space and launch sys-tem environments.
Office of Spectral Applications: Multispectral and hyperspectral sensor development;data analysis and algorithm development; applications of multispectral and hyperspectralimagery to defense, civil space, commercial, and environmental missions.