Embed Size (px)
Citation preview
Dr. Janaki R.R. AlavalapatiProfessor and Head, Department of Forestry, College of Natural
Resources, Virginia Polytechnic Institute and State University
Dr. Alan W. HodgesExtension Scientist, Food and Resource Economics Department,
Institute of Food and Agricultural Sciences University of Florida
Pankaj LalPhD Student, School of Forest Resources and Conservation
University of Florida
Puneet DwivediPhD Student, School of Forest Resources and Conservation
University of Florida
Dr. Mohammad Rahmani Coordinator of Economic Analysis, Food and Resource
Economics Department, Florida Cooperative Extension Service, Institute of Food and Agricultural Sciences
University of Florida
Ilan Kaufer PhD Student, School of Forest Resources and Conservation
University of Florida
Jagannadha R. MattaProject Associate, School of Forest Resources and Conservation
University of Florida
Andres SusaetaPhD Student, School of Forest Resources and Conservation
University of Florida
Sidhanand KukretyPhD Student, School of Forest Resources and Conservation
University of Florida
Dr. Thomas J. Stevens IIIPost Doctoral Associate, Food and Resource Economics Department,
Institute of Food and Agricultural Sciences University of Florida
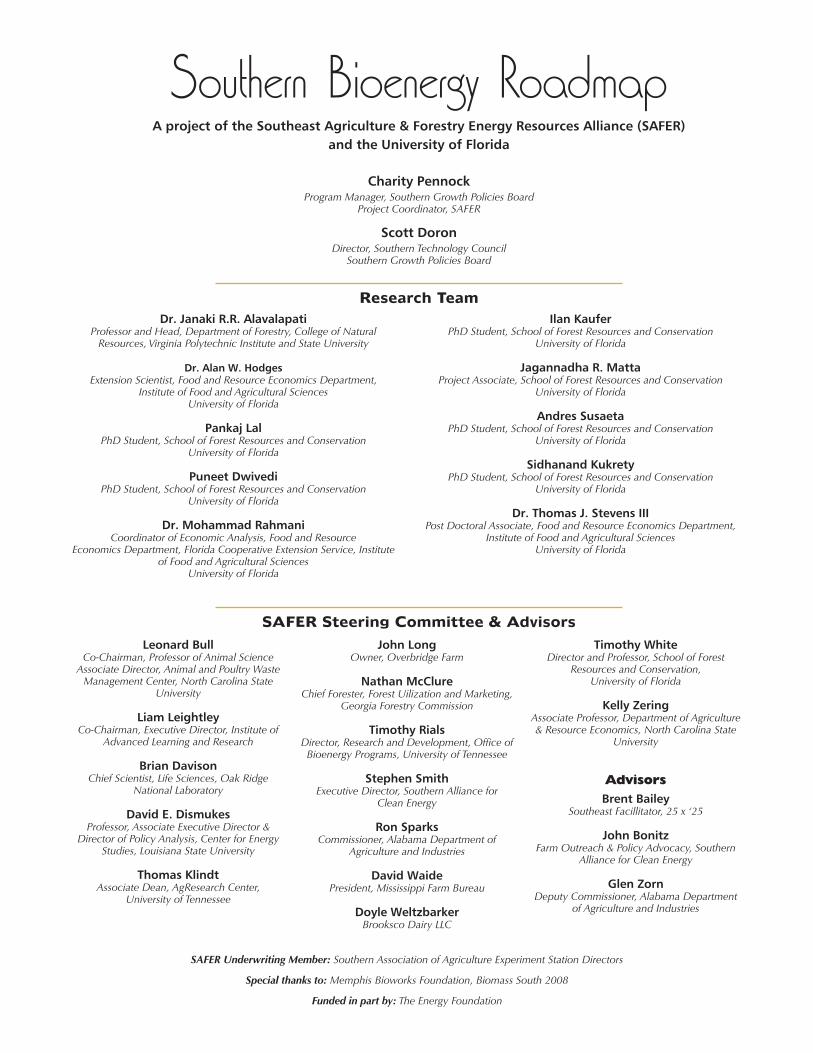
Southern Bioenergy RoadmapA project of the Southeast Agriculture & Forestry Energy Resources Alliance (SAFER)
and the University of Florida
Charity PennockProgram Manager, Southern Growth Policies Board
Project Coordinator, SAFER
Scott DoronDirector, Southern Technology Council
Southern Growth Policies Board
Research Team
SAFER Underwriting Member: Southern Association of Agriculture Experiment Station Directors
Special thanks to: Memphis Bioworks Foundation, Biomass South 2008
Funded in part by: The Energy Foundation
Leonard BullCo-Chairman, Professor of Animal Science
Associate Director, Animal and Poultry Waste Management Center, North Carolina State
University
Liam LeightleyCo-Chairman, Executive Director, Institute of
Advanced Learning and Research
Brian DavisonChief Scientist, Life Sciences, Oak Ridge
National Laboratory
David E. DismukesProfessor, Associate Executive Director &
Director of Policy Analysis, Center for Energy Studies, Louisiana State University
Thomas KlindtAssociate Dean, AgResearch Center,
University of Tennessee
John LongOwner, Overbridge Farm
Nathan McClureChief Forester, Forest Uilization and Marketing,
Georgia Forestry Commission
Timothy RialsDirector, Research and Development, Office of Bioenergy Programs, University of Tennessee
Stephen SmithExecutive Director, Southern Alliance for
Clean Energy
Ron SparksCommissioner, Alabama Department of
Agriculture and Industries
David WaidePresident, Mississippi Farm Bureau
Doyle WeltzbarkerBrooksco Dairy LLC
Timothy WhiteDirector and Professor, School of Forest
Resources and Conservation, University of Florida
Kelly ZeringAssociate Professor, Department of Agriculture & Resource Economics, North Carolina State
University
AdvisorsBrent Bailey
Southeast Facillitator, 25 x ‘25
John BonitzFarm Outreach & Policy Advocacy, Southern
Alliance for Clean Energy
Glen ZornDeputy Commissioner, Alabama Department
of Agriculture and Industries
SAFER Steering Committee & Advisors

SOUTHEAST AGRICULTURE & FORESTRY ENERGY RESOURCES ALLIANCEc/o SOUTHERN GROWTH POLICIES BOARD
P.O. BOX 12293, RESEARCH TRIANGLE PARK, NC 27709
PHONE: 919-941-5145 • FAX: 919-941-5594
http://www.saferalliance.net
©2009 Southeast Agriculture & Forestry Energy Resources Alliance

Table of ContentsThe Southern Bioenergy Roadmap can be downloaded in full at http://www.saferalliance.net/projects/bioenergy_roadmap.pdf
Executive Summary .................................................................................. 1
Introduction ........................................................................................... 13
I. Socio-economic, Land Use, and Energy ProfileSocio-economic profile ...................................................................... 15Land use allocations .......................................................................... 17Energy profile ................................................................................... 20Renewable electricity ......................................................................... 24Alternative fuels ................................................................................ 25Emissions ........................................................................................ 26
II. Commercial InventoryFueling stations ................................................................................. 27Biofuel production plants .................................................................... 28Electric power generation from biomass ................................................. 31Biomass feedstock availability .............................................................. 37Summary of bioenergy feedstock resources ............................................. 49Economic contribution of biopower generation ....................................... 50
III. Policy InventoryState energy plans ............................................................................. 53Policies and programs ........................................................................ 54Regulatory mechanisms ...................................................................... 55Incentive-based policies ..................................................................... 58Support programs .............................................................................. 61
IV. Research & EducationResearch centers ............................................................................... 63Education & training centers ................................................................ 64
V. Results from Expert Survey and Stakeholder MeetingOpen-ended survey ........................................................................... 66Stakeholder meetings ......................................................................... 74
Endnotes & Bibliography ........................................................................ 75
AppendicesA - Listing of bioenergy-related companies in the South............................. 78B - Select bioenergy policies of Southern States ....................................... 90C - Select bioenergy research centers in the South .................................. 117D - Select bioenergy education and training centers in the South ............... 122E - Expert perception survey .............................................................. 125

©2009 Southeast Agriculture & Forestry Energy Resources Alliance

Executive Summary | Page �
Executive SummaryIn June 2008, U.S. gasoline prices soared to over $4 a gallon, bringing into question the country’s dependence on oil. In November 2008, the International Energy Agency reported that by 2030 the demand for energy would grow by 45 percent. In January 2009, recession and rising unemploy-ment caused local, state, and federal leaders to seek new ways to stimu-late the economy, create jobs, and increase tax revenues. Altogether, these events, rather than be cause for fear and anxiety, represent a window of opportunity for which the South1 is uniquely positioned.
What’s the opportunity? For the South to lead the U.S. in reducing the nation’s dependence on im-ported oil, meeting new energy demand, and creating thousands of jobs for Southerners.
How does the South do it? By wisely using its resources to become the nation’s leader in the research, production, and distribution of bioenergy2.
What’s the economic impact?
Increased jobs and wealth for Southerners, particularly in rural commu-nities. In 2007, the renewable energy sector grossed over $40 billion in revenues and employed over 500,000 workers in the U.S.3 Two studies provide examples of the potential economic impact:
A 2007 study by the University of Georgia found that the annual operation of a 49 million gallon cellulosic ethanol4 plant in Treutlen County, Georgia (population ~7,000) would have a total direct and indirect economic impact to the state of $150 million in annual revenues, $17.5 million in annual labor income, $3 million in annual state and local taxes, and 444 jobs.5
The University of Florida calculated the potential economic impact of the annual operation of a 40 megawatt biomass power plant across a num-ber of different counties in the South. The study found that, on average, a 40 megawatt plant would have a total direct and indirect economic impact of $21.6 million in annual revenues, $13 million in personal and business income, and 370 jobs.6
To promote further bioenergy development in the South, the Southeast Agriculture & Forestry Energy Resources Alliance (SAFER) and the University of Florida developed the Southern Bioenergy Roadmap to inform and sup-port each state’s energy plan. The Roadmap identifies the South’s bioenergy strengths and weaknesses in the areas of industry, policy and research, with the goal of making targeted recommendations for growing the bioenergy industry.
➤
➤
a
About SAFER:
SAFERThe Southeast Agriculture & Forestry Energy Resources Alliance (SAFER) was formed to provide strategic leadership to the agricultural and forestry sectors in advancing renewable energy initiatives in the Southeast with the purpose of seeing the South become the nation’s leader in renewable energy production. SAFER works toward this vision by engaging in strategies for better policy, targeted research, efficient commercialization, and outreach and education. The Alliance was formed in 2006 through an initiative of the Energy Foundation in conjunction with the national 25 x ’25 committee to bring together representation from across the bioenergy landscape. In early 2007, the Alliance selected Southern Growth Policies Board to be its management and fiscal agent. To become a member and for more information, go to http://www.saferalliance.net.
Southern Growth Policies BoardSouthern Growth Policies Board is a non-partisan public policy think tank based in Research Triangle Park, North Carolina. Formed by the region’s governors in 1971, Southern Growth develops and advances economic development policies by providing a forum for partnership and dialog among a diverse cross-section of the region’s governors, legislators, business and academic leaders and the economic- and community-development sectors. This unique public-private partnership is devoted to strengthening the South’s economy and creating the highest possible quality of life. For more information go to http://www.southern.org.
Page � | Executive Summary
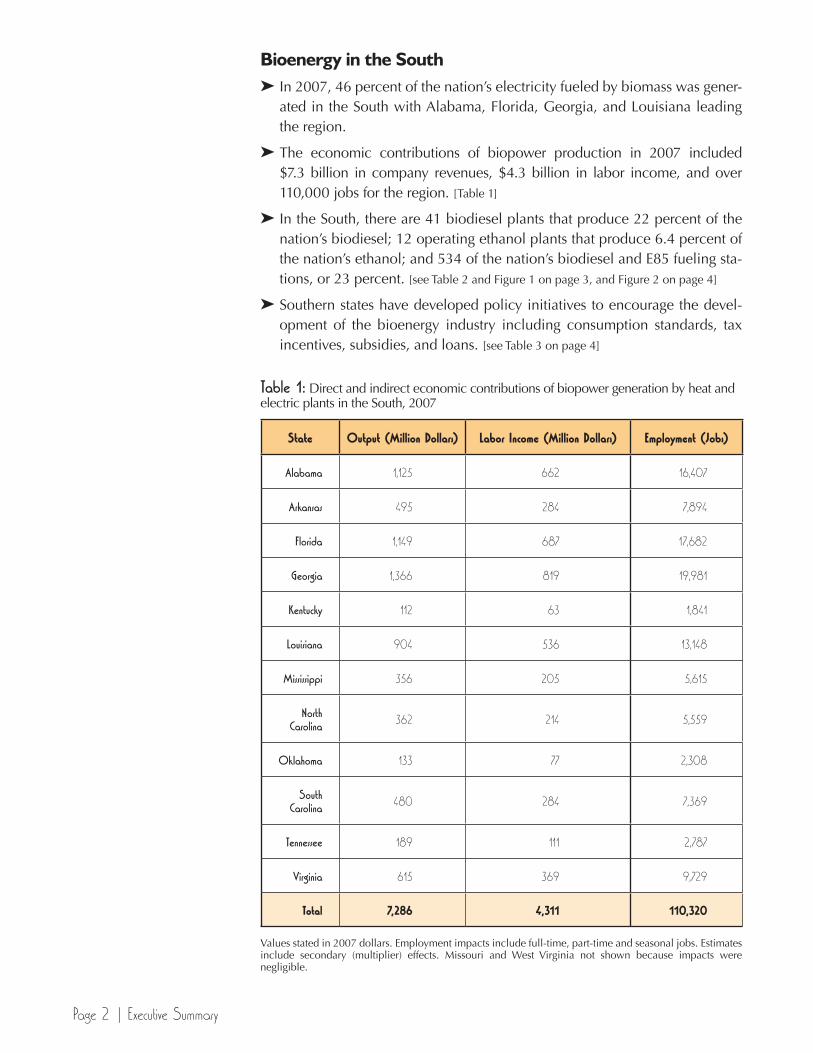
Bioenergy in the SouthIn 2007, 46 percent of the nation’s electricity fueled by biomass was gener-ated in the South with Alabama, Florida, Georgia, and Louisiana leading the region.
The economic contributions of biopower production in 2007 included $7.3 billion in company revenues, $4.3 billion in labor income, and over 110,000 jobs for the region. [Table 1]
In the South, there are 41 biodiesel plants that produce 22 percent of the nation’s biodiesel; 12 operating ethanol plants that produce 6.4 percent of the nation’s ethanol; and 534 of the nation’s biodiesel and E85 fueling sta-tions, or 23 percent. [see Table 2 and Figure 1 on page 3, and Figure 2 on page 4]
Southern states have developed policy initiatives to encourage the devel-opment of the bioenergy industry including consumption standards, tax incentives, subsidies, and loans. [see Table 3 on page 4]
➤
➤
➤
➤
Table 1: Direct and indirect economic contributions of biopower generation by heat and electric plants in the South, 2007
State Output (Million Dollars) Labor Income (Million Dollars) Employment (Jobs)
Alabama �,��5 66� �6,407
Arkansas 495 �84 7,894
Florida �,�49 687 �7,68�
Georgia �,366 8�9 �9,98�
Kentucky ��� 63 �,84�
Louisiana 904 536 �3,�48
Mississippi 356 �05 5,6�5
North Carolina 36� ��4 5,559
Oklahoma �33 77 �,308
South Carolina 480 �84 7,369
Tennessee �89 ��� �,787
Virginia 6�5 369 9,7�9
Total 7,286 4,311 110,320
Values stated in 2007 dollars. Employment impacts include full-time, part-time and seasonal jobs. Estimates include secondary (multiplier) effects. Missouri and West Virginia not shown because impacts were negligible.

Executive Summary | Page 3
Table 2: Alternative fueling stations in the South, 2007
State Biodiesel Ethanol (E85)
Natural Gas Electric Hydrogen Propane Total
Alabama �� 6 3 0 0 40 60
Arkansas � 6 3 0 0 37 48
Florida �� �6 �5 3 � 47 95
Georgia �8 �8 �8 0 0 37 ���
Kentucky � �� 0 0 0 �3 �5
Louisiana � 3 5 0 0 9 �8
Mississippi 5 � 0 0 0 33 40
Missouri 5 80 6 0 � 65 �57
North Carolina 66 �4 �� 0 0 44 �36
Oklahoma 6 6 5� 0 0 64 ��7
South Carolina 73 7� 4 0 0 �0 �69
Tennessee 35 �3 3 0 0 4� �03
Virginia �� 6 9 � � �9 48
West Virginia � 3 � 0 0 7 �3
Region Total 258 276 131 4 4 477 1150
U.S. Total 620 1701 774 417 51 2125 5688
Figure 1: Locations and capacities in million gallons per year of current and future ethanol plants in the South, 2008
Source: Renewable Fuels Association. List of Fuel Ethanol Producers, Current and Pending, September 2008. Available at http://www.ethanolrfa.org/industry/locations/.
Source: Alternative Fuels Data Center (AFDC). U.S. Department of Energy, Energy Efficiency and Renewable Energy Program, September 2007. Available at http://www.afdc.energy.gov/afdc/.
6.4% of the Nation’s Ethanol
is Produced in the South

Page 4 | Executive Summary
Table 3: Summary of bioenergy policies by state, 2008†
State State Energy Plan Regulatory Mechanisms Incentive Based
Policies Support Based Policies
RFS RPS Both NM/IC AFV Tax Sub/
Grant Loan Prod. & Infra.
Exten. & Educ. Tech
Alabama X X X X
Arkansas X X X X X X X
Florida X X X X X X X X
Georgia X X X X X X
Kentucky X X X X X X X
Louisiana X X X X X
Mississippi X X X
Missouri X X X X X X X X X X
North Carolina X X X X X X X X X X
Oklahoma X X X X X
South Carolina X X X X X X X
Tennessee X X X X X X
Virginia X X X X X X X X
West Virginia X X X X
Source: Bioenergy policy information compiled by research team
† See Abbreviation Key in Endnotes on page 11.
Figure 2: Locations and capacities in million gallons per year of current biodiesel plants in the South, 2007
Source: National Biodiesel Board (NBB). Commercial Biodiesel Production Plants, January 2008, available at http://www.biodiesel.org/buyingbiodiesel/producers_marketers/.
22% of the Nation’s Biodiesel
is Produced in the South

Executive Summary | Page 5
Southern strengthsThe bioenergy activity in the South is built, and continues to grow, on the region’s significant assets for both biopower and biofuel:
The South holds 44 percent of the energy in the nation’s forestlands, 31 percent of the nation’s energy in crop, mill, and urban waste residues, 28 percent of the nation’s energy in biogas, and 19 percent of the nation’s energy in croplands. [Table 4]
Southern forests had nearly 9.5 billion dry tons of live biomass inventory in 2006 and showed a net annual growth of more than 13 billion cubic feet, accounting for nearly 44 percent of the U.S. total. [see Figure 3 on page 6]
There are 24 wood pellet manufacturers in the South, 29 percent of all wood pellet manufacturers in the U.S.
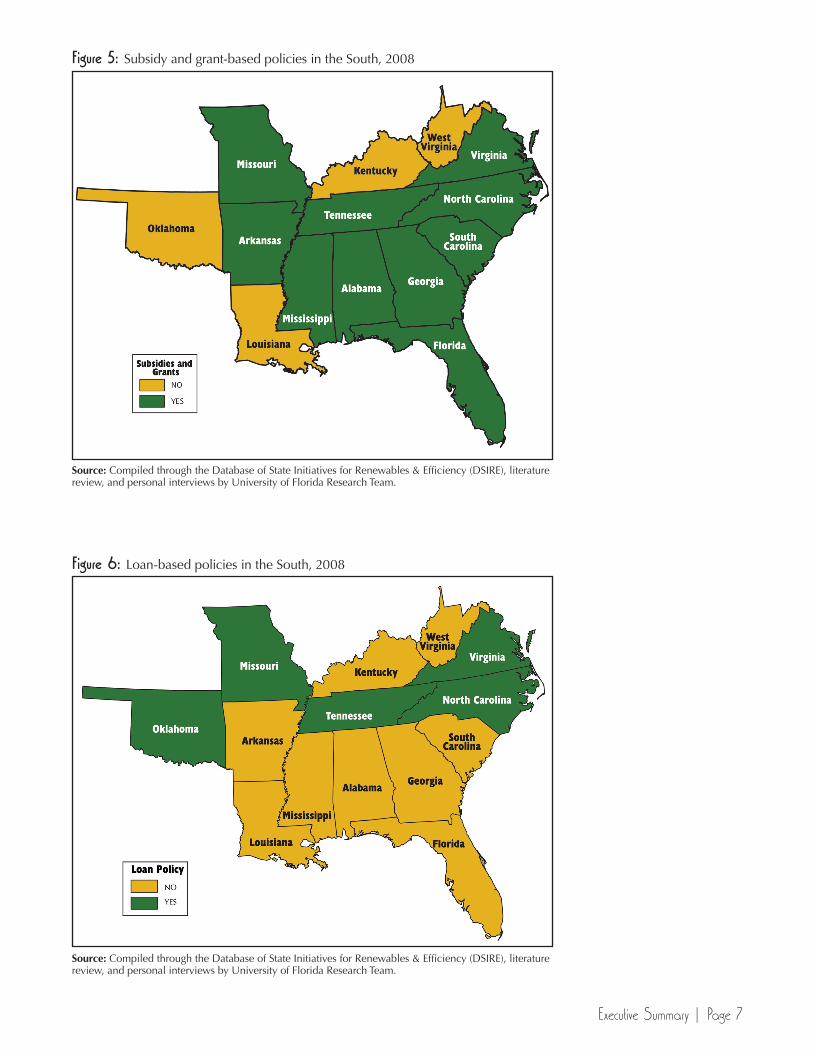
Thirteen states provide incentives to promote bioenergy development, such as tax breaks, subsidies, grants and/or loans. [see Figure 4 on page 6, and Figures 5 & 6 on page 7]
Research in bioenergy is occurring in every Southern state with centers affiliated with universities, non government organizations, industry, and government entities.
➤
➤
➤
➤
➤
Table 4: Summary of energy values of biomass feedstock resources in the South
State Biofuel Crops Forest Resources
Crop, Mill & Urban Wood
ResiduesBiogas All Resources
Trillion BTU
Alabama �3 �8� 96 4 305
Arkansas 8� ��3 �34 � 34�
Florida 36 88 �0� 6 �30
Georgia 3� �3� ��4 4 380
Louisiana 74 �00 ��� � �96
Kentucky 98 56 48 3 �05
Mississippi 67 �50 47 � �66
Missouri �3� 53 �68 5 457
North Carolina 4� �75 97 9 3�3
Oklahoma �03 �9 4� � �76
South Carolina �7 ��4 4� � �85
Tennessee 54 96 53 3 �06
Virginia 4� ��5 54 3 ��4
West Virginia �3 5� �4 � 79
Region Total 911 1575 1129 48 3663
U.S. Total 4900 3581 3630 169 12281
Region Share of U.S. 18.6% 44.0% 31.1% 28.6% 29.8%
Source: Composite data from Southern Bioenergy Roadmap, 2009.

Page 6 | Executive Summary
Figure 4: Tax-based incentive policies in the South, 2008
Source: Compiled through the Database of State Initiatives for Renewables & Efficiency (DSIRE), literature review, and personal interviews by University of Florida Research Team.
Figure 3: Inventory of live biomass on forestland in the South, by county, 2006-2007
Source: U.S. Department of Agriculture, Forest Service (USDA-FS). Forest Inventory and Analysis, Timber Product Output online database; Forest Inventory Database, Mapmaker 3.0 online data retrieval tool. Available at http://www.ncrs.fs.fed.us/4801/tools-data/mapping-tools/.
Executive Summary | Page 7
Figure 5: Subsidy and grant-based policies in the South, 2008
Source: Compiled through the Database of State Initiatives for Renewables & Efficiency (DSIRE), literature review, and personal interviews by University of Florida Research Team.
Figure 6: Loan-based policies in the South, 2008
Source: Compiled through the Database of State Initiatives for Renewables & Efficiency (DSIRE), literature review, and personal interviews by University of Florida Research Team.
Page 8 | Executive Summary
Southern weaknessesOnly 6.4 percent of the nation’s ethanol is produced in the South, with a majority of the South’s plants (operational and planned) found in Missouri due to the state’s supply of corn as its feedstock.
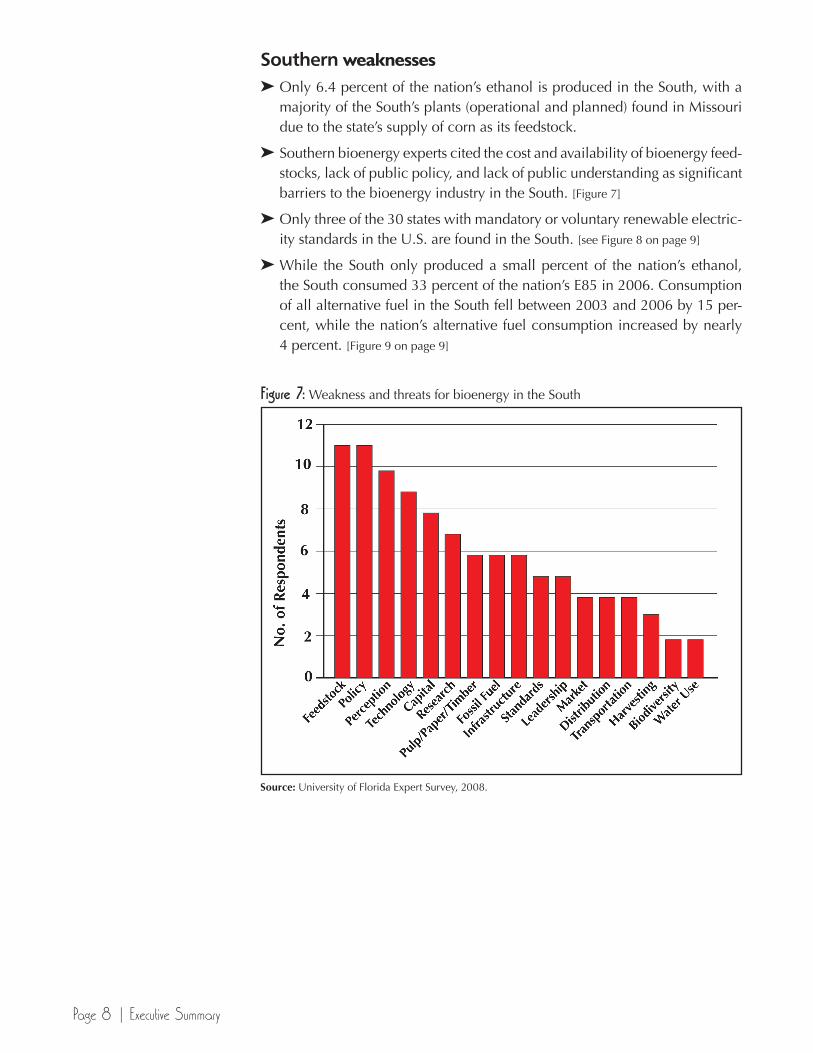
Southern bioenergy experts cited the cost and availability of bioenergy feed-stocks, lack of public policy, and lack of public understanding as significant barriers to the bioenergy industry in the South. [Figure 7]
Only three of the 30 states with mandatory or voluntary renewable electric-ity standards in the U.S. are found in the South. [see Figure 8 on page 9]
While the South only produced a small percent of the nation’s ethanol, the South consumed 33 percent of the nation’s E85 in 2006. Consumption of all alternative fuel in the South fell between 2003 and 2006 by 15 per-cent, while the nation’s alternative fuel consumption increased by nearly 4 percent. [Figure 9 on page 9]
➤
➤
➤
➤
Figure 7: Weakness and threats for bioenergy in the South
Source: University of Florida Expert Survey, 2008.

Executive Summary | Page 9
Figure 9: Percentage change in consumption of alternative fuel* in the U.S. and South, 2003-2006
Source: Energy Information Administration (EIA), 2008. Estimated consumption of alternative fuels, by state, 2003-2005. Accessed on April 15, 2008. Link: http://www.eia.doe.gov/cneaf/alternate/page/atftables/ afvtransfuel_II.html.
*”Alternative fuel” includes: compressed natural gas, electric, E85, hydrogen, liquefied natural gas, and lique-fied petroleum gas.
Source: Department of Energy, Energy Efficiency & Renewable Energy, January 2009. Available at http://apps1.eere.energy.gov/states/maps/renewable_portfolio_states.cfm#map.
Figure 8: Mandatory and voluntary renewable electricity standards in the U.S., 2008
Page �0 | Executive Summary
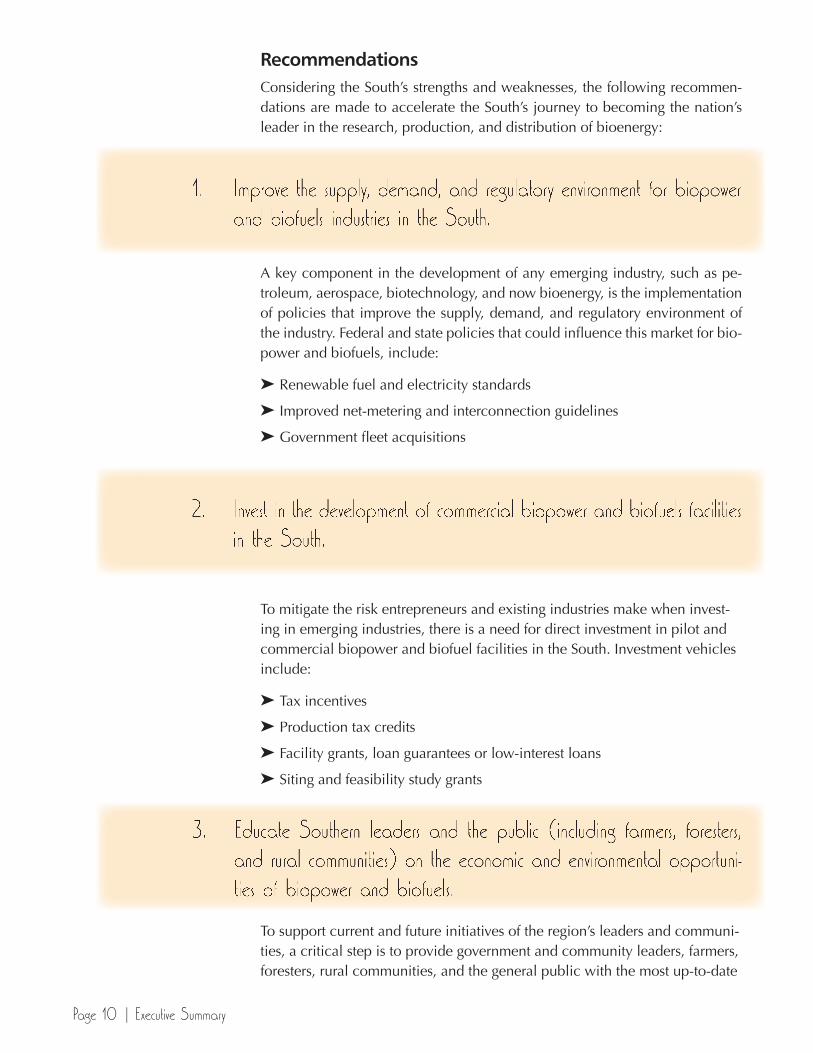
RecommendationsConsidering the South’s strengths and weaknesses, the following recommen-dations are made to accelerate the South’s journey to becoming the nation’s leader in the research, production, and distribution of bioenergy:
A key component in the development of any emerging industry, such as pe-troleum, aerospace, biotechnology, and now bioenergy, is the implementation of policies that improve the supply, demand, and regulatory environment of the industry. Federal and state policies that could influence this market for bio-power and biofuels, include:
Renewable fuel and electricity standards
Improved net-metering and interconnection guidelines
Government fleet acquisitions
To mitigate the risk entrepreneurs and existing industries make when invest-ing in emerging industries, there is a need for direct investment in pilot and commercial biopower and biofuel facilities in the South. Investment vehicles include:
Tax incentives
Production tax credits
Facility grants, loan guarantees or low-interest loans
Siting and feasibility study grants
To support current and future initiatives of the region’s leaders and communi-ties, a critical step is to provide government and community leaders, farmers, foresters, rural communities, and the general public with the most up-to-date
➤
➤
➤
➤
➤
➤
➤
3. EducateSouthernleadersandthepublic(includingfarmers,foresters,andruralcommunities)ontheeconomicandenvironmentalopportuni-tiesofbiopowerandbiofuels.
2. InvestinthedevelopmentofcommercialbiopowerandbiofuelsfacilitiesintheSouth.
1. Improvethesupply,demand,andregulatoryenvironmentforbiopowerandbiofuelsindustriesintheSouth.

Executive Summary | Page ��
information regarding biopower and biofuels. To be successful, this outreach should:
Engage a broad range of partners, including farm and forestry organiza-tions, state biomass councils, state energy offices, state agriculture depart-ments, and community and economic developers
Communicate in concise and easy-to-read materials
Address both the economic and environmental opportunities surrounding biopower and biofuels
Endnotes1 In this document, the “South” refers to Alabama, Arkansas, Florida, Georgia, Kentucky,
Louisiana, Mississippi, Missouri, North Carolina, Oklahoma, South Carolina, Tennessee, Virginia, and West Virginia.
2 Bioenergy is renewable energy created from biomass such as biopower (i.e. electricity) and biofuels (i.e. ethanol, biodiesel). Biomass is organic materials derived from plants and animals and includes agricultural and forestry residues, municipal solid wastes, industrial wastes, and land and aquatic crops grown solely for energy purposes.
3 Management Information Services, Inc. and American Solar Energy Society. Green Collar Jobs in the U.S. and Colorado: Economic Drivers for the 21st Century, January 2009.
4 While most ethanol plants in the U.S. use corn as their fuel source, the South’s opportuni-ties lie in the development of cellulosic ethanol: transportation fuel derived from non-food sources, such as wood, grasses, and residues.
5 Flanders, Archie and John McKissick, Economic Impact of Cellulosic Ethanol Production in Treutlen County, University of Georgia Center for Agribusiness and Economic Development, April 2007.
6 Hodges, Alan W. and Mohammad Rahmani, Economic Impacts of Generating Electricity Fact Sheets, University of Florida, September 2007. http://edis.itas.ufl.edu/FE697.
† Table 3 Abbreviation Key: RFS – Renewable Fuel Standard
RPS – Renewable Portfolio Standard (mandatory and voluntary)
NM/IC – States have both Net-metering / Interconnection standards
AFV – Alternative fuel vehicle acquisition regulations
Tax – Tax incentives
Sub/Grant – Subsidies and grants
Loan – Loan-based policies
Prod & Infra. – Production and infrastructure development
Exten & Educ – Extension and educational outreach
Tech – Technology advancement policies
Background cover art courtesy of ©iStockphoto.com/Jamie Farrant
➤
➤
➤

SOUTHEAST AGRICULTURE & FORESTRY ENERGY RESOURCES ALLIANCEc/o SOUTHERN GROWTH POLICIES BOARD
P.O. BOX 12293, RESEARCH TRIANGLE PARK, NC 27709
PHONE: 919-941-5145 • FAX: 919-941-5594
http://www.saferalliance.net
©2009 Southeast Agriculture & Forestry Energy Resources Alliance