Embed Size (px)
Citation preview

MANUAL FOR ANALYSIS OF PARTICIPATORY
RURAL APPRAISAL (PRA) DATA
A HOW-TO GUIDE FOR USE BY PARTNERS IN
THE SOMALIA RESILIENCE PROGRAM
(SomReP)
Compiled and drafted by:
Obando Ekesa
Consultant
Research, Monitoring & Community Development

Page 1 of 25
Foreword Somalia is a country that has had a very challenging past two decades because of ongoing civil war coupled with
other disasters such as drought and lately tropical cyclones in some parts. Consequently, the country has
suffered from these shocks which have caused negative developmental challenges and made the country
increasingly fragile.
To try and held stem these challenges, many humanitarian and developmental agencies have been operating in
Somalia since 1992, after the fall of Said Barre’s government. Much of this assistance has, however, focused on
short-term to medium-term strategies aimed at meeting immediate needs. Though it is noteworthy that
progress has been made in helping the Somalis towardspeace and stability, there is still a lot that is yet to be
done.
One of the things needed is to ensure that the communities in Somalia are able to build their resilience towards
both natural and man-made disasters. Resilience is an emergent topic among development practitioners, and is
gaining momentum in disaster risk and management to a paradigm shift from anticipation to hazards to building
the capacities of communities towards shocks and stresses.
It is against this backdrop that the Somalia Resilience Program (SomReP) was conceptualized in 2013 by seven
international non-governmental organizations working in Somalia to bring their synergies together in resilience
programming. The objective of SomReP is to increase resilience of chronically vulnerable people, households,
communities and systems in targeted zones: pastoral, agro-pastoral and peri-urban with the aim of enhancing
resilience in Somalia. This is so that Somalia can withstand the various shocks and stresses it has experienced for
the past two decades.
To help communities in resilience programming, the implementers facilitate them to identify their needs and
vulnerabilities through participatory rural appraisal (PRA) tools and techniques. These are intended to produce
evidence-based programming so that the resilience programming can be more effective. This manual therefore
is a guide to consortium partners to help them walk through the analysis of the PRA data collected from
communities, which will effectively guide them in evidence-based programming.
It is our hope that the consortium partners will find this manual useful and will provide feedback to the SomReP
Technical Unit as part of ensuring programme learning and research is generated, which is in tandem with
achievement of Result 5 of the SomReP Program.
Andrew Lanyon
Chief of Party
Somalia Resilience Program (SomReP)

Page 2 of 25
Acknowledgements This PRA manual, compiled and drafted by Obando Ekesa (SomReP Monitoring & Evaluation Consultant), is as a
result of the PRA Analysis work undertaken with some of the SomReP consortium partners, initially with staff of
ACF, ADRA, CARE & Oxfam during the commencement of the analysis and later with World Vision and Oxfam
during the field-testing. Thank you Osman Adar, SomReP Pastoral Technical Advisor for the pivotal part you
played in the PRA Analysis process with some of the consortium partners.
We are also grateful to Georgina Jordan, SomReP Quality Assurance & Knowledge Manager for her further
refinement of the manual and the feedback received from Daniel Kanyerere, SomReP Agro-Pastoral Technical
Advisor during the drafting of the manual. We particularly thank the various donors – DANIDA, the European
Union, World Bank, USAID, SIDA and AusAID – for funding the various projects within the Resilience
Programming, which have consequently contributed to learning enabling the drafting of this manual. The
SomReP Technical Unit would like to thank everybody, who has contributed in whatever small way, to the
realization of this manual.

Page 3 of 25
Contents
Foreword ....................................................................................................................................................................1
Acknowledgements ...................................................................................................................................................2
INTRODUCTION ..........................................................................................................................................................4
Background ................................................................................................................................................................4
Purpose and Scope of the Manual ........................................................................................................................4
Target/User for the Manual ..................................................................................................................................5
How to use the Manual .........................................................................................................................................5
Limitations of this manual .....................................................................................................................................5
Participatory Rural Appraisal ....................................................................................................................................6
Why PRA? ...............................................................................................................................................................6
Participatory Rural Appraisal in the Somali Context ............................................................................................7
Participatory Rural Appraisal (PRA) Tools ............................................................................................................8
AN ANALYTICAL FRAMEWORK – ANALYSIS OF PRA DATA .................................................................................... 14
Analysis Methodology ........................................................................................................................................ 15
Consolidation of Analysis by district .................................................................................................................. 22
Design .................................................................................................................................................................. 23
Page 4 of 25
INTRODUCTION
Background The Somalia Resilience Program (SomReP) is a consortium comprising of seven international non-governmental
organizations, namely: Action Contre la Faim (ACF), Adventist Development and Relief Agency (ADRA), CARE
International (CI), Cooperazione Internazionale (COOPI), Danish Refugee Council (DRC), Oxfam, and World Vision
International (WVI). SomReP is a 5-year program which aims at enhancing resilience in Somalia with an overall
objective of building household and community resilience to drought and related risks in Somalia.
SomReP’s focus areas are in pastoralist, agro-pastoralist and peri-urban livelihoods zones in eight regions of
Somalia – Gedo, Galgaduud, Hiraan, Nugal, Sanaag, Sool, Mudug and Togdheer. The first phase, which
commenced in 2013, will be for three years targeting 70,000 HHs (which is approximately 420,000 people). The
program has five expected program results, upon which documentation, monitoring and evaluation will be
based:
1. Improved adaptive capacity of individuals (disaggregated by Age, Gender and Diversity), HHs and
communities through support to livelihood diversification and improved access to markets, financial
services, and basic livelihood services;
2. Improved absorptive capacity of HHs and communities through collective action in support of effective
disaster risk management, adoption of positive coping strategies and improved access to formal and
informal safety nets;
3. Eco-system health improved through promotion of equitable and sustainable natural resource
management;
4. Transformative capacity improved through support to greater coordination of community based
governance structures in livelihoods, DRR, conflict mitigation and natural resource management;
5. Programme learning and research generated, published, and shared among relevant stakeholders
(including communities, NGOs, and government).
As part of achieving Result 5, this manual was developed as a guide to consortium partners to use to analyze
data collected during the participatory rural appraisal (PRA) and use the same to develop guidelines for project
design. It should be noted, however, that the manual is neither prescriptive nor exhaustive but to be used both
as acomplementary and supplementary guide to enhance the analysis process and add to the organizations’
existing analysis procedures.
Purpose and Scope of the Manual Participatory Rural Appraisal (PRA) is one of the myriad of participatory approaches of actively working with
people in decision-making towards implementing change in their own communities. PRA takes cognizance that
communities are in control of their own development and of their resources and goes further to treat
people/communities as assets and partners in the development process.
The manual is designed as a guiding framework for resilience programming using PRA tools. It goes one step
further beyond the PRA data collection to guide program managers and implementers in undertaking analysis
which should then guide them in making decisions for program/project design. However, it introduces the most
common (but not all) of the PRA tools used by development practitioners and groups them into three main
categories: (1) visualization, mapping and modeling tools; (2) ranking and scoring tools; and (3) problem
identification/analysis tools. The description of the tools in this manual is not done exhaustively as there are
several manuals1 that describe the PRA process.
1Examples of manuals include: Rapid Rural Appraisal (RRA) & Participatory Rural Appraisal (PRA): A manual for CRS Field Workers and
partners; CARE’s Household Livelihood Security Assessments: A toolkit for practitioners. There are many PRA manuals which can be used.

Page 5 of 25
The focus of this manual is on the PRA Data Analysis to be undertaken after the completion of PRA data
collection. The aim of the data analysis is to ensure that correct programmatic decisions are made prior to
implementation of resilience projects, which are then validated by going back to the communities.
Target/User for the Manual This manual is meant to be used by partners in the SomReP Consortium and other development practitioners
who are particularly interested in resilience programming. The specific target groups are therefore program
managers and implementers who are key in the design of programs/projects. However, the manual can also be
used to train trainers of trainers (ToTs) or staff who will implement resilience projects.
How to use the Manual It should be noted, however, that the PRA process involves an entire continuum which involves community
mobilization, PRA data collection and analysis, and subsequent decision-making for project implementation.
This manual should be used in conjunction with PRA Data Collection Manuals. The PRA Data Collection
Manuals, as opposed to this data analysis manual, have more comprehensive steps and procedures of the
various PRA tools. They explore and explain in detail step-by-step description on how to go about conducting the
PRA exercise in the community, the time duration, the participants, etc. It is therefore important for users to
first acquaint themselves with the PRA tools as outlined in the PRA manuals. It is also assumed that whoever is
using this manual has a good understanding of the PRA tools and how to conduct PRA exercises in targeted
communities.
Prior to conducting the PRA exercise, it is important for the users of this manual to undertake a PRA review. The
twofold aim of doing this are: to get a common understanding of the PRA; and to identify PRA approaches/tools
to be used in the field. It is important to identify what PRA tools they will use since some of the tools overlap in
the data they generate. So decisions need to be made on which specific tools will yield the most useful data to
guide in making program design decisions.
Once the data has been collected, then it is important to conduct another PRA review to help the
implementersget an understanding of how to organize, process and interpret the field data gathered. This
review is guided by the Analytical Frameworkoutlined in this manual which describes the analysis process, the
essential elements of the analysis process, and the critical stages.
The last and final process is then the consolidation of the data by district (it is assumed the implementation is
undertaken in districts) and the programmatic design decisions. A reporting template, which documents the
results of the PRA analysis, has been annexed at the end of the manual, which has been field-tested by some
consortium partners.
Limitations of this manual
This manual, first, does not give a comprehensive description of the PRA toolsfor conducting the PRA exercise,
because it would lose its focus of being a guide book in the analysis of the PRA data.Secondly, the manual takes
cognizance of the fact that the PRA Data is largely qualitative and therefore the analysis is an iterative process.
Consequently, the manual will continue to be refined by the SomRePTechnical Unit as learning points are
generated by consortium partners during their analysis. Lastly, the analysis guide postulated here will involve a
lot of triangulation to ensure cross-checking of information generated. We acknowledge the fact that we cannot
use data analysis software (at the moment) but it is hoped that as programming continues, this will be possible
as more refined data collection techniques are generated and used.

Page 6 of 25
Participatory Rural Appraisal
Why PRA? Participatory Rural Appraisal (PRA) as an approach was coined by development scholar, Robert Chambers in
1983 in his classic book, Rural Development – Putting the Last First. Over a period of time, PRA has become
encapsulated as a label given to a growing family of participatory approaches and methods that emphasize local
knowledge and enable local people to make their own appraisal, analysis, and plans. PRA uses group animation
and exercises to facilitate information sharing, analysis, and action among stakeholders (according to the World
Bank’s Website).
Consequently, PRA is a set of participatory and largely visual techniques for assessing group and community
resources, identifying and prioritizing problems and appraising strategies for solving them. It is a
research/planning methodology in which a local community (with or without the assistance of outsiders) studies
an issue that concerns the population, prioritizes problems, evaluates options for solving the problem(s) and
comes up with a Community Action Plan to address the concerns that have been raised.
Simply stated, PRA is a set of tools and techniques used with households/communities to gather and analyze
information on community resources, problems, potential and needs.The PRA exercise at community level is
conducted with the purpose of empowering the communities in identifying opportunities and issues facing them
in their localities and designing appropriate mechanisms to mitigate these obstacles. The process is used to
mobilize communities so that they can analyze their own situation and design interventions that will help them
solve their problems ormeet their development objective.
PRA is used to:
• Analyze the current situation and potential in a village or community.
• Analyze problems and their causes.
• Support households to identify activities that respond to difficulties and opportunities
The defining principles of PRA are:
• Seeks to catalyze reflection and analysis with and by local people through the use of visual methods,
interactive processes and group learning.
• An emphasis on enabling people to speak up and out.
• Focus on interactive learning between and among local people and those from outside.
• An explicit concern with quality of interaction: stress on personal values, attitudes and behavior as a
prerequisite for effective work.
• The use of open-ended, adaptable, visual methods within a flexible learning process rather than the use
of a sequence of specific methods for pre-determined ends.
• A commitment to generating knowledge for action (rather than simply for understanding) and to
address tangible, do-able action plans for immediate or intermediate follow-up.
PRA therefore helps communities to:
� Mobilize their human and natural resources
� Define their problems
� Consider previous successes and failures
� Evaluate priorities and opportunities.
� Prepare a systematic and site specific plan of action.
Page 7 of 25
Specifically in project implementation, the PRA exercise is useful in the following scenarios2:
I. Pre-project
PRA tools are useful for gathering information that will help agencies to orient their programs. The use of
several PRA tools in an area (or several villages) that is new to the agency/NGO enables the agency/NGO to get a
sense of the range of issues that need to be addressed, and be better informed on the context (social, economic,
political, environmental, etc.) in which the projects will intervene.
II. Project Design
PRA is essential in the design phase to ensuring that the project is appropriate to the realities in the area where
it will be working. There is ample experience now to suggest that standardized, off the shelf projects are of
limited effectiveness. The more that projects can be customized to the peculiar circumstances where they will
intervene, the greater their chance of success.
This manual is therefore intended to guide SomReP Consortium partners in the analysis which leads to
program/project design decisions as part of the package in the design of resilience programs in Somalia.
III. Early project intervention
Conducting PRAs early in the project can help the project further refine its objectives and activities. If PRAs have
not been done in the project design phase, then undertaking PRAs early in the project will be essential to
correcting any design flaws. In some cases, these PRAs will logically lead into development of community action
plans (CAPs) that draw the communities more deeply into the planning process.
IV. Mid-project
As the project gets underway, the staff may choose a select number of communities in which to do regular PRA
studies to monitor implementation, and to assess the effectiveness of the approach. This will enable corrections
to be made as problems are identified. PRA is also a very useful method to use in mid-term evaluations of
project activities in selected sites. The SomReP Program envisages using selected PRA tools for mid-term
reviews.
V. End of project
The end of project evaluation will almost certainly wish to include a PRA assessment of strengths and
weaknesses. This evaluation will look at who was affected by the project and the impact on those who
participated,as well as those who did not.
The SomReP Consortium hopes to use selected PRA tools in the end of project evaluations.
Participatory Rural Appraisal in the Somali Context Undertaking Participatory Rural Appraisal (PRA) may be quite different in the Somalia context as opposed to
other countries in the world. Somalia is a country that has been in a protracted civil war since the fall of
formalized government in 1990. The situation has been exacerbated by slow onset disasters, particularly
drought and famine which has left the country in an extremely fragile state.
Most of the communities, however, are recovering from the effects of civil war and are therefore transiting from
humanitarian to development assistance. In such post-conflict transitions, PRA may be used to support these
war torn areas to evolve from conflict to long term development by using the community members to embrace
2Adapted from Rapid Rural Appraisal (RRA) &Participatory Rural Appraisal (PRA): A Manual for CRS Field Workers and
Partners by Karen Schoonmaker Freudenberg (www.crs.org)
Page 8 of 25
the change they desire. The PRA process therefore allows the communities to take the driver’s seat in the
development cycle by:
� Exploring an area, learning about key problems and opportunities.
� Planning research or development interventions.
� Investigating one key problem or specific topic.
� Involving the local people in research and planning.
� Monitoring and evaluating a research or development activity.
� Dealing with conflicting differences with different groups (conflict resolution).
PRA is therefore both an instrument and a process that can help address the various challenges in the Somalia
context and one that is especially useful in involving all stakeholders and thereby help to prevent escalation of
conflict. It also serves as an eye-opener to communities to identify their own challenges and give ideas to how
these can be addressed.
Within resilience programming, PRA is particularly useful because resilience programming is a long-term agenda
that requires the involvement of the entire communities – from the youth, women, and village elders to
government officials. The PRA process is therefore important for community mobilization to ensure the targeted
communities fully participate. Since resilience is a complex term, it is imperative that communities are mobilized
through the PRA process so as to create ownership of the project. In certain scenarios, it will even be more
useful where the communities translate the concept of resilience into their own local dialect using simple
terminologies they can identify with (This concept is borrowed from CARE’s programming, which ensures that all
their projects are translated into the target communities’ local dialect, thereby creating ownership).
In addition, the concept of resilience recognizes the entire spectrum of community-based disaster risk mitigation
(CBDRM). Somalia, like many other countries, is susceptible to risk and as such it is important for communities to
be mobilized to discuss the risks inherent in their communities and how they can participate together to
mitigate them. The PRA process therefore is useful in CBDRM because communities are helped to plan solutions
to help them build their capacity of coping with disasters risks and reducing their vulnerabilities with the
ultimate aim of developing safer and more resilient communities.
However, it is acknowledged that resilience programming is a continuous process that will require both patience
and persistence if lasting change is to be seen within the Somalia context.
Participatory Rural Appraisal (PRA) Tools The purpose of conducting PRA in program target villages is to ensure the active involvement for all concerned
stakeholders especially the target communities to participate in planning process through participatory rural
appraisal while at the same time identifying and analyzing their priority needs, gaps and coming up with an
effective action plan that will be a sustainable solution for the identified and emerged problems.
There are many tools used for participatory approaches. The choice and application of tools isdependent on the
objectives to be met during training process and the ease in applicability of toolsfor those whom training is
intended for. According to Wikipedia, hundreds of participatory techniques and tools have been described in a
variety of books and newsletters, or taught at training courses around the world. These techniques/tools can be
divided into three (3) broad categories, namely:
• Visualization (Diagramming), Mapping and Modelling Tools, e.g.
- Transects,
- Maps (resource maps, social maps)
- Venn Diagrams
- Seasonal Calendars
Page 9 of 25
- Historical Timelines
• Ranking and Scoring Tools, e.g.
- Pair Wise Ranking
- Matrix Ranking
- Matrix Scoring
- Wealth ranking and Well-Being Analysis
- Pie Charts
• Problem Identification/Analysis Tools, e.g.
- Identification and specification
- Causal chaining
- Prioritization
Summary of PRA Tools used in SomRePand their use/importance
PRA Tools Use and/or importance
Visualization (Diagramming), Mapping and Modelling tools
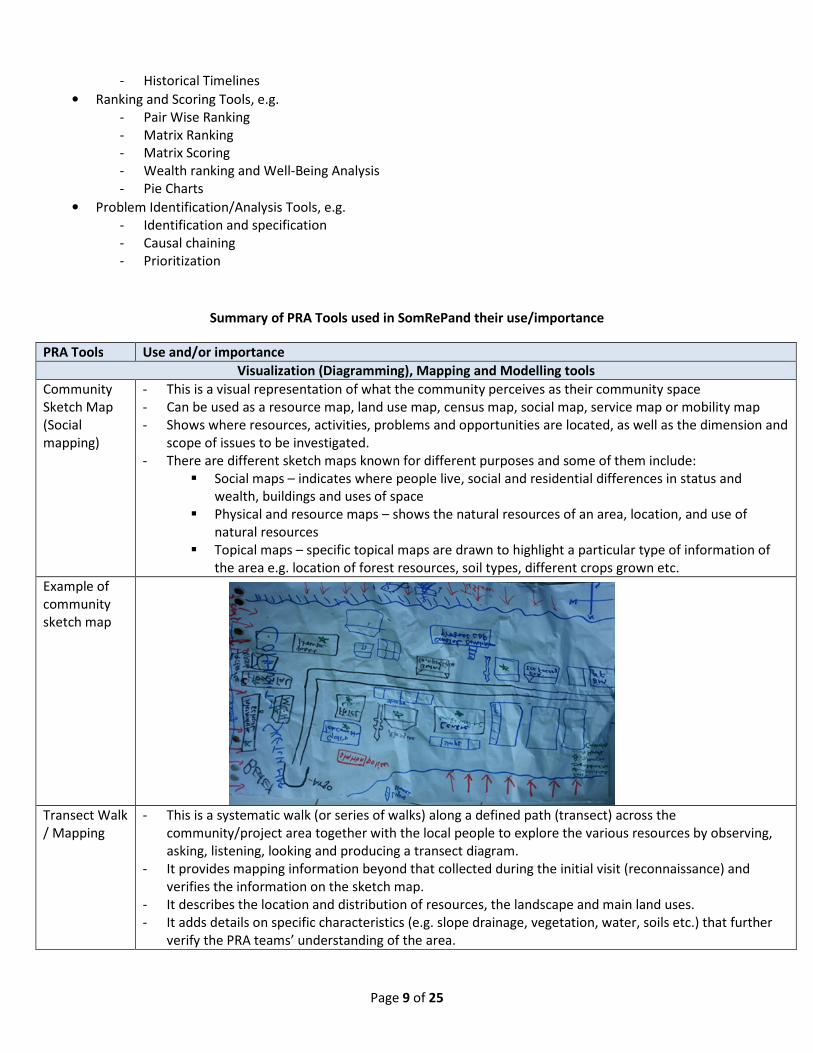
Community
Sketch Map
(Social
mapping)
- This is a visual representation of what the community perceives as their community space
- Can be used as a resource map, land use map, census map, social map, service map or mobility map
- Shows where resources, activities, problems and opportunities are located, as well as the dimension and
scope of issues to be investigated.
- There are different sketch maps known for different purposes and some of them include:
� Social maps – indicates where people live, social and residential differences in status and
wealth, buildings and uses of space
� Physical and resource maps – shows the natural resources of an area, location, and use of
natural resources
� Topical maps – specific topical maps are drawn to highlight a particular type of information of
the area e.g. location of forest resources, soil types, different crops grown etc.
Example of
community
sketch map
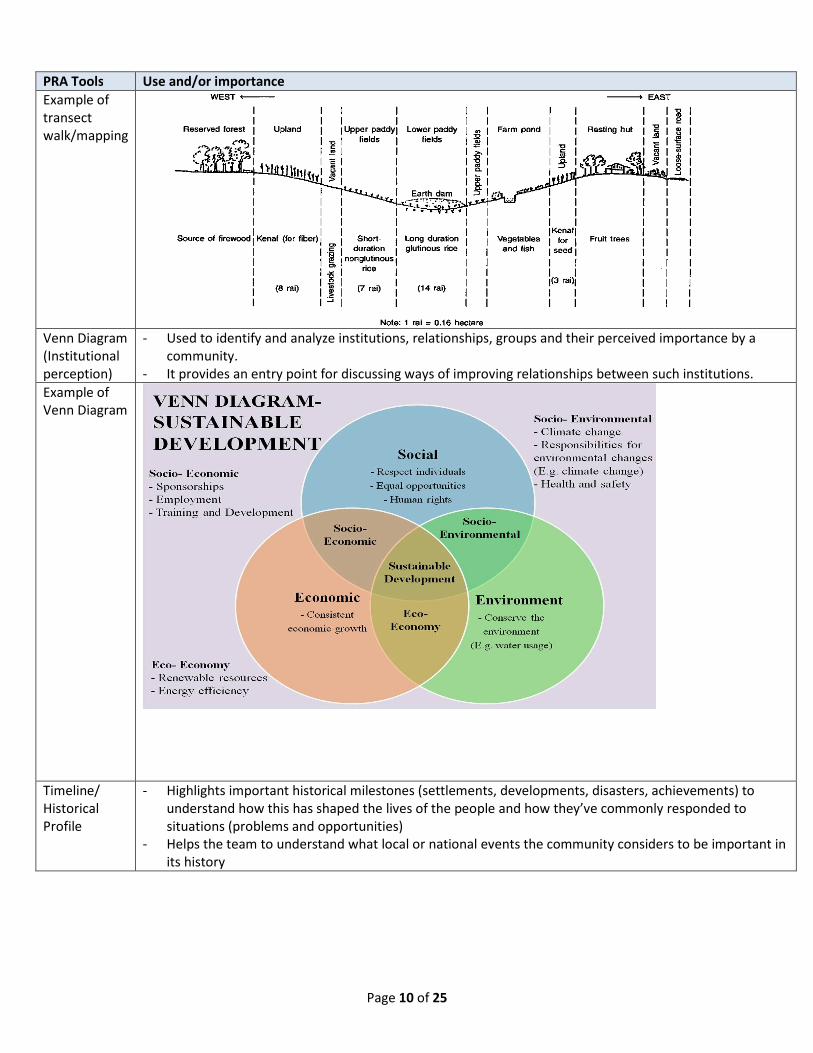
Transect Walk
/ Mapping
- This is a systematic walk (or series of walks) along a defined path (transect) across the
community/project area together with the local people to explore the various resources by observing,
asking, listening, looking and producing a transect diagram.
- It provides mapping information beyond that collected during the initial visit (reconnaissance) and
verifies the information on the sketch map.
- It describes the location and distribution of resources, the landscape and main land uses.
- It adds details on specific characteristics (e.g. slope drainage, vegetation, water, soils etc.) that further
verify the PRA teams’ understanding of the area.
Page 10 of 25
PRA Tools Use and/or importance
Example of
transect
walk/mapping
Venn Diagram
(Institutional
perception)
- Used to identify and analyze institutions, relationships, groups and their perceived importance by a
community.
- It provides an entry point for discussing ways of improving relationships between such institutions.
Example of
Venn Diagram
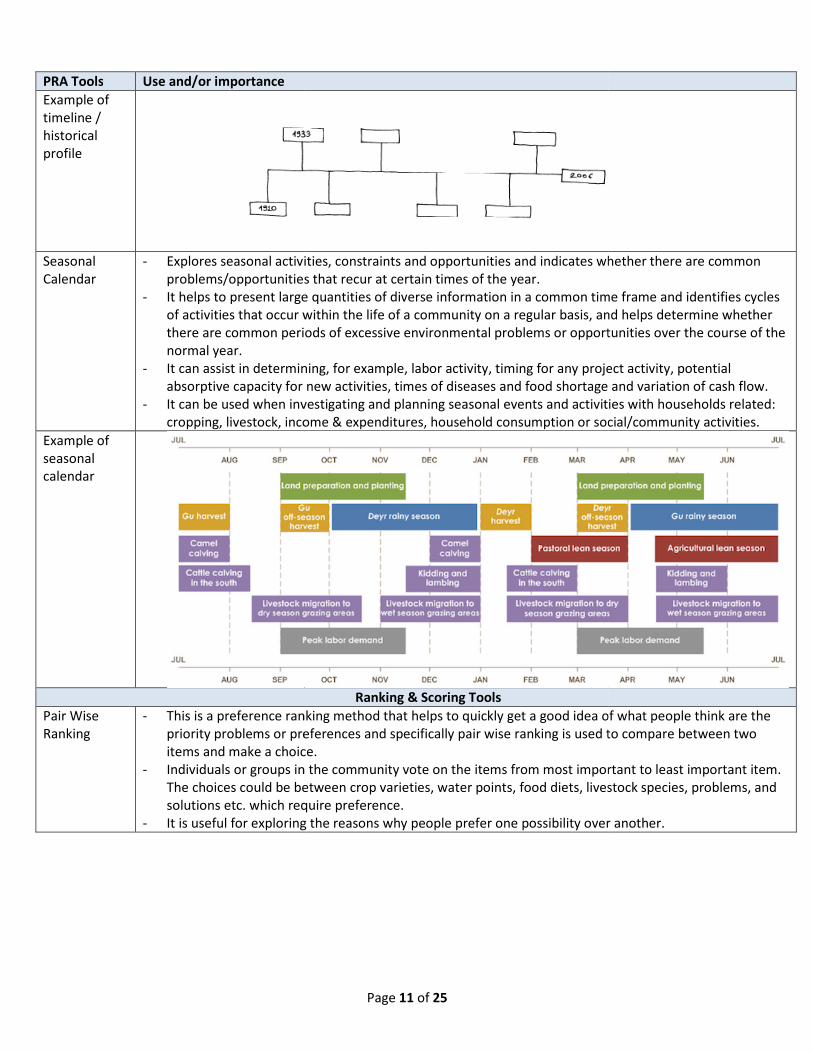
Timeline/
Historical
Profile
- Highlights important historical milestones (settlements, developments, disasters, achievements) to
understand how this has shaped the lives of the people and how they’ve commonly responded to
situations (problems and opportunities)
- Helps the team to understand what local or national events the community considers to be important in
its history
PRA Tools Use and/or importance
Example of
timeline /
historical
profile
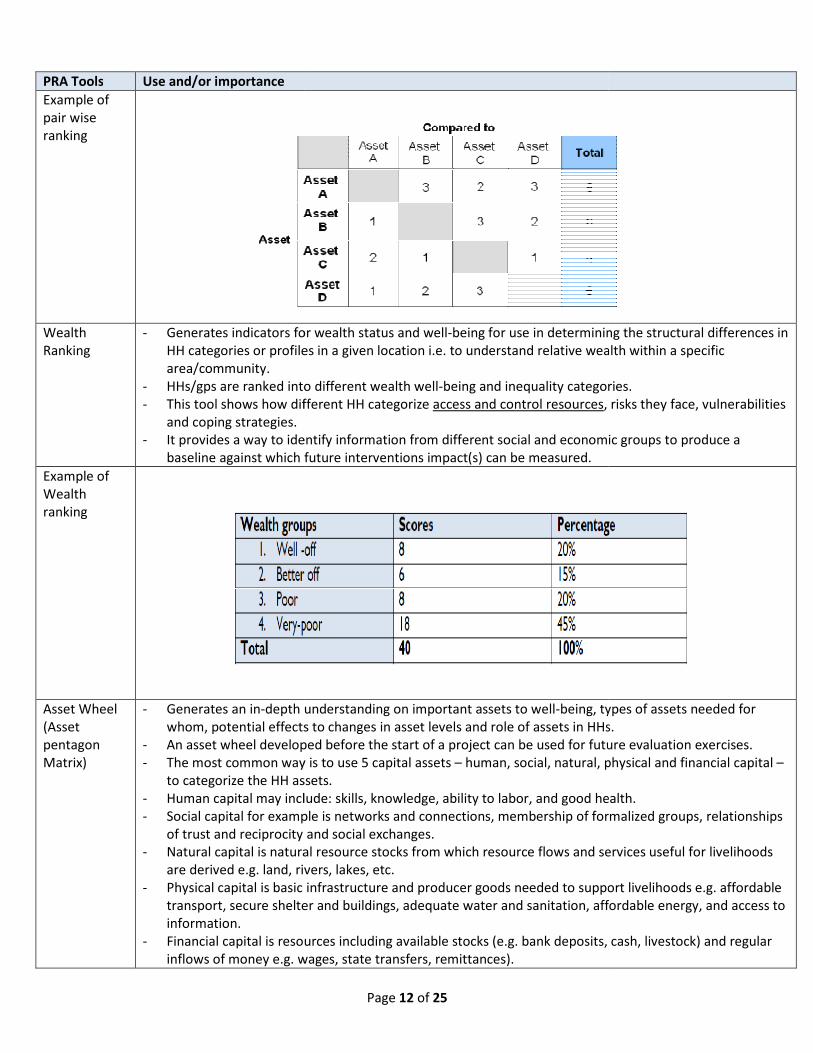
Seasonal
Calendar
- Explores seasonal activities, constraints and opportunities and indicates whether there are common
problems/opportunities that recur at certain times of the year.
- It helps to present large quantities of diverse information in a common time frame and identifies cycles
of activities that occur within the life of a community on a regular basis, and helps determine whether
there are common periods of excessive environme
normal year.
- It can assist in determining, for example,
absorptive capacity for new activities, times of diseases and food shortage and variat
- It can be used when investigating and planning seasonal events and activities with households related:
cropping, livestock, income & expenditures, household consumption or social/community activities.
Example of
seasonal
calendar
Pair Wise
Ranking
- This is a preference ranking method that helps to quickly get a good idea of what people think are the
priority problems or preferences and specifically pair wise ranking is used to compare between two
items and make a choice.
- Individuals or groups in the community vote on the items from most important to least important item.
The choices could be between crop varieties, water points, food diets, livestock species, problems,
solutions etc. which require prefere
- It is useful for exploring the reasons why people prefer one possibility over another.
Page 11 of 25
Explores seasonal activities, constraints and opportunities and indicates whether there are common
problems/opportunities that recur at certain times of the year.
It helps to present large quantities of diverse information in a common time frame and identifies cycles
of activities that occur within the life of a community on a regular basis, and helps determine whether
there are common periods of excessive environmental problems or opportunities over the course of the
It can assist in determining, for example, labor activity, timing for any project activity, potential
absorptive capacity for new activities, times of diseases and food shortage and variat
It can be used when investigating and planning seasonal events and activities with households related:
cropping, livestock, income & expenditures, household consumption or social/community activities.
Ranking & Scoring Tools
This is a preference ranking method that helps to quickly get a good idea of what people think are the
priority problems or preferences and specifically pair wise ranking is used to compare between two
ake a choice.
Individuals or groups in the community vote on the items from most important to least important item.
The choices could be between crop varieties, water points, food diets, livestock species, problems,
etc. which require preference.
It is useful for exploring the reasons why people prefer one possibility over another.
Explores seasonal activities, constraints and opportunities and indicates whether there are common
It helps to present large quantities of diverse information in a common time frame and identifies cycles
of activities that occur within the life of a community on a regular basis, and helps determine whether
ntal problems or opportunities over the course of the
activity, timing for any project activity, potential
absorptive capacity for new activities, times of diseases and food shortage and variation of cash flow.
It can be used when investigating and planning seasonal events and activities with households related:
cropping, livestock, income & expenditures, household consumption or social/community activities.
This is a preference ranking method that helps to quickly get a good idea of what people think are the
priority problems or preferences and specifically pair wise ranking is used to compare between two
Individuals or groups in the community vote on the items from most important to least important item.
The choices could be between crop varieties, water points, food diets, livestock species, problems, and
It is useful for exploring the reasons why people prefer one possibility over another.
PRA Tools Use and/or importance
Example of
pair wise
ranking
Wealth
Ranking
- Generates indicators for wealth status and well
HH categories or profiles in a given location i.e. to understand relative wealth within a specific
area/community.
- HHs/gps are ranked into different wealth well
- This tool shows how different HH categorize
and coping strategies.
- It provides a way to identify information from different social and economic groups to produce a
baseline against which future interventions impact(s) can be measured.
Example of
Wealth
ranking
Asset Wheel
(Asset
pentagon
Matrix)
- Generates an in-depth understanding on important assets to well
whom, potential effects to changes in asset levels and role of assets in HHs.
- An asset wheel developed before the start of a project can be used for future evaluation exercises.
- The most common way is to use 5 capital assets
to categorize the HH assets.
- Human capital may include: skills,
- Social capital for example is
of trust and reciprocity and social exchanges.
- Natural capital is natural resource stocks from which resour
are derived e.g. land, rivers, lakes, etc.
- Physical capital is basic infrastructure and producer goods needed to support livelihoods e.g. affordable
transport, secure shelter and buildings, adequate water and sa
information.
- Financial capital is resources including available stocks (e.g. bank deposits, cash, livestock) and regular
inflows of money e.g. wages, state transfers, remittances).
Page 12 of 25
Generates indicators for wealth status and well-being for use in determining the structural differences
HH categories or profiles in a given location i.e. to understand relative wealth within a specific
HHs/gps are ranked into different wealth well-being and inequality categories.
This tool shows how different HH categorize access and control resources, risks they face, vulnerabilities
It provides a way to identify information from different social and economic groups to produce a
baseline against which future interventions impact(s) can be measured.
depth understanding on important assets to well-being, types of assets needed for
whom, potential effects to changes in asset levels and role of assets in HHs.
developed before the start of a project can be used for future evaluation exercises.
The most common way is to use 5 capital assets – human, social, natural, physical and financial capital
the HH assets.
Human capital may include: skills, knowledge, ability to labor, and good health.
capital for example is networks and connections, membership of formalized groups, relationships
of trust and reciprocity and social exchanges.
Natural capital is natural resource stocks from which resource flows and services useful for livelihoods
are derived e.g. land, rivers, lakes, etc.
Physical capital is basic infrastructure and producer goods needed to support livelihoods e.g. affordable
transport, secure shelter and buildings, adequate water and sanitation, affordable energy, and access to
resources including available stocks (e.g. bank deposits, cash, livestock) and regular
inflows of money e.g. wages, state transfers, remittances).
being for use in determining the structural differences in
HH categories or profiles in a given location i.e. to understand relative wealth within a specific
being and inequality categories.
, risks they face, vulnerabilities
It provides a way to identify information from different social and economic groups to produce a
being, types of assets needed for
whom, potential effects to changes in asset levels and role of assets in HHs.
developed before the start of a project can be used for future evaluation exercises.
human, social, natural, physical and financial capital –
, and good health.
networks and connections, membership of formalized groups, relationships
ce flows and services useful for livelihoods
Physical capital is basic infrastructure and producer goods needed to support livelihoods e.g. affordable
nitation, affordable energy, and access to
resources including available stocks (e.g. bank deposits, cash, livestock) and regular

Page 13 of 25
PRA Tools Use and/or importance
Example of
asset matrix
Livelihood
Matrix
- Individuals and groups identify the list of livelihood activities that they rely upon and develop criteria to
apply selective preference ranking from choices.
- It allows for logical rationale that can be applied to the livelihood needs and opportunities of the
groups/individuals.
Example of
livelihood
matrix
Problem Identification Tools
Risk Mapping - Involves generating a visual illustration of perceptions on both types and varying levels of risk that can
affect individuals, groups or communities.
- It captures the recurrent sites of risk and of past events that had a negative impact, mechanisms for
mitigation or preventing risks/hazards.
- Participants use social map to identify, locate and point important areas prone to various risks.
Problem
Analysis
- Involves a visual illustration of the dependent and independent (cause and effect) variables that underlie
problems faced by groups or a community.
- The actual (real) problem is illustrated by a tree trunk while the factors, influences and outcomes are
illustrated as the roots and branches.
- It helps to facilitate discussion on: a problem affecting households in the village and the causes and
effects of the problem; linkages between different causes and different effects of the problem; and
solutions and activities households can do that will contribute to solve the problems.
- It can be used to identify: HH perceptions of causes of problems they face; HH perceptions of effects of
problems they face; and linkages between different causes and effects of the problems.
- It is particularly important when planning activities such as social programs with households; analyzing

Page 14 of 25
PRA Tools Use and/or importance
social or community problems; and looking at issues and problems facing the most vulnerable (e.g.
women) in a community.
Example of
problem tree
analysis
AN ANALYTICAL FRAMEWORK – ANALYSIS OF PRA DATA The analytical framework below highlights a number of ideas forappropriate desk analysis of the PRA data. The
framework suggests six (6) analysis methods, each with its own objective. However, it should be noted that
analysis is a continuous process of reviewing information as it is collected, classifying it, formulating additional
questions, verifying information, and drawing conclusions. It should therefore not be left until all the data has
been collected.
Why analyze the PRA data?
Analysis is the process of making sense of the collected information/data. Collection of the PRA data from the
targeted communities is not complete without analyzing to enable focused decision-making in the design of
programs/projects prior to implementation. The same information will also be useful in the subsequent
reviews/evaluations of the program/project.
This manual suggests the following analysis methodologies:
• Summary of PRA Data
• Do No Harm Analysis
• Stakeholder Analysis
• Causal Loop Analysis and Systems Analysis
• Risk Analysis
• Asset Risk Analysis

Page 15 of 25
Analysis Methodology
1. Summary of PRA Data To give a snapshot of the PRA data collected, a summary table is extracted from the PRA reports for each village
in the targeted districts.
Name of Organization:
Name of District:
Village 1 Village 2 Village 3 Village 4 Village
…n
Similarities Variations Implications
for
programmin
g
Estimated
population
Village x-tics
(community
sketch map)
Asset Matrix
(asset ranking)
Wealth
ranking
Household
wealth ranking
(assets among
different
wealth groups)
Hazards
among the
different
wealth groups
Problems
identified in
the community
Livelihood
activities
(among the
different
wealth groups)
2. Do No Harm Analysis
Do No Harm (DNH) was conceptualized in the early 1990s, when a number of international and local NGOs
collaborated through the Local Capacities for Peace Project, also known as Do No Harm (DNH) Project, to learn
more about how assistance that is given in conflict settings interacts with the conflicts3.
DNH is an important aspect to consider for humanitarian and development practitioners because it is
acknowledged that, by itself, assistance neither causes nor can end conflict, it can be a significant factor in
conflict contexts. Assistance can have important effects on intergroup relations and on the course of
intergroupconflict. Conflicts are never simple. DNH does not, and cannot, make things simpler. Rather, DNH
3From the Do No Harm Handbook, The Framework for Analyzing the Impact of Assistance on Conflict, Collaborative Learning Projects,
2004.

Page 16 of 25
helps us get ahandle on the complexity of the conflict environments where we work.The aim is to help
assistance workersdeal with the real complexities of providing assistance in conflicts with less frustration and
more clarity and, it is hoped, with better outcomes for the societies where assistance is provided.4
Seven steps to the DNH Analytical Framework
The framework is adapted from the Do No harm Handbook and it should be noted that it is not a prescriptive
but descriptive tool. To undertake a DNH Analysis, it is important to use both primary sources (Venn diagram)
and secondary sources of data.
Analysis is undertaken in the following 7 steps, as adapted from the Do No Harm Handbook:
a) Understanding the context of conflict – understanding which conflicts are dangerous in terms of their
destructiveness or violence. Every society has groups with different interests and identities that contend
with other groups. However, many – even most – of these differences do not erupt into violence and,
therefore, are not relevant for DNH Analysis.
DNH is useful for understanding the impacts of assistance programmes on the socio/political schisms
that cause, or have the potential to cause, destruction or violence between groups.
b) Analyzing dividers and tensions – once the important schisms in society have been identified, the next
step is to analyze what divides the groups. These dividers/sources of tension between groups may be:
� Roots causes i.e. deep-seated, historical injustices
� Proximate causes i.e. recent, short-lived causes or manipulated by sub group leaders
� Economic relations
� Geography
� Demography
� Politics
� Religion
� Internal to the society
� External to the society
Understanding what divides people is critical to understanding, subsequently, how the
humanitarian/development assistance programmes feed into, or lessen, these forces (mentioned above).
c) Analyzing connectors and local capacities for peace–analyze how people, although divided by conflict,
remain also connected across sub-group lines.
The local capacities for peace offer an avenue for rebuilding non-war relations because they help
organizations assess the impacts of assistance programmes on conflict.
d) Analyzing the assistance programme–This involves a thorough review of all aspects of the assistance
programme. Where and why is assistance offered, who are the staff (external and internal), how were
they hired, who are the intended
e) Analyzing the Assistance Programmes Impact on dividers and connectors – this involves using the
concepts of resource transfers and implicit ethical messages. The analysis is the interactions of each
aspect of the assistance programme with the existing divers/tensions and connectors/LCPs.
Questions to ask include:
4From the Do No Harm Handbook, The Framework for Analyzing the Impact of Assistance on Conflict, Collaborative Learning Projects,
2004.
Page 17 of 25
o Who gains,losses (or who does not gain) from the assistance/project/intervention?
o Do these groups overlap with the divisions identified as potentially or actually destructive?
o Does the intervention support military activities or civilian structures?
o Are there any missed opportunities to reinforce connectors?
o Will the intervention inadvertently undermine or weaken LCPs?
o What resources is the intervention bringing into the conflict?
o What impact will the development support have?
o What messages are being given through the way the organization works?
o What impact will the organization have through the implicit ethical messages?
Each aspect of programming should be reviewed for its actual and potential impacts on
dividers/tensions and connectors/LCPs.
f) Considering (and generating programming options) – if the above analysis (b – e) shows that the
intervention/program will worsen intergroup divers, then the implementers must think about how to
provide the same program in a way that eliminates its negative, conflict-worsening impacts.
If the connectors/local capacities for peace have been overlooked, the program should be redesigned
not to miss these opportunities for peace.
g) Test Programming Options and redesign project – once a better programming option has been selected,
it is crucially important to re-check the impacts of the new approach on the dividers and connectors.
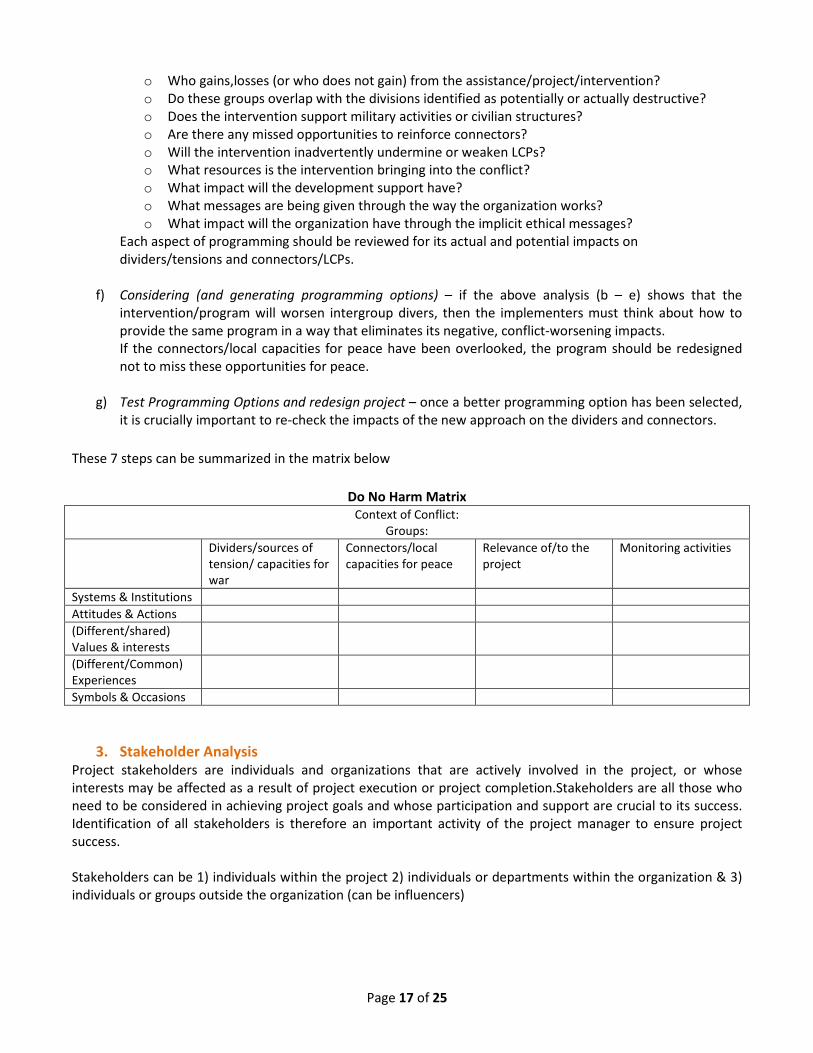
These 7 steps can be summarized in the matrix below
Do No Harm Matrix
Context of Conflict:
Groups:
Dividers/sources of
tension/ capacities for
war
Connectors/local
capacities for peace
Relevance of/to the
project
Monitoring activities
Systems & Institutions
Attitudes & Actions
(Different/shared)
Values & interests
(Different/Common)
Experiences
Symbols & Occasions
3. Stakeholder Analysis Project stakeholders are individuals and organizations that are actively involved in the project, or whose
interests may be affected as a result of project execution or project completion.Stakeholders are all those who
need to be considered in achieving project goals and whose participation and support are crucial to its success.
Identification of all stakeholders is therefore an important activity of the project manager to ensure project
success.
Stakeholders can be 1) individuals within the project 2) individuals or departments within the organization & 3)
individuals or groups outside the organization (can be influencers)
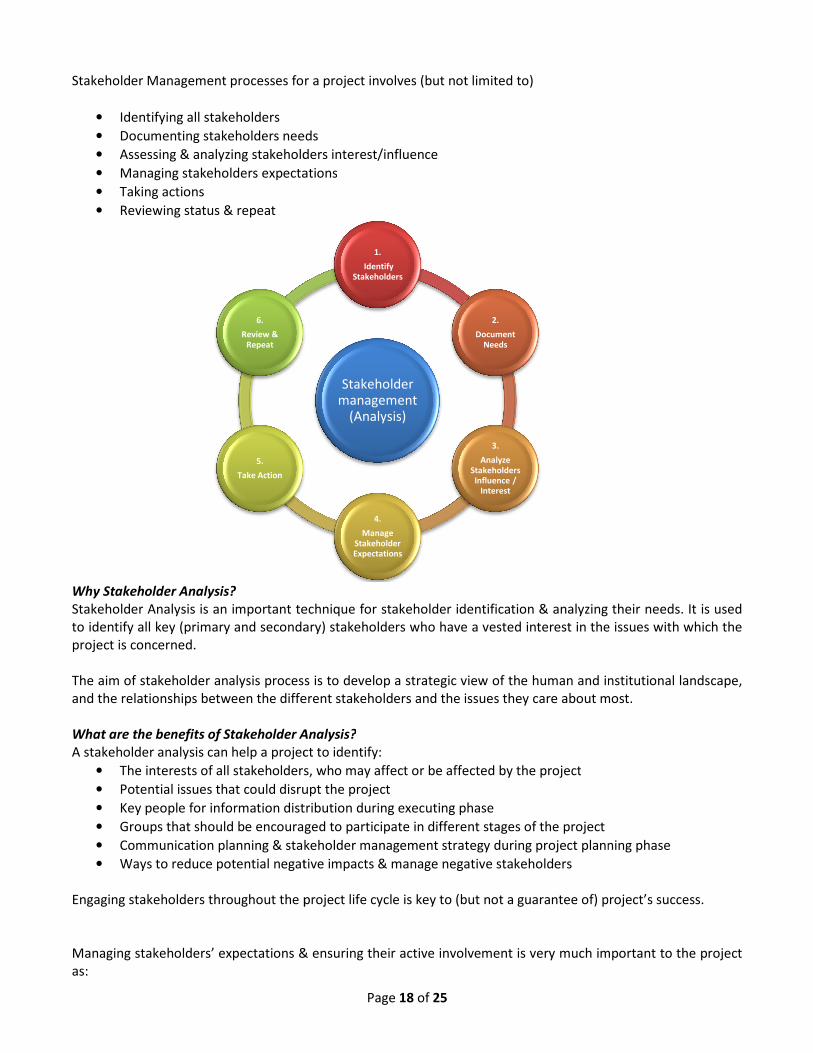
Stakeholder Management processes for a
• Identifying all stakeholders
• Documenting stakeholders needs
• Assessing & analyzing stakeholders interest/influence
• Managing stakeholders expectations
• Taking actions
• Reviewing status & repeat
Why Stakeholder Analysis?
Stakeholder Analysis is an important technique for stakeholder identification & analyzing their needs. It is used
to identify all key (primary and secondary) stakeholders who have a vested interest in the issues with which the
project is concerned.
The aim of stakeholder analysis process is to develop a strategic view of the human and institutional landscape,
and the relationships between the different stakeholders and the issues they care about most.
What are the benefits of Stakeholder Analysis?
A stakeholder analysis can help a project to identify:
• The interests of all stakeholders, who may affect or be affected by the project
• Potential issues that could disrupt the project
• Key people for information distribution during executing phase
• Groups that should be encouraged to participate in different stages of the project
• Communication planning & stakeholder management strategy during project planning phase
• Ways to reduce potential negative impacts & manage negative stakeholders
Engaging stakeholders throughout the project life cycle is key to (but not a guarantee of) project’s success.
Managing stakeholders’ expectations & ensuring their active involvement is very much important to
as:
5.
Take Action
6.
Review & Repeat
Page 18 of 25
Stakeholder Management processes for a project involves (but not limited to)
Documenting stakeholders needs
Assessing & analyzing stakeholders interest/influence
Managing stakeholders expectations
Stakeholder Analysis is an important technique for stakeholder identification & analyzing their needs. It is used
to identify all key (primary and secondary) stakeholders who have a vested interest in the issues with which the
im of stakeholder analysis process is to develop a strategic view of the human and institutional landscape,
and the relationships between the different stakeholders and the issues they care about most.
What are the benefits of Stakeholder Analysis?
eholder analysis can help a project to identify:
The interests of all stakeholders, who may affect or be affected by the project
Potential issues that could disrupt the project
Key people for information distribution during executing phase
ld be encouraged to participate in different stages of the project
Communication planning & stakeholder management strategy during project planning phase
Ways to reduce potential negative impacts & manage negative stakeholders
throughout the project life cycle is key to (but not a guarantee of) project’s success.
expectations & ensuring their active involvement is very much important to
Stakeholder management
(Analysis)
1.
IdentifyStakeholders
2.
Document Needs
3.
Analyze Stakeholders Influence /
Interest
4.
Manage Stakeholder Expectations
Stakeholder Analysis is an important technique for stakeholder identification & analyzing their needs. It is used
to identify all key (primary and secondary) stakeholders who have a vested interest in the issues with which the
im of stakeholder analysis process is to develop a strategic view of the human and institutional landscape,
and the relationships between the different stakeholders and the issues they care about most.
Communication planning & stakeholder management strategy during project planning phase
throughout the project life cycle is key to (but not a guarantee of) project’s success.
expectations & ensuring their active involvement is very much important to the project

Page 19 of 25
• It is indispensable for continuation of the project & its successful completion
• It gives opportunity to individuals or groups to express their ideas/issues/concerns over the project
• It gives a sense of accountability and enhances responsibility
• It enables effective risk identification & response planning
• It opens up excellent learning opportunity for both the project team and stakeholders
The analysis can be summarized in the matrix below:
Stakeholder Analysis Matrix Actors /Groups in
the community
Characteristics of
the group
(members, social
background,
cultural
background)
Status of the group
(formal or informal)
Interests, motives
attitudes and/or
needs related to
project
Group potentials
(strengths &
weaknesses)
Key process
influencing access
to livelihood assets
(implications to the
project)
4. Causal Loop Analysis& Systems Analysis
Causal Loop Analysis This is a continuation of the problem tree analysis discussed above. It involves identifying the likely causes of
problems, and is best depicted using cause and effect diagrams, which helps one to thoroughly think through
the causes of problems. Cause and Effect Diagrams are also known as Fishbone Diagrams because a completed
diagram can look like the skeleton of a fish; and as Ishikawa Diagrams, after Professor Kaoru Ishikawa, a pioneer
of quality management, who devised them in the 1960s.
Their major benefit is that they push one to consider all possible causes of the problem, rather than just the
ones that are most obvious. The approach combines brainstorming with use of a type of concept map.
How to Use the Tool
Follow these steps to solve a problem with a Cause and Effect Diagram:
a) Identify the problem: Write down the exact problem you face in detail. Where appropriate identify who
is involved, what the problem is, and when and where it occurs. Write the problem in a box on the left
hand side of a large sheet of paper. Draw a line across the paper horizontally from the box. This
arrangement, looking like the head and spine of a fish, gives you space to develop ideas.
b) Work out the major factors involved: Next identify the factors that may contribute to the problem. Draw
lines off the spine for each factor, and label it. These may be people involved with the problem, systems,
equipment, materials, external forces, etc. Try to draw out as many possible factors as possible. If you
are trying to solve the problem as part of a group, then this may be a good time for some brainstorming.
Using the 'Fish bone' analogy, the factors you find can be thought of as the bones of the fish.
c) Identify possible causes: For each of the factors you considered in stage 2, brainstorm possible causes of
the problem that may be related to the factor. Show these as smaller lines coming off the 'bones' of the
fish. Where a cause is large or complex, then it may be best to break it down into sub-causes. Show
these as lines coming off each cause line.
d) Analyze your diagram: By this stage you should have a diagram showing all the possible causes of your
problem. Depending on the complexity and importance of the problem, you can now investigate the
most likely causes further. This may involve setting up investigations, carrying out surveys, etc. These
will be designed to test whether your assessments are correct.
Page 20 of 25
Systems Analysis Closely interrelated with causal loop analysis is the systems analysis. This is a step further in the analysis that
looks at the entire system in the community because in nature and human behavior everything is connected to
everything else in a complex web of interactions. Consequently, in systems analysis, it is important to isolate the
issues of interest or what we want to observe and confine systems.
What is a system? A system is anetwork of multi variables that are connected to each other through causal
relationship and has certain behaviors, which we only can characterize through observation as a whole or simply
put it is a collection of people and/or parts which interact with each other to function as a whole. The principal
attribute of a system is that we can only understand its behavior by viewing it as a whole.
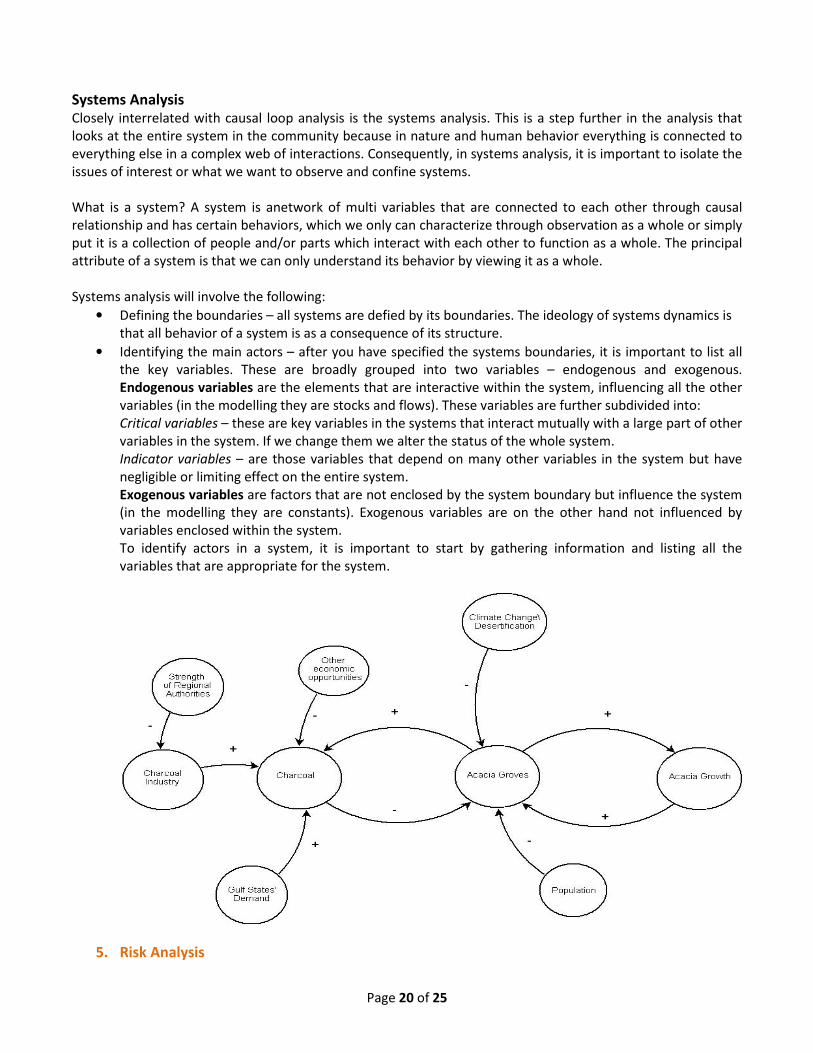
Systems analysis will involve the following:
• Defining the boundaries – all systems are defied by its boundaries. The ideology of systems dynamics is
that all behavior of a system is as a consequence of its structure.
• Identifying the main actors – after you have specified the systems boundaries, it is important to list all
the key variables. These are broadly grouped into two variables – endogenous and exogenous.
Endogenous variables are the elements that are interactive within the system, influencing all the other
variables (in the modelling they are stocks and flows). These variables are further subdivided into:
Critical variables – these are key variables in the systems that interact mutually with a large part of other
variables in the system. If we change them we alter the status of the whole system.
Indicator variables – are those variables that depend on many other variables in the system but have
negligible or limiting effect on the entire system.
Exogenous variables are factors that are not enclosed by the system boundary but influence the system
(in the modelling they are constants). Exogenous variables are on the other hand not influenced by
variables enclosed within the system.
To identify actors in a system, it is important to start by gathering information and listing all the
variables that are appropriate for the system.
5. Risk Analysis
Page 21 of 25
This is a continuation of the hazard analysis conducted at the field level. Risk, is the estimated impact that a
hazard would have on people, services, facilities, and structures in the community or the likelihood of a hazard
resulting in an adverse condition that causes injury or damage. In simpler terms, risk is defined as the probability
of a threat/hazard being exacerbated by vulnerability (i.e. Risk = Threat (hazard)x Vulnerability).
A hazard is a source of potential danger or adverse conditions. Hazard identification determines the areas of
your community that are affected by disasters, the likelihood of a disaster occurring, and how intense the
disaster might be. Vulnerability is the exposure of to risk as a result of people’s class, gender, ethnicity, age or
other factors.
Risk Analysis is important to enable identification of threats (or 'hazards') facing a community and implications
for resilience programming, especially for vulnerable communities prone to natural or human-made disasters.At
this level, it is imperative to involve the community in identifying their various risks prior to undertaking the
analysis at implementation level. This is important because it will enable the implementers to create
community-based disaster risk mitigation (CBDRM) approach. The aim of CBDRM is to build people’s capacity of
coping with disaster risks and reducing their vulnerability thereby developing safer and more resilient
communities. CBDRM is defined as a process in which at-risk communities are actively engaged in the
identification, analysis, treatment, monitoring and evaluation of disaster risks in order to reduce their
vulnerabilities and enhance their capacities. Engaging in the CBDRM process prior to the desk analysis will help
in the overall PRA process (data collection, analysis, and program design) because it highlights the inherent risks
and the role the community will play and tie this to the early warning system. Ultimately, this will help program
implementers to determine what is needed to reduce the risks and thereby build their resilient capacities.
Risk analysis should consider 3 elements:
• Hazard analysis –this involves understanding what hazards exist in the community, the likelihood of
them occurring, their likely intensity, and their effect. This is partly done with the communities during
the PRA Data collection and is further enhanced during the desk analysis.
• Vulnerability Assessment – this understands who or what is vulnerable to the hazards.
• Capacity assessment – involves understanding what capacities exist within the community to reduce the
vulnerabilities identified.
Risk assessment consequently seeks to answer the question: What would happen if a hazard occurred in your
community, country or region? A risk assessment therefore informs:
• The hazards to which the community is most susceptible;
• What hazards can do to physical, social and economic assets;
• Which areas are most vulnerable to damage from these hazards;
• The resulting cost of damages or costs avoided through future mitigation projects.
The simple steps in conducting a Risk Assessment involve:
1. Describe the hazards
2. Identify community assets
3. Analyze risks
4. Summarize vulnerability
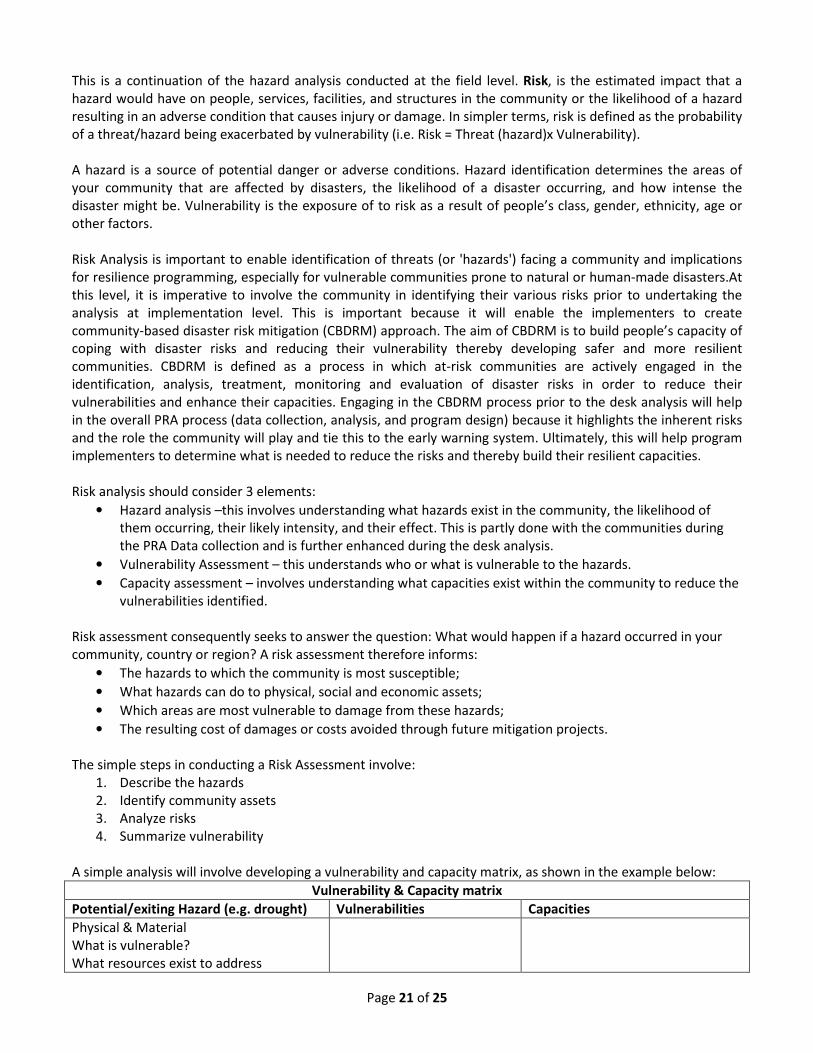
A simple analysis will involve developing a vulnerability and capacity matrix, as shown in the example below:
Vulnerability & Capacity matrix
Potential/exiting Hazard (e.g. drought) Vulnerabilities Capacities
Physical & Material
What is vulnerable?
What resources exist to address

Page 22 of 25
vulnerabilities
Social & Organization
Who is vulnerable?
What resources exist to make them less
so?
Motivation & Attitude
What attitudes lead to vulnerability?
What capacities exist to improve the
situation?
Potential/existing hazard (indicate)
Source: http://www.communityplanning.net/methods/risk_assessment.php
6. Asset Risk Analysis
Closely related to the risk analysis is the asset risk analysis, which analyses the risks the community’s assets are
exposed to. In the SomReP Program, the analysis is done based on the specific livelihood zones targeted in the
program i.e. agro-pastoral, pastoral and peri-urban livelihood zones.
Sources of Info: Risk mapping, asset and livelihood matrixes. Think in terms of adaptive absorptive and
transformative
Livelihood Group
(pastor/agro/peri)
Livelihood
target Group
(e.g. low
market, low
asset
explain assets
specifics)
Risk effecting
means of
existence
Cause (reason
for the risk )
Negative Coping
strategies
Existing
capacities (HH or
community level)
to support asset
during risks
(Positive coping
strategies can be
put here also)
Agro Pastoral
Pastoral
Peri-urban
Consolidation of Analysis by district Gaps/weakness in the system to be addressed (comes from all the above activities and problem analysis, if Risk
has a negative effect (the cause (3 above) is also a weakness here). Also note many different groups may suffer
the same weakness but we need to name them all.
Weakness
Risk Weakness
Specific
group
within
Livelihood
group
identified
Asset
group
(Matrix)
Impact Secondary
impact
Severity of
impact
L,M,H
Length of
Impact
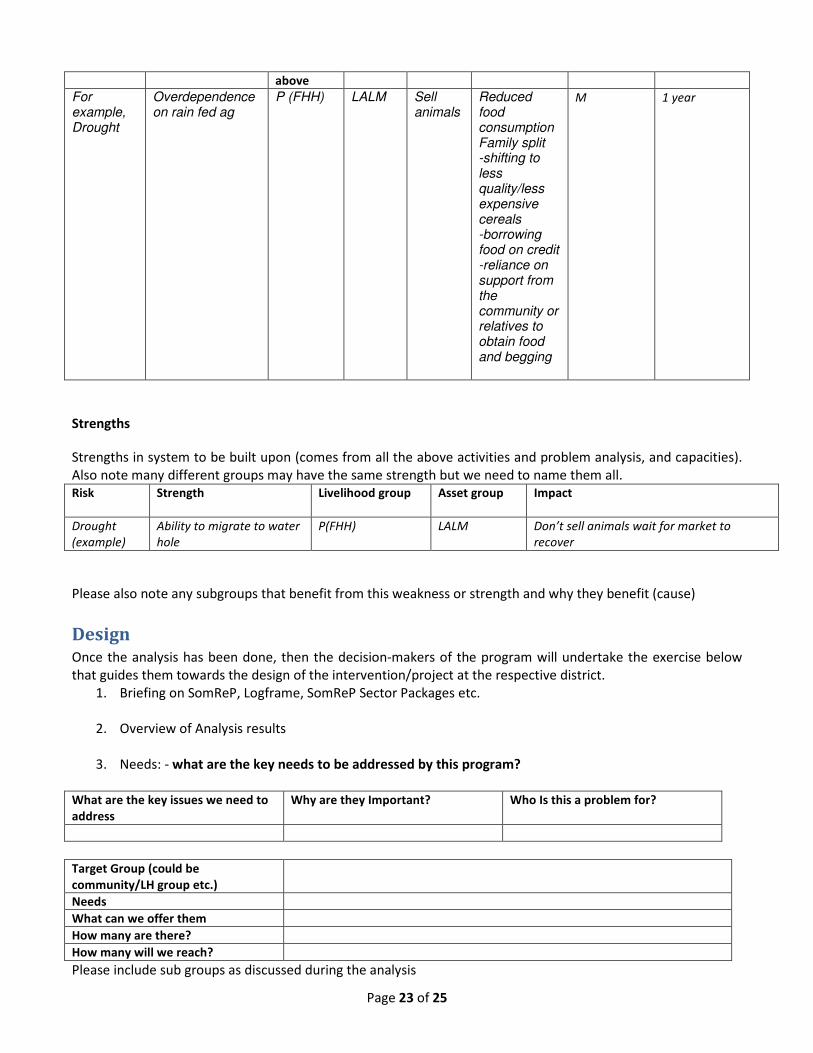
Page 23 of 25
above
For example, Drought
Overdependence on rain fed ag
P (FHH) LALM Sell animals
Reduced food consumption Family split -shifting to less quality/less expensive cereals -borrowing food on credit -reliance on support from the community or relatives to obtain food and begging
M 1 year
Strengths
Strengths in system to be built upon (comes from all the above activities and problem analysis, and capacities).
Also note many different groups may have the same strength but we need to name them all.
Risk Strength
Livelihood group Asset group Impact
Drought
(example)
Ability to migrate to water
hole
P(FHH) LALM Don’t sell animals wait for market to
recover
Please also note any subgroups that benefit from this weakness or strength and why they benefit (cause)
Design Once the analysis has been done, then the decision-makers of the program will undertake the exercise below
that guides them towards the design of the intervention/project at the respective district.
1. Briefing on SomReP, Logframe, SomReP Sector Packages etc.
2. Overview of Analysis results
3. Needs: - what are the key needs to be addressed by this program?
What are the key issues we need to
address
Why are they Important? Who Is this a problem for?
Target Group (could be
community/LH group etc.)
Needs
What can we offer them
How many are there?
How many will we reach?
Please include sub groups as discussed during the analysis

Page 24 of 25
1. Strengths What strengths can be built upon? Why are they Important? Who Is this useful for?
Target Group: (could be
community/liv group etc.)
What can we offer them
How many are there?
How many will we reach?
Please include sub groups as discussed during the analysis
2. Prioritise activities
Using the activity list excel sheet for each target group list the appropriate activities-prioritise as per guiding
criteria
Please also prioritise according to what needs to happen first Year 1, Year 2 etc.
Decision Criteria: (these can be weighed if needed)
1) Priorities and needs of beneficiaries
2) Expertise and experience of implementing partner-
3) Likelihood of success-
4) Duration of implementation-
5) Sustainability
6) Mandate of implementing partner
7) Donor policy
8) Gender and social diversity aspects
3. Link to Packages(before or after up to the facilitator)
4. Stakeholder analysis: “if we implement a response, who are stakeholders and how do
they relate to us?”
5. SWOR analysis: “if we implement this project what are the internal and external factors
to consider?”
Strengths Weakness Opportunity Risk
6. Design Work plan as per attached work plan excel sheet
7. PRA Data Analysis Report Template
SomRep PRA Analysis Reporting Template_draft zero.docx