Embed Size (px)
Citation preview
Some Motivating Facts
Nelson Mark
University of Notre Dame and NBER
Asset Pricing Course
(Mark) Some Motivating Facts January 16, 2018 1 / 10
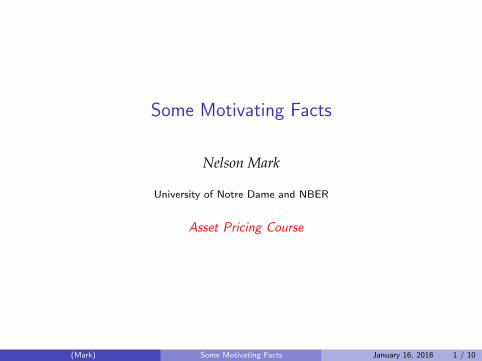
Equity and T-Bill Cumulated Returns
(Mark) Some Motivating Facts January 16, 2018 2 / 10
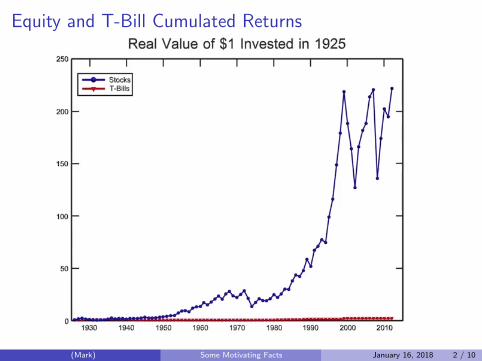
Equity and T-Bill Cumulated Returns in logs
(Mark) Some Motivating Facts January 16, 2018 3 / 10

Equity and T-Bill Annual Returns
(Mark) Some Motivating Facts January 16, 2018 4 / 10
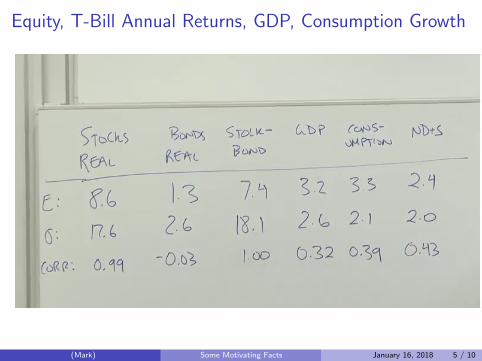
Equity, T-Bill Annual Returns, GDP, Consumption Growth
(Mark) Some Motivating Facts January 16, 2018 5 / 10
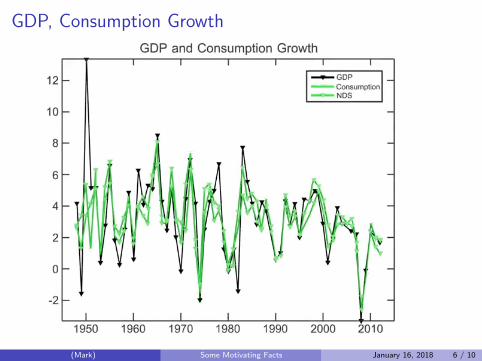
GDP, Consumption Growth
(Mark) Some Motivating Facts January 16, 2018 6 / 10
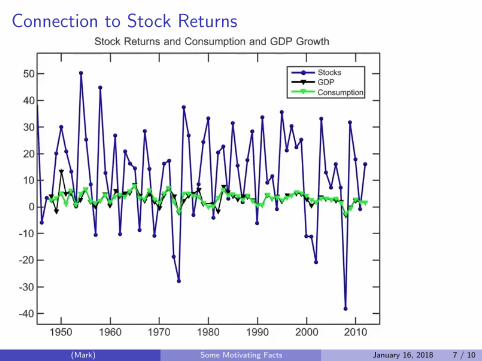
Connection to Stock Returns
(Mark) Some Motivating Facts January 16, 2018 7 / 10
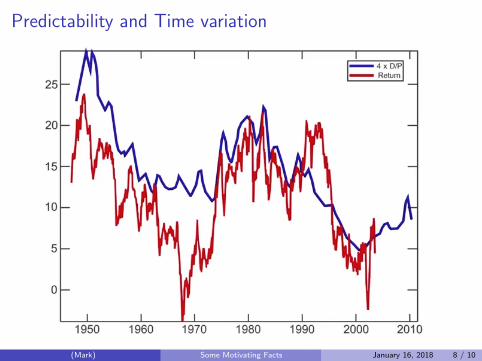
Predictability and Time variation
(Mark) Some Motivating Facts January 16, 2018 8 / 10
Carry Trade
! BBD US Equity: This is Baker, Bloom, and Davis’s index built from analyses of news articles containing terms related to USequity market uncertainty. Starting in January 1985, they tally searches of terms such as ‘uncertainty’ or ‘uncertain,’ ‘eco-nomic’ or ‘economy,’ and ‘equity market,’ ‘equity price,’ ‘stock market,’ or ‘stock price.’ They only do this for the US. Thisindex was downloaded from their website, http://www.policyuncertainty.com/index.html.
! CI GeoPol: This is a global index of geopolitical risk proposed by Caldara and Iacoviello (2016). They draw on the Baker,Bloom, and Davis newspaper analysis by counting occurrence of words related to geopolitical tensions in leading news-papers to create a monthly index of geopolitical risk. Their index spikes around events such as the Gulf War, 9/11, the2003 Iraq invasion, the 2014 Russia-Ukraine crisis, and the Paris terrorist attacks. Their index is found to lead declinesin real activity, moves with the VIX and corporate credit spreads, and moves inversely with oil prices.
! HRS MPU: This is a news-based monetary policy uncertainty index for the US proposed by Husted et al. (forthcoming).They construct their index using the newspaper approach similar to Baker, Bloom, and Davis, but with a focus on US mon-etary policy. Their index begins in 1985.
4.2. Econometric measures
The next set of uncertainty indices are based on econometric analyses of macroeconomic time-series data and analyses ofprofessional forecasts.
! JLD Macro and JLD Fin: These are the macroeconomic uncertainty and financial market uncertainty indices for the US,proposed and analyzed by Jurado et al. (2015). They begin by computing individual uncertainty, which is the conditionalvolatility of the forecasting error of an individual macroeconomic or financial time series. They compute them at 1-, 3-,and 12-month ahead forecast-error horizons. The macro uncertainty index is an aggregate of the individual macro
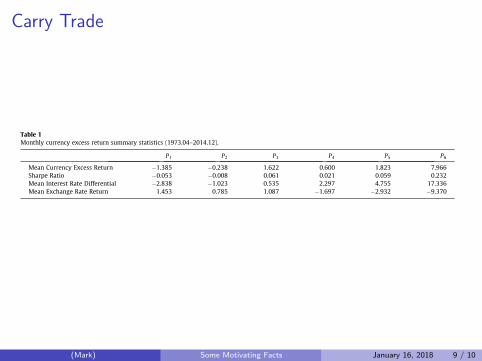
Table 1Monthly currency excess return summary statistics (1973.04–2014.12).
P1 P2 P3 P4 P5 P6
Mean Currency Excess Return "1.385 "0.238 1.622 0.600 1.823 7.966Sharpe Ratio "0.053 "0.008 0.061 0.021 0.059 0.232Mean Interest Rate Differential "2.838 "1.023 0.535 2.297 4.755 17.336Mean Exchange Rate Return 1.453 0.785 1.087 "1.697 "2.932 "9.370
Notes: To form the portfolio returns, we sort by the nominal interest rate for each country from low to high. The rank ordering is divided into six categories,into which the currency returns are assigned. P6 is the portfolio of returns associated with the highest interest rate quantile and P1 is the portfolio of returnsassociated with the lowest interest rate quantile. The excess returns are the mean of the USD returns in each category minus the US nominal interest rateand are stated in percent per annum. These are log-approximated excess returns and exchange rate returns. The mean currency excess return is
repi ¼ 1TPT
t¼1repi;t . The mean interest rate differential is 1
TPT
t¼1 rPjt " r0;t! "
, where rPjt $ 1nj;t
Pi2Pj rj;t . The mean exchange rate return is
1TPT
t¼11ni;t
Pj2Pi
D lnðSj;tþ1Þ! "
and is positive when the dollar falls in value.
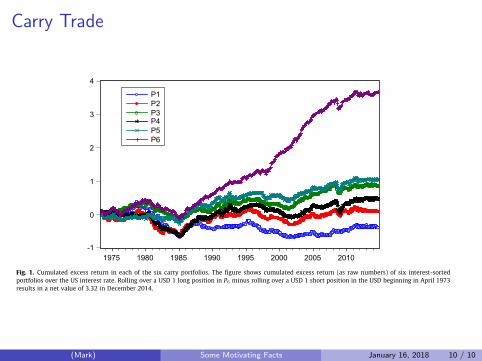
Fig. 1. Cumulated excess return in each of the six carry portfolios. The figure shows cumulated excess return (as raw numbers) of six interest-sortedportfolios over the US interest rate. Rolling over a USD 1 long position in P6 minus rolling over a USD 1 short position in the USD beginning in April 1973results in a net value of 3.32 in December 2014.
K.A. Berg, N.C. Mark / Journal of International Money and Finance xxx (2017) xxx–xxx 5
Please cite this article in press as: Berg, K.A., Mark, N.C. Measures of global uncertainty and carry-trade excess returns. J. Int. Money Fin.(2017), http://dx.doi.org/10.1016/j.jimonfin.2017.07.010
(Mark) Some Motivating Facts January 16, 2018 9 / 10
Carry Trade
! BBD US Equity: This is Baker, Bloom, and Davis’s index built from analyses of news articles containing terms related to USequity market uncertainty. Starting in January 1985, they tally searches of terms such as ‘uncertainty’ or ‘uncertain,’ ‘eco-nomic’ or ‘economy,’ and ‘equity market,’ ‘equity price,’ ‘stock market,’ or ‘stock price.’ They only do this for the US. Thisindex was downloaded from their website, http://www.policyuncertainty.com/index.html.
! CI GeoPol: This is a global index of geopolitical risk proposed by Caldara and Iacoviello (2016). They draw on the Baker,Bloom, and Davis newspaper analysis by counting occurrence of words related to geopolitical tensions in leading news-papers to create a monthly index of geopolitical risk. Their index spikes around events such as the Gulf War, 9/11, the2003 Iraq invasion, the 2014 Russia-Ukraine crisis, and the Paris terrorist attacks. Their index is found to lead declinesin real activity, moves with the VIX and corporate credit spreads, and moves inversely with oil prices.
! HRS MPU: This is a news-based monetary policy uncertainty index for the US proposed by Husted et al. (forthcoming).They construct their index using the newspaper approach similar to Baker, Bloom, and Davis, but with a focus on US mon-etary policy. Their index begins in 1985.
4.2. Econometric measures
The next set of uncertainty indices are based on econometric analyses of macroeconomic time-series data and analyses ofprofessional forecasts.
! JLD Macro and JLD Fin: These are the macroeconomic uncertainty and financial market uncertainty indices for the US,proposed and analyzed by Jurado et al. (2015). They begin by computing individual uncertainty, which is the conditionalvolatility of the forecasting error of an individual macroeconomic or financial time series. They compute them at 1-, 3-,and 12-month ahead forecast-error horizons. The macro uncertainty index is an aggregate of the individual macro
Table 1Monthly currency excess return summary statistics (1973.04–2014.12).
P1 P2 P3 P4 P5 P6
Mean Currency Excess Return "1.385 "0.238 1.622 0.600 1.823 7.966Sharpe Ratio "0.053 "0.008 0.061 0.021 0.059 0.232Mean Interest Rate Differential "2.838 "1.023 0.535 2.297 4.755 17.336Mean Exchange Rate Return 1.453 0.785 1.087 "1.697 "2.932 "9.370
Notes: To form the portfolio returns, we sort by the nominal interest rate for each country from low to high. The rank ordering is divided into six categories,into which the currency returns are assigned. P6 is the portfolio of returns associated with the highest interest rate quantile and P1 is the portfolio of returnsassociated with the lowest interest rate quantile. The excess returns are the mean of the USD returns in each category minus the US nominal interest rateand are stated in percent per annum. These are log-approximated excess returns and exchange rate returns. The mean currency excess return is
repi ¼ 1TPT
t¼1repi;t . The mean interest rate differential is 1
TPT
t¼1 rPjt " r0;t! "
, where rPjt $ 1nj;t
Pi2Pj rj;t . The mean exchange rate return is
1TPT
t¼11ni;t
Pj2Pi
D lnðSj;tþ1Þ! "
and is positive when the dollar falls in value.
Fig. 1. Cumulated excess return in each of the six carry portfolios. The figure shows cumulated excess return (as raw numbers) of six interest-sortedportfolios over the US interest rate. Rolling over a USD 1 long position in P6 minus rolling over a USD 1 short position in the USD beginning in April 1973results in a net value of 3.32 in December 2014.
K.A. Berg, N.C. Mark / Journal of International Money and Finance xxx (2017) xxx–xxx 5
Please cite this article in press as: Berg, K.A., Mark, N.C. Measures of global uncertainty and carry-trade excess returns. J. Int. Money Fin.(2017), http://dx.doi.org/10.1016/j.jimonfin.2017.07.010
(Mark) Some Motivating Facts January 16, 2018 10 / 10