Embed Size (px)
Citation preview


Welcometwo groups: Enterprise and SMB. In addition, we expanded the “Challenges”
section of our survey to look at issues beyond the scope of monitoring alone –
providing insight into just how vast concerns surrounding security, downtime,
and efficient staffing are for leaders in the IT community.
Without a doubt, one thing that this year’s survey confirmed is that nothing is
slowing down. Code and infrastructure are being deployed and commissioned
at a faster and faster rate, the number of tools it takes to effectively manage
these services is multiplying, and the expectations placed on IT leaders to
ensure customer satisfaction is increasing. The urgency to ensure reliability and
uptime resonates across the board, and it’s clear that IT leaders are focused on
solutions that will not only work today, but can scale and adapt to tomorrow.
To learn more about the insights, the challenges, and the outlook shared by
over 1500 of your peers, read on! And as always, we invite you to join the
conversation: Tweet us your thoughts and feedback with the hashtag
#StateOfMonitoring.
Last year, we kicked off the first-ever State of Monitoring survey with a clear
goal: to shine a light on the world of IT monitoring and understand how shifts in
this rapidly-changing landscape are affecting organizations and posing new
challenges for IT.
The original goal was to collect about 500-600 responses – but to our delight,
over 1500 IT pros responded in the span of a week. We were overwhelmed by
the response. The results allowed us to produce a report that, for the first time,
honed in on topics unique to the world of monitoring, such as: What tools are
most popular? What are the key monitoring challenges facing IT teams? How do
alert storms affect IT performance? And which KPIs are organizations most
commonly using to measure IT performance?
This year, we’re excited to bring back State of Monitoring for a second time –
offering all new insights into a world that continues to evolve, fragment, and
pose new challenges for IT professionals. In this year’s report, you will note
many similarities. For example, once again over 1500 IT pros responded to our
call for participants. Also, many of the themes that we examine in the report are
similar to last year, such as top monitoring challenges, the effect of alerts on IT
performance, key performance KPIs, and the effects of agile development on IT
operations.
However, in contrast to last year, we decided to do a couple of things differently:
first of all, we recognized that the needs of enterprise organizations are
inherently distinct from that of SMBs. So we decided to divide our rankings of
the industry’s most popular monitoring and ticketing/collaboration tools into
Happy monitoring,Team Panda

The respondents 101
The monitoring stack 402
Age of agile 703
Concerns and challenges 1004
Effect of alerts on IT performance 1305
Monitoring strategy: Satisfaction and performance 1606
Customer experience is king 1907
Your biggest monitoring challenge of 2017? 2108
If you could make one change to your monitoring strategy… 2309
Key takeaways 2510
Table of Contents

The respondents
State Of Monitoring | 1
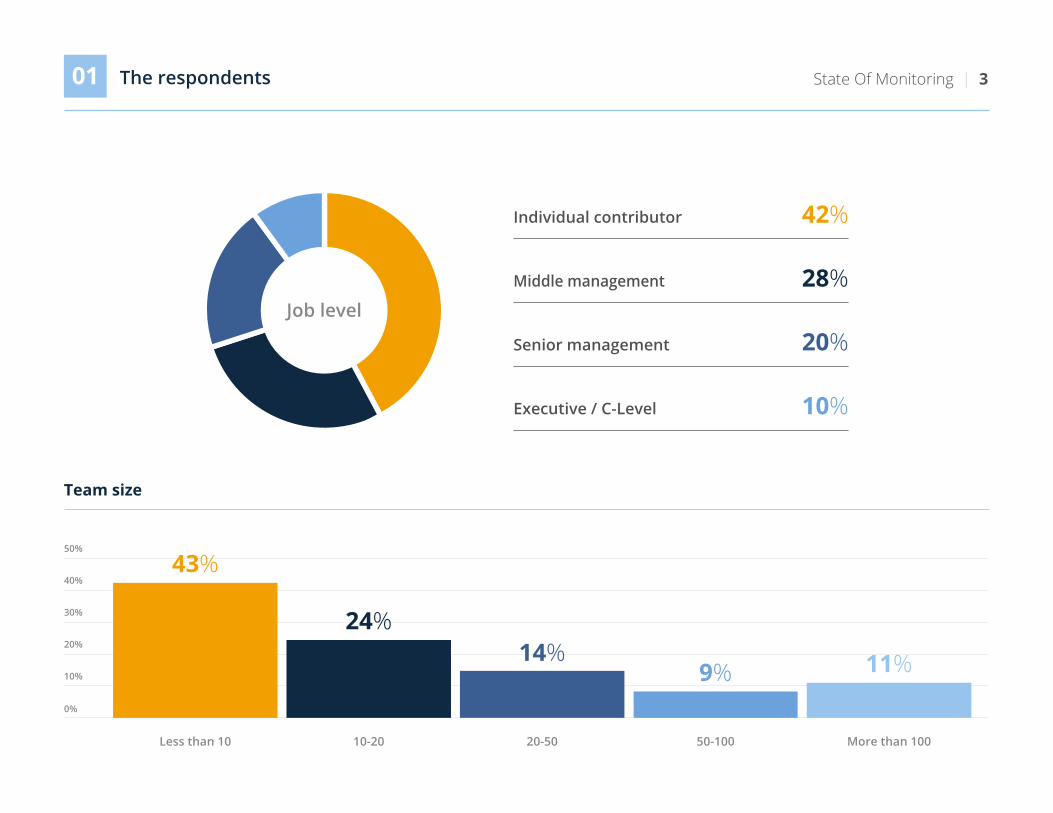
Over 1500 IT professionals participated in this year’s survey. While the respondents
represented a wide range of industries, company size skewed large, with the majority
coming from companies with 1000 or more employees. Interestingly, team size
demonstrated the opposite trend, with most respondents reporting a team of less than ten.
This may signal that operational independence at larger enterprises is migrating away from
a centralized IT, with a larger number of smaller, fragmented teams – or that there is
increasing pressure on IT to expand their capacity, without increasing headcount. In other
words, to do more with less.
01

1500+ IT professionals
The respondents State Of Monitoring | 201
1
2
3
4
5
Telecomm, Tech, Internet & Electronics
Healthcare & Pharmaceuticals
Manufacturing
Finance & Financial Services
Education
Top industries
10000+
Average company size
1–50
51–200
201–1000
1001–10000 32%
20%
23%
12%
13%
Less than 10 10-20 20-50 50-100 More than 100
0%
10%
20%
30%
40%
50%
Individual contributor
Middle management
Senior management
Executive / C-Level 10%
20%
42%
28%Job level
Team size
43%
24%14%
9% 11%
The respondents State Of Monitoring | 301

The monitoring stack
State Of Monitoring | 4
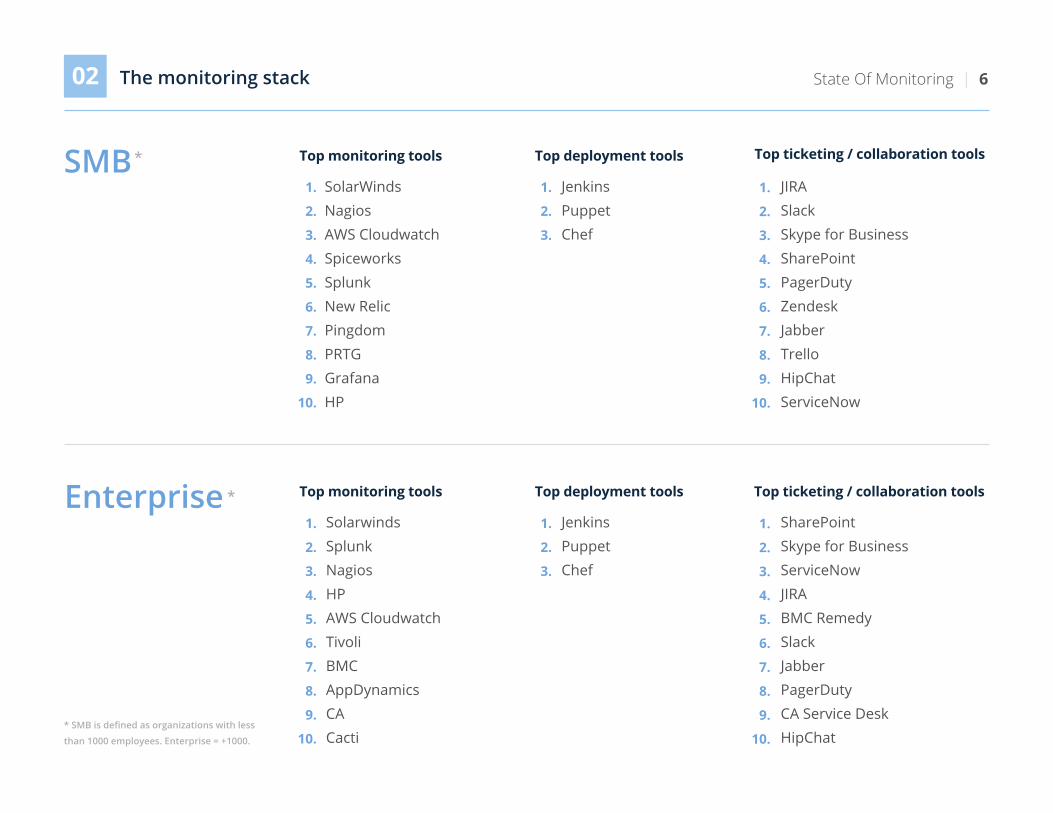
The results of this year’s survey confirm just how complex and diverse the modern IT stack
has become. Keeping in mind that the numbers reported here are representative of each
respondent’s personal use, it can be inferred that the total number of tools deployed within
an entire LOB or organization would be much higher. Not only did each individual
respondent report using an average of 6-7 tools on a regular basis, over half stated that they
are considering to further expand their stack in the coming year, reflecting the vast
proliferation that exists in the number of tools required to effectively maintain and support
IT applications and infrastructure.
02

are planning to expand their monitoring
stack in 2017 – by an average of
2 additional tools.
82%
53%
33%27%
Internal applications
Other customerfacing applications
E-commerceapplications
Mobile applications
0%
10%
20%
30%
40%
50%
60%
70%
80%
90%
100%
The average IT team member uses:
tools on a regular basis
6-7
monitoring tools
3-4
deployment solution
+1
ticketing / collaboration tools
+2
and 29% use at least one in-house proprietary solution.
The monitoring stack State Of Monitoring | 502
Top services monitored
54%
Enterprise
SMB Top monitoring tools
SolarWindsNagiosAWS CloudwatchSpiceworksSplunkNew RelicPingdomPRTGGrafanaHP
JenkinsPuppetChef
JIRASlackSkype for BusinessSharePointPagerDutyZendeskJabberTrelloHipChatServiceNow
Top deployment tools Top ticketing / collaboration tools
Top monitoring tools
SolarwindsSplunkNagiosHPAWS CloudwatchTivoliBMCAppDynamicsCACacti
JenkinsPuppetChef
SharePointSkype for BusinessServiceNowJIRABMC RemedySlackJabberPagerDutyCA Service DeskHipChat
Top deployment tools Top ticketing / collaboration tools
The monitoring stack State Of Monitoring | 602
* SMB is defined as organizations with less
than 1000 employees. Enterprise = +1000.
1.
2.
3.
4.
5.
6.
7.
8.
9.
10.
1.
2.
3.
1.
2.
3.
4.
5.
6.
7.
8.
9.
10.
1.
2.
3.
4.
5.
6.
7.
8.
9.
10.
1.
2.
3.
1.
2.
3.
4.
5.
6.
7.
8.
9.
10.
Age of agile
State Of Monitoring | 7
Not only are IT teams dealing with more tools than ever before, but they’re also having to
manage more moving parts – which are evolving and churning out data at an
unprecedented rate. This year’s survey noted a distinct shift in the frequency of both code
and infrastructure change, in addition to an increased adoption of DevOps practices and
monitoring as code. All of these signals point to a widespread cultural shift in the way that IT
operations and engineering teams are supporting the goals of agile development. Agile is no
longer a novelty of startups or software companies. All organizations, regardless of their size
or industry, recognize that agility is mission critical to remaining competitive and relevant –
and as such, the assurance of delivering new features with both speed and reliability are
increasingly becoming a shared responsibility between Dev and Ops.
03

of respondents consider their organization
to be agile.
state that developers at their organization
build monitoring into their code, a 3%
increase versus 2016.
of respondents report that their organization
employs DevOps, up 4% over last year. At
enterprise organizations (1000+ employees),
adoption is up 8%.
Age of agile State Of Monitoring | 803
54%
45%
39%

More thanonce per hour
A few timesper day
A few timesper week
A few timesper month
A few timesper Year
More thanonce per hour
A few timesper day
A few timesper week
A few timesper month
A few timesper Year
Frequency of infrastructure changes
More change. More frequently.
Across the board, the frequency of code and infrastructure change is on the rise. Between 2016 and 2017,
the number of respondents reporting daily or weekly code deployments increased, while monthly and
yearly deployments declined. Similarly for infrastructure management, the number of respondents who
reported that their organization makes just a few changes per year sharply declined, while all other
response groups increased.
0%
10%
20%
30%
40%
0%
10%
20%
30%
40%
2016 2017 2016 2017
State Of Monitoring | 9
Frequency of code deployments
Age of agile03

Concerns and challenges
State Of Monitoring | 10
Like in 2016, we presented survey respondents with a list of common monitoring issues and
asked them to identify how challenging each is for their organization. However, this year we
expanded the scope of our inquiry to include a second section focusing on broader IT
concerns. In both categories, each of the top five concerns were shared by at least three
quarters of all survey participants – reaching upwards of 80%.
04

Top IT concerns for 2017 *
1
2 Suffering an outage or significant downtime
3 Successfully staffing and retaining qualified staff members
Resolving incidents in a timely manner
Delivering a product or business objective to schedule 4
5 75%
76%
82%
87%
84%
Based on the percentage of respondents who identified each statement
as a concern or challenge for their organization
Suffering a security breach
Concerns and challenges State Of Monitoring | 1104
*

Quickly remediating service disruptions
Securing budget for the proper monitoring tools
Reducing alert noise from the organization’s monitoring tools
Delivering a product or business objective to schedule
Quickly identifying service disruptions 75%
76%
78%
81%
79%
Based on the percentage of respondents who identified each statement
as a concern or challenge for their organization*
*
Concerns and challenges State Of Monitoring | 12
Top five monitoring challenges *
04
1
2
3
4
5

Effect of alerts on IT performance
State Of Monitoring | 13
Given the increasingly fragmented and agile nature of modern monitoring architectures, it is
perhaps unsurprising that alert noise has proven to be a persistent issue for IT teams. Over
three quarters of this year’s 1500+ respondents stated that reducing alert noise is a
challenge – and across the board, the number of IT practitioners reporting high alert
volumes (100+ per day) is on the rise. The fundamental issue is not that alert volumes are
increasing – that is expected – but that alert storms appear to have a substantial effect on
the ability of IT teams to effectively manage and remediate incidents, comply to customer
SLAs, and meet business objectives. With all leading indicators suggesting that alert volumes
are likely to continue their upwards trend, IT teams will be compelled to find a way to
separate signal from noise in order to effectively scale.
05

Among respondents that reported over 100 alerts
per day, only 26% are able to investigate and
remediate the majority (75-100%) within 24 hours.
of respondents state that reducing
alert noise is a challenge.
78%
+1%
+2%
+3%
100–500
500–1000
1000+
% of respondents
The number of respondents reporting high alert volumes are on the rise. All cohort groups above 100 alerts per day demonstrated an increase in comparison to 2016.
Effect of alerts on IT performance State Of Monitoring | 1405
2016 2017Average # daily alerts

Less than 50 50–100 100 –500 500 –1000 1000+
53%
23%13%
6% 5%0%
10%
20%
30%
40%
50%
60%
Teams that receive over100 alerts per day are...
more concerned about failing to comply to customer SLAs.
15%
more concerned about resolving incidents in a timely manner.
9%
more concerned about delivering business objectives to schedule.
7%
Satisfied with ability to respond to alerts
# of alerts per day
Across the board, respondents reported low satisfaction with their team’s
ability to respond to alerts. Even among those that receive less than 50 alerts
per day, only 53% were satisfied. This number sharply drops as the number
of daily alerts increases – to just 5% for organizations swamped in over 1000
alerts per day.
The struggle is real
Effect of alerts on IT performance State Of Monitoring | 1505

Monitoring strategy: Satisfaction and performance
State Of Monitoring | 16
Similar to 2016, this year’s survey findings reiterated the importance of a thoughtful and
strategic approach to monitoring. Respondents who report that their organization has a
defined monitoring process in place find alerts easier to handle and service disruptions
easier to mitigate. Plus, those who are satisfied with their monitoring strategy demonstrate
far better rates of remediation, in addition to a host of other benefits. But it’s important to
note that almost half of the 1500+ IT pros surveyed stated that their organization does not
have a defined monitoring process in place, and just a fraction claimed that they are very
satisfied with their current approach – a clear sign that IT teams have a long way to go when
it comes to effectively addressing the challenges of modern applications and infrastructure.
06

Those who do not have a defined process find it more
challenging to…
...versus those who do.
identify service disruptions
+15%
remediate service disruptions
+13%
learn from current disruptions to prevent future occurrences
+14%
Monitoring strategy: Satisfaction and performance State Of Monitoring | 1706
agree that a strategic monitoring process is
important to their organization, but only
13% are very satisfied with their existing
process. In addition, just 11% are very
satisfied with their monitoring strategy, based
on overall investment (e.g. tools, headcount).
of respondents report that their
organization has a defined monitoring
process in place. Of those, 75% are satisfied
with their ability to respond to alerts – versus
40% for those who do not have a defined
process.
85%
52%

Monitoring strategy: Satisfaction and performance State Of Monitoring | 1806
DissatisfiedSatisfied
Among those who consider their organization’s monitoring process to be strategic...
There is a clear correlation between monitoring strategy satisfaction and the ability to remediate. Among those who are satisfied, the majority of respondents fall into the best-performing cohort group (75-100% of alerts resolved in 24 hours). This trend flips among those who are dissatisfied, with most respondents reporting the worst rates of remediation (less than 25% resolved).
also have a process in place to identify the root cause of incidents.70%agree that developers are actively involved in supporting applications.60%
report that developers build monitoring into their code.73%consider their organization to be agile.65%
48%
30%37%
Less than 25% 25-50% 50-75% 75-100%
0%
10%
20%
30%
40%
50%
60%
22% 21%14%
7%
21%
Monitoring strategy satisfaction & Ability to remediate alerts
% of alerts resolved in 24 hours

Customer experience is king
State Of Monitoring | 19
Just as in 2016, customer satisfaction took the top spot as the leading performance KPI
reported among respondents – far outranking metrics that some might consider
“traditional” for IT practitioners, such as SLA compliance and MTTR. We believe the result is a
clear indicator of the crucial role that the digital customer experience plays, now more than
ever, as a competitive differentiator. Digital customers have come to expect consistent
uptime and lightning-quick response times as standard. The difference between “expected
customer experience” and “great customer experience” lies in factors such as usability,
personalization, cross-platform support, and customer service. As a result, we predict that
customer experience will increasingly become a C-level job.
07

Customer satisfaction
SLA compliance
Incident volume
MTTR
Other 6%
34%
43%
73%
46%
Top performance KPIs
Customer experience is king State Of Monitoring | 2007

Your biggest monitoring challenge of 2017?
State Of Monitoring | 2108
Like last year, we added two write-in sections to our survey to further clarify our
overall findings with qualitative insights. In the first, we asked respondents to
identify what they thought would be their biggest IT monitoring challenge of 2017.
The most prominent theme was purely to address and improve their
organization’s overall monitoring strategy, followed closely by the desire to
modernize the monitoring architecture, and to implement a solution to effectively
manage alerts.

Your biggest monitoring challenge of 2017? State Of Monitoring | 2208
Improving monitoring strategy
Modernizing monitoring architecture
Effectively managing alerts
Security
Budget
Cloud migration
Centralizing and consolidating monitoring tools
Scaling monitoring with growth
Improving root cause identification
Staffing qualified personnel
1.
2.
3.
4.
5.
6.
7.
8.
9.
10.
“Dealing withalert storms”
“Keeping up withour company’s growth”
“Adapting tothe speed of agile”
“Integrating monitoringwith ticketing”
“Hiring qualified staffand keeping them”
intelligent
needs
ops
AI
current utilize
server
Define
house
dedicated
proper
actionable
robust
Develop
lesstool
data
easier
Improve Simplify
SaaS
routing
internal
event
solutions
legacy
scalecomplexity
time
systems
root causemetrics
Availability
access
Replace
discovery
product informationsupport
resources
existing
dashboards
developers control
solutiontune
across
properly
tuning
training
onestaffing reduce
centralizationtickets
alerts consolidate
critical
noise
correlation
cloud
upgradecomprehensive
platform
volume
Increaseapproach
overall
networkstrategy
tools
dashboard
focus
implementation
visibility
applications service
Deployagile
security
ability
performancechange
management
automationbudget
integration
environment
infrastructure
incidents
mobile
appropriate
thresholds
machine learning
multiple
false positives
proactive
customer
Move
What do you anticipate will be your biggest IT monitoring challenge of 2017?
We asked Top themes

If you could make one change to your monitoring strategy…In our second write-in section, we asked respondents: if you could make one change to your
current monitoring strategy, what would it be? Similar to our previous question, the most
prominent theme was the desire to refine the organization’s overall strategy or processes,
followed by investing in new tools and centralizing/consolidating the monitoring stack.
State Of Monitoring | 2309

changes
Server
performance
networkIncrease
effective
Correlation
issues
applications
toolsbudget
consolidation
volume
fatigue
platform
actionable
identifying
data
solution
alerts
migration
environment
alertproactive
infrastructure
support
hacking
Cyber Funding
Securingmobile
tuning
metrics
Hybrid
Storage
containers
across
root
service
stacklegacy availableadding
Implementing
product
threats
resources
analysis
usage
traffic
customer
Reducing
challenge
system
integration
Staffingalerting
AWS
attacks
servicesimprovementssecurity
cloud
new systems
Adapting
growth
breach
platforms
thresholds
single
realteams
log
Integrating
response
processes
Scaling
abilitycause
positivesmanagement
right
false
noise
managingdifferentRansomware
strategy
externalsignal
business
quicklyinternal
breaches
approach issue
developers
devices
critical
If you could make one change to your monitoring strategy… State Of Monitoring | 249
Refining overall strategy or processes
Investing in new tools
Centralizing/consolidating the monitoring stack
Event management and alert correlation
Automation
If you could make one change to your current monitoring strategy, what would it be?
We asked
Staffing qualified personnel
Refining monitoring metrics
Alert noise reduction
Securing additional funding
Improving incident management
1.
2.
3.
4.
5.
6.
7.
8.
9.
10.
Top themes
“Make monitoring part ofthe process of developing apps”
“Automate! Automate!Automate!”
“Centralize monitoring intoa single pane of glass”
“Employ smarter alertingthat takes the guesswork out
of identifying root cause”
“Obtain fundingfor better tools”

Key takeawaysDoing more with less?
More tools, more moving parts
Alert noise is not getting any quieter
An effective monitoring strategy is key
It all boils down to the customer experience
State Of Monitoring | 2510

Over 1500 IT pros participated in this year’s survey. The respondents represented a wide
range of industries, and although company size skewed large (53% from organizations with
1000+ employees), team size demonstrated the opposite trend, with 43% reporting a team
of less than ten. This could be reflective of the proliferation of applications and
microservices, which has lead many larger organizations to shift away from a centralized IT
to a number of smaller, specialized DevOps teams that share responsibility for a particular
service or business unit.
On the other hand, it could be indicative that IT leaders are simply having to do more with
less. If the latter, there are two potential reasons for this: first being that IT leaders are
feeling the pain of the IT skills gap and simply unable to keep their team staffed with
qualified candidates. This hypothesis is bolstered by the qualitative feedback we received
when asking respondents to identify their biggest monitoring challenge for the upcoming
year, as well as the one change they would make to their monitoring strategy. In both cases,
staffing and retaining qualified personnel ranked among the top 10 themes. Alternatively, IT
leaders may be facing pressure to expand their capacity, without increasing headcount.
Key takeaways State Of Monitoring | 2610
Doing more with less?

Key takeaways State Of Monitoring | 2710
The findings of this year’s survey not only confirm that IT practitioners are relying a growing
number of tools to effectively do their job, but it also demonstrates that the underlying
systems that they support are growing ever more agile and complex. According to the
report, the average practitioner currently uses six-seven tools on a regular basis, and over
half of respondents reported that they plan to further expand their stack in 2017 – by
approximately two tools on average.
This means that we are likely to see that figure jump to 8-9 tools on average next year, and
that’s just per person. The total number of tools required organization-wide to effectively
support agile development, uptime and reliability is no doubt much higher, particularly at
the enterprise level.
This, paired with the fact that the frequency of both code and infrastructure change is on
the rise, points to the growing complexity and noisiness of today’s monitoring stack. Across
the board, the number of respondents reporting daily or weekly code deployments
increased, while monthly and yearly deployments declined. Similarly for infrastructure
management, the number of respondents who reported that their organization makes just
a few changes per year sharply declined, while all other response groups increased.
More tools, more moving parts

Key takeaways State Of Monitoring | 2810
With more tools and more moving parts to keep tabs on, it is perhaps little surprise that
alert noise has proven to be such a loud – and painful – problem. More than three quarters
of the 1500+ respondents stated that reducing alert noise is a challenge, and the number of
respondents reporting high alert volumes (100-500, 500-1000, or 1000+ alerts per day) has
increased across the board over 2016. This group reports extremely low levels of
satisfaction with their ability to respond to alerts, which is reflected in the fact that only 26%
are are able to remediate the majority (75-100%) within 24 hours.
Furthermore, those with high volumes of alerts are more concerned about complying to
customer SLAs and delivering business objectives to schedule. However, if the proliferation
of monitoring tools, as well as the frequency of code and infrastructure change, continue
their upwards trend, then alert storms are only likely to become more prevalent and
challenging for IT teams. While many organizations might try to remediate this issue by
increasing headcount, in most cases it would be a “BandAid” solution, too costly to be
feasible in the long run.
In order to implement a long-term solution that can scale to the challenges of big data,
automation is key. While software and infrastructure management have made strides in this
regard, service assurance has been left in the dust. In order to achieve true, long-term agility
at scale, organizations must replace tedious manual processes by coupling monitoring
automation with automated alert correlation and event management.
Alert noise is not getting any quieter
Key takeaways State Of Monitoring | 2910
While it may sound like a no-brainer, the effect of a solid monitoring strategy – or lack
thereof – cannot be underestimated. The benefits abound: those with a defined monitoring
strategy in place find it easier to identify and remediate service disruptions, and those who
consider their monitoring process to be strategic are also more likely to build monitoring
into code, agree that developers are actively involved in supporting applications, and
consider their organization to be agile.
In addition, there is a clear correlation between monitoring strategy satisfaction and the
volume of alerts that can be investigated and resolved within 24 hours. However, despite all
the evidence in support of its importance, only half of respondents reported that their
organization has a defined monitoring strategy in place.
Even more troubling, a meager 13% agreed that they are very satisfied with their approach
to monitoring, and just 11% are satisfied based on overall investment. As IT systems grow
ever more noisy and complex, developing a future-proof monitoring process that can scale
with organizational growth is an imperative.
An effective monitoring strategy is key
Key takeaways State Of Monitoring | 3010
For two years in a row, customer satisfaction has far outranked all other performance
metrics we included in our survey – including some that many might consider “traditional”
for IT practitioners. Customer satisfaction was cited as a KPI by a whopping 73% of
respondents, while the second most popular metric, SLA compliance, was cited by just 45%.
This vast gap indicates the pivotal role that the digital customer experience plays as a key
competitive differentiator. It also signals an important shift in the way that IT performance
is valued. Traditional metrics, such as MTTR and incident volume, are too heavily weighted
on outcomes not closely associated with business services. Tracking the number of closed
tickets or resolved incidents does not directly gauge the quality of the end user experience –
and whether they are likely to buy or engage again.
In fact, digital customers have come to expect technical reliability as standard. The
difference between “good” and “great” now lies in factors such as usability, personalization,
cross-platform support, and customer service.
It all boils down to thecustomer experience

Interested in more? Check out
The Modern NOC:IT Ops Predictions for 2017