Embed Size (px)
Citation preview

Solid-State NMR Spectroscopy
Correlation
Struct
ure
Dynam
ics

1. Introduction
Since the pioneering demonstration of cross-polarization13C NMR spectra of solid adamantane and benzene,[1] solid-state NMR spectroscopy has advanced rapidly and is beingused to study the structure and dynamics of a variety of solidsystems ranging from catalysts and glasses to polymers andproteins. Much of the success of solid-state NMR spectro-scopy is due to the evolution of a variety of techniques forstudying internuclear distances, anisotropy, torsion angles,atomic orientations, spin diffusion, molecular dynamics, andexchange processes, while maintaining the analytical highresolution and sensitivity that constitute the hallmarks ofpractically useful NMR experiments in chemistry.Our goal in this Review is to demonstrate the utility of
solid-state NMR spectroscopy for the study of molecularstructure and dynamics in solids, and its application as a toolfor routine chemical analysis of solid materials. We discuss theinteractions between nuclear spins and magnetic fields thatgive rise to the traditionally broad solid-state NMR signals, as
well as the common and less-common methods designed toeliminate this broadening. We review the concepts behindtechniques that are routinely used to exploit internuclearinteractions (e.g. methods of internuclear distance determi-nation and correlation experiments in solids). We also discusssolid-state NMR spectroscopy of quadrupolar nuclei such as2H, 23Na, and 27Al and outline how they can be used to probeorientation, dynamics, and structure. Numerous excellentreview articles have appeared in the past few years showinghow the tools of solid-state NMR spectroscopy can be appliedto solving specific problems.[2±31] For the benefit of providingthe reader with a more or less complete overview of currentsolid-state NMR spectroscopic techniques, we refer to thosepublications and other references given in the text for apresentation of specific applications or specific methods. Adetailed mathematical description of solid-state NMR is leftout purposely, but, where appropriate, we provide referencesto books and articles that explain in greater detail the topicspresented herein.
2. Solid-state NMR of Low-Abundance Spin 1³2Nuclei
The most common NMR experiments performed for solid-state samples are those involving the observation of spin 1³2nuclei with low gyromagnetic ratios, for example, 13C, 15N, and29Si. Thus, we begin with an introduction to the spininteractions that play a role in solid-state NMR spectra of
Solid-State NMR Spectroscopic Methods in Chemistry
David D. Laws, Hans-Marcus L. Bitter, and Alexej Jerschow*
Over the last decades, NMR spectro-scopy has grown into an indispensabletool for chemical analysis, structuredetermination, and the study of dy-namics in organic, inorganic, and bio-logical systems. It is commonly used fora wide range of applications from thecharacterization of synthetic productsto the study of molecular structures ofsystems such as catalysts, polymers,and proteins. Although most NMRexperiments are performed on liquid-state samples, solid-state NMR is rap-
idly emerging as a powerful method forthe study of solid samples and materi-als. This Review outlines some of thedevelopments of solid-state NMRspectroscopy, including techniquessuch as cross-polarization, magic-anglespinning, multiple-pulse sequences, ho-mo- and heteronuclear decoupling andrecoupling techniques, multiple-quan-tum spectroscopy, and dynamic anglespinning, as well as their applicationsto structure determination. Modernsolid-state NMR spectroscopic techni-
ques not only produce spectra with aresolution close to that of liquid-statespectra, but also capitalize on aniso-tropic interactions, which are oftenunavailable for liquid samples. Withthis background, the future of solid-state NMR spectroscopy in chemistryappears to be promising, indeed.
Keywords: multipulse techniques ¥NMR spectroscopy ¥ solid-statestructures ¥ spin-spin coupling ¥structure elucidation
[*] Prof. Dr. A. Jerschow,[�] Dr. D. D. Laws, Dr. H.-M. L. BitterMaterials Sciences Division, Lawrence Berkeley National LaboratoryandDepartment of Chemistry, University of California at BerkeleyBerkeley, CA 94720 (USA)E-mail : [email protected]
[�] Present address: Chemistry Department, New York UniversityNew York, NY 10003 (USA)fax: (�1)212-260-7905
REVIEWS
Angew. Chem. Int. Ed. 2002, 41, 3096 ± 3129 ¹ 2002 WILEY-VCH Verlag GmbH&Co. KGaA, Weinheim 1433-7851/02/4117-3097 $ 20.00+.50/0 3097

REVIEWS A. Jerschow et al.
spin 1³2 nuclei and discuss common spectroscopic methods thatmanipulate and even eliminate the effects that these inter-actions have on solid-state NMR spectra.If one were to dissolve a sample of 1-13C-labeled (10%)
glycine in water and apply a single �/2 pulse at the appropriateNMR frequency for 13C nuclei, the familiar 13C spectrumshown in Figure 1 would result. Two well-resolved signals
Figure 1. Liquid-state 13C NMR spectrum (75 MHz) of 1-13C labeled(10%) glycine dissolved in H2O (0.2 mL) to a concentration of �10 m�.
appear in the spectrum, corre-sponding to the 13C-labeled car-bonyl carbon atoms and thenatural abundance (�1% for13C) � carbon atom in the gly-cine sample. The familiar 1:2:1splitting pattern of the carbonylcarbon resonance provides in-formation about its J couplingto the two � protons. The split-ting of the isotopically dilute �-carbon resonance are a result ofJ couplings to both the �-pro-tons and the carbonyl carbonatom. In contrast, Figure 2shows the result of a compara-ble experiment performed onthe same compound in the solid state. The signals for thecarbonyl 13C, which were very sharp in the liquid-statespectrum, are now replaced by an extremely broad(�200 ppm) and generally uninterpretable peak. The broad-ening of the signal for �-carbon atom renders it barelyperceptible. These broad solid-state signals are primarily theresult of interactions that are present (but rarely observed) inliquid-state NMR spectra. The three primary interactions arethe heteronuclear and homonuclear dipolar couplings, and thechemical-shift anisotropy. In the ensuing sections, we examine
3098 Angew. Chem. Int. Ed. 2002, 41, 3096 ± 3129
David Douglas Laws received hisB.S. in chemistry in 1995 from theUniversity of Illinois, Urbana-Champaign where he worked withProfessor Eric Oldfield on thecalculation of NMR chemical shiftsin proteins. He then moved to theUniversity of California, Berkeley,where he received his Ph.D. inchemistry working with ProfessorAlex Pines on developing techni-ques to study solid-state proteins byNMR spectroscopy. David nowresides with his wife Elizabeth in New Jersey, where he teaches chemistry and coaches swimming at The LawrencevilleSchool.
Hans-Marcus Bitter obtained his B.S. degree from Princeton University in 1995 and received his Ph.D. in 2000 from theUniversity of California at Berkeley under the supervision of Professor Alexander Pines. Currently, he works as aninformatics scientist at Biospect, a South San Francisco biotech company. He resides in San Francisco with his wifeCatherine.
Alexej Jerschow received his Ph.D. from the University of Linz (Austria) under the supervision of Professor NorbertM¸ller for work on the analysis of polymers with multidimensional NMR spectroscopy. He was then a postdoctoralfellow with Professor Geoffrey Bodenhausen and supervisor of the NMR facility of West Switzerland at the Universityof Lausanne. His research involved the development of novel liquid-state NMR methodology, and the study of complexflow with magnetic resonance imaging methods. As an Erwin Schrˆdinger fellow with Professor Alexander Pinesat the University of California, Berkeley, he developed new solid-state high-resolution NMR techniques for quadrupolarnuclei. He lives with his family in New York and is currently an Assistant Professor of Physical Chemistry at New YorkUniversity.
A. JerschowH.-M. BitterD. Laws
Figure 2. Solid-state 13C NMRspectrum (125 MHz) of 1-13Clabeled (10%) glycine powder(90 mg).

REVIEWSSolid-State NMR Spectroscopy
the origins of each of these interactions and discuss how theireffects on solid-state NMR spectra can be coherentlymanipulated so as to produce spectra with a resolution closerto that of liquid-state spectra. However, these mechanismsoften contain a wealth of structural data and we will alsoreview techniques that aid in obtaining this information.
2.1. Heteronuclear Dipolar Coupling
We begin our analysis of the solid-state 13C NMR spectrumof glycine with an examination of the heteronuclear dipolarcoupling. The heteronuclear dipolar coupling arises from aninteraction between the nuclear magnetic moments of twodifferent nuclear spins. (By convention, nuclear spins arelabeled as I for ™abundant∫ spins, for example, that of theproton, and S for ™rare∫ spins such as that of 13C or 15N nuclei.)In an external magnetic field, the Zeeman interactiondescribes the energy of the spin I based on its orientation,either parallel (™spin-up∫) or antiparallel (™spin-down∫), withrespect to the external field [Eq. (1)], where �� gyromag-netic ratio, B0� external magnetic field, andmI� nuclear spinquantum number (which is either � 1³2 or � 1³2 for a spin 1³2nucleus).
EZeeman � � �h�B0mI (1)
Similarly, spin S will align itself either parallel or antipar-allel to B0. Since each spin represents a nuclear magneticmoment that produces a small magnetic field, the S spin will™feel∫ the magnetic field produced by the I spin and vice versawhen the two spins are within reasonable proximity of eachother (�10 ä). This magnetic field produced by the I spin willeither add to or subtract from the external field felt by theS spin, depending on the orientation of the I spin, therebyincreasing or decreasing the effective local magnetic field atthe site of spin S and thus changing its resonance frequency.The degree to which spin I affects the magnetic field felt byspin S is characterized by the strength of the heteronucleardipolar coupling, which is represented by the Hamiltonian inEquation (2).
HIS � � d (3cos2�� 1)IzSz (2)
The parameter d is the dipolar coupling constant [Eq. (3)].
d � �0
4�
� ��h�I�S
r3IS(3)
In this case, rIS� internuclear distance, �0� permeability offree space (�4�� 107 NA�2), �I and �S� gyromagnetic ratiosof the I and S spins, respectively, and Iz and Sz� z componentsof the nuclear spin angular momentum operators I and S,respectively. The angle � describes the orientation of theinternuclear vector with respect to the orientation of theexternal magnetic field (Figure 3 shows this for a case in whichI� 1H and S� 13C). Because the magnitude of the couplingbetween two nuclear spins depends on the internuclear
distance, the dipolar cou-pling is a through-space in-teraction. In contrast, J cou-pling requires the presenceof chemical bonds. It is trans-ferred through the electronsengaged in these bonds andthus is confined to nucleiwithin a molecule. Through-space dipolar coupling, how-ever, also occurs betweennuclei in different molecules.The two coupling mecha-nisms are therefore comple-mentary in information con-tent.Three properties of the heteronuclear dipolar coupling
Hamiltonian stand out:1) The magnitude of the coupling isproportional to the product of the gyromagnetic ratios. Thisappears intuitively reasonable because the magnetic momentof a nucleus is proportional to �, and nuclei with greatermagnetic moments produce stronger magnetic fields, which inturn increases the dipolar coupling interaction. 2) The dipolarcoupling is inversely proportional to the cube of the inter-nuclear distance, so the interaction falls off rapidly as thenuclei are moved farther apart. 3) The dipolar coupling isdependent on the orientation, which is evident from the(3cos2�� 1) term in the dipolar Hamiltonian. This means thatfor two nuclei of spins I and S which are separated by a fixeddistance, the magnitude of the dipolar interaction will begreater for certain orientations of the I ±S internuclear vectorthan for others. It is the orientational dependence of thedipolar coupling that limits its role in liquid-state NMRspectroscopy. The reorientation time of a molecule in solutionis much faster than the time the dipolar coupling would needto evolve, thus causing the (3cos2�� 1) term of the hetero-nuclear dipolar coupling Hamiltonian to average to zero. In astatic solid sample comprised of randomly oriented crystal-lites, however, the internuclear vector remains invariant overtime, and the resonance frequency produced by each crystal-lite depends on its orientation with respect to the externalfield. In a polycrystalline powder sample in which thecrystallites are oriented in all possible directions, the presenceof a heteronuclear dipolar coupling produces a spectrum suchas that shown in Figure 4 (if no other orientation-dependentinteractions are present). The two complementary patterns,termed the ™Pake doublet∫,[32] arise from energy differencesdetermined by HIS, depending on the parallel or antiparallelalignment of the I spin with respect to the S spin (the IzSz termgives positive and negative energies, respectively). Theintensity of the pattern at a particular frequency reflects theabundance of the crystallites that resonate at that frequency.In a powdered solid, the singular peaks of the Pake patterncorrespond to crystallites for which the I� S internuclearvector lies perpendicular to the magnetic field. The two lowedges of the Pake pattern correspond to the relatively fewcrystallites whose I ±S internuclear vectors point toward thepoles (parallel to the external field). Notably, there is also anorientation of the I ± S vector relative to B0 at which the
Angew. Chem. Int. Ed. 2002, 41, 3096 ± 3129 3099
Figure 3. � is the angle betweenthe 1H ± 13C bond vector and thedirection of the external magneticfield B0 .

REVIEWS A. Jerschow et al.
d–d –d d0
= 0o = 54.7o
= 90o
da)
b) θθ
θ
/2 /2
Figure 4. a) Dipolar Pake pattern (™Pake doublet∫) for two coupled spinsin a powder sample; the two signals correspond to a positive (parallel spins)and a negative (antiparallel spins) value of the IzSz component. b) Thepoints with maximum intensity corresponds to �� 90�–a perpendicularorientation to B0 is adopted by a majority of the crystals. The smallestnumber of crystals have the internuclear vector parallel to B0 (�� 0�). Atthe magic angle of �� 54.7�, the dipolar coupling is zero. The spacingbetween the points of maximum intensity in a) is equal to the dipolarcoupling constant d (d/�h if expressed in Hz).
resonance frequency of the crystallites is not altered by theheteronuclear dipolar coupling. This is the case at the ™magicangle∫ of �� 54.74� ((3cos2�� 1)� 0).The spectrum in Figure 2 does not resemble a Pake pattern
for three reasons: 1) each carbon atom couples to more thanone proton; 2) the protons couple with each other; and3) other anisotropic interactions cause additional broadeningof the resonances, as discussed below.
2.2. Heteronuclear Dipolar Decoupling
The heteronuclear coupling that is responsible for much ofthe broadening in the glycine spectrum in Figure 2 involvesthe coupling of 1H nuclear spins to the detected 13C nuclearspins, as the 1H ± 13C dipolar coupling is typically the dominantinteraction experienced by the 13C spin. A typical couplingconstant for a bonded 1H± 13C pair (at a distance of about1 ä) is approximately 30 kHz. However, close inspection ofthe Hamiltonian in Equation (2) suggests two possible meansof eliminating the interaction to give narrower lines. Oneapproach is to take advantage of the fact that the dipolarcoupling is zero when the internuclear vector is oriented at themagic angle with respect to the magnetic field. This approachis implemented in a technique known as magic-angle spinning(see Section 2.4). The second method that can be used toeliminate the effect of the 1H nuclei on the 13C spectrum is tomanipulate the proton spins in such a way that their effect onthe 13C nucleus, when averaged over time, is equal to zero.This is the solid-state dipolar version of spin decoupling,which is used in solution NMR spectroscopy. As can be seenfrom the signals for the two transitions shown in Figure 4, aproton whose spin is parallel to the external field (™spin-up∫)produces a shift in the resonance frequency of a 13C nucleusthat is opposite to the shift produced by a proton whose spin isantiparallel to the external field (™spin-down∫). By constantly
applying radio-frequency (RF)pulses that rotate the protonnuclear spins between their™spin-up∫ and ™spin-down∫states, the average orientationof the 1H magnetic momentstends to zero, and the dipolarcoupling is essentially averagedaway (this also applies to theJ coupling). This continuous-wave (CW) spin decoupling[33, 34]
is widely used to eliminate het-eronuclear couplings in solid-state NMR spectroscopy. Ascan been seen in Figure 5, underCW irradiation at the 1H Lar-mor frequency, the 13C peak is definitely less broad than thatin Figure 2. The resulting spectrum is dominated by thechemical-shift anisotropy (see Section 2.3). Notably, 1H de-coupling has a much more dramatic effect on the signal for the� carbon atom (which is now visible in the spectrum) than itdoes on the signal for the carbonyl carbon atom (Figure 5).This is a result of the distance dependence of the dipolarcoupling: with two � protons a distance of �1 ä away, the� carbon atom experiences a much stronger 1H ± 13C couplingthan the unprotonated carbonyl carbon atom. In liquid-stateNMR spectroscopy, CW decoupling is used much less often asit has been superseded by a number of different multiple-pulse techniques.[35, 36] These techniques are usually not aseffective in solid-state NMR spectroscopy for reasons that wewill discuss below.
2.3. Chemical-Shift Anisotropy
The origin of the chemical shift can be understood byexamining the effect of B0 on the electrons around a nucleus.When an external magnetic field is applied to an atom, notonly are the nuclear spins perturbed, but the surroundingelectrons are also affected since they, too, have magneticmoments. The external field induces circulating currents ofelectrons that in turn produce small magnetic fields (typically�1x10⁶ times smaller than B0), which either add to or subtractfrom the external field felt by the nucleus. Therefore, theeffective magnetic field experienced by the nucleus is altered,as is its resonance frequency.The orientation dependence or anisotropy of the chemical
shift can be quite dramatic. For a non-sp3-hybridized 13C atom,the chemical shift anisotropy (CSA) can be as large as 120 ±140 ppm (e.g., see Figure 5). Much larger anisotropies (up to1000s ppm) can be found for some heavier nuclei. The CSAresults from the fact that the atoms in molecules rarely possessspherically symmetric electron distributions; instead, theelectron density can be thought of as an ellipsoid, typicallyelongated along bonds or nonbonding p-orbitals. The degreeto which the electron density affects the resonance frequencyof a nucleus depends on the orientation of the electron cloud(and hence the orientation of the molecule) with respect toB0 . For example, the resonance frequency of a carbonyl
3100 Angew. Chem. Int. Ed. 2002, 41, 3096 ± 3129
Figure 5. CW 1H decoupledsolid-state 13C NMR spectrum(125 MHz) of a 1-13C-labeled(10%) glycine powder.

REVIEWSSolid-State NMR Spectroscopy
carbon atom can differ by more than 120 ppm, depending onthe orientation of the C�Omoiety with respect to the externalfield, as can be seen in Figure 6. The largest chemical shift (i.e.deshielding effect) in the resonance frequency of the 13Cnucleus occurs when the narrowest part of the electron cloud
Figure 6. Schematic representation of the principle values of the CSA: �11
(a), �22 (b), and �33 (c). The position of each resonance depends on theorientation of the magnetic field relative to the principal axes of thechemical shift tensor. (Reproduced from ref. [43], with permission.)
is oriented along the B0 axis (Figure 6a), whereas the smallestshift occurs when the widest part of the electron cloud isoriented along B0 (Figure 6c). These two chemical shifts,referred to as �11 and �33, respectively, are two of the three™principal values∫ of the CSA. The third value �22 is the shiftproduced by the molecular orientation perpendicular to theaxes of �11 and �33 (Figure 6b). These three principal valuesand the information of the orientation of the ellipsoid (usuallyspecified by the three Euler angles[37]) provide all theinformation necessary to describe the CSA of a nuclearspin.[38, 39]
In powder samples, in which the vast number of randomlyoriented crystallites ensures that all of the possible molecularorientations are sampled, a ™powder pattern∫ such as the oneshown in Figure 5 emerges. The left and right edges of theC�O signal correspond to the chemical shifts �11 and �33,respectively, and the position of the maximum intensity of thepattern corresponds to �22 (for the common convention of�11� �22� �33). The broad CSA signal is the result of aninteraction between the detected spins and the external field,and so there is no simple way to remove this interaction by RFpulses (as we did with the heteronuclear dipolar coupling)without affecting the free precession of the spins required forsignal detection. However, liquid-state NMR spectroscopyprovides a clue as to how the effects of the CSA can beeliminated. In liquids, molecules randomly and rapidly samplethe full range of orientations, so that even a stronglyasymmetric electron distribution will appear spherical whenviewed on the NMR timescale. One can divide the chemical-shift Hamiltonian ��� into an isotropic term and an aniso-tropic term. For the special case in which �11� �22 (so that theellipsoids in Figure 6 would be axially symmetric like a cigar),
the chemical shift Hamiltonian can be written as shown inEquation (4):
Hcs � �B0 Iz [�iso� 1³2�CSA(3cos2�� 1)] (4)
�iso� (isotropic) chemical shielding factor (typically in theorder of 10�6 �� ppm) [Eq. (5)].
�iso � 1³3(�11� �22� �33) (5)
The angle � relates the orientation of the unique axis of theellipsoid with respect to B0 , and �csa dictates the magnitude ofthe CSA [Eq. (6)]
�CSA � �33� �iso (6)
In a rapidly tumbling molecule, all possible orientations ofthe ellipsoid are sampled, causing the orientation-dependentterm to average to zero and leaving only the isotropiccomponent of the chemical shift, �iso�B0 Iz, which is observedin liquid-state NMR spectra. Imposing a random, liquid-likemotion on a solid-state sample is, however, mechanicallyimpractical since it would require motion around multipleaxes at speeds that are currently unattainable. By spinning thesample around a unique well-chosen axis (see followingSection 2.4), one can also eliminate the anisotropic term ofthe chemical-shift Hamiltonian.
2.4. Magic-Angle Spinning
We pointed out in Section 2.2 that when the vector betweentwo nuclei makes an angle �� 54.74� (the magic angle) withthe static magnetic field, the value of the (3cos2�� 1) term inthe heteronuclear dipolar coupling Hamiltonian is zero. Thesame is true for the axially symmetric CSA, for which ananalogous angular dependence is found (in this case, � is theangle that the long axis of the CSA ellipsoid makes with thestatic field). This could be accomplished by using a singlecrystal in which the CSA ellipsoid is oriented so that ��54.74�. Single crystals are, however, hard to obtain for manysamples, and the orientation of the unique CSA axis withrespect to the crystallite frame is not known.Alternatively, by rapidly spinning a polycrystalline powder
sample, one can make the average CSA look like an ellipsoidwhose long axis is aligned with the spinning axis. This is alsotrue when the CSA is not axially symmetric. The effect of thisaverage CSA on the spectrum is eliminated if the spinningaxis is inclined at 54.74� with respect to the static magneticfield. This technique is known as magic-angle spinning(MAS).[40, 41]
Another qualitative description of the theory that underliesthe averaging of the CSA under spinning has been report-ed:[38, 39, 42] For a static powder sample, the value of the CSA isfixed for a given crystallite orientation. When the sample isspun, the CSA values of all crystallites become time-depend-ent, since the orientation of the crystallites change. Figure 7shows that an axis inclined at an angle of 54.74� represents thedirection of the space diagonal of a cube. The x, y, and z
Angew. Chem. Int. Ed. 2002, 41, 3096 ± 3129 3101

REVIEWS A. Jerschow et al.
coordinate axes appear symmet-ric when looking down the spacediagonal. Over a single rotationperiod, each crystallite thereforeexperiences the average of theeffective chemical shift �iso�(�xx � �yy � �zz)/3� (�11 � �22 ��33)/3, the isotropic chemicalshift. MAS can therefore beregarded as a dynamic imple-mentation of cubic symmetry,[43]
which cancels the anisotropicterm.Figure 8a ± d show a series of
13C MAS spectra for uniformly13C-labeled (10%) glycine at dif-ferent spinning speeds. As thespinning speed decreases, numer-
ous peaks begin to appear at frequency distances of integermultiples of the spinning speed. These peaks, known asspinning sidebands, result from the incomplete averaging ofthe revolving CSA ellipsoid at slow spinning speeds.[40, 41]
These additional signals always appear in-phase for a perfect
Figure 8. Solid-state 13C NMR spectra (125 MHz) of a uniformly 13C-labeled (10%) glycine powder sample; the spectra were acquired underCW 1H decoupling and MAS at the given spinning speeds. As the spinningspeed decreases the envelope of the spinning sidebands begins to resemblethe simulated static NMR spectrum e).
powder, but may be anti-phase when a preferential orienta-tion of the crystallites exists in the sample.[44] Although thesesidebands are often a nuisance (they can be minimized byspinning at a frequency greater than the width of the CSApattern), in some instances their presence provides additionalinformation about a sample (see Section 4.4). Figure 8erepresents a powder spectrum reconstructed from the CSAparameters obtained by fitting the sideband intensities inFigure 8a ± d.[45] This spectrum looks very similar to theexperimental spectrum shown in Figure 5, taking into accountthe difference in the abundance of the 13C labeled � carbonatom.
2.5. Homonuclear Dipolar Coupling
The heteronuclear dipolar coupling is the result of aninteraction between the magnetic fields produced by differentneighboring nuclear spins (for example 1H and 13C). The sameform of coupling exists between like spins, such as two 13Cnuclei. However, whereas two unlike nuclear spins (hetero-nuclei) have very different resonance frequencies (for exam-ple, when 1H spins resonate at 500 MHz, 13C spins resonate at125 MHz), two like spins are able to undergo an energy-conserving ™flip-flop∫ transition in which one spin flips upwhile the other spin flips down (Figure 9). To account for the
Figure 9. a) At different transition frequencies of two spins �I and �S, noenergy-conserving transition can occur; b) when �I��S, c) the spins canexchange magnetization through an energy-conserving ™flip-flop∫ inter-action.
™flip-flop∫ interaction, an additional term, normally ineffec-tive in the heteronuclear case, is added back in to give thehomonuclear dipolar Hamiltonian [Eq. (7)]
HII � � d 1³2 (3cos2�� 1) (3 I1z I2z� (I1 ¥ I2)) (7)
Analogously to Equation (3), d� (�0/4�)(�h�2I /r3IS. The ori-
gin of the term I1 ¥ I2 (� I1xI2x� I1yI2y� I1zI2z) can be betterunderstood by rewriting Equation (7) as Equation (9) interms of raising and lowering operators [Eq. (8)]
I� � Ix� iIy ; I� � Ix� iIy (8)
HIS � � d 1³2 (3 cos2�� 1) (2 I1zI2z� 1³2 (I�1 I�2 � I�1 I�2 �) (9)
The raising operator I� increases the angular momentum ofa spin by �h, which amounts to flipping a spin from the ™down∫orientation to the ™up∫ orientation (Figure 9). Conversely, thelowering operator I� lowers the angular momentum of a spinby �h, causing an ™up∫ spin to flip ™down∫. Together, the I�1 I�2and I�1 I�2 provide for an energy-conserving exchange of spinangular momentum between any two coupled spins whoseresonance frequencies overlap. When two like spins have very
3102 Angew. Chem. Int. Ed. 2002, 41, 3096 ± 3129
54.7o
x
y
z
Figure 7. The magic angle(54.7�) is the angle that thespace diagonal of a cubemakes with the z axis. This isalso the direction of the nodalplane in a dzz orbital. Rapidspinning of the sample aboutthis axis removes the dipolarinteractions.

REVIEWSSolid-State NMR Spectroscopy
different chemical shifts so that there is no overlap betweentheir resonance frequencies, there can be no energy-conserv-ing transition; in the latter case, the homonuclear dipolarHamiltonian reverts to the form of the heteronuclear dipolarHamiltonian shown in Equation (2).For low-� nuclei such as 13C and 15N, the homonuclear
dipolar coupling can often be removed by MAS, as even fordirectly bonded 13C nuclei, the dipolar coupling constant ddoes not exceed 5 kHz. However, there still can be ™recou-pling∫ effects with certain ratios of spinning speed tochemical-shift difference of the two nuclei (see Section 4).The homonuclear dipolar interaction has perhaps the largestimpact on 1H solid-state NMR spectroscopy, as the strength ofthe homonuclear dipolar coupling between two proton spinscan routinely approach 100 kHz because of their largegyromagnetic ratio. The problem of strong 1H± 1H dipolarcoupling is exacerbated by the high abundance of protons inmost organic systems, which results in a network of stronglycoupled spins that are very difficult to decouple from eachother. As a result, solid-state 1H NMR spectra typicallyconsist of a single broad peak, with a line width in the orderof 50 kHz. Figure 10a shows a static 1H NMR spectrum ofsolid glycine, in which the many protons lead to a spectrumthat cannot be interpreted. Although MAS does help toreduce the line width (Figure 10b), it is still too broad to be ofgeneral use, even at the very high (�30 kHz) MAS speedsnow obtainable. Homonuclear decoupling by using RF-pulsesequences are discussed in Section 3.2.
Figure 10. Solid-state 1H NMR spectrum (500 MHz) of glycine powder:a) without spinning, b) with spinning (10 kHz, at the magic angle).
2.6. Cross Polarization
Thus far we have concentrated on the differences betweenliquid- and solid-state Hamiltonians and spectra, and howthese differences can be overcome by utilizing techniquessuch as spin decoupling and MAS. To complete this section,we turn our attention to an additional difference betweenliquid- and solid-state NMR experiments. Even in liquid-stateexperiments that measure 13C or 15N chemical shifts or
J couplings, the magnetization is often initially transferredfrom neighboring protons and then transferred back to theprotons for detection to exploit the higher sensitivity. Inaddition, as relaxation is usually more rapid for protons, onecan minimize acquisition times.[46] As a result of the difficul-ties involved in obtaining high-resolution solid-state 1H NMRspectra, the majority of solid-state NMR experiments detectthe magnetization of other nuclei such as 13C, 31P, and 15N. Thedrawbacks of directly detecting low-� nuclei such as 13C and15N are low isotopic abundances, low spin polarization, andlow signal intensity. These drawbacks can be circumvented bya solid-state NMR technique that combines both the highpolarization and short relaxation time that is typical of1H NMR spectroscopy with high resolution (e.g. of 13C and15N nuclei)–this would be the conceptual analogue of theINEPT and DEPT experiments).[47]
To enhance the signals from rare nuclei such as 13C and 15N,many solid-state NMR experiments today routinely involvethe transfer of polarization from abundant nuclei (usually 1Hnuclei) by using a technique called cross polarization(CP).[1, 38, 39] The process of CP occurs through the tendencyof the magnetization to flow from highly polarized nuclei tonuclei with lower polarizations when the two are brought intocontact, similar to heat flow from a hot object to a cold objectwhen the two are in thermal contact. For homonuclear spins,the magnetization can be exchanged through mutual energy-conserving spin flips (Figure 9b ± c). For heteronuclear pairssuch as 1H and 13C, these spin flips are not energy-conservingat high magnetic fields (see Figure 9a). Therefore, theexchange of magnetization must be driven externally by theapplication of RF fields.Among the techniques for establishing a dipolar contact
between two different spin systems I and S, a particularlyeffective approach is that of Hartmann and Hahn.[48]
The Hartmann ±Hahn method requires the simultaneousapplication of two continuous RF fields, one at the resonancefrequency of the I spin and one at the resonance frequency ofthe S spin. The effect of any RF field is to rotate themagnetization about the axis of the applied field. The rotationor nutation rate depends on the frequency and amplitude ofthe RF field. An RF field that oscillates at the I-spinfrequency, for example, 500 MHz, would have essentially noeffect on S spins with a frequency of 125 MHz and vice versa.By applying two RF fields, one tuned to the I spins the otherto the S spins, both the I and S spins can be rotatedindependently around a particular axis at rates determinedby the amplitudes of the two applied fields. When the nutationfrequencies of the I and S spins are equal, an energy-conserving dipolar contact between the two spin systems iscreated. The differences in energy are supplied by the RFfields. It is through this dipolar contact that the polarization istransferred between the I and S spins. One way to describehow this connection is established is by using a referenceframe rotating at both the I and the S spin nutationfrequencies. In the doubly rotating frame, the spacingbetween the spin-up and spin-down energy levels is equalfor the I and S spins (Figure 11a).The experimental implementation of this concept to obtain
high-resolution NMR spectra of rare or dilute S spins is shown
Angew. Chem. Int. Ed. 2002, 41, 3096 ± 3129 3103

REVIEWS A. Jerschow et al.
Figure 11. Hartmann ±Hahn CP: a) The energy differences between thetransitions of the I and the S spins can be made equal in a doubly rotatingframe when the nutation frequencies on both spins are equal. b) Pulsesequence for CP of 13C (S) nuclei by protons (I) with detection of the 13Cmagnetization. c) Solid-state 13C NMR spectra (125 MHz) of uniformly13C-labeled (10%) glycine powder acquired by using the pulse sequence inb) as a function of the CP time. Because of the directly bonded H� protons,the 13C� nuclei are polarized more rapidly than the unprotonated carbonylcarbon nuclei.
in Figure 11b. First, the proton magnetization is brought intothe xy plane by a �/2 pulse. RF fields are then applied to the Iand S spins for a period �CP, causing the magnetization to beexchanged between the I spins and the S spins in theirrespective rotating frame. Finally, the S spins are detectedwhile the I spins are decoupled. This sequence forms the basisof proton-enhanced NMR spectroscopy[1, 49] which, throughthe combination of CP and MAS,[50, 51] opened the way toroutine high-sensitivity, high-resolution, solid-state 13C NMRspectroscopy. The increase in the S-spin magnetization duringthe CP mixing period �CP depends on the strength of the I ± Sdipolar coupling (Figure 11c). The polarization buildup in theunprotonated carbonyl carbon atom requires a longer CPtime than for the � carbon atom, which is quickly polarized byits bonded protons (Figure 11c). Typical mixing times rangefrom 100 �s to 10 ms. The polarization buildup curve starts todecay beyond a certain mixing time as a result of relaxationand magnetization-transport phenomena. A direct link be-tween integrated signal intensities and stoichiometric abun-dances is no longer available owing to the many parametersinvolved, which is also true for liquid-state proton-enhancedor inverse spectroscopy.The maximum enhancement for a CP contact period under
the Hartmann ±Hahn conditions �I�I� �S�S is �I/�S (�I and�S� gyromagnetic ratios of spins I and S, respectively; �I and�S� nutation rates imposed by the RF fields).[39] Modifica-tions of the basic CP sequence can give sensitivity improve-ments beyond this theoretical enhancement through multiple
CP contact sequences.[1] In most NMR experiments, theacquisition or sampling rate is dictated by the relaxation time(T1) of the detected nuclei. Under CP conditions, the samplingrate depends on the relaxation time of the nuclei from whichthe magnetization is transferred. As the protons in the solidstate typically relax more rapidly than most other spin 1³2nuclei, many more scans can be acquired in a given amountof time in such an experiment than in a simple single-pulseexperiment that detects the rare 13C nucleus directly. Thispoint is illustrated in Figure 12, which shows a solid-state 13Cspectrum of (non-13C-enriched) alanyl histidine, both with and
Figure 12. Solid-state 13C NMR spectra (125 MHz) of unlabeled alanylhistidine powder: a) with CP by protons, and b) in a standard single-pulseexperiment. Both spectra were recorded under MAS at a speed of 12 kHzand with CW 1H decoupling. The recycle delay for the spectrum in a) was2 s. The recycle delay for the spectrum in b) was 60 s, owing to the long 13Crelaxation time (�18 s for this sample).
without CP from the protons. The signal intensities in the twoexperiments are not directly proportional for reasons men-tioned above. Whereas the overall signal-to-noise ratios of thetwo spectra in Figure 12a, b are comparable (�1.7:1 for therightmost peak) the acquisition time of the non-CP spectrumwas 45 times longer than for the CP spectrum, owing to thelong relaxation time T1 (�18 s) of the carbon nuclei.The elegant techniques outlined in this section are powerful
and often sufficient tools for many applications in basicchemical analysis and characterization of solid samples. Asshown in Figure 12a, a combination of high-power CWdecoupling, cross-polarization, and high-speed MAS, canrapidly yield one-dimensional solid-state spectra of com-pounds containing spin 1³2 nuclei of low natural abundancesuch as 13C, 15N, and 29Si, with sufficient spectral sensitivityand resolution. However, as in liquid-state NMR, moreadvanced multipulse and multidimensional techniques canbe utilized to perform amore detailed analysis of the structureand dynamics of a sample. In the following three sections, weprovide an overview of such techniques, with primaryemphasis on those methods that are easily implemented.
3104 Angew. Chem. Int. Ed. 2002, 41, 3096 ± 3129

REVIEWSSolid-State NMR Spectroscopy
3. Multidimensional NMR and MultipulseDecoupling
The majority of solid-state NMR experiments performedon organic or biological systems involve the detection of low-abundance nuclei such as 15N and 13C. One reason for this isthe fact that the homonuclear dipolar coupling can often beneglected because the probability of having two NMR-activenuclei next to each other is very low. In addition, the lowgyromagnetic ratios of these nuclei make the strengths of thehomonuclear couplings very small, even when the nuclei aredirectly bonded. MAS at moderate speeds (a few kHz) caneliminate their effects altogether. In contrast, as the homo-nuclear dipolar coupling between neighboring protons can bestrong (in the order of �100 kHz). Furthermore, becauseprotons have an abundance of almost 100%, MAS does littleto narrow the signal, as was shown in Section 2. Reasonablyhigh resolution is achieved in solid-state 1H NMR spectro-scopy through active pulse decoupling of the 1H spins duringsignal detection (to be precise: not during the actual samplingof a data point of the signal, but between different data pointsin the acquisition).[52±54] These experiments are often verydemanding on hardware. A simpler and often more reliableway of acquiring high-resolution spectra of protons is todetect the magnetization indirectly by using multidimensionalNMR spectroscopy. We first review the general acquisition ofmultidimensional spectra and then we describe methods ofmultipulse decoupling sequences that can be used in theindirect dimension of these experiments to minimize theeffects of the homonuclear coupling between abundant nuclei.
3.1. 2D NMR Spectroscopy: The WISE Experiment
Although 2D NMR spectroscopy has many differentapplications,[54±56] the basic form of all these experiments isessentially the same (Figure 13a). First, the magnetization isprepared in a state appropriate to whatever properties are tobe detected in the indirect dimension. For instance, to detect astandard spectrum of the chemical shifts in the indirectdimension, the preparation phase could involve a �/2 pulse orpossibly a CP sequence. Next, the magnetization is allowed toevolve for a time t1 under a specific NMR Hamiltonian. Forinstance, if one wishes the I spins in an I ± S spin system toevolve only under HII and HCS, then the S spins should bedecoupled to remove HIS (a � pulse in the S-spin channel att� 1³2t1 suffices for static samples). To evolve only under HII, a�-pulse or a train of �-pulses can be applied during t1 to createechoes that refocus HCS.Following the evolution period t1, an optional mixing pulse
(or a sequence of pulses) is used to prepare the magnetizationfor the final detection period t2 . As with the initial preparationperiod, the nature of the mixing period depends largely on thespectrum desired. In heteronuclear experiments, it is oftennecessary to transfer the magnetization from one set of spinsto another. For instance, in an experiment correlating 1H and13C chemical shifts, the mixing period might involve CP from
prepare evolve (t1) mix detect (t2)
a)
b)
2D Fourier
transform
ν
ν
1
2
Figure 13. a) Pulse sequence for 2D NMR experiments: The seconddimension is obtained by repeating the 1D experiment with sequential timeperiods t1 to stroboscopically detect the evolution of the prepared state.b) 2D Fourier transform: First a Fourier transform is performed on eachdirectly detected t2 signal, followed by a Fourier transform in the t1dimension. Since the evolution of the magnetization during t1 modulatesthe directly detected t2 signal, a double Fourier transform produces aspectrum in which the indirectly detected spectrum is correlated with thedirectly detected spectrum. (Reproduced from ref. [43], with permission.)
the 1H spins to the 13C spins. Once the mixing period iscomplete, the resulting magnetization is detected as usual inthe direct dimension t2 .A 2D free-induction decay is acquired by assembling
several 1D free-induction decays acquired at increasing timest1. The different 1D spectra are modulated in t1 based on theHamiltonians chosen during this time period. By performing aFourier transform in both dimensions t1 and t2 , a 2D spectrumis produced which correlates the interactions detected in theindirect dimension t1 with the interactions detected in thedirect dimension t2 (Figure 13b).[55]
A simple example of a useful 2D solid-state NMR experi-ment is the WIdeline SEparation (WISE) experiment (Fig-ure 14a).[57, 58] The 1H magnetization is initially rotated intothe xy plane by a �/2 pulse. During t1, the magnetization thenevolves under the 1H chemical shifts, the homonuclear dipolarcouplings, and the heteronuclear couplings to 13C nuclei(HCS�HII�HIS), after which it is transferred through CP toneighboring 13C nuclei for detection in t2. A 2D WISEspectrum correlates broad 1H resonances with the relativelynarrow resonances of the neighboring 13C nuclei under MAS(Figure 14b). In this manner, a normally unresolvable 1D1H NMR spectrum is separated into the contributions of
Angew. Chem. Int. Ed. 2002, 41, 3096 ± 3129 3105

REVIEWS A. Jerschow et al.
Figure 14. The WISE experiment: a) Pulse sequence for the correlation of1H and 13C resonances with WISE. b) 2D 1H± 13C WISE NMR spectrum ofa polystyrene-b-polydimethylsiloxane (PS-b-PDMS) block copolymer(1:1). The broad 1H signals correspond to rigid protons, whereas thenarrow 1H signals correspond to mobile protons, in which the homonucleardipolar coupling is partially averaged out. (Adapted from ref. [57], withpermission.)
various 1H sites in proximity to spectroscopically resolved 13Csites. Usually a short CP period assures that mainly nearby (orbonded) nuclear spins are correlated. The spectrum inFigure 14b is taken from a block copolymer of polystyreneand polydimethylsiloxane (1:1). The resonance line widths ofthe 1H sites in the polymer blend provide information aboutlocal molecular mobility of the different polymer components.The greater the mobility of a 1H nucleus, the narrower its1H NMR signal. Recently, this method has been used tocharacterize nanostructured inorganic ± organic compo-sites.[59, 60]
Although WISE does allow the separation and study ofbroad 1H resonances based on their coupling to nearby 13Cnuclei, the experiment does not achieve the original goal setforth in this section: to remove the 1H homonuclear couplingand to obtain a resolved 1H NMR spectrum of the chemicalshifts. In Section 3.2 we show that by using appropriatehomonuclear decoupling sequences during t1, the effects ofthe 1H ± 1H dipolar coupling can indeed be strongly reduced,while the chemical shift evolution is preserved. The applica-tion of these RF pulse sequences during t1 is notably lessdemanding than in experiments in which pulses and detectionperiods are interleaved.[52±54]
3.2. Homonuclear Dipolar Decoupling
In the previous sections, we discussed heteronuclear dipolardecoupling, in which the dipolar coupling between two sets ofspins I and S is removed by a strong RF field applied to the Ispins while the S spins evolve. The success of CW decouplingis a result of the form of HIS, which is proportional to IzSz.By constantly rotating the I spins around one axis with acontinuous RF field, the sign of the energy determined by IzSz
oscillates between positive and negative, producing a time-averaged value of zero. On the other hand, the homonucleardipolar coupling is proportional to 3 I1zI2z� (I1 ¥ I2). As, by
definition, the magnetization of the two nuclei cannot bemanipulated independently, a CW irradiation of the I spinsaround one axis will have no effect on the sign of the energies.In a more elaborate approach, one can show that if thedirection of the local field exerted by the spins on each other istoggled between all three axes, the effect of the couplingvanishes. This has been implemented early on in a multipulsesequence by Waugh et al. (WAHUHA or WHH-4).[61] Al-though this sequence is not used much any more, it still servesas a good illustrative example of how such techniques work,and how new ones can be designed.
3.2.1. WAHUHA
To understand this and similar sequences, it is helpful toconsider a rotation of the reference frame rather thatrotations of the spins. Although the rotations of, for example,z magnetization into x magnetization could be considered, themagnetization could also be kept constant and the referenceframe rotated in the opposite direction. In this way HII
becomes Hxx, Hyy, or Hzz, depending on how the referenceframe is rotated by the RF pulses (Figure 15a). Hxx, Hyy, andHzz are described in Equations (10)–(12)
Hxx � � d 1³2 (3cos2�� 1) (3 I1xI2x� (I1 ¥ I2)) (10)
Hyy � � d 1³2 (3cos2�� 1) (3 I1yI2y� (I1 ¥ I2)) (11)
Hzz � � d 1³2 (3cos2�� 1) (3 I1zI2z� (I1 ¥ I2)) (12)
2t t τ t t
x y -x-y
HII Hzz HxxHyy Hyy Hzz
HII = 0
x
y
zb)
a)
Figure 15. a) Pulse sequence for one cycle of the four-pulse WAHUHAdecoupling sequence, in which the magnetization is aligned sequentiallyalong the x, y, and z axes. b) The Lee ±Goldburg sequence is the continuousanalogue, in which the spins undergo rotation about an axis inclined at themagic angle in spin space (analogous to mechanical magic angle spinning inreal space).
Since the scalar product of the two angular momentumoperators I1 ¥ I2 can be defined as in Equation (13), the sumHxx�Hyy�Hzz� 0.
I1 ¥ I2 � I1xI2x� I1yI2y� I1zI2z (13)
Therefore, any pulse sequence that shifts the referenceframe along the x, y, and z axes (and with it the ™direction∫ of
3106 Angew. Chem. Int. Ed. 2002, 41, 3096 ± 3129

REVIEWSSolid-State NMR Spectroscopy
the local dipolar fields) for equal periods of time shouldsuccessfully eliminate the homonuclear dipolar coupling. Onthe other hand, the chemical shift in the usual laboratoryframe is proportional to Iz alone. When the reference frame isrotated sequentially along all three axes (during threeconsecutive time periods) the chemical shift will be propor-tional to (Ix� Iy� Iz)/3. The overall average chemical shiftevolution is then scaled by a factor of 1/
���3
relative to the
evolution without the decoupling sequence.[61] Thus, theWAHUHA sequence accomplishes our goal of eliminatingthe 1H ± 1H homonuclear dipolar coupling while still allowingthe magnetization to evolve under HCS.We could also consider allowing the reference frame to
continuously change from the x to the y and the z direction.This has been implemented in an early windowless sequencecalled Lee ±Goldburg decoupling.[62] The magnetization (orthe reference frame) is rotated about an effective magneticfield in the rotating frame that can be created by applying anoff-resonance RF irradiation. If the RF strength �RF isadjusted so that �RF�
���2
�� (��� frequency offset), an
effective RF field is produced in the rotating frame and isinclined at the magic angle with respect to z. The magnet-ization (or the reference frame) follows a conical path,crossing the z, y, and x axes at equal angles (Figure 15b). InMAS, the spatial averaging analogue of the above techniques,one would have exactly the same effect if sufficiently rapidsample reorientation were possible. There is one exception,though: the chemical shift is not scaled in MAS.
3.2.2. Decoupling Supercycles
Although the WAHUHA sequence is theoretically veryeffective in removing the homonuclear dipolar interaction,complications are often encountered in practice. Pulseimperfections and chemical-shift-offset effects can interferewith 1H homonuclear decoupling when using WAHUHA.These problems can be circumvented to a large extent by theuse of decoupling supercycles, which are repetitive imple-mentations of simple sequences such as WAHUHA, withspecific phase shifts of the RF pulses.[63, 64] For example, thesupercycle MREV-8[65, 66] is a composite sequence of twoWAHUHA pulse trains, with a 180� phase shift in two of thelast four pulses (Figure 16a). This sequence has been shown tobe much more robust against various pulse imperfections andfrequency-offset effects.[38] In addition toMREV-8, there existmore complex decoupling supercycles, including BR-24,[67]
BLEW-12,[68] CORY-24,[69] TREV-8,[70] and MSHOT.[71]
Often, symmetrization principles are used to improve theperformance of different sequences. In the continuous Lee ±Goldburg decoupling sequence mentioned above, the sym-metrization is implemented by switching the offset between��� and ��� and simultaneously changing the phase of theRF irradiation by 180� (Figure 16b). Errors in the averagingtrajectories are removed by this procedure (Figure 16c). Thismethod is called the frequency-switched Lee ±Goldburg (FS-LG) sequence and has been extremely useful in manyapplications.[72±79]
Figure 16. a) Pulse sequence for one cycle of the MREV-8 decouplingsequence; b) FS-LG decoupling; c) compensation for errors in the magnet-ization trajectories with the FS-LG sequence.
A complication that must be considered when using ahomonuclear decoupling sequence under MAS conditions isthe possible interference between sample spinning and multi-pulse decoupling. This affects the time-averaging of HII indifferent ways, in particular when the spinning speed is veryhigh.[75] Since this interference often degrades the effective-ness of multipulse decoupling sequences, it is advantageous tooptimize the multipulse sequence for MAS. First, the pulsecycles should be rotor-synchronized; that is, an integernumber of pulse trains should be applied per rotor cycle.Second, as many pulse cycles should be applied per rotorperiod as possible. However, these guidelines make theimplementation of long sequences (especially the 24-pulseBR-24 sequence) very difficult under fast MAS, in which therotor cycle can be as short as 30 �s. A powerful alternativeinvolves FS-LG:[72, 73] the full cycle time is typically of theorder of 10 ± 20 �s, which is still significantly shorter than therotor period at routine speeds (10 ± 20 kHz). In practice, FS-LG has proven to be a very effective decoupling sequence atdifferent spinning speeds. Lee ±Goldburg irradiation can alsobe used instead of a continuous-wave field during CP. Thisleads to homonuclear decoupling during the heteronuclearmagnetization transfer, which makes the transfer moreselective to directly bonded atoms. This has been exploitedto measure the distance between heteronuclei.[80, 81]
Promising new homonuclear decoupling schemes are beingdeveloped that are based on a new class of symmetry rules,allowing for a minimization of the RF ± rotation interfer-ence.[82]
3.2.3. Multiple-Quantum Spectroscopy
Although it is possible to remove the effects of thehomonuclear dipolar interaction by multipulse sequences, itis also possible to tailor the interaction Hamiltonian to aspecific form. The appropriate multipulse sequence can beapplied to create an effective double-quantum dipolar Ham-iltonian [Eq. (14)].[83]
Hdq � �d 1³2 (3cos2�� 1) (I1�I2�� I1-I2-)
Angew. Chem. Int. Ed. 2002, 41, 3096 ± 3129 3107
REVIEWS A. Jerschow et al.
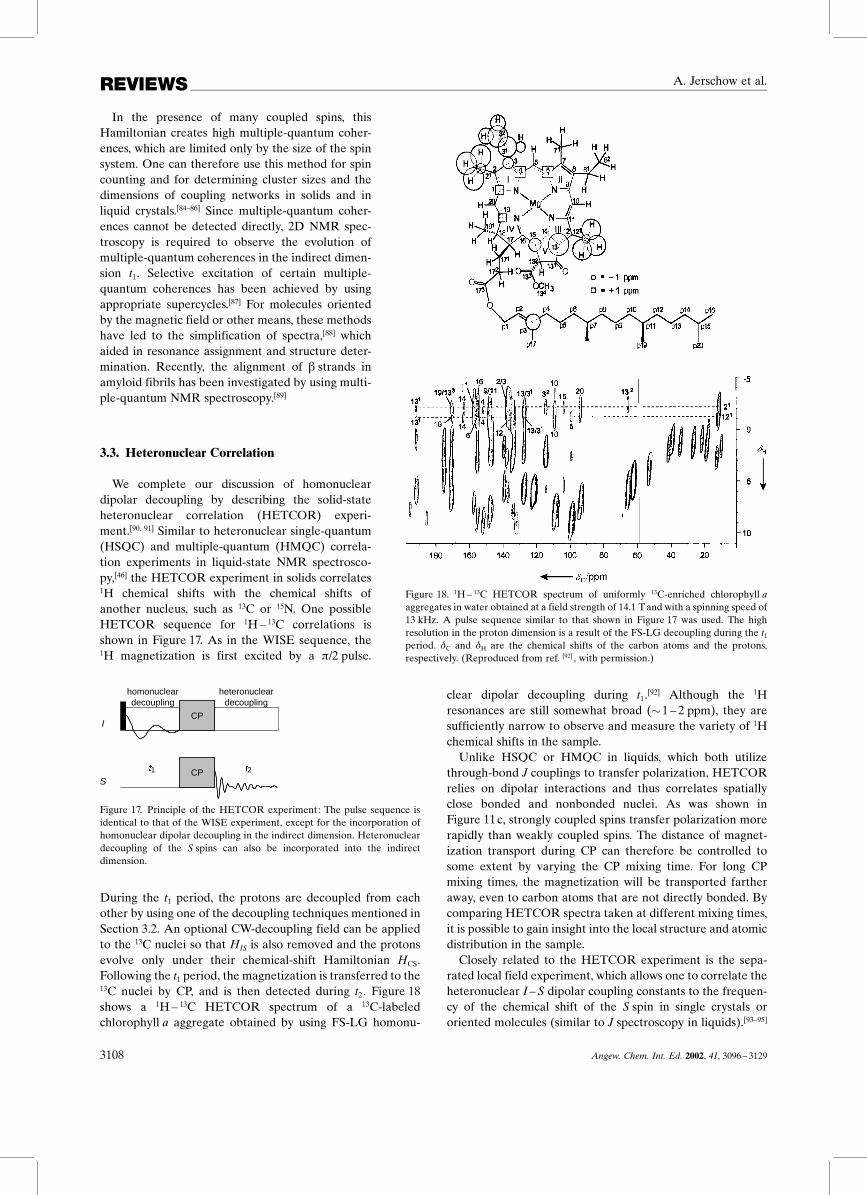
In the presence of many coupled spins, thisHamiltonian creates high multiple-quantum coher-ences, which are limited only by the size of the spinsystem. One can therefore use this method for spincounting and for determining cluster sizes and thedimensions of coupling networks in solids and inliquid crystals.[84±86] Since multiple-quantum coher-ences cannot be detected directly, 2D NMR spec-troscopy is required to observe the evolution ofmultiple-quantum coherences in the indirect dimen-sion t1. Selective excitation of certain multiple-quantum coherences has been achieved by usingappropriate supercycles.[87] For molecules orientedby the magnetic field or other means, these methodshave led to the simplification of spectra,[88] whichaided in resonance assignment and structure deter-mination. Recently, the alignment of � strands inamyloid fibrils has been investigated by using multi-ple-quantum NMR spectroscopy.[89]
3.3. Heteronuclear Correlation
We complete our discussion of homonucleardipolar decoupling by describing the solid-stateheteronuclear correlation (HETCOR) experi-ment.[90, 91] Similar to heteronuclear single-quantum(HSQC) and multiple-quantum (HMQC) correla-tion experiments in liquid-state NMR spectrosco-py,[46] the HETCOR experiment in solids correlates1H chemical shifts with the chemical shifts ofanother nucleus, such as 13C or 15N. One possibleHETCOR sequence for 1H ± 13C correlations isshown in Figure 17. As in the WISE sequence, the1H magnetization is first excited by a �/2 pulse.
homonuclear
decoupling
heteronuclear
decoupling
CP
CP
I
S
t1 t2
Figure 17. Principle of the HETCOR experiment: The pulse sequence isidentical to that of the WISE experiment, except for the incorporation ofhomonuclear dipolar decoupling in the indirect dimension. Heteronucleardecoupling of the S spins can also be incorporated into the indirectdimension.
During the t1 period, the protons are decoupled from eachother by using one of the decoupling techniques mentioned inSection 3.2. An optional CW-decoupling field can be appliedto the 13C nuclei so that HIS is also removed and the protonsevolve only under their chemical-shift Hamiltonian HCS.Following the t1 period, the magnetization is transferred to the13C nuclei by CP, and is then detected during t2. Figure 18shows a 1H ± 13C HETCOR spectrum of a 13C-labeledchlorophyll a aggregate obtained by using FS-LG homonu-
clear dipolar decoupling during t1.[92] Although the 1Hresonances are still somewhat broad (�1 ± 2 ppm), they aresufficiently narrow to observe and measure the variety of 1Hchemical shifts in the sample.Unlike HSQC or HMQC in liquids, which both utilize
through-bond J couplings to transfer polarization, HETCORrelies on dipolar interactions and thus correlates spatiallyclose bonded and nonbonded nuclei. As was shown inFigure 11c, strongly coupled spins transfer polarization morerapidly than weakly coupled spins. The distance of magnet-ization transport during CP can therefore be controlled tosome extent by varying the CP mixing time. For long CPmixing times, the magnetization will be transported fartheraway, even to carbon atoms that are not directly bonded. Bycomparing HETCOR spectra taken at different mixing times,it is possible to gain insight into the local structure and atomicdistribution in the sample.Closely related to the HETCOR experiment is the sepa-
rated local field experiment, which allows one to correlate theheteronuclear I ±S dipolar coupling constants to the frequen-cy of the chemical shift of the S spin in single crystals ororiented molecules (similar to J spectroscopy in liquids).[93±95]
3108 Angew. Chem. Int. Ed. 2002, 41, 3096 ± 3129
Figure 18. 1H ± 13C HETCOR spectrum of uniformly 13C-enriched chlorophyll aaggregates in water obtained at a field strength of 14.1 Tand with a spinning speed of13 kHz. A pulse sequence similar to that shown in Figure 17 was used. The highresolution in the proton dimension is a result of the FS-LG decoupling during the t1period. �C and �H are the chemical shifts of the carbon atoms and the protons,respectively. (Reproduced from ref. [92] , with permission.)

REVIEWSSolid-State NMR Spectroscopy
In this experiment, a � pulse acting on both the I and the Sspins at t� 1³2t1 refocuses the chemical shift as well as the CSA,while the homonuclear coupling is removed by one of thehomonuclear decoupling sequences. Therefore, only theheteronuclear I ± S coupling will be in effect during t1. Avariant of this technique, called PISEMA (polarizationinversion spin exchange at magic angle), has successfullybeen used to determine the secondary structures of solidproteins.[96±98] The concerted variations in the 13C and 15Nchemical shifts and the 1H ± 13C and 1H± 15N dipolar couplingscause the signals that arise from different residues to lie alongcircular paths, the form of which is characteristic of thesecondary structure.
3.4. Multipulse Heteronuclear Dipolar Decoupling
Before leaving the discussion of multipulse NMR spectros-copy, we return once again to the topic of heteronucleardipolar decoupling. We have limited our discussion ofheteronuclear decoupling to CW irradiation. However, thebeauty and efficiency of multipulse decoupling in thehomonuclear case raises the question as to whether anefficient multipulse sequence can be employed for hetero-nuclear decoupling. In liquids, a wealth of multipulse sequen-ces are available, including MLEV-16, WALTZ-16, andGARP.[35, 99±101] In the solid state, however, because of themagnitude of the coupling constants and interference effectsbetween heteronuclear and homonuclear couplings (seeSection 2.2), these sequences can be inferior to CW decou-pling. In addition, sign changes of the dipolar couplingconstants under MAS result in a partial cancellation of theeffects of these multipulse sequences.[43] The heteronucleardecoupling technique called two-pulse phase modulation(TPPM)[102] was shown to produce results superior to simpleCW decoupling, particularly under MAS. As shown inFigure 19 the TPPM sequence breaks the CW irradiation into
Figure 19. TPPM decoupling sequence: RF irradiation is applied contin-uously, with an alternating phase shift of ��/2 and ��/2, for every timeperiod �. The values of � and � are optimized before the experiment toachieve maximum decoupling efficiency.
a series of discrete time periods � (in the order of 3 ± 20 �s)during which the phase of the irradiation alternates between��/2 and ��/2. Typically, the values of � and � must beoptimized for a particular sample in order to produce thesmallest possible line widths. Figure 20 shows the spectra of13C-labeled calcium formate acquired under proton TPPM
1000 500 0 –500 –1000
a)
b)
ν /Hz
Figure 20. 13C CPMAS NMR spectrum of calcium formate: a) with TPPMdecoupling, and b) with CW decoupling. In both cases, the spinning speedwas 10.7 kHz. The splitting observed in a) is a result of the chemical shiftdifference of 80 Hz between the two crystallographically different 13C sitesin calcium formate. (Reproduced from ref. [102], with permission.)
decoupling (Figure 20a) and under CW decoupling (Fig-ure 20b). A typical � value is about 50�, and � is oftenadjusted to give a flip angle of approximately 150�. With theimproved resolution that results from TPPM decoupling, thedifference in chemical shifts (80 Hz) between the twocrystallographically non-equivalent 13C sites in calcium for-mate is resolved, which is not possible with standard CWdecoupling under the same conditions. Although a rigorousstudy of why this procedure improves heteronuclear decou-pling is still missing, it is believed that the favorable propertiesof the TPPM sequence are related to a facilitation of flip-floptransitions among the abundant proton nuclei, which assistthe heteronuclear decoupling in a process called ™self-decoupling∫.[103±106] The less stringent requirements for thedecoupling power of the TPPM sequence are particularlyapparent with high-speed MAS. As can be seen in the13C NMR spectrum of (non-13C-enriched) cyclosporin A (Fig-ure 21), line widths of 10 to 50 Hz can be obtainedand the vast majority of the resonances in the spectrum areresolved. Although alternative decoupling methods havebeen proposed,[107, 108] TPPM is still the most widely usedsequence.In this section, we showed that it is possible, through a
combination of multipulse homonuclear decoupling and 2DNMR spectroscopy, to obtain high-resolution solid-state1H NMR spectra. Phase modulation of heteronuclear decou-pling sequences can produce CP MAS spectra of rare spinswith a resolution close to that of liquid-state spectra. Theconcept of using a series of pulses to manipulate a Hamil-tonian has applications far beyond hetero- and homonucleardecoupling. As will be seen in Section 4, multipulse sequencesand 2D NMR spectroscopy can be used to derive informationfrom interactions (e.g. CSA or dipolar coupling) that arenormally removed under MAS.
Angew. Chem. Int. Ed. 2002, 41, 3096 ± 3129 3109

REVIEWS A. Jerschow et al.
20170
1560
NNH
HN
N
O
O
O
O
N
O
NN
NH
N
O
O
O
OHO
NH
N
O
O
δ /ppmC
Figure 21. 13C CP MAS NMR spectrum (125 MHz) of cyclosporin A (seestructure). The spectrum was measured with a spinning frequency of33.3 kHz using TPPM decoupling (�� 20�). With the combination of highspinning speeds and TPPM decoupling, the 13C line widths are 10 ± 50 Hz.(Courtesy of A. Lesage and L. Emsley).
4. Reintroducing Lost Hamiltonians
Section 2 of this review addressed the question of how toremove some of the undesirable effects of interactions thatare found in solid-state NMR spectroscopy, for example,dipolar coupling and CSA, by utilizing techniques such asMAS and high-power spin decoupling. The resulting spectrumhas a resolution close to that of a liquid-state NMR spectrum(e.g., see Figures 12a and 21). However, the signals producedby dipolar coupling and CSA provide information about theenvironment of the nuclei, and this information is lost byremoving these interactions through spinning and decoupling.In the following section, we discuss techniques that selectivelyreintroduce dipolar couplings and CSA under MAS tomeasure distances or establish correlations based on prox-imity. Although a vast number of methods can be used toreintroduce the dipolar coupling and the CSA, we discuss indetail only a limited number of techniques that serve both asrepresentative examples and as basic building blocks for morecomplicated experiments.
4.1. Distance Measurements in Solids
An integral part of structure determination in molecularsystems is the measurement of distances between atoms. In
liquid-state NMR spectroscopy, this is usually accomplishedthrough the measurement of cross-relaxation rates by nuclearOverhauser effect spectroscopy (NOESY).[46, 109] These relax-ation mechanisms can usually be neglected in solids, as themagnetization can be transferred more directly through thecoherent action of heteronuclear and homonuclear dipolarcouplings. As shown in Equation (2), the strength of thedipolar coupling between two nuclei is proportional to theinverse cube of the internuclear distance, which is the key toobtaining structural information. However, with the excep-tion of couplings that involve protons (e.g., 1H ± 1H or1H ± 13C), the effects of homonuclear and heteronucleardipolar coupling are often removed under MAS, since thespinning speed can routinely be made greater than themagnitude of the coupling constant. Thus, to measure dipolarcouplings while retaining the high resolution afforded byMAS, the couplings must be selectively reintroduced.
4.1.1. Heteronuclear Recoupling: REDOR
The heteronuclear dipolar Hamiltonian introduced inEquation (2) contains the orientation-dependent term(3cos2�� 1), and the spin-component-dependent term IzSz.In Section 3 we discussed how one can manipulate the spincomponent by CW and TPPM decoupling, or the spatialcomponent by MAS. Both methods lead to the removal of theeffects of this interaction. In the case of CW decoupling, it iseasy to turn this interaction on and off by controlling the RFfield. Recoupling a dipolar interaction that is removed byMAS is more complicated, as it is not practical to rapidly turnthe spinning on and off.[110] By properly manipulating the spincomponent of the dipolar Hamiltonian in synchrony with thesample rotation, however, it is possible to partially undo theeffect of MAS on the heteronuclear dipolar coupling.For a single crystal that moves along a conical path under
MAS, the value of the effective heteronuclear dipolarcoupling interaction determined by HIS changes both inintensity and sign (Figure 22a). Over a single rotation period,
RFt
0
0
π/ωr
BzC
N
HIS
HIS
a)
b)
Figure 22. Time-dependent behavior of the heteronuclear dipolar cou-pling: a) The time-dependent evolution ofHIS with MAS; as the integral ofthe dipolar coupling over a single rotor cycle is zero, the dipolar coupling iseffectively removed if the spinning speed is sufficiently high. Right: aninternuclear vector between a carbon nucleus and a nitrogen nucleustraverses a conical path. b) The time-dependent evolution ofHIS with MASwith two � pulses on the S spin per rotor cycle. Each � pulse reverses thesign of the dipolar coupling Hamiltonian, thus creating a time evolutionwhich no longer averages to zero. (Reproduced from ref. [43], withpermission.)
3110 Angew. Chem. Int. Ed. 2002, 41, 3096 ± 3129

REVIEWSSolid-State NMR Spectroscopy
the integrated magnitude of HIS is zero, so the dipolarcoupling is effectively removed under MAS. However, byapplying RF pulses at proper intervals, it is possible tointerfere with the trajectory of HIS so that the value of HIS isnot zero over one rotation period. By applying � pulses, theS spin magnetization is flipped (Sz� Sz) and the sign of HIS
changes. Once again we point out that it is not theHamiltonian that is directly manipulated but the spins. Theequivalent picture of rotating the reference frame instead ofthe spins leads to the description of an effective Hamiltonianthat changes sign. Indeed, by applying two � pulses perrotation period (Figure 22b), the evolution of HIS can bealtered in such a way that approximately 70% of theheteronuclear dipolar coupling is recoupled (i.e. the integrat-ed magnitude of HIS is 70% of its static value).This two-�-pulse technique, known as rotational echo
double resonance (REDOR),[111] is a powerful tool fordetermining dipolar couplings between two different nuclearspecies such as 13C and 15N. The pulse sequence for REDOR isshown in Figure 23. The 13C nuclei are subjected to a �/2 pulse
Figure 23. a) The REDOR pulse sequence: CP of the 13C nuclei isfollowed by a period � in which the 13C magnetization is dephased by theapplication of a series of rotor-synchronized pulses on the 15N magnet-ization, which recouple the 13C ± 15N dipolar coupling; the signal decaysfaster for larger coupling constants. b) Usually, the dephasing curves in thelower right hand corner are used, which show the amount of dephasingrelative to the initial signal intensity (�S/S0). Apart from a scaling factor,these curves are mirror images of the actual dephasing curves on the left.
or are polarized through CP from the protons. During �m, two15N � pulses are applied per rotation period, so that the 13C ±15N dipolar coupling is reintroduced. When a � pulse isapplied at t� 1³2�m in the 13C channel instead of the 15Nchannel, recoupling of heteronuclear coupling that involves athird nuclear species is avoided. The experiment is repeated inthe absence of the 15N pulses and the two spectra arecompared. Under the influence of the (recoupled) 13C ± 15Ndipolar coupling, the 13C magnetization decays as a result ofan averaging effect of the powder sample. By measuring thedecay of the magnetization with increasing �m, and dividingthe intensities by the signals of the ™natural∫ decay measured
without recoupling, a REDOR decay curve such as thatshown in Figure 23b can be created. Figure 24 shows anexperimental dephasing curve acquired for 13C,15N-labeled(10%) glycine. From the fitted line, a 13C ± 15N dipolar
Figure 24. Dephasing curve: 13C magnetization in 13C- and 15N-labeledglycine as a function of the length of the dephasing time �. �S/S0 (theREDOR difference) is the normalized difference between the 13C signalintensities with and without the 15N pulses. By fitting the decay of the 13Cmagnetization, the 13C ± 15N dipolar coupling was determined to be 195 Hz.
coupling constant of 195 Hz was obtained. FromEquation (3),the 15N ± 13C internuclear distance was found to be 2.47 ä. Asthe strength of the heteronuclear dipolar coupling approaches�25 Hz, it becomes very difficult to determine distances byusing REDOR. This corresponds to a 15N ± 13C distance of�5 ä and a 13C ± 31P distance of �7.5 ä. These distancesexceed those typically studied in liquid-state NMR spectros-copy[46, 109] and they can provide useful constraints in struc-tural studies of solids.When the dephasing curve is a sum of the individual curves
of several isolated spin pairs, a dipolar coupling constantspectrum can be obtained by using a so-called REDOR-transform.[112] Complications may arise when more than twospins are coupled. For this case, special techniques have beenproposed for obtaining individual the coupling con-stants.[113, 114] A careful study of the viability of distancemeasurements in multiple-spin systems of unknown structuresby REDOR-type recoupling techniques has been conductedby Fyfe and co-workers.[115, 116] F ± Si distances in zeolites havebeen measured in this way.[117]
Frequency-selective heteronuclear recoupling can be ach-ieved by using selective pulses on one of the channels, and hasbeen employed, for example, to measure 13C ± 15N distances inuniformly labeled proteins.[118, 119] REDOR is not the onlymethod to recouple heteronuclear dipolar interactions: othertechniques are based on windowless frequency-, phase-, andamplitude-modulated sequences,[120, 121] and, strictly speaking,CP is a type of heteronuclear recoupling sequence.
4.1.2. Homonuclear Recoupling: DRAMA and RR
Homonuclear dipolar recoupling can be accomplished inmuch the same way as heteronuclear dipolar recoupling–manipulation of the spin component of the dipolar Hamil-tonian influences the motional averaging produced by thespinning rotor. The main difference between heteronuclear
Angew. Chem. Int. Ed. 2002, 41, 3096 ± 3129 3111

REVIEWS A. Jerschow et al.
and homonuclear dipolar recoupling lies in the difficulty ofindividually addressing different homonuclear spins. In RE-DOR, one can repeatedly alternate the sign ofHIS by applyingpulses to either the I or the S spin. In a homonuclear spinsystem I1I2 the two spins have very similar resonancefrequencies, so any � pulse intended to change the sign ofI1z , will also result in changing the sign of I2z . Thus, theapplication of a � pulse has little effect on the overallevolution frequencies determined by HII.One alternative to using � pulses is to use �/2 pulses, which
change the orientation of the quantization axis of the dipolarcoupling. In Figure 22a, we showed that over a single rotationperiod, the spatial evolution of the dipolar Hamiltonian issuch that its average value is zero. However, by togglingbetween one or more of the Hamiltonians in Equations (10)–(12) during the rotation period by the application of�/2 pulses, the averaging produced by MAS can be interrupt-ed. One such technique is DRAMA (dipolar recovery at themagic angle).[122] During this sequence, two �/2 pulses perrotation period toggle the reference frame from the z axis tothe y axis and back again (Figure 25a). Under ideal con-ditions, the reference frame is directed along the z axis for halfof the rotation period (�� �r/2) and along the y axis for theother half. DRAMA recouples up to 45% of the homonucleardipolar coupling. Because the two-pulse sequence alsorecouples the CSA under MAS, a better implementation ofDRAMA also includes � pulses to refocus the CSA (Fig-ure 25b).
13
1
( )n
4
τ
τ
τ
τ
τ
τ
τ
τ
( /2)x –x x –x x –x x –x
–x xx –x x –x x –x
τr τr τr τr
τrτrτr
τr
τr
a)
b)
CP
CP
heteronuclear decoupling
π
( /2)xπ π xπ
H
C
Figure 25. a) Pulse sequence for one cycle of the DRAMA homonucleardipolar recoupling sequence consisting of �/2 pulses only. b) The partialrecoupling of the CSA that occurs under the sequence in a) can be removedapplying a � pulse at the end of each rotor cycle. �r�Rotor period.
Distance determination with DRAMA is carried out ingenerally the same way as with REDOR experiments. Duringthe mixing period �m, the magnetization of the recouplednuclei decays as a result of the dephasing effects of thehomonuclear dipolar coupling. For example, Figure 26 showssolid-state NMR spectra of [carbonyl-13C]polycarbonate ob-tained by using the pulse sequence in Figure 25b both with
20 10 0 -10 -20
rotorcycles
64
48
32
16
rotorcycles
64
48
32
16
rotorcycles
64
48
32
16
full echo (So)
dephased echo (S)
a)
b)
ν /kHz
Figure 26. Solid-state 13C NMR spectra of [13C-carbonyl]polycarbonate,obtained by using the DRAMA sequence in Figure 25b. a) Decay of the13C carbonyl resonance as a function of the mixing time �m. As �m increases,the 13C magnetization decays as a result of the reintroduction ofhomonuclear dipolar coupling between the chains. b) Experiment runwithout the DRAMA �/2 pulses. The observed decay is a result of thenatural relaxation of the magnetization. The spinning speed was 4167 Hz,which corresponds to 64 rotor cycles with a 15.4-ms mixing time.(Reproduced from ref. [123], with permission.)
(Figure 26a) and without (Figure 26b) the recoupling pulses.As the mixing time increases, the intensities of all of the 13Cresonances decrease because of recoupled 13C ± 13C dipolarcoupling (Figure 26a). This decay is substantially morepronounced than the natural decay of the magnetizationwhen the DRAMA recoupling pulses are removed (Fig-ure 26b). By measuring the decay of the 13C magnetization asa function of �m, it is possible to determine the 13C ± 13Cdipolar coupling constants and the corresponding internucleardistances. For the polycarbonate sample, the 13C ± 13C inter-nuclear distances were used to help determine a model forpolycarbonate chain packing in the solid state.[123]
Another example of a commonly used method for recou-pling homonuclear dipolar couplings under MAS is rotationalresonance or RR.[124] Unlike DRAMA, rotational resonance
3112 Angew. Chem. Int. Ed. 2002, 41, 3096 ± 3129

REVIEWSSolid-State NMR Spectroscopy
does not require the application of pulses to interrupt theeffect of the spinning rotor–in fact, rotational resonanceutilizes the spinning rotor to recouple two spins. As shown inSection 2.5, the homonuclear dipolar coupling contains the™flip-flop∫ interaction terms, I�1 I�2 � I�1 I�2 . When the chemicalshifts of two nuclei differ by a frequency that is larger than thedipolar coupling constant, the flip-flop term is suppressed as itis no longer possible for the spins to undergo an energy-conserving transfer of spin angular momentum. However,when the frequency of the MAS rotor �r is set such that it isequal to an integer multiple of the difference in isotropicchemical shifts ��iso of the two nuclear spins [Eq. (15)] thenthe homonuclear dipolar coupling is effectively recoupled.
��iso � n�r (15)
Although the origin of this process is complex, it cangenerally be understood by considering the rotor to be anadditional source of energy for the system to bridge theenergy gap between the nuclear spin transitions. Only whenthe rotor spins at one of the rotational resonance conditionsdictated by Equation (15) are the nuclei recoupled. Figure 27shows a 13C CPMAS spectrum of glycine taken at 12.0 and at16.6 kHz, which corresponds to off and on rotational reso-nance conditions (n� 1) in this case. The splitting in Fig-ure 27c at the rotational resonance condition is a result of theinteraction between the nuclei, and is indicative of thecoupling strength.
50100150200
a)
b)
c)
RR off
RR on
∆ = r
CO Cα
ωω
δ /ppm
Figure 27. a) CP MAS NMR spectra (125 MHz) of uniformly 13C-labeled(10%) glycine powder. The expansions show the two signals at rotorspinning speeds of 12kHz (b; RR off) and of 16.6 kHz (c; RR on), whichcorresponds to the n� 1 rotational resonance condition [Eq. (15)]. Thesignals are distorted as a result of the recoupling of HII. (Courtesy of R. H.Havlin).
Distance measurements using RR are accomplished in asomewhat different manner than the recoupling techniquesdiscussed so far. Figure 28a shows a general pulse sequencefor measuring 13C ± 13C homonuclear dipolar couplings by RR.The first step in RR is to set the spectrometer frequency to theresonance frequency of one of the two nuclei to be recoupled,and set the spinning speed so that it complies with the RRcondition of Equation (15). Following the initial CP step, the
m
CP
CP
1H
13C Inversion
π
heteronuclear decoupling
a)
b)
C
c)
RR on
RR off
0ms
1ms
3ms
5ms
7ms
/2
π
τ
mτ
/2 π/2
<I1z–I2z>
/ms
ν /kHz mτ /ms
C
<I1z–I2z>
Figure 28. The RR experiment: a) Following 1H CP, the 13C magnetizationis stored along the z axis and one of the resonances is inverted. Themagnetization then decays for a period �m, before it is returned to thexy plane for detection. b) RR NMR spectra of doubly-13C-labeled Znacetate. As the mixing time �m increases, the 13C nuclei have more time toexchange magnetization, to oscillate, and to decay back to equilibrium.C) The difference in the magnetization between the two peaks oscillatesunder RR conditions, but stays fairly constant just 100 Hz off the RRcondition. (Adapted from ref. [124], with permission.)
13C magnetization is returned to the z axis, at which point themagnetization of the on-resonance 13C nuclei is inverted byusing a long, low-power pulse. In the absence of any dipolarrecoupling, the inverted 13C nuclei slowly relax back to theirequilibrium state. However, when the 13C ± 13C nuclei arerecoupled by meeting the RR condition of Equation (15),they undergo energy-conserving flip-flop transitions, that is,the inverted spins flip up and the uninverted spins flop down.Often an oscillatory behavior of the magnetization is ob-served until the equilibrium is reached at which point themagnetization is equally distributed between the two spins. InFigure 28b a series of 13C RR spectra of a doubly 13C-labeledZn acetate is shown, acquired at different mixing times �m. Byobserving the oscillatory decay in the intensity of both peaks,it is possible to measure the magnitude of the dipolar couplingbetween the two 13C sites and thereby determine theinternuclear distance.Especially in weakly enriched or unlabeled compounds
with low natural abundance of the NMR-active isotopes (e.g.13C) it is difficult to observe the decaying signal that arisesfrom a spin pair, as the bulk of the signal comes from isolatedspins. To filter out these signals, a difference-spectroscopytechnique can be employed.[125] Only the non-spin-pairmagnetization survives long mixing times, and its spectrumcan be subtracted from those acquired with shorter mixingtimes. An alternative and often cleaner approach is to employ
Angew. Chem. Int. Ed. 2002, 41, 3096 ± 3129 3113

REVIEWS A. Jerschow et al.
double-quantum filters to specifically select the signals fromthe spin pairs.[126, 127]
In addition to DRAMA and RR, a plethora of homonu-clear recoupling sequences have been developed with acro-nyms such as HORROR,[128] DRAWS,[129] MELODRA-MA,[130] BABA,[131] RFDR,[132] and C7.[133] Each of thesesequences has certain strengths and weaknesses. The qualitycriteria for these sequences very much depend on the task athand. They include broadband behavior, selectivity, robust-ness with respect to pulse errors, CSA dependence, sensitivity,scaling of the recoupled interaction, angular dependence ofthe recoupling in a powder, and the ability to filter spin pairscleanly. A detailed evaluation of different homonuclearrecoupling techniques is given by Baldus et al,[134] Dusoldand Sebald,[135] as well as by Bennett, Griffin and Vega.[136] Inthis section, we have focused mainly on DRAMA and RR,merely because these were the first homonuclear recouplingtechniques, and serve as instructive and illustrative examples(in much the same way as WAHUHA does for homonucleardecoupling). In practice, however, the most commonly usedtechniques seem to be RFDR,[132] C7,[133] and their variants.Continuous developments are underway in this field, and theadvantages of a particular sequence over another is oftendifficult to rationalize theoretically. Recently, these sequenceswere classified according to certain symmetry principles,which helps to evaluate them and to choose the appropriateone for a particular application.[137] The valueof these classification schemes cannot beunderestimated, as they provide for the firsttime a uniform treatment of homo- andheteronuclear spin decoupling and recouplingunder spinning conditions, ranging from sim-ple CW decoupling and CP to more compli-cated experiments that involve RR as well asfrequency-switched and phase-modulated se-quences.[138]
4.2. Correlation Spectroscopy in the SolidState
We have discussed techniques that allow thereintroduction of the dipolar coupling for bothhomonuclear and heteronuclear systems andwe have outlined how these techniques can beused to determine internuclear distances. Inaddition, the reintroduction of the dipolarcoupling provides a magnetization exchangemechanism between spatially close nuclei thatcan be used for correlating their resonancefrequencies in the same way as in liquid-stateNMR techniques such as COSY, NOESY, orHMQC.[46, 55]
4.2.1. Heteronuclear CorrelationSpectroscopy
The concept of heteronuclear correlation insolid-state NMR spectroscopy was introduced
in Section 3 with a discussion of the 1H ± 13C HETCORexperiment. The relative simplicity of the HETCOR experi-ment is largely a consequence of the ability to transfer thepolarization between nuclei using CP. When transferring thepolarization between low-� nuclei such as 13C and 15N, CP maybecome difficult to optimize as the 13C ± 15N dipolar couplingis effectively removed under MAS, even when the Hart-mann ±Hahn condition is specifically adjusted for rapidspinning.[139, 140] An alternative and often more robust meansof producing heteronuclear dipolar correlation spectra is toutilize a REDOR-like recoupling (see Section 4.1) to ex-change the magnetization between the 13C and 15N spins.[141]
Figure 29a shows a possible pulse sequence that produces a13C ± 15N correlation spectrum in the solid state. The 13C nucleiare first polarized through CP from the protons, after which aREDOR sequence is used to recouple the 13C and 15N nuclei.Following the REDOR sequence, the 15N spins are allowed toevolve for a period t1 (the indirect dimension), before asecond REDOR sequence is used to return the magnetizationto the 13C spins for detection. Figures 29b, c show 2D 13C ± 15Ncorrelation spectra of a solid sample of formyl-Met-Leu-Pheobtained with such a sequence (Figure 29a) by using differentREDOR mixing times.[141] With short mixing times, themagnetization is transported over shorter distances, and thecorrelations are limited to neighboring atoms such as N ±C�and N±C� (Figure 29b). However, when the spins are
3114 Angew. Chem. Int. Ed. 2002, 41, 3096 ± 3129
Figure 29. a) Heteronuclear correlation of 13C and 15N nuclei by dipolar recoupling. The modifiedREDOR pulse sequence incorporates pulses on the 13C nuclei in addition to the standard pulses onthe 15N nuclei. b) 2D 13C ± 15N correlation spectrum of the tripeptide Formyl-Met-Leu-Pheobtained by using the pulse sequence in a). As a result of the short mixing time of 614.4 �s, the 13Cmagnetization does not spread much further than one bond, giving rise only to N±C� and N±C�
correlations. c) With a mixing time of 2.46 ms, the magnetization is transported further, thuspermitting the observation of N ±C� and N±C� correlations. (Adapted from ref. [141], withpermission.)

REVIEWSSolid-State NMR Spectroscopy
recoupled for longer periods (Figure 29c), the magnetizationhas more time to diffuse through the sample, thus leading tochemical shift correlations between more distant atoms (e.g.N ±C� and N±C�). This REDOR-type technique has recentlybeen shown to be very efficient in the heteronuclear magnet-ization transfer between 1H and 13C, and between 1H and15N.[142, 143] In the latter case, even the reverse transfer from 15Nto 1H has resulted in an improvement in sensitivity (analogousto inverse detection in liquid-state NMR spectroscopy.[46]
As indicated above, carefully optimized CP is another wayof performing heteronuclear correlation experiments betweenlow-� nuclei and has been particularly effective with largemagnetic fields. Remarkable 15N ± 13C correlation spectrahave been collected to assign the resonances of uniformlylabeled proteins and peptides in the solid state.[144±146]
4.2.2. Homonuclear Correlation Spectroscopy
Homonuclear 2D correlation spectra can be obtained insolids in a manner very similar to that used for heteronuclearcorrelations. Figure 30 outlines a general experimental pro-cedure for a 13C ± 13C homonuclear dipolar coupling correla-
heteronuclear decoupling
homonuclear
recoupling
CP1H
13C CP
t2t1
Figure 30. Typical pulse sequence for homonuclear correlation spectro-scopy with dipolar recoupling. Once the 13C magnetization has evolved inthe indirect dimension, a homonuclear recoupling sequence is used toexchange magnetization between neighboring 13C nuclear spins. The 13Cmagnetization is then detected in the direct dimension.
tion experiment in the solid state. The sequence begins againwith CP of the 13C nuclei from the protons. The 13C magnet-ization evolves during t1, followed by a homonuclear recou-pling sequence of the type introduced in Section 4.1 torecouple homonuclear dipolar coupling, thus allowing thetransfer of magnetization between neighboring 13C atoms.Finally, the 13C magnetization is detected in the directdimension t2. Figure 31 shows a 13C ± 13C chemical shiftcorrelation spectrum of uniformly-13C-labeled erythromycinA obtained by using the sequence shown in Figure 30. In theexperiment, the CMR7 method was used for 13C homonuclearrecoupling;[147] the method employs windowless rotor-synchronized � and 2� pulses. Resonance assignments be-come possible in uniformly and partially labeled proteins byusing homonuclear correlation experiments of very highquality.[148±152] As in the heteronuclear correlation spectra ofFigure 29b, c, the number of cross peaks in a homonuclearcorrelation spectrum can be controlled to some extent by theduration of the recoupling period. As the recoupling timeincreases, the magnetization diffuses further through thesample, thus leading to chemical shift correlations between anincreasing number of spins. Many more variants of theseexperiments exist, including 3D correlation, double-quantumfiltration, and double-quantum/single-quantum correlation
Figure 31. 2D 13C ± 13C correlation spectrum of uniformly 13C-enrichederythromycin A. The spectrum was measured at a field of 9.4 T with aspinning speed of 8 kHz. ACMR-7 sequence was used to recouple the 13C ±13C homonuclear dipolar coupling and create the 13C ± 13C correlationsshown in the spectrum. (Reproduced from ref. [147], with permission.)
experiments.[145, 153±155] This latter experiment has even beenapplied to protons for the investigation of the packing anddynamics of triphenylene and hexabenzocoronene deriva-tives.[156]
A pure recoupled double-quantum Hamiltonian can beused for spin-counting experiments under MAS (analogous tomultiple-quantum spectroscopy in the static case discussed inSection 3.2.3).[157] In a related example, the time evolution ofrecoupled double-quantum coherences has been used toprobe the torsion angles between different bonds.[158±160]
4.3. Recoupling away from the Magic Angle
Before leaving the topic of dipolar recoupling, we discuss amethod to recouple HII or HIS effectively. As previouslymentioned, it is not mechanically feasible to stop and restartthe spinning sufficiently rapidly to reinstate the dipolarcoupling under MAS. However, there is an alternativesolution: as the dipolar coupling is fully removed only at themagic angle, if the axis of the spinning rotor is rotated atanother angle (e.g., 0�, parallel to the external magnetic field)
Angew. Chem. Int. Ed. 2002, 41, 3096 ± 3129 3115

REVIEWS A. Jerschow et al.
the dipolar coupling emerges. The sample can then bereturned to the magic angle for detection. This technique isknown as switched-angle spinning or SAS.[161] Figure 32 showsa SAS spectrum of doubly 13C-labeled zinc acetate in which
-3.0 0.0 3.0
-10.0
0.0
10.0
a)
b)
t2
π π
rotor
hop
= 90° = 54.74°
t12
t12
CP
CP
heteronuclear
decoupling
heteronuclear
decoupling
13C
1H
/2 π/2
θθ
ν1 /kHz
ν2 /kHz
Figure 32. a) Pulse sequence for SAS. The experiment begins with therotor oriented 90� relative to the external magnetic field. After themagnetization is excited by a CP sequence, the 13C ± 13C homonucleardipolar coupling is detected in t1 using a � pulse to refocus the CSA. A�/2 pulse stores the magnetization along the z axis while the rotor axis isreoriented at the magic angle, at which point a second �/2 pulse returns themagnetization to the xy plane for detection in t2. b) 2D SAS NMRspectrum of uniformly 1,2-13C labeled (10%) zinc acetate. The 13C ± 13Chomonuclear dipolar coupling (displayed along the �1 axis) is attenuated bya factor of two because of the orientation of the rotor during t1. �2 is the(isotropic) chemical shift dimension. (Reproduced from ref. [161], withpermission.)
the 13C ± 13C homonuclear dipolar couplings are recoupled. Ifthe rotor is oriented along B0 during t1, the recouplingefficiency is 100%. Mechanical difficulties with suddenchanges in angle as well as difficulties in detecting themagnetization in this orientation make the perpendicularalignment of the rotor axis more practical. However, theefficiency in this case is only 50%. Spinning at different anglescan also be used to reintroduce the CSA, and to performisotropic/anisotropic correlation spectroscopy with quadru-polar nuclei. Although this approach requires the use ofspecialized probes and is mechanically very demanding, froma conceptual point of view these techniques offer significantlymore degrees of freedom than spinning around a singleaxis.[162] This fact is the driving force behind many newhardware and application developments in this field.
4.4. Reintroduction of the Chemical-Shift Anisotropy
Figure 5 showed a 13C static carbon spectrum of glycineobtained with heteronuclear spin decoupling. The spectrumhas two broad lines that correspond to the CSA of the �- andcarbonyl carbon atoms. The two signals are the direct result ofthe electronic structure around the nuclei, and thus contain a
wealth of localized informationabout the structure, dynamics,and orientation of the nucleuswith respect to its surroundingatoms. For example, the CSAfor the � carbon atom of mostamino acids in proteins andpeptides depends on the second-ary structure (�-helix versus �-sheet),[163, 164] as shown in Fig-ure 33 for valine.Although the measurement
of CSA signals from static sol-id-state NMR spectra is possiblein singly and some doubly la-beled samples, it is generally notfeasible in multispin systems,which result in overlappingCSA powder patterns. Furthermore, static spectra typicallyrequire extensive signal averaging to obtain the signalintensity and resolution required to determine the CSAsignal. In the following section we describe techniques thatcombine the high resolution of a MAS experiment with theanisotropic information content available from a staticsample, and therefore represent powerful demonstrations ofthe potential of solid-state NMR spectroscopy.
4.4.1. Spinning-Sideband Analysis
Figure 8 showed a series of MAS spectra taken at differentspinning speeds. With a decrease in the spinning speed, anincreasing number of spinning sidebands appear in thespectrum as a result of incomplete motional averaging ofthe CSA by the rotation. As the spinning speed approacheszero, the envelope of the spinning sidebands takes on theshape of the static powder pattern shown in Figure 8e. Indeed,the intensities of the spinning sidebands contain informationabout the CSA, and through an appropriate analysis one candetermine the three CSA parameters, �11, �22, and �33. TheHerzfeld ±Berger[45] method uses a series of precalculatedsurfaces to determine �11, �22, and �33 from the integratedintensities of a number of spinning sidebands. The method isconceptually straightforward and not technically demanding,requiring only the acquisition of a 1D MAS spectrum. Bytaking spectra at different spinning speeds and averaging thevalues of �11, �22, and �33 determined from the Herzfeld ±Berger surfaces, the accuracy of the method can be furtherenhanced. Figure 34 shows a spectrum of 15N-labeled adeno-sine monophosphate (AMP) acquired at a MAS speed of1105 Hz. The spinning speed for the spectrum in Figure 34 waschosen specifically to minimize sideband overlap, thus allow-ing the determination of the CSAs of all five 15NAMP sites byusing the Herzfeld ±Berger method.Under circumstances in which the spectra are too crowded
with sidebands to resolve the CSAs by this method, it isadvantageous to use 2D NMR spectroscopy to spread theoverlapping CSA patterns across a second dimension. Apowerful technique for this is PASS (phase-adjusted spinningsidebands), which allows one to separate spinning-sideband
3116 Angew. Chem. Int. Ed. 2002, 41, 3096 ± 3129
Figure 33. Simulated staticspectra of the �-carbon atomof a �-valine residue in a pep-tide or protein. The shape ofthe �-carbon CSA dependsstrongly on whether the resi-due is located within an �-helix(- - - -) or a �-sheet (––).
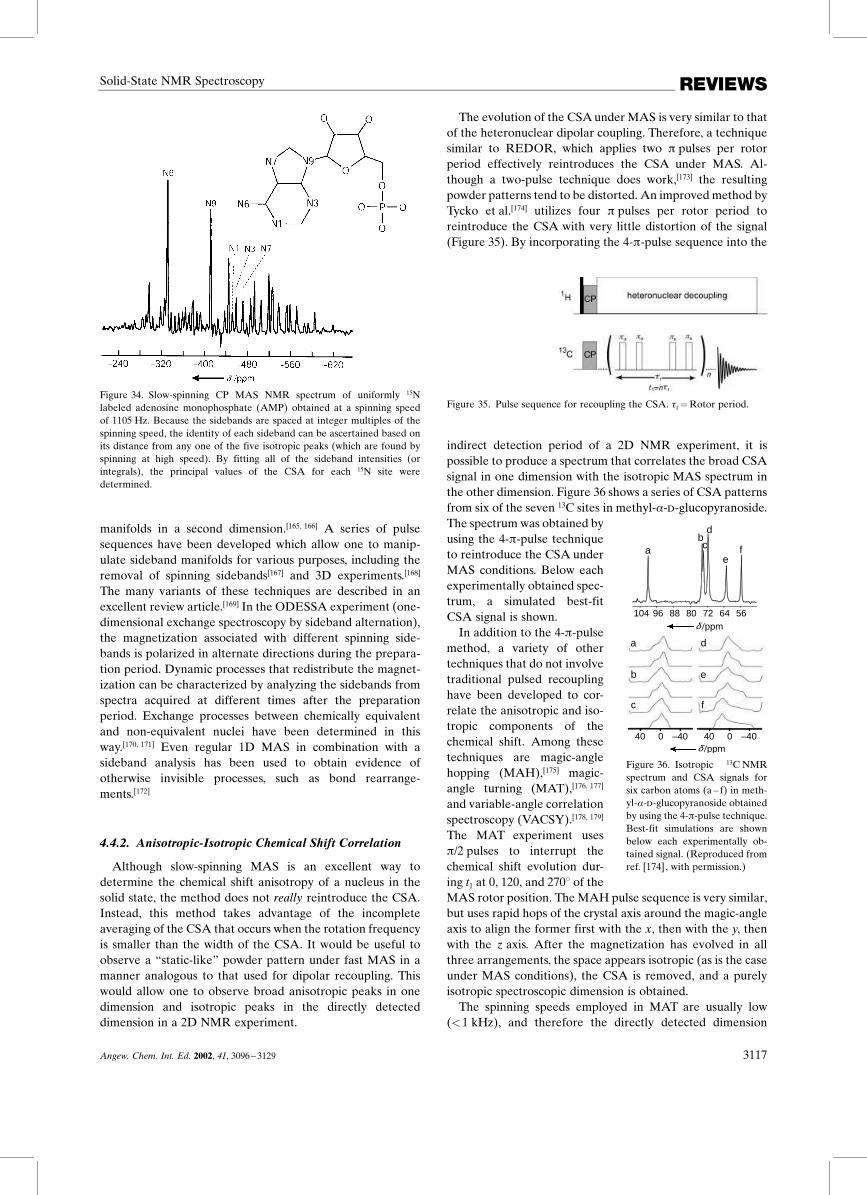
REVIEWSSolid-State NMR Spectroscopy
Figure 34. Slow-spinning CP MAS NMR spectrum of uniformly 15Nlabeled adenosine monophosphate (AMP) obtained at a spinning speedof 1105 Hz. Because the sidebands are spaced at integer multiples of thespinning speed, the identity of each sideband can be ascertained based onits distance from any one of the five isotropic peaks (which are found byspinning at high speed). By fitting all of the sideband intensities (orintegrals), the principal values of the CSA for each 15N site weredetermined.
manifolds in a second dimension.[165, 166] A series of pulsesequences have been developed which allow one to manip-ulate sideband manifolds for various purposes, including theremoval of spinning sidebands[167] and 3D experiments.[168]
The many variants of these techniques are described in anexcellent review article.[169] In the ODESSA experiment (one-dimensional exchange spectroscopy by sideband alternation),the magnetization associated with different spinning side-bands is polarized in alternate directions during the prepara-tion period. Dynamic processes that redistribute the magnet-ization can be characterized by analyzing the sidebands fromspectra acquired at different times after the preparationperiod. Exchange processes between chemically equivalentand non-equivalent nuclei have been determined in thisway.[170, 171] Even regular 1D MAS in combination with asideband analysis has been used to obtain evidence ofotherwise invisible processes, such as bond rearrange-ments.[172]
4.4.2. Anisotropic-Isotropic Chemical Shift Correlation
Although slow-spinning MAS is an excellent way todetermine the chemical shift anisotropy of a nucleus in thesolid state, the method does not really reintroduce the CSA.Instead, this method takes advantage of the incompleteaveraging of the CSA that occurs when the rotation frequencyis smaller than the width of the CSA. It would be useful toobserve a ™static-like∫ powder pattern under fast MAS in amanner analogous to that used for dipolar recoupling. Thiswould allow one to observe broad anisotropic peaks in onedimension and isotropic peaks in the directly detecteddimension in a 2D NMR experiment.
The evolution of the CSAunder MAS is very similar to thatof the heteronuclear dipolar coupling. Therefore, a techniquesimilar to REDOR, which applies two � pulses per rotorperiod effectively reintroduces the CSA under MAS. Al-though a two-pulse technique does work,[173] the resultingpowder patterns tend to be distorted. An improved method byTycko et al.[174] utilizes four � pulses per rotor period toreintroduce the CSA with very little distortion of the signal(Figure 35). By incorporating the 4-�-pulse sequence into the
Figure 35. Pulse sequence for recoupling the CSA. �r�Rotor period.
indirect detection period of a 2D NMR experiment, it ispossible to produce a spectrum that correlates the broad CSAsignal in one dimension with the isotropic MAS spectrum inthe other dimension. Figure 36 shows a series of CSA patternsfrom six of the seven 13C sites in methyl-�-�-glucopyranoside.The spectrum was obtained byusing the 4-�-pulse techniqueto reintroduce the CSA underMAS conditions. Below eachexperimentally obtained spec-trum, a simulated best-fitCSA signal is shown.In addition to the 4-�-pulse
method, a variety of othertechniques that do not involvetraditional pulsed recouplinghave been developed to cor-relate the anisotropic and iso-tropic components of thechemical shift. Among thesetechniques are magic-anglehopping (MAH),[175] magic-angle turning (MAT),[176, 177]
and variable-angle correlationspectroscopy (VACSY).[178, 179]
The MAT experiment uses�/2 pulses to interrupt thechemical shift evolution dur-ing t1 at 0, 120, and 270� of theMAS rotor position. The MAH pulse sequence is very similar,but uses rapid hops of the crystal axis around the magic-angleaxis to align the former first with the x, then with the y, thenwith the z axis. After the magnetization has evolved in allthree arrangements, the space appears isotropic (as is the caseunder MAS conditions), the CSA is removed, and a purelyisotropic spectroscopic dimension is obtained.The spinning speeds employed in MAT are usually low
(�1 kHz), and therefore the directly detected dimension
Angew. Chem. Int. Ed. 2002, 41, 3096 ± 3129 3117
40 0 –40 40 0 –40
a
b
c
d
e
f
abc
d
ef
δ /ppm
δ /ppm
104 96 88 80 72 64 56
Figure 36. Isotropic 13C NMRspectrum and CSA signals forsix carbon atoms (a ± f) in meth-yl-�-�-glucopyranoside obtainedby using the 4-�-pulse technique.Best-fit simulations are shownbelow each experimentally ob-tained signal. (Reproduced fromref. [174], with permission.)

REVIEWS A. Jerschow et al.
contains a wealth of spinning sidebands thatform the anisotropic dimension. The recentlyimproved MAT technique called FIREMATachieves higher sensitivity; and an isotropic/anisotropic correlation spectrum is shown forerythromycin A in Figure 37.[180]
Figure 38 shows a 2D isotropic/anisotropiccorrelation spectrum of �-tyrosine ¥HCl pro-duced with the VACSY method. In thisexperiment, the demands on hardware arelower than for the SAS experiment men-tioned previously, as the spinning angle isonly gradually changed between different 1Dexperiments (within seconds), rather thanduring the experiment (within a few milli-seconds). Nevertheless, the same comment asat the end of Section 4.4 applies: althoughMAH, MAT, and VACSY all have definiteadvantages over slow-spinning MAS or the4-�-pulse sequence, they are technologicallymore difficult to implement, and requirespecialized hardware. Since these methodsare potentially more versatile, further devel-opments in hardware can be expected.
4.5. J Coupling
As a final note in this section, we brieflyintroduce a Hamiltonian that has not yetplayed a role in this Review, the J-couplingHamiltonian. In some instances, the signals insolid-state NMR specta can be made suffi-ciently narrow by MAS so that J coupling canbe exploited for correlation spectroscopy(e.g. COSY and INADEQUATE) in muchthe same way as in liquid-state NMR spec-troscopy.[117, 181±183] The J coupling exhibits nospatial orientation dependence, and is there-fore not averaged out under MAS (weneglect here the anisotropic J-coupling con-tribution, which has a form similar to thedipolar coupling and is therefore removed byMAS).[184] In general, however, very strongdipolar coupling from abundant nuclei makethe MAS approach impractical to revealJ coupling. Recent technological break-throughs such as high-speed MAS and high-power proton homo- and heteronuclear de-coupling has made it possible to observe andutilize J coupling in polycrystalline samples.Figure 39 shows an INADEQUATE spec-trum[185] of a solid sample of �-tyrosine ¥HClacquired under MAS with high-power homo-nuclear proton decoupling. This experimenthas also been carried out on disorderedsolids.[186] High-power proton homodecou-pling sequences have been described whichuse heteronuclear J couplings in solids, anal-
3118 Angew. Chem. Int. Ed. 2002, 41, 3096 ± 3129
δ /ppm
Figure 37. Isotropic chemical shift ±CSA correlation spectrum of erythromycin A measuredwith the FIREMAT technique.[180] The slow MAS speed of 390 Hz produces a spinning-sidebandpattern that closely resembles a CSA powder signal in the directly observed dimension. Amultipulse sequence in the indirect dimension in combination with a special processing methodproduces isotropic lines.

REVIEWSSolid-State NMR Spectroscopy
Figure 38. 2D NMR correlation spectrum of the isotropic/anisotropicchemical shifts of �-tyrosine measured with VACSY. The isotropicprojection is shown with the assignment of the peaks. (Reproduced fromref. [178], with permission.)
Figure 39. Solid-state 2D INADEQUATE NMR spectrum (125 MHz) offully 13C-labeled �-tyrosine ¥HCl. �SQ and �DQ are the single-quantum andthe double-quantum frequencies, respectively, expressed in ppm. �DQ is thesum of the chemical shifts of the two correlated carbon atoms. The spinningspeed was 22 kHz, and the 1H decoupling field strength was 120 kHz.(Reproduced from ref. [43], with permission.)
ogous to the liquid-state HMQC experiment.[79, 187] In adifferent experiment, a specifically designed pulse sequencewas used during the mixing period of the sequence ofFigure 30 to eliminate all interactions except for the isotropic
J-coupling interaction. In this way, 2D through-bond homo-nuclear correlation spectra have been obtained.[188±190] Thesetechniques provide a convenient additional and complemen-tary assignment tool, as they only indicate intramolecularthrough-bond coupling, as opposed to assignment strategiesbased on dipolar-coupling approaches.In Sections 2 and 3, we discussed the interactions in solid-
state NMR spectroscopy that prevent the acquisition of high-resolution NMR spectra as well as ways to counteract theeffects of these interactions. Although dipolar coupling, CSA,and quadrupolar coupling (see Section 5) result in poorerresolution in the spectra, they contain useful structuralinformation that is often difficult to obtain from liquid-stateNMR spectroscopy. The techniques presented in this sectionprovide a means to combine the advantages of high-resolutionNMR spectroscopy with the ability to extract structuralinformation contained in anisotropic interactions such as CSAand dipolar coupling.
5. Quadrupolar Nuclei
So far, our discussion of solid-state NMR spectroscopy hasbeen restricted to spin 1³2 nuclei such as 1H, 13C, 15N, 31P, and29Si. We now extend our survey of solid-state NMR spectro-scopy to include the majority of isotopes found in the periodictable, that is, those with spin I� 1³2. Although these quad-rupolar nuclei possess the same set of basic interactions thatwere introduced in Section 2 (e.g. the CSA, dipolar coupling,etc.), there are two principal differences between spin 1³2nuclei and those with spin I� 1³2 : 1) For quadrupolar nuclei,the allowed values of the nuclear spin quantum numbermI areno longer simply � 1³2 and � 1³2. For a spin 1 nucleus (e.g. 2Hand 14N), the allowed values formI are �1, 0, and �1; thus, inthe presence of an external magnetic field, spin1 nuclei havethree energy levels and two transitions. Likewise, a spin 3³2nucleus (e.g. 23Na and 87Rb) has four spins states with mI�� 3³2, � 1³2, 1³2, and 3³2. In general, there are 2I� 1 spin states and2I directly detectable transitions. 2) Quadrupolar nucleipossess a nonspherical charge distribution that can couple toelectric-field gradients present in most solid-state materi-als.[191] This quadrupolar coupling has an enormous effect onthe observed NMR spectrum (as seen below).
5.1. Spin 1 Nuclei
Although spin 1 nuclei are much more rare than half-integer quadrupolar nuclei, the literature on spin 1 nuclei isextensive, mainly because of the usefulness of deuterium (2H)in NMR spectroscopy.[22, 192±194] Based on its small electroncloud and relatively low gyromagnetic ratio (� 1³7 that of 1H),and consequently a small chemical shift range of �3 ± 4 ppmand relatively weak dipolar couplings, one might expect static2H NMR line widths to be narrow. Thus, it may be somewhatsurprising to learn that static 2H NMR line widths routinelyexceed 100 kHz, as shown in the spectrum of CDI3 inFigure 40. Quadrupolar interactions are at the origin of thisvery broad line.
Angew. Chem. Int. Ed. 2002, 41, 3096 ± 3129 3119

REVIEWS A. Jerschow et al.
–200 0 200
a)
b)
CDI3
ν /kHz
Figure 40. Static 2H NMR spectrum of CDI3: a) experimentally obtainedspectrum; b) simulated spectrum based on the quadrupolar couplingconstant derived from the spectrum in a); The qaudrupolar couplingfrequency, �Q was determined to be 167.5 kHz, and the anisotropy to be 0.(Adapted from ref. [257], with permission.)
To understand the 2H quadrupolar signal displayed inFigure 40, it is helpful to examine the effect of the quad-rupolar coupling on the 2H Zeeman energy levels. In Fig-ure 41a, we show the energy levels of a spin 1 nucleus in an
Figure 41. Energy-level diagram for spin 1 nuclei subject to a) the Zeemaninteraction and b) to both the Zeeman and the first-order quadrupolarinteractions. The splitting shown in b) is a result of the first-orderquadrupolar coupling at one particular crystal orientation.
external magnetic field with no quadrupolar coupling present.Both the �10 and 0� 1 transitions have the sameresonance frequency as the energy differences between thespin states are identical. Figure 41b shows the same threeenergy levels under the influence of the first-order quadru-polar Hamiltonian H�1�
Q (the term ™first order∫ is explainedlater). Whereas the mI��1 and the mI��1 spin statesdecrease in energy upon the addition of H�1�
Q , the mI� 0 spinstate increases in energy. As a result, the �10 and the0� 1 transitions differ in energy, and therefore resonate attwo different frequencies. The difference between the fre-quencies is proportional to the first-order quadrupolarcoupling constant �Q [Eq. (16)].
�Q � 3eq eQ
2I �2I � 1��h (16)
In Equation (16), e is the electron charge, eq is thez component of the electric field gradient felt at the nucleus,
and Q is the nuclear electric quadrupole moment. Theconstant Q is a nuclear property (like �) that describes thestrength with which a quadrupolar nucleus couples to anelectric-field gradient at the nucleus. For example, deuteriumhas a relatively small nuclear electric quadrupole moment(Q� 3� 10�31 m2), and typically quadrupolar coupling con-stants are on the order of 100 ± 300 kHz.[192] On the otherhand, Q� 2� 10�30 m2 for 14N (spin 1), and typical quadru-polar coupling constants are �10 times higher (1 ± 5 MHz).The origin of the nuclear electric quadrupole moment (anasymmetric charge distribution) is simply the fact that anucleus of uniform shape does not necessarily have asymmetric charge distribution, depending on the number ofprotons and neutrons. Under the influence of the electrostaticinteraction, the nucleus arranges itself within an asymmetricelectron cloud, which in turn influences the NMR-activeenergy transitions.As is also seen in Figure 41b, the effect of the first-order
quadrupolar coupling is to produce a quadrupolar splittingwhose magnitude is dictated by�Q. However, in Figure 40, wesee not only a splitting, but rather a signal that stronglyresembles the dipolar Pake pattern shown in Figure 4. This isbecause the splitting caused by the first-order quadrupolarcoupling depends on the orientation of the molecule withrespect to the magnetic field (in the same way as the CSA and,in the case of cylindrical symmetry, the dipolar coupling; for2H, this is very often a good approximation because of theaxially symmetrical C�H bonds). Therefore, just as the widthof the Pake pattern of Figure 4 was an exact measure of thedipolar coupling constant d, the width of the 2H Pake patternis a measure of the quadrupolar coupling constant �Q.Since the orientational dependence of the first-order
quadrupolar coupling is the same as for the CSA it comes asno surprise that this coupling can (in principle) be eliminatedby MAS. This is exactly the case in Figure 42a, which shows astatic 2H NMR spectrum of a mixture of deuterated hexa-methylbenzene and deuterated ferrocene; the spectrumconsists of two overlapping Pake patterns, which correspondto the two deuterium environments. MAS (Figure 42b) resultsin the quadrupolar line width being reduced to a series ofspinning sidebands; upon closer inspection of the residualisotropic signals, it is possible to discern the isotropic chemicalshifts of the two 2H sites. For completeness, we mention thatthe first high-resolution 2H NMR spectrum of a solid wasobtained by exciting the double-quantum transition betweenthe mI��1 and �1 states and measuring it indirectly.[195] Asseen in Figure 41b the energy splitting between these twostates is not affected by the first-order quadrupolar coupling,and is therefore independent of the orientation of theprincipal axes of the quadrupolar interaction. Incidentally,this transition was also successfully exploited for ™double-quantum decoupling∫ of 2H from 1H nuclei. This method wasused to acquire early high-resolution 1H NMR spectra ofpartly deuterated solids.[196]
Although MAS can be quite effective in reducing thedeuterium quadrupolar line width, 2H NMR is often per-formed on static samples. The reasons for this choice arethreefold: 1) In contrast to the vast amount of time necessaryto acquire a static spectrum of a spin 1³2 nucleus, a static
3120 Angew. Chem. Int. Ed. 2002, 41, 3096 ± 3129

REVIEWSSolid-State NMR Spectroscopy
a)
b)
c)
Figure 42. 2H NMR spectra of a solid mixture of deuterated ferrocene anddeuterated hexamethylbenzene, under: a) static conditions, b) magic-anglespinning. c) Expansion of the center band of b), which shows tworesonances corresponding to the two deuterium sites. (Adapted fromref. [258], with permission.)
quadrupolar spectrum can be obtained more rapidly becausethe quadrupolar coupling greatly facilitates the relaxation ofquadrupolar nuclei, thus reducing the time required for themagnetization to relax back to thermal equilibrium. 2) The 2Hquadrupolar coupling is a sensitive measure of internalmolecular motion.[193, 197] As the quadrupolar coupling de-pends on the molecular orientation with respect to themagnetic field, a reorientation of the molecule reduces thewidth and shape of a static 2H resonance line. Figure 43 showsa series of 2H NMR spectra of deuterated DMPC in a lipidbilayer. By adding different species to the bilayer (such ascholesterol or cytochrome c oxidase) it is possible to alter themobility of the deuterated hydrophobic lipid tails. The narrowquadrupolar signals in Figure 43b ± d indicate that the addedcompounds increase the mobility of the lipid tails, whereas theaddition of cholesterol to the bilayer (Figure 43e) decreasesthe lipid mobility. 3) Static 2H NMR spectroscopy is also apowerful tool for studying molecular orientation and or-der.[192, 198, 199] Solid-state 2H NMR spectroscopy has also beenshown to be an excellent probe for paramagnetic reactioncenters in proteins.[200, 201]
Figure 44a shows the sequence for a 2D exchange experi-ment. The spins are allowed to evolve with their characteristicresonance frequencies during t1. Another �/2 pulse stores themagnetization along the z direction. During the mixing time�m, the nuclei may reorient or chemically exchange, and afterthe final �/2 pulse the spins evolve with either the same or–ifexchange occurred–a different resonance frequency. In theabsence of exchange, a 2D spectrum acquired in this way willdisplay the quadrupolar Pake pattern along its diagonal(similar to that shown in Figure 40). If reorientation occurredduring �m, the resonance frequency of a particular spinchanges to some new location in the Pake pattern, and off-diagonal peaks start to appear (Figure 44b). In this example,
Figure 43. 2H NMR spectra of [D3]DMPC in the presence of variousadditives: a) excess water (30 �C); b) cytochrome c oxidase (67 wt%);c) sarcoplasmic reticulum adenosinetriphosphatase (67 wt%); d) beefbrain myelin proteolipid apoprotein (N2; 67 wt%); e) cholesterol(33 wt%). [D3]DMPC� 1-myristoyl-2(14,14,14-trideutero)myristoyl-sn-glycero-3-phosphocholine. (Adapted from ref. [197], with permission.)
Figure 44. a) Pulse sequence for 2D exchange experiments, equallyapplicable to spin 1³2 and spin 1 nuclei. b) Left: 2D exchange spectrum of�-poly(vinylidene fluoride) at 370 K (�m� 200 ms); right: contour plot ofthe spectrum. (Adapted from ref. [202], with permission).
reorientation angle distributions were determined for the C ±2H moieties in �-poly(vinylidene fluoride).[202]
Spin 1³2 nuclei have also been extensively studied by 2Dexchange experiments: exchange and reorientation processesas well as local order have been investigated by correlatingCSA and dipolar powder patterns with pulse sequences of thebasic type shown in Figure 44a.[54, 203, 204] Further modifica-tions of these techniques include improved exchange experi-ments for spinning samples[205] and variable spinning-angleexchange experiments.[206]
Thus far, our discussion has been limited to 2H NMRspectroscopy. The value of �Q for the deuterium nucleus ismuch smaller than that of other quadrupolar nuclei, and forthis reason we have not alluded to the existence of a second,
Angew. Chem. Int. Ed. 2002, 41, 3096 ± 3129 3121

REVIEWS A. Jerschow et al.
more complex quadrupolar term–the second-order quadru-polar coupling. In every 2H spectrum that was shown above,the second-order quadrupolar coupling was present, butrelatively small in size. When the quadrupolar coupling isvery large, as it is for 14N, the second-order quadrupolarcoupling can have a significant effect on the observed signal.Figure 45 shows the effect of the second-order quadrupolarcoupling on the energy levels of spin 1 and spin 3³2 nuclei,which causes an additional asymmetric line broadening. Aswe will show in Section 5.2, even when the first-orderquadrupolar coupling is completely removed, the second-order quadrupolar Hamiltonian can still be large enough tomake the spectrum uninterpretable.
Figure 45. Effect of the Zeeman splitting and first- and second-orderquadrupolar coupling on the energy levels of a) spin 1 and b) spin 3/2nuclei.
5.2. Nuclei with Spin I� 1
With the exception of 10B (I� 3), 50V (I� 6), and 177Lu(I� 7), all nuclei with spin I� 1 are half-integer quadrupolarnuclei. Nuclei with half-integer spins behave quite differentlyfrom nuclei with integer spins. The reason for this difference ismade clear by examining the effect that the quadrupolarHamiltonian has on the energy levels of a half-integerquadrupolar nucleus. Figure 45b shows the energy levels fora spin 3³2 nucleus a) without any quadrupolar coupling,b) under the influence of the first order quadrupolar coupling,and c) including the second-order quadrupolar coupling. Thefirst-order quadrupolar Hamiltonian shifts the mI�� 1³2 andthe mI� 1³2 energy levels by the same amount in the samedirection. Thus, the resonance frequency of the � 1³2� 1³2transition, known as the central transition, is unchanged by
the first-order quadrupolar Hamiltonian. In contrast, theresonance frequencies of the � 3³2� 1³2 and � 1³23³2 tran-sitions, known as the satellite transitions, are each shifted byan amount proportional to ��1�
Q , the first-order quadrupolarcoupling constant. The net result of H�1�
Q on a half-integerquadrupolar nucleus is to shift and broaden (in a powderedsolid) the resonances that result from the satellite transitionssubstantially. Therefore, in a standard solid-state NMR experi-ment performed at the frequency of the central transition, thesatellite transitions are seldom observed.[207] Yet, because thecentral transition is still broadened by the second-orderquadrupolar coupling, the resulting line width can be quitelarge, as seen in the solid-state 23Na NMR spectrum of sodiumoxalate in Figure 46b. In some cases, the second-order signalis impossible to detect by traditional methods.[208]
Figure 46. Solid-state 23Na NMR spectrum (105 MHz) of sodium oxalateacquired a) without any sample spinning, and b) with spinning at 4 kHz atthe magic angle. (Adapted from ref. [213], with permission.)
A full mathematical description of the second-order quad-rupolar Hamiltonian H�2�
Q can be found in the litera-ture.[207, 209, 210] Here, we just point out two important featuresof H�2�
Q that are relevant to the study of half-integerquadrupolar nuclei by solid-state NMR spectroscopy. First,H�2�
Q has associated with it a coupling constant ��2�Q [Eq. (17),
�0�Larmor frequency].
��2�Q � ���1�
Q �22�0
(17)
From Equation (17) it becomes clear why the effects of thesecond-order quadrupolar coupling are rarely observed in2H NMR spectroscopy. Even if ��1�
Q is as large as 300 kHz, themagnitude of ��2�
Q in a 2.3-T magnetic field is only �3 kHz.Equation (17) also provides a major motivation for studyingquadrupolar nuclei at high fields: the size of��2�
Q can always bedecreased by increasing B0 .Another important feature of the second-order quadrupo-
lar Hamiltonian H�2�Q is its orientation dependence, which is
more complicated than that of the first-order HamiltoniansH�1�
Q addressed thus far. There are three orientational termsassociated with H�2�
Q ; these terms correspond mathematically
3122 Angew. Chem. Int. Ed. 2002, 41, 3096 ± 3129

REVIEWSSolid-State NMR Spectroscopy
to the zeroth- [Eq. (18)], second- [Eq. (19)], and fourth-order[Eq. (20)] Legendre polynomials:[162, 211]
P0 (cos�) � 1 (18)
P2 (cos�) � � 1³2 (3 cos2�� 1) (19)
P4 (cos�) � 1³8(3� 30cos2�� 35cos4�) (20)
Although these equations are appropriate only for axiallysymmetric quadrupolar couplings, the following qualitativediscussion is equally applicable to the general case. Thezeroeth-order term is a scalar, and just like the isotropiccomponent of the chemical shift, is not dependent on �.Indeed, one of the effects of the second-order quadrupolarcoupling is to produce an isotropic quadrupolar shift thatcannot be removed. This shift is also observed in liquids inwhich molecular reorientation is not too rapid.[212] Thesecond-order term of H�2�
Q is dependent on (3cos2�� 1) andcan therefore be removed by MAS. Figure 46 shows23Na NMR spectra of solid polycrystalline sodium oxalate;the spectra were obtained with (Figure 46b) and withoutMAS (Figure 46a). Although there is some narrowing, theeffect is not nearly as dramatic as that of spin 1³2 nuclei. Theprimary reason that the line broadening does not disappearwith rotation at the magic angle is that the terms P2 (cos�) andP4 (cos�) equal zero at different values of � (Figure 47).Therefore, to remove the second-order quadrupolar couplingand produce a narrow line, a technique other than MAS mustbe employed. For many years, research in high-resolutionsolid-state NMR spectroscopy was focused on this challenge.
0 10 20 30 40 50 60 70 80 90-0.5
0
0.5
1
P2(cos )
30.56o 70.12o54.74o
θ
θ
/
P4(cos )θ
°
Figure 47. Plot of the second- and fourth-order Legendre polynomialsP2 (cos�) and P4 (cos�), respectively, as a function of �. P2 (cos�)� 0 at themagic angle of 54.74� ; P4 (cos�)� 0 at angles of 30.56� and 70.12�.
5.2.2. Double Rotation
A number of techniques have been developed to counterthe effects of the second-order quadrupolar Hamiltonian inorder to produce sharp NMR spectra of quadrupolar nuclei.The first technique that we discuss is conceptually simple butchallenging to implement experimentally: to eliminate theCSA in a powdered sample, it is common practice to spin thesample at an angle of 54.74� relative to the magnetic field toaverage the P2 (cos�) spatial term of the CSA Hamiltonian to
zero. Similarly, double rotation (DOR)[213±215] eliminates thesecond-order quadrupolar coupling by spinning at the anglesof 54.74� and 30.56� simultaneously to remove the P2 (cos�)and P4 (cos�) spatial terms of H�2�
Q . This is accomplished byusing the ™rotor in a rotor∫ design shown in Figure 48, which
Figure 48. ™Rotor-in-a-rotor∫ design for an NMR probe for DOR experi-ments. The outer rotor spins about an axis oriented at the magic angle,while the inner rotor spins about an axis oriented at 30.56� with respect tothe outer axis.
allows the simultaneous rotation of the sample about twodifferent axes. Under DOR conditions, all the second-orderquadrupolar coupling is removed, except for its isotropiccomponent, thus leaving a sharp isotropic peak flanked by aseries of sidebands spaced at integer multiples of the outerrotor frequency. Figure 49 shows 23Na DOR NMR spectra
Figure 49. 23Na DORNMR spectra (105 MHz) of sodium oxalate acquiredat outer-rotor spinning speeds of a) 320 Hz, b) 440 Hz, c) 640 Hz, andd) 850 Hz. (Adapted from ref. [259], with permission.)
of sodium oxalate obtained at various outer rotor speeds.When compared to the 23Na NMR spectra of sodium oxalatein Figures 46a, b, the high resolution that is made possiblethrough DOR is quite dramatic, and these experiments werethe first to open the door to truly high-resolution NMRspectroscopy of quadrupolar nuclei in the solid state.[216, 217] Ina method similar to the sideband analysis introduced byHerzfeld and Berger (see Section 4.4.1) one can obtaininformation about the strength of the quadrupolar couplingand asymmetry parameters from the sidebands.[218]
Angew. Chem. Int. Ed. 2002, 41, 3096 ± 3129 3123

REVIEWS A. Jerschow et al.
5.2.3. Dynamic-Angle Spinning
Dynamic-angle spinning (DAS) is an alternative techniquefor removing the second-order quadrupolar coupling.[219, 220]
Like DOR, DAS seeks to remove the second-order quad-rupolar coupling by spinning the sample at multiple angles.However, DAS spins sequentially at two different anglesrather than simultaneously.As an example, let us assume that a powdered sample of a
sodium salt is spun about an axis inclined at an angle of 37.38�with respect to the static magnetic field. As the centraltransition magnetization of the 23Na nuclei evolves following a�/2 pulse, the nuclei in different crystal orientations precess atdifferent frequencies, depending on the value of H�2�
Q . As aresult, one can expect quadrupolar signals similar to thoseshown in Figure 50a. When the same sample is spun at an
Figure 50. Simulated second-order quadrupolar powder patterns for thecentral transition of a spin I� 3/2 nucleus spinning at an angle of 37.38� (a)and 79.19� (b). is the anisotropy of the quadrupolar coupling. (Adaptedfrom ref. [218], with permission.)
angle of 79.19�, the second-order quadrupolar signals looklike those shown in Figure 50b. It is interesting to see thatthese two sets of simulated spectra are exact mirror images ofeach other. This means thatH�2�
Q for a crystal spinning at 37.38�has the opposite sign of that for a crystal spinning at 79.19�.Therefore, whatever the contribution of the quadrupolarcoupling to the resonance frequencies, its effect can beremoved by sequentially spinning the sample at these twoangles. In fact, there are an infinite number of so-called DASangle pairs.[162, 219, 221] It is no coincidence that the angles 37.38�and 79.19� correspond to the symmetry of an icosahedron(dodecahedron). Just as MAS corresponds to the dynamicimplementation of cubic symmetry (see Section 2), DAS is thedynamic realization of icosahedral symmetry.[162, 222]
Figure 51a, b shows two possible pulse sequences for theimplementation of DAS experiments. For magnetization toevolve at two different angles, one must use a NMR probethat allows the spinning rotor axis to change orientation. As itis impractical to move a spinning rotor while activelyacquiring a signal, DAS is incorporated into a two-dimen-sional experiment in which the second-order quadrupolarcoupling is removed in the indirect dimension t1 but not in thedirect dimension t2 . First, the magnetization is excited with a�/2 pulse and is allowed to evolve while spinning at 37.38� fora period of time t1a� 1³2t1. The magnetization is then rotatedback along the z axis (so that the evolution is interrupted) andthe rotor axis is reoriented at an angle of 79.19�. The magneti-zation is then returned to the x,y plane by means of another�/2 pulse. The magnetization then evolves over a period oftime t1b. At the end of the t1 period, the magnetization isdetected in the direct dimension t2 . By incrementing the
RF
rotor
RF
rotor
= 37.38°
= 37.38°
= 79.19°
= 54.74° = 79.19°
a)
b)
t2
t2
π
hop
hophop
t1a
t1a
t1b
t1b
/2π/2π/2
π/2 π/2 π/2π/2π/2
θ
θθ
θ
θ
Figure 51. Pulse sequences for 2D DAS NMR experiments. a) Conven-tional sequence to obtain an isotropic/anisotropic correlation with powderpatterns in the direct dimension characteristic of the second spinning angle.b) Sequence with a second hop to allow detection at the magic angle. Withthe chosen angles, t1a has to be equal to t1b, as the residual powder spectra atboth spinning angles are the exact mirror images of each other as shown inFigure 50.
evolution time of the indirect dimension, it is possible toproduce a two-dimensional spectrum that correlates thenarrow isotropic lines with the broad second-order quadru-polar signal. Figure 52 shows a 2D 87Rb DAS NMR spectrum
Figure 52. A 2D DAS NMR spectrum of the central transitions of 87Rb inRbNO3. The spectrum was obtained by using the pulse sequence inFigure 51b. By taking slices in the isotropic (indirect) dimension at thedifferent isotropic frequencies, powder patterns can be obtained which arecharacteristic of the different sites and from which the quadrupolarcoupling constants and asymmetry parameters can be determined. Thequadrupolar coupling is often given as the so-called quadrupolar couplingconstant parameter CQ� e2qQ/h (in MHz). (Figure courtesy of P. J.Grandinetti.)
of RbNO3, which has three non-equivalent rubidium sites.Although the Rb resonances overlap heavily in the projectionof the anisotropic dimension, they are resolved in the isotropicdimension. By fitting the second-order quadrupolar signalsobtained by taking slices at the positions of the three isotropicpeaks, it is possible to determine the magnitude and aniso-tropy of the quadrupolar coupling at each site. In recentyears, the structural analysis of glasses has relied much onthe application of this technique (for examples, seerefs. [223, 224]).
3124 Angew. Chem. Int. Ed. 2002, 41, 3096 ± 3129
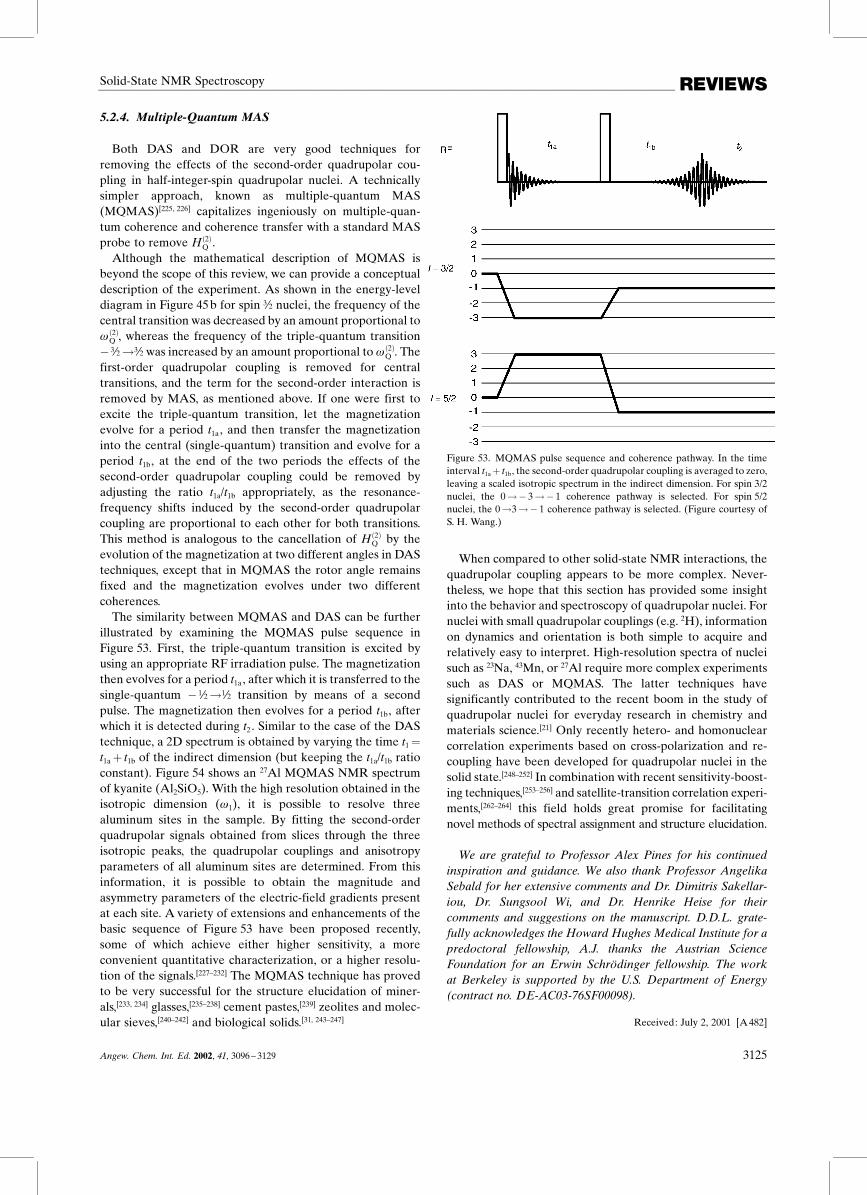
REVIEWSSolid-State NMR Spectroscopy
5.2.4. Multiple-Quantum MAS
Both DAS and DOR are very good techniques forremoving the effects of the second-order quadrupolar cou-pling in half-integer-spin quadrupolar nuclei. A technicallysimpler approach, known as multiple-quantum MAS(MQMAS)[225, 226] capitalizes ingeniously on multiple-quan-tum coherence and coherence transfer with a standard MASprobe to remove H�2�
Q .Although the mathematical description of MQMAS is
beyond the scope of this review, we can provide a conceptualdescription of the experiment. As shown in the energy-leveldiagram in Figure 45b for spin 3³2 nuclei, the frequency of thecentral transition was decreased by an amount proportional to��2�
Q , whereas the frequency of the triple-quantum transition� 3³23³2 was increased by an amount proportional to ��2�
Q . Thefirst-order quadrupolar coupling is removed for centraltransitions, and the term for the second-order interaction isremoved by MAS, as mentioned above. If one were first toexcite the triple-quantum transition, let the magnetizationevolve for a period t1a, and then transfer the magnetizationinto the central (single-quantum) transition and evolve for aperiod t1b, at the end of the two periods the effects of thesecond-order quadrupolar coupling could be removed byadjusting the ratio t1a/t1b appropriately, as the resonance-frequency shifts induced by the second-order quadrupolarcoupling are proportional to each other for both transitions.This method is analogous to the cancellation of H�2�
Q by theevolution of the magnetization at two different angles in DAStechniques, except that in MQMAS the rotor angle remainsfixed and the magnetization evolves under two differentcoherences.The similarity between MQMAS and DAS can be further
illustrated by examining the MQMAS pulse sequence inFigure 53. First, the triple-quantum transition is excited byusing an appropriate RF irradiation pulse. The magnetizationthen evolves for a period t1a, after which it is transferred to thesingle-quantum � 1³21³2 transition by means of a secondpulse. The magnetization then evolves for a period t1b, afterwhich it is detected during t2 . Similar to the case of the DAStechnique, a 2D spectrum is obtained by varying the time t1�t1a� t1b of the indirect dimension (but keeping the t1a/t1b ratioconstant). Figure 54 shows an 27Al MQMAS NMR spectrumof kyanite (Al2SiO5). With the high resolution obtained in theisotropic dimension (�1), it is possible to resolve threealuminum sites in the sample. By fitting the second-orderquadrupolar signals obtained from slices through the threeisotropic peaks, the quadrupolar couplings and anisotropyparameters of all aluminum sites are determined. From thisinformation, it is possible to obtain the magnitude andasymmetry parameters of the electric-field gradients presentat each site. A variety of extensions and enhancements of thebasic sequence of Figure 53 have been proposed recently,some of which achieve either higher sensitivity, a moreconvenient quantitative characterization, or a higher resolu-tion of the signals.[227±232] The MQMAS technique has provedto be very successful for the structure elucidation of miner-als,[233, 234] glasses,[235±238] cement pastes,[239] zeolites and molec-ular sieves,[240±242] and biological solids.[31, 243±247]
Figure 53. MQMAS pulse sequence and coherence pathway. In the timeinterval t1a� t1b, the second-order quadrupolar coupling is averaged to zero,leaving a scaled isotropic spectrum in the indirect dimension. For spin 3/2nuclei, the 0� 3� 1 coherence pathway is selected. For spin 5/2nuclei, the 03� 1 coherence pathway is selected. (Figure courtesy ofS. H. Wang.)
When compared to other solid-state NMR interactions, thequadrupolar coupling appears to be more complex. Never-theless, we hope that this section has provided some insightinto the behavior and spectroscopy of quadrupolar nuclei. Fornuclei with small quadrupolar couplings (e.g. 2H), informationon dynamics and orientation is both simple to acquire andrelatively easy to interpret. High-resolution spectra of nucleisuch as 23Na, 43Mn, or 27Al require more complex experimentssuch as DAS or MQMAS. The latter techniques havesignificantly contributed to the recent boom in the study ofquadrupolar nuclei for everyday research in chemistry andmaterials science.[21] Only recently hetero- and homonuclearcorrelation experiments based on cross-polarization and re-coupling have been developed for quadrupolar nuclei in thesolid state.[248±252] In combination with recent sensitivity-boost-ing techniques,[253±256] and satellite-transition correlation experi-ments,[262±264] this field holds great promise for facilitatingnovel methods of spectral assignment and structure elucidation.
We are grateful to Professor Alex Pines for his continuedinspiration and guidance. We also thank Professor AngelikaSebald for her extensive comments and Dr. Dimitris Sakellar-iou, Dr. Sungsool Wi, and Dr. Henrike Heise for theircomments and suggestions on the manuscript. D.D.L. grate-fully acknowledges the Howard Hughes Medical Institute for apredoctoral fellowship, A.J. thanks the Austrian ScienceFoundation for an Erwin Schrˆdinger fellowship. The workat Berkeley is supported by the U.S. Department of Energy(contract no. DE-AC03-76SF00098).
Received: July 2, 2001 [A482]
Angew. Chem. Int. Ed. 2002, 41, 3096 ± 3129 3125

REVIEWS A. Jerschow et al.
[1] A. Pines, M. G. Gibby, J. S. Waugh, J. Chem. Phys. 1973, 59, 569.[2] M. Auger, Curr. Issues Mol. Biol. 2000, 2, 119.[3] B. Bechinger, R. Kinder, M. Helmle, T. C. Vogt, U. Harzer, S.
Schinzel, Biopolymers 1999, 51, 174.[4] B. Bechinger, Mol. Membr. Biol. 2000, 17, 135.[5] B. Bechinger, FEBS Lett. 2001, 504, 161.[6] T. A. Cross, Methods Enzymol. 1997, 289, 672.[7] H. J. de Groot, Curr. Opin. Struct. Biol. 2000, 10, 593.[8] C. Dybowski, S. Bai, Anal. Chem. 2000, 72, 1R.[9] L. Frydman, Annu. Rev. Phys. Chem. 2001, 52, 463.[10] R. Fu, T. A. Cross,Annu. Rev. Biophys. Biomol. Struct. 1999, 28, 235.[11] R. G. Griffin, Nat. Struct. Biol. 1998, 5 (Suppl.), 508.[12] S. Hafner, D. E. Demco, R. Kimmich, Solid State Nucl. Magn. Reson.
1996, 6, 275.[13] M. Hunger, Solid State Nucl. Magn. Reson. 1996, 6, 1.[14] D. G. Lynn, S. C. Meredith, J. Struct. Biol. 2000, 130, 153.[15] F. M. Marassi, S. J. Opella, Curr. Opin. Struct. Biol. 1998, 8, 640.[16] L. M. McDowell, J. Schaefer, Curr. Opin. Struct. Biol. 1996, 6, 624.[17] S. J. Opella, Nat. Struct. Biol. 1997, 4 (Suppl.), 845.[18] I. Schnell, H. W. Spiess, J. Magn. Reson. 2001, 151, 153.[19] H. Schwalbe, A. Bielecki, Angew. Chem. 2001, 113, 2100; Angew.
Chem. Int. Ed. 2001, 40, 2045.[20] G. Siegal, J. van Duynhoven, M. Baldus, Curr. Opin. Chem. Biol.
1999, 3, 530.[21] M. E. Smith, E. R. H. Van Eck, Prog. Nucl. Magn. Reson. Spectrosc.
1999, 34, 159.[22] D. J. Siminovitch, Biochem. Cell. Biol. 1998, 76, 411.[23] Y. Tong, E. Oldfield, A. Wieckowski, Anal. Chem. 1998, 70, 518A.[24] R. Tycko, Solid State Nucl. Magn. Reson. 1994, 3, 303.[25] R. Tycko, Curr. Opin. Chem. Biol. 2000, 4, 500.[26] R. Tycko, Methods Enzymol. 2001, 339, 390.[27] R. Tycko, Annu. Rev. Phys. Chem. 2001, 52, 575.
[28] A. Watts, Biochim. Biophys. Acta 1998, 1376, 297.[29] A. Watts, I. J. Burnett, C. Glaubitz, G. Grobner, D. A. Middleton,
P. J. Spooner, J. A. Watts, P. T. Williamson, Nat. Prod. Rep. 1999, 16,419.
[30] A. Watts, Curr. Opin. Biotechnol. 1999, 10, 48.[31] G. Wu, Biochem. Cell. Biol. 1998, 76, 429.[32] G. E. Pake, J. Chem. Phys. 1948, 16, 327.[33] F. Bloch, Phys. Rev. 1956, 102, 104.[34] F. Bloch, Phys. Rev. 1958, 111, 841.[35] A. J. Shaka, J. Keeler, Prog. Nucl. Magn. Reson. Spectrosc. 1987, 19,
47.[36] M. H. Levitt, Prog. Nucl. Magn. Reson. Spectrosc. 1986, 18, 61.[37] A. R. Edmonds,Angular Momentum in QuantumMechanics, Prince-
ton University Press, 1960.[38] ™High Resolution NMR in Solids: Selective Averaging∫: U. Hae-
berlen, Adv. Magn. Reson. 1976, Suppl. 1.[39] M. Mehring, High Resolution NMR in Solids, Springer, New York,
1983.[40] E. R. Andrew, A. Bradbury, R. G. Eades, Nature 1958, 182, 1659.[41] I. J. Lowe, Phys. Rev. Lett. 1959, 2, 285.[42] M. M. Maricq, J. S. Waugh, J. Chem. Phys. 1979, 70, 3300.[43] L. Emsley, D. D. Laws, A. Pines, Proc. Int. Sch. Phys. ™Enrico Fermi∫
1999, 129, 45.[44] M. H. Levitt, J. Magn. Reson. 1989, 82, 427.[45] J. Herzfeld, A. E. Berger, J. Chem. Phys. 1980, 73, 6021.[46] J. Cavanagh, A. G. Palmer, W. Fairbrother, N. Skelton, Protein NMR
spectroscopy: Principles and practice, Academic Press, San Diego,1996.
[47] A. E. Derome, Modern NMR Techniques for Chemistry Research,Pergamon, Oxford, 1987.
[48] S. R. Hartmann, E. L. Hahn, Phys. Rev. 1962, 128, 2042.[49] A. Pines, M. G. Gibby, J. S. Waugh, J. Chem. Phys. 1972, 56, 1776.
3126 Angew. Chem. Int. Ed. 2002, 41, 3096 ± 3129
Figure 54. 27Al MQMASNMR spectrum (104.217 MHz) of kyanite (Al2SiO5) at a MAS spinning speed of 22978 Hz. This spectrum was taken with a variantof the basic pulse sequence shown in Figure 53 with an additional z filter.[260] 1D spectra for each of the sites were obtained by taking slices through the peaksin the isotropic (�iso) dimension. (Adapted from ref. [261], with permission.)

REVIEWSSolid-State NMR Spectroscopy
[50] E. O. Stejskal, J. Schaefer, J. S. Waugh, J. Magn. Reson. 1977, 28, 105.[51] J. Schaefer, E. O. Stejskal, J. Am. Chem. Soc. 1976, 98, 1031.[52] R. K. Harris, P. Jackson, Chem. Rev. 1991, 91, 1427.[53] A. Jurkiewicz, C. E. Bronniman, G. E. Maciel, Fuel 1990, 69, 804.[54] K. Schmidt-Rohr, H. W. Spiess, Multidimensional Solid-State NMR
and Polymers, Academic Press, San Diego, 1994.[55] R. R. Ernst, G. Bodenhausen, A. Wokaun, Principles of Nuclear
Magnetic Resonance in One and Two Dimensions, Clarendon Press,Oxford, 1987.
[56] H. Kessler, M. Gehrke, C. Griesinger, Angew. Chem. 1988, 100, 507;Angew. Chem. Int. Ed. Engl. 1988, 27, 490.
[57] K. Schmidt-Rohr, J. Clauss, H. W. Spiess, Macromolecules 1992, 25,3273.
[58] I. Quijada-Garrido,M.Wilhelm, H. W. Spiess, J. M. Barrales-Rienda,Macromol. Chem. Phys. 1998, 199, 985.
[59] L. M. Bronstein, C. Joo, R. Karlinsey, A. Ryder, J. W. Zwanziger,Chem. Mater. 2001, 13, 3678.
[60] S. M. de Paul, J. W. Zwanziger, R. Ulrich, U. Wiesner, H. W. Spiess, J.Am. Chem. Soc. 1999, 121, 5727.
[61] J. S. Waugh, L. M. Huber, U. Haeberlen, Phys. Rev. Lett. 1968, 20,180. The acronyms WAHUHA and WHH-4 are derived from theauthor names.
[62] M. Lee, W. I. Goldburg, Phys. Rev. A 1965, 140, 1261.[63] U. Haeberlen, J. S. Waugh, Phys. Rev. 1968, 175, 453.[64] P. Mansfield, Phys. Lett. A 1970, 32, 485.[65] P. Mansfield, J. Phys. C 1971, 4, 1444.[66] W. K. Rhim, D. D. Elleman, R. W. Vaughan, J. Chem. Phys. 1972, 58,
1772.[67] D. P. Burum, W. K. Rhim, J. Chem. Phys. 1979, 71, 944.[68] D. P. Burum, M. Linder, R. R. Ernst, J. Magn. Reson. 1981, 44, 173.[69] D. G. Cory, J. Magn. Reson. 1991, 94, 526.[70] K. Takegoshi, C. A. McDowell, Chem. Phys. Lett. 1985, 116, 100.[71] M. Hohwy, P. V. Bower, H. J. Jakobsen, N. C. Nielsen, Chem. Phys.
Lett. 1997, 273, 297.[72] A. Bielecki, A. C. Kolbert, M. H. Levitt, Chem. Phys. Lett. 1989, 155,
341.[73] A. Bielecki, A. C. Kolbert, H. J. M. de Groot, R. G. Griffin, M. H.
Levitt, Adv. Magn. Reson. 1990, 14, 111.[74] M. H. Levitt, A. C. Kolbert, A. Bielecki, D. J. Ruben, Solid State
Nucl. Magn. Reson. 1993, 2, 151.[75] B.-J. van Rossum, H. Fˆrster, H. J. M. de Groot, J. Magn. Reson.
1997, 124, 516.[76] J. D. Cross, P. R. Costa, R. G. Griffin, J. Chem. Phys. 1998, 108, 7286.[77] M. Baldus, B. H. Meier, J. Magn. Reson. 1997, 128, 172.[78] A. Ramamoorthy, F. M. Marassi, M. Zasloff, S. J. Opella, J. Biomol.
NMR 1995, 6, 329.[79] A. Lesage, D. Sakellariou, S. Steuernagel, L. Emsley, J. Am. Chem.
Soc. 1998, 120, 13194.[80] V. Ladizhansky, S. Vega, J. Chem. Phys. 2000, 112, 7158.[81] B.-J. van Rossum, C. P. de Groot, V. Ladizhansky, S. Vega, H. J. M.
de Groot, J. Am. Chem. Soc. 2000, 122, 3465.[82] P. K. Madhu, X. Zhao, M. H. Levitt, Chem. Phys. Lett. 2001, 346, 142.[83] J. Baum, M. Munowitz, A. N. Garroway, A. Pines, J. Chem. Phys.
1985, 83, 2015.[84] M. Munowitz, M. Mehring, A. Pines, J. Chem. Phys. 1987, 86, 3172.[85] J. Baum, A. Pines, J. Am. Chem. Soc. 1986, 108, 7447.[86] M. Munowitz, A. Pines, Science 1986, 233, 525.[87] W. S. Warren, D. P. Weitekamp, A. Pines, J. Chem. Phys. 1980, 73,
2084.[88] M. Carravetta, F. Castiglione, G. De Luca, M. Edgar, J. W. Emsley,
R. D. Farrant, E. K. Foord, J. C. Lindon, M. Longeri, W. E. Palke,D. L. Turner, J. Magn. Reson. 1998, 135, 298.
[89] O. N. Antzutkin, J. J. Balbach, R. D. Leapman, N. W. Rizzo, J. Reed,R. Tycko, Proc. Natl. Acad. Sci. USA 2000, 97, 13045.
[90] P. Carvatti, G. Bodenhausen, R. R. Ernst, Chem. Phys. Lett. 1982, 89,363.
[91] P. Carvatti, L. Braunschweiler, R. R. Ernst, Chem. Phys. Lett. 1983,100, 305.
[92] B.-J. van Rossum, E. A. M. Schulten, J. Raap, H. Oschkinat, H. J. M.de Groot, J. Magn. Reson. 2002, 155, 1.
[93] K. Hester, J. L. Ackerman, V. R. Cross, J. S. Waugh, Phys. Rev. Lett.1976, 36, 1081.
[94] K. Schmidt-Rohr, D. Nanz, L. Emsley, A. Pines, J. Phys. Chem. 1994,98, 6668.
[95] S. Caldarelli, M. Hong, L. Emsley, A. Pines, J. Phys. Chem. 1996, 100,18696.
[96] C. H. Wu, A. Ramamoorthy, S. J. Opella, J. Magn. Reson., Ser. A1994, 109, 270.
[97] F. M. Marassi, S. J. Opella, J. Magn. Reson. 2000, 144, 150.[98] J. K. Denny, J. F. Wang, T. A. Cross, J. R. Quine, J. Magn. Reson.
2002, 154, 80.[99] M. H. Levitt, R. Freeman, T. Frenkiel, J. Magn. Reson. 1982, 47,
328.[100] M. H. Levitt, R. Freeman, T. Frenkiel, Adv. Magn. Reson. 1983, 12,
47.[101] A. J. Shaka, J. Keeler, T. Frenkiel, R. Freeman, J. Magn. Reson. 1983,
52, 335.[102] A. E. Bennett, C. M. Rienstra, M. Auger, K. V. Lakshmi, R. G.
Griffin, J. Chem. Phys. 1995, 103, 6951.[103] M. Mehring, G. Sinning, A. Pines, Z. Phys. B 1976, 24, 73.[104] G. Sinning, M. Mehring, A. Pines, Chem. Phys. Lett. 1976, 43, 382.[105] M. Mehring, G. Sinning, Phys. Rev. B 1977, 15, 2519.[106] M. Ernst, H. Zimmerman, B. H. Meier, Chem. Phys. Lett. 2000, 317,
581.[107] Z. H. Gan, R. R. Ernst, Solid State Nucl. Magn. Reson. 1997, 8, 153.[108] M. Eden, M. H. Levitt, Chem. Phys. Lett. 1999, 111, 1511.[109] K. W¸thrich in Encyclopedia of NMR, Vol. 2 (Eds.: D. M. Grant,
R. K. Harris), Wiley, Chichester, 1996, S. 932.[110] Mechanically demanding experiments have been performed in which
the MAS rotor was stopped briefly to recouple the chemical shiftanisotropy and then restarted to detect the NMR signal in t2 (R. C.Zeigler, R. A. Wind, G. E. Maciel, J. Magn. Reson. 1988, 79, 299).
[111] T. Gullion, J. Schaefer, J. Magn. Reson. 1989, 81, 196.[112] K. T. Mueller, T. P. Jarvie, D. J. Aurentz, B. W. Roberts, Chem. Phys.
Lett. 1995, 242, 535.[113] T. Gullion, C. H. Pennington, Chem. Phys. Lett. 1998, 290, 88.[114] O. Liivak, D. B. Zax, J. Chem. Phys. 2000, 113, 1088.[115] C. A. Fyfe, A. R. Lewis, J. M. Chezeau, Can. J. Chem. 1999, 77, 1984.[116] C. A. Fyfe, A. R. Lewis, J. Phys. Chem. B 2000, 104, 48.[117] C. A. Fyfe, D. H. Brouwer, A. R. Lewis, J. M. Chezeau, J. Am. Chem.
Soc. 2001, 123, 6882.[118] C. P. Jaroniec, B. A. Tounge, J. Herzfeld, R. G. Griffin, J. Am. Chem.
Soc. 2001, 123, 3507.[119] C. P. Jaroniec, B. A. Tounge, C. M. Rienstra, J. Herzfeld, R. G.
Griffin, J. Am. Chem. Soc. 1999, 121, 10237.[120] R. Fu, S. A. Smith, G. Bodenhausen, Chem. Phys. Lett. 1997, 272, 361.[121] Y. Ishii, T. Terao, J. Chem. Phys. 1998, 109, 1366.[122] R. Tycko, G. Dabbagh, Chem. Phys. Lett. 1990, 173, 461.[123] C. A. Klug, W. Zhu, K. Tasaki, J. Schaefer,Macromolecules 1997, 30,
1734.[124] D. P. Raleigh, M. H. Levitt, R. G. Griffin, Chem. Phys. Lett. 1988,
146, 71.[125] T. Nakai, C. A. McDowell, J. Magn. Reson. Ser. A 1995, 140, 199.[126] T. Karlsson, M. Ede¬n, H. Luthman, M. H. Levitt, J. Magn. Reson. Ser.
A 2000, 145, 95.[127] S. Dusold, A. Sebald, J. Magn. Reson. 2000, 145, 340.[128] N. C. Nielsen, H. Bildsoe, H. J. Jakobsen, M. H. Levitt, J. Chem.
Phys. 1994, 101, 1805.[129] S. Kiihne, M. A. Mehta, J. A. Stringer, D. M. Gregory, J. C. Shiels,
G. P. Drobny, J. Phys. Chem. 1998, 102, 2274.[130] B.-Q. Sun, P. R. Costa, D. Kocisko, P. T. Lansbury, R. G. Griffin, J.
Chem. Phys. 1995, 102, 702.[131] M. Feike, D. E. Demco, R. Graf, J. Gottwald, S. Hafner, H. W. Spiess,
J. Magn. Reson. Ser. A 1996, 122, 214.[132] A. E. Bennett, J. H. Ok, R. G. Griffin, S. Vega, J. Chem. Phys. 1992,
96, 8624.[133] M. Hohwy, H. J. Jakobsen, M. Ede¬n, M. H. Levitt, N. C. Nielsen, J.
Chem. Phys. 1998, 108, 2686.[134] M. Baldus, D. G. Geurts, B. H. Meier, Solid State Nucl. Magn. Reson.
1998, 11, 157.[135] S. Dusold, A. Sebald, Annu. Rep. NMR Spectrosc. 2000, 41, 185.[136] A. E. Bennett, R. G. Griffin, S. Vega, NMR 1994, 33, 3.[137] M. Carravetta, M. Ede¬n, X. Zhao, A. Brinkmann, M. H. Levitt,
Chem. Phys. Lett. 2000, 321, 205.
Angew. Chem. Int. Ed. 2002, 41, 3096 ± 3129 3127

REVIEWS A. Jerschow et al.
[138] M. H. Levitt in Encyclopedia of NMR, Supplement (Eds.: D. M.Grant, R. K. Harris), Wiley, Chichester, in press.
[139] G. Metz, X. Wu, S. O. Smith, J. Magn. Reson. Ser. A 1994, 110, 219.[140] M. Baldus, D. G. Geurts, S. Hediger, B. H. Meier, J. Magn. Reson. Ser.
A 1996, 118, 140.[141] M. Hong, R. G. Griffin, J. Am. Chem. Soc. 1998, 120, 7113.[142] I. Schnell, B. Langer, S. H. M. Sˆntjens, M. H. P. van Gebderen, R. P.
Sijbesma, H. W. Spiess, J. Magn. Reson. 2001, 150, 57.[143] K. Saalw‰chter, R. Graf, H. W. Spiess, J. Magn. Reson. 2001, 148, 398.[144] T. A. Egorova-Zachernyuk, J. Hollander, N. Fraser, P. Gast, A. J.
Hoff, R. Cogdell, H. J. M. de Groot, M. Baldus, J. Biomol. NMR2001, 19, 243.
[145] C. M. Rienstra, M. Hohwy, M. Hong, R. G. Griffin, J. Am. Chem.Soc. 2000, 122, 10979.
[146] J. Pauli, M. Baldus, B. van Rossum, H. de Groot, H. Oschkinat,ChemBioChem 2001, 2, 272.
[147] C. M. Rienstra, M. E. Hatcher, L. J. Mueller, B. Sun, S. W. Fesik,R. G. Griffin, J. Am. Chem. Soc. 1998, 120, 10602.
[148] J. M. Griffiths, A. E. Bennett, M. Engelhard, F. Siebert, J. Raap, J.Lugtenburg, J. Herzfeld, R. G. Griffin, Biochemistry 2000, 39, 362.
[149] T. A. Egorova-Zachernyuk, B. van Rossum, G. J. Boender, E.Franken, J. Ashurst, J. Raap, P. Gast, A. J. Hoff, H. Oschkinat,H. J. M. de Groot, Biochemistry 1997, 36, 7513.
[150] A. McDermott, T. Polenova, A. Bockmann, K. W. Zilm, E. K.Paulsen, R. W. Martin, G. T. Montelione, J. Biomol. NMR 2000, 16,209.
[151] Alia, J. Matysik, C. Soede-Huijbregts, M. Baldus, J. Raap, J.Lugtenburg, P. Gast, H. J. van Gorkom, A. J. Hoff, H. J. M. de Groot,J. Am. Chem. Soc. 2001, 123, 4803.
[152] J. Pauli, B. van Rossum, H. Fˆrster, H. J. M. de Groot, H. Oschkinat,J. Magn. Reson. 2000, 143, 411.
[153] B.-Q. Sun, C. M. Rienstra, P. R. Costa, J. R. Williamson, R. G.Griffin, J. Am. Chem. Soc. 1997, 119, 8540.
[154] H. Geen, J. Gottwald, R. Graf, I. Schnell, H. W. Spiess, J. J. Titman, J.Magn. Reson. 1997, 125, 224.
[155] A. S. D. Heindrichs, H. Geen, J. J. Titman, J. Magn. Reson. 2000, 147,68.
[156] S. P. Brown, I. Schnell, J. D. Brand, K. M¸llen, H. W. Spiess, J. Mol.Struct. 2000, 521, 179.
[157] H. Geen, R. Graf, A. S. D. Heindrichs, B. S. Hickman, I. Schnell,H. W. Spiess, J. J. Titman, J. Magn. Reson. 1999, 138, 167.
[158] S. Ravindranathan, X. Feng, T. Karlsson, G. Widmalm, M. H. Levitt,J. Am. Chem. Soc. 2000, 122, 1102.
[159] X. Feng, P. J. E. Verdegem, Y. K. Lee, D. Sandstrˆm, M. Ede¬n, P.Bovee-Geurts, W. J. de Grip, J. Lugtenburg, H. J. M. de Groot, M. H.Levitt, J. Am. Chem. Soc. 1997, 119, 6853.
[160] F. J. Blanco, R. Tycko, J. Magn. Reson. 2001, 149, 131.[161] A. C. Kolbert, P. J. Grandinetti, M. Baldwin, S. B. Prusiner, A. Pines,
J. Phys. Chem. 1994, 98, 7936.[162] A. Samoson, B. Q. Sun, A. Pines in Pulsed Magnetic Resonance:
NMR, ESR, and Optics (Ed.: D. M. S. Bagguley), Clarendon,Oxford, 1992.
[163] J. Heller, D. D. Laws, M. Tomaselli, D. S. King, D. E. Wemmer, A.Pines, R. H. Havlin, E. Oldfield, J. Am. Chem. Soc. 1997, 119, 7827.
[164] R. H. Havlin, H. Le, D. D. Laws, A. C. deDios, E. Oldfield, J. Am.Chem. Soc. 1997, 119, 11951.
[165] W. T. Dixon, J. Chem. Phys. 1982, 77, 1800.[166] S. Fe¬aux de Lacroix, J. J. Titman, A. Hagemeyer, H. W. Spiess, J.
Magn. Reson. 1992, 97, 435.[167] O. N. Antzukin, Z. Song, X. Feng, M. H. Levitt, J. Chem. Phys. 1994,
100, 130.[168] J. J. Titman, S. Fe¬aux de Lacroix, H. W. Spiess, J. Chem. Phys. 1993,
98, 3816.[169] O. N. Antzutkin, Prog. Nucl. Magn. Reson. Spectrosc. 1999, 35, 203.[170] V. Ge¬rardy-Montouillout, C. Malveau, P. Tekely, Z. Olender, Z. Luz,
J. Magn. Reson. Ser. A 1996, 123, 7.[171] P. Tekely, D. Reichert, H. Zimmermann, Z. Luz, J. Magn. Reson.
2000, 145, 173.[172] C. J‰ger, D. Reichert, H. Zimmermann, T. Sen, R. Poupko, Z. Luz, J.
Magn. Reson. 2001, 153, 227.[173] M. Alla, E. I. Kundla, E. Lippmaa, JETP Lett. 1978, 27, 194.[174] R. Tycko, G. Dabbagh, P. A. Mirau, J. Magn. Reson. 1989, 85, 265.
[175] A. Bax, N. M. Szeverenyi, G. Maciel, J. Magn. Reson. 1983, 55, 494.[176] Z. H. Gan, J. Am. Chem. Soc. 1992, 114, 8307.[177] J. Z. Hu, A. M. Orendt, D. W. Alderman, R. J. Pugmire, C. Ye, D. M.
Grant, Solid State Nucl. Magn. Reson. 1994, 3, 181.[178] L. Frydman, G. C. Chingas, Y. K. Lee, P. J. Grandinetti, E. A.
Eastman, G. A. Barall, A. Pines, Isr. J. Chem. 1992, 32, 161.[179] L. Frydman, G. C. Chingas, Y. K. Lee, P. J. Grandinetti, M. A.
Eastman, G. A. Barrall, A. Pines, J. Chem. Phys. 1992, 97, 4800.[180] D. W. Alderman, G. McGeorge, J. Z. Hu, R. J. Pugmire, D. M. Grant,
Mol. Phys. 1998, 95, 1113.[181] C. A. Fyfe, H. Grondey, Y. Feng, G. T. Kokotailo, Chem. Phys. Lett.
1990, 173, 211.[182] C. A. Fyfe, H. Grondey, Y. Feng, G. T. Kokotailo, S. Ernst, J.
Weitkamp, Zeolites 1992, 12, 50.[183] C. A. Fyfe, Y. Feng, H. Grondey, G. T. Kokotailo, A. Mar, J. Phys.
Chem. 1991, 95, 3747.[184] R. E. Wasylishen in Encyclopedia of NMR, Vol. 3 (Ed.: D. M. Grant,
R. K. Harris), Wiley, Chichester, 1996, S. 1685.[185] A. Lesage, C. Auger, S. Caldarelli, L. Emsley, J. Am. Chem. Soc. 1997,
119, 7867.[186] A. Lesage, M. Bardet, L. Emsley, J. Am. Chem. Soc. 1999, 121, 10987.[187] A. Lesage, P. Charmont, S. Steuernagel, L. Emsley, J. Am. Chem. Soc.
2000, 122, 9739.[188] E. H. Hardy, R. Verel, B. H. Meier, J. Magn. Reson. 2001, 148, 459.[189] M. Baldus, R. J. Iuliucci, B. H. Meier, J. Am. Chem. Soc. 1997, 119,
1121.[190] A. S. D. Heindrichs, H. Geen, C. Giordani, J. J. Titman, Chem. Phys.
Lett. 2001, 335, 89.[191] Quadrupolar nuclei located within a cubic crystal will not experience
a quadrupolar coupling as a consequence of the symmetry of thelattice. Evidence for this can be seen in the 14N NMR spectrum ofNH4Cl or in the 23Na NMR spectrum of NaCl, which have verynarrow signals.
[192] H. H. Mantsch, H. Saito¬ , I. C. P. Smith, Prog. Nucl. Magn. Reson.Spectrosc. 1977, 11, 211.
[193] L. W. Jelinski, Annu. Rev. Mater. Sci. 1985, 15, 359.[194] N. Chandrakumar, Spin-1 NMR, Vol. 34, Springer, Berlin, 1996.[195] S. Vega, T. W. Shattuck, A. Pines, Phys. Rev. Lett. 1976, 37, 43.[196] A. Pines, S. Vega, M. Mehring, Phys. Rev. B 1978, 18, 112.[197] R. L. Smith, E. Oldfield, Science 1984, 225, 280.[198] P. Diehl, C. L. Khetrapal, NMR 1969, 1, 1.[199] ™Nuclear Magnetic Resonance of Liquid Crystals∫: Z. Luz, NATO
ASI Ser. Ser. C 1983, 141, 315.[200] H. Lee, P. R. Ortiz de Montellano, A. E. McDermott, Biochemistry
1999, 38, 10808.[201] H. Lee, T. Polenova, R. H. Beer, A. E. McDermott, J. Am. Chem.
Soc. 1999, 121, 6884.[202] J. Hirschinger, D. Schaefer, H. W. Spiess, Macromolecules 1991, 24,
2428.[203] G. Dabbagh, D. P. Weliky, R. Tycko, Macromolecules 1994, 27,
6183.[204] R. H. Lewis, H. W. Long, K. Schmidt-Rohr, H. W. Spiess, J. Magn.
Reson. Ser. A 1995, 115, 26.[205] E. R. deAzevedo, T. J. Bonagamba, K. Schmidt-Rohr, J. Magn.
Reson. 2000, 142, 86.[206] L. Frydman, Y. K. Lee, L. Emsley, G. C. Chingas, A. Pines, J. Am.
Chem. Soc. 1993, 115, 4825.[207] A. Abragam, Principles of Nuclear Magnetism, Clarendon, Oxford,
1961.[208] A. Medek, V. Frydman, L. Frydman, J. Phys. Chem. A 1999, 103,
4830.[209] C. P. Slichter, Principles of Nuclear Magnetic Resonance, 3rd ed.,
Springer, New York, 1990.[210] A. J. Vega in Encyclopedia of NMR (Eds.: D. M. Grant, R. K.
Harris), Wiley, Chichester, 1995.[211] A. Samoson, E. I. Kundla, E. Lippmaa, J. Magn. Reson. 1982, 49, 350.[212] L. Werbelow, R. E. London, Concepts Magn. Reson. 1995, 8, 325.[213] A. Samoson, E. Lippmaa, A. Pines, Mol. Phys. 1988, 65, 1013.[214] A. Samoson, A. Pines, Rev. Sci. Instrum. 1989, 60, 3239.[215] A. Llor, J. Virlet, Chem. Phys. Lett. 1988, 152, 248.[216] B. F. Chmelka, K. T. Mueller, A. Pines, J. Stebbins, Y. Wu, J. W.
Zwanziger, Nature 1989, 339, 42.
3128 Angew. Chem. Int. Ed. 2002, 41, 3096 ± 3129

REVIEWSSolid-State NMR Spectroscopy
[217] Y. Wu, B. F. Chmelka, A. Pines, M. E. Davis, P. J. Grobet, P. A.Jacobs, Nature 1990, 346, 6284.
[218] B. Q. Sun, J. H. Baltisberger, Y. Wu, A. Samoson, A. Pines, SolidState Nucl. Magn. Reson. 1992, 1, 267.
[219] K. T. Mueller, B. Q. Sun, G. C. Chingas, J. W. Zwanziger, T. Terao, A.Pines, J. Magn. Reson. 1990, 86, 470.
[220] J. H. Baltisberger, S. L. Gann, E. W. Wooten, T. H. Chang, K. T.Mueller, A. Pines, J. Am. Chem. Soc. 1992, 114, 7489.
[221] K. T. Mueller, Y. Wu, B. F. Chmelka, J. Stebbins, A. Pines, J. Am.Chem. Soc. 1991, 113, 32.
[222] E. W.Wooten, K. T. Mueller, A. Pines,Acc. Chem. Res. 1992, 25, 209.[223] R. E. Youngman, J. W. Zwanziger, J. Phys. Chem. 1996, 100, 16720.[224] J. W. Zwanziger, Solid State Nucl. Magn. Reson. 1994, 3, 219.[225] A. Medek, J. S. Harwood, L. Frydman, J. Am. Chem. Soc. 1995, 117,
12779.[226] L. Frydman, J. S. Harwood, J. Am. Chem. Soc. 1995, 117, 5367.[227] P. K. Madhu, A. Goldbourt, L. Frydman, S. Vega, Chem. Phys. Lett.
1999, 307, 41.[228] S. P. Brown, S. Wimperis, J. Magn. Reson. 1997, 128, 42.[229] D. Iuga, H. Sch‰fer, R. Verhagen, A. P. M. Kentgens, J. Magn. Reson.
2000, 147, 192.[230] T. Vosegaard, D. Massiot, P. J. Grandinetti, Chem. Phys. Lett. 2000,
326, 454.[231] G. Wu, D. Rovnyak, R. G. Griffin, J. Am. Chem. Soc. 1996, 118, 9326.[232] A. Jerschow, J. W. Logan, A. Pines, J. Magn. Reson. 2001, 149, 268.[233] S. E. Ashbrook, A. J. Berry, S.Wimperis,Am.Mineral. 1999, 84, 1191.[234] S. E. Ashbrook, H. McManus, K. J. D. MacKenzie, S. Wimperis, J.
Phys. Chem. B 2000, 104, 6408.[235] J. F. Stebbins, J. V. Oglesby, S. K. Lee, Chem. Geol. 2001, 174, 63.[236] J. F. Stebbins, P. D. Zhao, S. K. Lee, J. V. Oglesby, J. Non-Cryst. Solids
2001, 293, 67.[237] Z. Xu, J. F. Stebbins, Solid State Nucl. Magn. Reson. 1998, 11, 243.[238] F. Angeli, T. Charpentier, S. Gin, J. C. Petit, Chem. Phys. Lett. 2001,
341, 23.[239] P. Faucon, T. Charpentier, D. Bertrandie, A. Nonat, J. Virlet, J. C.
Petit, Inorg. Chem. 1998, 37, 3726.[240] J.-P. Amoureux, F. Bauer, H. Ernst, C. Fernandez, D. Freude, D.
Michel, U.-T. Pingel, Chem. Phys. Lett. 1998, 285, 10.
[241] U.-T. Pingel, J.-P. Amoureux, T. Anupold, F. Bauer, H. Ernst, C.Fernandez, D. Freude, A. Samoson, Chem. Phys. Lett. 1998, 294, 345.
[242] A. Tuel, S. Caldarelli, A. Meden, L. B. McCusker, C. Baerlocher, A.Ristic, N. Rajic, G. Mali, V. Kaucic, J. Phys. Chem. B 2000, 104, 5697.
[243] S. Sham, G. Wu, Inorg. Chem. 2000, 39, 4.[244] S. Ding, C. A. McDowell, Chem. Phys. Lett. 2000, 320, 316.[245] D. Rovnyak, M. Baldus, G. Wu, N. V. Hud, J. Feigon, R. G. Griffin, J.
Am. Chem. Soc. 2000, 122, 11423.[246] C. V. Grant, V. Frydman, L. Frydman, J. Am. Chem. Soc. 2000, 122,
11743.[247] C. V. Grant, V. Frydman, J. S. Harwood, L. Frydman, J. Am. Chem.
Soc. 2002, 124, 4458.[248] J. C. C. Chan, J. Magn. Reson. 1999, 140, 487.[249] S. H. Wang, S. M. de Paul, L. M. Bull, J. Magn. Reson. 1997, 125, 364.[250] M. Baldus, D. Rovnyak, R. G. Griffin, J. Chem. Phys. 2000, 112, 5902.[251] M. Nijman, M. Ernst, A. P. M. Kentgens, B. H. Meier, Mol. Phys.
2000, 98, 161.[252] S. Wi, L. Frydman, J. Am. Chem. Soc. 2001, 123, 10354.[253] F. H. Larsen, J. Skibsted, H. J. Jakobsen, N. C. Nielsen, J. Am. Chem.
Soc. 2000, 122, 7080.[254] F. H. Larsen, A. S. Lipton, H. J. Jakobsen, N. C. Nielsen, P. D. Ellis, J.
Am. Chem. Soc. 1999, 121, 3783.[255] A. S. Lipton, J. A. Sears, P. D. Ellis, J. Magn. Reson. 2001, 151, 48.[256] A. S. Lipton, G. W. Buchko, J. A. Sears, M. A. Kennedy, P. D. Ellis, J.
Am. Chem. Soc. 2001, 123, 992.[257] A. C. Kunwar, H. S. Gutowsky, E. Oldfield, J. Magn. Reson. 1985, 62,
521.[258] J. Ackerman, R. Eckman, A. Pines, Chem. Phys. 1979, 42, 423.[259] Y. Wu, B. Q. Sun, A. Pines, A. Samoson, E. Lipmaa, J. Magn. Reson.
1990, 89, 297.[260] J.-P. Amoureux, C. Fernandez, S. Steuernagel, J. Magn. Reson. Ser. A
1996, 123, 116.[261] L. B. Alemany, S. Steuernagel, J.-P. Amoureux, R. L. Callender,
A. R. Barron, Solid State Nucl. Magn. Reson. 1999, 14, 1.[262] Z. H. Gan, J. Am. Chem. Soc. 2000, 122, 3242.[263] C. Huguenard, F. Taulelle, B. Knott, Z. Gan, J. Magn. Reson. 2002,
156, 131.[264] S. E. Ashbrook, S. Wimperis, J. Magn. Reson. 2002, in press.
Angew. Chem. Int. Ed. 2002, 41, 3096 ± 3129 3129