Embed Size (px)
Citation preview

1
Electronic Supplementary Information
Solid-State Electropolymerization and Doping of Triphenylamine as a
Route for Electroactive Thin Films
Teresa Lana-Villarreal, José M. Campiña*, Néstor Guijarro, Roberto Gómez*
Institut Universitari d´Electroquímica; Departament de Química-Física. Universitat
d´Alacant. Apartat 99, E-03080, Alacant, Spain.
1. Experimental details.............................................................................................2
2. Schemes................................................................................................................6
3. Evolution of the voltammograms of TPA electrodes in NaCl solutions..............7
4. Effect of scan rate on voltammogram evolution for TTA and TPA electrodes....8
5. Spectral and mass changes associated to voltammetry........................................10
6. Water contact angle measurements......................................................................12
7. Cross sections of the films...................................................................................13
* Corresponding authors:
José Miguel Campiña, Email: [email protected]
Roberto Gómez, Email: [email protected], Tel: +34965903536, Fax:
+34965903537
Supplementary Material (ESI) for PCCPThis journal is © the Owner Societies 2011
2
1. Experimental details:
Electrochemical Quartz Crystal Microbalance (EQCM)
According to Sauerbrey equation, the shift in the vibration frequency (f) suffered by
a quartz plate can be used to calculate the change of the electrode mass (m) that results
from the deposition (or dissolution) of a rigid, homogeneous, thin film:
f = [-2 f02 / A (pqq)1/2] m =-Cf m (S1)
where f0 is the resonant frequency of the quartz plate, A the piezoelectrically active
area, and pqq the product of the density and the shear modulus of quartz, respectively.
Cf is called the sensitivity factor of the crystal and has a value of 56.6 Hz g-1 cm2 at
room temperature for the quartz crystals used in this study.
In addition to the aforementioned mass effect, the QCM is also sensitive to changes in
the viscosity of the film and/or the QCM surrounding liquid medium. As the Sauerbrey
equation is valid exclusively if the loaded film is rigid, it is important to establish
whether this requirement is satisfied in our case. Equivalent electrical circuit parameters
have been employed to characterize the QCM behavior with simultaneous mass and
liquid loading effects. When the QCM response is completely governed by variations of
solution density and viscosity at the electrode surface, it has been established that1-4
6614
sg
q q
c ffR L f
(S2)
where f and R are the shifts of the quartz crystal resonant frequency and motional
resistance, respectively. qL is the motional inductance of the quartz crystal in air (30
mH, according to the QCM200 operation manual), 66c is the lossy piezoelectrically
stiffened quartz elastic constant (2.957·1010 N·m-2), q is the shear modulus for AT-cut
Supplementary Material (ESI) for PCCPThis journal is © the Owner Societies 2011

3
-800
-600
-400
-200
0
0
10
20
30
0 1000 2000 3000
-40
-20
0
f /
Hz
a.
R /
b.
f/
R /
Hz·
-1
time / s
c.
quartz (2.947·1010 N·m-2), sgf is the series resonant frequency in air (5 MHz in our
case). According to these values, equation S2 can be approximated to
11 2.65 ·4
q
f HzR L
This value can be used as a criterion to ascertain the film rigidity. The experimental
value should be much larger than this one in order to ascribe the resonant frequency
changes exclusively to mass effects.
Figure S1. Time-resolved resonance frequency (f) (a.), resistance (R) (b.) shifts
and (f/R) (c.) for a 5 MHz quartz crystal plate coated with thin solid films of TPA
during its cyclic voltammetry evolution at 50 mVs-1 in a N2-purged NaClO4 0.5 M
solution. The dashed line in figure c. represents the threshold value ( 12.65 · Hz ).
Supplementary Material (ESI) for PCCPThis journal is © the Owner Societies 2011

4
Figure S1 shows the time-resolved shifts of frequency ( f ) and resistance (R ) and
the ratio / f R for a quartz crystal electrode covered by a TPA corresponding to fig.
7. As observed, / f R is about ten times larger than the value expected for a net
viscous effect, suggesting that the TPA film behaves as a rigid layer.
During doping, the ratio / f R is 1105 · Hz , indicating that the film is highly
rigid and the Sauerbrey equation can be used accurately to estimate the changes in mass,
i.e. the number of perchlorate anions from the electrolyte that ingress in the film to
compensate the positive doping charge.
Atomic Force Microscopy
In order to perform the thickness measurements, a line was marked on the thin films
supported on silicon wafers with a razor blade and one of the resulting parts wiped off
with acetone, creating a sharply delineated step that was imaged by AFM.
Contact Angle Measurements
Under the assumptions that the drops formed are symmetric about a central vertical
axis and that viscosity or inertia are not playing a significant role in determining their
shape (i.e. the drop is not in motion), the shape is just defined by gravity and interfacial
tension. Provided the necessary optical amplification by means of a lens and a high
resolution camera, the contact angle is obtained as the slope of the tangent to the drop
profile at the liquid-solid-vapor interface.
Static contact angle measurements were performed for TPA and TTA thin films
(before and after the electrochemical treatment) by using an Optical Contact Angle and
Surface Tension Meter CAM 101 from KSV Instruments. This is a fully computer
Supplementary Material (ESI) for PCCPThis journal is © the Owner Societies 2011

5
controlled instrument based on the capture and automatic analysis of video images. The
drop profile is extracted from the stored image (captured by a high resolution CCD
camera) with subpixel accuracy. Contrary to other tradicional approaches as circular,
polynomial or Bashforth-Adams fitting, which only use parts of the drop profile and
may often produce erroneous results (especially for large drops), the curve is fitted to
the Young-Laplace equation. Thus, contact angle data is easily obtained from the fitted
curve.
Supplementary Material (ESI) for PCCPThis journal is © the Owner Societies 2011

6
2. Schemes.
Triphenylamine Tri-p-tolylamine
Scheme S1. Structure of triphenylamine and its corresponding para-methyl substituted
derivative, tri-p-tolylamine.
Scheme S2. Art model illustrating π-cloud electron density delocalization in the
monocation radical formed after the one-electron oxidation of TPA. The model shows
that the unpaired electron can be effectively delocalized to the para positions through
this conjugated system, explaining their high reactivity.
Supplementary Material (ESI) for PCCPThis journal is © the Owner Societies 2011

7
3. Evolution of the voltammogram for TPA electrodes in NaCl solutions
-0.5 0.0 0.5 1.0-0.02
0.00
0.02
0.04
0.06
0.08
j / m
A·c
m-2
E / VAg/AgCl
Figure S2. Evolution of cyclic voltammograms of a TPA thin solid film in 0.5 M
NaCl aqueous solution. Scan range: -0.4 to 1.0 V at 50 mV·s-1; 30 cycles. The arrows
indicate the direction of growth of the current density with an increasing number of
cycles (The figure corresponds to the cycles 2, 6, 10, 16, 20, 26 and 30).
Supplementary Material (ESI) for PCCPThis journal is © the Owner Societies 2011
8
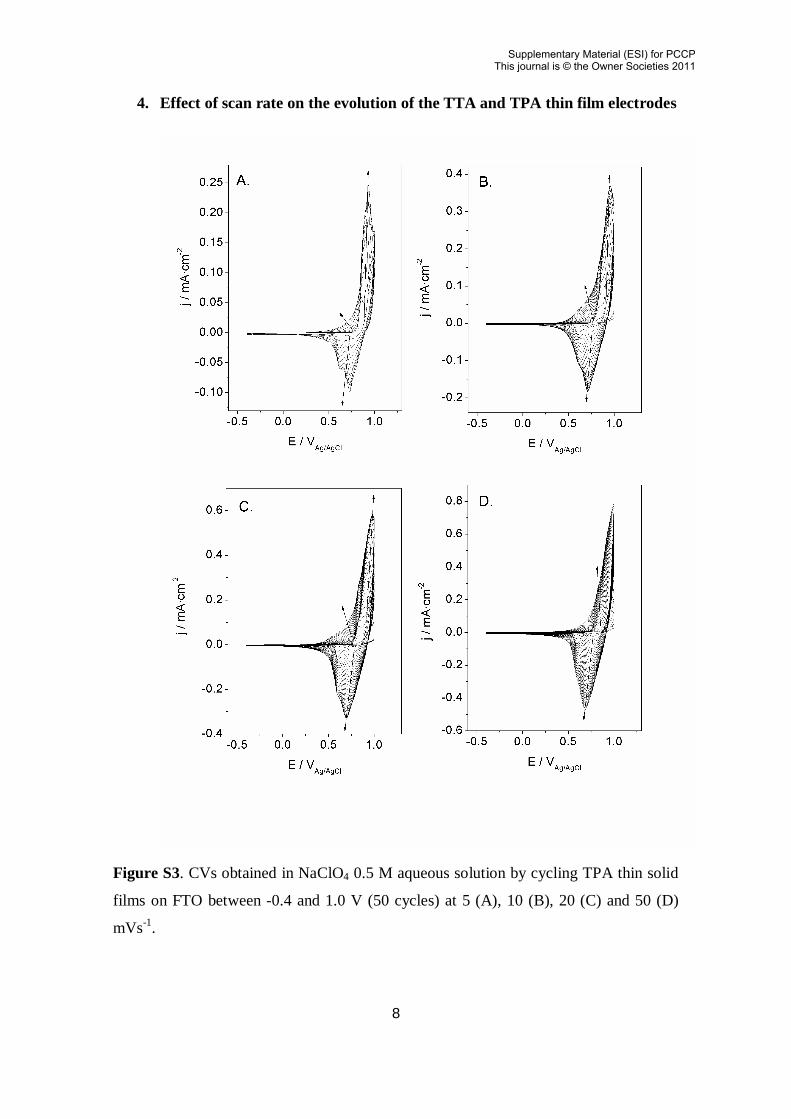
4. Effect of scan rate on the evolution of the TTA and TPA thin film electrodes
Figure S3. CVs obtained in NaClO4 0.5 M aqueous solution by cycling TPA thin solid
films on FTO between -0.4 and 1.0 V (50 cycles) at 5 (A), 10 (B), 20 (C) and 50 (D)
mVs-1.
Supplementary Material (ESI) for PCCPThis journal is © the Owner Societies 2011

9
Figure S4. CVs obtained in 0.5 M NaClO4 aqueous solution by cycling TTA thin solid
films on FTO between -0.4 and 1.0 V (50 cycles) at 5 (A), 10 (B), 20 (C) and 50 (D)
mVs-1.
Supplementary Material (ESI) for PCCPThis journal is © the Owner Societies 2011

10
5. Spectral and mass changes associated to voltammetry
Figure S5. Changes induced in the absorbance at 380 (squares) and 720 nm (circles) by
cycling the potential between -0.4 and 1.0 V at 5 mVs-1 (blue lines) for TTA (a) and
TPA (b) FTO electrodes previously submitted to 40 cycles between -0.4 and 1 V at 50
mVs-1, in N2 purged 0.5 M NaClO4 aqueous solution.
Supplementary Material (ESI) for PCCPThis journal is © the Owner Societies 2011

11
Figure S6. Mass changes induced by cycling the potential between -0.4 and 1.0 V at 5
mVs-1 (blue lines) for TTA (a) and TPA (b) FTO electrodes previously submitted to 40
cycles between -0.4 and 1 V at 50 mVs-1 in N2 purged 0.5 M NaClO4 aqueous solution.
Supplementary Material (ESI) for PCCPThis journal is © the Owner Societies 2011
12
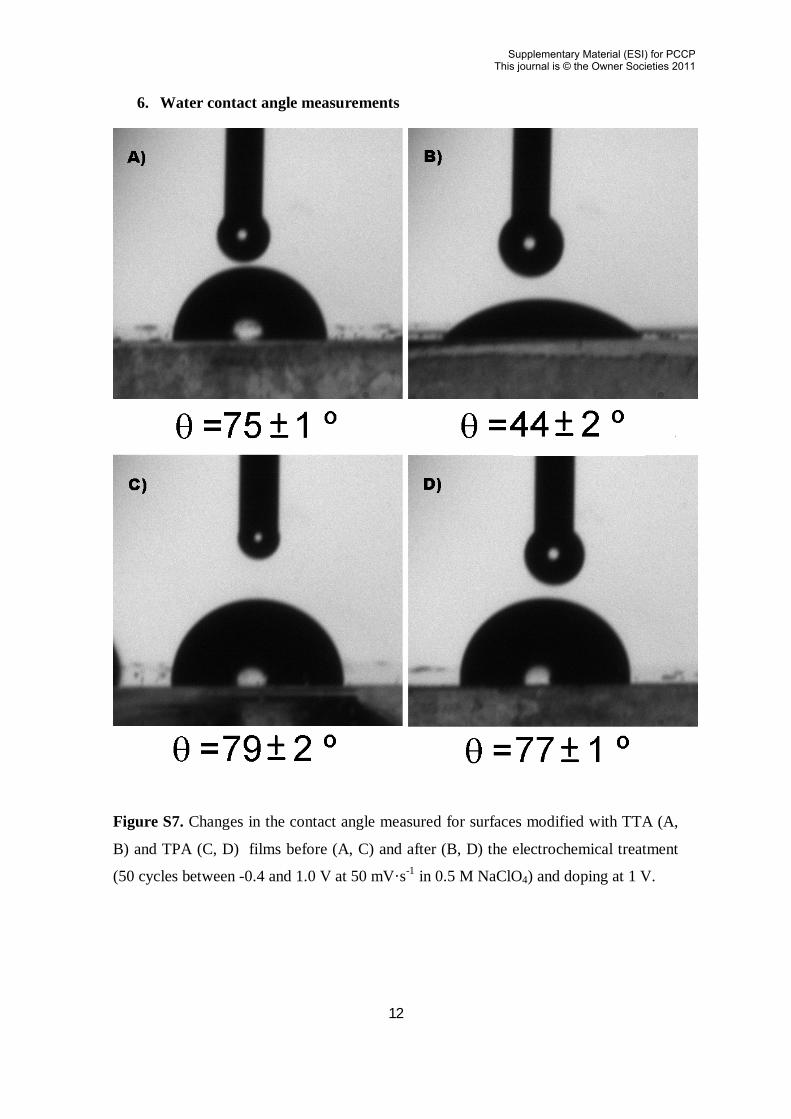
6. Water contact angle measurements
Figure S7. Changes in the contact angle measured for surfaces modified with TTA (A,
B) and TPA (C, D) films before (A, C) and after (B, D) the electrochemical treatment
(50 cycles between -0.4 and 1.0 V at 50 mV·s-1 in 0.5 M NaClO4) and doping at 1 V.
Supplementary Material (ESI) for PCCPThis journal is © the Owner Societies 2011

13
7. Cross sections of the films
Figure S8. Cross section analysis of the AFM images obtained for a TPA (a.) and a
TTA (b.) thin films deposited on silicon wafers.
[1] D. A. Buttry and M. D. Ward, Chem. Rev., 1992, 92, 1355. [2] Q. Xie, J. Wang, A. Zhou, Y. Zhang, H. Liu, Z. Xu, Y. Yuan, M. Deng and S. Yao, Anal. Chem., 1999, 71, 4649. [3] X. Tu, Q. Xie, C. Xiang, Y. Zhang and S. Yao, J. Phys. Chem. B, 2005, 109, 4053. [4] Q. Xie, Z. Li, C. Deng, M. Liu, Y. Zhang, M. Ma, S. Xia, X. Xiao, D. Yin and S. Yao, J. Chem. Educ., 2007, 4,681.
0 1 2 3 4 5
0
50
100
150
Hei
ght /
nm
x / m
0 1 2 3 4 5
0
50
100
150
200
250
300
Hei
ght /
nm
x / m
1.0µm
a.
1.0µm
b.
Supplementary Material (ESI) for PCCPThis journal is © the Owner Societies 2011